

Page 1

Instruction Manual
748446-D
April 2002
Model CAT200
Continuous Analyzer Transmitter
http://www.processanalytic.com
Page 2

ESSENTIAL INSTRUCTIONS
READ THIS PAGE BEFORE PROCEEDING!
Rosemount Analytical designs, manufactures and tests its products to meet many national and
international standards. Because these instruments are sophisticated technical products, you
MUST properly install, use, and maintain them to ensure they continue to operate within their
normal specifications. The following instructions MUST be adhered to and integrated into your
safety program when installing, using, and maintaining Rosemount Analytical products. Failure to
follow the proper instructions may cause any one of the following situations to occur: Loss of life;
personal injury; property damage; damage to this instrument; and warranty invalidation.
• Read all instructions prior to installing, operating, and servicing the product.
• If you do not understand any of the instructions, contact your Rosemount Analytical representative
for clarification.
• Follow all warnings, cautions, and instructions marked on and supplied with the product.
• Inform and educate your personnel in the proper installation, operation, and maintenance of
the product.
• Install your equipment as specified in the Installation Instructions of the appropriate Instruc-
tion Manual and per applicable local and national codes. Connect all products to the proper elec-
trical and pressure sources.
• To ensure proper performance, use qualified personnel to install, operate, update, program, and
maintain the product.
• When replacement parts are required, ensure that qualified people use replacement parts specified by
Rosemount. Unauthorized parts and procedures can affect the product’s performance, place the safe
operation of your process at risk, and VOID YOUR WARRANTY. Look-alike substitutions may result
in fire, electrical hazards, or improper operation.
• Ensure that all equipment doors are closed and protective covers are in place, except when
maintenance is being performed by qualified persons, to prevent electrical shock and personal
injury.
The information contained in this document is subject to change without notice.
Teflon® and Viton® are registered trademarks of E. I. duPont de Nemours and Co., Inc.
SNOOP® is a registered trademark of NUPRO Co.
Emerson Process Management
Rosemount Analytical Inc.
Process Analytic Division
1201 N. Main St.
Orrville, OH 44667-0901
T (330) 682-9010
F (330) 684-4434
e-mail: gas.csc@EmersonProcess.com
http://www.processanalytic.com
Page 3

Model CAT200
PREFACE...........................................................................................................................................P-1
Definitions ...........................................................................................................................................P-1
Intended Use Statement.....................................................................................................................P-2
Safety Summary .................................................................................................................................P-2
General Precautions For Handling And Storing High Pressure Gas Cylinders .................................P-5
Documentation....................................................................................................................................P-6
Compliances .......................................................................................................................................P-6
1-0 DESCRIPTION AND SPECIFICATIONS..............................................................................1-1
1-1 Overview................................................................................................................................1-1
1-2 Typical Applications...............................................................................................................1-1
a. Standard Industry Applications .......................................................................................1-2
1-3 Detector Methodologies.........................................................................................................1-2
a. Non-Dispersive Infrared (NDIR)......................................................................................1-2
Opto-Pneum
Overall NDIR Method......................................................................................................1-5
b. Paramagnetic Oxygen Method .......................................................................................1-7
c. Electrochemical Oxygen Method ....................................................................................1-8
d. Thermal Conductivity Method .........................................................................................1-10
1-4 Specifications ........................................................................................................................1-12
a. General ...........................................................................................................................1-12
b. CAT200 Detector ............................................................................................................1-13
Instruction Manual
748446-D
April 2002
TABLE OF CONTENTS
A
tic Method .................................................................................................1-4
2-0 INSTALLATION ....................................................................................................................2-1
2-1 Process and Calibration Gas Connection .............................................................................2-1
a. Gas Conditioning.............................................................................................................2-5
b. Internal Gas Paths ..........................................................................................................2-5
2-2 Installation..............................................................................................................................2-7
a. Location...........................................................................................................................2-7
b. Limitations .......................................................................................................................2-7
c. Gas Lines ........................................................................................................................2-7
d. Services ..........................................................................................................................2-7
e. Mounting Options ............................................................................................................2-7
f. Vent Lines .......................................................................................................................2-8
g. Electrical Connections ....................................................................................................2-8
2-3 Analytical Leak Check ...........................................................................................................2-12
a. Flow Indicator Method.....................................................................................................2-12
b. Manometer Method.........................................................................................................2-13
3-0 OPERATION .........................................................................................................................3-1
3-1 Startup and initialization ........................................................................................................3-1
3-2 Display & Operating Keys......................................................................................................3-2
a. Display ............................................................................................................................3-2
b. Keys ................................................................................................................................3-2
c. Menu Lines and Softkey Functionality ............................................................................3-3
d. Common Function Keys..................................................................................................3-4
e. Entering and Changing Variables ...................................................................................3-4
f. Starting a Function..........................................................................................................3-4
g. Main Menu ......................................................................................................................3-5
Rosemount Analytical Inc. A Division of Emerson Process Management Contents i
Page 4

Instruction Manual
748446-D
April 2002
3-3 Basic Setup............................................................................................................................3-8
a. Analyzer Channel Status ................................................................................................3-8
b. Status Details ..................................................................................................................3-9
c. Acknowledge and Clear Failures ....................................................................................3-10
d. Current Operation Parameters........................................................................................3-11
e. Single Component Display..............................................................................................3-12
f. Multi Component Display ................................................................................................3-12
3-4 Calibration..............................................................................................................................3-13
a. Calibration Status............................................................................................................3-13
b. Zero Calibration...............................................................................................................3-14
c. Span Calibration..............................................................................................................3-15
d. Setup Basic Calibration Parameters ...............................................................................3-16
e. Open and Close Valves ..................................................................................................3-16
3-5 Analyzer & I/O, Expert Control & Setup ................................................................................3-17
a. Analyzer Module Setup...................................................................................................3-18
b. Load Factory Configuration.............................................................................................3-19
c. Calibration Parameters ...................................................................................................3-19
d. Span Gas Parameter ......................................................................................................3-20
e. Calibration Tolerances ....................................................................................................3-20
f. Calibration Procedure Setup...........................................................................................3-22
g. Timed Controlled Calibration ..........................................................................................3-24
3-6 Calibration Parameters – Manual Calibration........................................................................3-25
a. Advanced Calibration Methods .......................................................................................3-26
b. Zero Gas Parameters .....................................................................................................3-27
3-7 Alarm Parameters..................................................................................................................3-28
a. Alarm Setup and Control.................................................................................................3-29
3-8 Range Parameters ................................................................................................................3-30
a. Offset and Span of Range ..............................................................................................3-30
b. Response times (t90) ......................................................................................................3-31
c. Autoranging Control ........................................................................................................3-31
3-9 Cross Interference Compensation.........................................................................................3-34
3-10 Linearization ..........................................................................................................................3-36
a. Disable Linearization .....................................................................................................3-36
b. Zero and Sapn Calibration ............................................................................................3-36
c. Calculate Linearization Curve........................................................................................3-37
d. Enable Linearization .......................................................................................................3-37
e. Linearization Verification ................................................................................................3-37
3-11 Programmable Logic Control (PLC) ......................................................................................3-38
a. Disable PLC ....................................................................................................................3-38
b. Input the program............................................................................................................3-38
c. Enable PLC .....................................................................................................................3-38
d. Checking the results .......................................................................................................3-38
e. Example for PLC Programming ......................................................................................3-43
f. Placing the codes into the Program menu......................................................................3-44
g. PLC Output .....................................................................................................................3-44
3-12 Programmable Calculator......................................................................................................3-45
a. Programming the Calculator ...........................................................................................3-45
b. Example for Calculation Programming ...........................................................................3-47
3-13 Measurement Display Configuration .....................................................................................3-48
3-14 Acknowledgement of Status Reports ....................................................................................3-50
3-15 Concentration Measurement Parameters .............................................................................3-50
3-16 Concentration Peak Measurement........................................................................................3-51
3-17 Differential Measurement ......................................................................................................3-52
Model CAT200
ii Contents Rosemount Analytical Inc. A Division of Emerson Process Management
Page 5

Model CAT200
3-18 Gas flow Setup ......................................................................................................................3-53
3-19 Pressure Compensation ........................................................................................................3-54
3-20 Flow Measurement ................................................................................................................3-55
3-21 Temperature Measurement ...................................................................................................3-55
3-22 Load/Save Analyzer Module Configuration ...........................................................................3-56
3-23 Inputs & Outputs (SIO/DIO)...................................................................................................3-57
a. SIO ..................................................................................................................................3-57
b. DIO..................................................................................................................................3-61
c. DIO Function Codes .......................................................................................................3-62
3-24 Delay and Average ................................................................................................................3-63
3-25 AK-Protocol Communication .................................................................................................3-64
3-26 System Configuration and Diagnostics .................................................................................3-65
a. Diagnostic Menus............................................................................................................3-65
Analyzer Module Diagnostics..........................................................................................3-66
b. Load/Save Module Configuration....................................................................................3-67
c. Date and Time.................................................................................................................3-68
d. Security Codes................................................................................................................3-69
Setting the code numbers ...............................................................................................3-69
Enable the security code.................................................................................................3-69
e. System Reset..................................................................................................................3-71
f. Memory Usage................................................................................................................3-71
3-27 Display Controls ....................................................................................................................3-72
3-28 Measurement.........................................................................................................................3-73
3-29 Shut Down .............................................................................................................................3-73
3-30 Temperature Stabilization......................................................................................................3-74
a. Controller Settings...........................................................................................................3-74
DIP switch settings:.........................................................................................................3-74
Initial menu settings: .......................................................................................................3-75
Final menu settings: ........................................................................................................3-75
Instruction Manual
748446-D
April 2002
4-0 MAINTENANCE AND SERVICE ..........................................................................................4-1
4-1 Overview................................................................................................................................4-1
4-2 Component Removal.............................................................................................................4-1
a. Analyzer Component Removal .......................................................................................4-2
b. Power Supply Assembly Removal ..................................................................................4-2
4-3 Troubleshooting Guide ..........................................................................................................4-3
a. Instrument Not Functioning (LCD Display Is Dark).........................................................4-3
b. No or Incorrect Measurement Screen.............................................................................4-3
c. Error Messages Displayed..............................................................................................4-3
d. Detector Signal Communication Failed ..........................................................................4-4
e. Light Source Failure........................................................................................................4-4
f. Detector Failure...............................................................................................................4-4
g. No Temperature Measurement.......................................................................................4-4
h. No External Input ............................................................................................................4-4
i. No or Incorrect Analog Outputs or Digital I/O .................................................................4-5
j. Calibration not Possible ..................................................................................................4-5
k. Fluctuating or Erroneous Display ....................................................................................4-5
l. Response Time Too Long (t90 time) ..............................................................................4-5
4-4 Analyzer Configuration and Adjustment ................................................................................4-7
a. Component Layout..........................................................................................................4-7
b. Circuit Board ICB ............................................................................................................4-12
c. Circuit Board PSV ...........................................................................................................4-12
d. Circuit Board PIC ............................................................................................................4-12
Rosemount Analytical Inc. A Division of Emerson Process Management Contents iii
Page 6

Instruction Manual
748446-D
April 2002
e. Circuit Board ACU...........................................................................................................4-13
f. Analyzer Rear Panel .......................................................................................................4-14
g. Thermal Conductivity Response Time ............................................................................4-17
4-5 Maintenance ..........................................................................................................................4-18
a. Checking & Cleaning of the Analyzer .............................................................................4-18
b. Photometric Components ...............................................................................................4-19
Removal of Photometer Assembly..................................................................................4-19
Light Source Replacement..............................................................................................4-20
Removal of Analysis Cells ..............................................................................................4-21
Cleaning of Analysis Cells & Windows ...........................................................................4-22
Reinstalling Analysis Cells ..............................................................................................4-22
Reinstalling Photometer Assembly .................................................................................4-22
Physical Zeroing..............................................................................................................4-22
c. Replacement of Electrochemical Oxygen Sensor ..........................................................4-23
Check of the Sensor .......................................................................................................4-23
Removal of the Sensor ...................................................................................................4-24
Replacing the Sensor......................................................................................................4-25
Reinstalling the Sensor ...................................................................................................4-25
Basic Calibration for the Oxygen Sensor........................................................................4-25
4-6 Analyzer Service....................................................................................................................4-26
a. Photometer Signal Processing (PCB PSV) ....................................................................4-26
Internal Voltage Supply...................................................................................................4-27
IR Source ........................................................................................................................4-28
Chopper ..........................................................................................................................4-28
Unamplified Signal at Detector .......................................................................................4-29
Signal on PCB “PSV” ......................................................................................................4-29
b. Physical Zero – Paramagnetic Oxygen ..........................................................................4-30
c. Removal of Operator Front Panel ...................................................................................4-30
d. Replacement of Buffer Battery........................................................................................4-31
e. Replacement of Fuses ....................................................................................................4-32
f. Test Points for OXS PC Board........................................................................................4-33
g. Power Supply ..................................................................................................................4-35
h. Wiring of DIO with External Devices ...............................................................................4-36
Model CAT200
5-0 RETURN OF MATERIAL ......................................................................................................5-1
5-1 Return Of Material .................................................................................................................5-1
5-2 Customer Service ..................................................................................................................5-1
5-3 Training..................................................................................................................................5-1
iv Contents Rosemount Analytical Inc. A Division of Emerson Process Management
Page 7

Model CAT200
Figure 1-1. CAT200 Continuous Analyzer Transmitter ............................................................ 1-1
Figure 1-2. Absorption Bands of Sample Gas and Transmittance of Interference Filters ....... 1-3
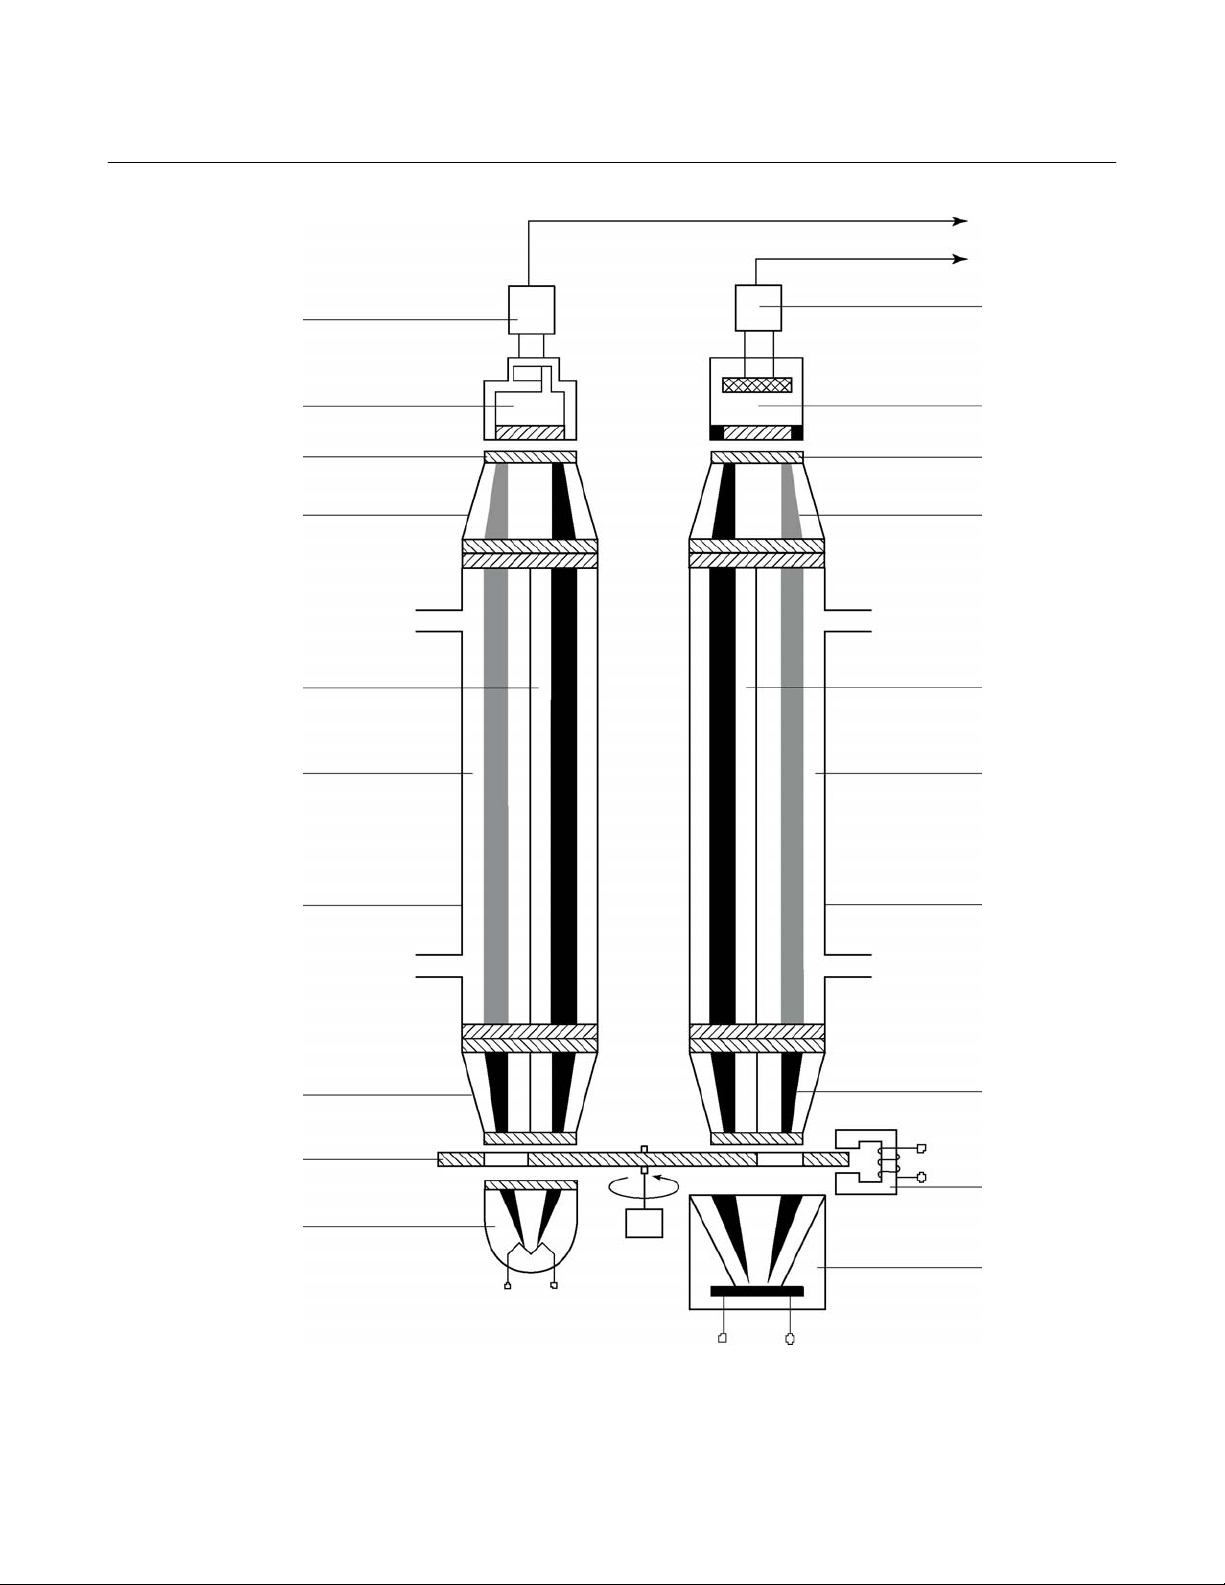
Figure 1-3. Opto-Pneumatic Gas Detector............................................................................... 1-4
Figure 1-4. Overall NDIR Method............................................................................................ 1-6
Figure 1-5. Paramagnetic Oxygen Analysis............................................................................. 1-7
Figure 1-6. Electrochemical Oxygen Sensor............................................................................ 1-8
Figure 1-7. Reaction of Galvanic Cell ...................................................................................... 1-9
Figure 1-8. Thermal Conductivity Sensor............................................................................... 1-11
Figure 1-9. Response Time vs Flow Rate Dependence ........................................................ 1-11
Figure 2-1. Gas Connections ................................................................................................... 2-2
Figure 2-2. Piping Diagram (Example)..................................................................................... 2-3
Figure 2-3. Outline and Mounting Dimensions......................................................................... 2-4
Figure 2-4. Internal Gas Paths (example) ................................................................................ 2-6
Figure 2-5. Increased Safety Junction Box Terminals ........................................................... 2-11
Figure 2-6. Leak Test - Flow Indicator Method ...................................................................... 2-12
Figure 2-7. Leak Test - Manometer Method........................................................................... 2-13
Figure 3-1. Startup Display ......................................................................................................3-1
Figure 3-2. The Display and Operating Keys........................................................................... 3-2
Figure 3-3. The Display Screen ............................................................................................... 3-3
Figure 3-4. Confirmation Display.............................................................................................. 3-4
Figure 3-5. Main Menu Display ............................................................................................... 3-5
Figure 3-6. Module Manufacturing Data Displays.................................................................... 3-6
Figure 3-7. Main Menu Sub Menus.......................................................................................... 3-7
Figure 3-8. Analyzer Channel Status Menu Display ................................................................ 3-8
Figure 3-9. Status Details Displays .......................................................................................... 3-9
Figure 3-10. List of Possible Failures Menu (Screen 1 of 2)...................................................... 3-9
Figure 3-11. List of Possible Failures (Screen 2 of 2)................................................................ 3-9
Figure 3-12. Confirmation Displays.......................................................................................... 3-10
Figure 3-13. Analyzer Operation Settings Menu...................................................................... 3-11
Figure 3-14. Auto Start Procedures ......................................................................................... 3-11
Figure 3-15. Single Channel Display........................................................................................ 3-12
Figure 3-16. Multi Channel Display .......................................................................................... 3-12
Figure 3-17. Basic Controls and Setup Menu .......................................................................... 3-13
Figure 3-18. Calibration Procedure Status Menu..................................................................... 3-13
Figure 3-19. Calibration Deviations Menu................................................................................ 3-13
Figure 3-20. Set Gas Valves Menu .......................................................................................... 3-16
Figure 3-21. Analyzer and I/O, Expert Controls & Setup Sub Menus...................................... 3-17
Figure 3-22. Analyzer Module Setup and Controls (1/3) Menu (Screen 1 of 3)....................... 3-18
Figure 3-23. Analyzer Module Setup and Controls (2/3) Menu (Screen 2 of 3)....................... 3-18
Figure 3-24. Analyzer Module Setup and Controls (3/3) Menu (Screen 3 of 3)....................... 3-18
Figure 3-25. Load Factory Configuration ................................................................................. 3-19
Figure 3-26. Calibration Parameters Menu .............................................................................. 3-19
Figure 3-27. Span Gas Definition Menu................................................................................... 3-20
Figure 3-28. Tolerances Menu ................................................................................................. 3-20
Figure 3-29. Calibration Procedure Setup Menu ..................................................................... 3-22
Figure 3-30. Zero/Span Calibration Stability Diagram ............................................................. 3-22
Figure 3-31. Analog Output Chart ............................................................................................ 3-23
Figure 3-32. Time Control Menu .............................................................................................. 3-24
Figure 3-33. Auto-Start Procedures Menu ............................................................................... 3-24
Figure 3-34. Calibration Menu.................................................................................................. 3-25
Figure 3-35. Advanced Calibration Menu................................................................................. 3-26
Instruction Manual
748446-D
April 2002
LIST OF ILLUSTRATIONS
Rosemount Analytical Inc. A Division of Emerson Process Management Contents v
Page 8

Instruction Manual
748446-D
April 2002
Figure 3-36. State of Calibration Procedures Screen .............................................................. 3-26
Figure 3-37. Zero Gas Definition Menu.................................................................................... 3-27
Figure 3-38. Alarm Setup Menu ............................................................................................... 3-28
Figure 3-39. Concentration Alarm Setup Menu ....................................................................... 3-29
Figure 3-40. Range Parameters Menu..................................................................................... 3-30
Figure 3-41. Begin / End of Ranges Menu............................................................................... 3-30
Figure 3-42. Response Times Menu........................................................................................ 3-31
Figure 3-43. Auto-ranging Control Menu.................................................................................. 3-31
Figure 3-44. Hysteresis Between Ranges Graph .................................................................... 3-32
Figure 3-45. Actual Switch Levels Screen ............................................................................... 3-33
Figure 3-46. Cross Interference Compensation Menu............................................................. 3-34
Figure 3-47. Channels Display................................................................................................. 3-34
Figure 3-48. Interference Factors Menu................................................................................... 3-35
Figure 3-49. Multiple Spline Linearization Menu...................................................................... 3-36
Figure 3-50. Linearization Raw Values Menu .......................................................................... 3-36
Figure 3-51. Programmable Logic Control Menu..................................................................... 3-38
Figure 3-52. PLC Program Menu ............................................................................................ 3-44
Figure 3-53. PLC Outputs Menu .............................................................................................. 3-44
Figure 3-54. Programmable Calculator Menu.......................................................................... 3-45
Figure 3-55. Programmable Calculator – Program Menu ........................................................ 3-47
Figure 3-56. Measurement Display Configuration Menu (Screen 1 of 3) ................................ 3-48
Figure 3-57. Measurement Display Configuration Menu (Screen 2 of 3) ................................ 3-49
Figure 3-58. Measurement Display Configuration Menu (Screen 3 of 3) ................................ 3-49
Figure 3-59. Acknowledgement of Status Reports Menu ........................................................ 3-50
Figure 3-60. General Concentration Measurement Parameters Setup Menu ......................... 3-50
Figure 3-61. Concentration Peak Measurement Menu ............................................................ 3-51
Figure 3-62. Differential Measurement Menu........................................................................... 3-52
Figure 3-63. Gas Flow Setup Menu ......................................................................................... 3-53
Figure 3-64. Pressure Compensation Menu ............................................................................ 3-54
Figure 3-65. Flow Measurement Menu .................................................................................... 3-55
Figure 3-66. Pressure Compensation Menu ............................................................................ 3-55
Figure 3-67. Load/Save Analyzer Module Configuration Menu ............................................... 3-56
Figure 3-68. Analyzer Module I/O Modules Menu ................................................................... 3-57
Figure 3-69. Local SIO Configuration Parameters Menu......................................................... 3-57
Figure 3-70. Analog Outputs Menu .......................................................................................... 3-57
Figure 3-71. Analyzer Modules Menu ...................................................................................... 3-58
Figure 3-72. Output Signal If Analyzer Module Fails / Fine Adjustment Menu ........................ 3-59
Figure 3-73. Serial Interface Menu........................................................................................... 3-60
Figure 3-74. Relay Outputs Menu ............................................................................................ 3-60
Figure 3-75. Local DIO Boards Setup Menu ............................................................................ 3-61
Figure 3-76. Delay and Average Menu .................................................................................... 3-63
Figure 3-77. Example Concentration Average......................................................................... 3-63
Figure 3-78. AK-Communication Menu.................................................................................... 3-64
Figure 3-79. System Configuration Menu ................................................................................ 3-65
Figure 3-80. Diagnostic Menus ................................................................................................ 3-65
Figure 3-81. Analyzer Module Diagnostics Menu .................................................................... 3-66
Figure 3-82. Load/Save Analyzer Module Configuration Menu ............................................... 3-67
Figure 3-83. Date and Time Menu ........................................................................................... 3-68
Figure 3-84. Security Setup Menu ........................................................................................... 3-69
Figure 3-85. Define Basic Level Security PIN Menu................................................................ 3-69
Figure 3-86. System Reset Menu ............................................................................................ 3-71
Figure 3-87. Control Module RAM – Memory Usage Menu..................................................... 3-71
Figure 3-88. Display Controls Menu......................................................................................... 3-72
Model CAT200
vi Contents Rosemount Analytical Inc. A Division of Emerson Process Management
Page 9

Model CAT200
Figure 3-89. Front Panel Control Menu.................................................................................... 3-72
Figure 3-90. Temperature Controller........................................................................................ 3-74
Figure 4-1. CAT200 Enclosure Assembly ................................................................................ 4-2
Figure 4-2. Photometer Analyzer Component Layout.............................................................. 4-8
Figure 4-3. Analyzer Component Layout ................................................................................. 4-9
Figure 4-4. Analyzer Component Layout ............................................................................... 4-10
Figure 4-5. Analyzer Component Layout ............................................................................... 4-11
Figure 4-6. Plug Locations PCB PIC...................................................................................... 4-12
Figure 4-7. Analyzer Rear Panel Layout ................................................................................ 4-14
Figure 4-8. SIO/DIO Pin Assignments (Option) (Front View Of Connectors) ........................ 4-15
Figure 4-9. Pin Assignments DC Power Connector............................................................... 4-16
Figure 4-10. TC Sensor Standard (Short) Response Time Setting ......................................... 4-17
Figure 4-11. TC Sensor Long Response Time Setting ............................................................ 4-17
Figure 4-12. Analyzer Photometer Assembly ( 2 Channel IR, Electrochemical Oxygen
Analyzer, Viewed From Top) ............................................................................... 4-19
Figure 4-13. Chopper Housing with IR Light Sources.............................................................. 4-20
Figure 4-14. Photometer Assembly (1 mm to 10 mm cells)..................................................... 4-21
Figure 4-15. Photometer Assembly (30 mm to 200 mm cells)................................................. 4-21
Figure 4-16. PCB OXS Test Points and Connections.............................................................. 4-24
Figure 4-17. Rear View of Front Panel with Oxygen Sensor ................................................... 4-24
Figure 4-18. Photometer Block Diagram.................................................................................. 4-26
Figure 4-19. PCB VVS .............................................................................................................4-27
Figure 4-20. PCB MOP ............................................................................................................ 4-28
Figure 4-21. Detector Signal .................................................................................................... 4-29
Figure 4-22. Controller Board ACU .......................................................................................... 4-31
Figure 4-23. Fuses on PCB LEM ............................................................................................. 4-32
Figure 4-24. PCB OXS Cable Connections Locations............................................................. 4-34
Figure 4-25. Power Supply Connections.................................................................................. 4-35
Figure 4-26. DIO Inductive Loads ............................................................................................ 4-36
Instruction Manual
748446-D
April 2002
LIST OF TABLES
Table 2-1. Analog Output (SIO) Terminal Assignments ......................................................... 2-9
Table 2-2. Digital Input & Output (DIO) Terminal Assignments.............................................. 2-9
Table 2-3. Relay Output Contacts (SIO) Terminal Assignments .......................................... 2-10
Table 2-4. RS232/RS485 Serial Interface (SIO) Terminal Assignments .............................. 2-10
Table 2-5. Power Connections Terminal Assignments......................................................... 2-10
Table 3-1. Available Operators ............................................................................................. 3-39
Table 3-2. Available Commands (Signal Codes 1 – 19): General Signals.......................... 3-39
Table 3-3. Available Commands (Signal Codes 20 – 39): Programmable Calculator.......... 3-39
Table 3-4. Available Commands (Signal Codes 40 – 69): Programmable Logic Controls... 3-40
Table 3-5. Available Commands (Signal Codes 70 – 89): SIO I/O Module.......................... 3-40
Table 3-6. Available Commands (Signal Codes 90 – 109): DIO I/O Module........................ 3-41
Table 3-7. Measurement Channels....................................................................................... 3-42
Table 3-8. Zero And Span Gas For Each Gas Component .................................................. 3-43
Table 3-9. Valve/Gas Sequencing ........................................................................................ 3-43
Table 3-10. Program Steps..................................................................................................... 3-43
Table 3-11. Programmable Calculator Operator Types.......................................................... 3-45
Table 3-12. Programmable Calculator Operand Types.......................................................... 3-46
Table 3-13. Programmable Calculator Program Steps........................................................... 3-47
Table 3-14. Application for Basic Controls Menu Allowable Function Variables .................... 3-49
Table 3-15. System Configuration and Diagnostic Menus Overview ..................................... 3-65
Rosemount Analytical Inc. A Division of Emerson Process Management Contents vii
Page 10

Instruction Manual
748446-D
April 2002
Model CAT200
DRAWINGS
659922 Assembly Instructions, Basic CAT200
660210 Installation Drawing, CAT200
660371 Diagram, Power Input and Ground Circuits
661581 Wiring Diagram CAT200
(LOCATED IN REAR OF MANUAL)
viii Contents Rosemount Analytical Inc. A Division of Emerson Process Management
Page 11

Instruction Manual
Model CAT200
PREFACE
The purpose of this manual is to provide information concerning the components, functions, installation and maintenance of the CAT200 .
Some sections may describe equipment not used in your configuration. The user should become
thoroughly familiar with the operation of this module before operating it. Read this instruction
manual completely.
DEFINITIONS
The following definitions apply to DANGERS, WARNINGS, CAUTIONS and NOTES found throughout
this publication.
DANGER .
Highlights the presence of a hazard which will cause severe personal injury, death, or substantial
property damage if the warning is ignored.
748446-D
April 2002
WARNING .
Highlights an operation or maintenance procedure, practice, condition, statement, etc. If not
strictly observed, could result in injury, death, or long-term health hazards of personnel.
CAUTION.
Highlights an operation or maintenance procedure, practice, condition, statement, etc. If not
strictly observed, could result in damage to or destruction of equipment, or loss of effectiveness.
NOTE
Highlights an essential operating procedure,
condition or statement.
Rosemount Analytical Inc. A Division of Emerson Process Management Preface P-1
Page 12

Instruction Manual
748446-D
April 2002
Model CAT200
INTENDED USE STATEMENT
The CAT200 Continuous Analyzer Transmitter is intended for use as an industrial process measurement device only. It is not intended for use in medical, diagnostic, or life support applications,
and no independent agency certifications or approvals are to be implied as covering such applications.
SAFETY SUMMARY
If this equipment is used in a manner not specified in these instructions, protective systems may be
impaired.
AUTHORIZED PERSONNEL
To avoid explosion, loss of life, personal injury and damage to this equipment and on-site property,
do not operate or service this instrument before reading and understanding this instruction manual
and receiving appropriate training. Save these instructions.
DANGER.
ELECTRICAL SHOCK HAZARD
Do not open while energized. Installation requires access to live parts which can cause death or
serious injury.
For safety and proper performance this instrument must be connected to a properly grounded
three-wire source of power.
DANGER.
POSSIBLE EXPLOSION HAZARD
Do not operate without dome and covers secure. Ensure that all gas connections are made as labeled and are leak free. Improper gas connections could result in explosion and death.
P-2 Preface Rosemount Analytical Inc. A Division of Emerson Process Management
Page 13

Instruction Manual
Model CAT200
DANGER.
ELECTRICAL SHOCK HAZARD
Do not operate without dome and covers secure. Servicing requires access to live parts which can
cause death or serious injury. Refer servicing to qualified personnel. Operating personnel must
not remove instrument covers.
For safety and proper performance this instrument must be connected to a properly grounded
three-wire source of power.
WARNING.
DEVICE HAZARDOUS AREA CERTIFICATION(S)
748446-D
April 2002
Any addition, substitution, or replacement of components installed on or in this device, must be
certified to meet the hazardous area classification that the device was certified to prior to any such
component addition, substitution, or replacement. In addition, the installation of such device or
devices must meet the requirements specified and defined by the hazardous area classification of
the unmodified device. Any modifications to the device not meeting these requirements, will void
the product certification(s).
Do not open instrument when energized.
Ensure that all gas connections are made as labeled and are leak free. Improper gas connections
could result in explosion and death.
This unit’s exhaust may contain hydrocarbons and other toxic gases such as carbon monoxide.
Carbon monoxide is highly toxic and can cause headache, nausea, loss of consciousness, and
death.
WARNING: DEVICE CERTIFICATION(S)
WARNING.
POSSIBLE EXPLOSION HAZARD
WARNING
TOXIC GAS
Avoid inhalation of the exhaust gases at the exhaust fitting.
Connect exhaust outlet to a safe vent using stainless steel or Teflon line. Check vent line and connections for leakage.
Keep all tube fittings tight to avoid leaks. See Section 2-3 (page 2-12) for leak test information.
Rosemount Analytical Inc. A Division of Emerson Process Management Preface P-3
Page 14

Instruction Manual
748446-D
April 2002
DANGER
TOXIC GAS PURGE
This device may contain explosive, toxic or unhealthy gas components. Before cleaning or changing parts in the gas paths, purge the gas lines with ambient air or nitrogen.
WARNING
PARTS INTEGRITY AND UPGRADES
Tampering with or unauthorized substitution of components may adversely affect the safety of this
instrument. Use only factory approved components for repair.
Because of the danger of introducing additional hazards, do not perform any unauthorized modification to this instrument.
Contact Rosemount Analytical Inc., Customer Service Center for Return Authorization.
Model CAT200
CAUTION
PRESSURIZED GAS
This unit requires periodic calibration with a known standard gas. It also may utilizes a pressurized carrier gas, such as helium, hydrogen, or nitrogen. See General Precautions for Handling and
Storing High Pressure Gas Cylinders at the rear of this manual.
CAUTION
HEAVY WEIGHT
Use two persons or a suitable lifting device to move or carry the instrument.
P-4 Preface Rosemount Analytical Inc. A Division of Emerson Process Management
Page 15

Instruction Manual
748446-D
Model CAT200
April 2002
GENERAL PRECAUTIONS FOR HANDLING AND STORING HIGH
PRESSURE GAS CYLINDERS
Edited from selected paragraphs of the Compressed Gas Association's "Handbook of Compressed
Gases" published in 1981
Compressed Gas Association
1235 Jefferson Davis Highway
Arlington, Virginia 22202
Used by Permission
1. Never drop cylinders or permit them to strike each other violently.
2. Cylinders may be stored in the open, but in such cases, should be protected against extremes of
weather and, to prevent rusting, from the dampness of the ground. Cylinders should be stored in the
shade when located in areas where extreme temperatures are prevalent.
3. The valve protection cap should be left on each cylinder until it has been secured against a wall or
bench, or placed in a cylinder stand, and is ready to be used.
4. Avoid dragging, rolling, or sliding cylinders, even for a short distance; they should be moved by using a
suitable hand-truck.
5. Never tamper with safety devices in valves or cylinders.
6. Do not store full and empty cylinders together. Serious suckback can occur when an empty cylinder is
attached to a pressurized system.
7. No part of cylinder should be subjected to a temperature higher than 125
never be permitted to come in contact with any part of a compressed gas cylinder.
8. Do not place cylinders where they may become part of an electric circuit. When electric arc welding,
precautions must be taken to prevent striking an arc against the cylinder.
°
F (52°C). A flame should
Rosemount Analytical Inc. A Division of Emerson Process Management Preface P-5
Page 16

Instruction Manual
748446-D
April 2002
Model CAT200
DOCUMENTATION
The following CAT200 instruction materials are available. Contact Customer Service Center or the local
representative to order (See Section 5).
748441 Instruction Manual (this document)
COMPLIANCES
This product may carry approvals from several certifying agencies. The certification marks appear on the
product name-rating plate.
Area Classifications:
USA
Class I Zone 1
AEx d e m IIB + H
T4X
2
Canada
Ex d e m IIB + H
European Union
ATEX, Category 2, Zone 1, IIB + H
USA/Canada
Certified by Canadian Standards Association, an OSHA Nationally Recognized Testing Laboratory (NRTL) for USA and Canada.
European Union
Conforms with the provisions of the EMC Directive 89/336/EEC, Low Voltage Directive 73/23/EEC, Potentially Explosive Atmospheres Directive
94/9/EC, including amendments by the CE marking Directive 93/68/EEC.
EC type Examination Certificate, LCIE 00 ATEX 6009 X.
Rosemount Analytical has satisfied all obligations from the European Legislation to harmonize the product requirements in Europe.
Australia/New Zealand
Conforms with Electromagnetic Compatibility – Generic Emission standard
and AS/NZS 4251.1 – 1994 Part 1 – Residential, commercial, and light industrial.
2
T4X
T4X
2
®
0081
EEx d e m II B (+H2) T4
LCIE 00 ATEX 6009 X
II 2 G
N96
Complies with the NAMUR RECOMMENDATION, Electromagnetic Compatibility (EMC) issue 1998.
P-6 Preface Rosemount Analytical Inc. A Division of Emerson Process Management
NAMUR
Page 17

Model CAT200
DESCRIPTION AND SPECIFICATIONS
Instruction Manual
748446-D
April 2002
SECTION 1
1-1 OVERVIEW
This manual describes the CAT200 Continuous Analyzer Transmitter.
The CAT200 is a multi-component, multimethod Continuous Gas Analyzer. Its Class I,
Zone I (IIB) + H
2
T2 X approved enclosure
makes it suitable for installation in hazardous
environments. The field mountable housing
design allows the CAT200 to be mounted
close to the process instead of in a remote
shelter. This feature greatly reduces installation and utility costs while improving process
efficiency.
The CAT200 can continuously measure 1, 2
or 3 components in a single analyzer using a
combination of Non Dispersive Infrared
(NDIR/UV/VIS), Paramagnetic Oxygen,
Thermal Conductivity, Electrochemical sensors. The CAT200 also features an optional
customized sample-handling module.
The CAT200 offers advanced menu and diagnostic functionality with the ability to network
multiple analyzers in complex process monitor
and control systems. The high speed micro-
processor architecture of the CAT200 makes
it capable of ultra low range measurements
for CO and CO
2
.
1-2 TYPICAL APPLICATIONS
The CAT200 Continuous Analyzer Transmitter
supports a variety of industry applications,
drawing on more than 40 years of development and process expertise in sensors, digital
signal processing and software technologies.
The CAT200 can satisfy the most demanding
single or multi-component analysis requirements. More than 60 gas components can be
measured including:
Carbon Monoxide (CO)
Carbon Dioxide (CO
Methane (CH
)
4
Hexane (CH equiv.) (C
Water Vapor (H
Oxygen (O
Hydrogen (H
)
2
)
2
)
2
)
6H14
O)
2
Helium (He)
Argon (Ar)
Figure 1-1. CAT200 Continuous Analyzer Transmitter
Rosemount Analytical Inc. A Division of Emerson Process Management Description and Specifications 1-1
Page 18

Instruction Manual
748446-D
April 2002
Model CAT200
a. Standard Industry Applications
Petrochemical Refinery
Light Naphtha Isomerization
•
H2, CO and CO2 in make-up Hydrogen
Gas to Combined Feed
•
H2 in Scrubber Off Gas to Refinery Fuel
Gas Header
Catalytic Reforming
•
H2 in Recycle Gas from Product Sepa-
rator
•
H2 in Net Gas from Net Gas Knockout
Drum
•
H2 in CCR Nitrogen Header
•
H2 in Surge Hopper Vent
Fluidized Catalytic Cracking
•
CO and O2 Monitoring of Fluidized
Catalytic Cracking Regenerator Gas
Sulfur Recovery Units
•
Propylene in Feed to Sulfur Recovery
Plant
Petrochemical Complex
•
Ethylene in Primary and Secondary De-
Methanizer Overhead
•
CO2 in Ethane-Ethylene Splitter
•
Propylene in Splitter Bottoms
Ammonia and Urea
1-3 DETECTOR METHODOLOGIES
The CAT200 can employ up to two of four
different measuring methods depending on
the configuration chosen. The methods are:
2
NDIR, Paramagnetic O
, Electrochemical O2,
and Thermal Conductivity.
a. Non-Dispersive Infrared (NDIR)
The non-dispersive infrared method is
based on the principle of absorption of infrared radiation by the sample gas being
measured. The gas-specific wavelengths
of the absorption bands characterize the
type of gas while the strength of the absorption gives a measure of the concentration of the gas component being
measured.
An optical bench is employed comprising
an infrared light source, two analysis cells
(reference and measurement), a chopper
wheel to alternate the radiation intensity
between the reference and measurement
side, and a photometer detector. The detector signal thus alternates between concentration dependent and concentration
independent values. The difference between the two is a reliable measure of the
concentration of the absorbing gas component.
Depending on the gas being measured
and its concentration, one of two different
measuring methods may be used as follows:
•
H2, CO and CO2 in Synthesis Gas
Utilities
Interference Filter Correlation Method
With the IFC method the analysis cell is
alternately illuminated with filtered infrared
•
H2 in Cooling Gas in Turbine Generators
concentrated in one of two spectrally
separated wavelength ranges. One of
Metals
•
H2 in Endothermic Furnace
these two wavelength bands is chosen to
coincide with an absorption band of the
sample gas and the other is chosen such
All Applications
•
Continuous Emission Monitoring Sys-
that none of the gas constituents expected to be encountered in practice absorbs anywhere within the band.
tems (CEMS)
The spectral transmittance curves of the
interference filters used in the CAT200
1-2 Description and Specifications Rosemount Analytical Inc. A Division of Emerson Process Management
Page 19

Model CAT200
Instruction Manual
748446-D
April 2002
analyzer and the spectral absorption of
the gases CO and CO
2
are shown in
Figure 1-2 below. It can be seen that the
absorption bands of these gases each
coincide with the passbands of one of the
interference filters. The forth interference
filter, used for generating a reference signal, has its passband in a spectral region
where none of these gases absorb. Most
of the other gases of interest also do not
absorb within the passband of this reference filter.
CO
The signal generation is accomplished
with a pyroelectrical (solid-state) detector.
The detector records the incoming infrared radiation. This radiation is reduced by
the absorption of the gas at the corresponding wavelengths. By comparing the
measurement and reference wavelength,
an alternating voltage signal is produced.
This signal results from the cooling and
heating of the pyroelectric detector material
2
CO
Absorption Band
Transmittance (%)
0 15 30 54 60 75 90
Transmittance (%)
0 18 36 54 72 90
3000 3200 3400 3600 3800 4000 4200 4400 4600 4800 5000 5200 5400 5600
HC CO2 CO
Reference
Wave Length (nm)
Figure 1-2. Absorption Bands of Sample Gas and Transmittance of Interference Filters
Rosemount Analytical Inc. A Division of Emerson Process Management Description and Specifications 1-3
Page 20

Instruction Manual
748446-D
April 2002
Model CAT200
b. Opto-PneumAtic Method
In the opto-pneumatic method, a thermal
radiator generates the infrared radiation
which passes through the chopper wheel.
This radiation alternately passes through
the filter cell and reaches the measuring
and reference side of the analysis cell
with equal intensity. After passing another
filter cell, the radiation reaches the pneumatic detector.
The pneumatic detector compares and
evaluates the radiation from the measuring and reference sides of the analysis
cell and converts them into voltage signals proportional to their respective intensity.
The pneumatic detector consists of a gasfilled absorption chamber and a compen-
sation chamber which are connected by a
flow channel in which a Microflow filament
sensor is mounted. This is shown in
Figure 1-3 below. In principle the detector
is filled with the infrared active gas to be
measured and is only sensitive to this distinct gas with its characteristic absorption
spectrum. The absorption chamber is
sealed with a window which is transparent
for infrared radiation. The window is usually Calcium Fluoride (CaF
2
).
When the infrared radiation passes
through the reference side of the analysis
cell into the detector, no pre-absorption
occurs. Thus, the gas inside the absorption chamber is heated, expands and
some of it passes through the flow channel into the compensation chamber.
Absorption chamber
Flow channel with
Microflow sensor
CaF2 Window
Figure 1-3. Opto-Pneumatic Gas Detector
Compensation chamber
1-4 Description and Specifications Rosemount Analytical Inc. A Division of Emerson Process Management
Page 21

Model CAT200
Instruction Manual
748446-D
April 2002
When the infrared radiation passes
through the open measurement side of
the analysis cell into the detector, a part
of it is absorbed depending on the gas
concentration. The gas in the absorption
chamber is, therefore, heated less than in
the case of radiation coming from the reference side. Absorption chamber gas becomes cooler, gas pressure in the
absorption chamber is reduced and some
gas from the compensation chamber
passes through the flow channel into the
absorption chamber.
The flow channel geometry is designed in
such a way that it hardly impedes the gas
flow by restriction. Due to the radiation of
the chopper wheel, the different radiation
intensities lead to periodically repeated
flow pulses within the detector.
The Microflow sensor evaluates these
flow pulses and converts them into electrical pulses which are processed into the
corresponding analyzer output.
c. Overall NDIR Method
In the case of dual-channel analyzers, the
broadband emission from two infrared
sources pass through the chopper wheel.
In the case of the Interference Filter Correlation (IFC) method, the infrared radiation then passes through combinations of
interference filters. In the case of the
opto-pneumatic method, the infrared radiation passes through an optical filter
depending on the application and need for
reduction of influences. Then the infrared
radiation enters the analysis cells from
which it is focused by filter cells onto the
corresponding detector. The preamplifier
detector output signal is then converted
into the analytical results expressed directly in the appropriate physical concentration units such as percent volume,
ppm, mg/Nm
Figure 1-4 (page 1-6).
3
, etc. This is shown in
Rosemount Analytical Inc. A Division of Emerson Process Management Description and Specifications 1-5
Page 22
Instruction Manual
748446-D
April 2002
Model CAT200
To electronics
Preamplifier
Pneumatic or pyroelectric detector
(solid-state detector)
window
Filter cell without dividing
wall (IFC) with optical
filters
reference side
measuring side
Preamplifier
Duplex filter disc
VIS / UV
semiconductor detector
window
Filter cell without
dividing wall (IFC)
with optical filters
reference side
measuring side
Analysis cell
Filter cell with dividing wall (IR)
Chopper blade
IR source with
reflector
Motor
Figure 1-4. Overall NDIR Method
Analysis cell
Filter cell with dividing wall (UV)
Eddy current drive
VIS / UV source
with reflector
1-6 Description and Specifications Rosemount Analytical Inc. A Division of Emerson Process Management
Page 23

Model CAT200
Instruction Manual
748446-D
April 2002
d. Paramagnetic Oxygen Method
The paramagnetic principle refers to the
induction of a weak magnetic field, parallel and proportional to the intensity of a
stronger magnetizing field.
The paramagnetic method of determination of oxygen concentration utilizes nitrogen filled quartz spheres arranged at
opposite ends of a bar, the center of
which is suspended by and free to rotate
on a thin platinum wire ribbon in a cell.
Nitrogen (N
2
) is used because it is dia-
magnetic or repelled by a magnet.
A small mirror that reflects a light beam
coming from a light source to a photodetector, is mounted on the platinum ribbon.
A strong permanent magnet specifically
shaped to produce a strong, highly inhomogeneous magnetic field inside the
analysis cell, is mounted outside the wall
of the cell.
When oxygen molecules enter the cell,
their paramagnetism will cause them to
be drawn towards the region of greatest
magnetic field strength. The oxygen
molecules thus exert different forces on
the two suspended nitrogen filled quartz
spheres, producing a torque which
causes the mirror to rotate away from its
equilibrium position.
The rotated mirror deflects the incident
light onto the photodetector creating an
electrical signal which is amplified and fed
back to a coil attached to the bar holding
the quartz spheres, forcing the suspended
spheres back to the equilibrium position.
The current required to generate the restoring torque to return the quartz bar to
its equilibrium position is a direct measure
of the O
2
concentration in the sample gas.
The complete paramagnetic analysis cell
consists of an analysis chamber, permanent magnet, processing electronics, and
a temperature sensor. The temperature
sensor is used to control a heat exchanger to warm the measuring gas to
about 55 °C. Refer to Figure 1-5 below.
Permanent Magnet
Platinum Wire
Mirror
Light
Source
Photodetector
Amplifier
Display
Quartz Sphere(s)
Wire Loop
Figure 1-5. Paramagnetic Oxygen Analysis
Rosemount Analytical Inc. A Division of Emerson Process Management Description and Specifications 1-7
Page 24

Instruction Manual
748446-D
April 2002
Model CAT200
e. Electrochemical Oxygen Method
The electrochemical method of determining oxygen concentration is based on the
galvanic cell principle shown in Figure 1-6
below.
incorporates a lead and gold galvanic
process with a lead anode and a gold
cathode, using an acid electrolyte.
Oxygen molecules diffuse through a nonporous Teflon membrane into the electrochemical cell and are reduced at the gold
cathode. Water is the byproduct of this
reaction.
On the anode, lead oxide is formed which
is transferred into the electrolyte. The lead
anode is continuously regenerated and,
therefore, the electrode potential remains
unchanged for a long time. The rate of
diffusion and corresponding response
time (t
90
) of the sensor is dependent on
the thickness of the Teflon membrane.
The electric current between the electrodes is proportional to the O
2
concen-
tration in the sample gas being measured.
The resultant signal is measured as a
voltage across the resistor and thermistor,
the latter of which is used for temperature
compensation. A change in the output
voltage (mV) represents oxygen concentration.
NOTE
The electrochemical O
cell requires a
2
minimum internal consumption of
oxygen. Sample gases with an oxygen
concentration of less than 2% could
result in a reversible detuning of sensitivity and the output will become unstable. The recommended practice is
to purge the cell with conditioned ambient air between periods of measurement. If the oxygen concentration is
below 2% for several hours or days,
the cell must be regenerated for about
one day with ambient air. Temporary
flushing with nitrogen (N
) for less
2
than one hour (analyzer zeroing) will
have no effect on the sensitivity or
stability.
Lead Wire (Anode)
Lead Wire (Cathode)
Anode (Lead)
O-Ring
Plastic Disc
Plastic Disk
Black
Red
Resistor
Thermistor
Acid Electrolyte
Sponge Disc
Cathode (Gold Film)
Teflon Membrane
Figure 1-6. Electrochemical Oxygen Sensor
1-8 Description and Specifications Rosemount Analytical Inc. A Division of Emerson Process Management
Page 25

Model CAT200
(
)
(
)
)
)
Instruction Manual
748446-D
April 2002
Red
Thermistor (5
(-) (+)
Gold Lead
Cathode (2) Anode (1)
O2 + 4 H + 4 e → 2 H2O2 Pb + 2 H
Summary reaction O2 + 2 Pb → 2 PbO
V out
Electrolyte (3)
(ph 6)
Black
Resistor (6
O → 2PbO + 4 H + 4 e
2
Figure 1-7. Reaction of Galvanic Cell
Rosemount Analytical Inc. A Division of Emerson Process Management Description and Specifications 1-9
Page 26

Instruction Manual
748446-D
April 2002
Model CAT200
f. Thermal Conductivity Method
Thermal conductivity is an efficient
method to measure two-component gas
2
mixtures such as H
Thermal conductivity measuring cells incorporate electrically heated wires with
cooling rates that are influenced by the
sample gas in the cell. The cell combines
short response time with minimum interference, which can be effected by variations in the sample gas flow rate.
The measuring cells consist of an outer
ring enclosing a inner cylindrical chamber.
This chamber contains two lateral passages, each equipped with two thermal
sensor devices. One passage is supplied
with sample gas and the other is supplied
with an optional reference gas or a closed
loop. A variable bypass arrangement
permits adjustments of response time
versus flow rate dependence. The cell
can be set between extremes of fast response with relative high dependence on
flow rate, or low response time with least
dependence on sample flow rate by rotating the outer section with respect to the
inner section.
Both the cell volume and the mass of its
measurement resistor have been minimized on order to obtain short response
time. A nickel resistor is placed between
two superimposed square ceramic plates
which form the walls of the measurement
cell. The cell volume is approximately 1
µl. A total of four such cells are integrated
to form the sensor, two of these function
as the measurement cells, and the other
two function as the reference cells. The
latter may be either sealed off, or connected to a flow of a reference gas.
, HE, CO2 and Ar.
rounding gas to colder chamber walls. For
otherwise stable conditions, this heat absorption will be proportional to the thermal
conductivity of the gas present between
the sensor and the chamber wall. Interconnecting the four sensors into a Wheatstone bridge circuit provides an electronic
signal proportional to gas density.
The annular inner chamber is provided
with two transverse passages, each of
which is equipped with two temperature
sensors. One of these transverse passages is subjected to a flow of the sample
gas, while to other is subjected to a flow
of the reference gas (optional), or is
sealed off as a closed loop (standard version). The gas flow will distribute itself
between the transverse passages, or
between the annular grooves on the periphery of the annular chamber.
This results in a variable bypass configuration. If the transverse passages are
aligned directly opposite the gas inlet and
outlet fittings, there will result the shortest
response times and an enhanced dependence of the analytical signal upon the
sample-gas flow rate.
If the transverse passages are arranged
aligned at 90° Angles to these gas fittings,
the heat transport between sample gas
and the sensor will be predominantly by
diffusion (i.e. significantly slowed). The
dependence of the analytical signal upon
sample gas flow rate will be minimized
and the response time extended.
This arrangement has the advantage that
any value between the two mentioned
extremes may be set. See Section 4-4g
page 4-17 for adjustment of the response
time versus flow rate dependence.
The entire measurement cell is thermostatically controlled to a temperature of up
to 55 °C. The four integral temperature
sensors are electrically heated to a higher
temperature. Their temperatures, and
thus their electrical resistance, are dependent upon heat losses, which in turn,
result from heat absorption in the sur-
1-10 Description and Specifications Rosemount Analytical Inc. A Division of Emerson Process Management
The materials in contact with the samplegas flow rate are aluminum, Viton, stainless steel and ceramic. This provides for
resistance to corrosion which might arise
for some types of aggressive sample gas
constitutions.
Page 27

Model CAT200
g
Instruction Manual
748446-D
April 2002
Inner chamber
Figure 1-8. Thermal Conductivity Sensor
T
Timing Constant
Outer chamber
Flow Dependence
Cell T
0° 45° 90°
∆α
Optimal
Ran
e
Figure 1-9. Response Time vs Flow Rate Dependence
Rosemount Analytical Inc. A Division of Emerson Process Management Description and Specifications 1-11
Page 28

Instruction Manual
748446-D
April 2002
1-4 SPECIFICATIONS
a. General
Power ............................................ Universal Power Supply 90-264 VAC, 50-60 Hz,
Detectors/Number ......................... NDIR, PMD, E02, TC, UV/VIS (one channel only).
Mounting........................................ 4” or 6” Pipe, Rack, or Wall Mount
Area Classification......................... See Compliances page P7
Corrosion Protection Option.......... Instrument grade air is required. Consult factory for
Ambient Range
Temperature .......................... -30° to +5° Celsius. (-34° to 122° F)
Relative Humidity................... 5% to 95%
Inputs/Outputs
Digital..................................... RS232 serial data
Analog Current Outputs......... Up to 8 isolated 4-20 ma, 500 ohms max load
Analog Digital Outputs........... Up to 16, 5-30 VDC, max current 500 ma
Analog Digital Inputs.............. Up to 8, 0-30 VDC, 2.2 ma
Instrument Weight ......................... 120 to 150 lbs. (55-70 kg)
Model CAT200
±10% 180 Watts Maximum at Start Up. Up to 380
Watts with optional case heater.
Up to three channels in one analyzer.
requirements
1-12 Description and Specifications Rosemount Analytical Inc. A Division of Emerson Process Management
Page 29

Model CAT200
b. CAT200 Detector
Instruction Manual
748446-D
April 2002
Detection Limit
Linearity
Zero Drift
Span Drift
Repeatability
2,3
2,3
2,3
2,3
Response Time
Sample Flow Rate
Sample Pressure
Influence of Pressure
Standard
5
Pres. Comp. Opt.
Influence of
Temperature
On Zero
On Span
On Span
2
2
2
,6
Sensor Materials in
Contact with Sample
Warm-up Time
NDIR/UV/VIS
2,3
≤
1%
≤
1%
≤
1%
90
2,3
2,3
≤
7s
≤
2%/week
≤
1%/week
3s ≤ t
Paramagnetic
≤
2%/week
≤
1%/week
4
≤
O
1%
≤
≤
2
1
2,3
1%
2,3
2,3
1%
O2
Electrochemical
2,3
≤
1%
≤
1%
≤
2%/week
≤
1%/week
2,3
2,3
≤
1%
<5-6s 12s 3s ≤ t90 ≤ 20s
Thermal
Conductivity
2,3
≤
2%
≤
1%
≤
2%/week
≤
1%/week
2,3
2,3
≤
1%
1
4
.2-1.5 l/min .2-1.5 l/min .2-1.5 l/min .2-1.5 l/min .2-1.5 l/min
≤
1500 hPa abs Atm
≤
0.1%/hPa
5
≤
0.01%/hPa
≤
1%
≤
5%
≤
1%
Anodized Alum
Stainless Steel
Optional
15 to 50 Min
4
≤
0.1%/hPa
≤
0.01%/hPa
≤
1%
≤
1%
≤
1%
Stainless Steel
50 Min 15 to 50 Min 50 Min
≤
1500 hPa abs
≤
0.1%/hPa
≤
0.01%/hPa
≤
1%
≤
2%
≤
1%
Stainless Steel
Teflon
≤
1500 hPa abs≤1500 hPa abs
≤
0.1%/hPa
≤
0.01%/hPa
≤
1%
≤
5%
≤
1%
Stainless Steel
NDIR Ultra Low
(0-10ppm)
CO
CO2(0-20ppm)
0.2ppm
≤
1%
±2ppm
≤
10s
≤
1%
≤
5%
≤
2%
3
3
3
1
1
1
≤
≤
±2%/24-hr
≤
±2%/24-hr
≤
≤
0.1%/hPa
≤
0.01%/hPa
Gold Plated
Stainless Steel
15 - 50 Min
4
1
Temperature change not greater than 10k in 1 hour.
2
Related to fullscale, per 10°K.
3
At constant pressure and temperature.
4
Dependent on sensor.
5
Related to measuring value.
6
With optional temperature stabilization.
Rosemount Analytical Inc. A Division of Emerson Process Management Description and Specifications 1-13
Page 30

Instruction Manual
748446-D
April 2002
Model CAT200
1-14 Description and Specifications Rosemount Analytical Inc. A Division of Emerson Process Management
Page 31

Model CAT200
Instruction Manual
748446-D
April 2002
SECTION 2
INSTALLATION
DANGER
ELECTRICAL SHOCK HAZARD
POSSIBLE EXPLOSION HAZARD
Do not open while energized. Do not operate without dome and covers secure. Installation requires access to live parts
which can cause death or serious injury.
WARNING
ELECTRICAL SHOCK HAZARD
Installation and servicing of this device
requires access to components that may
present electrical shock and/or mechanical
hazards. Refer installation and servicing to
qualified service personnel.
WARNING
POSSIBLE EXPLOSION HAZARD
Installation of this device must be made in
accordance with all applicable national
and/or local codes. See specific references
on installation drawing located in the rear
of this manual.
2-1 PROCESS AND CALIBRATION GAS CON-
NECTION
Besides sample gas, the CAT200 requires
other gases for operation. In most cases, one
or more Calibration Standards must be provided. These should be cylinders of gas which
closely resemble the expected sample, both in
species and concentrations. These calibration
gases are normally introduced into the system
as an input to the Sample Conditioning Plate
Option or sample conditioning may be provided by others.
Each gas cylinder should be equipped with a
clean, hydrocarbon free two-stage regulator
with indicating gauges of approximately 0 to
3000 psig (0 to 207 bar) for cylinder pressure
and 0 to 100 psig (0 to 6.7 bar) for delivery
pressure. Regulators should have a metallic
as opposed to elastomeric diaphragm, and
provide for ¼ inch compression fitting outlet
and should be LOX clean.
NOTE
All connections specified in the Installation Drawing, in conjunction with the Application Data Sheet, should be made.
NOTE
Purge and reference option combination is
only available with two channel analyzer.
CAUTION
HIGH PRESSURE GAS CYLINDERS
This unit requires periodic calibration with
a known standard gas. It also may utilizes
a pressurized carrier gas, such as helium,
hydrogen, or nitrogen. See General Precautions for Handling and Storing High
Pressure Gas Cylinders, page P-5.
Rosemount Analytical Inc. A Division of Emerson Process Management Installation 2-1
An example of a typical gas connection arrangement for a one channel to three channel
series analyzer is shown in Figure 2-2 page 2-
3.
When the optional auto-calibration solenoid
valves are installed, the sample gas is introduced to connection 9 instead of connection 1
or 3. In this case, the outlet at connection 5 is
used.
An external flow meter may be used (if no
internal is available) to adjust the flow rate.
Page 32

Instruction Manual
748446-D
April 2002
Model CAT200
In hazardous areas this must be done in
accordance with the legilation. The flow
must be adjusted so that calibration gases
and sample gas have the same rate. The
1 2 3 4
567
8 9 10 11
auto calibration solenoid valve option is
only available with a two-channel analyzer
with series connection.
Bottom View
1 – Gas Inlet Ch 1 2 – Gas Outlet Ch 1 3 – Gas Inlet Ch 2* 4 – Gas Outlet Ch 2*
5 – Gas Inlet Ch 3, Reference 1, or Span Gas 1 Inlet* 6 –Gas Outlet Ch 3, Reference 1, or Span Gas 2 Inlet *
7 – Gas Inlet Purge, Reference 2, or Sample Gas Inlet* 8 – Gas Outlet Purge, Reference 2, or Zero Gas Inlet*
9, 10, 11 – Spare
*Option – Purge Gas or Reference Gas
Figure 2-1. Gas Connections
2-2 Installation Rosemount Analytical Inc. A Division of Emerson Process Management
Page 33

Model CAT200
(
)
(
)
A
Instruction Manual
748446-D
April 2002
Span gas 1
Span gas 2
Sample gas
Zero gas
Solenoid Valves
not supplied
V1
V2
V3
V4
NALYZER
Channel 3
(option)
Throttle and Dust Filter
(not supplied)
Channel 2
(option)
Gas Sampling Pump
(not supplied)
Gas Outlet
Channel 1
Gas Inlet
Flow Meter
not supplied
Figure 2-2. Piping Diagram (Example)
Rosemount Analytical Inc. A Division of Emerson Process Management Installation 2-3
Page 34

Instruction Manual
[
]
[
]
[
]
[
]
[
]
[
]
[
]
[
]
748446-D
April 2002
27.00
685.8
14.25
362
16.00
406.4
13.00
330.2
A
MOUNTING HOLE
.625 [15.88] DIA
4 PLC’S
D
2.50
[63.5]
Model CAT200
3.00
76.2
2.90
[73.7]
B
25.50
647.7
.62
[15.7]
1.25
[31.8]
2.25
[57.2]
D. SAMPLE HANDLING PLATE OPTION. SIZE AND
ARRANGEMENT SUBJECT TO APPLICATION.
C. ELEVEN GAS CONNECTION PORTS (IF REQUIRED
FOR APPLICATION, FLAME ARRESTOR(S) INSTALLED). SEE FIGURE 2-1, PAGE 2-2.
B. ANALOG AND DIGITAL I/O PORTS (M16 x 1.5).
A. INCREASED SAFETY JUNCTION BOX.
Note: The Increased Safety Junction Box must be
protected by fuse supply which has a breaking capacity adjusted to the short circuit of the equipment.
C
2.00
50.8
DIMENSIONS
1.00
25.4
INCH
MM
Figure 2-3. Outline and Mounting Dimensions
2-4 Installation Rosemount Analytical Inc. A Division of Emerson Process Management
Page 35

Model CAT200
Instruction Manual
748446-D
April 2002
a. Gas Conditioning
If the CAT200 is not supplied with the optional Sample Handling Plate, care must
be taken to ensure that the sample gas is
properly conditioned for successful operation of the various detectors.
All gases must be supplied to the analyzer as conditioned gases! When the
system is used with corrosive gases, it
must be verified that there are no gas
components which may damage the gas
path components.
The gas conditioning must meet the following conditions:
•
Free of condensable constituents
•
Free of dust above 2 µm
•
Free of aggressive constituents which
may damage the gas paths
•
Temperature and pressure in accor-
dance with the specifications
When analyzing vapors, the dewpoint of
the sample gas must be at least 10 °C
below the ambient temperature in order to
avoid the precipitation of condensate in
the gas paths.
An optional barometric pressure compensation feature can be supplied for the
CAT200. This requires a pressure sensor
with a range of 800 – 1,100 hPa. The
concentration values computed by the
detectors will then be corrected to eliminate erroneous measurements due to
changes in barometric pressure.
The gas flow rate must be in the range of
0.2 l/min to a maximum of 1.5 l/min. A
constant flow rate of 1 l/min is recommended.
NOTE:
The maximum gas flow rate for paramagnetic oxygen detectors is 1.0
l/min!
b. Internal Gas Paths
The possible variations of the internal gas
paths are shown in Figure 2-4 (page 2-6)
for a three channel analyzer. The variations depend on the configuration chosen.
Certain options may not be available depending on the number of channels and
the gas path options chosen. See specific
configuration for analyzer.
Rosemount Analytical Inc. A Division of Emerson Process Management Installation 2-5
Page 36

Instruction Manual
CO2/H2O
748446-D
April 2002
Tubing in series
Model CAT200
In Out
In OutIn OutIn Out
Tubing in parallel
(limited reference options)
Tubing in series and
parallel
(special tubing)
ULCO
Special tubing
(External in series)
(Internal in parallel)
In OutIn Out
COhigh
CO ultra low
Figure 2-4. Internal Gas Paths (example)
2-6 Installation Rosemount Analytical Inc. A Division of Emerson Process Management
Page 37

Model CAT200
Instruction Manual
748446-D
April 2002
2-2 INSTALLATION
CAUTION
Do not operate or service this instrument
before reading and understanding this instruction manual and receiving appropriate training.
WARNING
ELECTRICAL SHOCK HAZARD
POSSIBLE EXPLOSION HAZARD
Do not open while energized. Do not operate without dome and covers secure. Installation requires access to live parts
which can cause death or serious injury.
WARNING
HIGH PRESSURE GAS CYLINDERS
This unit requires periodic calibration with
a known standard gas. It also may utilizes
a pressurized carrier gas, such as helium,
hydrogen, or nitrogen. See General Precautions for Handling and Storing High
Pressure Gas Cylinders, page P-5.
Refer to the installation drawing supplied with
the application data package.
a. Location
The CAT200 is designed to be installed in
unsheltered environmental locations. It is
recommended that the analyzer be located out of direct sunlight to the extent
possible.
The CAT200 should be installed as near
as possible to the sample point, in order
to avoid low response time caused by
long sample gas lines.
b. Limitations
Ambient Temperature:-30° to 50° C (-34°
to 122° F)
Relative Humidity:5% to 95%
c. Gas Lines
For external gas lines, the use of all new
tubing throughout is strongly recommended. The preferred type is new, refrigeration grade copper tubing, sealed at
the ends. Generally, stainless steel tubing
is less desirable as it contains hydrocarbon contaminants introduced through
cleaning. Pre-cleaned and rinsed stainless steel tubing is available from various
supply houses, and is recommended if
stainless steel is desired.
d. Services
All input power, AC or DC as well as input
and output digital and analog signals connect through the Safety Junction Box located above the CAT200 dome.
e. Mounting Options
The CAT200 can be mounted to either 4½ or 6-¼ inch diameter pipe stands. Alternately, the analyzer can be wall or floor
mounted.
Although the CAT200 is enclosed in an
explosion proof and environmentally
sealed enclosure, it should be protected
from direct sunlight. In areas subjected to
harsh winter climates, protection should
be provided from rain and snow. A corrugated awning or other suitable means can
be provided to meet these conditions.
See drawing 660210 on the inside of the
rear cover for typical pipe mounting
method. Note that the mounting stand is
an option.
Rosemount Analytical Inc. A Division of Emerson Process Management Installation 2-7
Page 38

Instruction Manual
748446-D
April 2002
Model CAT200
f. Vent Lines
Connect all vent lines (these are specified
on the Application Data Sheet) to an appropriate header. The header should have
a means of being purged when venting
dangerous gases. Insure that there is no
back pressure in the vent system as this
will cause variations in the repeatability of
the system.
g. Electrical Connections
NOTES
The enclosure is a NEMA 4X IP 55. All
entry locations must be sealed.
North American area classification –
Class I Zone 1, Group IIB + H
Cenelec Category 2 – Zone 1, Group
IIB + H
2
T4.
Readily accessible main power dis-
connect to be supplied by customer.
Electrical installation to be in accor-
dance with National Electrical Code.
(ANSI/NFPA 70) and or other applicable national or local codes.
Connect all required signal cables to the
Increased Safety Junction Box. The cable
entry locations are indicated on the inside
cover of the junction box. The actual
electrical connections will be specified in
the Application Data package. All connections are not necessary for every application.
T4.
2
All digital inputs and digital outputs are
made through the Increased Safety Junction Box. Cable length for these signals
should not exceed 3,000 feet (914 meters), to avoid excessive capacitance and
corresponding signal distortion.
The following connections are made
through the Increased Safety Junction
Box:
•
Electrical Power – ½” conduit
•
Analog Outputs – ½” conduit
• Digital Outputs & optional RS232/RS485
– ½” conduit
Power Cable
AC Operation: 16 gauge, minimum.
DC Operation: 12 gauge, minimum.
Connect AC power through a 10A circuit
breaker that is to be located close to the
CAT200. The circuit breaker will provide
over current protection as well as a
means of disconnecting the power.
Maximum power requirements will be 180
watts, with most applications requiring
less than this amount.
NOTE
The optional case heater may increase
power requirements to 380 watts.
2-8 Installation Rosemount Analytical Inc. A Division of Emerson Process Management
Page 39

Model CAT200
Top 1 (blk) 4-20 current output 1
Top 2 (brn) 4-20 current output 2
Top 3 (red) mA return for output 1 & 2
Top 4 (org) 4-20 current output 3 (option)
Top 5 (yel) 4-20 current output 4 (option)
Top 6 (grn) mA return for output 3 & 4
Top 7 (blu) 4-20 current output 5 (option)
Top 8 (vio) 4-20 current output 6 (option)
Top 9 (gry) mA return for output 5 & 6
Top 10 (wht) 4-20 current output 7 (option)
Top 11 (wht/blk) 4-20 current output 8 (option)
Top 12 (wht/brn) mA return for output 7 & 8
Bottom 1 (blk) Digital output 1
Bottom 2 (brn) Digital output 2
Bottom 3 (red) Digital output 3
Bottom 4 (org) Digital output 4
Bottom 5 (yel) Digital output 5
Bottom 6 ((grn) Digital output 6
Bottom 7 (blu) Digital output 7
Bottom 8 (vio) Digital output 8
Bottom 9 (gry) Digital output 9
Bottom 10 (wht) Digital output 10
Bottom 11 (wht/blk) Digital output 11
Bottom 12 (wht/brn) Digital output 12
Bottom 13 (wht/red) Digital output 13
Bottom 14 (wht/org) Digital output 14
Bottom 15 (wht/yel) Digital output 15
Bottom 16 (wht/grn) Digital input 1
Bottom 17 (wht/blu) Digital input 2
Bottom 18 (wht/vio) Digital input 3
Bottom 19 (wht/gry) Digital input 4
Bottom 20 (blk/red) Digital input 5
Bottom 21 (blk/org) Digital input 6
Bottom 22 (blk/yel) Digital output common 1-8
Bottom 23 (blk/grn) Digital output common 9-15
Instruction Manual
748446-D
April 2002
Terminal Description
Table 2-1. Analog Output (SIO) Terminal Assignments
Terminal Description
NOTE:
The loading of the open collector digital outputs is a maximum of 30 VDC and 500 mA. See Section
4-6h, page 4-36
Table 2-2. Digital Input & Output (DIO) Terminal Assignments
Rosemount Analytical Inc. A Division of Emerson Process Management Installation 2-9
Page 40

Instruction Manual
748446-D
April 2002
Terminal Description
Top 18 (wht/vio) Relay contact 1
Top 19 (wht/gry) Relay contact 2
Top 20 (wht/red) Relay contact 3
Top 21 (blk/org) Relay contacts common
Non-voltage carrying contacts, maximum 30 V, 1 A, 30 W.
Table 2-3. Relay Output Contacts (SIO) Terminal Assignments
Terminal RS232 RS485
Top 13 (wht/red) Ground Ground
Top 14 (wht/org) RxD RxD -
Top 15 (wht/yel) TxD RxD +
Top 16 (wht/grn) Not used TxD +
Top 17 (wht/blu) Not used TxD -
Model CAT200
NOTE
Table 2-4. RS232/RS485 Serial Interface (SIO) Terminal Assignments
Terminal Description
1 Hot (line In)
2 Neutral
3Ground
4Ground
Table 2-5. Power Connections Terminal Assignments
2-10 Installation Rosemount Analytical Inc. A Division of Emerson Process Management
Page 41

Model CAT200
Instruction Manual
748446-D
April 2002
EMI Filter Bottom
124
1 4
Power
1
Top
24
Figure 2-5. Increased Safety Junction Box Terminals
Rosemount Analytical Inc. A Division of Emerson Process Management Installation 2-11
Page 42

Instruction Manual
748446-D
April 2002
Model CAT200
2-3 ANALYTICAL LEAK CHECK
If explosive or hazardous gas samples are
being measured with the CAT200, it is recommended that gas line fittings and components be thoroughly leak-checked prior to
initial application of electrical power, bimonthly intervals thereafter, and after any
maintenance which involves breaking the integrity of the sample containment system.
a. Flow Indicator Method
Supply air or inert gas such as nitrogen,
at 10 psig (689 hPa), to the analyzer
through a flow indicator with a range of 0
to 250 cc/min. Install a shut-off valve at
the sample gas outlet. Set the flow rate to
125 cc/min.
Close the outlet shut-off valve and notice
that the flow reading drops to zero. If the
flow reading does not drop to zero, the
system is leaking and must be corrected
before the introduction of any flammable
sample gas or application of power.
CAT200 Analyzer
N2
10 psig
(69 kPa)
Inlet Outlet
Flow Meter
Gas
Outlet
Figure 2-6. Leak Test - Flow Indicator Method
2-12 Installation Rosemount Analytical Inc. A Division of Emerson Process Management
Page 43

Model CAT200
App
Instruction Manual
748446-D
April 2002
b. Manometer Method
Install a water-filled U-tube manometer at
the sample gas outlet. Install a shut-off
valve at the sample gas inlet. Admit air or
inert gas to the inlet shut-off valve until
the analyzer is pressurized to approximately 50 hPa. The water column will be
about 500 mm.
CAT200 Analyzer
Inlet Outlet
Close the inlet shut-off valve and, following a brief period for pressure equilibrium,
verify that the height of the water column
does not drop over a period of about 5
minutes. If the water column height drops,
the system is leaking and must be corrected before the introduction of any
flammable sample gas or application of
power.
N2
Water
Figure 2-7. Leak Test - Manometer Method
Overpressure
rox. 50 hPa
Rosemount Analytical Inc. A Division of Emerson Process Management Installation 2-13
Page 44

Instruction Manual
748446-D
April 2002
Model CAT200
2-14 Installation Rosemount Analytical Inc. A Division of Emerson Process Management
Page 45

Model CAT200
Instruction Manual
748446-D
April 2002
SECTION 3
OPERATION
3-1 STARTUP AND INITIALIZATION
Once the CAT200 has been correctly assembled and installed in accordance with
the instructions in Section 2-2 (page 2-7),
“Installation,” the analyzer is ready for operation.
Before operating the system, verify that the
Leak Checks have been performed and
that the sample handling unit is performing
correctly.
Apply power to the system and verify that
sample gas is flowing.
NOTE:
A warm-up time of from 15 to 50 minutes
is required depending on the installed
detector(s).
After switching on the CAT200, the analyzer will begin its booting procedure which
is apparent on the LCD screen. The first
part of the initialization procedure is a self
check of the software and analyzer components. Various displays will show the status
of the initialization including revision notes,
“Initializing network interface,” “Searching
for nodes,” and “Calculating bindings.”
Pressing the LCDreset (F1) key during initializing will reset the LCD brightness and
contrast to factory settings (See Section 327, page 3-72). Pressing the Abort (F3) key
will abort the network initializing, aborting
any connection to other analyzers. In that
case, only the menus of the local analyzer
will be available.
At the end of the initializing routine the “single component” screen will display as
shown on the next page. This screen is the
access to all other channels, menus and
submenus. The actual display may differ
from that shown depending on any custom
configuration as described in Sections 0313 (page 3-48) and 3-27 (page 3-72).
In case of power failure, all user defined
specific module parameters are saved by a
battery powered memory.
(C) 2001 FISHER-ROSEMOUNT Analytical
MLT Control Module Rev. 3.3.4/P008
Language: P009/01/00
Initializing Network
Initializing network interface
LCDReset
F1 F2 F3 F4 F5
Abort
Figure 3-1. Startup Display
Rosemount Analytical Inc. A Division of Emerson Process Management Operation 3-1
Page 46

Instruction Manual
y
748446-D
April 2002
Model CAT200
3-2 DISPLAY & OPERATING KEYS
a. Display
The LCD screen shows all measurement values of the analyzer, status values and all user menu instructions.
Operation is performed with five function keys, four arrow (cursor) keys and
the enter key. The function of each key
varies depending on the installed analyzer module, any auxiliary modules installed, and the individual menu
displayed.
b. Keys
The Function Keys, also called softkeys, are assigned values depending
on the menu or screen being displayed.
The legend is displayed above the
keys.
The Enter Key is used to confirm a
previously entered variable value, to
start a selected function or to go to a
submenu selected at a menu line as
opposed to the Function Keys. As an
alternate to using the Enter Key to start
a function, the → key can be used.
The Cursor Keys (↑ or ↓) are used to
move up or down the lines within a
menu or to increment and decrement
number variables.
The Cursor Keys (← or →) are used to
move backwards or forwards between
the pages of a menu or to select numeric digits for adjustment.
LCD Display
MLT/CH1/R1
37.50
0.00 Range: 1 50.00
Failures: No
Maintenance-Requests: No
Temperature: 20.0 C 0.0 100.0
Operation: Ready
Displa
F1 F2 F3 F4 F5
Status… Main… Channel BasicCal
Function Keys
ppm CH4
Figure 3-2. The Display and Operating Keys
Cursor Keys
Enter Key
3-2 Operation Rosemount Analytical Inc. A Division of Emerson Process Management
Page 47

Model CAT200
p
y
Instruction Manual
748446-D
April 2002
c. Menu Lines and Softkey Functional-
ity
Menu lines can be selected with the ↑
key or the ↓ key. The selected line is
displayed as white lettering on a black
background (highlighted). Menus can
contain four different types of lines:
Menu Line – A line ending with three
dots (…) indicates that it leads to a
submenu. The submenu can be activated by pressing the ↵ key or the →
key when the line is highlighted.
Function Line – A line ending with an
exclamation point (!) indicates that it will
start a function. The function can be
activated by pressing the ↵ key or the
→ key when the line is highlighted.
Variable Line – A line ending with a
colon (:) indicates that it displays a
module variable parameter. Some
parameters can be changed and some
parameters display only a status and
cannot be changed. Paramters that
cannot be changed will be displayed
below a line within the menu.
Text Line – A line without punctuation
marks only displays information.
Tag Line – At the top of each menu
page is the tag line of the current channel in the format – MLT / Channel # /
Range #. To the right of the Tag is the
value of the indicated channel.
The Function Keys (Softkeys) can
sometimes be assigned as Functions
(exclamation point) or Submenus (three
dots) as shown below.
Tag Line
Menu Line
Variable Lines
Function softkeys F1 – F5 Legend
MLT/CH1/R1 37.50 ppm
Calibration procedure status…
Start zero calibration procedure!
Start span calibration procedure!
Check calibration deviation: Enabled
Range number: 1
Span gas: 100 ppm
Range upper limit: 100 ppm
Operation status: Read
Measure
-- Basic Controls and Setu
Status… Channel Back… Valves…
--
Figure 3-3. The Display Screen
Selected Line
(Reverse Text)
Lines below this separator
line are information and
cannot be changed.
Rosemount Analytical Inc. A Division of Emerson Process Management Operation 3-3
Page 48

Instruction Manual
748446-D
April 2002
Model CAT200
d. Common Function Keys
Display – Change form the single
component display to the multicomponent display. F1 in the single
component display.
Measure – Change from menus and
submenus to the single component display of the selected channel. F1.
Status – Change to the menu “Analyzer Channel Status” which displays
the most important parameters and information about the status of the current channel or module. F2 if available.
(See Section 3-3a, page 3-8)
Main – Change from single component
display to the main menu. F3 in the
single component display. (See Section
3-2g, page 3-5)
Channel – Scrolls through the channels in the same menu. In the main
menu and the single component display
menu it moves between the channels of
the connected analyzers and analyzer
modules. IN the submenus it moves
only between the channels of the current analyzer or analyzer module. F3 if
available, F4 in the single component
display.
ware and hardware versions. F5 in the
main menu. (See Section 3-2g, page 35 “F5”)
More – Changes to an additional menu
page of the current menu. F5 if available.
e. Entering and Changing Variables
1. Select the variable line desired to
be changed using the ↑ key or the
↓ key. The selected line will be
highlighted white on black.
2. Press the ↵ key and the parameter
will be selected for modification.
3. Use the ↑ key or the ↓ key change
the value, scroll among the available variables or change the value
of a selected digit or character.
4. Use the ← key or the → key to se-
lect digits within a number. For
some variable the quantity of digits
or characters can be changed.
5. Press the ↵ key again to confirm
the new value.
f. Starting a Function
Lock – Changes to the main menu and
locks all three operation levels, if a security code is enabled in the system
configuration (See Section 3-26d, page
Pressing the ↵ key or the → key while
a function line is highlighted will bring
up a confirmation menu as shown below.
3-69). F4 in the main menu.
BasicCal – Change from the single
component display to the menu “Ana-
MLT/CH1/R1 37.50 ppm
lyzer module calibration.” F5 in the single component display. (See Section 36, page 3-25)
-- Confirmation Required –
MFG Data – Change from the main
menu to the menu “Module Manufac-
Do you really want to do this ??
Press “Yes” or “Back…”
turing Data” which displays further
submenus with information about the
control module and analyzer module,
such as address of the manufacturer,
serial number of the modules and soft-
3-4 Operation Rosemount Analytical Inc. A Division of Emerson Process Management
Yes…
Back…
Figure 3-4.Confirmation Display
Page 49

Model CAT200
y
y
play
y
Instruction Manual
748446-D
April 2002
Pressing the Back… (F4) key will return
to the previous menu page.
The confirmation prompt can be disabled in the “Measurement Display
Configuration” menu under the expert
configuration level. See Section 3-13,
page 3-48. In such case, each function
will start directly after the function menu
line is selected and no confirmation will
be required.
g. Main Menu
Pressing the Main… (F3) key or the →
key while in any single component display will bring up the Main Menu. From
the Main menu it is possible to change
all operating values of the analyzer to
set up and control the parameters of
measurement, calibration and data
transfer.
MLT/CH1/R1 37.50 ppm
-- Main Menu --
Analyzer basic controls (calibration) & setup…
zer and I/O, expert controls & setup…
Anal
stem configuration and diagnostics…
S
controls…
Dis
Time & Date: 14:01:45 29 July 2001
S
stem tag: Fisher-Rosemount
Measure
Status… Channel Lock… MFG Data
showing the manufacturing and version
data of the analyzer.
Selections from the Main Menu:
Measure (F1) – Changes to the single
component display of the current channel. See Section 3-1, page 3-1.
Status… (F2) – Changes to the “Current measurement parameters” menu
of the current channel. See Section 33a, page 3-8.
Channel (F3) – Scrolls through all
channels of the connected Analyzers
and Analyzer modules.
Lock… (F4) – Locks any operating
level by security code. See Section 326d, page 3-69.
MFG Data (F5) – Changes to “Module
Manufacturing Data” menu. See Figure
3-6, page 3-6 .
Figure 3-5. Main Menu Display
From the Main menu, the MFGData
(F5) key will access several submenus
Rosemount Analytical Inc. A Division of Emerson Process Management Operation 3-5
Page 50

Instruction Manual
g
g
y
y
g
748446-D
April 2002
Model CAT200
MLT/CH1/R1 37.50 ppm
Control module manufacturin
Anal
Measure
MLT/CH1/R1 37.50 ppm
Measure
MLT/CH1/R1 37.50 ppm
Serial num ber: d941-29
Manufacturing date: 08 08 01
Hardware revision: ACU02 R: 3.3.2 Final D: Jul2
Software revision: 3..3.4 / P008 / Ch5
Revision date: August 8 2001
Revision time: 03:26:15
-- Module Manufacturin
zer module manufacturing data…
(C) 2001 Fisher-Rosemount MFG GmbH & Co OHG
Manufactured by:
Fisher-Rosemount GmbH & Co OHG
Industriestrasse 1
D-63594 Hasselroth / Germany
Tel: (+49) 6055 884-0
FAX: (+49) 6055 884-209
zer Module Version Information --
-- Anal
data…
Data --
Back…<<< >>>
Back…
More…
MLT/CH1/R1 37.50 ppm
(C) 2001 Fisher-Rosemount MFG GmbH & Co OHG
Manufactured by:
Fisher-Rosemount GmbH & Co OHG
Industriestrasse 1
D-63594 Hasselroth / Germany
Tel: (+49) 6055 884-0
FAX: (+49) 6055 884-209
Measure
MLT/CH1/R1 37.50 ppm
Revision date: May 8 2001
Revision time: 15:30:02
Phrase dictionary version: P 009/01/00
Language: English
Measure
MLT/CH1/R1 37.50 ppm
-- Control Module Version Information --
Serial number: d9410129
Manufacturing date: 29.07.1999
Hardware revision: ACU02 R 3.3.2.D July 01 2001
Software r evision: 3.3.4 / P008
(C) 2001 Fisher-Rosemount
Orrville, Ohio 44667-0901 / USA
Or… More…
Manufactured by:
Rosemount Analytical Inc.
1201 North Main Street
Tel: (330) 682-9010
FAX: (330) 684-4434
Back…
Back…
Measure
MLT/CH1/R1 37.50 ppm
Measurement system:
RAM memory:
Local SIO module installed
Serial interface adapter:
Heater installed:
Local DIO module installed:
Sensor system revision:
Sensor system serial number:
Measure
-- Hardware Confi
Channel
Back…
uration --
Back…
More…
PSV-System
745376 Bytes
Enabled
RS-232
Measure
No
2
Back…
Figure 3-6. Module Manufacturing Data Displays
3-6 Operation Rosemount Analytical Inc. A Division of Emerson Process Management
Page 51
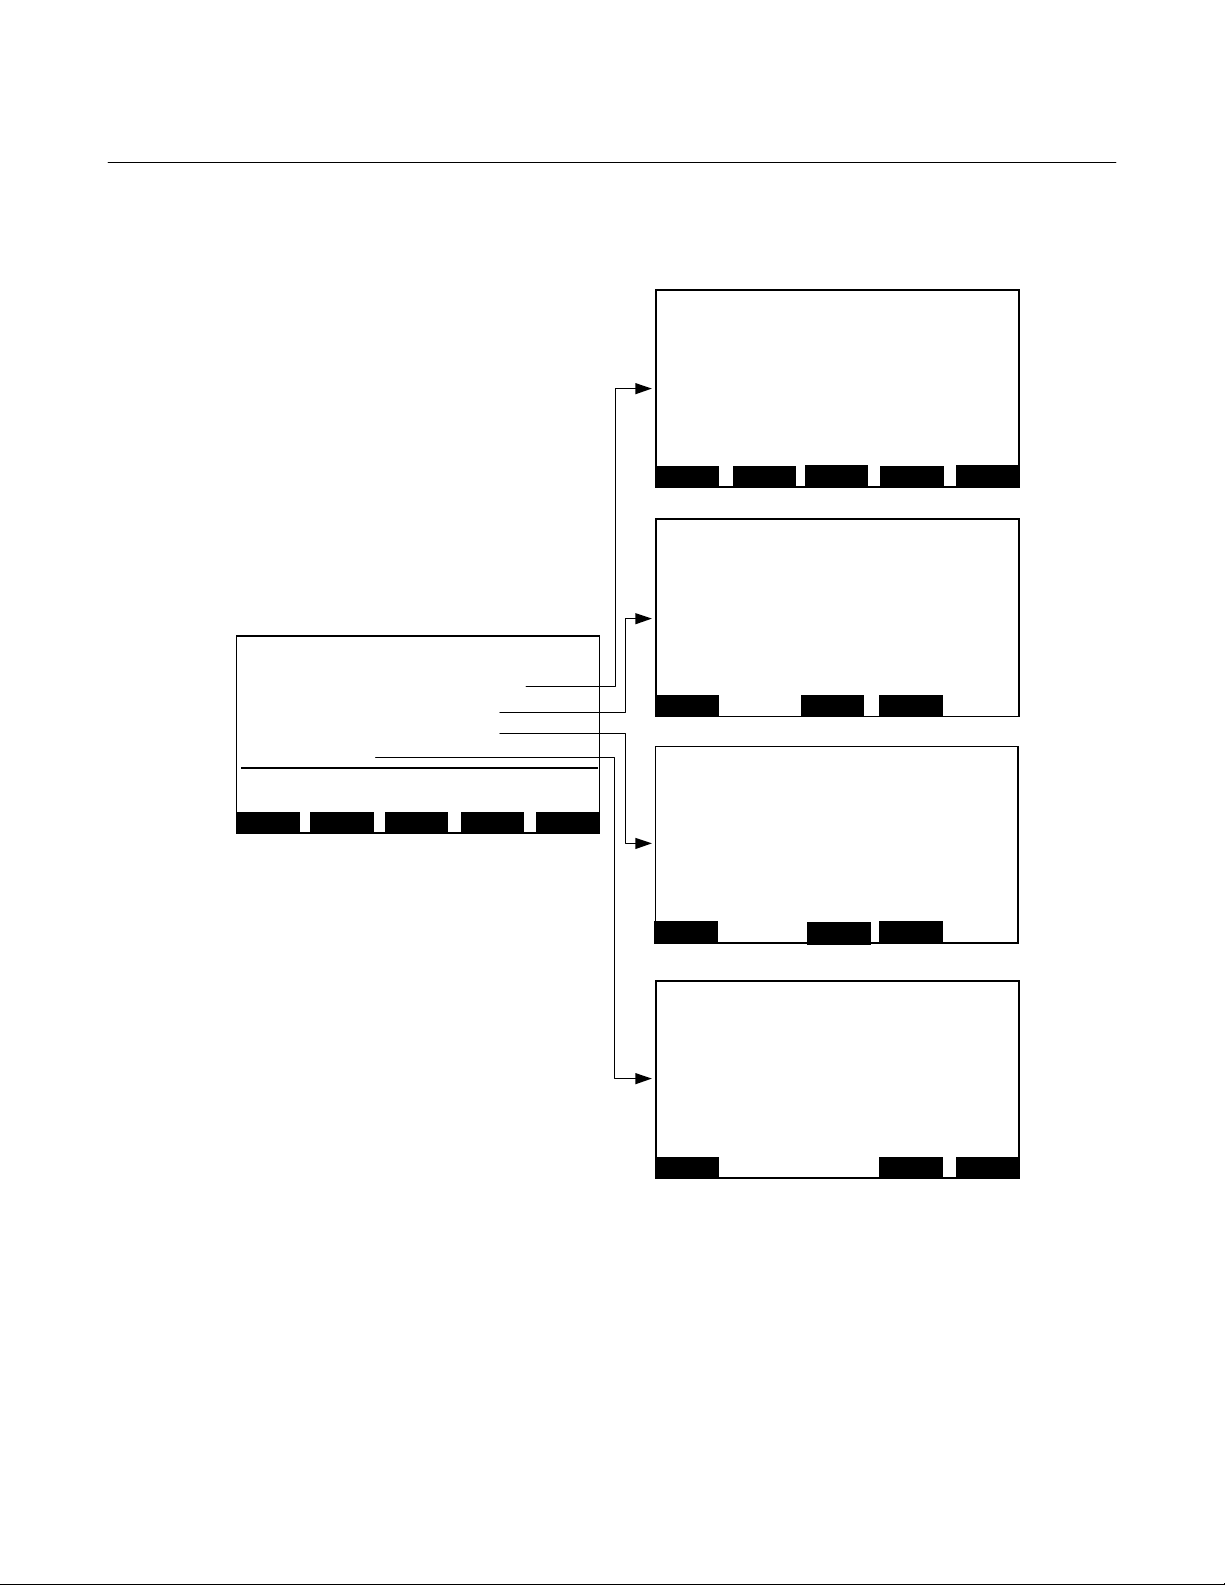
Model CAT200
y
y
y
play
y
p
p
play
p
y
Instruction Manual
748446-D
April 2002
MLT/CH1/R1 37.50 ppm
zer basic controls (calibration) & setup…
Anal
zer and I/O, expert controls & setup…
Anal
stem configuration and diagnostics…
S
controls…
Dis
Time & Date: 10:30:05 August 10 2001
stem tag: Fisher-Rosemount
S
Measure
-- Main Menu --
Status… Channel Lock… MFG Data
MLT/CH1/R1 37.50 ppm
Calibration procedure status…
Start zero calibration procedure!
Start span cal ibration pro cedure!
Check calibration deviation:
Range number:
Span gas:
Range upper limit:
O
eration status:
Measure
MLT/CH1/R1 37.50 ppm
Analyzer module controls…
II/O module controls…
Analyzer mod ule setup…
II/O module setup…
Measure
MLT/CH1/R1 37.50 ppm
System calibration…
Diagnostic menus…
Loading/saving configuration parameters…
Date and time…
Security codes…
Network module binding…
System reset…
Memory usage…
System modules…
System tag: Fisher-Rosemount
Measure
-- Basic Controls and Setu
Status…
-- Ex
Channel Valves…
ert Module Configuration --
Channel
-- System Configuration --
Channel
--
Back…
Back…
Back…
Enabled
46.00 ppm
50.00 ppm
Read
1
MLT/CH1/R1 37.50 ppm
Brightness: 70%
Contrast: 23%
Switch automatically to “Measure” after: 10 min.
Measure
-- Dis
Controls --
Back…
More…
Figure 3-7. Main Menu Sub Menus
Rosemount Analytical Inc. A Division of Emerson Process Management Operation 3-7
Page 52

Instruction Manual
y
y
y
748446-D
April 2002
3-3 BASIC SETUP
Model CAT200
The following section describe the basic
control of the analyzer and the viewing of
channel parameters. Examples of stepping
through the menus are shown so that the
user can become familiar with the opera-
a. Analyzer Channel Status
MLT/CH1/R1
37.50
0.00 Range: 1 50.00
Failures: No
Maintenance-Requests: No
Temperature: 20.0 C 0.0 100.0
Operation: Ready
Displa
MLT/CH1/R1 37.50 ppm
Status details…
Current operation parameters…
General status:
Hours of operation:
Operation status:
Events:
Alarms:
Failures:
Maintenance requests:
Function control/service:
Measure
MLT/CH1/R1
Status… Main… Channel BasicCal
-- Anal
zer Channel Status --
RawMeas
Channel More…Back…
37.50
0.00 Range: 1 50.00
Failures: No
Maintenance-Requests: No
Temperature: 20.0 C 0.0 100.0
Operation: Ready
ppm CH4
ppm CH4
Normal
164
Ready
No
No
No
No
No
tion, keeping in mind that displays and
menu choices may be different depending
on actual analyzer configuration and any
customization of the menus.
If necessary, from the Main menu press
MEASURE (F1).
Press STATUS (F2) to change to the
Analyzer Channel Status menu.
Or, from the Main menu press STATUS (F2)
to change to the Analyzer Status menu.
From the Analyzer Channel Status menu
additional submenus are available for Status
details… and Current operational
parameters… See Sections 3-3a (page 3-8)
and 3-3d (page 3-11).
NOTE
The RawMeas (F2) changes to the Primary
raw measurements submenu and then the
F5 key changes to the Secondary raw
measurements submenu.
The F5 key changes to the Special Functions submenu.
To return to the measurement display,
press Display (F1).
Displa
Status… Main… Channel BasicCal
Figure 3-8. Analyzer Channel Status Menu Display
3-8 Operation Rosemount Analytical Inc. A Division of Emerson Process Management
Page 53

Model CAT200
p
p
b. Status Details
To access the Status Details menu, from
the Analyzer Channel Status menu
(Figure 3-8, page 3-8), select “Status
details…” submenu, press Enter or →
key.
MLT/CH1/R1 37.50 ppm
-- Status Details --
Failures…
Maintenance requests…
Functions controls…
Alarms…
Events…
Acknowledge and clear failures!
Acknowledge and clear maintenance requests!
Acknowledge and clear function controls!
Measure
Back…
Instruction Manual
748446-D
April 2002
From the List of Possible Failures (1/2)
menu press More (F5), screen 2 is displayed.
MLT/CH1/R1 37.50 ppm
-- List of
External input:
Measure
Figure 3-11.List of Possible Failures
ossible failures (2/2) --
Back…
(Screen 2 of 2)
No
Figure 3-9. Status Details Displays
In the Status Details menu, select Failures…
Screen 1 (of 2) of the List of Possible
Failures menu.
MLT/CH1/R1 37.50 ppm
-- List of
One or more failures:
Configuration replaced by factory setting:
Chopper fail:
Raw signal overflow:
Detector signal communication failed:
Source:
Detector:
Heater control:
Temperature measurement:
Invalid pressure measurement:
Measure
ossible failures (1/2) --
Back… More…
No
No
No
No
No
No
No
No
No
No
Figure 3-10.List of Possible Failures Menu
(Screen 1 of 2)
Press Back… (F3) to return to the previous menu.
Press Measure to return to the Measurement Display.
NOTE:
In order to change to other available
status details, select the menu line
with the ↑ or ↓ keys and then press the
↵ key.
Rosemount Analytical Inc. A Division of Emerson Process Management Operation 3-9
Page 54

Instruction Manual
748446-D
April 2002
c. Acknowledge and Clear Failures
Model CAT200
This function is used after the reasons for
reported failures have been corrected.
Then the menu “List of Possible Failures,”
will be ready for new reports.
Use of this function is only possible if it is
enabled in the “Acknowledgement of
Status Reports” with the line “Acknowledgement allowed in status menu:” answered Yes.
From the Analyzer Channel Status menu
(Figure 3-8, page 3-8) select Status details… (Figure 3-9, page 3-9).
In the Status Details menu, select Acknowledge and clear failure!
The Confirmation Required screen is displayed.
MLT/CH1/R1 37.50 ppm
-- Confirmation Required --
In the Confirmation Required menu press
Yes (F2) to start the function, press
Back… (F4) to cancel and return to the
Status Details menu.
After Yes (F2) is pressed, SUCCESS
message is momentarily displayed once
the function has started.
The display automatically returns to the
Status Details menu.
The other “Acknowledge and clear……”
functions in the “Status Details” menu can
be acknowledged and cleared in the
same way as just described.
Do you really want to do this ??
Press “Yes” or “Back…”
Yes
MLT/CH1/R1 37.50 ppm
-- SUCCESS --
The selected function has been started/executed –
(Wait a moment…)
Back…
Figure 3-12. Confirmation Displays
3-10 Operation Rosemount Analytical Inc. A Division of Emerson Process Management
Page 55

Model CAT200
y
d. Current Operation Parameters
This function is used to view and control
various operational parameters of the current channel and controlled calibrations.
From the Analyzer Channel Status menu
(Figure 3-8, page 3-8) select Current operation parameters…
Instruction Manual
748446-D
April 2002
MLT/CH1/R1 37.50 ppm
-- Auto Start Procedures --
Position in the auto-start list:
Channel tag:
Procedure type:
Interval mode:
Start time:
Start date:
Time & Date:
MLT/CH1/CO
SPAN
Each Day
00:00:00
16:03:25 July 28, 2001
1
-
MLT/CH1/R1 37.50 ppm
zer Operation Settings --
-- Anal
Remote control via serial port (AK):
Range and calibration control:
Range:
Range upper limit:
Span gas concentration:
t90 time:
Hours of operation:
Last re-start occurred:
Actual zero gas concentration:
Auto-start procedures…
Measure
8:40:35 June 22, 2001
Back…Channel
Enabled
Manual
50.00 ppm
50.00 ppm
2.00 s
164
0.00ppm
Figure 3-13.Analyzer Operation Settings
Menu
Select Auto start procedures… press Enter.
Measure
Back…
Figure 3-14.Auto Start Procedures
1
In this menu the three time controlled
calibrations can be changed.
Press Measure (F1) to return to the single
component display of the current channel.
Rosemount Analytical Inc. A Division of Emerson Process Management Operation 3-11
Page 56

Instruction Manual
y
[2]
[2]
[2]
748446-D
April 2002
Model CAT200
e. Single Component Display
Use the following steps to change the
channel of the single component display.
Example:
2
Changing from CO
(channel 1) to CO
(channel 2)
From the single channel display press
Channel (F4)
MLT/CH1/R1
2.50 %
0.00 Range: 1 5.00
Temperature: 25.0 C 0.0 100.0
Maintenance-Requests: No
Any_Alarms: No
Operation: Ready
Displa
Figure 3-15. Single Channel Display
Status… Main… Channel BasicCal
CO2
f. Multi Component Display
To change from the single component
display to the multi component display
press Display (F1).
NOTE
Changing from the multi component
display can be done from each single
component display.
2.00
95.00
150.00
Select
MLT13/CH1
MLT13/CH2
MLT13/CH3
Status… Tags Off LCDReset
%CO2
ppm CO
ppm NO
0.00
0.00
0.00
Figure 3-16. Multi Channel Display
5.00
250.00
F.S. 150.00
Continue pressing Channel (F4) to display
the desired channel depending on the
analyzer configuration, ultimately returning to the first channel.
Each bargraph shows the start and end
of the range for the respective channel.
The number in parentheses indicates the
number of the selected range for that
channel. (F.S. = fullscale).
Use the Tags Off (F3) key to turn the tags
on or off.
To select a single channel in the multi
channel display, enable the select symbol
(>) by pressing the Select (F1) key or the
↓ key.
Then use the ↓ or ↑ key to select the line
for the desired channel. When the desired channel is marked, select it for single component display by pressing the
Select (F1) key.
3-12 Operation Rosemount Analytical Inc. A Division of Emerson Process Management
Page 57

Model CAT200
p
y
3-4 CALIBRATION
Instruction Manual
748446-D
April 2002
Select Calibration procedure status…
menu.
To insure correct analyzer measurement, zeroing and spanning should be performed at
least once per week. The span calibration
must be performed after the zeroing.
For analyzers with Ultra Low CO measurement, the calibration should be performed on
a daily basis.
For either manual or automatic calibration, the
required test gases must be fed to the analyzer through the respective gas inlets with a
no-back-pressure flow rate of about 1 l/min,
the same as the sample gas.
NOTE
After switching on the analyzer, wait at
least approximately 15 to 50 minutes (depending on installed detectors) for instrument warm up before feeding gas to the
analyzer.
NOTE
If the optional internal or external solenoid
valves are installed, the valves are automatically actuated by digital outputs for
the respective function.
MLT/CH1/R1 37.50 ppm
-- Calibration Procedure Status --
Procedure status:
Maximum remaining procedure time:
Valve position:
Concentration in span gas units:
Results
Last zero calibration:
Last span calibration:
Last zero was:
Last span was:
Successful zero+span calibrated ranges:
Measure
Cancel!
13:32:06 July 27 2001
13:37:23 July 27 2001
Ready
Samplegas
37.50 ppm
Success
Success
1=2=3=4
More…Back…
Figure 3-18. Calibration Procedure Status
Menu
The More… (F5) key will go to the Calibration Deviations menu. In this menu
you can close all valves or setup each
valve separately with zero gas, span gas,
sample gas, or test gas. See Section 34e, page 3-16.
Press More… (F5).
MLT/CH1/R1 37.50 ppm
-- Calibration Deviations --
Deviation from zero:
Sum of zero deviations:
0.34 ppm
4.41 ppm
0 s
a. Calibration Status
Deviation from span:
From the Single channel display press
Sum of span deviations:
BasicCal (F5) to go to the Basic Controls
and Setup menu.
MLT/CH1/R1 37.50 ppm
-- Basic Controls and Setu
Calibration procedure status…
Start zero calibration procedure!
Start span calibration procedure!
Check calibration deviation:
Range number:
Span gas:
Range upper limit:
Operation status:
Measure
Status…
Channel ValvesBack…
--
Enabled
1
46.00 ppm
50.00 ppm
Read
Figure 3-17. Basic Controls and Setup Menu
Rosemount Analytical Inc. A Division of Emerson Process Management Operation 3-13
Measure
Figure 3-19. Calibration Deviations Menu
A basic calibration procedure will reset
the deviations to 0.00 (see Section 36a, page 3-26)
Use the Channel (F3) key to check calibration deviations of other available
channels.
The Back… (F3) key returns to the Calibration Procedure Status menu.
Channel
NOTE
Back…
0.82 ppm
7.57 ppm
Page 58

Instruction Manual
748446-D
April 2002
Model CAT200
b. Zero Calibration
For zeroing, the analyzer has to be
flushed with nitrogen (N
) or an adequate
2
zero gas such as synthetic or conditioned
air. Air cannot be used for oxygen zeroing.
From the single channel display press
BasicCal (F5). The Basic Controls and
Setup menu is displayed (Figure 3-17,
page 3-13).
NOTE
Before starting zero calibration, make
sure that zero gas is available.
NOTE
All measurement ranges of the same
channel are zeroed at the same time.
Select “Start zero calibration!”. The confirmation screen is displayed.
Select Yes (F2) to start zero calibration or
Back… (F4) to cancel calibration and return to Basic Controls and Setup menu.
During calibration the “Procedure
status:” variable line will display the
progress of the calibration procedure.
They are:
st
1
: Purging1-Wait
The purging time depends on the parameters entered for purge time. See
Section 3-5e, page 3-20. The purge time
must be long enough to get a stable gas
concentration before calibration.
nd
2
: Zeroing-Wait
The procedure time depends on parameters entered for stability time and averaging time. See Section 3-5f, page 3-22.
rd
: Purging2-Wait
3
The purging time depends on the parameters entered for purge time. See
Section 3-5f, page 3-22. The purge time
must be long enough to get a stable gas
concentration before calibration.
Completed
NOTE
The display of this message depends
on the setup in the expert controls and
setup. See Section 3-13, page 3-48.
When Yes (F2) is pressed and calibration
starts, the Calibration Procedure Status
menu (Figure 3-18, page 3-13) is displayed
NOTE
The calibration procedure can be cancelled at any time by pressing the
Cancel! (F2) key.
To return to single component display
press Measure (F1).
To return to “Analyzer Module Calibration”
menu, press Back… (F4).
To change to “Calibration Deviations”
menu (Figure 3-19, page 3-13), press
More… (F5).
3-14 Operation Rosemount Analytical Inc. A Division of Emerson Process Management
Page 59

Model CAT200
c. Span Calibration
The span gas concentration should be in
the range or 80% to 110% of the fullscale
range of the analyzer. If lower span gas
concentrations are used, the measuring
accuracy for sample gas concentrations
higher than the span gas concentration
will be compromised. Spanning for oxygen measurement can be done using
ambient air as span gas, if the oxygen
concentration is known and constant.
To calibrate analyzers with Ultra Low CO
measurement internal H
3%vol, used for cross compensation),
use water vapor saturated N
gas, according to the according to the
saturation characteristics. Purge N
through a gas-bubbler bottle, filled with
distilled water and at a slightly higher ambient temperature as necessary. Connect
a second vessel into a kyrostat (to hold
the ambient temperature constant) in series to get a defined dew point.
From the single channel display press
BasicCal (F5) to display the “Basic Controls and Setup” menu.
Before starting span calibration, make
sure that span gas is available.
NOTE
2
O channel (0-
2
as a span
2
Instruction Manual
748446-D
April 2002
Yes (F2) to continue function, Back… to
return to Basic Controls and Setup menu.
NOTE
The display of this message depends
on the setup in the expert controls and
setup. See Section 3-13, page 3-48.
During calibration the “Procedure
status:” variable line will display the
progress of the calibration procedure:
st
1
: Purging1-Wait
The purging time depends on the parameters entered for purge time. See
Section 3-5c, page 3-19. The purge time
must be long enough to get a stable gas
concentration before calibration.
nd
2
: Spanning-Wait
The procedure time depends on parameters entered for stability time and averaging time. See Section 3-5c, page 3-19.
rd
: Purging2-Wait
3
The purging time depends on the parameters entered for purge time. See
Section 3-5c, page 3-19. The purge time
must be long enough to get a stable gas
concentration before calibration.
NOTE
Normally all measurement ranges of
the same channel are spanned at the
same time. To calibrate separately,
Completed
To return to single component display
press Measure (F1).
change the parameters. See Section 35c, page 3-19.
To return to “Analyzer Module Calibration”
menu, press Back… (F4).
In the Basic Controls and Setup menu,
select function line “Start zero calibration
procedure!”, press Enter.
To change to “Calibration Deviations”
menu (Figure 3-19, page 3-13), press
More… (F5).
The Confirmation Required screen
(Figure 3-4, page 3-4) is displayed, press
Rosemount Analytical Inc. A Division of Emerson Process Management Operation 3-15
Page 60

Instruction Manual
y
748446-D
April 2002
Model CAT200
d. Setup Basic Calibration Parameters
The basic setup parameters for calibration
can be changed from the “Basic Controls
and Setup” menu. These parameters are:
Check calibration deviation:
Enables and disables the stability and tolerance check during calibration. Press
Enter on the line and use the ← or →
keys to toggle the value.
Range number:
Select the desired range number from 1
to 4 for viewing or setting the span gas
and range upper limit. Or define another
range.
Span Gas:
Set the span gas value of the calibration
gas. Values outside the linearity limit of
the analyzer will not be accepted.
Range upper limit:
Set the range upper limit. Values outside
the linearity limit of the analyzer will not
be accepted.
From the single channel display press
BasicCal (F5) to display the “Basic Controls and Setup” menu.
From the single channel display press
BasicCal (F5) to display the “Basic Controls and Setup” menu.
NOTE
Before starting gas flow, make sure
that gas is available.
Press Valves… (F5) to change to the “Set
Gas Valves” menu.
MLT/CH1/R1 37.50 ppm
-- Set Gas Valves --
Flow zero gas!
Flow span gas!
Flow sample gas!
Flow test gas!
Close all valves!
Valve position:
Operation status:
Measure
Status…
Channel Back…
Samplegas
Read
Figure 3-20. Set Gas Valves Menu
Go to the desired function line by using
the ↓ or ↑ key, when the desired line is
highlighted, press Enter (or →) to start
that function.
The Confirmation Required screen will be
displayed, either press Yes (F2) to start
the function, or Back… (F4) to cancel and
return to the Set Gas Valves menu.
Go to the desired parameter by using the
↓ or ↑ key, when the desired line is highlighted, press Enter (or →) to select.
Once Yes (F2) is selected the function will
initiate. Once the function is completed,
the SUCCESS screen will momentarily be
displayed. The display will automatically
Use the ← or → keys to toggle through
the value.
Press the Enter ↵ key to accept new val-
return to the previous menu (Set Gas
Valves).
The functions from this menu are:
ues or return to previous parameters with
the Status… (F2) key.
Start the flow of span gas, sample gas or
test gas. Close all valves.
e. Open and Close Valves
F3 – Change to another available channel
The following procedure shows how to
to execute gas flow.
manually turn on valves to start gas flowing for zero, span, sample and test gas.
F4 – Go back to “Basic Controls and
Setup” menu to start zeroing or spanning.
F1 – Return to single component display.
3-16 Operation Rosemount Analytical Inc. A Division of Emerson Process Management
Page 61

Model CAT200
y
p
p
y
p
Instruction Manual
748446-D
April 2002
3-5 ANALYZER & I/O, EXPERT CONTROL &
SETUP
Expert module configuration provides access
to set up parameters for the measurement
MLT/CH1/R1 37.50 ppm
Analyzer module controls…
II/O module controls…
Analyzer module setup…
II/O module setup…
Measure
ert Module Configuration --
-- Ex
Channel
Back…
and calibration on the CAT200 as well as the
configuration of the I/O modules. The applicable parts of these menus and configuration
parameters will depend on the included options of the CAT200. Figure 3-21 below shows
the submenus.
MLT/CH1/R1 37.50 ppm
Calibration procedure status…
Start zero calibration procedure!
Start span cal ibration pro cedure!
Check calibration deviation:
Range number:
Span gas:
Range upper limit:
O
eration status:
Measure
MLT/CH1/R1 37.50 ppm
Analyzer module controls…
II/O module controls…
Analyzer module setup…
II/O module setup…
Measure
MLT/CH1/R1 37.50 ppm
-- Analyzer Module Setup and Controls (1/3) --
Calibration parameters…
Alarm parameters…
Range parameters…
Cross interference compensation…
Linearization…
Programmable logic control (PLC)…
Programmable calculator…
Measurement display configuration…
Acknowledgement of status reports…
Concentration measurement parameters…
Measure
zer Module Controls --
-- Anal
Status…
Channel Valves…
-- I/O Module Controls--
Channel
Back…
Back…
Back…ChannelManData
Enabled
46.00 ppm
50.00 ppm
Read
More…
1
MLT/CH1/R1 37.50 ppm
Brightness: 70%
Contrast: 23%
Switch automatically to “Measure” after: 10 min.
Measure
-- I/O Module Setu
--
Back…
More…
Figure 3-21. Analyzer and I/O, Expert Controls & Setup Sub Menus
Rosemount Analytical Inc. A Division of Emerson Process Management Operation 3-17
Page 62

Instruction Manual
748446-D
April 2002
Model CAT200
The “Analyzer Module Setup and Controls”
menu and its various submenus can be accessed from the Main Menu as follows:
Main Menu
↓
Analyzer and I/O, expert controls &
setup…
Expert Module Configuration menu is displayed.
a. Analyzer Module Setup
From the Expert Module Configuration
menu, select:
Analyzer module setup…
Analyzer Module Setup and Controls (1/3)
menu is displayed.
MLT/CH1/R1 37. 50 ppm
-- Analyzer Module Setup and Controls (1/3) --
Calibration parameters…
Alarm parameters…
Range parameters…
Cross interference compensation…
Linearization…
Programmable logic control (PLC)…
Programmable calculator…
Measurement display configuration…
Acknowledgement of status reports…
Concentration measurement parameters…
Measure
ManData
Channel
Back…
More…
Figure 3-22. Analyzer Module Setup
and Controls (1/3) Menu (Screen 1 of 3)
Channel (F3):Change to other available
channels.
Back… (F4): Return to Expert Module
Configuration menu.
More… (F5): Change to screen 2 of
Analyzer Module Setup and Controls
menu.
Press More… (F5). Screen 2 is displayed.
MLT/CH1/R1 37.50 ppm
-- Analyzer Module Setup and Controls (2/3) --
Peak measurement…
Differential measurement…
Gas flow setup…
Pressure compensation…
Flow measurement…
Temperature measurement…
Loading/saving configuration parameters…
Inputs and outputs…
Delay and average…
Special functions…
Measure
Back…Channel
More…
Figure 3-23.Analyzer Module Setup
and Controls (2/3) Menu (Screen 2 of 3)
Press More… (F5). Screen 3 is displayed.
MLT/CH1/R1 37.50 ppm
-- Analyzer Module Setup and Controls (3/3) --
AK protocol communication…
Function Keys:
Measure (F1):Change to the single com-
ponent display of the current channel.
Measure
Figure 3-24.Analyzer Module Setup
and Controls (3/3) Menu (Screen 3 of 3)
Back…
ManData (F2): Load factory settings.
3-18 Operation Rosemount Analytical Inc. A Division of Emerson Process Management
Page 63

Model CAT200
b. Load Factory Configuration
This function deletes the user defined
RAM configuration parameters and loads
the factory default settings for the FlashEPROM configuration parameters the
analyzer.
NOTE
Instruction Manual
748446-D
April 2002
c. Calibration Parameters
Several submenus are available under
the menu “Calibration Parameters” to allow setting of the zero and span gas calibration parameters and the start the
different calibration methods.
To access the Calibration Parameters
menu:
This function is irreversible after
starting and confirmation. The user defined parameters will be deleted and
cannot be recovered!
To access Load factory configuration…
function:
Main Menu
↓
Analyzer and I/O, expert controls &
setup…
↓
Analyzer module setup…
↓
ManData… (F2)
Load Factory Configuration menu is displayed.
MLT/CH1/R1 37. 50 ppm
Measure
-- Load Factory Configuration --
BE CAREFUL with this function –
-
Replace current configuration with factory settings!
Back…
Figure 3-25. Load Factory
Configuration
To load factory configuration settings,
press Enter or → key. Press Back… (F4)
to cancel and return to previous menu.
If the Confirmation Required screen
(Figure 3-4, page 3-4) is displayed, press
Yes (F2) to continue function, Back… to
return to Analyzer Module Setup and
Controls menu.
Main Menu
↓
Analyzer and I/O, expert controls &
setup…
↓
Analyzer module setup…
↓
Calibration parameters…
MLT/CH1/R1 37.50 ppm
Span gases…
Tolerances…
Calibration procedure setup…
Time controlled calibration…
Calibration…
Advanced calibration methods…
Zero gases…
Range and calibration control: Manual:
Measure
-- Calibration Parameters --
Back…Channel
Figure 3-26. Calibration Parameters
Menu
The variable parameter “Range and calibration control:” is for the auto-ranging of
the current channel. This can also be
setup from the “Range parameters” menu
where additional description of the function can be found. See Section 3-8, page
3-30.
Function Keys:
Measure (F1): Change to the single component display of the current channel.
Channel (F3): Change to other available
channels.
Back… (F4): Return to the previous
menu.
Rosemount Analytical Inc. A Division of Emerson Process Management Operation 3-19
Page 64

Instruction Manual
748446-D
April 2002
Model CAT200
d. Span Gas Parameter
This menu is used to set the default value
for each range of the current channel, that
actual span gas concentration and the
desired span gas unit. The concentration
of each range should be in the range of
70% to 110% of the maximum range
value.
Main Menu
↓
Analyzer and I/O, expert controls &
setup…
↓
Analyzer module setup…
↓
Calibration parameters…
↓
Calibration procedure setup…
MLT/CH1/R1 37.50 ppm
Actual span gas concentration:
Spangas range-1:
Spangas range-2:
Spangas range-3:
Spangas range-4:
Span gas unit:
“ppm” → “mg/Nm3” converson factor:
Concentration in span gas units:
Measure
-- Span Gas Definition --
Back…
Figure 3-27. Span Gas Definition Menu
250.0 ppm
50.0 ppm
250.0 ppm
2500 ppm
10000 ppm
ppm
1.250
37.50 ppm
e. Calibration Tolerances
This menu is used to set the tolerances
for the stability calibration and maximum
calibration deviation for the current channel. These checks can also be disabled.
Main Menu
↓
Analyzer and I/O, expert controls &
setup…
↓
Analyzer module setup…
↓
Calibration parameters…
↓
Tolerances…
The Tolerances menu is displayed.
MLT/CH1/R1 37.50 ppm
Max. zero calibration deviation:
Max. span calibration deviation:
Check calibration deviation:
Stability tolerance – range 1:
Stability tolerance – range 2:
Stability tolerance – range 3:
Stability tolerance – range 4:
Last zero calibration:
Last span calibration:
Measure
-- Tolerances --
Channel
Back…
Figure 3-28. Tolerances Menu
Press F3 to change to the parameters of
the other channels.
30.00 %
20.00 %
Disabled
10.00 %
10.00 %
10.00 %
10.00 %
Success
Success
Max. zero(span) calibration deviation:
NOTE:
The “ppm” -> “mg/Nm3” conversion
factor can be setup in the Concentration Measurement Parameters menu.
See Section 3-15, page 3-50.
The deviation between two zero or span
gas concentrations will be determined
during the stability time of the calibration
procedure (See Section 3-5f, page 3-22).
The deviation tolerance is expressed as
the percent of the current range. Calibration will only be possible within this tolerance.
If a small deviation tolerance is chosen,
the calculated value may be out of range
during the entire calibration time and the
calibration will time out. If a large deviation tolerance is chosen, the calibration
may lack stability. The value is usually set
to 10% or 20%. The default values are
3-20 Operation Rosemount Analytical Inc. A Division of Emerson Process Management
Page 65

Model CAT200
Instruction Manual
748446-D
April 2002
30% for zero calibration and 20% for span
calibration.
Stability tolerance:
These values define the stability control
during the calibration procedure in fullscale percent. If the deviation is outside
this tolerance during the first stability time
is complete, a second stability process
will start automatically. This will be repeated as long as the reading is outside
the tolerance limit up until the maximum
procedure time. The default value is 10%.
Check calibration deviation:
When Enabled, the stability and tolerance
checking during the calibration procedure
will be based on the values of the tolerances.
When disabled, the calibration is performed without any stability and tolerance
checking and any calibration will be accepted.
Example:
End of range: 1000 ppm
Max. calibration deviation:20%
(equivalent to 200 ppm)
Desired value: 990 ppm
Display: 720 ppm
Deviation: 250 ppm (more than 200
ppm!)
Result: max. calibration process will
time out and calibration will be canceled.
Possible solutions:
Double the max. calibration deviation settings or disable the “Check deviation” parameter in which case any calibration will
be accepted.
Rosemount Analytical Inc. A Division of Emerson Process Management Operation 3-21
Page 66

Instruction Manual
748446-D
April 2002
f. Calibration Procedure Setup
Model CAT200
This menu is used to set up the parameters for the calibration process of the zeroing and spanning of the current
channel. Press the Channel… (F3) key to
set the other channels.
Main Menu
↓
Analyzer and I/O, expert controls &
setup…
↓
Analyzer module setup…
↓
Calibration parameters…
↓
Calibration procedure setup…
MLT/CH1/R1 37.50 ppm
Purge time:
Procedure times-out after:
Analog output during calibration:
Span ranges:
Valve position:
Stability time:
Averaging time:
Measure
-- Calibration Procedure Setup --
Channel
Back…
10 s
120 s
Tracking
Together
Samplegas
30 s
5 s
Press Back… (F4) to cancel and return to
last value entered.
The measurement should be stable before zeroing and spanning. Therefore, the
analyzer cell should be purged with
enough zero or span gas before calibration readings begin. Then after the purge
time, the stability time begins. During the
stability time the average over two signals
will be calculated. The averaging time
determines the time difference between
these two signals.
If the deviation of the two values is less
than the allowed maximum calibration deviation (See Section 3-5e, page 3-20) the
calibration will begin. If not, the stability
control starts again until a stable measurement is attained unless the time out
value is reach wherein the process stops
without attaining a calibration.
Figure 3-30 below, illustrates the process
of the stability controlled zero and span
gas calibration.
Figure 3-29. Calibration Procedure
Setup Menu
Averaging
Ti
Concentration
Start Zero
Calibration
Purge Stability Stability StabilityStability Time
Time Time Time Time Time
Figure 3-30. Zero/Span Calibration Stability Diagram
Start Span
Calibration
3-22 Operation Rosemount Analytical Inc. A Division of Emerson Process Management
Page 67

Model CAT200
g
Instruction Manual
748446-D
April 2002
NOTE
The stability time and averaging time
are factory settings and cannot be
changed by the user. For other values,
consult with the factory.
Analog output during calibration:
This function allows the analog output and
the limits of the local SIO to be held during calibration.
Sample Gas Zeroing Spanning Sample Gas
Analog Output
Tracking
Analog Output
Holdin
Figure 3-31. Analog Output Chart
Tracking - The analog output follows the
calibration zero and span values during
the calibration process.
Holding - The analog output is held to the
last value before calibration starts and resumes at the sample gas value after calibration. This can be used when limits are
applied to the analog output that calibration would trip.
NOTE:
The chart above (Figure 3-31) only
shows the basic concept of the analog
output. During actual calibration the
purge time will also be relevant. Therefore, if the purge time for the sample
gas will run first, followed which the
holding function will be switched on.
Span ranges:
Together - All measurement ranges of
the same channel will be calibrated together. This is the usual calibration mode.
Separately - Each measurement range
will calibrate separately.
Valve position:
options
Samplegas
Zerogas
Purgegas
Testgas
Spangas-1
Spangas-2
Spangas-3
Spangas-4
Linearizer
Spangas
AllClosed
---Other-Proc.
Basic-Status
Rosemount Analytical Inc. A Division of Emerson Process Management Operation 3-23
Page 68

Instruction Manual
748446-D
April 2002
Model CAT200
g. Timed Controlled Calibration
This menu is used to set up the parameters for the starting time of the zero and
span calibration of the current channel.
Main Menu
↓
Analyzer and I/O, expert controls &
setup…
↓
Analyzer module setup…
↓
Calibration parameters…
↓
Time controlled calibration…
MLT/CH1/R1 37.50 ppm
Zero calibration – Day of week:
Hour:
-
Minute:
-
Span calibration: - Day of week:
Hour:
-
Minute:
-
Zero+Span calibration – Day of week:
Hour
-
Minute
-
Measure
-- Time Control --
Channel ShowList…
Back…
Figure 3-32. Time Control Menu
Press Channel (F3) to change to the
parameters of the other channels.
Never
Never
Never
Time controlled calibration is only possible if the span gas comes from the optional solenoid valves or an external
sample conditioning system. If these are
not provided, all time control “Day of
week” settings should be set to “Never.”
A zero gas calibration should be performed before starting a span gas calibration. Therefore, the starting time of the
zero gas calibration should be before the
starting time of the span gas calibration.
Selecting the “Zero+Span calibration” option will automatically run the zero before
the span.
Press ShowList… (F5) to see the “AutoStart procedures” menu.
MLT/CH1/R1 37.50 ppm
0
0
0
0
0
0
Position in auto-start list:
Erase current position from list!
Erase all positions from list!
Channel tag:
Procedure type:
Interval mode:
Start time:
Start date:
Measure
-- Auto-Start Procedures --
Back…
Never
1
-
-
-
-
Figure 3-33.Auto-Start Procedures
Menu
For day of week the options are:
Sunday
Monday
Tuesday
Wednesday
Thursday
Friday
Saturday
If time controlled calibration has been disabled (Never) in the previous “Time Control” menu, it is necessary to reset the
memory to avoid further calibrations. This
is accomplished by the function “Erase
current position from list !” which will reset
the memory for the selected position in
the “Position in auto-start list:” variable.
The three potions are:
Each day
Never
For hour the options are:
1 – 23
For minute the options are:
1 – 59
3-24 Operation Rosemount Analytical Inc. A Division of Emerson Process Management
Position 1: Zero calibration
Position 2: Span calibration
Position 3: Zero+Span calibration
Starting the “Erase all positions from the
list !” function will delete the time control
setups for all three type of calibrations.
The last five lines in the menu show the
parameters of the selected position line.
Page 69

Model CAT200
3-6 CALIBRATION PARAMETERS – MANUAL
CALIBRATION
This menu allows the manual starting of a
zero or span calibration for all measurement
ranges of the current channel.
Main Menu
↓
Analyzer and I/O, expert controls &
setup…
↓
Analyzer module setup…
↓
Calibration parameters…
↓
Calibration…
MLT/CH1/R1 37.50 ppm
Calibration procedure status…
Start zero calibration procedure!
Start span calibration procedure!
Check calibration deviation:
Range number:
Span gas:
Range upper limit:
Operational status:
Measure
Figure 3-34. Calibration Menu
Valves… (F5) will change to the “Set Gas
Valves” menu (Figure 3-20, page 3-16).
Establish the gas flow of the current channel
as desired.
Before starting a calibration make sure the
signal is stable.
The Analyzer Module Calibration menu and its
submenus are the same as that under Basic
Controls. The calibration and gas flow
-- Calibration --
Channel Valves…Status…
Back…
Enabled
100.00 ppm
100.00 ppm
Ready
Instruction Manual
748446-D
April 2002
procedures are the same as found in Sections
3-4b (page 3-14), 3-4c (page 3-15) and 3-4e
(page 3-16).
In order to calibrate or set up the other
channels, change to the channel with the
Channel (F3) key.
To start the zero or span calibration for all
channels simultaneously, access the
Advanced Calibration Methods menu in
Section 3-6a (page 3-26).
To span calibrate the measurement ranges
separately, in the Calibration Procedure Setup
menu (Figure 3-26, page 3-19) set the Span
ranges: variable line to Separately. Refer to
Section 3-5f, page 3-22.
The Status… (F2) key shows the “Analyzer
Channel Status” menu as described in detail
in Section 3-3a (page 3-8). From that menu
and its submenus can be found the status of
the current channel for:
1
Failures
Maintenance requests
Function controls
Alarms
Events
Hours of operation
And the operational settings of the current
channel:
Range settings
Response time (t
90
)
The results of the last calibrations are shown
in the Calibration Procedure Status menu
(Figure 3-18, page 3-13). This menu will
appear automatically after starting the zero or
span gas calibration. The status of the running
calibration will be shown and can be canceled
at any time while running by pressing the
Cancel… (F2) key. See Section 3-4a (page 3-
13) for the complete menu displays.
Rosemount Analytical Inc. A Division of Emerson Process Management Operation 3-25
Page 70

Instruction Manual
748446-D
April 2002
Model CAT200
a. Advanced Calibration Methods
This menu has the following functions:
•
Start a zero calibration of all measurement ranges for all channels simultaneously.
• Start a span calibration of all meas-
urement ranges for all channels simultaneously.
• Start the zero and span calibration to-
gether for the current channel.
•
Start the zero and span calibration together for all channels.
•
Start the basic calibration procedure
for the current channel. A zero and a
span calibration will start automatically. If the calibration is successful,
the calibration deviations will be reset
to zero.
Main Menu
↓
Analyzer and I/O, expert controls &
setup…
↓
Analyzer module setup…
↓
Calibration parameters…
↓
Advanced calibration methods…
MLT/CH1/R1 37 .50 ppm
Start zero calibration procedure for all channels!
Start span calibration procedure for all channels!
Start zero+span calibration procedure!
Start zero+span calibration procedure for all channels!
Start basic calibration procedure!
Cancel all running procedures!
Info…
Measure
-- Advanced Calibration Methods --
Status…
Back…
In order to start the zero and span calibration separately, or to calibrate each
channel separately, or to calibrate the
measurement ranges separately with
span gas, use the Analyzer Module Calibration menu (See Section 3-6, page 3-
25) or the Calibration Procedure Setup
menu (See Section 3-5f, page 3-22).
To cancel any running calibration procedure, select the Cancel all running procedures !” function line.
The Status… (F2) key shows the
Analyzer Channel Status menu as
described in detail in Section 3-3a, page
3-8. From that menu and its submenus
can be found that status of the current
channel for:
Failures
Maintenance requests
Function controls
Alarms
Events
Hours of operation
The operational settings of the current
channel:
Range settings
Response time (t
90
)
Select the Info… menu line. The State of
Calibration Procedures screen is displayed. This screen displays the calibration status of each channel.
Advanced calibration methods…
↓
Info…
MLT/CH1/R1 37 .50 ppm
-- State of Calibration Procedures --
Figure 3-35. Advanced Calibration
Menu
Before starting any calibration, make sure
Channel – 1:
Channel – 2:
Channel – 3:
Measure
Back…
Ready
Ready
Ready
that the signal is stable.
Figure 3-36. State of Calibration
Procedures Screen
3-26 Operation Rosemount Analytical Inc. A Division of Emerson Process Management
Page 71

Model CAT200
b. Zero Gas Parameters
The Zero Gas Definition menu is used to
set up the zero gas concentration for all
ranges of the current channel. The concentration units (ppm, ppb, %, etc.) are
determined by the setup of the current
channel. See Section 3-15, page 3-50.
Analyzer and I/O, expert controls &
Analyzer module setup…
Calibration parameters…
Zero gases…
Instruction Manual
748446-D
April 2002
Main Menu
↓
setup…
↓
↓
↓
MLT/CH1/R1 37.50 ppm
Zero gas concentration (all ranges):
Measure
-- Zero Gas Definition --
0.00 ppm
Back…
Figure 3-37. Zero Gas Definition Menu
Rosemount Analytical Inc. A Division of Emerson Process Management Operation 3-27
Page 72

Instruction Manual
p
748446-D
April 2002
Model CAT200
3-7 ALARM PARAMETERS
This menu and its submenus controls the settings for the alarms for various parameters of
each channel. If the selected parameter signal
exceeds the alarm limit, a corresponding
alarm message is displayed. For concentration this will be flag icons at the alarm values
on the bargraph in the single component display.
Main Menu
↓
Analyzer and I/O, expert controls &
setup…
↓
Analyzer module setup…
↓
Alarm parameters…
MLT/CH1/R1 37.50 ppm
Alarm delay:
Concentration…
Concentration average…
Flow…
Pressure…
Temperature…
Calculator – 1…
Calculator – 2…
Calculator – 3…
Calculator – 4…
Measure
-- Alarm Setu
Status…
--
Back…
0.2 s
ClrAla!
Failures
Maintenance requests
Function controls
Alarms
Events
Hours of operation
And the operational settings of the current
channel:
Range settings
Response time (t
90
)
Some alarm setup items may not be available
if not installed in the analyzer. For instance, if
no flow sensor is installed, a corresponding
message will appear when attempting to select it.
Figure 3-38. Alarm Setup Menu
The Back… (F4) key will return to the last
value.
The ClrAla! (F5) key is to clear an active
alarm. This should be done only after the signal has returned to the allowed range to reset
the alarm for new events.
Alarm delay:
The alarm delay establishes the delay time
after an out of tolerance condition occurs before the alarm is set. The range is 0.0 to 30.0
seconds.
The Status… (F2) key will change the display
to the Analyzer Channel Status menu as
described in detail in Section 3-3a (page 3-8).
From that menu and its submenus can be
found that status of the current channel for:
3-28 Operation Rosemount Analytical Inc. A Division of Emerson Process Management
Page 73

Model CAT200
p
Instruction Manual
748446-D
April 2002
a. Alarm Setup and Control
The following is an example of setting the
alarm parameters using Concentration.
The other functions are set in the same
way.
From the Alarm Setup menu (Figure 3-38,
page 3-28) select the desired function and
the display changes to the following:
MLT/CH1/R1 37.50 ppm
Alarm gene ration is:
Level for Low-Low alarm:
Level for Low alarm:
Level for high alarm:
Level for High-High alarm:
Low-Low alarm:
Low alarm:
High alarm:
High-High alarm:
Measure
-- Concentration Alarm Setu
Channel
--
Back…
-10.000 ppm
0.000 ppm
100.000 ppm
1000.000 ppm
Figure 3-39. Concentration Alarm Setup
Menu
Use the Channel (F3) key to change to
the setup menu of the other channels.
Off
Off
Off
Off
Off
generation is: line. Otherwise, an alarm
may trigger while the parameter is being
changed.
Adjust the four available alarm levels as
desired. The units and possible range of
values depends on the parameter chosen.
Negative values can be entered by selecting the number with the Enter ↵ or →
key and then pressing F4 (±) to change
the sign.
Select one of the following to activate the
alarm for the parameter limits selected:
On: In this mode the alarm will activate
only as long as the signal exceeds the
established level. The alarm will deactivate as soon as the signal is back within
the allowed values.
On (Hold Alarm): In this mode the alarm
will activate when the signal exceeds the
established level and will remain activated
even when the signal is back within the
allowed values. To reset the alarm, use
the F5 key on the “Alarms Setup” menu to
clear the alarm.
Before beginning the alarm parameter
setup, turn off the alarms at the Alarm
Rosemount Analytical Inc. A Division of Emerson Process Management Operation 3-29
Page 74

Instruction Manual
g
g
g
748446-D
April 2002
Model CAT200
3-8 RANGE PARAMETERS
This menu and its submenus allow setup of
the range parameters for the current channel.
Press the Channel (F3) key to change to another channel.
Main Menu
↓
Analyzer and I/O, expert controls &
setup…
↓
Analyzer module setup…
↓
Range parameters…
MLT/CH1/R1 37 .50 ppm
Begin / end of ranges…
Response times (t90)…
Autoranging control…
Actual range number:
Range and calibration control:
Actual begin of range:
Actual end of range:
Measure
-- Ran
e Parameters --
Channel
Back…
Figure 3-40. Range Parameters Menu
Confirm the new variable with the Enter ↵ key
or cancel and return to the last value with the
F2 key.
Actual range number:
This variable allows selecting of the actual
range number of the current channel from 1 to
4. The range number will be set automatically
if the auto-ranging or the program I/o is enabled. The range number will be controlled by
digital inputs if the input I/o module is enabled.
Range and calibration control:
This parameter is used for auto-ranging of the
current channel. The following options are
available:
Manual – The range number must be
changed manually. The “Switch level hysteresis” is disabled. See Section 3-8c, page 3-31.
Self/Automatic – Auto-ranging is performed
by comparing the current measurement value
with the maximum range. In this case, the
value of “Switch level hysteresis” is enabled
(See Section 3-8c, page 3-31).
Manual
0.00 ppm
100.00 ppm
NOTE
If the auto-range mode is selected, the t
90
times of the corresponding channel must
be set to the same value (See Section 3-8b,
page 3-31). In addition, all offset values of
the channel must be set to zero.
Program I/O Module – In this case, the auto-
rangeing is controlled by the programmable
I/O board (I/O with three alarms). The value of
“Switch level hysteresis” is enabled (See Section 3-8c, page 3-31).
Inputs I/O module – In this case, the autoranging is controlled by the digital input (DIO).
The value of “Switch level hysteresis” is enabled (See Section 3-8c, page 3-31).
a. Offset and Span of Range
1
This menu is used to setup the offset and
span of each range for the current channel. Press the Channel (F3) key to
change to another channel.
Main Menu
↓
Analyzer and I/O, expert controls &
setup…
↓
Analyzer module setup…
↓
Range parameters…
↓
Begin / end of ranges…
MLT/CH1/R1 37 .50 ppm
Range – 1 begin:
Range – 1 end:
Range – 2 begin:
Range – 2 end:
Range – 3 begin:
Range – 3 end:
Range – 4 begin:
Ran
e – 4 end:
Measure
-- Be
in / End of Ranges --
Channel
Back…
0.00 ppm
50.00 ppm
0.00 ppm
250.00 ppm
0.00 ppm
2500.00 ppm
0.00 ppm
10000.00 ppm
Figure 3-41. Begin / End of Ranges
Menu
Allowed minimum and maximum range values
can be established between the fullscale concentration of range 1 and the fullscale concentration of range 4. See absolute range
upper and lower limit in the Auto-ranging
Control menu in Section 3-8c, page 3-31.
3-30 Operation Rosemount Analytical Inc. A Division of Emerson Process Management
Page 75

Model CAT200
p
ging
,
Instruction Manual
748446-D
April 2002
b. Response times (t90)
This menu is used to setup the response
90
time (t
-time) of each range for the current channel. Press the Channel (F3) key
to change to another channel. The response time is defined as the time necessary to sample the test gas until the
analyzer displays 90% of the concentration after a change in concentration.
Main Menu
↓
Analyzer and I/O, expert controls &
setup…
↓
Analyzer module setup…
↓
Range parameters…
↓
Response times (t90)…
MLT/CH1/R1 37.50 ppm
Range – 1:
Range – 2:
Range – 3:
Range – 4:
Actual range number:
t90 time:
Measure
-- Res
onse Times --
Channel
Back…
Figure 3-42.Response Times Menu
2.00 s
2.00 s
2.00 s
2.00 s
2.00 s
For normal operation, the response time
should not be less than 2 s.
For calibrations, the value should be 2 s.
The response times established here do
not constitute the response time of the
analyzer as a whole.
If auto-ranging is used (See Section 3-8c,
page 3-31), the response times must be
the same for each channel.
c. Auto-ranging Control
This menu is used to setup the autoranging parameters for the current channel. Press the Back… (F3) key to change
to another channel. If auto-ranging is enabled (See Section 3-8, page 3-30), the
best range for the current concentration
will be selected automatically.
Main Menu
↓
Analyzer and I/O, expert controls &
setup…
↓
1
Analyzer module setup…
↓
Range parameters…
↓
Auto-ranging control…
Select any digit with the ← or → key and
adjust the value with the ↑ or ↓ keys. Or,
adjust the entire value with the ↑ or ↓
keys.
MLT/CH1/R1 37.50 ppm
View actual switch levels:
Switch level hysteresis:
Usage of range – 1:
Usage of range – 2:
Usage of range – 3:
Usage of range – 4:
-- Autoran
Control --
10 %
Enabled
Enabled
Enabled
Enabled
Confirm the new variable with the Enter ↵
Back…
1000000 ppm
0.00 ppm
key or cancel and return to the last value
with the Back… (F3) key.
NOTES
The range of values is between 0.03
and 28 seconds for each range of a
channel.
The minimum increment of response time
is 0.3 seconds.
Absolute, range upper limit:
Absolute
range lower limit:
Measure
Channel
Figure 3-43.Auto-ranging Control Menu
Select the variable with the Enter ↵ or →
keys.
Select any digit with the ← or → key and
adjust the value with the ↑ or ↓ keys. Or,
adjust the entire value with the ↑ or ↓
keys.
Rosemount Analytical Inc. A Division of Emerson Process Management Operation 3-31
Page 76

Instruction Manual
748446-D
April 2002
Model CAT200
Confirm the new variable with the Enter ↵
key or cancel and return to the last value
with the Back… (F4) key.
NOTES
“Range and calibration control” must
be enabled in order for auto-ranging to
function. See Section 3-8, page 3-30.
The beginning of the range must be zero
for all four ranges of the current channel.
See Section 3-8a, page 3-30.
All four response times of the current
channel must have the same value. See
Section 3-8b, page 3-31.
The span gas concentration must be in
the correct range. See Section 3-5d, page
3-20.
Each of the ranges can be enables or
disabled and range 4 does not have to be
the biggest range.
Absolute, range lower limit: Normally
this value should be zero except for differential measurements. See Section 317, page 3-52.
Absolute, range upper limit: This is set
to 120% of the largest maximum range
value at initial operation. This is the
maximum value that will be accepted for
end of range.
Switch level hysteresis:
This value determines the hysteresis between the ranges for auto-ranging. This is
the difference between the concentration
values that the range switches when the
value is increasing and the point where
the range switches when the value is decreasing. Hysteresis prevents the rapid
toggling of the range when the concentration value is near a range switch point.
Selection of the value will depend upon
the expected rate of change in concentration values versus the need to keep
readings within a specified percentage of
the range limit.
The value applies to all three switch
points for the four ranges. The hysteresis
is calculated as a percentage of the current end of range value.
Figure 3-44 below is an example for a
hysteresis value of 10% and end of range
values of 500, 1000, 1500, and 2000 ppm
respectively:
1350
900
Range
123 4
0 500 1000 1500 2000
450
Concentration ppm
Figure 3-44. Hysteresis Between Ranges Graph
3-32 Operation Rosemount Analytical Inc. A Division of Emerson Process Management
Page 77

Model CAT200
g
To view the actual switch levels, choose
the View actual switch levels… submenu
which displays a screen similar to the following:
Analyzer and I/O, expert controls &
Analyzer module setup…
Range parameters…
Auto-ranging control…
Actual switch levels…
Instruction Manual
748446-D
April 2002
Main Menu
↓
setup…
↓
↓
↓
↓
MLT/CH1/R1 37.50 ppm
Range – 1 up:
Range – 1 down:
Range – 2 up:
Range – 2 down:
Range – 3 up:
Range – 3 down:
Range – 4 up:
Ran
e – 4 down:
Measure
-- Actual Switch Levels --
Channel
Back…
500 ppm
1000 ppm
450 ppm
1500 ppm
900 ppm
1350 ppm
Figure 3-45.Actual Switch Levels
Screen
--
--
Rosemount Analytical Inc. A Division of Emerson Process Management Operation 3-33
Page 78

Instruction Manual
p
748446-D
April 2002
Model CAT200
3-9 CROSS INTERFERENCE COMPENSATION
This function performs the calculation of the
influence of other components on the result of
the analyzed component. Each channel can
have a maximum of three interference components. Press the Channel (F3) key to switch
to another channel and calculate the cross
interference compensation of those channels.
Cross compensation must be performed with
pure gases or gases in an inert atmosphere
4
(CH
or N2). Do not use mixed gases.
All channels for which interference compensation is being calculated must be calibrated.
Main Menu
↓
Analyzer and I/O, expert controls &
setup…
↓
Analyzer module setup…
↓
Cross interference compensation…
MLT/CH1/R1 37 .50 ppm
Compensation is:
Selected interference component:
Cross interference source channel…
Interference factors…
Calculate factor for selected interference component!
Remove selected component!
1. Interference component:
2. Interference component:
3. Interference component:
Measure
-- Cross Interference Com
Channel
ensation --
Back…
Disabled
…….
…….
…….
Figure 3-46.Cross Interference
Compensation Menu
Calculation of cross interference compensation:
1. Select Disabled in the Compensation is:
variable line. Otherwise the result will be
influenced by previous values.
2. In the line Selected interference component: variable line, select the desired
number of the current interference component.
3. Select the Choose interference source
channel… submenu line to change to the
Channels screen as shown in Figure 3-47
below:
Main Menu
↓
Analyzer and I/O, expert controls &
setup…
↓
Analyzer module setup…
↓
Cross interference compensation…
↓
Choose interference source channel…
MLT/CH1/R1 37 .50 ppm
1
Measure
-- Channels --
Back…
MLT13/CH1
MLT13/CH2
MLT13/CH3
Figure 3-47.Channels Display
4. Select the desired interference source
Select any digit with the ← or → key and adjust the value with the ↑ or ↓ keys. Or, adjust
the entire value with the ↑ or ↓ keys.
Confirm the new variable with the Enter ↵ key
or cancel and return to the last value with the
Back… (F4) key.
channel with the ↑ or ↓ keys and then
choose it with the ↵ or → key. The display
will return to the “Cross Interference
Compensation” menu. The tag of the interference component will appear in one
of the last three lines of the menu. Its position will depend on the selected interference component number selected .
5. Repeat the last three steps as necessary
to select all interference components
(maximum 3).
3-34 Operation Rosemount Analytical Inc. A Division of Emerson Process Management
Page 79

Model CAT200
6. Begin the flow of the interference component into the sample gas channel and wait
for a stable reading.
7. Start the function “Calculate factor for selected interference component !” to automatically calculate the interference
component factor.
8. To see the result or to manually enter interference component factors, choose the
submenu “Interference factors…”:
Main Menu
↓
Analyzer and I/O, expert controls &
setup…
↓
Analyzer module setup…
↓
Cross interference compensation…
↓
Interference factors…
Instruction Manual
748446-D
April 2002
MLT/CH1/R1 37 .50 ppm
1. Interference component factors:
2. Interference component factors:
3. Interference component factors:
Measure
-- Interference Factors --
Back…
1.000
1.000
1.000
Figure 3-48.Interference Factors Menu
9. Select “Enabled” in the line “Compensation is” to begin using the cross compensation factors calculated or entered.
Remove selected component !
Use this function to delete the cross interference factor of the selected interference component.
Rosemount Analytical Inc. A Division of Emerson Process Management Operation 3-35
Page 80

Instruction Manual
748446-D
April 2002
Model CAT200
3-10 LINEARIZATION
The optical absorption of a gas as a function
of concentration is not linear over the entire
range. Therefore, the range of the analyzer
must be linearized. This can be done manually or semi-automatically. This section deals
with manual linearization. For semi-automatic
linearization, contact the factory.
Before starting linearization, it is necessary to
calibrate the highest range of the channel
(usually range 4) with zero and span gas.
Linearizing a channel requires the recording
of a raw values & setpoint values table. It is
necessary to have a minimum of six raw values (zero, span and four intermediate values)
and their corresponding setpoint values. To
improve the precision of linearization it is recommended to take ten to fifteen (maximum
30) values.
Main Menu
↓
Analyzer and I/O, expert controls &
setup…
↓
Analyzer module setup…
↓
Linearization…
MLT/CH1/R1 37 .50 ppm
Linearization method:
View/modify linearization curve table…
Lineaizer operator:
Start calculation of coefficients!
Calculation of coefficients:
Linearization status:
Lower linearization limit is:
Upper Linearization limit is:
Measure
-- Multiple Spline Linearization –
(Unused x/y pairs must be set to 0.0)
Channel
Back…
Figure 3-49. Multiple Spline Linearization
Menu
a. Disable Linearization
Before recording linearization values it is
necessary to disable the current linearization to avoid the influence of the old values on the new curve. Change to the
“Linearizer operation” function with the ↑
or ↓ key. Press the ↵ or → key and select
“Disabled” wit h the ↑ or ↓ key. Confirm
the selection with the ↵.
Splines
Disabled
No Coeffs!
In Range
-0 %
2 %
b. Zero And Span Calibration
Calibrate the highest range (usually range
4) with zero and span gas. This process is
described in Sections 3-4b (page 3-14)
and 3-4c (page 3-15), or 3-6 (page 3-25).
Recording the raw values & setpoint values table
Once a defined gas flow is established,
read each raw value in any menu display
at the top right or in the single component
display. Record the values in a table such
as the following for a typical NO channel:
# Setpoint Value Raw Value
1 0.000 0.000
2 217.455 266.291
3 319.620 387.709
4 428.610 517.464
5 536.760 645.199
6 636.510 757.313
7 955.395 1113.910
8 2105.560 2263.390
9 3163.860 3163.860
Inputting The Table Values To The Menus
Main Menu
↓
Analyzer and I/O, expert controls &
setup…
↓
Analyzer module setup…
↓
Linearization…
↓
View/modify linearization curve table…
↓
Linearization raw values (setpoint
values)…
MLT/CH1/R1 37 .50 ppm
X1:
X2:
X3:
X4:
X5:
X6:
X7:
X8:
X9:
X10:
Measure
-- Linearization Raw Values (1/3) –
ChannelY1…10
Back…
0.000 ppm
266.291 ppm
387.709 ppm
517.464 ppm
645.199 ppm
757.313 ppm
1113.910 ppm
2263.390 ppm
3163.860 ppm
0.000 ppm
More…
Figure 3-50.Linearization Raw Values Menu
3-36 Operation Rosemount Analytical Inc. A Division of Emerson Process Management
Page 81

Model CAT200
Instruction Manual
748446-D
April 2002
Select the first number with the ↵ or →
key.
Select any digit with the ← or → key and
adjust the new value with the ↑ or ↓ keys.
Change to the next line with the ↓ key.
Repeat the steps until all the raw values
are input.
If there are more than 10 values, press
the More… (F5) key to access the additional menus. All unused values must
have 0.000.
Change to the setpoints menu with the
X1…10 (F2) key and enter the setpoint
values in the same way.
NOTE
Each raw value “X” must match its
corresponding setpoint value “Y” or
the calculation of linearization will be
incorrect.
“Multiple spline linearization” or “4
polynomial linearization.”
If “Splines” is selected change to the
“Start calculation of coefficients” and start
the calculation with the ↵ key.
th
If “4
order polynomial” has been selected
the menu will appear slightly different with
the title “4
th
-Order Polynomial Linearization.” Using the line “Linearizer operation..” change to the submenu and enable
linearization of the four measurement
ranges separately. Change to the menu
“Calculation of coefficients…” and start
the calculation with the Do it! (F4) key.
d. Enable Linearization
In the “Multiple Spline Linearization”
menu, change to the “Linearizer operation” line and press the ↵ or → key to select “Enabled.” Confirm the selection with
the ↵ key.
e. Linearization Verification
th
order
c. Calculate Linearization Curve
Once all the raw values and setpoint values have been entered, the display will
return to the Multiple Spline Linearization
menu (Figure 3-49, page 3-36).
In the function line “Linearization method”
press the ↵ or → key to select between
Repeat the measurements with the same
setpoints values used for the linearization
curve. The fullscale deviation should be
better than 1% fullscale. For automotive
applications the deviation should be better
than 1% relative to the setpoint values in
the range between 10% and 100% of fullscale.
Rosemount Analytical Inc. A Division of Emerson Process Management Operation 3-37
Page 82

Instruction Manual
g
748446-D
April 2002
Model CAT200
3-11 PROGRAMMABLE LOGIC CONTROL (PLC)
This menu allows the enabling or disabling or
the logic control of the CAT200 analyzer, or of
the digital outputs using a corresponding program. As an example, it is possible to configure so that some calibration results are sent to
a certain analyzer output. The “Programming…” submenu is used to configure a PLC
program while the “Results…” submenu is
used to control the output status.
Main Menu
↓
Analyzer and I/O, expert controls &
setup…
↓
Analyzer module setup…
↓
Programmable logic control (PLC)…
MLT/CH1/R1 37.50 ppm
Programming…
Results…
PLC is:
Measure
-- Pro
rammable Logic Control --
Disabled
Back…
any auxiliary modules, any control module
or external undefined input signals.
a. Disable PLC
The PLC function must be disables before
starting to program to avoid program execution while writing it.
b. Input the program
Press the Enter ↵ key or → key in the
“Programming…” line to change to the
submenu for entering the program steps.
See Section 3-11e, page 3-43.
A program is composed of single commands (i.e. selecting a gas value), which
have to be connected logically (i.e. OrOperator). Each program line must contain a certain code for each operator and
each command (operand).
Every operator must be set in the line
before the commands that are to be combined. If an intermediate result is not used
directly in the process, the result buffer
must be deleted (Clear), in order to avoid
errors in a following logical operation.
Each program must end with the operator
“-7” (END of the program).
Figure 3-51. Programmable Logic
c. Enable PLC
Control Menu
Select “Enabled” in the “PLC is:” line to
start the program.
Select “Enabled” or “Disabled” in the “PLC is:”
line with the ↑ or ↓ keys.
Confirm the new variable with the Enter ↵ key
or cancel and return to the last value with the
Back… (F4) key.
d. Checking the results
Press the Enter ↵ key or → key in the
“Results…” line to change to the “PLC
Outputs” submenu, where the output
status can be controlled.
NOTE:
The PLC is only able to function with the
CAT200 analyzer. It cannot function with
3-38 Operation Rosemount Analytical Inc. A Division of Emerson Process Management
Page 83

Model CAT200
Signal ID Signal
1RAM-Fail
2ROM-Fail
3 Seconds; LOW/HIGH change all 1000 ms
4 Any sample gas valve selected (Channel 1…5)
5 Any zero gas valve selected (Channel 1…5)
6 Any span gas valve selected (Channel 1…5)
7 NAMUR-status: Failure (Channel 1…5)
8 NAMUR-status: Maintenance Request (Channel 1…5)
9 NAMUR-status: Failure (Channel 1…5)
10 – 19 Reserved
Instruction Manual
748446-D
April 2002
Operator Operator Description
-1 NOP No operation (= blank line)
-2 OR operand to IR
-3 AND operand to IR
-4 INVERT the IR (intermediate result)
-5 STORE the IR to RB (result buffer)
-6 CLEAR set IR to LOW/OFF/FALSE
-7 END of the program
Table 3-1. Available Operators
General Signals
Table 3-2. Available Commands (Signal Codes 1 – 19): General Signals
Programmable Calculator
Signal ID Signal
20 Execution status
21 Result 1 / Limit 1
22 Result 1 / Limit 2
23 Result 1 / Limit 3
24 Result 1 / Limit 4
25 Result 2 / Limit 1
26 Result 2 / Limit 2
27 Result 2 / Limit 3
28 Result 2 / Limit 4
29 Result 3 / Limit 1
30 Result 3 / Limit 2
31 Result 3 / Limit 3
32 Result 3 / Limit 4
33 Result 4 / Limit 1
34 Result 4 / Limit 2
35 Result 4 / Limit 3
36 Result 4 / Limit 4
37 – 39 Reserved
Table 3-3. Available Commands (Signal Codes 20 – 39): Programmable Calculator
Rosemount Analytical Inc. A Division of Emerson Process Management Operation 3-39
Page 84

Instruction Manual
748446-D
April 2002
Model CAT200
Programmable Logic Controls
Signal ID Signal
40 Output Result buffer #1
41 Output Result buffer #2
42 Output Result buffer #3
43 Output Result buffer #4
44 Output Result buffer #5
45 Output Result buffer #6
46 Output Result buffer #7
47 Output Result buffer #8
48 Output Result buffer #9
49 Output Result buffer #10
50 Output Result buffer #11
51 Output Result buffer #12
52 Output Result buffer #13
53 Output Result buffer #14
54 Output Result buffer #15
55 Output Result buffer #16
56 Output Result buffer #17
57 Output Result buffer #18
58 Output Result buffer #19
59 Output Result buffer #20
60 Execution status
61 - 69 Reserved
Table 3-4. Available Commands (Signal Codes 40 – 69): Programmable Logic Controls
SIO I/O Module
Signal ID Signal
70 Output #1 < 0V
71 Output #1 > 10V
72 Output #2 < 0V
73 Output #2 > 10V
74 Output #3 < 0V
75 Output #3 > 10V
76 Output #4 < 0V
77 Output #4 > 10V
78 Output #5 < 0V
79 Output #5 > 10V
80 Output #6 < 0V
81 Output #6 > 10V
82 Output #7 < 0V
83 Output #7 > 10V
84 Output #8 < 0V
85 Output #8 > 10V
86 Relay #1
87 Relay #2
88 Relay #3
89 Reserved
Table 3-5. Available Commands (Signal Codes 70 – 89): SIO I/O Module
3-40 Operation Rosemount Analytical Inc. A Division of Emerson Process Management
Page 85

Model CAT200
Table 3-6. Available Commands (Signal Codes 90 – 109): DIO I/O Module
Instruction Manual
748446-D
April 2002
DIO I/O Module
Signal ID Signal
90 Input #1
91 Input #2
92 Input #3
93 Input #4
94 Input #5
95 Input #6
96 Input #7
97 Input #8
98 Output 1..8 fail
99 Output 9..16 fail
100 Output 17..24 fail
101 General fail
102 – 109 Reserved
Rosemount Analytical Inc. A Division of Emerson Process Management Operation 3-41
Page 86

Instruction Manual
)
)
)
748446-D
April 2002
Ch 1Ch 2Ch 3Ch 4Ch 5
110 160 210 260 310 Raw signal failure
111 161 211 261 311 Sample gas valve
112 162 212 262 312 Zero gas valve
113 163 213 263 313 Test gas valve
114 164 214 264 314 Span gas valve - range 1
115 165 215 265 315 Span gas valve - range 2
116 166 216 266 316 Span gas valve - range 3
117 167 217 267 317 Span gas valve - range 4
118 168 218 268 318 Any of the span gas valves
119 169 219 269 319 Lin1 gas valve
120 170 220 270 320 Lin2 gas valve
121 171 221 271 321 Purge gas valve
122 172 222 272 322 Linearization Underflow
123 173 223 273 323 Linearization Overflow
124 174 224 274 324 Zero calibration in progress
125 175 225 275 325 Span calibration in progress
126 176 226 276 326 Range Underflow
127 177 227 277 327 Range Overflow
128 178 228 278 328 Range #1
129 179 229 279 329 Range #2
130 180 230 280 330 Range #3
131 181 231 281 331 Range #4
132 182 232 282 332 Failure (Namur
133 183 233 283 333 Maintenance request (Namur
134 184 234 284 334 Function Control (Namur
135 185 235 285 335 Concentration / Limit #1
136 186 236 286 336 Concentration / Limit #2
137 187 237 287 337 Concentration / Limit #3
138 188 238 288 338 Concentration / Limit #4
139 189 239 289 339 Conc. Average / Limit #1
140 190 240 290 340 Conc. Average / Limit #2
141 191 241 291 341 Conc. Average / Limit #3
142 192 242 292 342 Conc. Average / Limit #4
143 193 243 293 343 Temperature / Limit #1
144 194 244 294 344 Temperature / Limit #2
145 195 245 295 345 Temperature / Limit #3
146 196 246 296 346 Temperature / Limit #4
147 197 247 297 347 Pressure / Limit #1
148 198 248 298 348 Pressure / Limit #2
149 199 249 299 349 Pressure / Limit #3
150 200 250 300 350 Pressure / Limit #4
151 201 251 301 351 Flow / Limit #1
152 202 252 302 352 Flow / Limit #2
153 203 253 303 353 Flow / Limit #3
154 204 254 304 354 Flow / Limit #4
155 205 255 305 355 External signal #1
156 206 256 306 356 External signal #2
157 207 257 307 357 External signal #3
158 208 258 308 358 External signal #4
159 209 259 309 359 External signal #5
Signal ID
Model CAT200
Measurement - Channels
Signal
Table 3-7. Measurement Channels
3-42 Operation Rosemount Analytical Inc. A Division of Emerson Process Management
Page 87

Model CAT200
Instruction Manual
748446-D
April 2002
e. Example for PLC Programming
In this example there is a three channel
2
CO/SO
and O2. It is
2
analyzer measuring CO, SO
Sample
Channel CO SO
Zero gas O
Span gas CO/SO
Table 3-8. Zero And Span Gas For Each Gas Component
2
Valve – PLC Output 1 CO/SO2 Valve – PLC Output 2
O
Zero Cal. Chan 1 Span Cal. Chan 1
Zero Cal. Chan 2 Span Cal. Chan 2
Span Cal. Chan 3 Zero Cal. Chan 3
desired to write a program for the zero
and span gas calibration when the valve
setup for the calibration bottles is as follows:
CO/SO2
2
O
2
2
2
2
O
CO/SO
2
2
O
CO/SO
2
O
2
/O
2
Table 3-9. Valve/Gas Sequencing
Step Code Function/Parameter
1 -2 OR (Combination of the next three operands)
2 112 Zero gas calibration of channel 1
3 162 Zero gas calibration of channel 2
4 218 Span gas calibration of channel 3
5 -5 STORE (Saving the intermediate result to the result buffer)
6 40 Output result buffer 1
7 -6 CLEAR (Deleting the intermediate result of the calculator)
8 -2 OR (Combination of the next three operands)
9 118 Span gas calibration of channel 1
10 168 Span gas calibration of channel 2
11 212 Zero gas calibration of channel 3
12 -5 STORE (Saving the intermediate result to the result buffer)
13 41 Output result buffer 2
14 -6 CLEAR (Deleting the intermediate result of the calculator)
15 -7 END (End of program)
Table 3-10. Program Steps
Rosemount Analytical Inc. A Division of Emerson Process Management Operation 3-43
Page 88

Instruction Manual
p
g
p (
748446-D
April 2002
Model CAT200
f. Placing the codes into the Program
menu
In the Programmable Logic Control menu,
select Programming… The Program
menu is displayed.
MLT/CH1/R1 37.50 ppm
Program offset (o):
Step (o+1):
Step (o+2):
Step (o+3):
Step (o+4):
Step (o+5):
Step (o+6):
Step (o+7):
Step (o+8):
Step (o+9):
Ste
o+10):
Measure
-- Pro
ram --
Back…
More…
Figure 3-52. PLC Program Menu
Select the program steps with the ↑ or ↓
keys.
Select the field for the code number with
the ↵ or → key.
Select any digit with the ← or → key and
adjust the code number with the ↑ or ↓
keys. If necessary, change the sign (+/-)
with the Back… (F4) key.
112
162
218
118
168
g. PLC Output
In the Programmable Logic Control menu,
select Results… The PCL Outputs menu
is displayed.
As show in Figure 3-53 below, the PLCOutput 1 is “On” which means for the example described: The calibration gas is
o
-2
-5
40
-6
-2
still running for channel 1 or 2 zero gas or
channel 3 span gas.
MLT/CH1/R1 37.50 ppm
PLC Output 1:
PLC Output 2:
PLC Output 3:
PLC Output 4:
PLC Output 5:
PLC Output 6:
PLC Output 7:
PLC Output 8:
PLC Output 9:
PLC Output 10:
Measure
-- PLC Out
uts --
Back…
More…
On
Off
Off
Off
Off
Off
Off
Off
Off
Off
Figure 3-53. PLC Outputs Menu
NOTE:
A further submenu can be reached
with the More… (F5) key that will show
the results of the PLC outputs 11 to 20.
Confirm the code with the ↵ key or cancel
and go back to the last value with the F2
key.
If there are more than 10 steps, press the
F5 key to access the additional menus. All
unused steps must have a code of 0.
The maximum number of program steps
is 100 and the maximum number of results is 20.
When the programming is complete, start
the program by selecting “Enabled” in the
“PLC is:” line of the “Programmable Logic
Control” menu.
To control the output status of the PLC,
select the “Results…” submenu from the
“Programmable Logic Control” menu. This
will display the “PLC Outputs” menus as
shown in Figure 3-53.
3-44 Operation Rosemount Analytical Inc. A Division of Emerson Process Management
Page 89

Model CAT200
g
Instruction Manual
748446-D
April 2002
3-12 PROGRAMMABLE CALCULATOR
This menu allows the calculation of up to four
values using variables of the CAT200 analyzer, i.e. conversion of concentrations from
ppm to mg/m
3
. There are four memory locations to calculate results. The calculation program and other conditions have to be
established using the various submenus.
Main Menu
↓
Analyzer and I/O, expert controls & setup…
↓
Analyzer module setup…
↓
Programmable Calculator…
MLT/CH1/R1 37.50 ppm
Programming…
Constraints…
Units…
Calculator is:
Scaling…
Result calculator 1:
Result calculator 2:
Result calculator 3:
Result calculator 4:
Measure
-- Pro
rammable Calculator --
Back…
Disabled
0.012 Vol%
123.000 ppm
Figure 3-54. Programmable Calculator Menu
Select “Enabled” or “Disabled” in the function
line Calculator is:
Operator types Operator Description
-1 ADD Add Operand to IR (intermediate result)
-2 SUB Subtract Operand from IR
-3 DIV Divide IR by operand
-4 MUL Multiply IR with operand
-5 ADDC c Add Constant to IR
-6 SUBC c Subtract constant from IR
-7 DIVC c Divide IR by constant
-8 MULC c Multiply IR with constant
-9 ADDM m Add Memory to IR
-10 SUBM m Subtract Memory from IR
-11 DIVM m Divide IR by memory
-12 MULM m Multiply IR with memory
-13 STOM m Store IR at memory and set IR = 0.0
-14 STOR r Store IR to result and set IR=0.0
-15 NOP No operation
-16 ABS Convert IR into absolute value
-17 EOP End of program
Confirm the new variable with the Enter ↵ key
or cancel and return to the last value with the
Back… (F4) key.
NOTE
The Calculator is only able to function with
the CAT200 analyzer. It cannot function
with any auxiliary modules, any control
module or external undefined input signals.
a. Programming the Calculator
Disable the Calculator:
The Calculator function must be disables
before starting to program to avoid program execution while writing it.
Input the program:
Press the Enter ↵ key or → key in the
“Programming…” line to change to the
submenu for entering the program steps.
See Section 3-12b, page 3-47.
--
--
A program for calculation consists of operands like concentration or flow, and operators like the addition command. Each
program line must contain a certain code
for each operator and each command
(operand). Table 3-11 (below), and Table
3-12 (page 3-46) list the operands and
operators that can be used.
Table 3-11. Programmable Calculator Operator Types
Rosemount Analytical Inc. A Division of Emerson Process Management Operation 3-45
Page 90

Instruction Manual
748446-D
April 2002
Operand Types Operand Description
Model CAT200
1 Calculator Result #1
2 Calculator Result #2
3 Calculator Result #3
4 Calculator Result #4
5 Concentration Channel 1 (PPM!)
6 Concentration average Channel 1 (PPM!)
7 Temperature Channel 1
8 Pressure Channel 1
9 Flow Channel 1
10 Concentration Channel 2 (PPM!)
11 Concentration average Channel 2 (PPM!)
12 Temperature Channel 2
13 Pressure Channel 2
14 Flow Channel 2
15 Concentration Channel 3 (PPM!)
16 Concentration average Channel 3 (PPM!)
17 Temperature Channel 3
18 Pressure Channel 3
19 Flow Channel 3
20 Concentration Channel 4 (PPM!)
21 Concentration average Channel 4 (PPM!)
22 Temperature Channel 4
23 Pressure Channel 4
24 Flow Channel 4
25 Concentration Channel 5 (PPM!)
26 Concentration average Channel 5 (PPM!)
27 Temperature Channel 5
28 Pressure Channel 5
29 Flow Channel 5
Table 3-12. Programmable Calculator Operand Types
Every operator must be set in the line
above the corresponding variable. After
each calculating step the intermediate result must be stored and the memory must
be deleted before continuing to the next
step. Each program must end with the
“End of program” command.
Inputting The Constants:
Press the ↵ or → keys in the “Constants…” line of the “Programmable Calculator” menu to change to the submenu
for defining a maximum of four constants.
3-46 Operation Rosemount Analytical Inc. A Division of Emerson Process Management
Determination of the units:
Press the ↵ or → keys in the “Units…” line
of the “Programmable Calculator” menu to
change to the “Calculator Result Units”
submenu to set the display units of the
calculator’s result in the single component
display. Note: This value can be changed
while the program is running.
Scaling:
Press the ↵ or → keys in the “Scaling…”
line of the “Programmable Calculator”
menu to change to the submenu for establishing the minimum and maximum
value for each of the four results. This is
necessary for displaying the calculator’s
result in the single component display.
Page 91

Model CAT200
g
p (
Instruction Manual
748446-D
April 2002
The minimum and maximum values are
the limits of the bargraphs.
Starting the program:
Check the results:
The results of each calculation will be displayed in the last four lines of the “Pro-
grammable Calculator” menu.
Select “Enabled” in the “Calculator is:” line
to start the program.
(NO + NO
2
) X 2.05 mg/ml = NOx as mg/m3 of NO
2
Step Code Function/Parameter
1-1A
DD TO INTERMEDIATE RESULT (AT THE BEGINNING THE MEMORY IS ZERO
2 5 NO-Concentration from channel 1 (ppm)
3 -1 Add to IR (the concentration of channel 1)
410NO
2
-Concentration from channel 2 (ppm)
5 -13 Store the result of the addition to memory and set IR = 0
6 1 Memory #1
7 -9 Add memory to IR (= sum of NO and NO2 in ppm)
8 1 Memory #1
9 -8 Multiply IR with constant ([ppm NO + ppm NO2] X “conversion constant”)
10 1 Constant #1 ( = “conversion constant” ppm to mg/m3, here: 2.05 mg/ml)
11 -14 Store IR to result and set IR = 0
12 1 Constant #1 (= mg/m3 NO2)
14 -17 End of program
Table 3-13. Programmable Calculator Program Steps
)
b. Example for Calculation Programming
In this example it is desired to calculate
2
the concentration of NOx as NO
3
from the concentrations of NO in
mg/m
ppm (Channel 1) and NO
2
in
in ppm (Channel 2). It is necessary to add the single
concentrations and then to multiply by a
constant as follows:
Placing the codes into the “Program”
menu:
Programmable Calculator…
↓
Programming…
MLT/CH1/R1 37 .50 ppm
Program offset (o):
Step (o+1):
Step (o+2):
Step (o+3):
Step (o+4):
Step (o+5):
Step (o+6):
Step (o+7):
Step (o+8):
Step (o+9):
Ste
o+10):
Measure
-- Pro
ram --
Back…
112
162
218
118
168
More…
o
-2
-5
40
-6
-2
Figure 3-55. Programmable Calculator – Program
Menu
Select the program steps.
Select the field for the code number.
Select any digit with the ← or → key and
adjust the code number with the ↑ or ↓
keys. If necessary, change the +/- sign
with the Back… (F4) key.
Confirm the code with the ↵ key or cancel
and go back to the last value with the F2
key.
If there are more than 10 steps, press the
F5 key to access the additional menus. All
unused steps must have a code of 0.
The maximum number of program steps
is 100 and the maximum number of results is 20.
When the programming is complete, start
the program by selecting “Enabled” in the
“Calculator is:” line of the “Programmable
Logic Control” menu. The results will appear in the last four lines of that menu.
Rosemount Analytical Inc. A Division of Emerson Process Management Operation 3-47
Page 92

Instruction Manual
play
748446-D
April 2002
Model CAT200
3-13 MEASUREMENT DISPLAY CONFIGURATION
This menu is be used to:
•
Establish the parameters for the single
component display for the current channel
of the analyzer. Press the Channel (F3)
key to establish the conditions of the other
channels.
•
Establish the display of confirmation
menus for all channels of the analyzer.
•
Define the tags of the analyzer and the
tags of each range for the current channel.
NOTE
When changing an identification tag it is
necessary to change the configuration of
the programmable digital inputs and analog outputs because the parameters of the
module source will change so the relations
will disappear!
Main Menu
↓
Analyzer and I/O, expert controls & setup…
↓
Measurement display configuration…
MLT/CH1/R1 37 .50 ppm
-- Measurement Dis
Displayed concentration digits:
Digits after decimal point:
Display confirmation menus:
Signal on mini-bargraph – 1:
Signal on mini-bargraph – 2:
Signal on mini-bargraph – 3:
Signal on mini-bargraph – 4:
Measure
Configuration (1/3) --
Channel
Yes
Temperature
Maintenance-Requests
Any_Alarms
Operation
Back…
Tags…
4
2
Figure 3-56. Measurement Display Configuration
Menu (Screen 1 of 3)
Displayed concentration digits:
Adjusts the number of digits for the concentration limits with the values of 3, 4, 5, or 6.
Digits after decimal point:
Sets the precision of the decimal display with
the values of 0, 1, 2, or 3.
Display confirmation menus:
Yes: Displays the question “Do you really
want to do this?” after each function start to
provide an option to cancel an action before it
is executed.
No: No confirmation question will be asked to
start any function. Caution: Each function
will start immediately!
Signal on mini-bargraph – 1 (2, 3, 4):
These lines establish which of the following
parameters will appear in the last four lines of
the single component display for the current
channel.
Temperature (measurement value with bargraph)
•
Pressure (message: yes/no)
•
Flow (measurement value with bargraph)
•
Calculator-1 (2, 3, 4) (result of a calculator’s program. See Section 3-12, page 3-
45) Failures (message: yes/no)
•
Maintenance-Requests (message:
yes/no)
•
Function-Control (message: yes/no)
•
Range ID (measurement range with bargraph)
•
Operation (status message: ready, warmup, etc.)
•
Any_Alarms (message: yes/no)
•
Span-Conc. (span gas concentration
value with bargraph)
•
Gasflow (zerogas, spangas, samplegas)
•
Concentration (measurement value with
bargraph)
•
Average (measurement value with bargraph)
•
Minimum (measurement value with bargraph)
•
Maximum (measurement value with bargraph)
3-48 Operation Rosemount Analytical Inc. A Division of Emerson Process Management
Page 93

Model CAT200
play
play
Instruction Manual
748446-D
April 2002
NOTE
Each bargraph will display the low limit
(beginning value) and the high limit (end
value) of the corresponding parameter.
Analyzer and Channel Tags…
Press the Tags… (F5) key to change to the
second screen of the “Measurement Display
Configuration” menu to change the identification tag of the analyzer and the tag of each
range for the current channel. The tags appear at the top left of each menu page. Press
the Channel (F3) key to change the tags of
the other channels.
NOTE
When changing an identification tag it is
necessary to change the configuration of
the programmable digital inputs and analog outputs because the parameters of the
module source will change so the relations
will disappear!
Measurement Display Configuration (1/3)
↓
Tags… (F5)
↓
MLT/CH1/R1 37.50 ppm
-- Measurement Dis
Module identification tag:
Tag for range 1:
Tag for range 2:
Tag for range 3:
Tag for range 4:
Configuration (2/3) --
MLT/CH1
MLT/CH1/R1
MLT/CH1/R2
MLT/CH1/R3
MLT/CH1/R4
The maximum number of digits for each tag is
30. A full range of optional characters is available.
NOTES
The changes to the identification tags will
take effect upon changing to the single
component display.
The changes to the range tags will take effect upon changing the range for the first
time.
Pressing and holding the ↑ or ↓ key will
accelerate the scrolling to make changes
faster.
Application for Basic Controls Menu:
Press the More… (F5) key to change to the
third screen of the “Measurement Display
Configuration” menu to change the authorization for changing settings in the “Basic Controls & Setup” menu.
Measurement Display Configuration (1/3)
↓
Tags… (F5)
↓
More… (F5)
MLT/CH1/R1 37.50 ppm
-- Measurement Dis
Application for basic controls menu: All allowed
Configuration (3/3) --
Measure
Channel
Back…
Figure 3-57. Measurement Display Configuration
Menu (Screen 2 of 3)
More…
Measure
Back…
Figure 3-58. Measurement Display Configuration
Menu (Screen 3 of 3)
Settings Standard CEMS All allowed Calibration only
Start zero calibration: + + + +
Start span (gas) calibration: + + + +
(Current) range upper limit: +
Span gas (value): + + +
Range number: + +
Check calibration deviation: enabled/disabled
++
+ means the change of the function is allowed.
Table 3-14.Application for Basic Controls Menu Allowable Function Variables
Rosemount Analytical Inc. A Division of Emerson Process Management Operation 3-49
Page 94

Instruction Manual
g
p
748446-D
April 2002
Model CAT200
3-14 ACKNOWLEDGEMENT OF STATUS RE-
PORTS
This menu is used to:
•
Clear all events of the analyzer.
•
Acknowledge and clear failure, maintenance requests, and function controls.
•
Allow the acknowledgement and clearing
of functions in the “status details” menu.
See Section 3-3c, page 3-10.
•
Set operating hours to zero.
•
Establish hours for maintenance requests.
Main Menu
↓
Analyzer and I/O, expert controls & setup…
↓
Analyzer module setup…
↓
Acknowledgement of status reports…
MLT/CH1/R1 37 .50 ppm
Measure
-- Acknowled
Clear events!
Acknowledge and clear failures!
Acknowledge and clear maintenance requests!
Acknowledge and clear function controls!
Acknowledge allowed in status menu:
Set hours of operation to 0!
Hours of operation for maintenance requests:
Hours of operation:
Status…
ement of Status Reports --
Back…
Yes
30000
164
Figure 3-59. Acknowledgement of Status Reports
Menu
Analyzer channel status:
Press the Status… (F2) key to access this
menu and its submenus to find the status report of the current channel for Failures, Main-
tenance Requests, Function Controls, Alarms,
and Events. Also for the operational settings
of the current channel such as Range Settings
and Response Time (t
90
-time). See Section 3-
3a, page 3-8.
3-15 CONCENTRATION MEASUREMENT PA-
RAMETERS
This menu is used to setup the following parameters for the current channel of the analyzer:
•
Sample gas units: ppb, ppm, %, µg/Nm3,
3
g/Nm
, %LEL, %UEL
•
Ppm to mg/Nm3 conversion factor in the
range of 1 to 100000. The conversion
factor depends on the sample gas used.
•
The lower explosion limit (LEL) and the
upper explosion limit (UEL) in the range of
0 to 100%.
•
The measurement output during failure;
Actual, 0.0 V, End of Range.
Main Menu
↓
Analyzer and I/O, expert controls & setup…
↓
Analyzer module setup…
↓
Concentration measurement parameters…
MLT/CH1/R1 37 .50 ppm
Hours of operation for maintenance requests:
Establishes how many hours the analyzer
may operate until maintenance will be re-
-- General Concentration Measurement Setu
Sample gas unit:
3
“ppm” → “mg/Nm
Lower explosion limit (LEL):
Upper explosion limit (UEL):
Measurement output during failure:
” conversion factor:
--
ppm
1.250
10.00 %
20.00 %
Actual
quired. The range is 1 to 30000 and the default value is 30000.
Measure
Back…
Hours of operation:
Total hours of operation of the analyzer since
first startup of the analyzer or since the last
Figure 3-60. General Concentration
Measurement Parameters Setup Menu
reset of the hours of operation.
3-50 Operation Rosemount Analytical Inc. A Division of Emerson Process Management
Page 95

Model CAT200
Instruction Manual
748446-D
April 2002
3-16 CONCENTRATION PEAK MEASUREMENT
This menu is used to set the parameters for
and to capture the extreme values of a channel. Press the Channel (F3) key to set the parameters for the other channels.
Main Menu
↓
Analyzer and I/O, expert controls & setup…
↓
Analyzer module setup…
↓
More… (F5)
↓
Peak measurement…
MLT/CH1/R1 37.50 ppm
Reset minimum!
Reset maximum!
Reset both!
Minimum detection:
Maximum detection:
Difference (Max-Min):
Last minimum:
Last maximum:
Measure
-- Concentration Peak Measurment --
Channel
Back…
Always
Always
2.500
93.400
95.900
Figure 3-61. Concentration Peak Measurement
Menu
Reset Minimum !
Reset Maximum !
Reset Both !
These functions will reset the last minimum or
maximum value of concentration to the current reading. This would be used to begin a
new determination of minimum or maximum
within the current readings for each.
Minimum Detection:
Maximum Detection:
Always: The minimum and maximum detection is running automatically.
External: The minimum and maximum detection depends on an external instruction from
the digital input.
Off: The minimum and maximum detection is
not operational.
Difference (Max-Min), Maximum, Minimum:
These lines display the actual or last difference of and the extreme values for the current
channel. These values can be sent to the
analog outputs.
The minimum and maximum values can be
displayed in on of the last four lines of the single component display using the “Measurement Display Configuration menu. See
Section 3-13, page 3-48.
Rosemount Analytical Inc. A Division of Emerson Process Management Operation 3-51
Page 96

Instruction Manual
748446-D
April 2002
Model CAT200
3-17 DIFFERENTIAL MEASUREMENT
This function allows the measurement of the
difference between the current concentration
and a reference concentration. Thus the
measurement is not an absolute referenced to
zero but instead compared to a reference
value. This may be useful for concentrations
that only differ slightly from a basic value. The
reference value can be an actual value of another channel or a stored (fixed) value. To
establish differential measurement of other
channels, press the Channel (F3) key to
change the channel.
NOTE:
Before establishing differential measurement, it is necessary to calibrate with zero
gas and to linearize the measurement
channel and the reference channel. To
calibrate see Sections 3-4b (page 3-14) and
3-4d (page 3-16), or 3-5c (page 3-19). To
linearize see Section 3-10 (page 3-36).
Main Menu
↓
Analyzer and I/O, expert controls & setup…
↓
Analyzer module setup…
↓
More… (F5)
↓
Differential measurement…
MLT/CH1/R1 37.50 ppm
Function is:
Choose source channel…
Source concentration:
Store source concentration!
Source channel:
Measure
-- Differential Measurment --
Channel
Back…
Use actual value
Figure 3-62. Differential Measurement Menu
Disabled
-----
Select the reference channel:
Select the “Channels” submenu by selecting
the “Choose source channel…” line and
pressing the ↵ or → keys.
Select the tag of the desired reference channel with the ↑ or ↓ keys and then press the ↵
or → key. The display will return to the previous menu automatically and the selected reference channel will be displayed in the
“Source channel:” line.
Status determination of the reference
channel:
Select the “Source concentration:” line with
the ↑ or ↓ keys and press the ↵ or → key.
Adjust the parameter with the ↑ and ↓ keys
and confirm with the ↵ or → key.
Use actual value:
The reference value used to calculate the differential concentration is the current actual
value of the reference channel.
Use stored value:
The reference value used to calculate the differential concentration is fixed during the next
step.
Admit reference gas to the reference
channel:
It is necessary to admit a defined concentration of the measurement gas to the reference
channel to determine the reference value.
When the reference value is stable, change to
the “Store source concentration !” line with the
↑ or ↓ keys. Press the ↵ or → key to start the
measurement of the reference. If asked, confirm with the F2 (Yes) key or cancel and go
back to the menu with the F4 (Back…) or the
← key.
Admit measurement gas to the measurement channel:
Disable the function:
Apply the measurement gas to the measure-
In order to avoid interference of values while
the parameters are determined, select “Disabled” in the “Function is:” line.
3-52 Operation Rosemount Analytical Inc. A Division of Emerson Process Management
ment channel while the reference signal is
stable to measure the differential concentration.
Page 97

Model CAT200
p
Enable differential measurement:
Instruction Manual
748446-D
April 2002
Set the “Function is:” line to “Enabled”. The
differential concentration measurement will be
active.
3-18 GAS FLOW SETUP
This function establishes the method of gas
flow through the analyzer cell(s) as parallel or
serial and the valve position at “Basic-Status”
as Samplegas or All Closed.
NOTE:
The setting for gas flow must be set to the
actual combination of the analyzer cells.
This setup is established at the factory but
may be changed if the configuration of the
cells is changed after delivery. This function must be set correctly in order for the
time controlled calibration to operate
properly with the valves. See Section 3-5g,
page 3-24.
Main Menu
↓
Analyzer and I/O, expert controls & setup…
↓
Analyzer module setup…
↓
More… (F5)
↓
Gasflow setup…
MLT/CH1/R1 37.50 ppm
Gasflow through analyzer cells is:
Valve position at “Basic-Status”:
Valve position:
Operation status:
Measure
-- Gasflow Setu
Channel
--
Back…
Parallel
Samplegas
Samplegas
Ready
Figure 3-63. Gas Flow Setup Menu
Rosemount Analytical Inc. A Division of Emerson Process Management Operation 3-53
Page 98

Instruction Manual
p
748446-D
April 2002
Model CAT200
3-19 PRESSURE COMPENSATION
This function establishes the parameters of
pressure compensation (constant, sensor or
disabled) for the current channel. Press the
Channel (F3) key to set the pressure parameters for the other channels.
Main Menu
↓
Analyzer and I/O, expert controls & setup…
↓
Analyzer module setup…
↓
More… (F5)
↓
Pressure compensation…
MLT/CH1/R1 37.50 ppm
Compensation:
Manual pressure:
Unit:
Pressure measurement is:
Reference pressure:
Pressure:
Measure
-- Pressure Com
Channel
ensation --
Use manual pressure
Back…
1013.0 hPa
hPa
Valid
1013.0 hPa
1013.0 hPa
Compensation:
Use manual pressure: The pressure compensation of the current channel is based on
the value of the “Manual pressure:” line.
Use sensor value: The pressure compensation of the current channel is based on the
value measured by a pressure sensor. The
sensor value will be displayed in the “Reference pressure:” line. This selection is not
available if no sensor is installed. In that case,
the standard pressure of 1013.0n hPa (14.7
psig) shows in the “Reference pressure:” line.
Measure pressure: The pressure will be
measured and displayed in the “Pressure:”
line for the current channel but no compensation of the concentration will be performed.
This selection is not available if no sensor is
installed. In that case, the standard pressure
of 1013.0n hPa (14.7 psig) shows in the “Reference pressure:” line.
Disabled: No pressure compensation is performed.
Manual pressure:
Figure 3-64. Pressure Compensation Menu
When using the “Manual pressure” compensation method, input the actual atmospheric
pressure in the range of 500 to 1300hPa (7.3
to 18.9 psig).
Unit:
Used to set the units of measurement for
pressure as hPa or psig.
3-54 Operation Rosemount Analytical Inc. A Division of Emerson Process Management
Page 99

Model CAT200
p
Instruction Manual
748446-D
April 2002
3-20 FLOW MEASUREMENT
This function allows the setting of flow units
for the current channel and provides a display
of the actual flow of the channel.
Main Menu
↓
Analyzer and I/O, expert controls & setup…
↓
Analyzer module setup…
↓
More… (F5)
↓
Flow measurement…
MLT/CH1/R1 37 .50 ppm
Unit:
Flow measurement is:
Flow:
Measure
-- Flow Measurement --
Back…
Figure 3-65. Flow Measurement Menu
ml/min
Valid
23.0 ml/min
3-21 TEMPERATURE MEASUREMENT
This function allows the setting of temperature
units for the current channel and provides a
display of the actual temperature of the channel.
Main Menu
↓
Analyzer and I/O, expert controls & setup…
↓
Analyzer module setup…
↓
More… (F5)
↓
Temperature measurement…
MLT/CH1/R1 37 .50 ppm
Unit:
Temperature measurement is:
Temperature:
Measure
-- Tem
erature Measurement --
Back…
Valid
38.3 C
Figure 3-66. Temperature Measurement Menu
C
If no flowmeter is installed, a corresponding
message will be displayed in place of the
menu.
If no flowmeter is installed, a corresponding
message will be displayed in place of the
menu.
Rosemount Analytical Inc. A Division of Emerson Process Management Operation 3-55
Page 100

Instruction Manual
y
748446-D
April 2002
3-22 LOAD/SAVE ANALYZER MODULE CON-
FIGURATION
Model CAT200
Send configuration to serial interface !
This menu provides several functions to send
or load configuration data of the analyzer
through the serial interface. These functions
are only available if an SIO with serial interface is installed in the CAT200.
NOTE:
When loading configuration data all of the
current configuration in the memory will
be overwritten.
This function allows the setting of flow units
for the current channel and provides a display
of the actual flow of the channel.
Main Menu
↓
Analyzer and I/O, expert controls & setup…
↓
Analyzer module setup…
↓
More… (F5)
↓
Loading/saving configuration parameters…
The configuration data in memory will be sent
through the serial interface of the analyzer to
an external computer or other device.
Load configuration data from serial interface !
Configuration data will be loaded into memory
from an external computer or other device
through the serial interface of the analyzer.
The current configuration in memory will be
overwritten.
Reset analyzer module…
A submenu is displayed with one command
option: “Microprocessor RESET !” Select this
function to reset the analyzer to the initializing
mode and begin the start-up procedure.
Replace current configuration with factory
settings !
Deletes the configuration in memory and reestablishes the factory default setting from the
Flash-EPROM.
MLT/CH1/R1 37.50 ppm
-- Load/Save Anal
Send configuration to serial interface!
Load configuration from serial interface!
Reset analyzer module…
- BE CAREFUL with this function –
Replace current configuration with factory settings!
Measure
zer Module Configuration --
Back…
Figure 3-67. Load/Save Analyzer Module
Configuration Menu
3-56 Operation Rosemount Analytical Inc. A Division of Emerson Process Management
 Loading...