

Page 1
R&S®ZNA
Vector Network Analyzers
Getting Started
(;ÜÎÆ2)
1178645602
Version 21
Page 2

This document describes the following R&S® ZNA vector network analyzer models:
●
R&S® ZNA26, 10 MHz to 26.5 GHz, 2 test ports, 3.5 mm (m) connectors, order no. 1332.4500K22
●
R&S® ZNA26, 10 MHz to 26.5 GHz, 4 test ports, 3.5 mm (m) connectors, order no. 1332.4500K24
●
R&S® ZNA43, 10 MHz to 43.5 GHz, 2 test ports 2.92 mm, order no. 1332.4500K42
●
R&S® ZNA43, 10 MHz to 43.5 GHz, 4 test ports 2.92 mm, order no. 1332.4500K44
●
R&S® ZNA43, 10 MHz to 43.5 GHz, 2 test ports 2.4 mm, order no. 1332.4500K43
●
R&S® ZNA43, 10 MHz to 43.5 GHz, 4 test ports 2.4 mm, order no. 1332.4500K45
●
R&S® ZNA50, 10 MHz to 50 GHz, 2 test ports 2.4 mm, order no. 1332.4500K52
●
R&S® ZNA50, 10 MHz to 50 GHz, 4 test ports 2.4 mm, order no. 1332.4500K54
●
R&S® ZNA67, 10 MHz to 67 GHz, 2 test ports 1.85 mm, order no. 1332.4500K62
●
R&S® ZNA67, 10 MHz to 67 GHz, 4 test ports 1.85 mm, order no. 1332.4500K64
© 2022 Rohde & Schwarz GmbH & Co. KG
Muehldorfstr. 15, 81671 Muenchen, Germany
Phone: +49 89 41 29 - 0
Email: info@rohde-schwarz.com
Internet: www.rohde-schwarz.com
Subject to change – data without tolerance limits is not binding.
R&S® is a registered trademark of Rohde & Schwarz GmbH & Co. KG.
Trade names are trademarks of the owners.
1178.6456.02 | Version 21 | R&S®ZNA
Throughout this guide R&S® is abbreviated as R&S.
Page 3

R&S®ZNA
Contents
Contents
1 Safety and regulatory information........................................................7
1.1 Safety instructions........................................................................................................7
1.2 Warning messages in the documentation.................................................................. 9
1.3 Korea certification class A......................................................................................... 10
2 Documentation overview.....................................................................11
2.1 Getting started manual............................................................................................... 11
2.2 User manual and help................................................................................................. 11
2.3 Service manual............................................................................................................ 11
2.4 Instrument security procedures................................................................................ 12
2.5 Printed safety instructions.........................................................................................12
2.6 Data sheets and brochures........................................................................................ 12
2.7 Release notes and open source acknowledgment (OSA).......................................12
2.8 Application notes, application cards, white papers, etc......................................... 12
3 Preparing for use................................................................................. 13
3.1 Lifting and carrying.....................................................................................................13
3.2 Unpacking and checking............................................................................................13
3.3 Choosing the operating site.......................................................................................13
3.4 Setting up the product................................................................................................14
3.4.1 Placing the product on a bench top...............................................................................14
3.4.2 Mounting the product in a rack......................................................................................15
3.5 Considerations for test setup.................................................................................... 15
3.6 Connecting the analyzer to the AC supply............................................................... 16
3.7 Switching the instrument on and off.........................................................................17
3.8 Standby and ready state.............................................................................................18
3.9 Windows operating system........................................................................................18
3.10 Minimizing the VNA application.................................................................................20
3.11 Connecting external accessories..............................................................................21
3.11.1 Connecting a monitor.................................................................................................... 21
3.11.2 Connecting a keyboard................................................................................................. 21
3.11.3 Connecting a mouse..................................................................................................... 21
3.11.4 Connecting a printer......................................................................................................22
3Getting Started 1178.6456.02 ─ 21
Page 4

R&S®ZNA
Contents
3.11.5 Connecting a LAN cable............................................................................................... 22
3.11.6 Connecting a USB cable for remote control..................................................................23
4 Instrument tour.....................................................................................24
4.1 Front panel...................................................................................................................24
4.1.1 Touchscreen.................................................................................................................. 25
4.1.2 Status LEDs.................................................................................................................. 28
4.1.3 Standby key.................................................................................................................. 28
4.1.4 Front panel connectors................................................................................................. 29
4.2 Rear panel....................................................................................................................30
5 Operating the instrument.................................................................... 33
5.1 Manual operation........................................................................................................ 33
5.2 Control elements of the application window............................................................37
5.2.1 Title bar......................................................................................................................... 38
5.2.2 Toolbar.......................................................................................................................... 38
5.2.3 Softtools........................................................................................................................ 40
5.2.4 Menu bar....................................................................................................................... 40
5.2.5 Menu structure.............................................................................................................. 41
5.2.6 Hardkey panel............................................................................................................... 42
5.2.7 Status bar......................................................................................................................43
5.3 Touchscreen gestures................................................................................................ 43
5.4 Working with dialogs.................................................................................................. 45
5.5 Handling diagrams, traces, and markers..................................................................47
5.5.1 Adding new traces and diagrams..................................................................................47
5.5.2 Adding new markers..................................................................................................... 49
5.5.3 Deleting display elements............................................................................................. 50
5.5.4 Using drag and drop......................................................................................................50
5.6 Entering data............................................................................................................... 51
5.6.1 Dual-window mode vs. single-window mode................................................................ 51
5.6.2 Using the numeric editor............................................................................................... 52
5.6.3 Using the analyzer's on-screen keyboard..................................................................... 53
5.6.4
5.7.1 Using the graphical zoom..............................................................................................55
Using the Windows® on-screen keyboard.....................................................................54
5.7 Scaling diagrams........................................................................................................ 55
4Getting Started 1178.6456.02 ─ 21
Page 5

R&S®ZNA
Contents
5.7.2 Setting the sweep range............................................................................................... 57
5.7.3 Reference value and position........................................................................................58
5.7.4 Auto scale..................................................................................................................... 58
5.7.5 Circular diagrams.......................................................................................................... 59
5.7.6 Set by marker................................................................................................................59
5.7.7 Enlarging a diagram...................................................................................................... 60
6 Performing measurements..................................................................62
6.1 Transmission S-parameter measurement.................................................................62
6.1.1 Connecting the instrument for transmission measurements......................................... 62
6.1.2 Selecting the sweep range and other parameters........................................................ 63
6.1.3 Calibrating the instrument............................................................................................. 64
6.1.4 Evaluating data............................................................................................................. 67
6.1.5 Saving and printing data............................................................................................... 68
6.2 Reflection S-parameter measurement...................................................................... 69
7 Administrative tasks............................................................................71
7.1 Firmware installation.................................................................................................. 71
7.2 Remote operation in a LAN........................................................................................ 72
7.2.1 Assigning an IP address............................................................................................... 72
7.2.2 Using computer names................................................................................................. 74
7.2.3 Remote Desktop connection......................................................................................... 75
7.2.4
Windows® firewall settings............................................................................................ 75
8 Contacting customer support.............................................................77
Index......................................................................................................78
5Getting Started 1178.6456.02 ─ 21
Page 6

R&S®ZNA
Contents
6Getting Started 1178.6456.02 ─ 21
Page 7

R&S®ZNA
Safety and regulatory information
Safety instructions
1 Safety and regulatory information
The product documentation helps you use the product safely and efficiently. Follow the
instructions provided here and in the following chapters.
Intended use
The product is intended for the development, production and verification of electronic
components and devices in industrial, administrative, and laboratory environments.
Use the product only for its designated purpose. Observe the operating conditions and
performance limits stated in the data sheet.
Where do I find safety information?
Safety information is part of the product documentation. It warns you of potential dangers and gives instructions on how to prevent personal injury or damage caused by
dangerous situations. Safety information is provided as follows:
●
In Chapter 1.1, "Safety instructions", on page 7. The same information is provided in many languages as printed "Safety Instructions". The printed "Safety
Instructions" are delivered with the product.
●
Throughout the documentation, safety instructions are provided when you need to
take care during setup or operation.
1.1 Safety instructions
Products from the Rohde & Schwarz group of companies are manufactured according
to the highest technical standards. To use the products safely, follow the instructions
provided here and in the product documentation. Keep the product documentation
nearby and offer it to other users.
Use the product only for its intended use and within its performance limits. Intended
use and limits are described in the product documentation such as the data sheet,
manuals and the printed "Safety Instructions". If you are unsure about the appropriate
use, contact Rohde & Schwarz customer service.
Using the product requires specialists or specially trained personnel. These users also
need sound knowledge of at least one of the languages in which the user interfaces
and the product documentation are available.
Never open the casing of the product. Only service personnel authorized by
Rohde & Schwarz are allowed to repair the product. If any part of the product is damaged or broken, stop using the product. Contact Rohde & Schwarz customer service at
http://www.customersupport.rohde-schwarz.com.
Lifting and carrying the product
The product is heavy. Do not move or carry the product by yourself. A single person
can only carry a maximum of 18 kg safely depending on age, gender and physical condition. Look up the maximum weight in the data sheet. Use the product handles to
7Getting Started 1178.6456.02 ─ 21
Page 8

R&S®ZNA
Safety and regulatory information
Safety instructions
move or carry the product. Do not lift by the accessories mounted on the product.
Accessories are not designed to carry the weight of the product.
To move the product safely, you can use lifting or transporting equipment such as lift
trucks and forklifts. Follow the instructions provided by the equipment manufacturer.
Choosing the operating site
Only use the product indoors. The product casing is not waterproof. Water that enters
can electrically connect the casing with live parts, which can lead to electric shock,
serious personal injury or death if you touch the casing. If Rohde & Schwarz provides
accessories designed for your product, e.g. a carrying bag, you can use the product
outdoors.
Unless otherwise specified, you can operate the product up to an altitude of 2000 m
above sea level. The product is suitable for pollution degree 2 environments where
nonconductive contamination can occur. For more information on environmental conditions such as ambient temperature and humidity, see the data sheet.
Setting up the product
Always place the product on a stable, flat and level surface with the bottom of the product facing down. If the product is designed for different positions, secure the product so
that it cannot fall over.
If the product has foldable feet, always fold the feet completely in or out to ensure stability. The feet can collapse if they are not folded out completely or if the product is
moved without lifting it. The foldable feet are designed to carry the weight of the product, but not an extra load.
If stacking is possible, keep in mind that a stack of products can fall over and cause
injury.
If you mount products in a rack, ensure that the rack has sufficient load capacity and
stability. Observe the specifications of the rack manufacturer. Always install the products from the bottom shelf to the top shelf so that the rack stands securely. Secure the
product so that it cannot fall off the rack.
Connecting to power
The product is an overvoltage category II product. Connect the product to a fixed
installation used to supply energy-consuming equipment such as household appliances and similar loads. Keep in mind that electrically powered products have risks, such
as electric shock, fire, personal injury or even death. Replace parts that are relevant to
safety only by original parts, e.g. power cables or fuses.
Take the following measures for your safety:
●
Before switching on the product, ensure that the voltage and frequency indicated
on the product match the available power source. If the power adapter does not
adjust automatically, set the correct value and check the rating of the fuse.
●
Only use the power cable delivered with the product. It complies with country-specific safety requirements. Only insert the plug into an outlet with protective conductor terminal.
8Getting Started 1178.6456.02 ─ 21
Page 9

R&S®ZNA
Safety and regulatory information
Warning messages in the documentation
●
Only use intact cables and route them carefully so that they cannot be damaged.
Check the power cables regularly to ensure that they are undamaged. Also ensure
that nobody can trip over loose cables.
●
If you connect the product to an external power supply, use the one delivered with
the product or recommended in the product documentation. The external power
supply must conform to the country-specific regulations.
●
Only connect the product to a power source with a fuse protection of maximum
20 A.
●
Ensure that you can disconnect the product from the power source at any time.
Pull the power plug to disconnect the product. The power plug must be easily
accessible. If the product is integrated into a system that does not meet these
requirements, provide an easily accessible circuit breaker at the system level.
Cleaning the product
Use a dry, lint-free cloth to clean the product. When cleaning, keep in mind that the
casing is not waterproof. Do not use liquid cleaning agents.
Meaning of safety labels
Safety labels on the product warn against potential hazards.
Potential hazard
Read the product documentation to avoid personal injury or product damage.
Heavy product
Be careful when lifting, moving or carrying the product. Carrying the product requires a sufficient number of persons or transport equipment.
Electrical hazard
Indicates live parts. Risk of electric shock, fire, personal injury or even death.
Hot surface
Do not touch. Risk of skin burns. Risk of fire.
Protective conductor terminal
Connect this terminal to a grounded external conductor or to protective ground. This connection protects you against electric shock if an electric problem occurs.
1.2 Warning messages in the documentation
A warning message points out a risk or danger that you need to be aware of. The signal word indicates the severity of the safety hazard and how likely it will occur if you do
not follow the safety precautions.
WARNING
Potentially hazardous situation. Could result in death or serious injury if not avoided.
9Getting Started 1178.6456.02 ─ 21
Page 10

R&S®ZNA
Safety and regulatory information
Korea certification class A
NOTICE
Potential risks of damage. Could result in damage to the supported product or to other
property.
1.3 Korea certification class A
이 기기는 업무용(A급) 전자파 적합기기로서 판매자 또는 사용자는 이 점을 주의하시기
바라며, 가정외의 지역에서 사용하는 것을 목적으로 합니다.
10Getting Started 1178.6456.02 ─ 21
Page 11

R&S®ZNA
Documentation overview
Service manual
2 Documentation overview
This section provides an overview of the R&S ZNA user documentation. Unless specified otherwise, you find the documents at:
https://www.rohde-schwarz.com/manual/ZNA
2.1 Getting started manual
Introduces the R&S ZNA and describes how to set up and start working with the product. Includes basic operations, typical measurement examples, and general information, e.g. safety instructions, etc.
A printed version is delivered with the instrument. A PDF version is available for download on the Internet.
2.2 User manual and help
The user manual contains the description of all instrument modes and functions. It also
provides an introduction to remote control, a complete description of the remote control
commands with programming examples, and information on maintenance, instrument
interfaces and error messages. Includes the contents of the getting started manual.
The contents of the user manual are available as help in the R&S ZNA. The help offers
quick, context-sensitive access to the complete information for the instrument and its
firmware.
The user manual is also available for download or for immediate display on the Internet.
2.3 Service manual
Describes the performance test for checking the rated specifications, module replacement and repair, firmware update, troubleshooting and fault elimination, and contains
mechanical drawings and spare part lists.
The service manual is available for registered users on the global Rohde & Schwarz
information system (GLORIS):
https://gloris.rohde-schwarz.com
11Getting Started 1178.6456.02 ─ 21
Page 12

R&S®ZNA
Documentation overview
Application notes, application cards, white papers, etc.
2.4 Instrument security procedures
Deals with security issues when working with the R&S ZNA in secure areas. It is available for download on the Internet.
2.5 Printed safety instructions
Provides safety information in many languages. The printed document is delivered with
the product.
2.6 Data sheets and brochures
The data sheet contains the technical specifications of the R&S ZNA. It also lists the
firmware applications and their order numbers, and optional accessories.
The brochure provides an overview of the instrument and deals with the specific characteristics.
See https://www.rohde-schwarz.com/brochure-datasheet/ZNA
2.7 Release notes and open source acknowledgment (OSA)
The release notes list new features, improvements and known issues of the current
firmware version, and describe the firmware installation.
The software makes use of several valuable open source software packages. An opensource acknowledgment document provides verbatim license texts of the used open
source software.
See https://www.rohde-schwarz.com/firmware/ZNA
2.8 Application notes, application cards, white papers, etc.
These documents deal with special applications or background information on particular topics.
See https://www.rohde-schwarz.com/application/ZNA
12Getting Started 1178.6456.02 ─ 21
Page 13

R&S®ZNA
Preparing for use
Choosing the operating site
3 Preparing for use
Here, you can find basic information about setting up the product for the first time.
3.1 Lifting and carrying
The carrying handles are designed to lift or carry the instrument. Do not apply excessive external force to the handles.
See "Lifting and carrying the product" on page 7.
3.2 Unpacking and checking
1. Unpack the R&S ZNA carefully.
2. Retain the original packing material. Use it when transporting or shipping the
R&S ZNA later.
3. Using the delivery notes, check the equipment for completeness.
4. Check the equipment for damage.
If the delivery is incomplete or equipment is damaged, contact Rohde & Schwarz.
3.3 Choosing the operating site
Specific operating conditions ensure proper operation and avoid damage to the product and connected devices. For information on environmental conditions such as ambient temperature and humidity, see the data sheet.
See also "Choosing the operating site" on page 8.
Electromagnetic compatibility classes
The electromagnetic compatibility (EMC) class indicates where you can operate the
product. The EMC class of the product is given in the data sheet.
●
Class B equipment is suitable for use in:
– Residential environments
– Environments that are directly connected to a low-voltage supply network that
supplies residential buildings
●
Class A equipment is intended for use in industrial environments. It can cause
radio disturbances in residential environments due to possible conducted and radiated disturbances. It is therefore not suitable for class B environments.
13Getting Started 1178.6456.02 ─ 21
Page 14
R&S®ZNA
If class A equipment causes radio disturbances, take appropriate measures to
eliminate them.
3.4 Setting up the product
See also:
●
"Setting up the product" on page 8
●
"Intended use" on page 7
3.4.1 Placing the product on a bench top
To place the product on a bench top
1. Place the product on a stable, flat and level surface. Ensure that the surface can
support the weight of the product. For information on the weight, see the data
sheet.
Preparing for use
Setting up the product
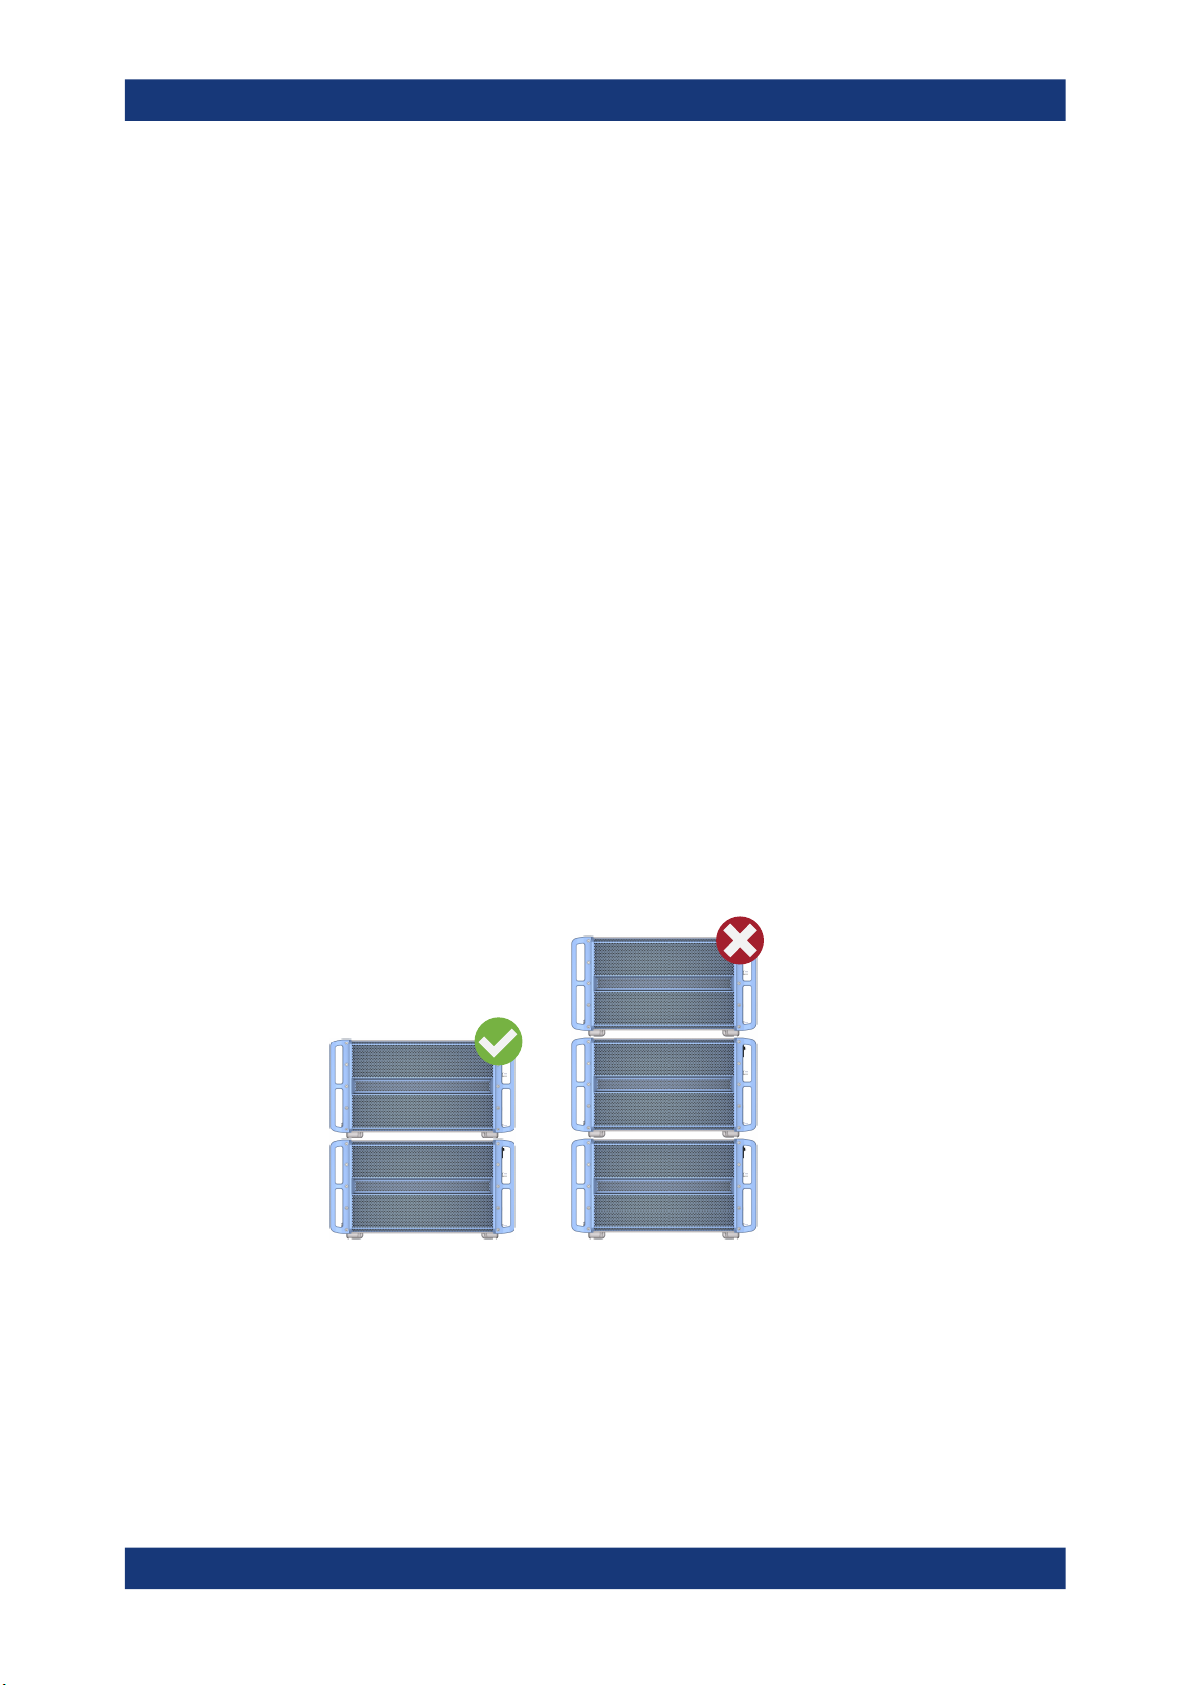
WARNING! A stack of products can fall over and cause injury. Never stack more
2.
than two products. Otherwise, mount them in a rack.
Stack as follows:
● All products must have the same dimensions (width and length).
● Do not exceed a total load of 50 kg placed on the product at the bottom of the
stack.
= Stacked correctly
Left
Right = Stacked incorrectly, too many products
NOTICE! Overheating can damage the product.
3.
Prevent overheating as follows:
● Keep a minimum distance of 10 cm between the fan openings of the product
and any object in the vicinity.
14Getting Started 1178.6456.02 ─ 21
Page 15

R&S®ZNA
● Do not place the product next to heat-generating equipment such as radiators
or other products.
3.4.2 Mounting the product in a rack
To prepare the rack
1. Observe the requirements and instructions in "Setting up the product" on page 8.
NOTICE! Insufficient airflow can cause overheating and damage the product.
2.
Design and implement an efficient ventilation concept for the rack.
To mount the R&S ZNA in a rack
1. Use an adapter kit to prepare the R&S ZNA for rack mounting.
a) Order the rack adapter kit R&S ZZA-KN6 (order number 1332.4498.02).
b) Mount the adapter kit. Follow the assembly instructions provided with the
adapter kit.
Preparing for use
Considerations for test setup
2. Lift the R&S ZNA to shelf height.
3. Grab the handles and push the R&S ZNA onto the shelf until the rack brackets fit
closely to the rack.
4. Tighten all screws in the rack brackets with a tightening torque of 1.2 Nm to secure
the R&S ZNA in the rack.
To unmount the R&S ZNA from a rack
1. Loosen the screws at the rack brackets.
2. Remove the R&S ZNA from the rack.
3. If placing the R&S ZNA on a bench top again, unmount the adapter kit from the
R&S ZNA. Follow the instructions provided with the adapter kit.
3.5 Considerations for test setup
Cable selection and electromagnetic interference (EMI)
Electromagnetic interference (EMI) can affect the measurement results.
To suppress electromagnetic radiation during operation:
●
Use high-quality shielded cables, for example, double-shielded RF and LAN
cables.
●
Always terminate open cable ends.
●
Ensure that connected external devices comply with EMC regulations.
15Getting Started 1178.6456.02 ─ 21
Page 16
R&S®ZNA
Preparing for use
Connecting the analyzer to the AC supply
Regarding length and quality, the following requirements have to be met for cable that
are directly connected to the R&S ZNA:
Table 3-1: Cable Requirements
Cable Type (Connector) Requirement
RF cables (PORT 1, ..., PORT N) Double shielded
BNC cables (various) Double shielded
DB-25 (User Port) Double shielded
Digital I/Q (External Handler IO, External Data Logger, Direct Control)
GPIB Standard cable
RFFE/GPIO R&S ZN-Z25 (order no. 1334.3424.02) only
DisplayPort (Monitor) Standard cable
DVI-D (Monitor) 2 ferrite cores
LAN At least CAT6, S/FTP
PCIe Standard cable
USB Standard cables, length ≤ 3m
R&S order no. 1402.4990.00 only
Signal input and output levels
Information on signal levels is provided in the data sheet. Keep the signal levels within
the specified ranges to avoid damage to the product and connected devices.
Preventing electrostatic discharge (ESD)
Electrostatic discharge is most likely to occur when you connect or disconnect a DUT.
NOTICE! Electrostatic discharge can damage the electronic components of the
►
product and the device under test (DUT).
Ground yourself to prevent electrostatic discharge damage:
a) Use a wrist strap and cord to connect yourself to ground.
b) Use a conductive floor mat and heel strap combination.
During operation, if the firmware observes a serious unexpected disturbance (e.g. due
to ESD), it resets all hardware components to ensure proper instrument functioning. It
then restores the user settings to the state before the disturbance and indicates the
foregone hardware reset by an "Hardware communication problem [...]" information
popup.
3.6 Connecting the analyzer to the AC supply
For safety information, see "Connecting to power" on page 8.
16Getting Started 1178.6456.02 ─ 21
Page 17

R&S®ZNA
Preparing for use
Switching the instrument on and off
The network analyzer is automatically adapted to the AC supply voltage, which must
be in the range of 100 V to 240 V at 50 Hz to 60 Hz. A line frequency of 400 Hz is also
supported.
The AC power connector is located in the upper part of the rear panel (see Chap-
ter 4.2, "Rear panel", on page 30).
1. Plug the AC power cable into the AC power connector on the rear panel of the
product. Only use the AC power cable delivered with the product.
2. Plug the AC power cable into a power outlet with ground contact.
The required ratings are listed next to the AC power connector and in the data
sheet.
3.
If necessary, also ground the product using the grounding terminal
The maximum power consumption and the typical power consumption of the individual
analyzer models are listed in the data sheet.
3.7 Switching the instrument on and off
To switch on the R&S ZNA
1. Switch the AC power switch to position I (On).
The AC power switch is located in the upper part of the rear panel, above the
mains connector; see Chapter 4.2, "Rear panel", on page 30.
After power-on, the analyzer automatically goes to standby or ready state, depending on the state of the standby toggle key at the front panel when the instrument
was switched off last time.
2. If necessary, press the standby toggle key on the front panel to switch the instrument to ready state.
See Chapter 3.8, "Standby and ready state", on page 18
.
The instrument automatically performs a system check, boots the Windows® operating system and then starts the vector network analyzer (VNA) application. If it
was terminated regularly, the VNA application restores all recall sets and instrument settings of the previous analyzer session.
To shut down the instrument
1. Press the standby toggle key.
Pressing the standby toggle key causes the instrument to save all loaded recall
sets, to close the VNA application, to shut down Windows®, and to go to standby
state (see Chapter 3.8, "Standby and ready state", on page 18).
Of course, you can also perform these steps manually, like in any Windows session.
17Getting Started 1178.6456.02 ─ 21
Page 18
R&S®ZNA
Preparing for use
Windows operating system
2. If desired, set the AC power switch to position O (Off).
To disconnect from power
The R&S ZNA is in standby state.
NOTICE! Risk of data loss. If you disconnect the product from power when it is in
1.
the ready state, you can lose settings and data. Shut it down first.
Set the switch on the power supply to position [0].
The LED of the standby toggle key key is switched off.
2. Disconnect the R&S ZNA from the power source.
To guarantee the specified functionality, after turning off the R&S ZNA, you have to wait
for at least 10 seconds before turning it on again. This rule applies to both the AC
power off and the standby state.
3.8 Standby and ready state
Thestandby toggle key is located in the bottom-left corner of the front panel.
In standby state, the LED on the standby toggle key is orange, in ready state it is
green. The standby power only supplies the power switch circuits and the optional high
precision quartz (R&S ZNA-B4, "Precision Oven Quartz Frequency Reference"). In this
state, it is safe to switch the AC power off and disconnect the instrument from the
power supply. In ready state, all modules are power-supplied. When switched to ready
state, the analyzer initiates its startup procedure.
Observe the instructions for startup and shutdown in Chapter 3.7, "Switching the instru-
ment on and off", on page 17.
3.9 Windows operating system
The analyzer is equipped with a Windows® operating system which has been configured according to the instrument's features and needs. Changes in the system configuration can be necessary to:
●
Establish a LAN connection
●
Customize the properties of the external accessories connected to the analyzer
●
Call up additional software tools
18Getting Started 1178.6456.02 ─ 21
Page 19

R&S®ZNA
Preparing for use
Windows operating system
Modifications of the operating system
The operating system is adapted to the network analyzer. To avoid impairment of
instrument functions, only change the settings described in this manual. Existing software must be modified only with update software released by Rohde & Schwarz. Likewise, only programs authorized by Rohde & Schwarz for use on the instrument must
be executed.
All necessary settings can be accessed from the Windows "Start" menu, in particular
from the "Control Panel". To open the "Start" menu, press the Windows key in the toolbar or on an external keyboard.
User accounts and password protection
The analyzer uses a user name and password as credentials for remote access. Two
user accounts with different levels of access are available on the instrument:
●
"instrument" is the default account with standard rights to change system settings.
Use this account for normal operation of the analyzer.
●
"Admin" is the account for administering the operating system. This account is
required, for instance, if you wish to install programs on the analyzer.
In the factory configuration, "894129" is preset as a password for both users. To protect
the analyzer from unauthorized access, it is recommended to change the preset passwords.
To switch from one user account to another, log off from Windows and then log on
again. The "switch user" functionality is disabled on the R&S ZNA.
Service packs and updates
Microsoft regularly creates security updates and other patches to protect Windowsbased operating systems. They are released through the Microsoft Update website and
associated update server. Update instruments using Windows regularly, especially
instruments that connect to a network.
Firewall settings
A firewall protects an instrument by preventing unauthorized users from gaining access
to it through a network. Rohde & Schwarz highly recommends using the firewall on
your instrument. Rohde & Schwarz instruments are shipped with the Windows firewall
enabled. All ports and connections for remote control are enabled.
Note that changing firewall settings requires administrator rights.
Virus protection
Take appropriate steps to protect your instruments from infection. Use strong firewall
settings and scan any removable storage device used with a Rohde & Schwarz instrument regularly. It is also recommended that you install anti-virus software on the instrument. Rohde & Schwarz does NOT recommend running anti-virus software in the
19Getting Started 1178.6456.02 ─ 21
Page 20
R&S®ZNA
3.10 Minimizing the VNA application
Preparing for use
Minimizing the VNA application
background ("on-access" mode) on Windows-based instruments, due to potentially
degrading instrument performance. However, Rohde & Schwarz does recommend running it during non-critical hours.
For details and recommendations, see the following Rohde & Schwarz white paper:
●
1EF96: Malware Protection Windows 10
With a minimized VNA application, you can access your analyzer's Windows® desktop
or run other applications.
To exit the default full-screen mode of the VNA application, deselect System – [Display]
> "View Bar" > "Title Bar Task Bar". Then use the standard Windows® titlebar functions
to minimize/maximize/close the application window.
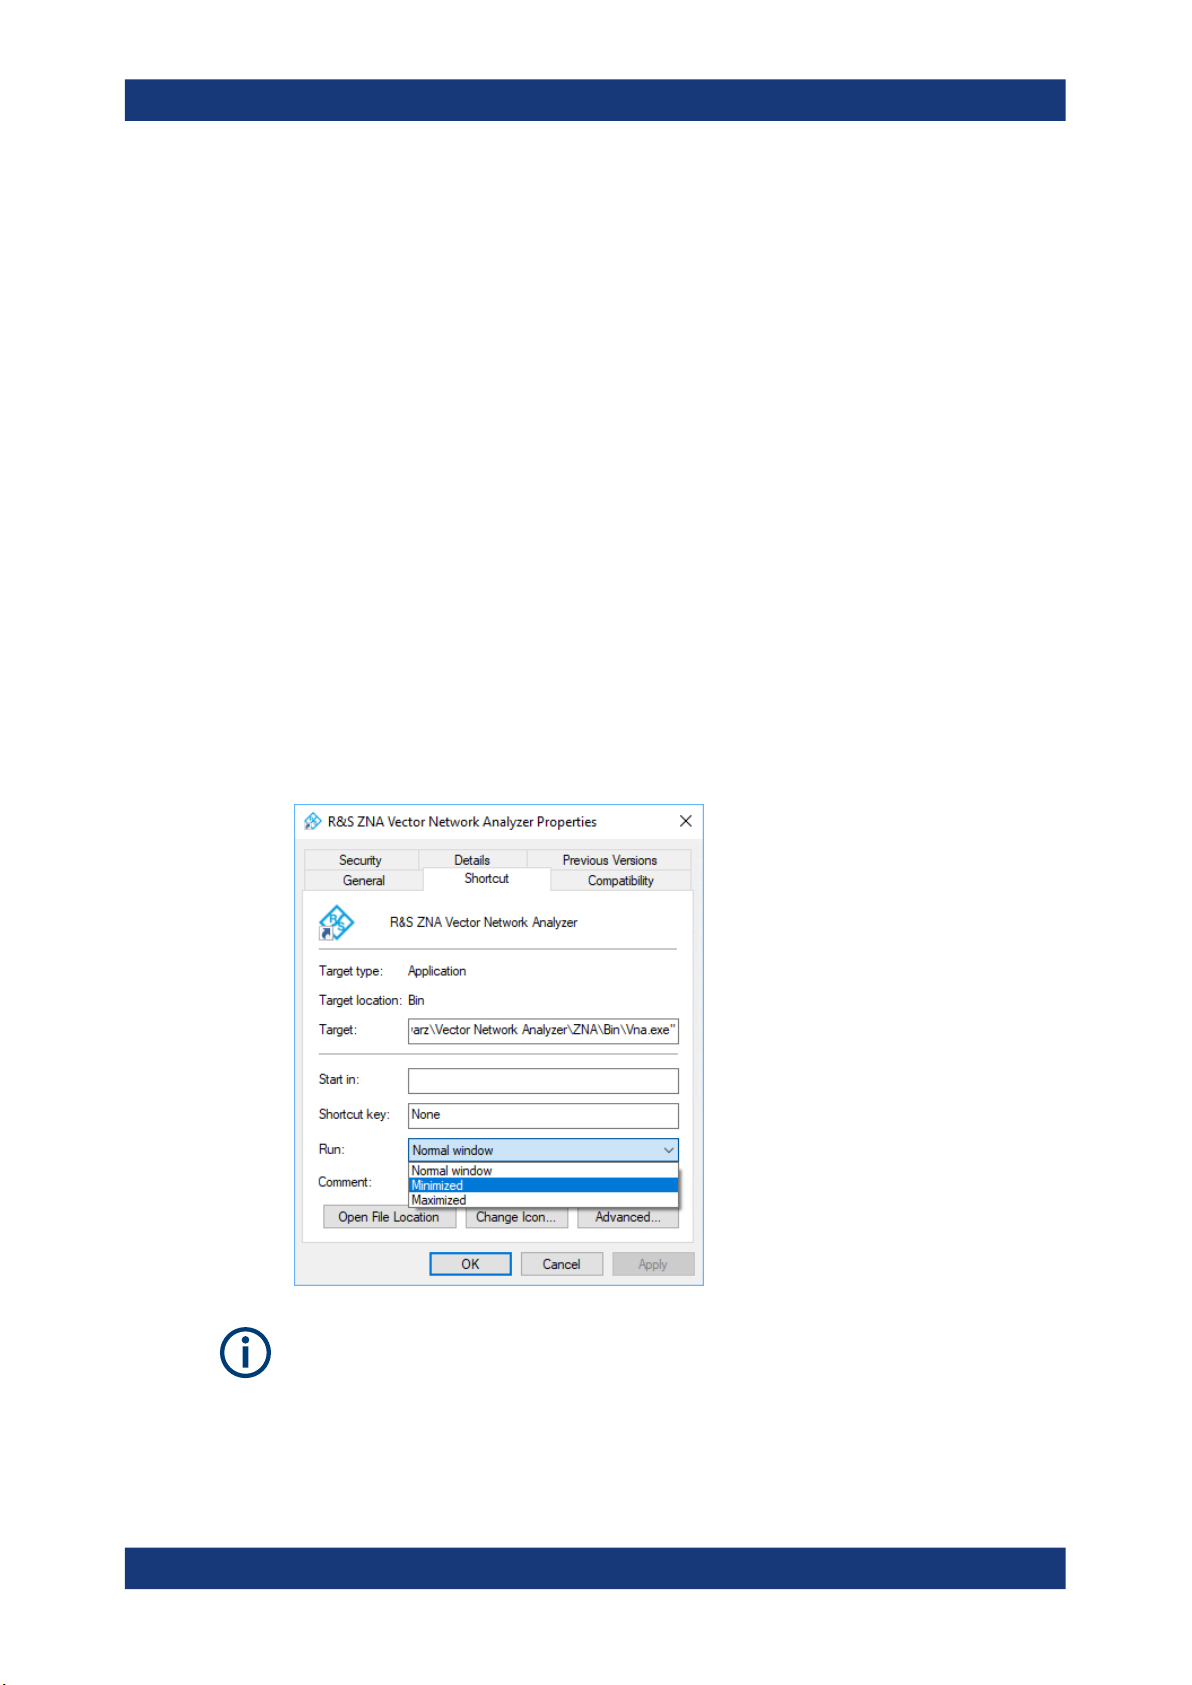
To start the VNA application with a minimized window
1. Right-click the Vector Network Analyzer shortcut icon on the desktop and open the
"Properties" dialog.
2. In the "Shortcut" tab, select "Run: Minimized".
A software update restores the original shortcut properties.
20Getting Started 1178.6456.02 ─ 21
Page 21
R&S®ZNA
3.11 Connecting external accessories
The analyzer's standard PC interfaces (Monitor, USB, LAN) can be used to connect
various accessories:
●
An external monitor displays the Windows® desktop plus the vector network analyzer (VNA) application windows.
●
External keyboard and mouse simplify local control, in particular manual (GUI)
operation of the VNA application.
●
A printer can be used to create hard copies of the measurement diagrams and
traces from within the VNA application.
●
A LAN connection can be established to access the analyzer's mass storage or
control the analyzer from an external PC.
●
The R&S ZNA can also be remote controlled via USB.
External monitor, keyboard and mouse are not required for local operation. The
R&S ZNA can be fully controlled by tapping the touchscreen.
Preparing for use
Connecting external accessories
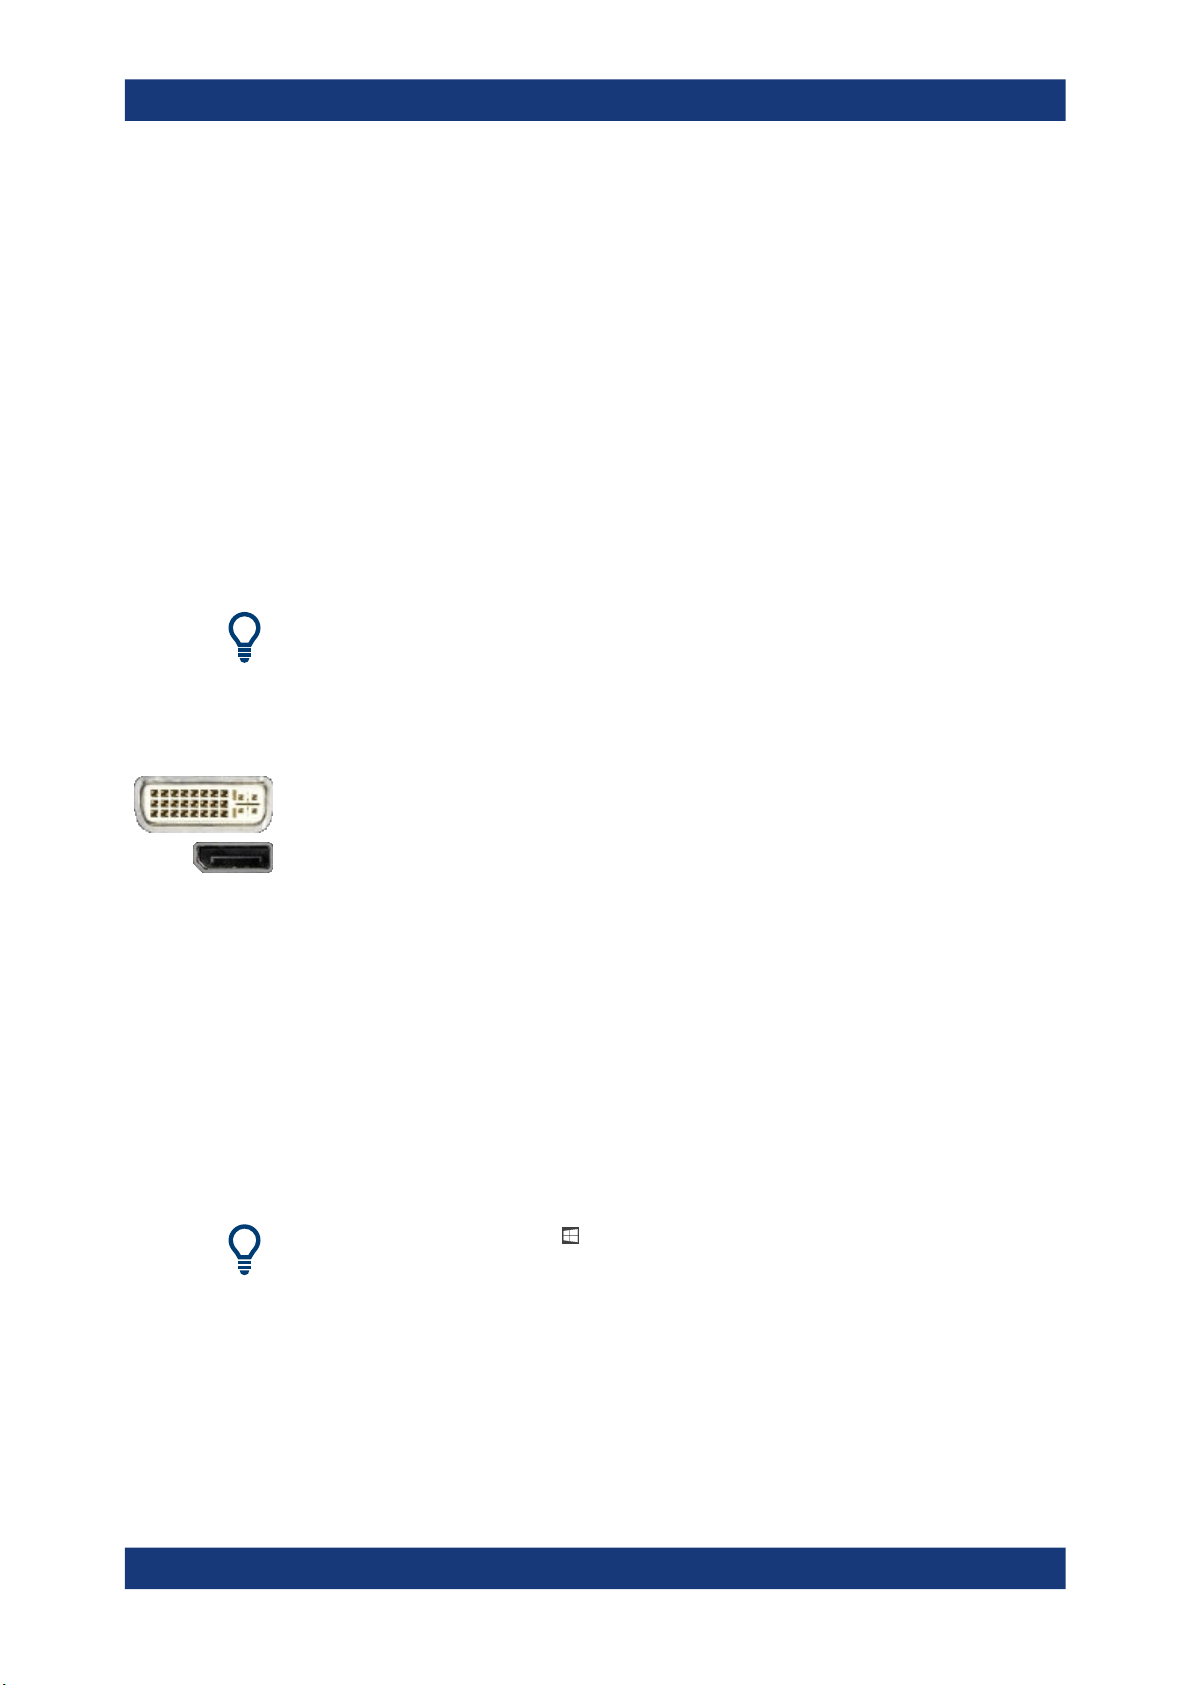
3.11.1 Connecting a monitor
A standard monitor can be connected to the DVI-D connector of the R&S ZNA. No
extra configuration is required.
The R&S ZNA also offers a DisplayPort.
3.11.2 Connecting a keyboard
A keyboard can be connected to any of the USB connectors. After being auto-detected
by the operating system, it can safely be disconnected and reconnected even during
measurements.
Keyboard configuration
The default input language is English – US. Select "Settings" > "Time & language" >
"Region & language" from the Windows® Start menu to manage languages and keyboards.
To access Windows®, use the
button in the toolbar of the application window.
3.11.3 Connecting a mouse
A USB mouse can be connected to any of the USB connectors. After being auto-detected by the operating system, it can safely be disconnected and reconnected even during measurements.
21Getting Started 1178.6456.02 ─ 21
Page 22

R&S®ZNA
Preparing for use
Connecting external accessories
Mouse configuration
Select "Settings" > "Devices" > "Mouse & touchpad" from the Windows® "Start" menu
to configure the mouse properties.
To access Windows®, use the
3.11.4 Connecting a printer
A printer can be connected to any of the USB connectors. After successful installation,
it can safely be disconnected and reconnected even during measurements.
Before printing (System – [File Print] > "Print"), the analyzer checks whether a printer is
connected and turned on and whether the appropriate printer driver is installed.
Printer driver installation
If necessary, the printer driver installation is initiated using the operating system's "Add
Printer Wizard". The wizard is self-explanatory. A printer driver must be installed only
once.
A great variety of printer drivers is available on the analyzer. To obtain the complete
list, select "Settings" > "Devices" > "Printers & scanners" from the Windows® "Start"
menu.
To access Windows®, use the button in the toolbar of the application window.
button in the toolbar of the application window.
You can load updated and improved driver versions or new drivers from an installation
disk, USB memory stick or another external storage medium. Alternatively, if the analyzer is integrated in a network, you can install driver data stored in a network directory.
In either case, use the "Add Printer" wizard to complete the installation.
Printer configuration
Use the "Printer Setup" dialog of the firmware (System – [File Print] > "Print" >
"Print...") or the Windows® printer management to configure the printer properties and
printing preferences.
3.11.5 Connecting a LAN cable
A LAN cable can be connected to the LAN connector on the rear panel of the analyzer.
To establish a LAN connection, proceed as follows:
1. Refer to Chapter 7.2.1, "Assigning an IP address", on page 72.
2. Connect a CAT6 or CAT7 LAN cable to the LAN port.
22Getting Started 1178.6456.02 ─ 21
Page 23

R&S®ZNA
3.11.6 Connecting a USB cable for remote control
Preparing for use
Connecting external accessories
The LAN port of the analyzer is an auto-crossover Ethernet port. You can connect it to
a network, but you can also set up a direct connection to a computer or another instrument. For both connection types, you can use either crossover or straight through
(patch) cables.
The IP address information is displayed in the System – [Setup] > "Remote Settings"
softtool tab.
The R&S ZNA can also be remote controlled via USB. To prepare for remote control
operation, connect a suitable USB cable to the type B "USB Device" port on the rear
panel of the instrument. With direct connection to a master device, a connecting cable
A-B (plug type A onto plug type B) must be used.
For more information, refer to the Remote Control chapter of your analyzer's help system or user manual.
23Getting Started 1178.6456.02 ─ 21
Page 24
R&S®ZNA
Instrument tour
Front panel
4 Instrument tour
This chapter gives an overview of the control elements and connectors of the
R&S ZNA and gives all information that is necessary to put the instrument into operation and connect external devices.
The meanings of the labels on the product are described in "Meaning of safety labels"
on page 9.
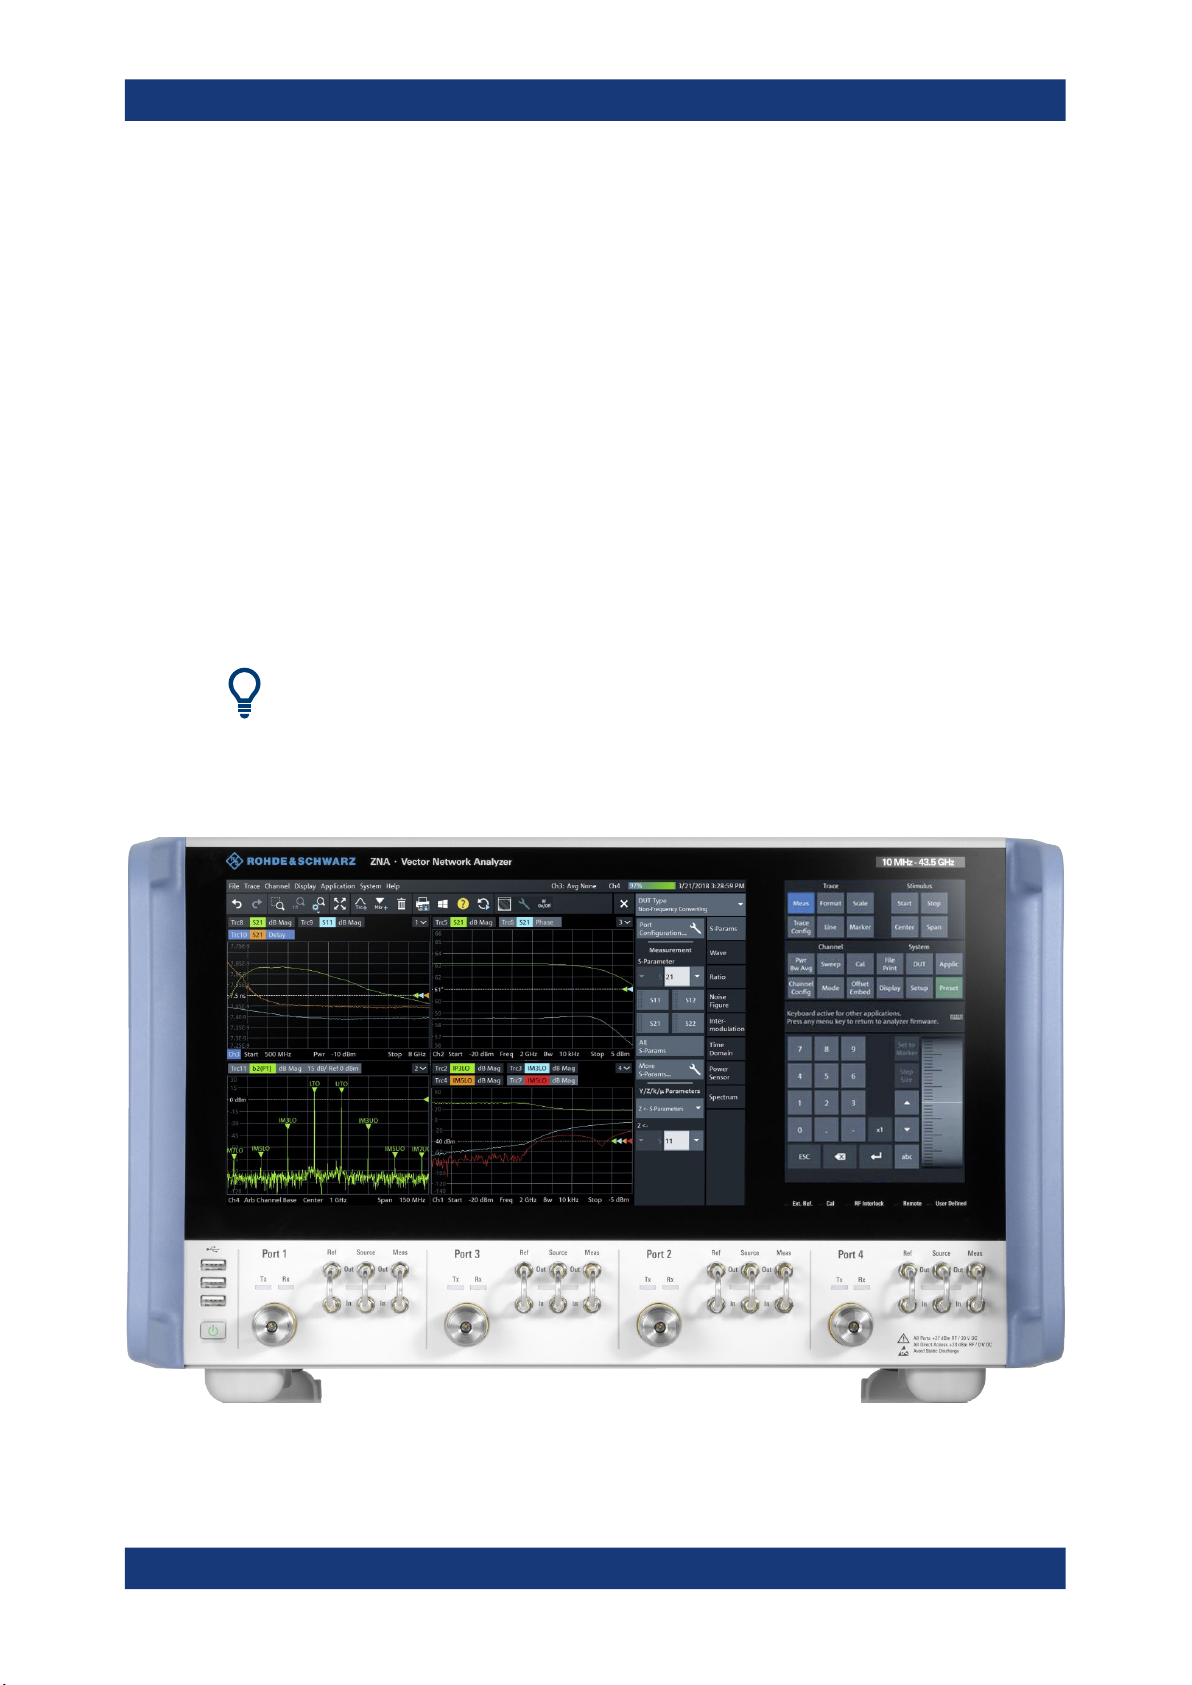
4.1 Front panel
The front panel of a R&S ZNA consists of a large-scale capacitive touchscreen and the
test port area below it.
Brief explanations on the controls and connectors can be found on the next pages.
Two-port and four-port network analyzers
The figures and examples in this Getting Started guide show a four-port network analyzer. Everything described in this guide is also valid for two-port analyzers. The extended measurement functionality of the four-port instruments is described in the help system and in the user manual.
24Getting Started 1178.6456.02 ─ 21
Page 25

R&S®ZNA
Instrument tour
Front panel
4.1.1 Touchscreen
The touchscreen is split into two parts: the application window with diagrams and softtools on the left, and the control window with its (virtual) function keys and data entry
controls on the right. User interaction is touch-only, i.e. all hardkeys commonly used in
Rohde & Schwarz VNAs have been implemented in software.
Refer to the data sheet for the technical specifications of the touchscreen.
Application Window Control Window
Function
Keys
Screen saver
The screen saver function of the operating system can be used to switch off the display
if the analyzer receives no command for a selectable period of time. The display is
switched on again when the touchscreen is touched.
4.1.1.1 Application window
The left part of the touchscreen is reserved for the application window.
The application window presents the measurement results, mostly in form of diagrams.
The toolbar, softtools and menu bar give access to all instrument functions. For an
introduction to touchscreen operation, refer to Chapter 5.1, "Manual operation",
on page 33.
The following sections contain further useful information about manual control of the
instrument.
●
Refer to Chapter 5, "Operating the instrument", on page 33 to learn how to handle
traces and diagrams, and how to use menus, keys and softtools.
●
Refer to chapter "Concepts and Features" in the user manual or help system to
obtain information about the results in the diagram.
Data Entry
Panel
25Getting Started 1178.6456.02 ─ 21
Page 26

R&S®ZNA
4.1.1.2 Control window: function keys
Instrument tour
Front panel
●
Refer to the description of the "Display" softtool (System – [Display]) in the user
manual or help system to learn how to customize the screen.
Most of the (virtual) keys in the upper part of the control window call up a related softtool of the analyzer GUI. Every softtool, in turn, provides access to a group of related
settings and actions (see Chapter 5.2.3, "Softtools", on page 40).
The Trace keys give access to all trace settings, to the limit check settings, and to the
marker functions including marker search.
●
[Meas]: select the measured and displayed quantity.
●
[Format]: define how measured data (traces) are presented.
●
[Scale]: define how traces are scaled.
●
[Trace Config]: store traces to memory and perform mathematical operations on
traces.
●
[Line]: define limits for measurement results, visualize them in the diagrams and
activate/deactivate the limit check.
●
[Marker]: position markers on a trace, configure their properties and select the format of the numerical readout. Markers can also be used to locate specific points on
the trace, define the sweep range, and scale the diagram.
The Channel keys give access to channel-related settings.
●
[Pwr Bw Avg]: define the power of the internal signal source, the IF bandwidth, and
the sweep average.
●
[Sweep]: define the scope of measurement, including the sweep type and the number of measured sweeps.
●
[Cal]: functions that are necessary to perform and manage calibrations.
●
[Channel Config]: functions for channel management.
●
[Mode]: set up channels for particular (non-standard) measurements.
●
[Offset Embed]: functions for embedding and deembedding a DUT.
The Stimulus keys define the sweep range, depending on the sweep type.
●
[Start]
●
[Stop]
●
[Center]
●
[Span]
The System keys give access to (or provide) general system functions.
●
[File Print]
– Create, save or load recall sets.
– Save or load trace data.
– Send the contents of the active diagrams to a file, to the clipboard, or to an
external printer (incl. content definition and printer setup).
●
[DUT]: starting point for DUT-centric measurement setup.
– Define DUTs to be measured (type, properties)
26Getting Started 1178.6456.02 ─ 21
Page 27

R&S®ZNA
4.1.1.3 Control window: data entry panel
Instrument tour
Front panel
– Choose the measurements to be performed on a selected DUT.
The analyzer firmware then helps you to set up the channels accordingly.
●
[Applic]: external software tools and optional extensions of the analyzer firmware.
●
[Display]: display settings and functions that activate, modify and arrange different
diagrams.
●
[Setup]: general system settings that are not restricted to a particular recall set.
●
[Preset]: restores preset values.
The controls in the data entry panel are used to enter numbers, units, and characters.
The appearance of the panel depends on the data type of the setting selected in the
Application window.
Figure 4-1: Data Entry panel
left = numeric value
right = string value
While most of the keys have their standard keyboard functionality, some keys and controls provide additional functionality:
●
The [abc] and [123] keys switch between the numeric and the string keyboard.
●
The wheel control at the right of the numerical data input panel increases and
decreases numerical values, and scrolls within lists.
[Step Size] opens an input box to select the steps (in units of the current physical
parameter) between two consecutive numerical values. The step size is also valid
for value changes using the up and down keys. See also Chapter 5.6.2, "Using the
numeric editor", on page 52.
27Getting Started 1178.6456.02 ─ 21
Page 28

R&S®ZNA
4.1.2 Status LEDs
Multi-color LEDs, indicating various HW and FW states:
●
Ext. Ref.
Indicates whether an external reference clock is used.
– Off: the internal reference clock is used
– Green: the R&S ZNA is synchronized to an external reference clock
– Yellow, flashing: the R&S ZNA is configured for external synchronization, but
cannot lock on the external reference clock.
●
Cal.
Indicates the calibration state of the active setup.
– Off: none of the traces (in the active setup) has a valid calibration
– Yellow: some of the traces have a valid calibration
– Green: all the traces have a valid calibration
●
RF Interlock
RF interlock mode is activated by “RF Off Control” BNC connector on the rear
panel of the R&S ZNA (see Chapter 4.2, "Rear panel", on page 30. In this mode,
RF sources are forced off.
– If the connector is terminated (electrical short), the RF interlock mode is inac-
tive and the LED is off (see picture below)
– If the connector is open, the RF interlock state is active and the LED is on
(red).
Instrument tour
Front panel
Figure 4-2: RF Off Control, terminated with attached Short
●
Remote
Indicates whether a remote control (RC) connection is established.
– Off: no RC connection established
– Green: RC connection established
●
User Defined
Persistent, user-defined state indicator. Can be set to off, green, green flashing,
red, or red flashing
4.1.3 Standby key
28Getting Started 1178.6456.02 ─ 21
Page 29

R&S®ZNA
4.1.4.1 Test ports
The standby toggle switch is located in the bottom left corner of the front panel.
The key serves two main purposes:
●
Toggle between standby and ready state; see Chapter 3.8, "Standby and ready
state", on page 18.
●
Shut down the instrument; see Chapter 3.7, "Switching the instrument on and off",
on page 17.
4.1.4 Front panel connectors
The test ports and three USB connectors are located on the front panel of the
R&S ZNA.
Numbered connectors:
●
3.5 mm male for R&S ZNA26
●
2.92 mm (K) or 2.4 mm male for R&S ZNA43
●
2.4 mm male for R&S ZNA50
●
1.85 mm male for R&S ZNA67
Instrument tour
Front panel
The test ports serve as outputs for the RF stimulus signal and as inputs for the measured RF signals from the DUT (response signals).
●
With a single test port, it is possible to generate a stimulus signal and measure the
response signal in reflection. For a measurement example, refer to Chapter 6.2,
"Reflection S-parameter measurement", on page 69.
●
With more than one test port, it is possible to perform full two-port, 3-port, ... , or nport measurements; see Chapter 6.1, "Transmission S-parameter measurement",
on page 62.
●
Use a torque wrench when screwing RF cables on the test port connectors.
●
See also Chapter 3.5, "Considerations for test setup", on page 15.
Connector usage
Two LEDs above each test port indicate the connector usage:
●
Tx on: connector is used as a source port
●
Rx on: connector is used as a receive port
●
both LEDs on: connector is used as a bidirectional (source and receive) port
29Getting Started 1178.6456.02 ─ 21
Page 30

R&S®ZNA
4.1.4.2 Direct generator and receiver access
4.1.4.3 USB connectors
Instrument tour
Rear panel
Hardware option R&S ZNAxx-B16 provides direct access to the Ref, Source and Meas
signal path for each test port of a R&S ZNAxx.
The connector type of the 3 connector pairs is 2.92 mm (f) for R&S ZNA26 and
R&S ZNA43, and 1.85 mm (f) for R&S ZNA50 and R&S ZNA67.
The front panel offers three USB connectors of type A (master USB).
The USB ports can be used to connect external devices, e.g.:
●
external PC accessories such as mouse or other pointing devices, a keyboard,
printer or external storage device (USB stick, CD-ROM drive etc.)
●
external measurement equipment such as calibration units, power meters, frequency converters, extension units, signal generators, or switch matrices
16
4.2 Rear panel
This section gives an overview of the rear panel elements of the network analyzer.
17
18
11
19
15
1
2 3 4 5 6
8 9 10
12
13
14
7
21
22
30Getting Started 1178.6456.02 ─ 21
Page 31

R&S®ZNA
Instrument tour
Rear panel
Table 4-1: Rear panel elements available on all instruments
Index Label Description
1 System Drive Removable system drive of the R&S ZNA, containing all software (including the operating
system and the VNA application) and data. No other drive is built in. Do not remove the
system drive during operation.
Option R&S ZNA-B19 provides an additional removable system drive (including operating
system and firmware).
2 Display Port External monitor connector (DisplayPort); see Chapter 3.11.1, "Connecting a monitor",
on page 21.
3 DVI Digital only External monitor connector (DVI-D); see Chapter 3.11.1, "Connecting a monitor",
on page 21.
4 LAN RJ-45 connector to integrate the instrument to a Local Area Network, primarily for remote
control purposes; see Chapter 7.2.1, "Assigning an IP address", on page 72.
5 USB Type A USB host (master) connectors. Similar functionality as the USB connectors on the
front panel (see Chapter 4.1.4.3, "USB connectors", on page 30).
6 USB Device Type B USB device (slave) connector for remote control of the instrument (see Chap-
ter 3.11.6, "Connecting a USB cable for remote control", on page 23).
7 I/O Power on/off switch, see Chapter 3.7, "Switching the instrument on and off", on page 17
8 GPIB IEEE 488 GPIB bus connector according to standard IEEE 488 / IEC 625.
9 External Handler IO Used to connect an external Handler I/O (option R&S ZNBT-Z14), providing a Centronics
36 input/output connector.
Not yet supported.
10 External Data Logger Digital interface for data streaming.
Requires "Data Streaming Memory" option R&S ZNA-B7 (not yet available).
11 (Reference) In/Out
12 (Reference) In /
(Reference) Out
13 Trigger In A BNC connector for an incoming external trigger signal (LV-TTL 3.3 V, 5 V tolerant).
14 User Port 25-pin D-Sub connector used as an input and output for other control signals (LV-TTL
15 (Ground connector) The ground connector provides the ground of the analyzer's supply voltage. Use this con-
SMA connector for external reference clock input or output.
●
Input: 100 MHz or 1 GHz
●
Output: 100 MHz
BNC connectors for external reference clock input and output.
●
Input: 50 kHz to 100 MHz
●
Output: 10 MHz
The optional trigger board R&S ZNA-B91 provides three additional trigger inputs (and four
trigger outputs).
3.3 V, 5 V tolerant).
nector for ESD protection; see "Preventing electrostatic discharge (ESD)" on page 16.
Table 4-2: Optional rear panel elements
Index Label Description
16 Converter LO Hardware option R&S ZNA-B8 provides a local oscillator output that is particularly useful
for driving mmWave converters.
17 Trigger In / Trigger Out BNC connectors for incoming/outgoing trigger signals (LV-TTL 3.3 V, 5 V tolerant).
Trigger inputs B to D and trigger outputs A to D are provided by the optional trigger board
R&S ZNA-B91.
31Getting Started 1178.6456.02 ─ 21
Page 32

R&S®ZNA
Instrument tour
Rear panel
Index Label Description
18 PuMo In/Out BNC connectors for incoming/outgoing external pulse modulator control signals (LV-TTL
3.3 V, 5 V tolerant).
Requires the optional trigger board R&S ZNA-B91.
19
21 RFFE GPIO Option R&S ZNA-B15 provides 2 independent RF Front-End (RFFE) interfaces and 10
22 Direct IF Access Input / Out-
BNC connectors for other incoming/outgoing control signals (LV-TTL 3.3 V, 5 V tolerant).
put
●
Ready for Trigger (outgoing)
●
Busy (outgoing)
●
+28 V Noise Source Control (outgoing)
●
RF Off Control (incoming)
Requires the optional trigger board R&S ZNA-B91.
General Purpose Input/Output (GPIO) pins on a single connector (25 pins, female). The
RFFE interfaces meet the MIPI® Alliance "System Power Management Interface Specification".
Option R&S ZNA-B26 provides direct access to the IF signal paths.
32Getting Started 1178.6456.02 ─ 21
Page 33

R&S®ZNA
Operating the instrument
Manual operation
5 Operating the instrument
The following sections describe the basics of manual operation, i.e. how to access
instrument functions and settings via the analyzer GUI. Manual operation is particularly
useful for getting to know the instrument and for trouble shooting.
Manual and remote control of the instrument
Manual control of the R&S ZNA is possible either via its touchscreen (without using a
mouse and/or keyboard), via locally connected monitor + mouse + keyboard (see
Chapter 3.11, "Connecting external accessories", on page 21), or via Remote Desktop
(see also Chapter 7.2, "Remote operation in a LAN", on page 72). Alternatively it can
be remote-controlled via the GPIB interface or a LAN connection.
To their full extent, manual operation and remote control are described in the GUI Reference and Command Reference chapters of the user manual, respectively. GUI functions and related remote commands are linked bidirectionally. Background information
is provided in the Concepts and Features chapter of the user manual.
5.1 Manual operation
The analyzer functions are accessible via several tabbed softtools, each presenting
related functions and settings. The function keys on the control window open the most
frequently used softtools (see Chapter 4.1.1.2, "Control window: function keys",
on page 26).
Manual operation via function keys and softtools provides touch-friendly access to the
instrument functions and settings, avoiding complicated menu structures and long
operating sequences. In general, this approach is recommended. However, sometimes
the toolbar or an object's context menu can offer a shortcut. As a full-fledged alternative for manual operation via mouse and keyboard, also the menu bar provides access
to all instrument functions and settings.
Figure 5-1: Function Keys
33Getting Started 1178.6456.02 ─ 21
Page 34

R&S®ZNA
Operating the instrument
Manual operation
Customizing the screen
The contents of the screen and the size and position of many display and control elements are not fixed. You can display or hide most elements. You can also drag and
drop traces and info fields.
Using the Touchscreen
To access an instrument function:
1. Press a (virtual) key, e.g. the [Meas] key in the Trace section.
The corresponding softtool expands at the current docking position.
2. Make sure the "S-Params" radio button is selected.
3. Activate the desired softtool tab, e.g. "Wave".
34Getting Started 1178.6456.02 ─ 21
Page 35

R&S®ZNA
Operating the instrument
Manual operation
4. Select a control element, e.g. "a1 Src Port 1".
The diagram immediately reflects your selection. The active trace shows the measurement results for the selected measured quantity.
A control element with three dots (e.g. System – [Setup] > "Setup" > "System Config...") opens a dialog, containing a group of related settings, a wizard or additional
information.
35Getting Started 1178.6456.02 ─ 21
Page 36

R&S®ZNA
Operating the instrument
Manual operation
Using the menu bar
The menu bar at the bottom of the application screen provides alternative access to all
instrument functions. To repeat the measured quantity selection described above,
► Select Trace – [Meas] > "S-Params" > "Wave" > "a1 Src Port 1".
The diagram immediately reflects your selection. The active trace shows the measurement results for the selected measured quantity. At the same time, the related
softtool tab is opened.
Using context menus
Context menus are another alternative for quick access to instrument settings.
1. Touch and hold (right-click) the measured quantity section in the trace info for a
couple of seconds until the context menu appears.
36Getting Started 1178.6456.02 ─ 21
Page 37

R&S®ZNA
Operating the instrument
Control elements of the application window
2. Select "a1 Src Port 2".
5.2 Control elements of the application window
The application window of the analyzer provides all control elements for the measurements and contains the diagrams for the results. There are several alternative ways for
accessing an instrument function:
●
Using a function key on the (virtual) hardkey panel to open the related softtool (recommended, provides all settings)
●
Using the menus and submenus of the menu bar (alternative to the previous
method)
●
Using the context menus of certain display objects (for important actions in the
context of this object)
●
Using the icons in the toolbar above the diagram area (for frequent global actions)
37Getting Started 1178.6456.02 ─ 21
Page 38

R&S®ZNA
Operating the instrument
Control elements of the application window
These methods are described in more detail in the following sections.
5.2.1 Title bar
By default, the analyzer GUI is shown in full screen mode, covering the whole screen
and hiding the Windows taskbar. However, you can toggle the full screen mode using
System – [Display] > "View Bar" > "Title and Task Bar On".
If full screen mode is switched off, the main application window of the vector network
analyzer application provides a standard Windows® title bar.
5.2.2 Toolbar
The toolbar above the diagram area contains the most frequently used control elements of the user interface. All controls are also accessible via Softtools.
The toolbar is divided into several icon groups, separated by vertical lines.
38Getting Started 1178.6456.02 ─ 21
Page 39

R&S®ZNA
Operating the instrument
Control elements of the application window
These icons represent the undo and redo actions that are also available
via the menu bar items "System" > "Undo" / "Redo".
Undo reverses the last action, redo reverses the last undo action (if possible).
These icons control the zoom function (Trace – [Scale] > " Zoom").
If multiple diagrams are configured, this icon toggles the "Maximize Diagram" action for the active diagram (System – [Display] > "Diagram" >
"Maximize Diagram").
These icons implement the following actions, from left to right:
●
Add a clone of the active trace to the active diagram (single tap; same
as Trace – [Trace Config] > "Traces" > "Add Trace") or to an
arbitrary/new one (drag & drop the "Trc+" icon to the diagram area).
●
Add a new marker to the active diagram (single tap; similar to Trace –
[Marker] > "Markers" > "Mkr<i>") or to an arbitrary one (drag & drop
the "Mkr+" icon).
●
Delete the active trace (single tap the trash icon), or an arbitrary trace
(drag & drop its trace info field to the trash icon). Or delete all markers
of a trace (drag & drop the marker info field to the trash icon).
These icons provide the following actions, from left to right:
●
Print the current diagrams to a bitmap file (same as System –
[File Print] > "Print" > "To File...").
By default, all diagrams are printed, no matter if displayed or not.
However you can also choose to print only the active diagram (see
System – [File Print] > "Print" > "Print...").
●
Open the Windows® Start menu.
●
Open the context-sensitive help.
●
Restart the sweep in all channels (same as Channel – [Sweep] >
"Sweep Control" > "Restart Sweep")
These icons provide the following actions, from left to right:
●
Toggle advanced diagram area editing, which makes rearranging
and/or deleting diagrams a breeze.
●
Toggle other measurements (except the active trace) OFF|ON
●
Open the "METAS Reconnection" dialog
This button is only visible if, option R&S ZNA-K50 "Measurement
Uncertainty Analysis"" is installed. It is only enabled, if a METAS calibration is active.
●
Open the channel setup dialog
These icons provide the following actions, from left to right:
●
Open the "ALC Config" dialog
This button is only visible while ALC (automatic level control) is
enabled
●
Open the "Source Coherence" dialog
This button is only visible while source coherence is enabled, which
requires option R&S ZNA-K6.
Switch off|on all sources. This button is pinned to the right edge of the toolbar and is always visible
You can hide the toolbar using System – [Display] > "View Bar".
39Getting Started 1178.6456.02 ─ 21
Page 40

R&S®ZNA
Operating the instrument
Control elements of the application window
5.2.3 Softtools
Softtools display groups of related settings as a tabbed panel. They can be opened via
function keys, or via menu bar and context menu items.
Figure 5-2: Scale softtool
A softtool is a tabbed panel with a close icon. When the softtool is closed, the close
icon is replaced by a "hamburger" icon. The latter allows you to reopen the softtool.
Some controls on the softtool tabs allow you to read and modify settings (e.g. "Ref
Value" in the screenshot above), some perform actions (e.g. "Auto Scale Trace"), while
others open additional dialogs (button label ends with "...").
5.2.4 Menu bar
You can also access the analyzer functions via textual menus. The menu bar is located
below the diagram area:
As in any Windows® application, menus can be controlled with the touchscreen or a
mouse. A short tap (left mouse click) expands a menu or submenu. If a menu command has no submenu assigned, a short tap (left mouse click) opens a dialog or
directly activates the menu command. When a (sub)menu is selected, the R&S ZNA
displays the corresponding softtool.
40Getting Started 1178.6456.02 ─ 21
Page 41

R&S®ZNA
Operating the instrument
Control elements of the application window
Overview of menu functions
●
The "File" menu provides functions to handle recall sets and trace files, to print or
save diagram content, and to shut down the VNA application.
●
The "Trace" menu provides all trace settings, the limit check settings, and the
marker functions including marker search.
●
The "Channel" menu provides all channel settings and activates, modifies or stores
different channels.
●
The "Display" menu provides all display settings and the functions for activating,
modifying and arranging different diagrams.
●
The "Application" menu gives access to applications and tools that extend the functionality of the analyzer firmware.
●
The "System" menu provides functions that can be used to return to a defined
instrument state, reverse operations, access service functions and define various
system-related settings.
●
The "Help" menu provides assistance with the network analyzer and its operation.
You can toggle the visibility of the menu bar using System – [Display] > "View Bar" >
"Menu Bar".
5.2.5 Menu structure
All menus show an analogous structure.
●
A menu command with a right arrow expands a submenu with further related settings.
Example: "Marker" expands a submenu with marker-related properties.
41Getting Started 1178.6456.02 ─ 21
Page 42

R&S®ZNA
●
A menu command with three dots appended calls up a dialog providing several
related settings.
Example: "Search Range" opens a dialog to define the search range for the
marker search.
●
A menu command with no arrow or dots initiates an immediate action.
Example: "Max" sets the active marker to the maximum of the active trace.
5.2.6 Hardkey panel
The (virtual) "Hard Key" panel displays the control window's function keys inside the
main application window. For a short description of the function keys, refer to section
Chapter 4.1.1.2, "Control window: function keys", on page 26.
Operating the instrument
Control elements of the application window
The "Hard Key" panel is particularly useful if the analyzer is controlled from an external
monitor or Remote Desktop.
For the R&S ZNA, it is hidden by default. In "Single Window Mode", it is visible (see
Chapter 5.6.1, "Dual-window mode vs. single-window mode", on page 51).
You can display the "Hard Key" panel using one of the following methods:
●
Select System – [Display] > "View Bar" > "Hard Key Panel".
●
Select "Display"> "View Bar" > "Hard Key Panel On" from the menu bar.
42Getting Started 1178.6456.02 ─ 21
Page 43

R&S®ZNA
●
Select "Hard Key" from the context menu of the softtool panel.
5.2.7 Status bar
The status bar shows
●
the active channel
●
the current channel's sweep averaging counter (e.g. "Ch<i>: Avg 9/10"), or "Ch<i>:
Avg None" if averaging is disabled
●
the progress of the sweep
The progress bar also shows when the R&S ZNA prepares a sweep with new
channel settings
●
the "EXT REF" symbol, if an external reference clock is used for synchronization
●
a frequency converter symbol, if frequency converters are configured
●
a symbol for redefined S-parameters, if the physical ports have been redefined
●
the current date and time
Operating the instrument
Touchscreen gestures
Figure 5-3: R&S ZNA with frequency converters
The progress bar shows a moving color gradient if the current sweep is too fast to be
monitored, e.g. because the number of sweep points is low. You can hide/show the status bar using System – [Display] > "View Bar" > "Status Bar".
5.3 Touchscreen gestures
A touchscreen allows you to interact with the software using various finger gestures on
the screen. The basic gestures supported by the software and most applications are
described here. Further actions using the same gestures may be possible.
Tapping
Touch the screen quickly, usually on a specific element.
You can tap most elements on the screen; in particular, any elements you can also
click on with a mouse pointer.
Figure 5-4: Tapping
43Getting Started 1178.6456.02 ─ 21
Page 44

R&S®ZNA
Operating the instrument
Touchscreen gestures
Double-tapping
Tap the screen twice, in quick succession.
Double-tap a diagram to maximize it or to restore its original size.
Dragging
Move your finger from one position to another on the display, keeping your finger on
the display the whole time.
By dragging your finger over a table or diagram you can pan the displayed area of the
table or diagram to show results that were previously out of view.
Figure 5-5: Dragging
Spreading and pinching two fingers
Move two fingers apart on the display (spread) or move two fingers together on the display (pinch).
These gestures take effect for diagrams only. The effect depends on the current zoom
mode (see Chapter 5.7, "Scaling diagrams", on page 55).
●
In graphical zoom mode, when you spread two fingers in the display, you graphically zoom in vertically.
When you pinch two fingers in the display, you graphically zoom out vertically.
Figure 5-6: Pinching
44Getting Started 1178.6456.02 ─ 21
Page 45

R&S®ZNA
Operating the instrument
Working with dialogs
While "Zoom Select" is active (toolbar icon or softtool button is toggled on), spreading and pinching is disabled. You can only select a rectangular area (using one finger) then.
●
In stimulus zoom mode, spreading and pinging is disabled by default. Only while
"Stim. Zoom Select" is active (toolbar icon or softtool button is toggled on), you can
use spreading and pinching to modify the sweep area and/or the vertical scaling.
Mouse vs. touch actions
Any user interface elements that react to actions by a mouse pointer also react to finger gestures on the screen, and vice versa. The following touch actions correspond to
mouse actions:
Table 5-1: Correlation of mouse and touch actions
Mouse operation Touch operation
Click Tap
Double-click Double-tap
Click and hold Touch and hold
Right-click Touch, hold for 1 second and release
Drag&drop (= click and hold, then drag and release) Touch, then drag and release
n.a. (Change hardware settings) Spread and pinch two fingers
Mouse wheel to scroll up or down Swipe
Dragging scrollbars to scroll up or down, left or right Swipe
In (graphical) zoom mode only: dragging the borders
of the displayed rectangle to change its size
Example:
You can scroll through a long table in conventional mouse operation by clicking in the
table's scrollbar repeatedly. In touchscreen operation, you would scroll through the
table by dragging the table up and down with your finger.
5.4 Working with dialogs
Dialogs provide groups of related settings and allow to make selections and enter data
in an organized way. The settings are visualized, if possible. An example is shown
below.
Touch, then drag and release
45Getting Started 1178.6456.02 ─ 21
Page 46

R&S®ZNA
Operating the instrument
Working with dialogs
All dialogs are operated in a similar way.
●
To open a dialog, select a softtool button with three dots appearing in its label (e.g.
"Start... (Manual)").
●
The title bar of each dialog contains some convenience functions:
– Use the "Dialog Transparency" function to make the display elements behind
the dialog visible.
Note: The "Dialog Transparency" is a global setting, i.e. it applies to all dialogs.
–
Use the icon to create a screenshot of the dialog.
●
Drag and drop the lower right corner of the dialog to modify its size.
●
Some dialogs are subdivided into tabs, containing groups of related settings. Activate a tab to access those settings.
The Help system provides useful information about each dialog's specific settings.
Select "Help" to open the Help.
46Getting Started 1178.6456.02 ─ 21
Page 47

R&S®ZNA
Operating the instrument
Handling diagrams, traces, and markers
5.5 Handling diagrams, traces, and markers
The analyzer displays measurement results as traces in rectangular diagrams. Markers
are used to read specific numerical values and to search for points or regions on a
trace. The following section presents some of the graphical tools the R&S ZNA provides for trace and marker handling.
For further reference
Refer to chapter "Concepts and Features" in the R&S ZNA Help or in the User Manual
to learn more about traces, channels, and screen elements.
5.5.1 Adding new traces and diagrams
A new trace is required if you want to measure and display an additional quantity.
Typical scenario: The transmission coefficient S21 is measured as described in Chap-
ter 6.1, "Transmission S-parameter measurement", on page 62. A trace is added to
display the reflection coefficient S11 for comparison.
To create a trace:
1. Drag the "Trc+" icon from the toolbar into a diagram.
The diagram changes its color scheme and contents as shown below.
2. Select the adequate drop position, depending on whether you want to display the
new trace in the existing diagram, or whether you want to add a new diagram. The
highlighted area indicates the target diagram.
47Getting Started 1178.6456.02 ─ 21
Page 48

R&S®ZNA
Operating the instrument
Handling diagrams, traces, and markers
3. In the dialog box that is opened when you release the "New Trace" icon, select the
S-parameter to be measured.
For a four-port analyzer:
The R&S ZNA generates a new trace for the selected S-parameter.
48Getting Started 1178.6456.02 ─ 21
Page 49

R&S®ZNA
Alternative control elements
To measure a different quantity, select Trace – [Meas]. Drag and drop a softkey representing a measured quantity to create a trace. Or simply select another softkey to
change the measured quantity of the active trace.
Select Trace – [Trace Config] to access more trace handling functions. Select System
– [Display] to access more diagram handling functions.
5.5.2 Adding new markers
A marker is needed, for instance, to read a particular numerical trace value.
To add a new marker:
●
Drag and drop the "New Marker" icon from the toolbar to the desired position in the
target diagram.
Operating the instrument
Handling diagrams, traces, and markers
The marker appears on the target diagram's active trace. The marker info field displays the stimulus value (x-axis value) and response value (y-axis value) at the
marker position. The response value varies as the analyzer continues performing
sweeps.
49Getting Started 1178.6456.02 ─ 21
Page 50

R&S®ZNA
Active trace, alternative control elements
The trace line of the active trace in the upper part of the diagram is highlighted. If the
diagram contains several traces, first activate the target trace, then add the marker.
The Trace – [Marker] softtool provides more functions for marker handling. In particular, any marker offered in the "Markers" tab can be positioned on the active trace using
drag & drop.
5.5.3 Deleting display elements
Markers, traces, diagrams, and other display elements are most conveniently deleted
using the "Delete" icon in the toolbar above the diagram area.
●
To delete a single marker, drag it into vertical direction to release it from the trace
and drop it onto the "Delete" icon.
To delete a set of markers, drag and drop their marker info field onto the "Delete"
icon.
Deleting a marker and its info field also disables the associated marker function.
●
To delete a trace, drag and drop its trace line onto the "Delete" icon. The active
trace can also be deleted by tapping/clicking the "Delete" icon.
Note however, that the last remaining trace cannot be deleted.
●
To delete a diagram, drag and drop its diagram number label onto the "Delete"
icon.
Note however, that the last remaining diagram cannot be deleted.
●
To delete a channel, drag and drop all associated traces onto the "Delete" icon.
Note however, that the last remaining channel cannot be deleted.
●
To hide the limit lines and disable the limit check, drag and drop the PASS / FAIL
message onto the "Delete" icon. The limit line itself is not deleted; you can re-use it
any time.
Operating the instrument
Handling diagrams, traces, and markers
The context menu of some display elements also provides the "Delete" function.
Undo function
If you happen to delete a display element unintentionally, you can restore it using the
"Undo" toolbar icon.
5.5.4 Using drag and drop
You can drag and drop many of the R&S ZNA's control and display elements to change
their size and position. The drag and drop functionality is often more convenient to use
than the equivalent buttons of the softtool panels. The following table gives an overview.
50Getting Started 1178.6456.02 ─ 21
Page 51

R&S®ZNA
Table 5-2: Drag and drop functionality for various screen elements
Screen element Action Drag and drop...
Diagram Create See Chapter 5.5.1, "Adding new traces and diagrams", on page 47
Resize Separator between adjacent diagrams
Delete See Chapter 5.5.3, "Deleting display elements", on page 50
Trace Create See Chapter 5.5.1, "Adding new traces and diagrams", on page 47
Move vertically Reference line marker (right diagram edge)
Operating the instrument
Entering data
Move into other or new
diagram
Delete See Chapter 5.5.3, "Deleting display elements", on page 50
Reset / suspend
graphic zoom
Marker Create See Chapter 5.5.2, "Adding new markers", on page 49
Move horizontally Marker symbol
Delete Marker or marker info field --> "Delete" icon; see Chapter 5.5.3, "Deleting display
Marker info field Add See Chapter 5.5.2, "Adding new markers", on page 49
Move within diagram Marker info field (move to one of several pre-defined positions)
Delete See Chapter 5.5.3, "Deleting display elements", on page 50
Trace line
"Zoom" element in additional trace line --> "Delete" icon; see Chapter 5.7.1,
"Using the graphical zoom", on page 55
elements", on page 50
5.6 Entering data
The analyzer provides dialogs with various types of input fields where you can enter
numeric values and character data. Data entry with a mouse and an external keyboard
is a standard procedure known from other Windows® applications. However, there are
various other ways to enter data.
5.6.1 Dual-window mode vs. single-window mode
In dual-window mode (default), both the application window and the control window are
shown. Whenever you select an editable value, a suitable editor is displayed in the
data entry part of the control window.
51Getting Started 1178.6456.02 ─ 21
Page 52

R&S®ZNA
Operating the instrument
Entering data
See Chapter 4.1.1.3, "Control window: data entry panel", on page 27.
In single-window mode (System – [Display] > "Config" > "Single Window Mode") only
the application window is shown, with its virtual Hardkey panel enabled. The values
can be edited in place, either using an external keyboard or by calling the VNA's
numeric editor or on-screen keyboard (see Chapter 5.6.2, "Using the numeric editor",
on page 52, or Chapter 5.6.3, "Using the analyzer's on-screen keyboard",
on page 53).
5.6.2 Using the numeric editor
The "Numeric Editor" is a tool for convenient entry and modification of numeric values.
It is available for all numeric input fields in the analyzer GUI.
The numeric editor is particularly useful in single-window mode. In dual-window mode,
a suitable editor is automatically displayed: whenever an editable value is selected in
the main window or a dialog, the data entry part of the control window is adjusted
accordingly. Hence in dual-window mode there is typically no need to open the numeric
editor.
Operation with touchscreen or mouse:
1. Double-tap (double-click) a numeric input field in a dialog or on a softtool to open
the numeric editor.
52Getting Started 1178.6456.02 ─ 21
Page 53

R&S®ZNA
Operating the instrument
Entering data
2. Use the buttons in the numeric keypad to compose the numeric input value.
3. If desired, select a "Step Size" and use the cursor up/down buttons to increment/
decrement the current value. If a marker is active, you can also set the numeric
value to the current marker value ("Set to Marker").
4. After completing the input string, select "ENTER" to apply your selection and close
the numeric editor.
[Step Size] key
In dual-window mode, if a numeric input field is active, the [Step Size] key in the data
entry panel opens a dialog containing the "Step Size" panel of the numeric editor.
Select the adequate step size for efficient operation of the on-screen wheel (and
mouse wheel).
5.6.3 Using the analyzer's on-screen keyboard
The on-screen "Keyboard" allows you to enter characters, in particular letters, without
an external keyboard. It is available for all text input fields in the analyzer GUI.
The on-screen keyboard is particularly useful in single-window mode. In dual-window
mode, a suitable editor is automatically displayed: whenever an editable value is
selected in the main window or a dialog, the data entry part of the control window is
adjusted accordingly. Hence in dual-window mode there is typically no need to open
the on-screen keyboard.
53Getting Started 1178.6456.02 ─ 21
Page 54

R&S®ZNA
Operating the instrument
Entering data
For the following procedure, we assume single-window mode.
1. Activate a character data input field in a softtool or a dialog.
5.6.4
2. Double-tap/click the input field to open the on-screen keyboard.
3. Select character buttons to compose the input string.
4. Select "Enter" to apply your selection and close the keyboard.
Using the Windows
®
on-screen keyboard
The Windows® on-screen keyboard allows you to enter characters, in particular letters,
even if an input field cannot call up the analyzer's own on-screen keyboard. Examples
are input fields in standard Windows ® dialogs.
Figure 5-7: Windows 10 on-screen keyboard
To call up the on-screen keyboard:
1. Open the System – [Applic] softtool.
54Getting Started 1178.6456.02 ─ 21
Page 55

R&S®ZNA
Operating the instrument
Scaling diagrams
2. Select "External Tools"
3. Select "Screen Keyboard".
5.7 Scaling diagrams
The analyzer provides various tools for customizing the diagrams and for setting the
sweep range. Choose the method that is most convenient for you.
5.7.1 Using the graphical zoom
The graphical zoom function magnifies a rectangular portion of the diagram (zoom window) to fill the entire diagram area. The sweep points are not affected.
The graphical zoom function is only supported for cartesian trace formats. For (inverted) Smith and polar diagrams, it is not available.
To activate the graphical zoom:
●
Select the "Zoom Config" icon in the toolbar above the diagram area and make
sure that the graphical zoom mode is active:
●
Select the "Zoom Select" toggle button in the toolbar above the diagram area.
The icon changes its background color from black to blue.
●
In the active diagram area, select an appropriate rectangular area.
55Getting Started 1178.6456.02 ─ 21
Page 56

R&S®ZNA
Operating the instrument
Scaling diagrams
The zoomed view shows the selected rectangle, scaled in both horizontal and vertical direction. In general, the zoom window covers only a part of the sweep range;
the horizontal distance between the sweep points increases. The reduced display
range is indicated in an additional zoom line in the channel info area.
Use the "Zoom Reset" icon to restore the original diagram. Alternatively, you can drag
and drop the "Zoom" label from the additional channel info line onto the toolbar button.
56Getting Started 1178.6456.02 ─ 21
Page 57

R&S®ZNA
Operating the instrument
Scaling diagrams
Alternative settings
●
The Trace – [Scale] > "Zoom" softtool tab allows you to define the displayed zoom
range numerically.
It can also be opened from the menu of the "Zoom Config" toolbar icon.
●
If the active diagram is graphically zoomed, "Overview On" in the "Zoom" softtool
tab toggles an overview. The upper part of the diagram then shows a small version
of the unzoomed diagram. You can move the zoomed part of the trace by moving
the rectangular area in the overview.
●
To zoom the stimulus range (keeping the number of sweep points constant), use
the "Zoom Config" toolbar icon and select "Mode Stimulus Zoom". Then use the
"Zoom Select" icon to narrow the sweep range and adjust the vertical scaling.
5.7.2 Setting the sweep range
The sweep range for all related channels is displayed in the channel info area at the
bottom of each diagram:
57Getting Started 1178.6456.02 ─ 21
Page 58

R&S®ZNA
To change the sweep range of the active channel, use one of the following methods:
●
Use the [Start], [Stop], [Center], and [Span] function keys from the Stimulus section.
●
Double-tap (with a mouse: double-click) the "Start" or "Stop" label in the channel
list.
●
Tap and hold (with a mouse: right-click) the "Start" or "Stop" label in the channel list
and select "Start Frequency", "Stop Frequency", "Center Frequency", or "Frequency Span" from the context menu.
●
Select "Start Frequency", "Stop Frequency", "Center Frequency", "Span Frequency" from the "Channel" > "Stimulus" menu.
●
Use the "Set by Marker" functions (Trace – [Marker] > "Set by Marker"; see Chap-
ter 5.7.6, "Set by marker", on page 59).
5.7.3 Reference value and position
The analyzer provides three parameters for changing the scale of the vertical
(response) axis:
●
Changing the "Ref Value" or "Ref Pos" shifts the trace in vertical direction and
adjusts the labels of the vertical axis. "Ref Value" also works for radial diagrams.
●
Changing the "Scale/Div" modifies the value of the vertical or radial diagram divisions and thus the entire range of response values displayed.
Operating the instrument
Scaling diagrams
The "Scale/Div" and the "Ref Value" are indicated in the scale section of the trace info.
In the example below, a "Scale/Div" of 10 dB and a "Ref Value" of 0 dB is used.
To change such a scale parameter, use one of the following methods:
●
Open the Trace – [Scale] > "Scale Values" softtool tab and proceed from there.
●
Tap and hold (with a mouse: right-click) the scale section in the trace info and
select a setting from the context menu.
●
Select a setting from the "Trace" > "Scale" menu.
●
Use "Set by Marker" functions (Trace – [Marker] > "Set by Marker"; see Chap-
ter 5.7.6, "Set by marker", on page 59).
5.7.4 Auto scale
The "Auto Scale" function adjusts the scale divisions and the reference value so that
the entire trace fits into the diagram. To access "Auto Scale", use one of the following
methods:
●
Open the Trace – [Scale] > "Scale Values" softtool tab and select "Auto Scale
Trace" or "Auto Scale Diagram".
●
Tap and hold (with a mouse: right-click) the scale section in the trace info and
select "Auto Scale Trace" from the context menu.
58Getting Started 1178.6456.02 ─ 21
Page 59

R&S®ZNA
●
Select "Auto Scale Trace" or "Auto Scale Diagram" from the "Trace" > "Scale"
menu.
5.7.5 Circular diagrams
The radial scale of a circular diagram ("Polar", "Smith" or "Inverted Smith") can be
changed with a single linear parameter, the "Ref Value". The reference value defines
the radius of the outer circumference.
●
Increasing the "Ref Value" scales down the polar diagram.
●
Decreasing the "Ref Value" magnifies the polar diagram.
The "Ref Value" is indicated in the scale section of the trace info.
To change the "Ref Value" setting, use one of the following methods:
●
Locate it on the Trace – [Scale] > "Scale Values" softtool tab.
●
Tap and hold (with a mouse: right-click) the scale section in the trace info and
select the parameter from the context menu.
●
Select the parameter from the "Trace" > "Scale" menu.
●
Use the "Set by Marker" functions; see Chapter 5.7.6, "Set by marker",
on page 59.
Operating the instrument
Scaling diagrams
5.7.6 Set by marker
The "Set by Marker" functions are a convenient tool for scaling (in particular: magnifying) diagrams without entering explicit numeric values. You simply place a marker to a
trace point and use the marker values to change the sweep range or move the trace
relative to the vertical axis. The touchscreen or a mouse makes it easier to activate
(touch/click) or move (drag and drop) markers.
To set the sweep range using markers, use one of the following methods.
59Getting Started 1178.6456.02 ─ 21
Page 60

R&S®ZNA
Operating the instrument
Scaling diagrams
Set "Start" and "Stop" values in the diagram:
1. Create two normal markers, e.g. the markers "Mkr 1" (default label "M1") and "Mkr
2" (default label "M2").
See Chapter 5.5.2, "Adding new markers", on page 49.
2. Place "M1" to the start value of the desired sweep range and tap Trace – [Marker]
> "Set by Marker" > "Start = Marker".
3. Place "M2" to the stop value of the desired sweep range and tap Trace – [Marker]
> "Set by Marker" > "Stop = Marker".
Use a definite "Span:"
1. Create a marker.
2. Enable "Delta Mode" for this marker.
The analyzer automatically creates an additional reference marker.
3. Place the reference marker to the start value of the desired sweep range.
4. Set the value of the delta marker to the desired sweep range and tap Trace –
[Marker] > "Set by Marker" > "Span = Marker".
To move the trace in vertical direction, proceed as follows:
1. Create a normal marker, e.g. the marker "Mkr 1" (default label "M1").
2. Place "M1" to a particular trace point, e.g. use the "Marker Search" functions to
locate a maximum or minimum on the trace.
3. Select Trace – [Marker] > "Set by Marker" > "Max = Marker" to move the trace
towards the upper diagram edge, leaving the values of the vertical divisions
("Scale/Div") and the overall vertical scale unchanged. Analogously, select "Min =
Marker" to move the trace towards the lower diagram edge, or select "Ref Val =
Marker" to move the trace towards the "Ref Value".
You can also use marker values in the "Numeric Editor"; see Chapter 5.6.2, "Using the
numeric editor", on page 52.
5.7.7 Enlarging a diagram
The analyzer provides different tools for customizing the contents and size of the diagrams:
●
Select from the toolbar to maximize the active diagram. Or, equivalently, select
System – [Display] > "Diagram" > "Maximize Diagram".
If enabled the active diagram is always maximized.
●
The "Menu Bar", the "Status Bar", the "Hard Key Panel", and the "Title Bar" can be
hidden to gain space for the diagrams (System – [Display] > "View Bar").
●
The System – [Display] > "Config" softtool tab defines optional display elements for
the interior of the diagrams.
60Getting Started 1178.6456.02 ─ 21
Page 61

R&S®ZNA
Operating the instrument
Scaling diagrams
Use the context menu of the diagram, the System – [Display] key or the "Display"
menu to access the display settings.
61Getting Started 1178.6456.02 ─ 21
Page 62

R&S®ZNA
Performing measurements
Transmission S-parameter measurement
6 Performing measurements
This chapter takes you through a sample session with a R&S ZNA network analyzer
and describes basic operation tasks.
Prerequisite
The instrument is set up, connected to the mains system, and started up as described
in Chapter 3, "Preparing for use", on page 13.
6.1 Transmission S-parameter measurement
In a transmission measurement, the analyzer transmits a stimulus signal to the input
port of the device under test (DUT) and measures the transmitted wave at the DUT's
output port. The trace settings allow you to select the measured quantities and display
formats, depending on what you want to learn from the data. A minimum of two analyzer test ports are required for transmission measurements.
In the following example, the analyzer is set up for a two-port transmission measurement. A frequency sweep range is selected, the instrument is calibrated and the measurement result is analyzed using various display formats.
6.1.1 Connecting the instrument for transmission measurements
To prepare a transmission measurement, you have to connect your DUT (which for
simplicity we assume to have appropriate connectors) in-between a pair of analyzer
test ports. It is recommended that you preset the R&S ZNA to start from a well-defined
instrument state.
62Getting Started 1178.6456.02 ─ 21
Page 63

R&S®ZNA
VNA
1 2
1 2
DUT
Performing measurements
Transmission S-parameter measurement
1. Connect the DUT between test ports 1 and 2 of the network analyzer as shown
above.
2. Use the [Preset] key to restore a well-defined instrument state.
The analyzer is now set to its default state. The default measured quantity is the
transmission S-parameter S21.
Select Trace – [Trace Config] and use the control elements in the "Traces" softtool tab
if you wish to create additional traces and diagrams.
6.1.2 Selecting the sweep range and other parameters
After a system preset the display shows a diagram with a dB magnitude scale, and the
S-parameter S21 is selected as a measured quantity. This S-parameter is the forward
transmission coefficient of the DUT. It is defined as the ratio of the transmitted wave at
the DUT's output port (port no. 2) to the incident wave at the DUT's input port (port no.
1).
63Getting Started 1178.6456.02 ─ 21
Page 64

R&S®ZNA
Performing measurements
Transmission S-parameter measurement
The R&S ZNA automatically adjusts its internal source and receiver to the selected
measured quantities: For an S21 measurement, a stimulus signal (termed a1) is trans-
mitted at the analyzer port no. 1; the transmitted wave (termed b2) is measured at port
2. The stimulus signal from the analyzer port no. 2 is not needed except for some cali-
bration types.
By default the sweep range is set to the frequency range of the analyzer, which can be
unsuitable for your DUT. The following procedure shows you how to configure a
smaller sweep range.
1. Select Stimulus – [Start] and set the "Start Frequency" to the lowest frequency you
want to measure (e.g. 1.77 GHz).
2. In the "Stop Frequency" input field, enter the highest frequency you want to measure (e.g. 2.5 GHz).
3. Select Trace – [Scale] > "Scale Values" and activate the "Auto Scale Trace" function. The analyzer adjusts the scale of the diagram to fit in the entire S21 trace,
leaving an appropriate display margin.
Tip: Refer to Chapter 5.7, "Scaling diagrams", on page 55 to learn more about the
different methods and tools for diagram scaling.
6.1.3 Calibrating the instrument
Calibration (system error correction) is the process of eliminating systematic, reproducible errors from the measurement results. E.g., in the current test setup, the connecting cables between the analyzer ports and the DUT introduce an attenuation and a
phase shift of the waves. Both effects impair the accuracy of the S-parameter measurement.
The analyzer provides a wide range of sophisticated calibration methods for all types of
measurements. The calibration method to select depends on the expected system
errors, the accuracy requirements of the measurement, on the test setup and on the
types of calibration standards available.
The following example requires a calibration kit with a male Through standard with
known transmission characteristics for the related test port connector type and gender.
With a single Through, it is possible to perform a transmission normalization, compensating for a frequency-dependent attenuation and phase shift in the signal paths.
64Getting Started 1178.6456.02 ─ 21
Page 65

R&S®ZNA
Performing measurements
Transmission S-parameter measurement
Due to the R&S ZNA's calibration wizard, calibration is a straightforward, guided process.
1. Replace the DUT by the Through standard of your calibration kit. Make sure to disconnect all calibration units.
2. Select Channel – [Cal] > "Configure/Start Calibration..." to open the calibration
setup dialog.
3. "Delete" all except the first row in the "Cal Settings" table. If the table is empty, use
"Add" to create a calibration setup.
4. Tap on the "Calibration" cell of the first row in the "Cal Settings" table to open the
"Define Calibration" dialog.
5. Select port 1 (P1) and port 2 (P2) and the calibration type "Trans Norm".
6. Select "OK" to apply your settings and return to the calibration setup dialog "Calibration Setting" wizard.
7. Select the test port connector type and gender (here: N 50 Ω, female, corresponding to a male Through standard), and the calibration kit (here: R&S ZV-Z121).
65Getting Started 1178.6456.02 ─ 21
Page 66

R&S®ZNA
Performing measurements
Transmission S-parameter measurement
8. Tap "Start Cal".
9. The calibration dock widget indicates the standard measurements that make up a
"Trans Norm" calibration.
Select "Through (mm)" to initiate the measurement of the connected Through standard. Measuring the isolation between ports 1 and 2 is optional. Skip it for now.
The analyzer performs a calibration sweep for the measured quantity S21. The
magnitude and phase of the result is displayed in two diagrams, together with the
expected typical result for a Through standard. The similarity of real and expected
traces indicates that the Through standard has been properly connected. After the
R&S ZNA has completed the calibration sweep and calculated the correction data,
the "Apply" button is enabled.
10. Select "Apply" to close the wizard.
The system error correction is calculated and applied to the current channel. A
"Cal" label appears in the trace list.
66Getting Started 1178.6456.02 ─ 21
Page 67

R&S®ZNA
Performing measurements
Transmission S-parameter measurement
To proceed with the measurement, remove the Through standard and connect the DUT
again.
6.1.4 Evaluating data
The analyzer provides various tools to optimize the display and analyze the measurement data. For instance, you can use markers to determine maxima and minima on the
trace, and change the display format to obtain information about the group delay of the
transmitted wave.
1. Select Trace – [Marker] > "Markers" > "Mkr 1".
This places marker "M1" to its default position (center of the sweep range). A
marker symbol (triangle) appears on the trace, a marker info field in the upper right
corner of the diagram. The marker info field displays the stimulus value (frequency)
and response value (magnitude of the transmission coefficient converted to a dB
value) at the marker position.
2. Select Trace – [Marker], activate the "Marker Search" softtool tab and activate
"Min" search.
The marker jumps to the absolute minimum of the curve in the entire sweep range.
The marker info field shows the coordinates of the new marker position.
3. Select Trace – [Format] and choose the "Delay" of the transmission coefficient as
displayed quantity.
The group delay represents the propagation time of the wave through the DUT; it is
displayed in a Cartesian diagram. The marker info field shows the frequency and
group delay at the marker position.
67Getting Started 1178.6456.02 ─ 21
Page 68

R&S®ZNA
Performing measurements
Transmission S-parameter measurement
Refer to the information on trace formats in the help system or in the user manual to
learn more about the diagram properties.
6.1.5 Saving and printing data
The analyzer provides standard functions for saving measurement settings and for
saving or printing the results. You can use these functions as if you were working on a
standard PC. Moreover you can export your trace data to an ASCII file and reuse it in a
later session or in an external application.
Data transfer is made easier if external accessories are connected to the analyzer or if
the instrument is integrated into a LAN. Refer to Chapter 3.11, "Connecting external
accessories", on page 21, and Chapter 7.2, "Remote operation in a LAN", on page 72
to obtain information about the necessary steps.
1. Activate the System – [File Print] > "Trace Data" softtool tab.
2. In the "Trace Data" softtool tab, select "Export" – "ASCII..." to open the "Export
Data - ASCII Files" dialog.
3. In the "Export Data - ASCII Files" dialog:
a) Select a file location ("Look in:").
b) Enter a file name ("File name:").
c) Select "Save".
The analyzer writes the data of the active trace to an ASCII file and closes the dialog.
4. Activate the "Print" softtool tab (System – [File Print] > "Print") .
5. In the "Print" softtool tab, select "Print" to print the diagram area or "To Clipboard"
to copy it to the Windows clipboard.
6. Select System – [File Print] > "Recall Sets" > "Save..." to open the "Save" dialog for
recall sets.
68Getting Started 1178.6456.02 ─ 21
Page 69

R&S®ZNA
Performing measurements
Reflection S-parameter measurement
7. In the "Save" dialog:
a) Select a file location ("Look in:").
b) Enter a name for the recall set file ("File name:").
c) Select "Save".
The analyzer saves the active recall set, containing channel, stimulus and trace
settings, to a znxml file. This recall set can be restored in a later session.
6.2 Reflection S-parameter measurement
In a reflection measurement, the analyzer transmits a stimulus signal to the input port
of the device under test (DUT) and measures the reflected wave. Different trace formats allow you to express and display the results, depending on what you want to
learn from the data. Only one analyzer test port is required for reflection measurements.
In principle, a reflection measurement involves the same steps as a transmission measurement. Note the following differences:
●
The basic test setup for reflection measurements involves a single DUT and analyzer port. For instance, you can connect the input of your DUT to port 1 of the analyzer as shown below.
VNA
1
1
DUT
You can also use the basic transmission test setup, e.g. if you want to measure
reflection and transmission parameters in parallel.
●
The analyzer provides special calibration types for reflection measurements. Use
the calibration wizard and select an appropriate type.
A full n-port calibration (TOSM, UOSM, TNA ...) corrects the system errors for all
transmission and reflection S-parameters.
69Getting Started 1178.6456.02 ─ 21
Page 70

R&S®ZNA
Performing measurements
Reflection S-parameter measurement
●
Some of the trace formats are particularly suited for reflection measurements. For
instance, you can display the measured reflection coefficient S11 in a Smith chart to
obtain the complex input impedance at port 1.
Proceed as described in Chapter 3.7, "Switching the instrument on and off",
on page 17 to shut down your analyzer.
70Getting Started 1178.6456.02 ─ 21
Page 71

R&S®ZNA
Administrative tasks
Firmware installation
7 Administrative tasks
This chapter describes some topics that are only needed occasionally, or if a special
instrument configuration is required.
7.1 Firmware installation
Upgrade versions of the analyzer firmware are supplied as single executable setup
files (*.exe).
Admin account
You need administrator rights to install a new firmware. See note on "User accounts
and password protection" on page 19 for details.
To perform a firmware update:
1. Copy the setup file to any storage medium accessible from the analyzer. This can
be either the internal mass storage drive, an external storage medium (USB memory stick, external CD-ROM drive) or a network connection (LAN).
The default name of the internal drive is C:. External storage devices are automatically mapped to the next free drive, i.e. D:, E: etc.
2.
Run the setup file from the Windows® Explorer. Follow the instructions of the setup
wizard.
Setup files can be reinstalled.
Factory calibration
A firmware update does not affect the factory calibration.
However, for a R&S ZNA that was factory calibrated with a firmware version < 2.0, an
upgrade to a firmware version ≥ 2.0 makes the factory calibration slightly less accurate.
A changed signal path in firmware versions ≥ 2.0 can result in an offset of approximately 0.3 dB for uncalibrated wave measurements. Calibrated measurements are not
affected. The offset can be eliminated by a new factory calibration at Rohde&Schwarz
service.
Downgrade to a firmware version < 1.90
Instruments shipped with a REFBOARD version > 001_000_000 cannot be downgraded to a firmware version < 1.90 simply by executing the related firmware setup file.
Please contact R&S service if you plan such a downgrade.
71Getting Started 1178.6456.02 ─ 21
Page 72

R&S®ZNA
7.2 Remote operation in a LAN
A LAN connection is used to integrate the analyzer into a home/company network.
LAN connectivity offers several applications, e.g.:
●
Transfer data between a controller and the analyzer, e.g. to run a remote control
program.
●
Control the measurement from a remote computer using Remote Desktop or a similar application.
●
Use external network devices (e.g. printers).
The analyzer uses a user name and password as credentials for remote access; see
note on "User accounts and password protection" on page 19 for details. To protect the
analyzer from unauthorized access, it is recommended to change the factory setting.
7.2.1 Assigning an IP address
Depending on the network capacities, the TCP/IP address information for the analyzer
can be obtained in different ways.
●
If the network supports dynamic TCP/IP configuration using the Dynamic Host
Configuration Protocol (DHCP), all address information can be assigned automatically.
●
If the network does not support DHCP, or if the analyzer is set to use alternate
TCP/IP configuration, the addresses must be set manually.
Administrative tasks
Remote operation in a LAN
By default, the analyzer is configured to use dynamic TCP/IP configuration and obtain
all address information automatically. Hence it is safe to establish a physical connection to the LAN without any previous analyzer configuration.
Manual TCP/IP configuration
If your network does not support DHCP, or if you choose to disable dynamic TCP/IP
configuration, you must assign valid address information before you connect the analyzer to the LAN. Contact your network administrator to obtain a valid IP address,
because connection errors can affect the entire network.
Admin account
You need administrator rights to change the TCP/IP configuration. See note on "User
accounts and password protection" on page 19 for details.
To enter the TCP/IP address information manually
1. Obtain the IP address and subnet mask for the analyzer and the IP address for the
local default gateway from your network administrator. If necessary, also obtain the
name of your DNS domain and the IP addresses of the DNS and WINS servers on
your network.
72Getting Started 1178.6456.02 ─ 21
Page 73

R&S®ZNA
Administrative tasks
Remote operation in a LAN
2. Use the Windows icon in the toolbar (or the Windows key on an external keyboard)
to access Windows®.
3. Open the "Control Panel" > "Network and Sharing Center" > "Change adapter settings" dialog and right-click the local connection.
4. Select "Properties" and confirm the user account control message, depending on
your current user account.
● If your current account is an administrator account, select "Yes".
● If your account is an account with standard user rights, enter the password of
the administrator account and select "Yes".
Figure 7-1: User Account Control dialog
5. In the "Connection Properties" dialog opened, select "Internet Protocol Version 4
(TCP/IPv4) > Properties" and enter the IP address information.
73Getting Started 1178.6456.02 ─ 21
Page 74

R&S®ZNA
Administrative tasks
Remote operation in a LAN
7.2.2 Using computer names
In a LAN that uses a DNS server (Domain Name System server), each PC or instrument connected in the LAN can be accessed via an unambiguous computer name
instead of the IP address. The DNS server translates the host name to the IP address,
which is especially useful when a DHCP server is used, as a new IP address can be
assigned each time the instrument is restarted.
Each instrument is delivered with an assigned computer name, but this name can be
changed. The default instrument name is a case-insensitive string with the following
syntax:
ZNA<26|43|67>-<serial_number>
The serial number can be found on the rear panel of the instrument. It is the third part
of the device ID printed on the bar code sticker:
ZNA43-102030, for example
74Getting Started 1178.6456.02 ─ 21
Page 75

R&S®ZNA
Administrative tasks
Remote operation in a LAN
7.2.3 Remote Desktop connection
Remote Desktop is a Windows® application which you can use to access and control
the analyzer from a remote computer through a LAN connection. While the measurement is running, the analyzer screen contents are displayed on the remote computer,
and Remote Desktop provides access to all applications, files, and network resources
of the analyzer.
At the R&S ZNA, by default remote connections are enabled using a local group policy
and remote access is granted to users instrument and administrator.
For detailed information about Remote Desktop and the connection, refer to the Windows® Help ("Windows Start Menu > Help and Support").
To establish a remote desktop connection, proceed as follows:
1. Connect remote Windows PC and VNA to the LAN and make sure that an IP connection can be established.
7.2.4
2. At the remote Windows PC, open a remote desktop connection (type Remote
Desktop Connection at the Windows Start/Search menu and hit enter).
3. In the "Remote Desktop Connection" dialog, enter the VNA's computer name or IP
address and select "Connect"
Windows
®
firewall settings
A firewall protects an instrument by preventing unauthorized users from gaining access
to it through a network. In the default configuration of the R&S ZNA, the firewall is
enabled. A remote desktop connection does not require any changes in the firewall
settings.
Admin account
You need administrator rights to change the firewall settings. See note on "User
accounts and password protection" on page 19 above for details.
Some actions require a different firewall configuration, e.g.:
●
To transfer data with other hosts in the LAN, you have to allow "File and Printer
Sharing".
To change the firewall settings, proceed as follows:
1.
Access the operating system by pressing the Windows® key on the external keyboard. Open the "Control Panel".
2. Select "Windows Defender Firewall"
● Select "Allow an app or feature through Windows Defender Firewall" to enable
"File and Printer Sharing".
75Getting Started 1178.6456.02 ─ 21
Page 76

R&S®ZNA
Administrative tasks
Remote operation in a LAN
● Select "Turn Windows Firewall on or off" to enable or disable the firewall.
Confirm the user account control message to allow the desired changes (see Fig-
ure 7-1). For detailed information about the firewall, refer to the Windows® Help.
76Getting Started 1178.6456.02 ─ 21
Page 77

R&S®ZNA
Contacting customer support
8 Contacting customer support
Technical support – where and when you need it
For quick, expert help with any Rohde & Schwarz product, contact our customer support center. A team of highly qualified engineers provides support and works with you
to find a solution to your query on any aspect of the operation, programming or applications of Rohde & Schwarz products.
Contact information
Contact our customer support center at www.rohde-schwarz.com/support, or follow this
QR code:
Figure 8-1: QR code to the Rohde & Schwarz support page
77Getting Started 1178.6456.02 ─ 21
Page 78

R&S®ZNA
Index
Index
A
AC supply .......................................................................... 16
Accessories (connect) ....................................................... 21
Administrative tasks .......................................................... 71
Application cards ............................................................... 12
Application notes ............................................................... 12
Auto scale ......................................................................... 58
B
Basic tasks ........................................................................ 33
Brochures .......................................................................... 12
C
Channel keys .................................................................... 26
Circular diagrams .............................................................. 59
Computer name
Changing .................................................................... 74
Control elements ............................................................... 37
Customer support .............................................................. 77
D
Data entry .......................................................................... 51
Data Entry panel ............................................................... 27
Data sheets ....................................................................... 12
Data Streaming ................................................................. 31
Device Control ................................................................... 31
DHCP server
LAN configuration ....................................................... 74
Diagram ............................................................................. 47
Dialogs .............................................................................. 45
Direct Control Interface ..................................................... 31
Direct IF Access ................................................................ 31
Display .............................................................................. 25
Display Port ....................................................................... 31
DNS server
LAN configuration ....................................................... 74
Drag and drop ................................................................... 50
DVI
Digital only .................................................................. 31
E
EMI suppression ............................................................... 15
Evaluation of data ............................................................. 67
External Data Logger
Connector ................................................................... 31
External Handler IO
Connector ................................................................... 31
F
Factory calibration ............................................................. 71
Firewall .............................................................................. 75
Firmware
Setup file ..................................................................... 71
Firmware installation ......................................................... 71
Front panel ........................................................................ 24
Front panel keys ................................................................ 33
Function keys .................................................................... 26
Channel section .......................................................... 26
Stimulus section .......................................................... 26
System section ........................................................... 26
Trace section .............................................................. 26
G
Getting started ................................................................... 11
GPIB Interface ................................................................... 31
GPIO Interface .................................................................. 31
Graphic zoom .................................................................... 55
Ground connector ............................................................. 31
H
Handler I/O
External ....................................................................... 31
Hardkey panel ................................................................... 42
I
IEEE 488 Interface ............................................................ 31
Instrument calibration ........................................................ 64
Instrument security procedures ......................................... 12
Instrument tour .................................................................. 24
IP address setting ............................................................. 72
K
Keyboard ........................................................................... 21
L
LAN ................................................................................... 31
connection .................................................................. 22
Remote operation ....................................................... 72
M
Marker ............................................................................... 47
set by .......................................................................... 59
Measurement examples .................................................... 62
Menu bar ........................................................................... 40
Menus ............................................................................... 41
Minimize application .......................................................... 20
Monitor .............................................................................. 21
DisplayPort ................................................................. 31
DVI-D .......................................................................... 31
Mouse ............................................................................... 21
N
Navigation tools ................................................................. 37
Numeric Editor (dialog) ..................................................... 52
O
OCXO Frequency Reference ............................................ 18
On-screen keyboard
analyzer ...................................................................... 53
Windows ..................................................................... 54
Operating system .............................................................. 18
78Getting Started 1178.6456.02 ─ 21
Page 79

R&S®ZNA
Index
Option
R&S ZNA-B4 ............................................................... 18
R&S ZNA-B7 ............................................................... 31
R&S ZNA-B15 (RFFE GPIO Interface) ....................... 31
R&S ZNA-B19 ............................................................. 31
R&S ZNA-B26 (Direct IF Access) ............................... 31
R&S ZNA-B91 ............................................................. 31
R&S ZNBT-Z14 ........................................................... 31
P
Password .......................................................................... 72
PCIe Interface ................................................................... 31
Power on and off ............................................................... 17
Printer ................................................................................ 22
Printing data ...................................................................... 68
Pulse Modulator Control
Connectors ................................................................. 31
R
R&S ZNA-B4 ..................................................................... 18
R&S ZNA-B7 ..................................................................... 31
R&S ZNA-B15 (RFFE GPIO Interface) ............................. 31
R&S ZNA-B19 ................................................................... 31
R&S ZNA-B26 (Direct IF Access) ..................................... 31
R&S ZNA-B91 ................................................................... 31
R&S ZNBT-Z14 ................................................................. 31
Rear panel ................................................................... 30, 31
Rear Panel
Optional Elements ...................................................... 31
Reference Clock (In/Out)
Connectors ................................................................. 31
Reference position ............................................................ 58
Reference value ................................................................ 58
Reflection measurement (example) .................................. 69
Release notes ................................................................... 12
Remote desktop ................................................................ 75
Removable System Drive .................................................. 31
RFFE Interface .................................................................. 31
Touchscreen ...................................................................... 25
Trace ................................................................................. 47
Trace keys ......................................................................... 26
Transmission measurement (example) ............................. 62
Trigger In
Connector ................................................................... 31
Trigger In/Out
Connectors ................................................................. 31
U
USB
front panel ................................................................... 30
USB Device ....................................................................... 31
USB Host
rear panel .................................................................... 31
User Port
Connector ................................................................... 31
V
Virus protection ................................................................. 72
W
White papers ..................................................................... 12
Windows ............................................................................ 18
Z
Zoom ................................................................................. 55
S
Safety instructions ......................................................... 7, 12
Saving data ....................................................................... 68
Scaling diagrams ............................................................... 55
Screen saver ..................................................................... 25
Security procedures .......................................................... 12
Service manual .................................................................. 11
Softtools ............................................................................ 40
Standby and ready state ................................................... 18
Standby key ...................................................................... 28
Startup and shutdown ....................................................... 17
Status bar .......................................................................... 43
Step Size (dialog) .............................................................. 53
Stimulus keys .................................................................... 26
Sweep range selection ...................................................... 63
Sweep range setting ......................................................... 57
System .............................................................................. 26
System Drive ..................................................................... 31
System keys ...................................................................... 26
T
Test port ............................................................................ 29
Title bar ............................................................................. 38
Toolbar .............................................................................. 38
79Getting Started 1178.6456.02 ─ 21
 Loading...