

Page 1
R&S®VSE-K96
OFDM Vector Signal Analysis
Application
User Manual
(;ÚçÞ2)
1176898002
User Manual
Version 02
Page 2

This manual applies to the following software, version 1.50 and later:
●
R&S®VSE Enterprise Edition base software (1320.7500.xx / 1320.7951.xx)
●
R&S®VSE Basic Edition base software (1345.1011.06)
The following software options are described:
●
R&S VSE-K96 (1320.7922.02)
© 2018 Rohde & Schwarz GmbH & Co. KG
Mühldorfstr. 15, 81671 München, Germany
Phone: +49 89 41 29 - 0
Fax: +49 89 41 29 12 164
Email: info@rohde-schwarz.com
Internet: www.rohde-schwarz.com
Subject to change – Data without tolerance limits is not binding.
R&S® is a registered trademark of Rohde & Schwarz GmbH & Co. KG.
Trade names are trademarks of the owners.
1176.8980.02 | Version 02 | R&S®VSE-K96
The following abbreviations are used throughout this manual: R&S®VSE is abbreviated as R&S VSE.
Page 3

R&S®VSE-K96
1.1 About this Manual......................................................................................................... 5
1.2 Typographical Conventions......................................................................................... 6
2.1 Introduction to Vector Signal Analysis....................................................................... 7
2.2 Starting the R&S VSE OFDM VSA application........................................................... 8
2.3 Understanding the Display Information......................................................................9
3.1 OFDM VSA Parameters...............................................................................................12
Contents
Contents
1 Preface.................................................................................................... 5
2 Welcome to the OFDM Vector Signal Analysis (VSA) Application
................................................................................................................. 7
3 OFDM VSA Measurement and Results...............................................12
3.2 Evaluation Methods for OFDM VSA Measurements................................................ 13
4 Measurement Basics........................................................................... 27
4.1 General Information on OFDM Signals..................................................................... 27
4.2 Signal Processing....................................................................................................... 34
5 Configuring OFDM VSA Measurements.............................................38
5.1 Configuration Overview..............................................................................................38
5.2 Signal Description.......................................................................................................40
5.3 Input and Frontend Settings...................................................................................... 43
5.4 Trigger Settings...........................................................................................................58
5.5 Data Acquisition..........................................................................................................61
5.6 Burst Search................................................................................................................64
5.7 Result Ranges............................................................................................................. 64
5.8 Synchronization, Demodulation and Tracking.........................................................65
5.9 Adjusting Settings Automatically..............................................................................69
6 Creating a Configuration File Using the R&S VSE-K96 Configura-
tion File Wizard.....................................................................................72
6.1 Understanding the R&S VSE-K96 Configuration File Wizard Display....................73
6.2 Configuration Steps....................................................................................................79
6.3 Reference of Wizard Menu Functions....................................................................... 86
6.4 Example: Creating a Configuration File from an Input Signal................................ 89
3User Manual 1176.8980.02 ─ 02
Page 4

R&S®VSE-K96
7.1 Result Configuration...................................................................................................97
7.2 Table Configuration.....................................................................................................99
7.3 Units........................................................................................................................... 100
7.4 Y-Scaling....................................................................................................................100
7.5 Markers...................................................................................................................... 102
7.6 Trace Settings............................................................................................................108
7.7 Trace / Data Export Configuration...........................................................................109
9.1 Introduction............................................................................................................... 114
Contents
7 Analyzing OFDM Vector Signals.........................................................97
8 How to Perform Measurements in the R&S VSE OFDM VSA applica-
tion.......................................................................................................112
9 Remote Commands for OFDM VSA..................................................114
9.2 Common Suffixes......................................................................................................119
9.3 Activating OFDM VSA Measurements.....................................................................119
9.4 Configuring OFDM VSA............................................................................................120
9.5 Analysis..................................................................................................................... 158
9.6 Configuring the Result Display................................................................................182
9.7 Retrieving Results.....................................................................................................192
9.8 Status Reporting System......................................................................................... 215
9.9 Deprecated Commands............................................................................................ 218
9.10 Programming Examples: OFDM Vector Signal Analysis.......................................220
Annex.................................................................................................. 224
A Menu Reference................................................................................. 225
A.1 Common R&S VSE Menus....................................................................................... 225
A.2 OFDM Vector Signal Analysis Menus......................................................................227
B Reference of Toolbar Functions....................................................... 230
C Formulae.............................................................................................234
C.1 Error Vector Magnitude (EVM)................................................................................. 234
C.2 I/Q Impairments......................................................................................................... 235
List of Remote Commands (OFDM VSA)......................................... 236
Index....................................................................................................241
4User Manual 1176.8980.02 ─ 02
Page 5

R&S®VSE-K96
1 Preface
1.1 About this Manual
Preface
About this Manual
This R&S VSE OFDM VSA User Manual provides all the information specific to the
application. All general software functions and settings common to all applications
and operating modes are described in the R&S VSE Base Software User Manual.
The main focus in this manual is on the measurement results and the tasks required to
obtain them. The following topics are included:
●
Welcome to the R&S VSE OFDM VSA application Application
Introduction to and getting familiar with the application
●
Measurements and Result Displays
Details on supported measurements and their result types
●
Measurement Basics
Background information on basic terms and principles in the context of the measurement
●
Configuration + Analysis
A concise description of all functions and settings available to configure measurements and analyze results with their corresponding remote control command
●
How to Perform Measurements in the R&S VSE OFDM VSA application Application
The basic procedure to perform each measurement and step-by-step instructions
for more complex tasks or alternative methods
●
Measurement Examples
Detailed measurement examples to guide you through typical measurement scenarios and allow you to try out the application immediately
●
Optimizing and Troubleshooting the Measurement
Hints and tips on how to handle errors and optimize the measurement configuration
●
Remote Commands for R&S VSE OFDM VSA application Measurements
Remote commands required to configure and perform R&S VSE OFDM VSA application measurements in a remote environment, sorted by tasks
(Commands required to set up the environment or to perform common tasks in the
software are provided in the R&S VSE Base Software User Manual)
Programming examples demonstrate the use of many commands and can usually
be executed directly for test purposes
●
Annex
Reference material
●
List of remote commands
Alphabetical list of all remote commands described in the manual
●
Index
5User Manual 1176.8980.02 ─ 02
Page 6
R&S®VSE-K96
1.2 Typographical Conventions
Preface
Typographical Conventions
The following text markers are used throughout this documentation:
Convention Description
"Graphical user interface elements"
[Keys] Key and knob names are enclosed by square brackets.
File names, commands,
program code
Input Input to be entered by the user is displayed in italics.
Links Links that you can click are displayed in blue font.
"References" References to other parts of the documentation are enclosed by quota-
All names of graphical user interface elements on the screen, such as
dialog boxes, menus, options, buttons, and softkeys are enclosed by
quotation marks.
File names, commands, coding samples and screen output are distinguished by their font.
tion marks.
6User Manual 1176.8980.02 ─ 02
Page 7

R&S®VSE-K96
2 Welcome to the OFDM Vector Signal Analy-
Welcome to the OFDM Vector Signal Analysis (VSA) Application
Introduction to Vector Signal Analysis
sis (VSA) Application
The R&S VSE OFDM VSA application performs vector and scalar measurements on
digitally modulated OFDM signals. To perform the measurements it converts RF signals into the complex baseband.
The R&S VSE OFDM VSA application features:
●
Analysis of non-standard and standard-conform OFDM systems
●
I/Q-based measurement results such as EVM, constellation diagrams, power spectrum
This user manual contains a description of the functionality that the application provides, including remote control operation.
Functions that are not discussed in this manual are the same as in the I/Q Analyzer
application and are described in the R&S VSE base software user manual. The latest
version is available for download at the product homepage http://www.rohde-
schwarz.com/product/VSE.html.
● Introduction to Vector Signal Analysis.......................................................................7
● Starting the R&S VSE OFDM VSA application......................................................... 8
● Understanding the Display Information.....................................................................9
2.1 Introduction to Vector Signal Analysis
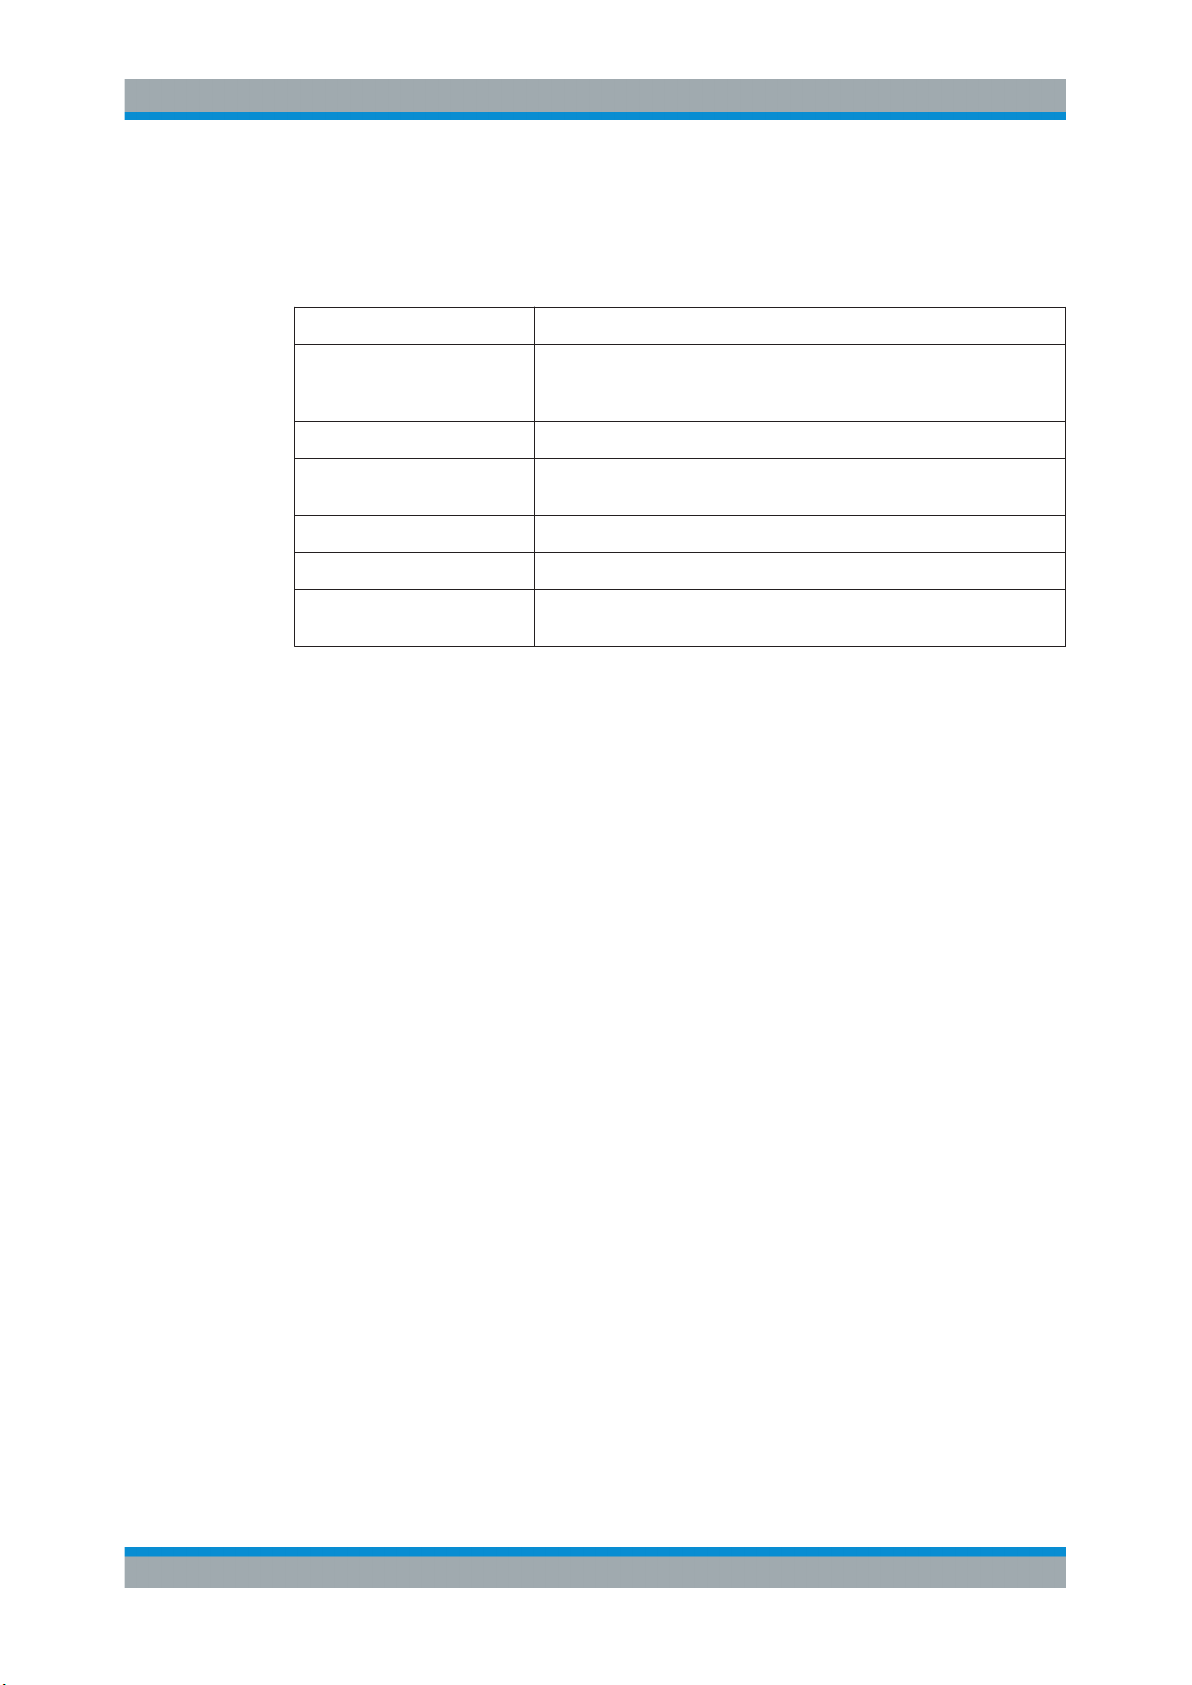
The goal of vector signal analysis is to determine the quality of the signal that is transmitted by the device under test (DUT) by comparing it against an ideal signal. The DUT
is usually connected with the analyzer via a cable. The key task of the analyzer is to
determine the ideal signal. Hence, the analyzer aims to reconstruct the ideal signal
from the measured signal that is transmitted by the DUT. This ideal signal is commonly
referred to as the reference signal, while the signal from the DUT is called the mea-
surement signal.
After extracting the reference signal, the R&S VSE OFDM VSA application compares
the measurement signal and the reference signal, and the results of this comparison
are displayed.
Example:
The most common vector signal analysis measurement is the EVM (Error Vector Magnitude) measurement. Here, the complex baseband reference signal is subtracted from
the complex baseband measurement signal. The magnitude of this error vector represents the EVM value. The EVM has the advantage that it "summarizes" all potential
errors and distortions in one single value. If the EVM value is low, the signal quality of
the DUT is high.
7User Manual 1176.8980.02 ─ 02
Page 8
R&S®VSE-K96
2.2 Starting the R&S VSE OFDM VSA application
Welcome to the OFDM Vector Signal Analysis (VSA) Application
Starting the R&S VSE OFDM VSA application
Figure 2-1: Simplified schema of vector signal analysis
OFDM Vector Signal Analysis is a separate application on the R&S VSE. It is activated
by creating a new measurement channel in OFDM VSA mode.
To activate the R&S VSE OFDM VSA application
1.
Select the "Add Channel" function in the Sequence tool window.
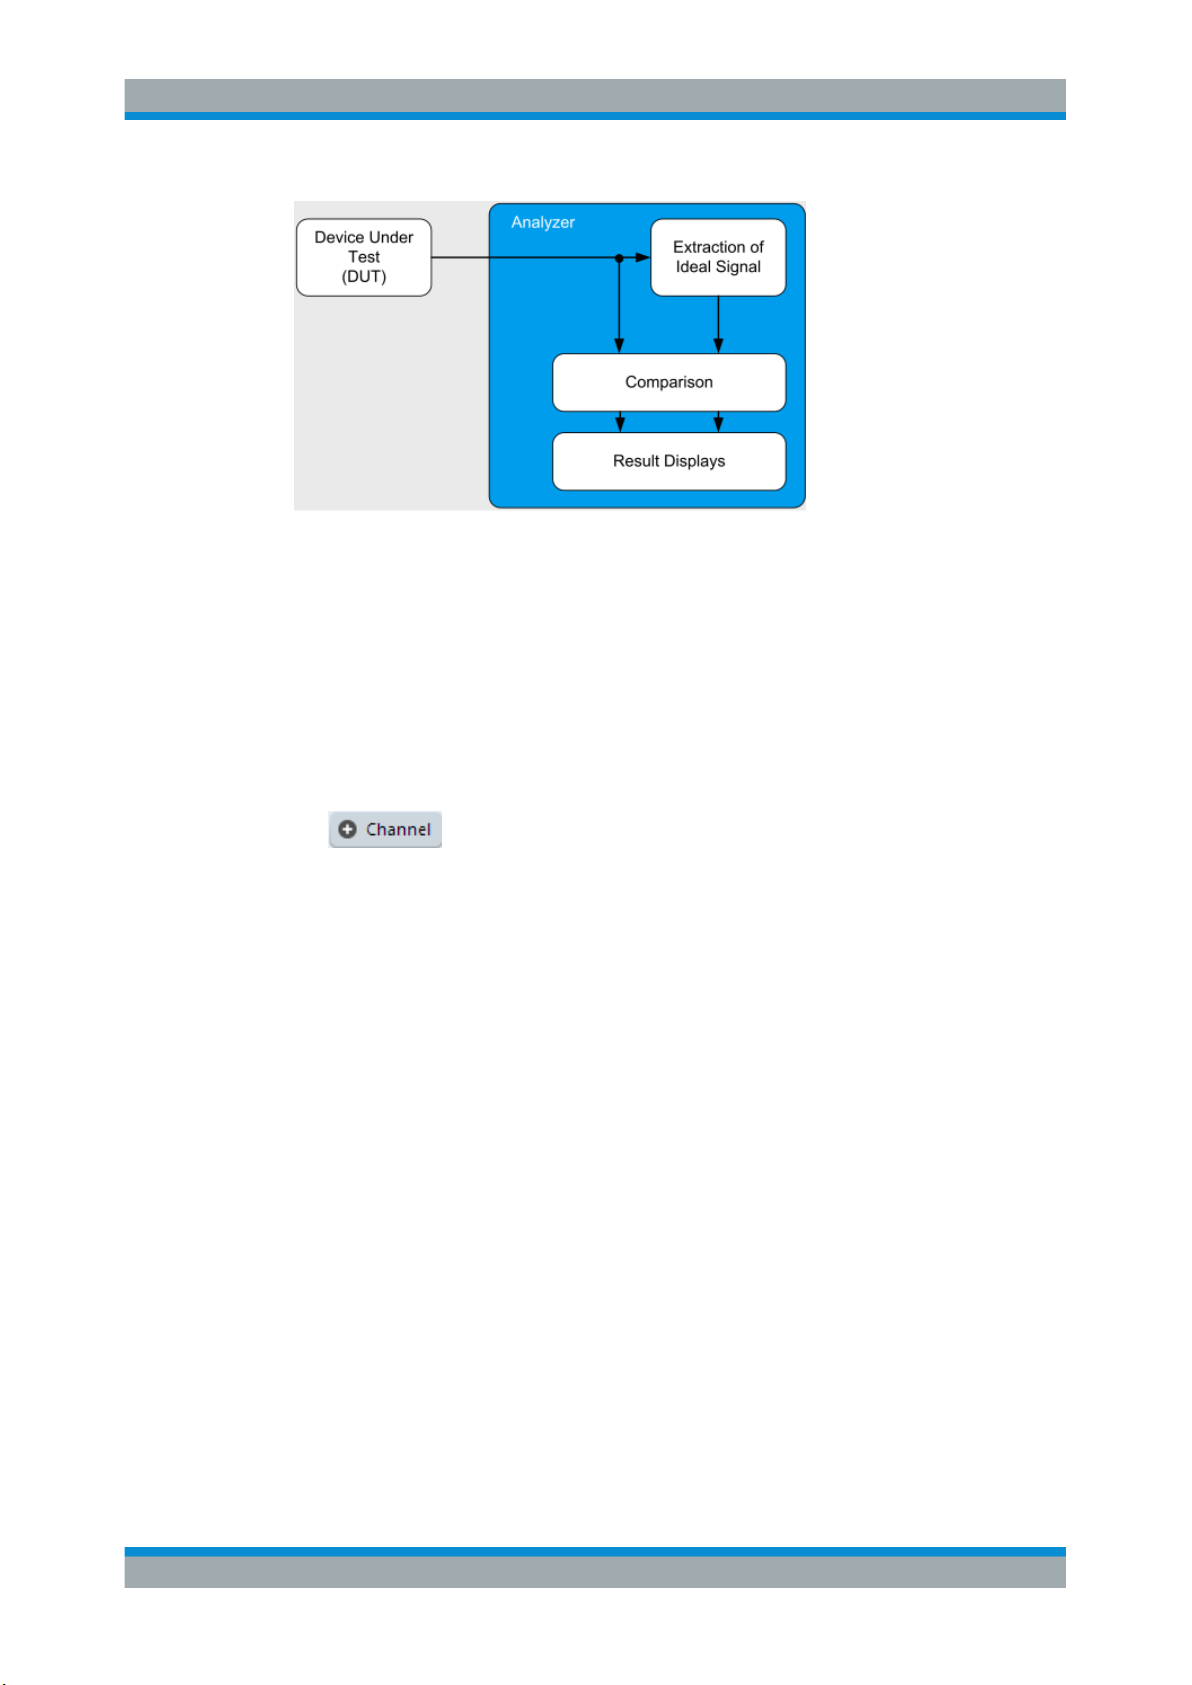
A dialog box opens that contains all operating modes and applications currently
available in your R&S VSE.
8User Manual 1176.8980.02 ─ 02
Page 9
R&S®VSE-K96
Welcome to the OFDM Vector Signal Analysis (VSA) Application
Understanding the Display Information
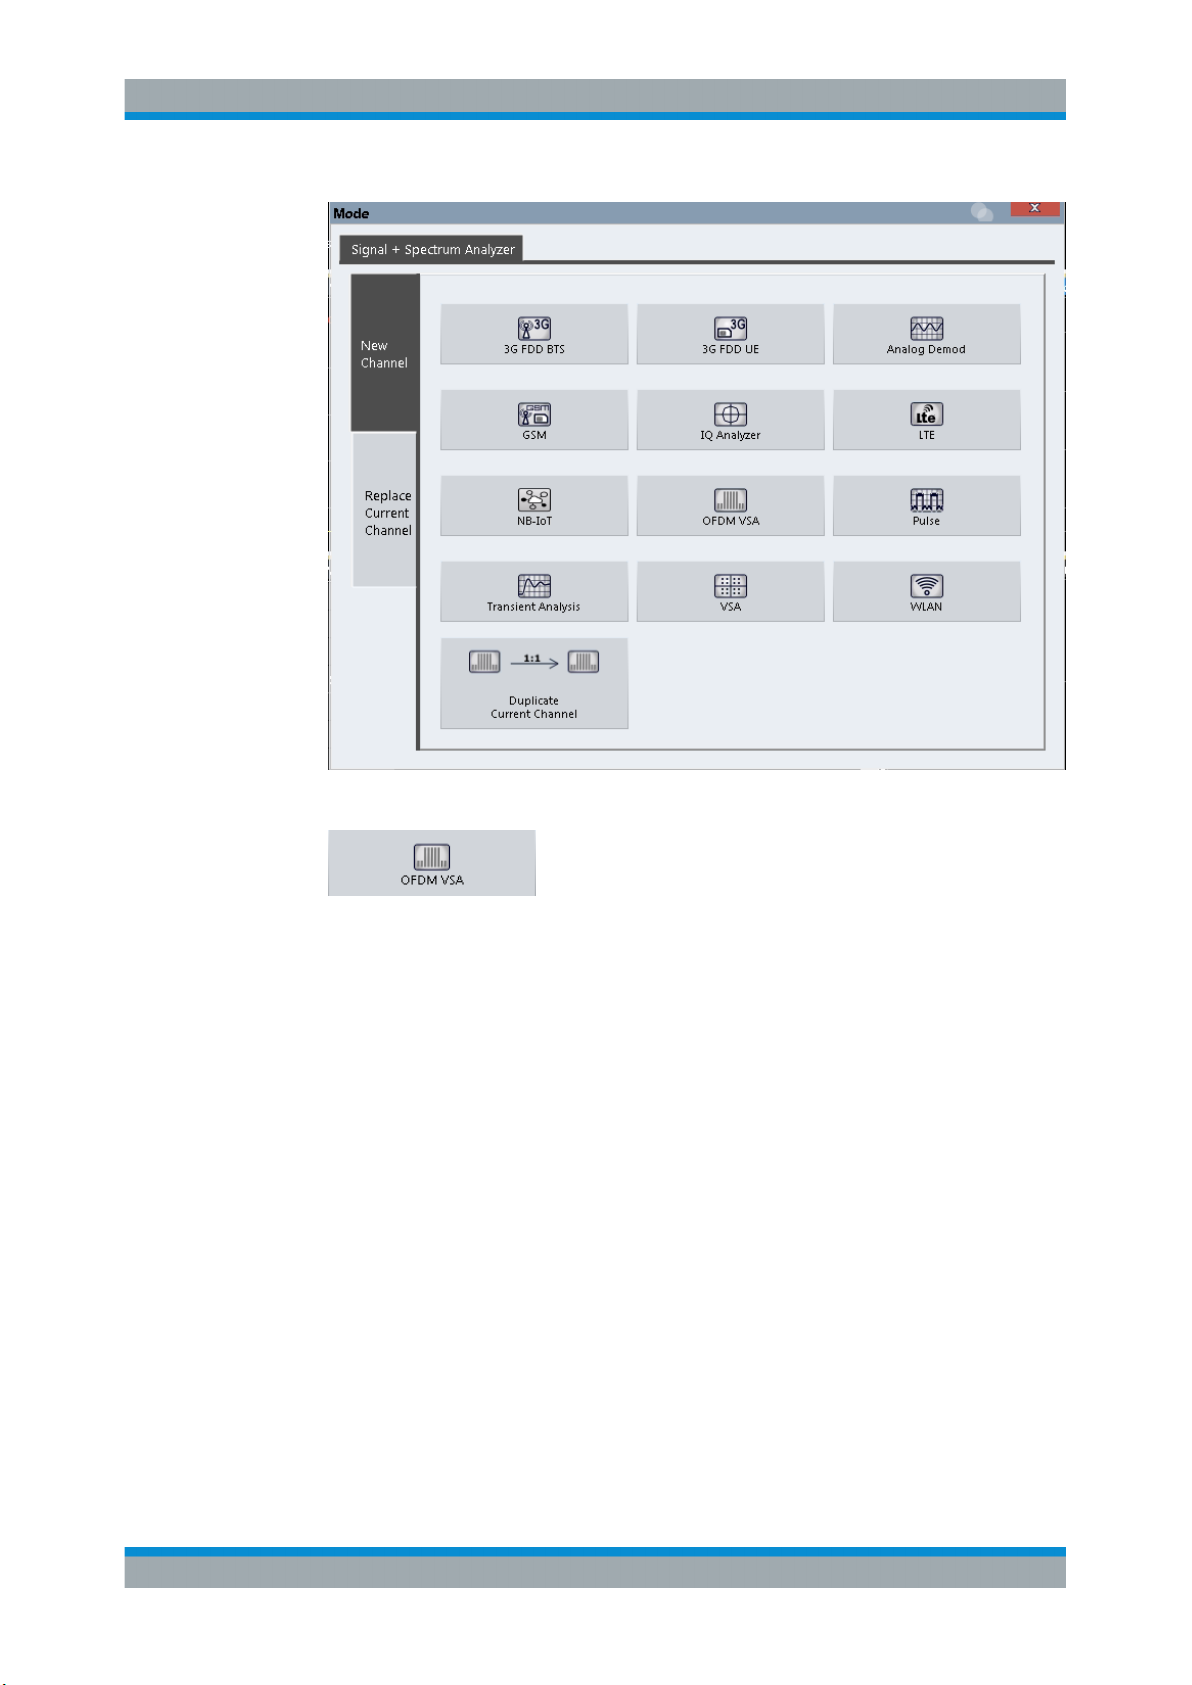
2. Select the "OFDM VSA" item.
The R&S VSE opens a new measurement channel for the R&S VSE OFDM VSA
application.
2.3 Understanding the Display Information
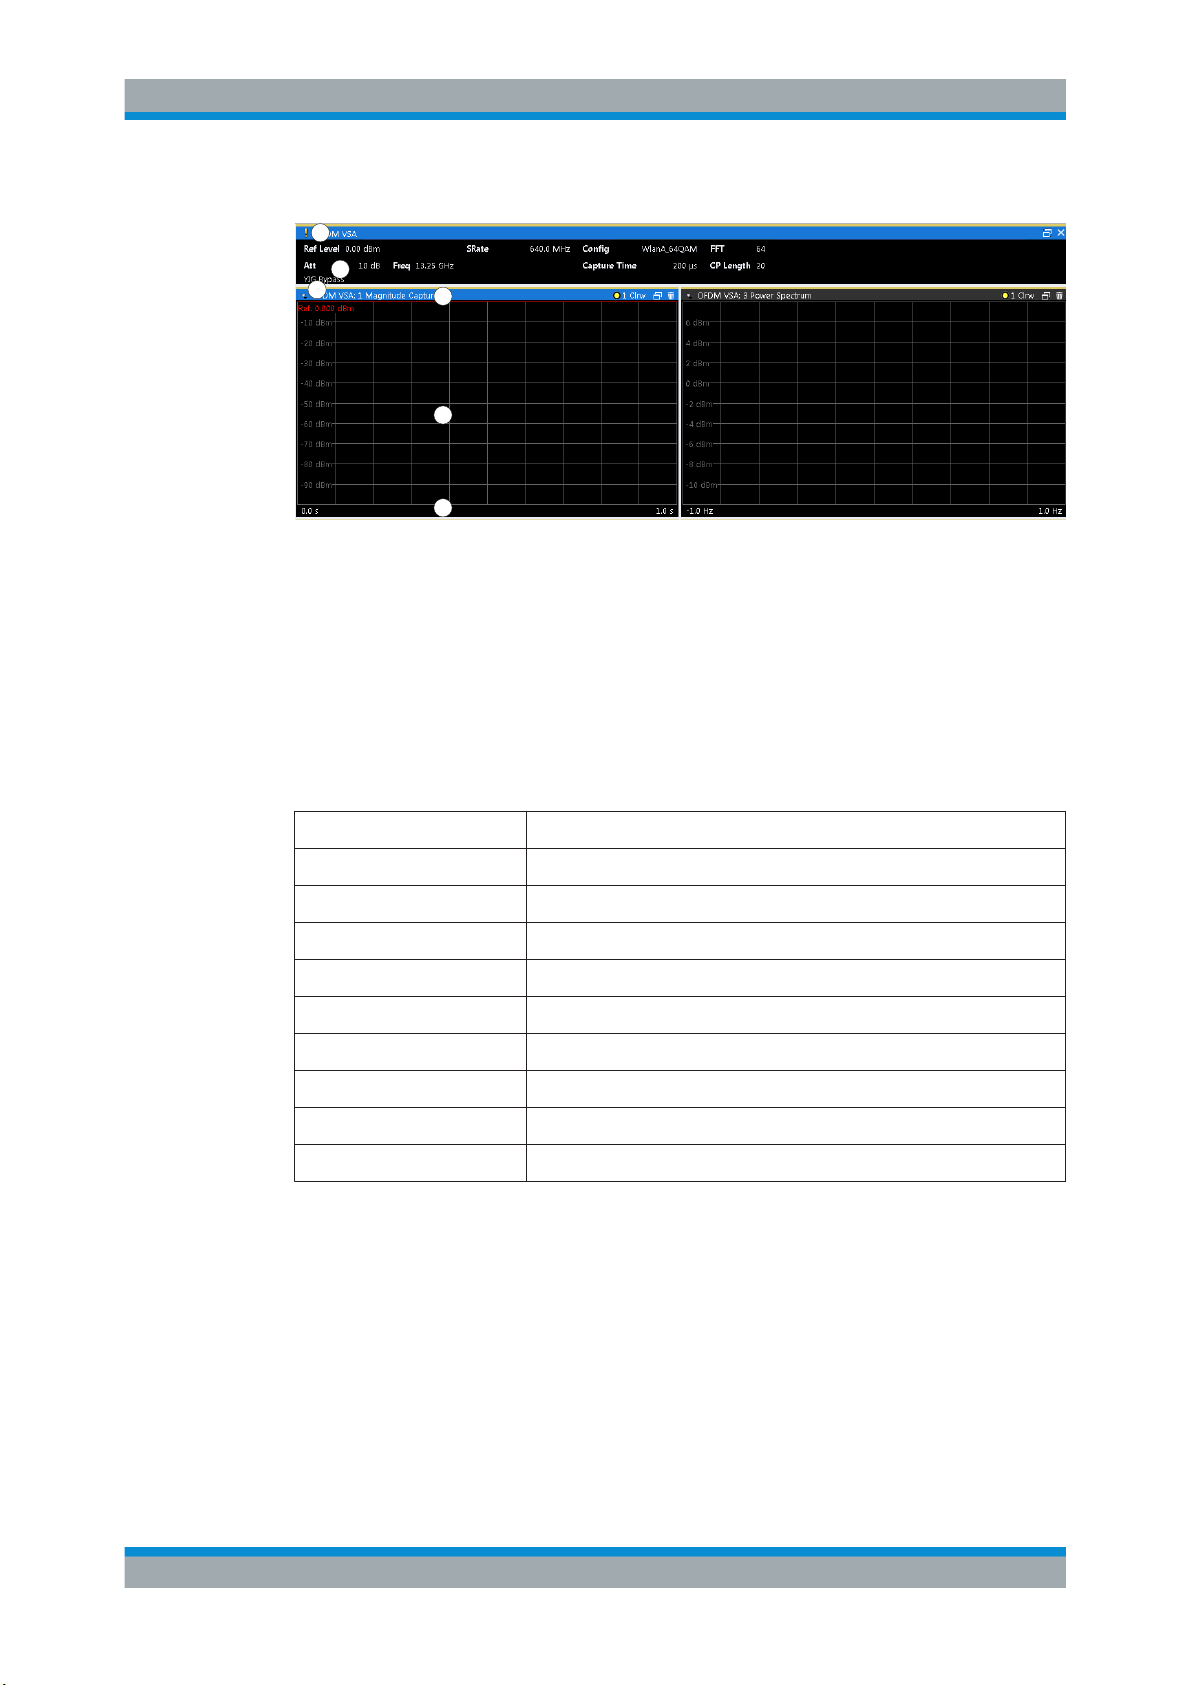
The following figure shows a measurement diagram during analyzer operation. All different information areas are labeled. They are explained in more detail in the following
sections.
9User Manual 1176.8980.02 ─ 02
Page 10
R&S®VSE-K96
Welcome to the OFDM Vector Signal Analysis (VSA) Application
Understanding the Display Information
1
2
1
1 = Color coding for windows of same channel
2 = Channel bar with measurement settings
3 = Window title bar with diagram-specific (trace) information
4 = Diagram area
5 = Diagram footer with diagram-specific information, depending on result display
3
4
5
Channel bar information
In the R&S VSE OFDM VSA application, the R&S VSE shows the following settings:
Table 2-1: Information displayed in the channel bar in R&S VSE OFDM VSA application application
Ref Level Reference level
Att Mechanical and electronic RF attenuation
Freq Center frequency for the RF signal
Offset Reference level offset
SRate Sample Rate
Config Currently loaded configuration file
Capture Time How long data was captured in current sweep
FFT FFT size
CP Length Cyclic prefix length
Trigger to Frame Offset between the trigger event and the start of the OFDM frame
In addition, the channel bar also displays information on instrument settings that affect
the measurement results even though this is not immediately apparent from the display
of the measured values (e.g. transducer or trigger settings). This information is displayed only when applicable for the current measurement. For details see the
R&S VSE Base Software User Manual.
Window title bar information
For each diagram, the header provides the following information:
10User Manual 1176.8980.02 ─ 02
Page 11

R&S®VSE-K96
Welcome to the OFDM Vector Signal Analysis (VSA) Application
Understanding the Display Information
0
21 64 75
Figure 2-2: Window title bar information in R&S VSE OFDM VSA application
0 = Color coding for windows of same channel
1 = Edit result display function
2 = Channel name
3 = Window number
4 = Window type
5 = Trace color, trace number, trace mode
6 = Dock/undock window function
7 = Close window function
3
Diagram area
The diagram area displays the results according to the selected result displays (see
Chapter 3.2, "Evaluation Methods for OFDM VSA Measurements", on page 13).
Diagram footer information
The diagram footer (beneath the diagram) contains the start and stop symbols or time
of the evaluation range.
Status bar information
The software status, errors and warnings and any irregularities in the software are indicated in the status bar at the bottom of the R&S VSE window.
11User Manual 1176.8980.02 ─ 02
Page 12
R&S®VSE-K96
3 OFDM VSA Measurement and Results
OFDM VSA Measurement and Results
OFDM VSA Parameters
For each measurement, a separate measurement channel is activated. Each measurement channel can provide multiple result displays, which are displayed in individual
windows. The measurement windows can be rearranged and configured in the
R&S VSE to meet your requirements. All windows that belong to the same measurement (including the channel bar) are indicated by a colored line at the top of the window title bar.
To add further result displays for the OFDM VSA channel
►
Select the
"Add Window" icon from the toolbar, or select the "Window > New
Window" menu item.
For details on working with channels and windows, see the "Operating Basics" chapter
in the R&S VSE base software user manual.
● OFDM VSA Parameters..........................................................................................12
● Evaluation Methods for OFDM VSA Measurements...............................................13
3.1 OFDM VSA Parameters
Several signal parameters are determined during vector signal analysis and displayed
in the Result Summary.
For details concerning the calculation of individual parameters, see Chapter C, "Formu-
lae", on page 234.
Table 3-1: OFDM VSA parameters
Parameter Description SCPI Parameter
EVM All [%/dB] Error Vector Magnitude of the payload symbols over all carri-
ers (except the guard carriers)
EVM Data Symbols
[%/dB]
Error Vector Magnitude of the payload symbols over all data
carriers
EVM[:ALL]
EVM:DATA
EVM Pilot Symbols
[%/dB]
MER [dB] Average Modulation Error Ratio (MER) for all data and all
I/Q offset [dB] Transmitter center frequency leakage relative to the total Tx
Gain imbalance
[%/dB]
*) Required to retrieve the parameter result, see FETCh:SUMM:<parameter>:<statistic>
on page 196
Error Vector Magnitude of the payload symbols over all pilot
carriers
pilot cells of the analyzed frames. The MER is the ratio of the
RMS power of the ideal reference signal to the RMS power
of the error vector.
channel power
Amplification of the quadrature phase component of the signal relative to the amplification of the in-phase component
EVM:PILot
MER[:ALL]
IQOFset
GIMBalance
12User Manual 1176.8980.02 ─ 02
Page 13
R&S®VSE-K96
OFDM VSA Measurement and Results
Evaluation Methods for OFDM VSA Measurements
Parameter Description SCPI Parameter
Quadrature error [°] Phase angle between Q-channel and I-channel deviating
from the ideal 90 degrees; measure for crosstalk from the Qbranch into the I-branch
Frequency Error [Hz] Frequency error between the signal and the currently defined
center frequency
The absolute frequency error includes the frequency error of
the connected instrument and that of the DUT. If possible,
the transmitter connected instrument and the DUT should be
synchronized (using an external reference).
See R&S VSE base software user manual > "Configuring
Instruments"
Sample Clock Error Clock error between the signal and the sample clock of the
R&S VSE in parts per million (ppm), i.e. the symbol timing
error
If possible, the transmitter connected instrument and the
DUT should be synchronized (using an external reference).
See R&S VSE base software user manual > "Configuring
Instruments"
Frame Power Average time domain power of the analyzed frame
Crest factor [dB] The ratio of the peak power to the mean power of the ana-
lyzed frame.
Trigger to Frame [s] (Displayed in channel bar only, not included in Result Sum-
mary.)
The time offset between the trigger event and the start of the
first OFDM frame
QUADerror
FERRor
SERRor
POWer
CRESt
FETCh:TTFRame?
*) Required to retrieve the parameter result, see FETCh:SUMM:<parameter>:<statistic>
on page 196
The R&S VSE OFDM VSA application also performs statistical evaluation over several
frames and displays the following results:
Table 3-2: Calculated summary results
Result type Description
Min Minimum measured value
Average Average measured value
Max Maximum measured value
3.2 Evaluation Methods for OFDM VSA Measurements
The data that was measured by the R&S VSE can be evaluated using various different
methods without having to start a new measurement. Which results are displayed
depends on the selected evaluation.
The OFDM VSA measurement provides the following evaluation methods:
13User Manual 1176.8980.02 ─ 02
Page 14
R&S®VSE-K96
OFDM VSA Measurement and Results
Evaluation Methods for OFDM VSA Measurements
Allocation Matrix............................................................................................................14
CCDF............................................................................................................................ 15
Channel Flatness.......................................................................................................... 15
Constellation Diagram...................................................................................................16
Constellation vs Carrier.................................................................................................17
Constellation vs Symbol................................................................................................17
EVM vs Carrier..............................................................................................................18
EVM vs Symbol.............................................................................................................18
EVM vs Symbol vs Carrier............................................................................................ 19
Group Delay..................................................................................................................20
Impulse Response........................................................................................................ 20
Magnitude Capture........................................................................................................21
Marker Table ................................................................................................................ 21
Power vs Carrier........................................................................................................... 22
Power vs Symbol.......................................................................................................... 22
Power vs Symbol vs Carrier..........................................................................................23
Power Spectrum............................................................................................................24
Result Summary............................................................................................................24
Signal Flow....................................................................................................................25
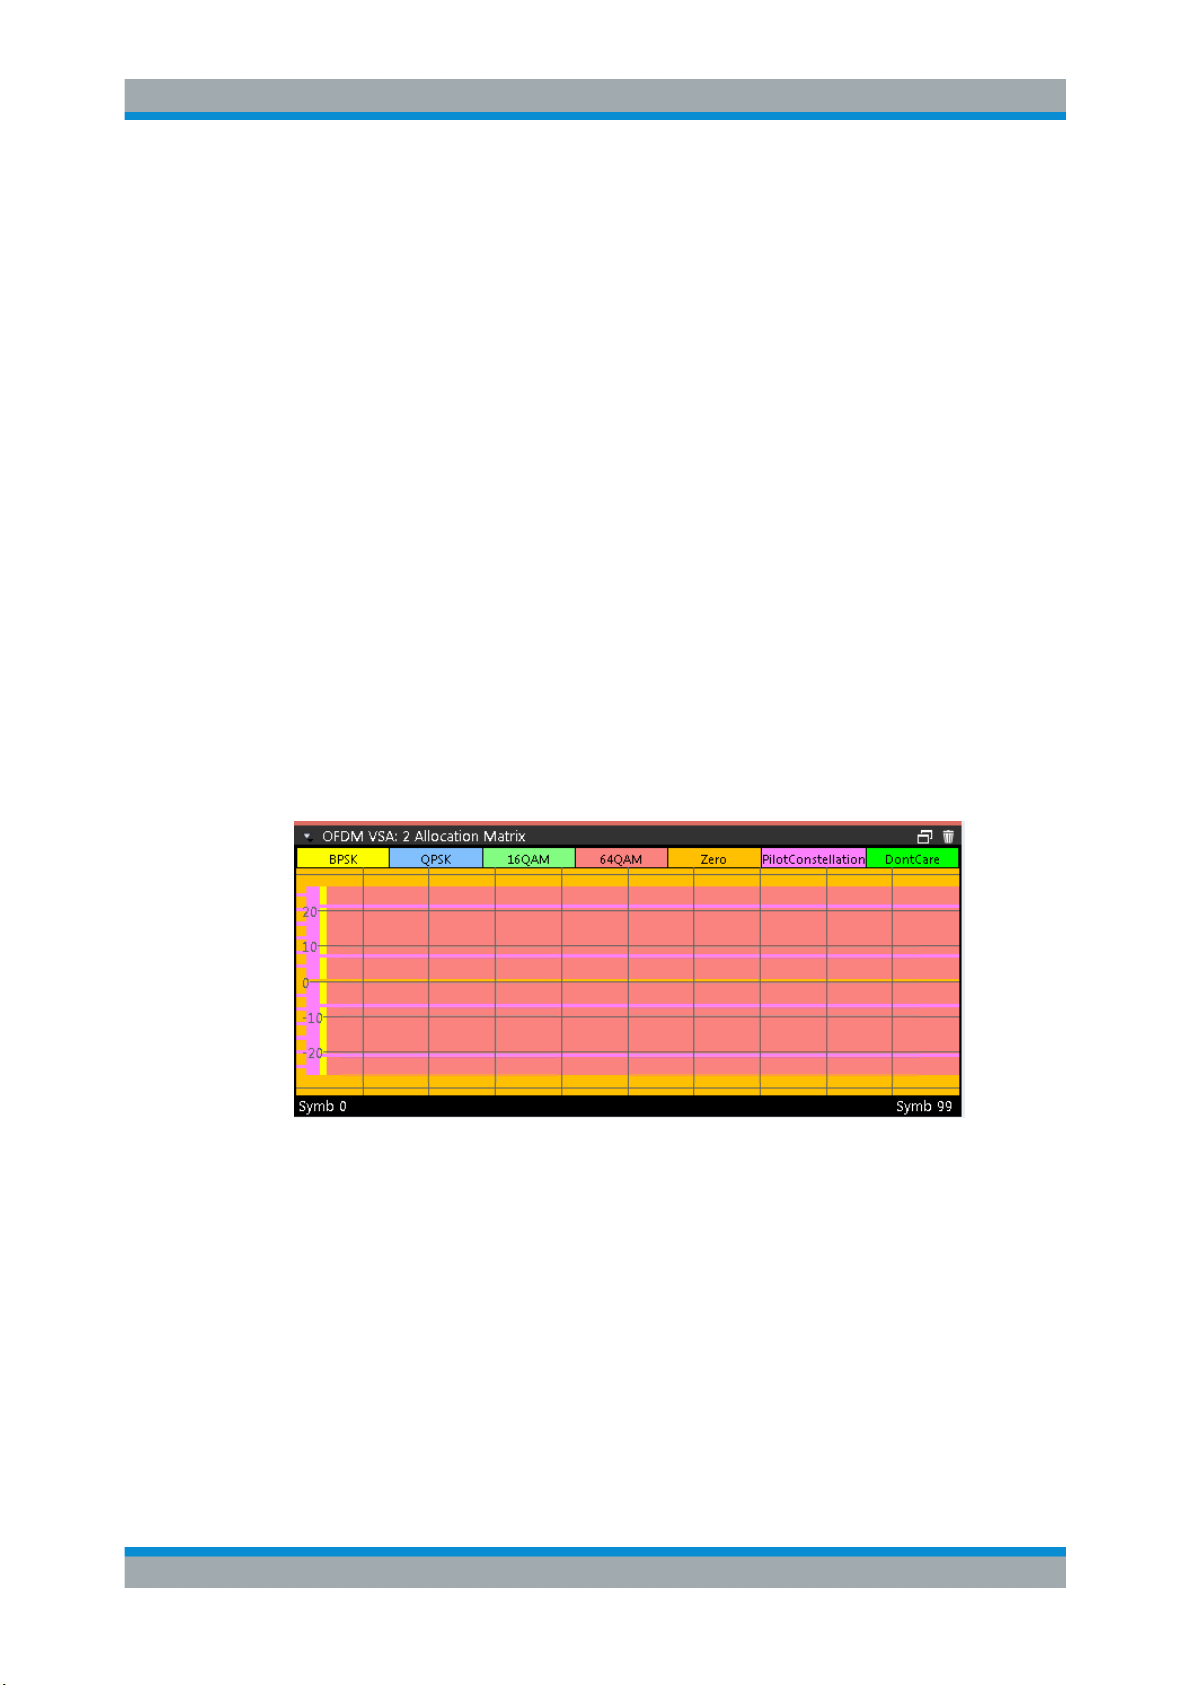
Allocation Matrix
The Allocation Matrix display is a graphical representation of the OFDM cell structure
defined in the currently loaded configuration file. Use markers to get more detailed
information on the individual cells.
Figure 3-1: Allocation Matrix
The legend for the color coding is displayed at the top of the matrix.
Remote command:
LAY:ADD? '1',RIGH,AMATrix, see LAYout:ADD[:WINDow]? on page 186
TRACe<n>[:DATA]? on page 205, see Chapter 9.7.4.1, "Allocation Matrix",
on page 209
TRACe<n>[:DATA]:X? on page 205
TRACe<n>[:DATA]:Y? on page 206
Symbol unit: UNIT:SAXes on page 166
14User Manual 1176.8980.02 ─ 02
Page 15
R&S®VSE-K96
OFDM VSA Measurement and Results
Evaluation Methods for OFDM VSA Measurements
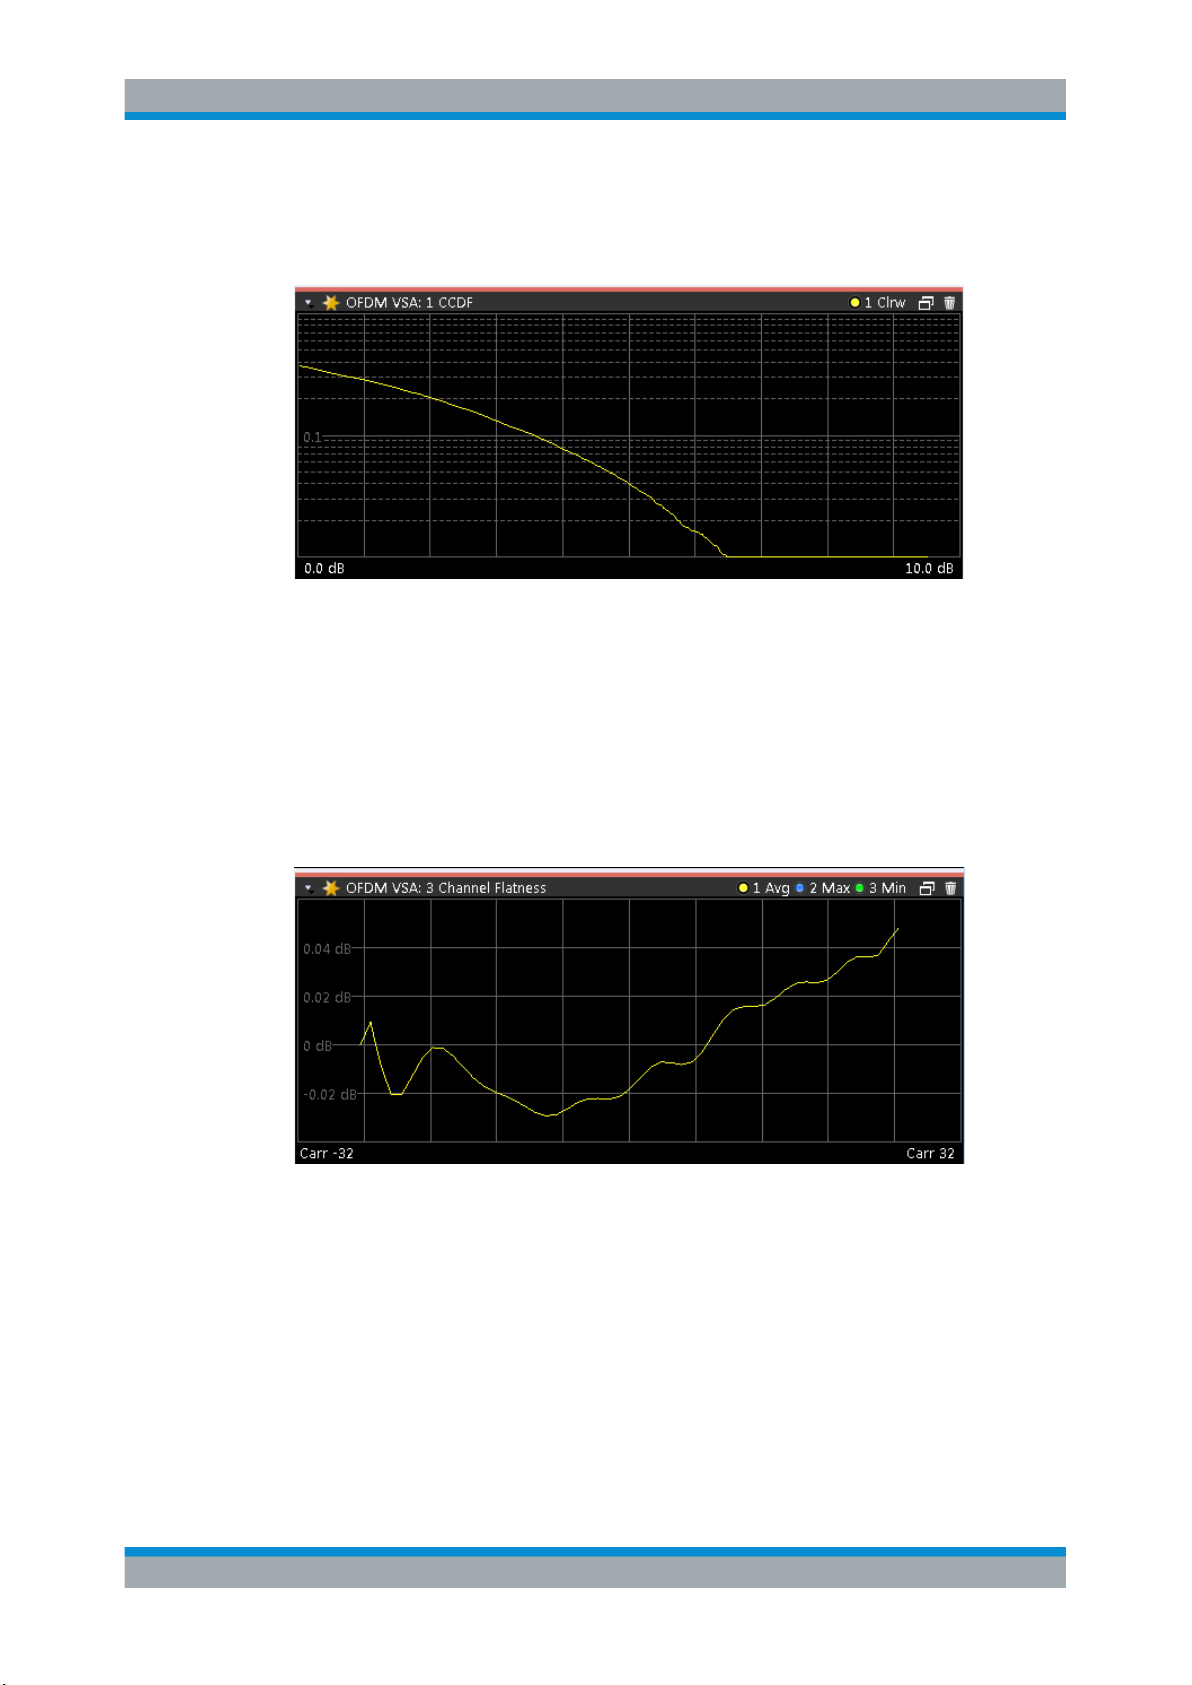
CCDF
The CCDF results display shows the probability of an amplitude exceeding the mean
power. The x-axis displays power relative to the measured mean power.
Figure 3-2: CCDF display
Remote command:
LAY:ADD? '1',RIGH,CCDF, see LAYout:ADD[:WINDow]? on page 186
TRACe:DATA?, see Chapter 9.7.4.2, "CCDF", on page 210
TRACe<n>[:DATA]:X? on page 205
Channel Flatness
The Channel Flatness display shows the amplitude of the channel transfer function vs.
carrier. The statistic is performed over all analyzed frames.
Figure 3-3: Channel Flatness Display
Remote command:
LAY:ADD? '1',RIGH,CHFL, see LAYout:ADD[:WINDow]? on page 186
TRACe:DATA?, see Chapter 9.7.4.3, "Channel Flatness", on page 210
TRACe<n>[:DATA]:X? on page 205
Carrier unit: UNIT:CAXes on page 164
15User Manual 1176.8980.02 ─ 02
Page 16
R&S®VSE-K96
OFDM VSA Measurement and Results
Evaluation Methods for OFDM VSA Measurements
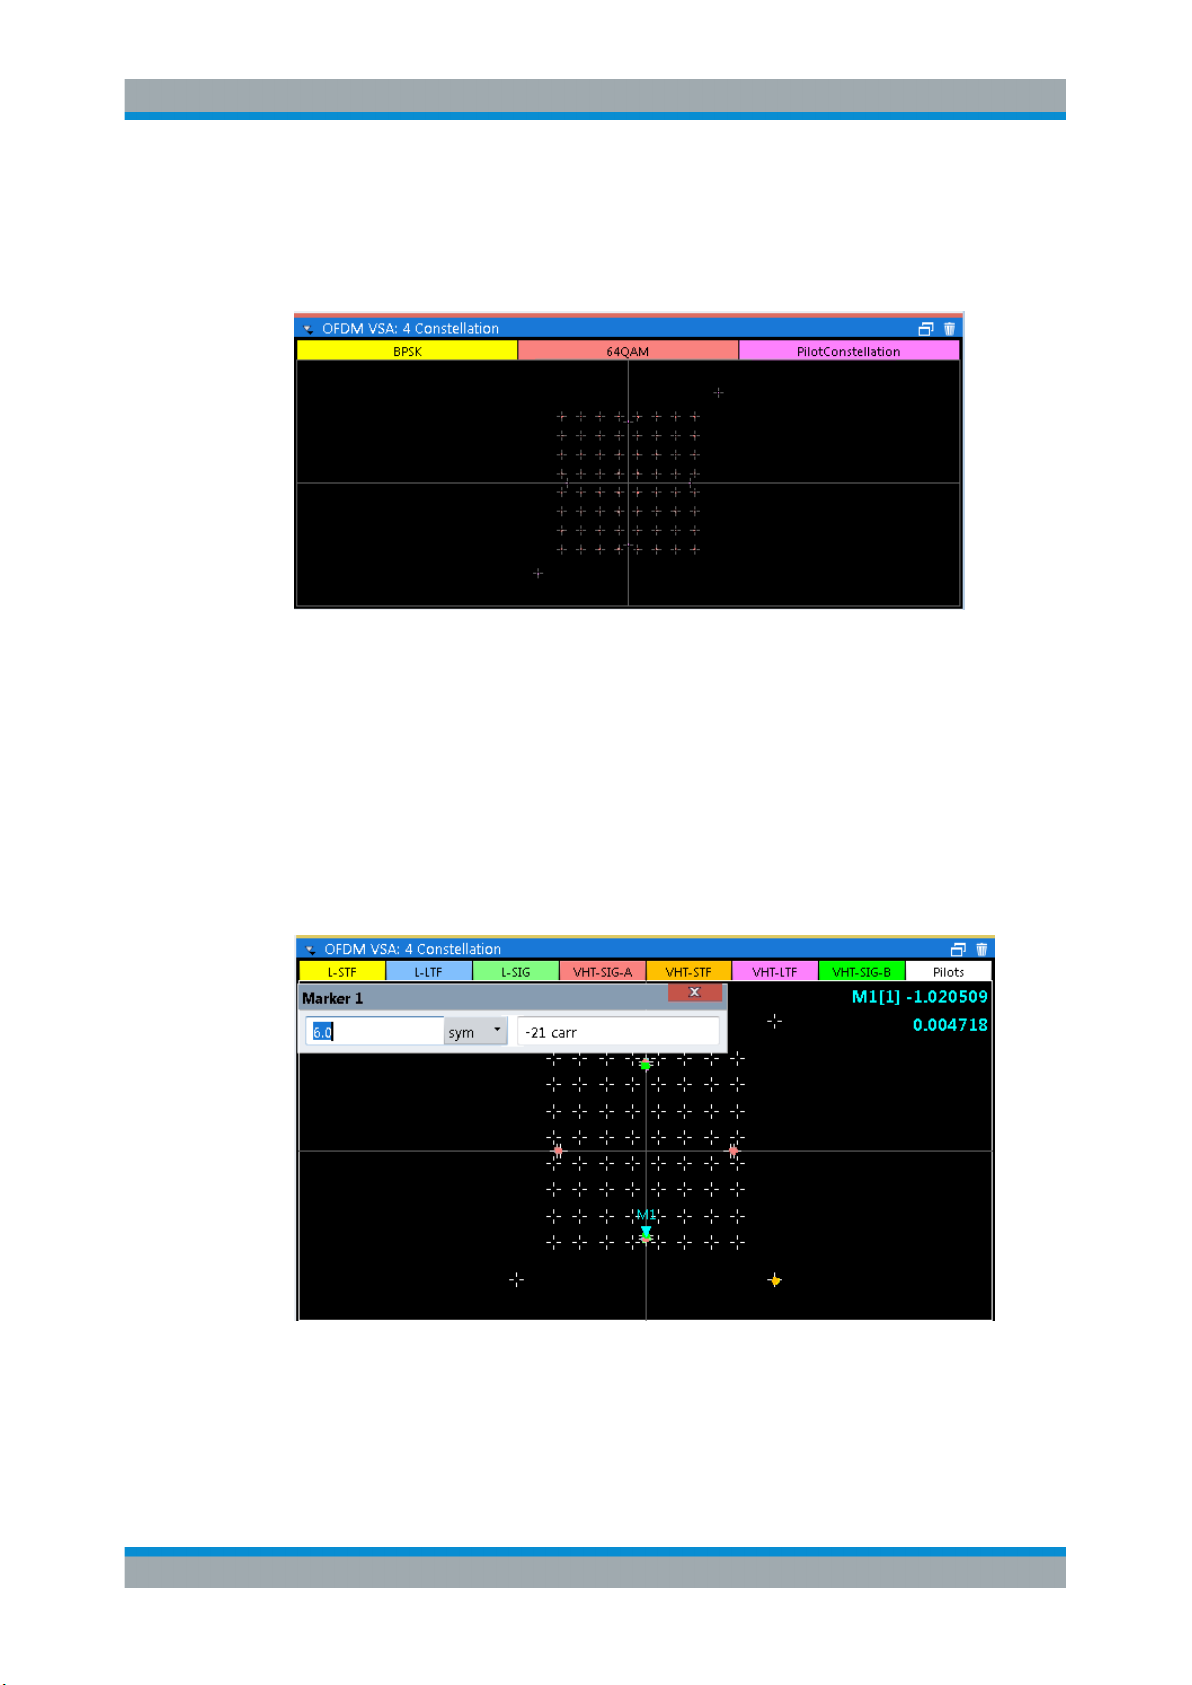
Constellation Diagram
The Constellation Diagram shows the inphase and quadrature results for the analyzed
input data. The ideal points for the selected cell types are displayed for reference purposes.
Figure 3-4: Constellation diagram
The legend for the color coding is displayed at the top of the matrix. If you click on one
of the codes, only the selected constellation points are displayed. Click again, and all
constellation points are displayed again (according to the constellation filter, see Chap-
ter 7.1, "Result Configuration", on page 97).
Markers in the Constellation diagram
Using markers you can detect individual constellation points for a specific symbol or
carrier. When you activate a marker in the Constellation diagram, its position is defined
by the symbol and carrier number the point belongs to, while the marker result indicates the I and Q values of the point.
Figure 3-5: Marker in a Constellation diagram
Remote command:
LAY:ADD? '1',RIGH,CONS, see LAYout:ADD[:WINDow]? on page 186
TRACe:DATA?, see Chapter 9.7.4.4, "Constellation Diagram", on page 210
16User Manual 1176.8980.02 ─ 02
Page 17
R&S®VSE-K96
OFDM VSA Measurement and Results
Evaluation Methods for OFDM VSA Measurements
Marker I/Q values:
CALCulate<n>:MARKer<m>:Z? on page 202
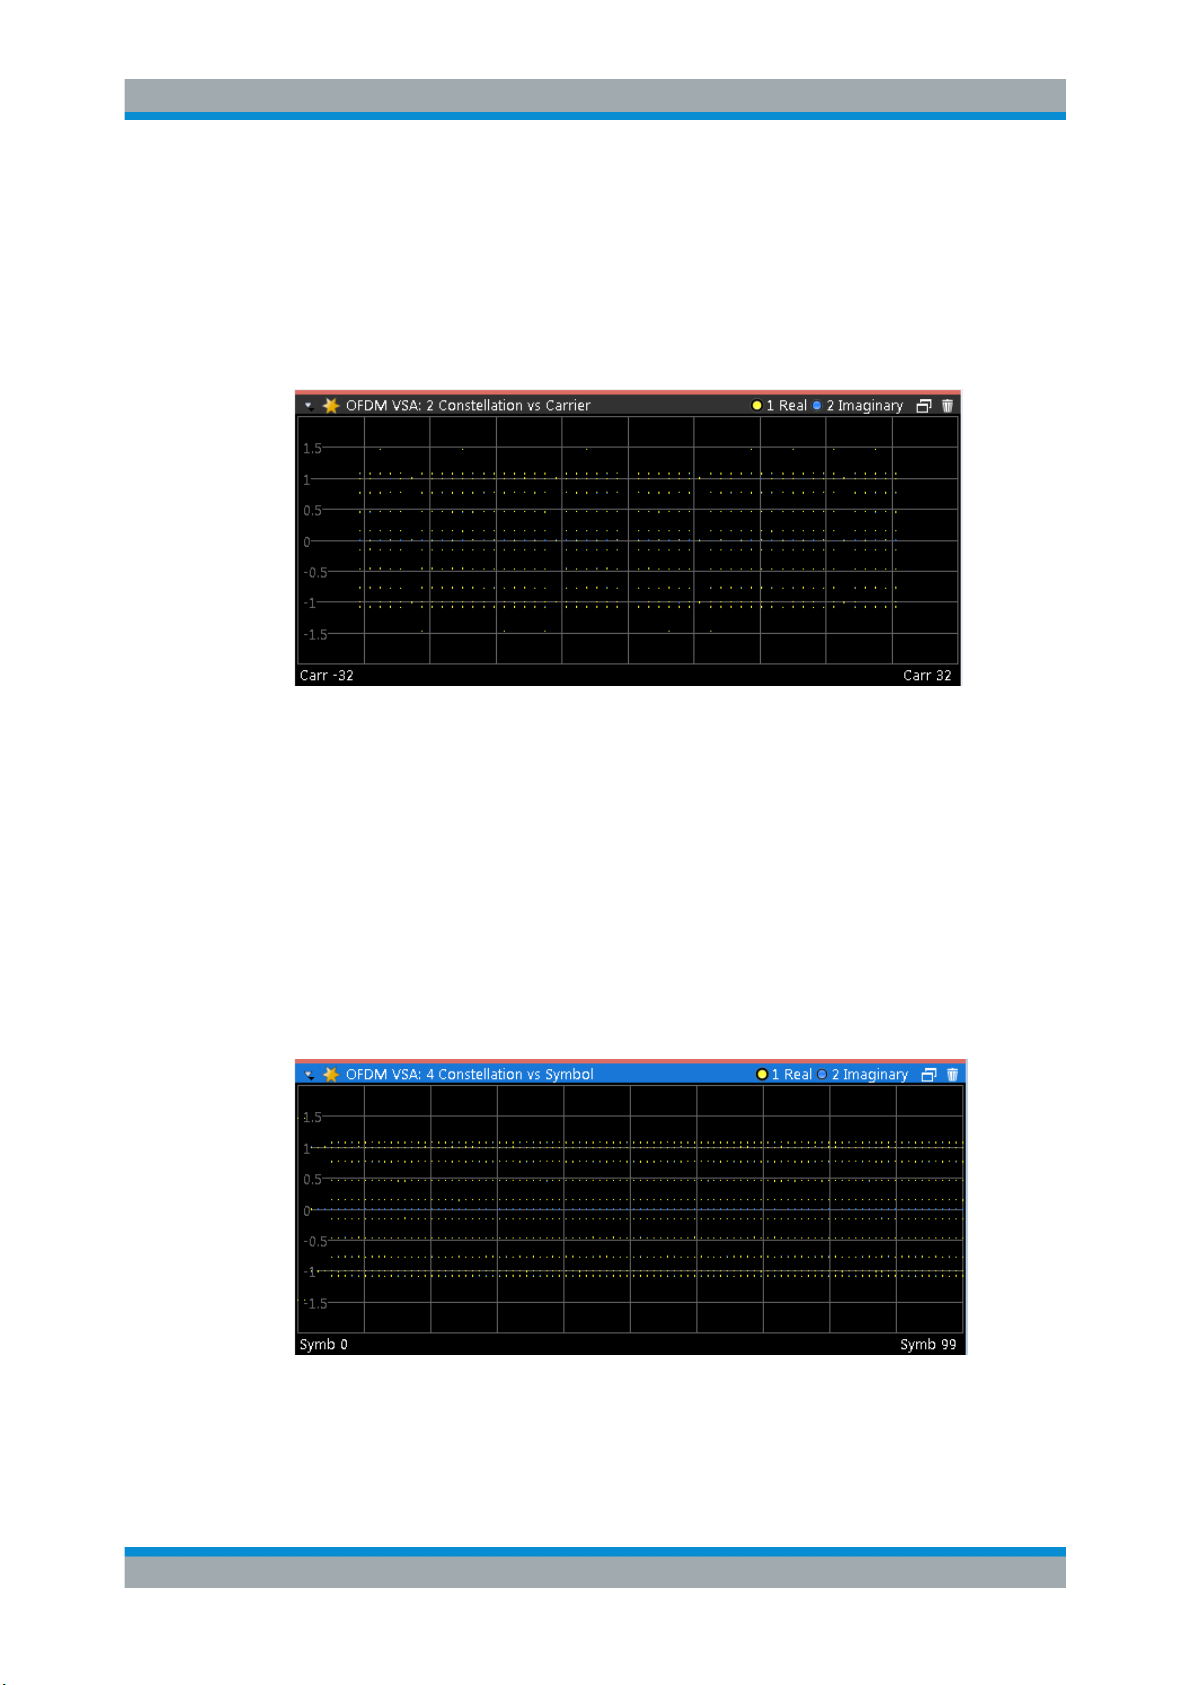
Constellation vs Carrier
The Constellation vs. Carrier display shows the inphase and quadrature magnitude
results of all analyzed symbols over the corresponding carriers. The inphase values
are displayed as yellow dots; the quadrature-values are displayed as blue dots.
Figure 3-6: Constellation vs. Carrier display
Note: This result display is only available if synchronization is successful.
Remote command:
LAY:ADD? '1',RIGH,CCAR, see LAYout:ADD[:WINDow]? on page 186
TRACe:DATA?, see Chapter 9.7.4, "Using the TRACe[:DATA] Command",
on page 208
Carrier unit: UNIT:CAXes on page 164
Constellation vs Symbol
The Constellation vs. Symbol display shows the inphase and quadrature magnitude
results of all analyzed carriers over the corresponding symbols. The inphase values
are displayed as yellow dots; the quadrature-values are displayed as blue dots.
Figure 3-7: Constellation vs. Symbol display
Note: This result display is only available if synchronization is successful.
17User Manual 1176.8980.02 ─ 02
Page 18
R&S®VSE-K96
OFDM VSA Measurement and Results
Evaluation Methods for OFDM VSA Measurements
Remote command:
LAY:ADD? '1',RIGH,CSYM, see LAYout:ADD[:WINDow]? on page 186
TRACe:DATA?, see Chapter 9.7.4, "Using the TRACe[:DATA] Command",
on page 208
Symbol unit: UNIT:SAXes on page 166
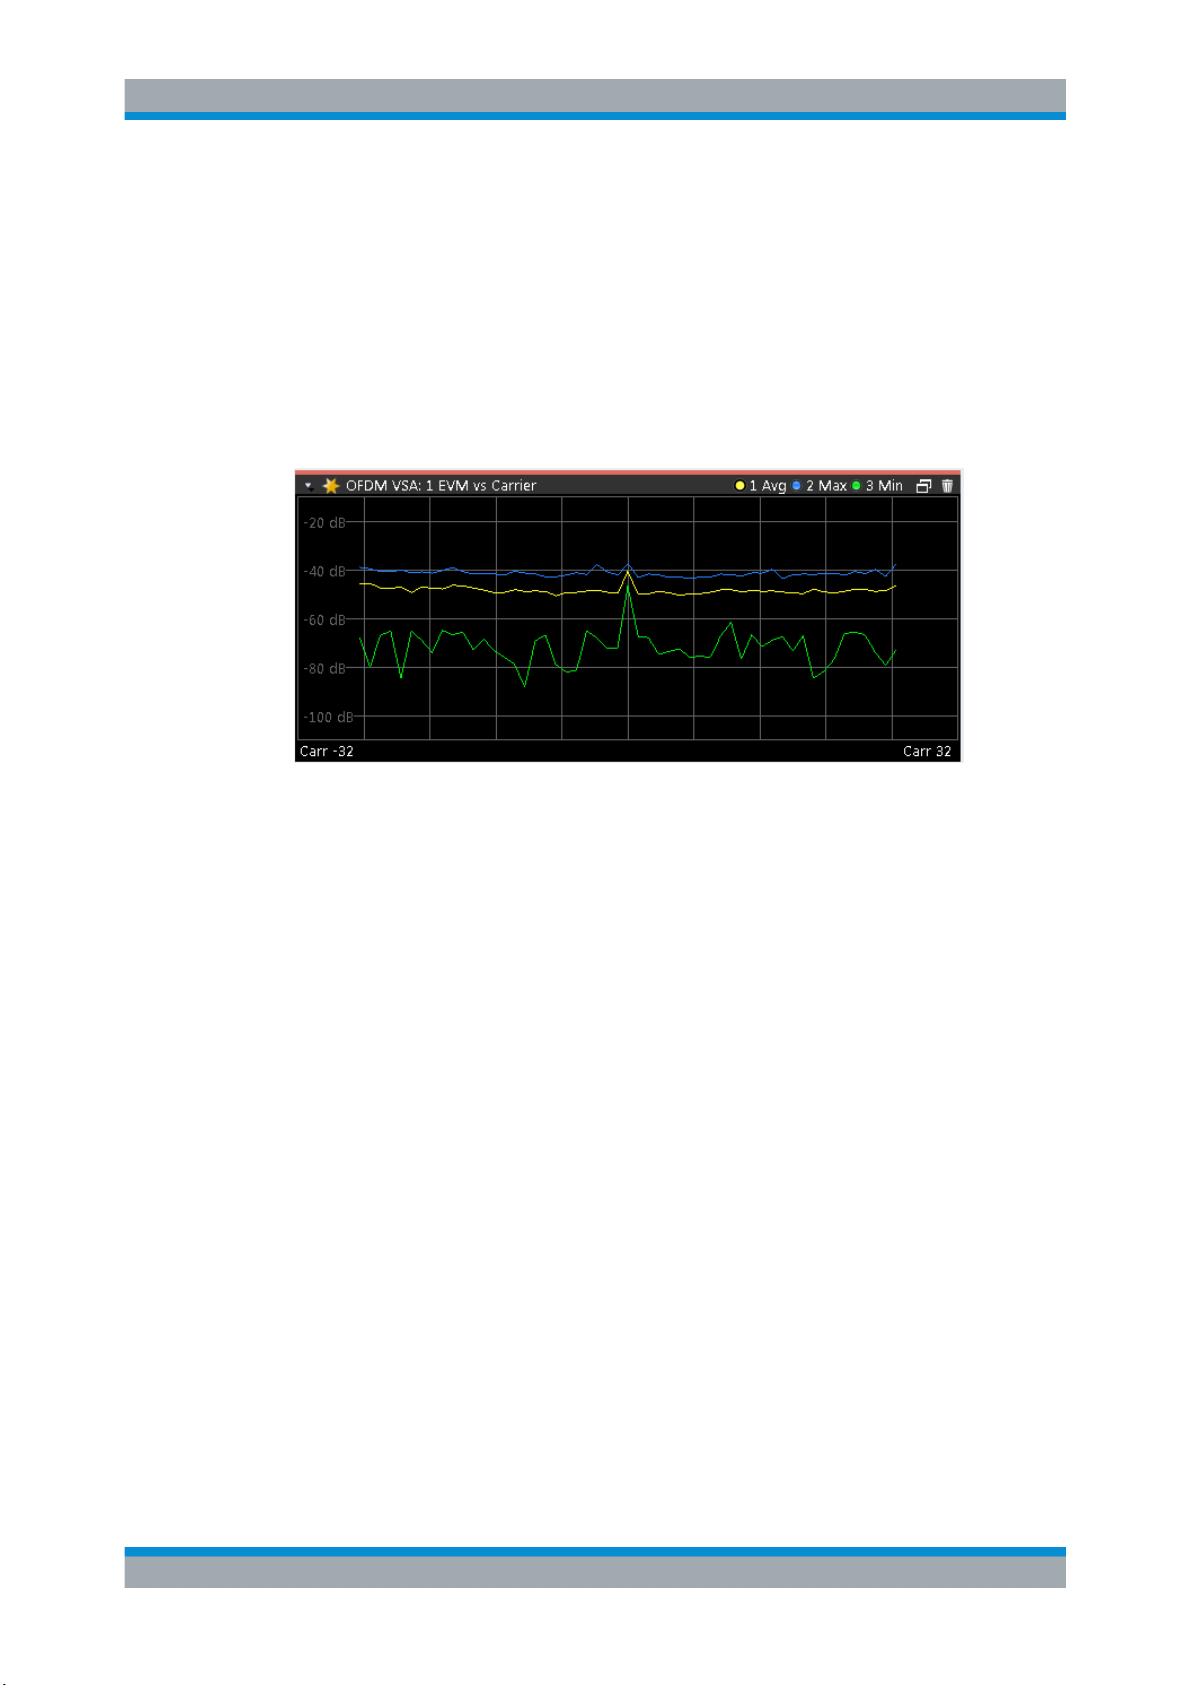
EVM vs Carrier
The EVM vs Carrier display shows the EVM of each carrier of the analyzed signal
frames in the frequency domain. The results are provided in dB. Multiple traces display
statistical evaluations over carriers.
Figure 3-8: EVM vs Carrier display
Note: This result display is only available if synchronization is successful.
Guard carriers to the left and right of the spectrum are not included in the EVM calculation. However, zero cells and the DC carrier are included.
Remote command:
LAY:ADD? '1',RIGH,EVC, see LAYout:ADD[:WINDow]? on page 186
TRACe:DATA?, see Chapter 9.7.4.7, "EVM vs Carrier", on page 212
TRACe<n>[:DATA]:X? on page 205
Carrier unit: UNIT:CAXes on page 164
EVM unit: UNIT:EVM on page 165
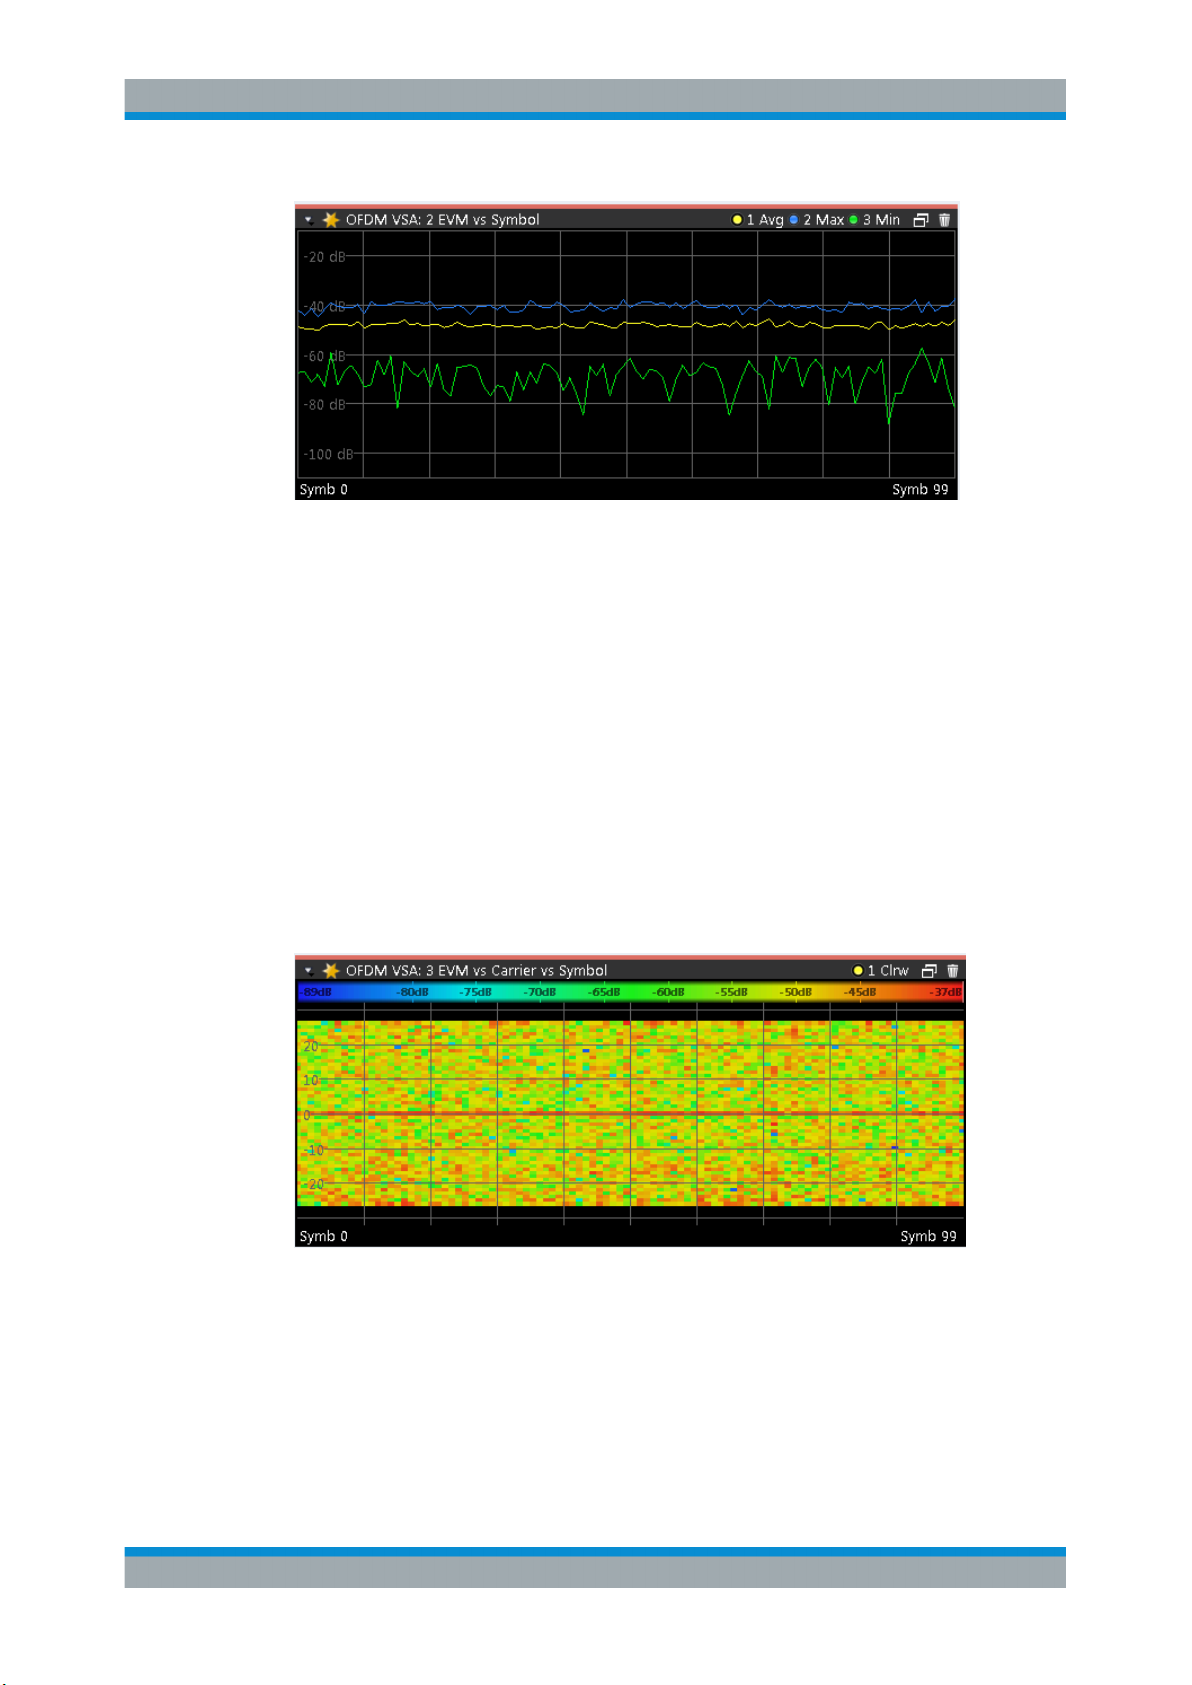
EVM vs Symbol
The EVM vs. Symbol display shows the EVM of each symbol of the analyzed signal
frames in the time domain. The results are provided in dB. Multiple traces display statistical evaluations over symbols.
Blue lines indicate the border between different OFDM frames if more than one frame
is analyzed.
18User Manual 1176.8980.02 ─ 02
Page 19
R&S®VSE-K96
OFDM VSA Measurement and Results
Evaluation Methods for OFDM VSA Measurements
Figure 3-9: EVM vs Symbol display
Note: This result display is only available if synchronization is successful.
Guard carriers to the left and right of the spectrum are not included in the EVM calculation. However, zero cells and the DC carrier are included.
Remote command:
LAY:ADD? '1',RIGH,EVSY, see LAYout:ADD[:WINDow]? on page 186
TRACe:DATA?, see Chapter 9.7.4.8, "EVM vs Symbol", on page 212
TRACe<n>[:DATA]:X? on page 205
Symbol unit: UNIT:SAXes on page 166
EVM unit: UNIT:EVM on page 165
EVM vs Symbol vs Carrier
The EVM vs Symbol vs Carrier display shows the EVM of each carrier (frequency
domain) and in each symbol (time domain) of the analyzed signal frames. The results
are provided in dB or percent, depending on the unit settings.
Figure 3-10: EVM vs Symbol vs Carrier display
The EVM values are represented by colors. The corresponding color map is displayed
at the top of the result display.
Note: This result display is only available if synchronization is successful.
19User Manual 1176.8980.02 ─ 02
Page 20
R&S®VSE-K96
OFDM VSA Measurement and Results
Evaluation Methods for OFDM VSA Measurements
Remote command:
LAY:ADD? '1',RIGH,EVSC, see LAYout:ADD[:WINDow]? on page 186
TRACe:DATA?, see Chapter 9.7.4.9, "EVM vs Symbol vs Carrier", on page 212
TRACe<n>[:DATA]:X? on page 205
TRACe<n>[:DATA]:Y? on page 206
Carrier unit: UNIT:CAXes on page 164
Symbol unit: UNIT:SAXes on page 166
EVM unit: UNIT:EVM on page 165
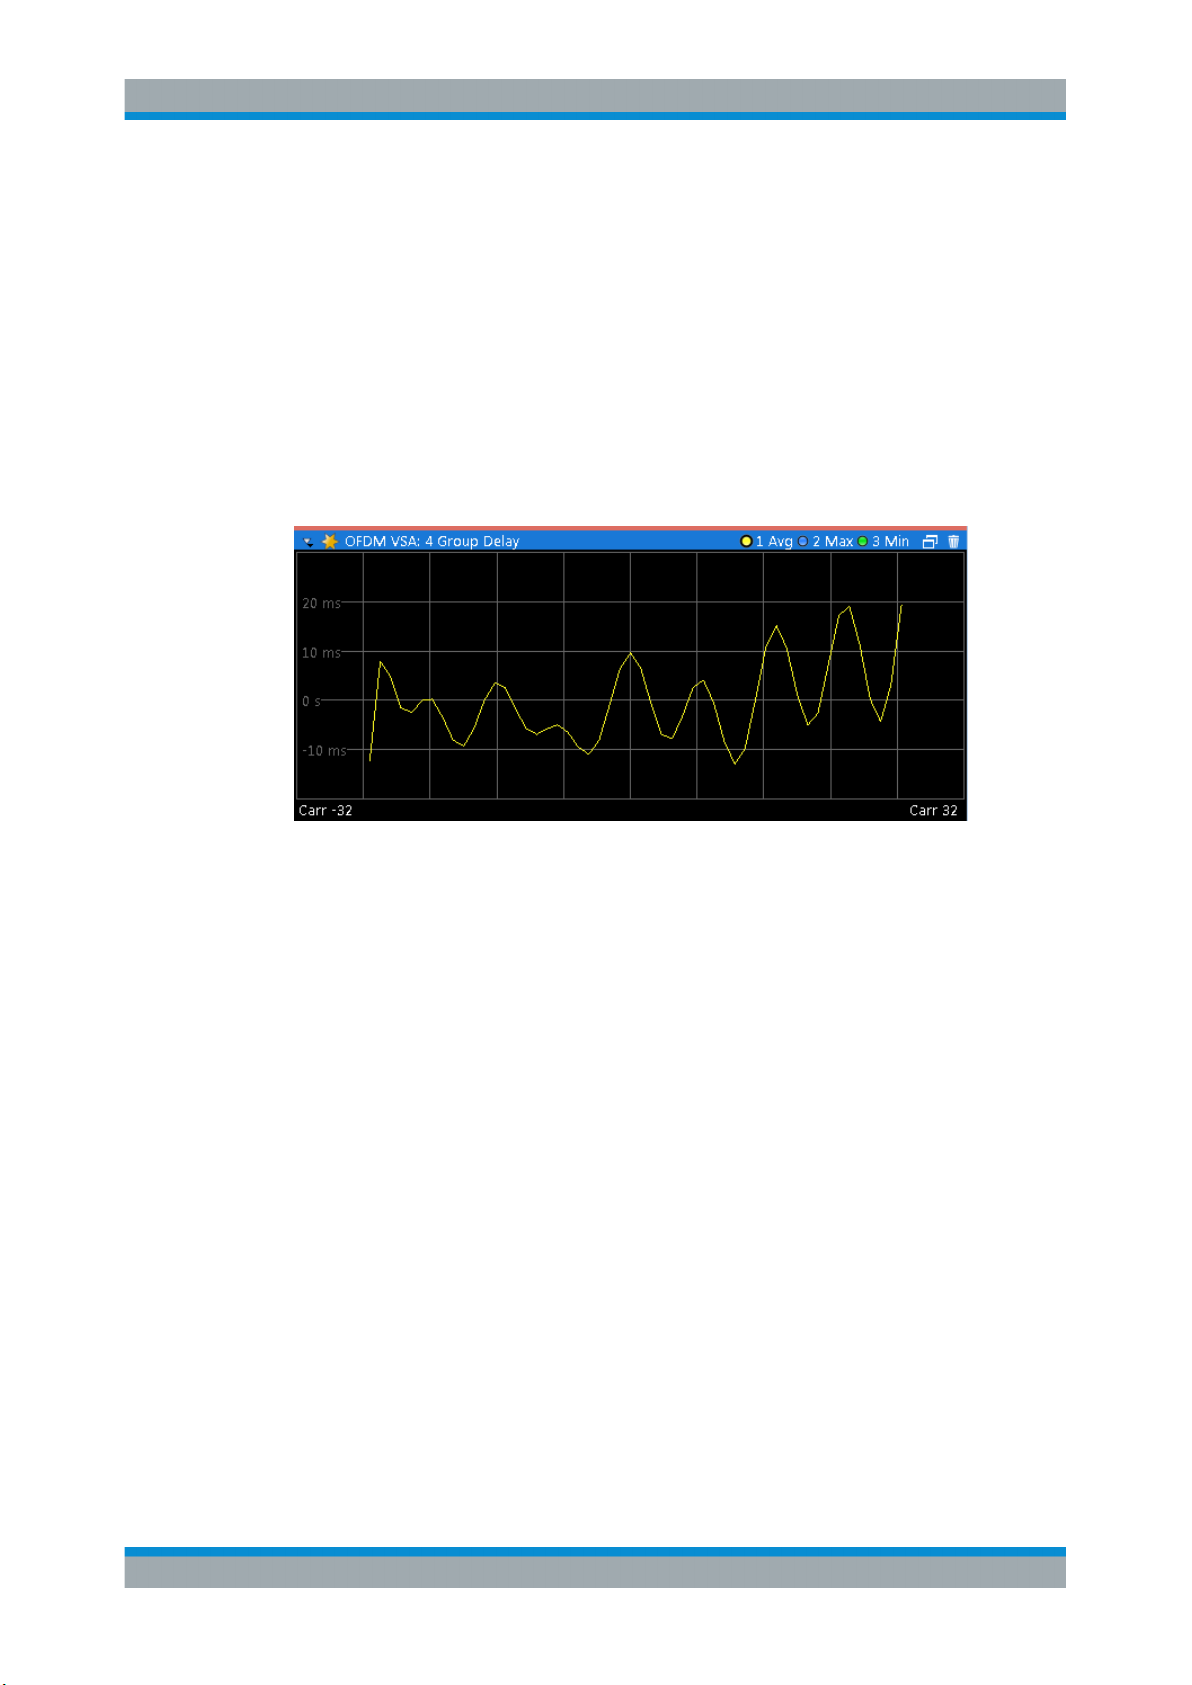
Group Delay
The Group Delay display shows the relative group delay of the transmission channel
per carrier. Multiple traces display statistical evaluations over all analyzed frames.
Remote command:
LAY:ADD? '1',RIGH,GDEL, see LAYout:ADD[:WINDow]? on page 186
TRACe:DATA?, see Chapter 9.7.4.11, "Group Delay", on page 213
TRACe<n>[:DATA]:X? on page 205
Carrier unit: UNIT:CAXes on page 164
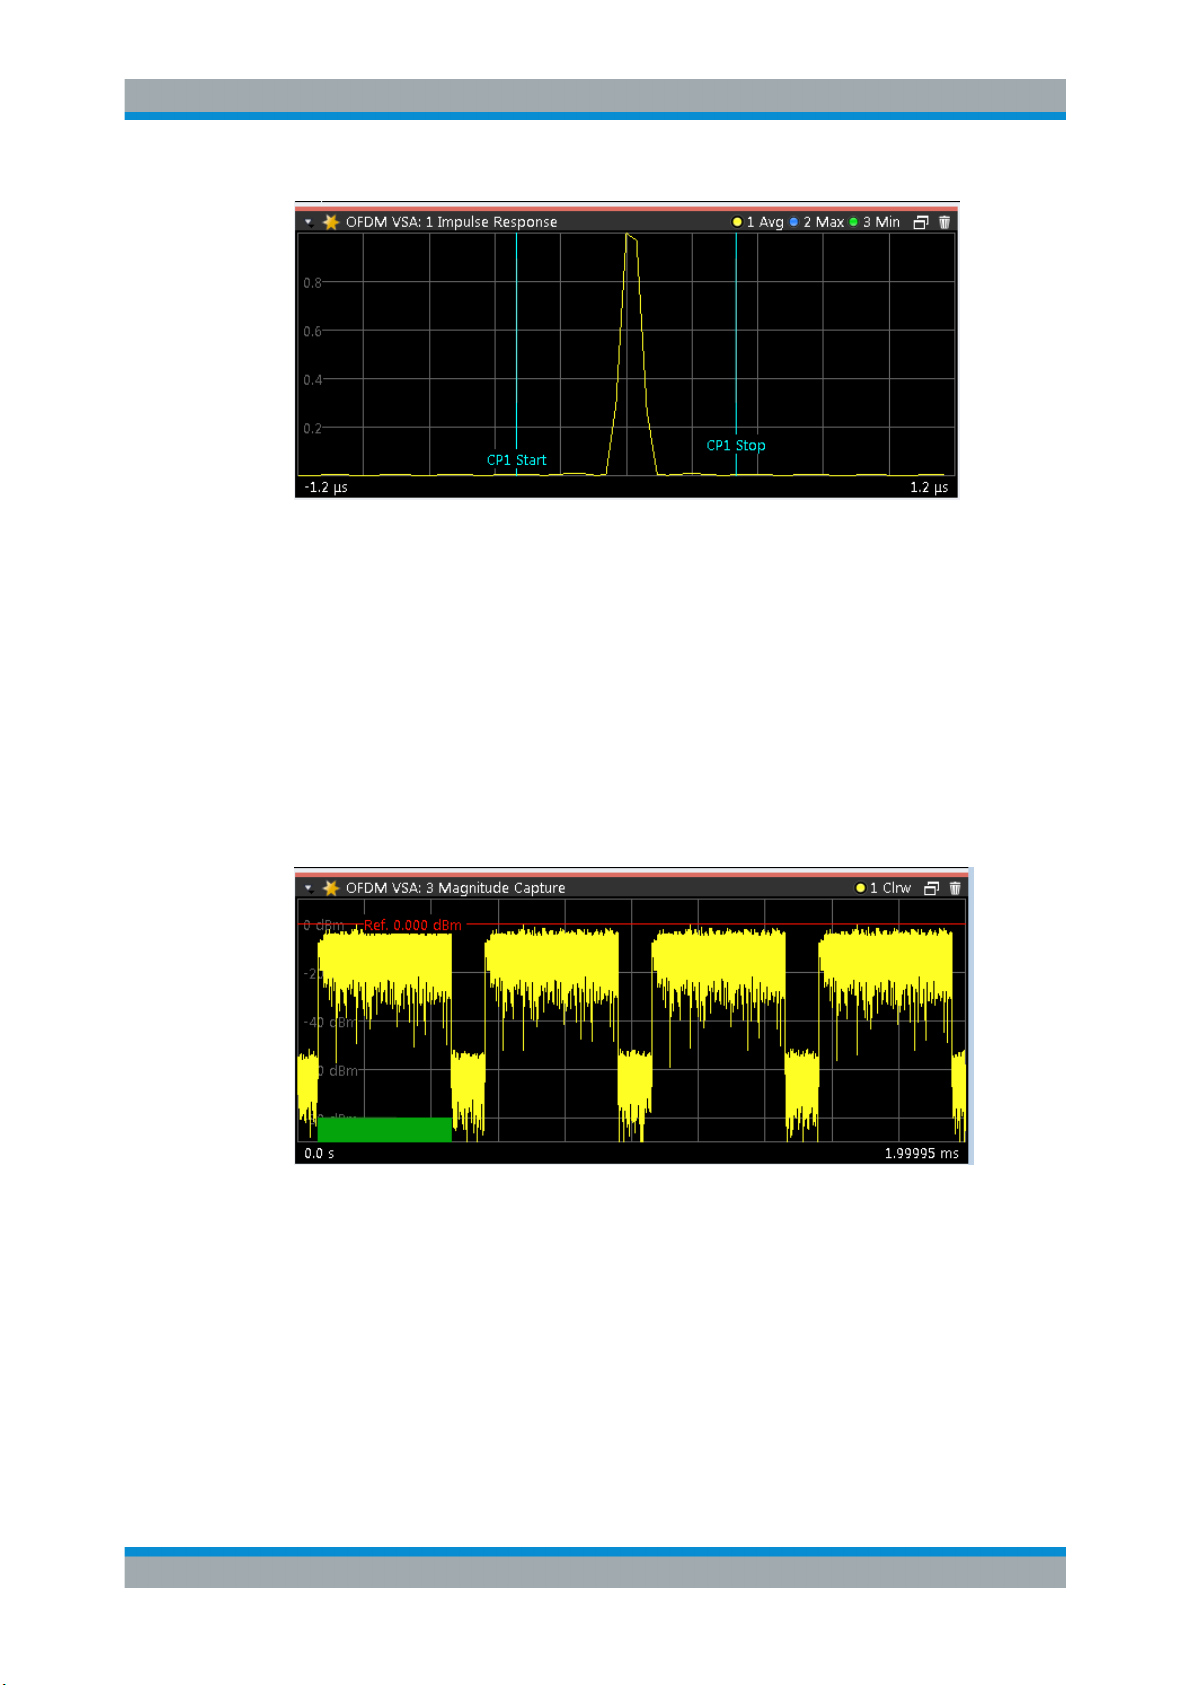
Impulse Response
The Channel Impulse Response display shows the impulse response of the channel
and its position within the guard interval. The start and the end of the cyclic prefix are
marked with blue lines. Multiple traces display statistical evaluations over all analyzed
frames.
20User Manual 1176.8980.02 ─ 02
Page 21
R&S®VSE-K96
OFDM VSA Measurement and Results
Evaluation Methods for OFDM VSA Measurements
Figure 3-11: Channel Impulse Response Display
Remote command:
LAY:ADD? '1',RIGH,IRES, see LAYout:ADD[:WINDow]? on page 186
TRACe:DATA?, see Chapter 9.7.4.12, "Impulse Response", on page 213
TRACe<n>[:DATA]:X? on page 205
Linear/ logarithmic scaling: UNIT:IRESponse on page 166
Magnitude Capture
The capture buffer contains the complete range of captured data for the last sweep.
The Magnitude Capture display shows the power of the captured I/Q data in dBm versus time. The analyzed frames are identified with a green bar at the bottom of the Magnitude Capture display.
Figure 3-12: Magnitude Capture display
Remote command:
LAY:ADD? '1',RIGH,MCAP, see LAYout:ADD[:WINDow]? on page 186
TRACe:DATA?, see Chapter 9.7.4.13, "Magnitude Capture", on page 214
TRACe<n>[:DATA]:X? on page 205
Time unit: UNIT:TAXes on page 166
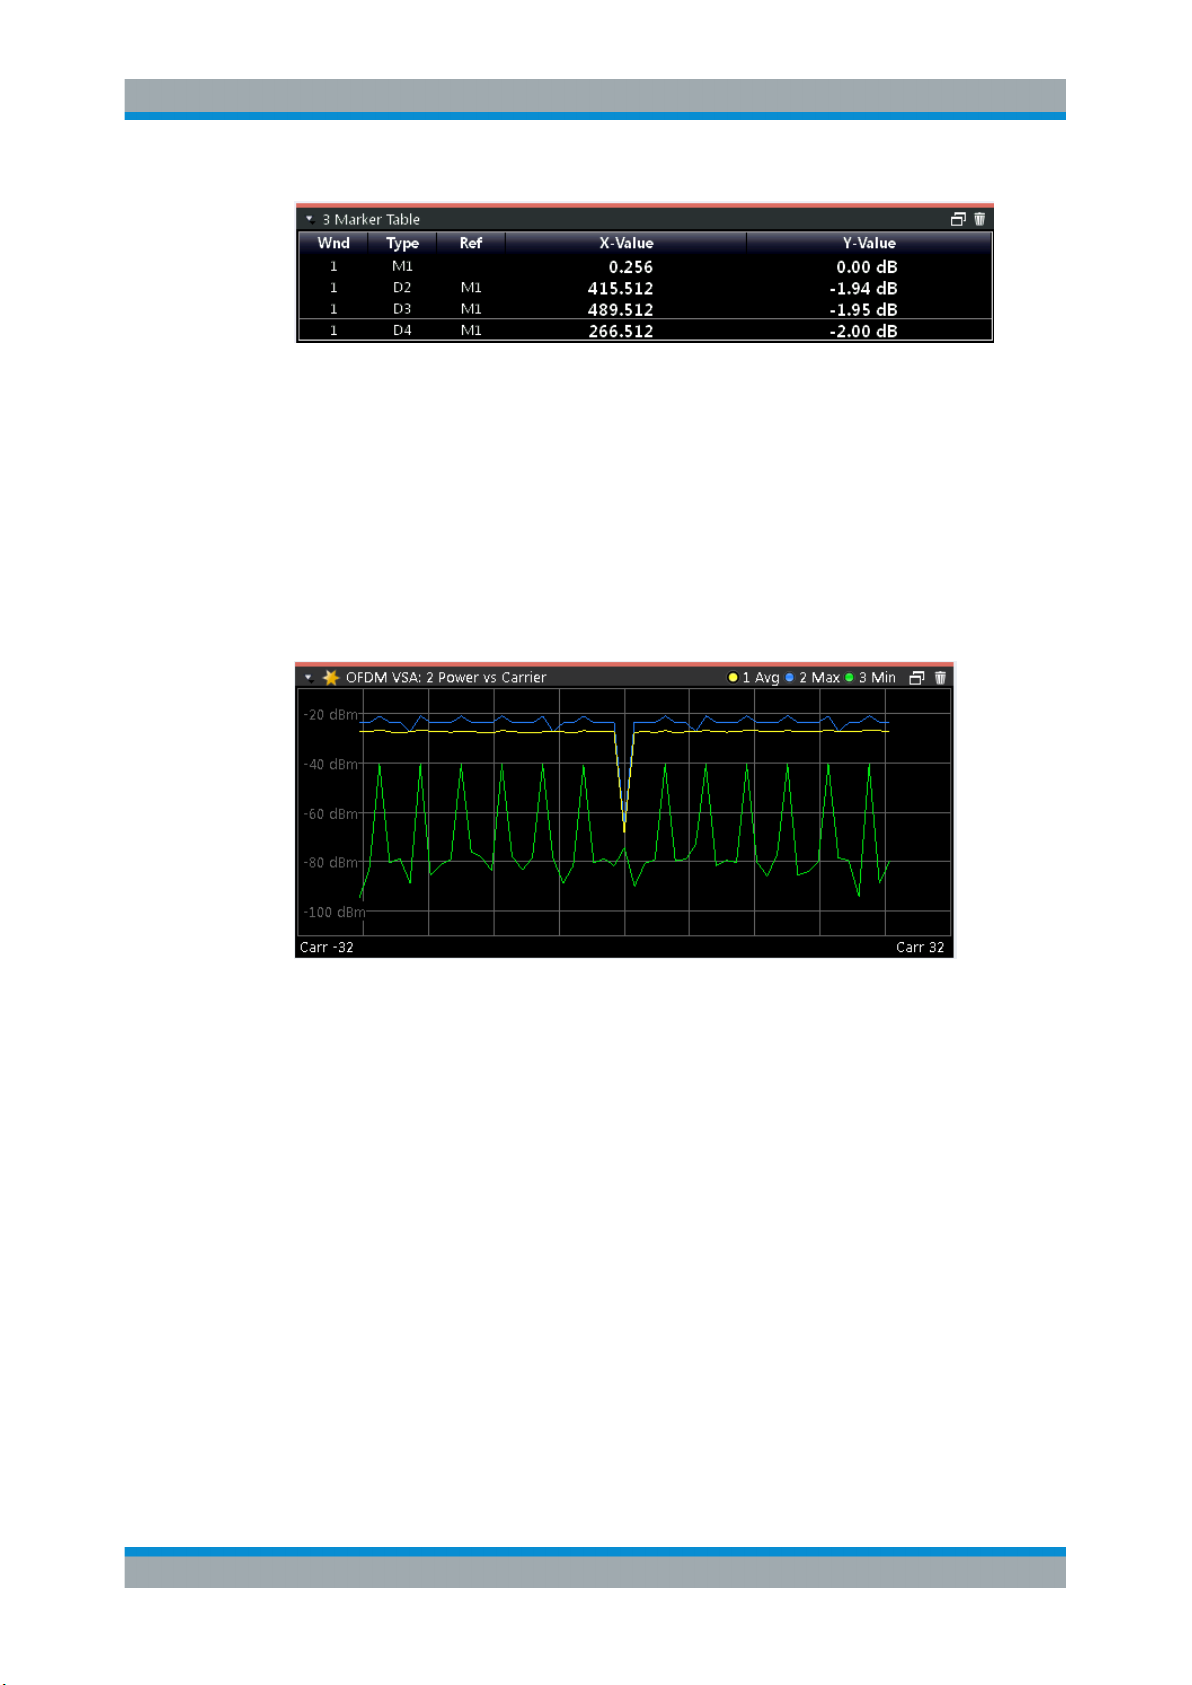
Marker Table
Displays a table with the current marker values for the active markers.
21User Manual 1176.8980.02 ─ 02
Page 22
R&S®VSE-K96
OFDM VSA Measurement and Results
Evaluation Methods for OFDM VSA Measurements
Remote command:
LAY:ADD? '1',RIGH, MTAB, see LAYout:ADD[:WINDow]? on page 186
Results:
CALCulate<n>:MARKer<m>:X on page 171
CALCulate<n>:MARKer<m>:Y on page 202
Power vs Carrier
The Power vs. Carrier display shows the power of all OFDM symbols in the analyzed
signal frames for each carrier. The power is measured with a resolution bandwidth
equal to the carrier spacing. Multiple traces display statistical evaluations over all analyzed frames.
Figure 3-13: Power vs Carrier display
Note:
This result display is only available if synchronization is successful.
Remote command:
LAY:ADD? '1',RIGH,PCAR, see LAYout:ADD[:WINDow]? on page 186
TRACe:DATA?, see Chapter 9.7.4.14, "Power vs Carrier", on page 214
TRACe<n>[:DATA]:X? on page 205
Carrier unit: UNIT:CAXes on page 164
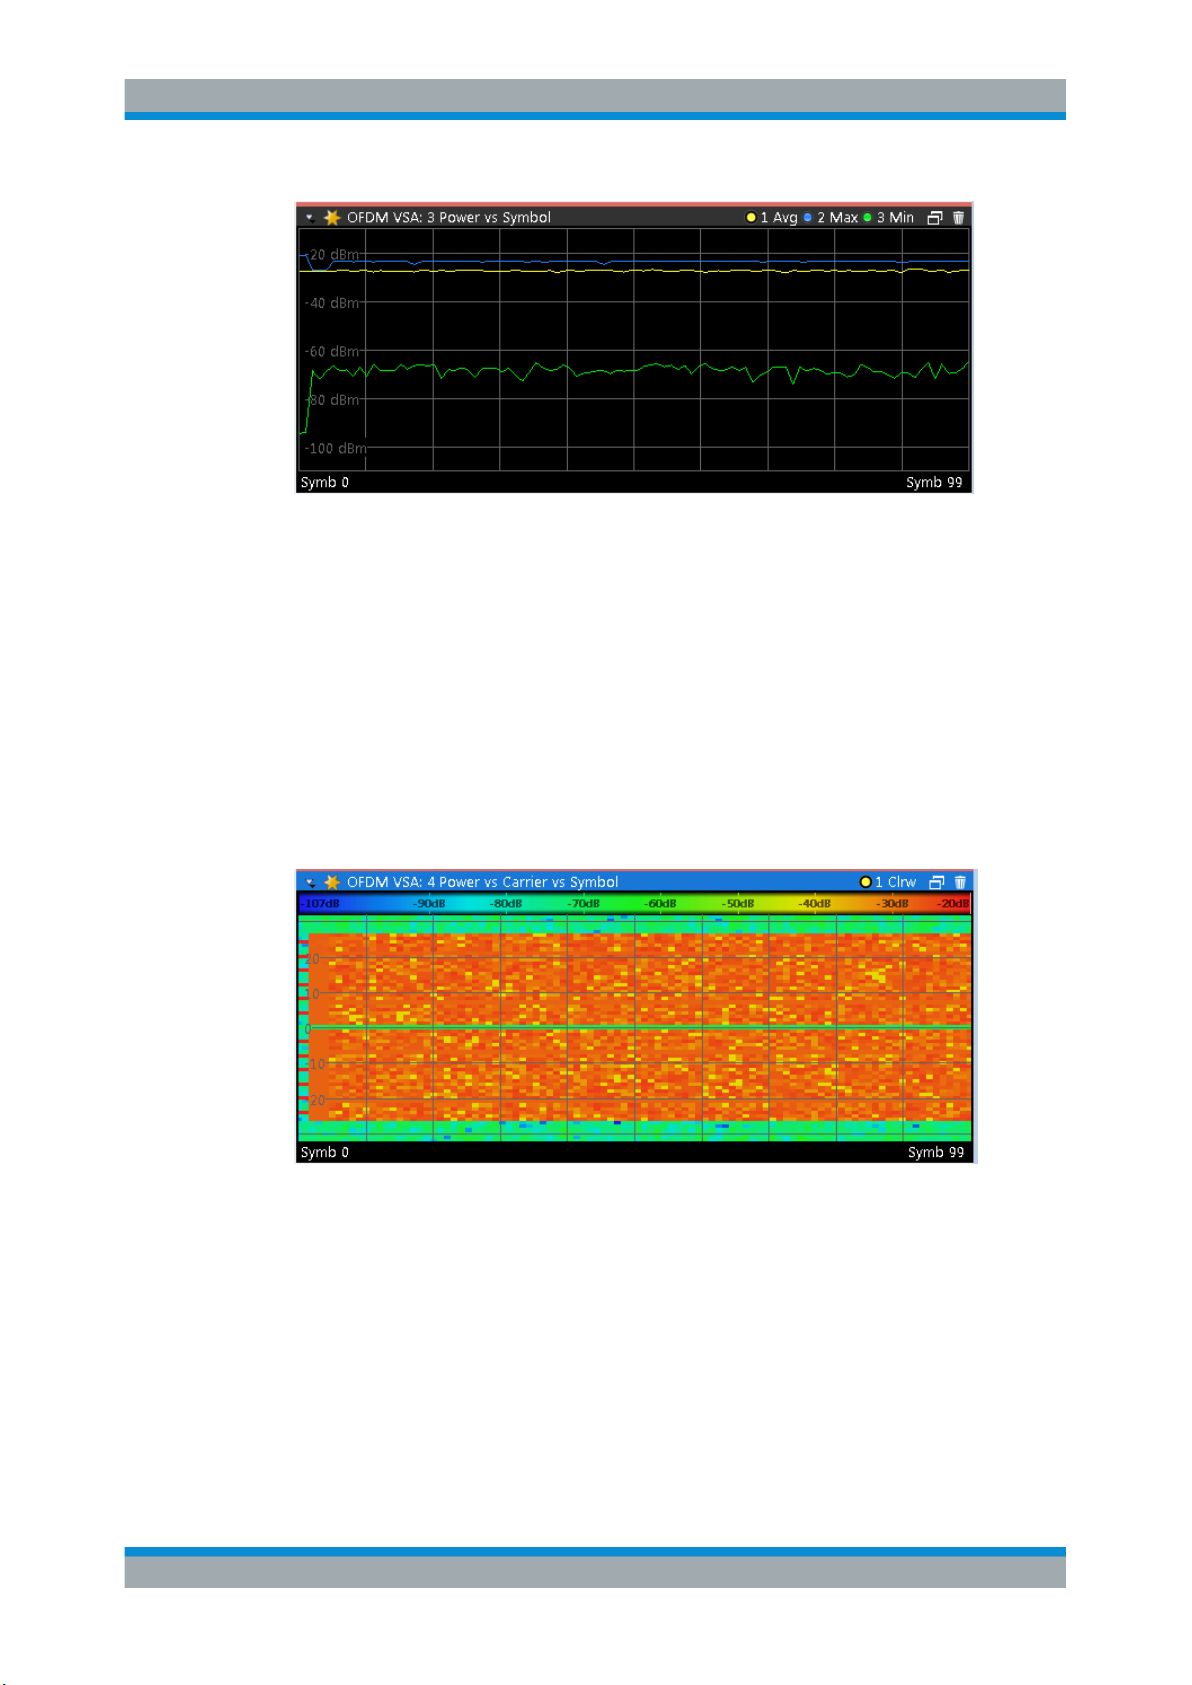
Power vs Symbol
The Power vs Symbol display shows the power of all OFDM carriers in the analyzed
signal frames for each symbol. The power is measured with a resolution bandwidth
equal to the carrier spacing. Multiple traces display statistical evaluations over all analyzed frames. Carriers which contain 'Zero'-cells over the complete symbol range (e.g.
guard carriers or DC carrier) are excluded from the statistic.
Vertical blue lines indicate the borders between frames.
22User Manual 1176.8980.02 ─ 02
Page 23
R&S®VSE-K96
OFDM VSA Measurement and Results
Evaluation Methods for OFDM VSA Measurements
Figure 3-14: Power vs Symbol display
Note: This result display is only available if synchronization is successful.
Remote command:
LAY:ADD? '1',RIGH,PSYM, see LAYout:ADD[:WINDow]? on page 186
TRACe:DATA?, see Chapter 9.7.4.15, "Power vs Symbol", on page 214
TRACe<n>[:DATA]:X? on page 205
Symbol unit: UNIT:SAXes on page 166
Power vs Symbol vs Carrier
The Power vs Carrier vs Symbol display shows the power of each carrier (= frequency
domain) in each symbol (= time domain) of the analyzed signal frames in dBm. The
power is measured with a resolution bandwidth that equals the carrier spacing.
Figure 3-15: Power vs Symbol vs Carrier display
The power levels are represented by colors. The corresponding color map is displayed
at the top of the result display.
Note: This result display is only available if synchronization is successful.
Remote command:
LAY:ADD? '1',RIGH,PSC, see LAYout:ADD[:WINDow]? on page 186
TRACe:DATA?, see Chapter 9.7.4.16, "Power vs Symbol vs Carrier", on page 214
TRACe<n>[:DATA]:X? on page 205
TRACe<n>[:DATA]:Y? on page 206
23User Manual 1176.8980.02 ─ 02
Page 24
R&S®VSE-K96
OFDM VSA Measurement and Results
Evaluation Methods for OFDM VSA Measurements
Carrier unit: UNIT:CAXes on page 164
Symbol unit: UNIT:SAXes on page 166
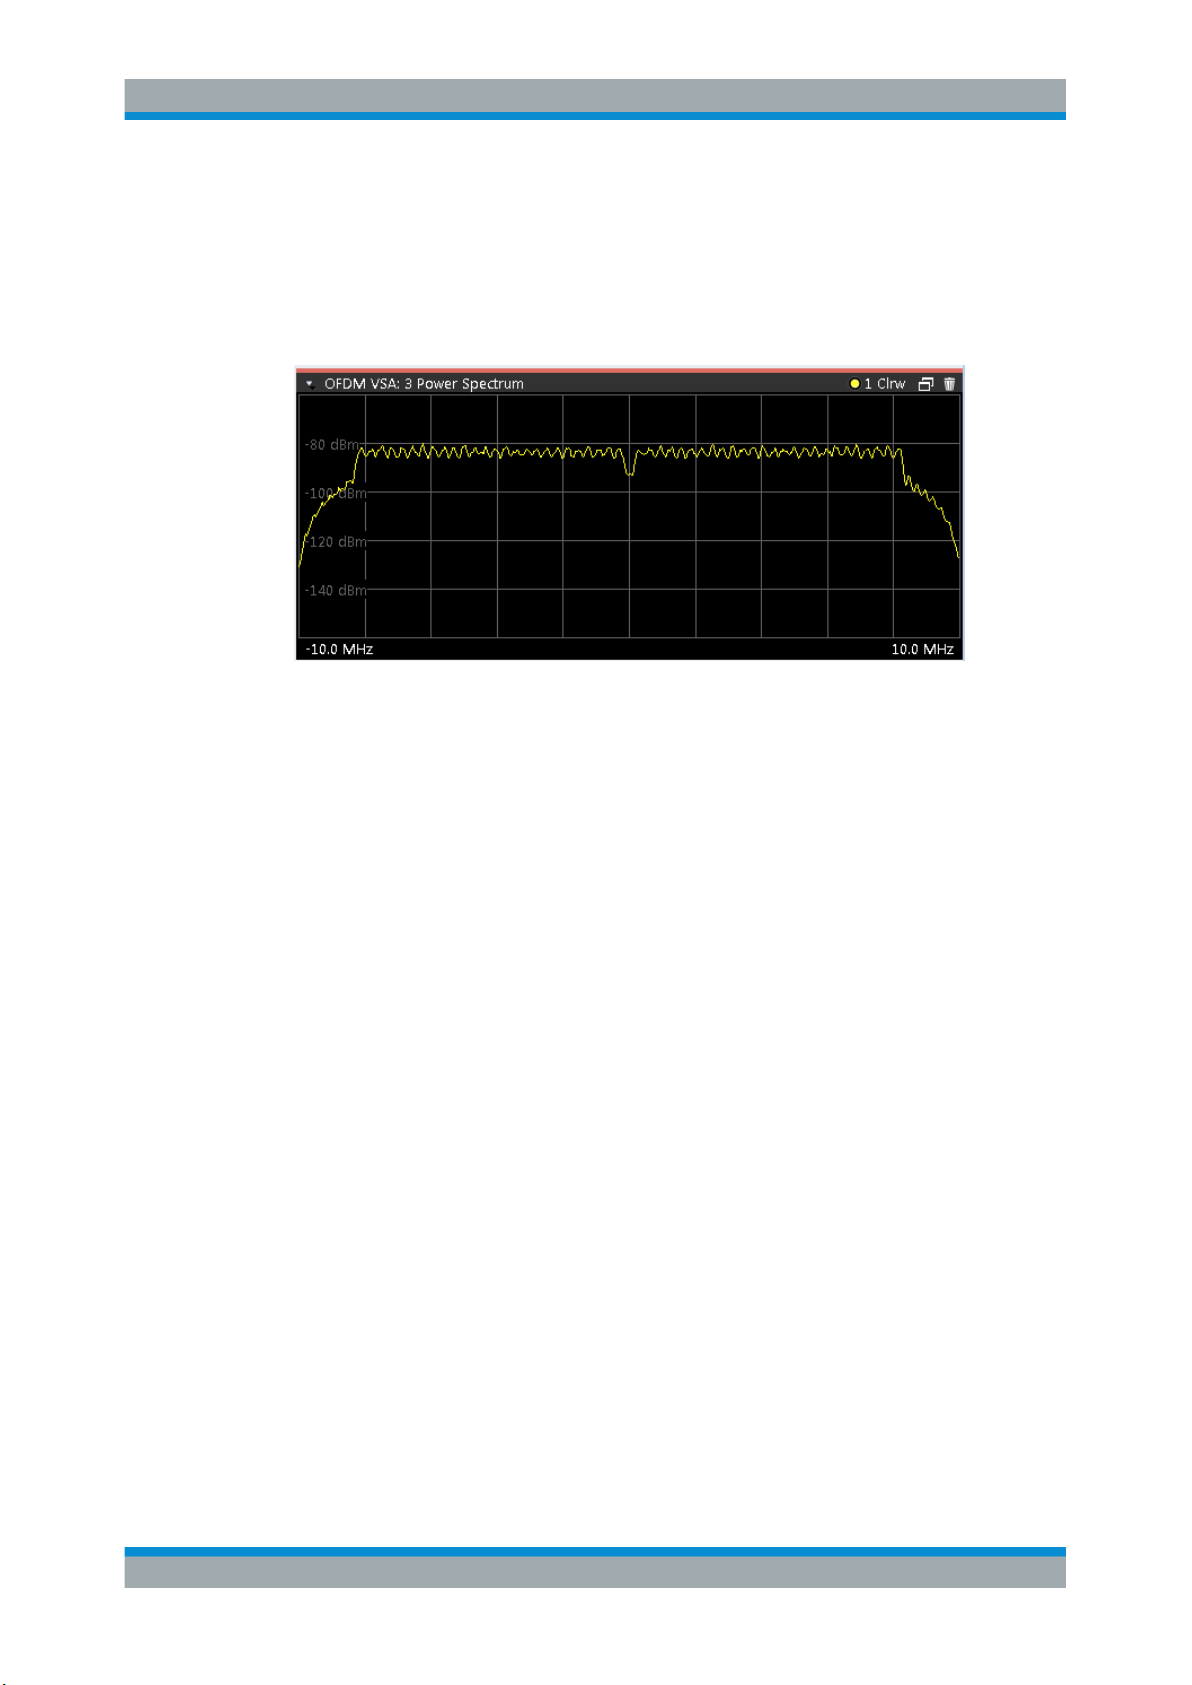
Power Spectrum
The Power Spectrum display shows the power in dBm vs frequency results of the complete capture buffer. This display is always available.
Figure 3-16: Power Spectrum display
Remote command:
LAY:ADD? '1',RIGH,PSP, see LAYout:ADD[:WINDow]? on page 186
TRACe:DATA?, see Chapter 9.7.4.17, "Power Spectrum", on page 215
Frequency unit: UNIT:FAXes on page 165
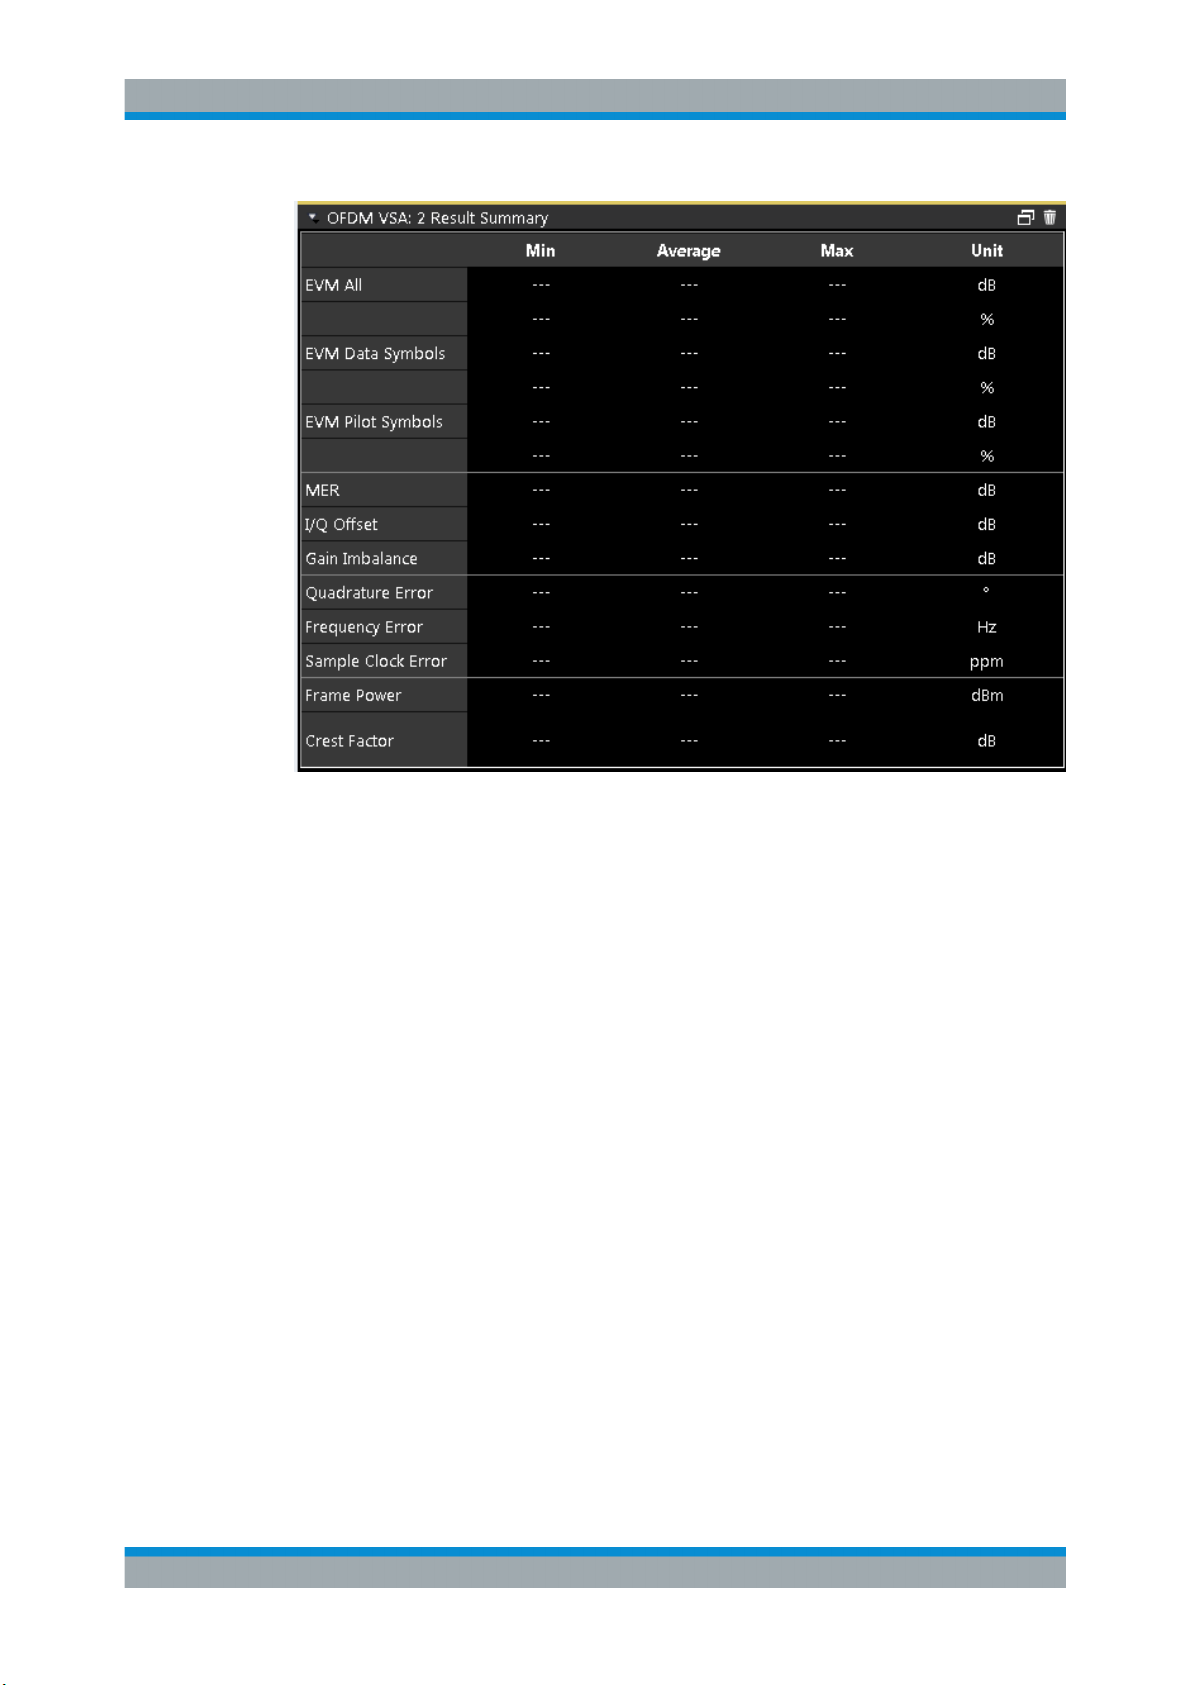
Result Summary
The Result Summary table provides numerical measurement results. Statistical evaluation is performed over all analyzed frames within the capture buffer.
24User Manual 1176.8980.02 ─ 02
Page 25
R&S®VSE-K96
OFDM VSA Measurement and Results
Evaluation Methods for OFDM VSA Measurements
Figure 3-17: Result Summary display
Note: If only one frame is available for analysis, the minimum and maximum values
are not displayed, as they are identical to the average value.
For details on the individual results see Table 3-1.
Remote command:
LAY:ADD? '1',RIGH,RSUM, see LAYout:ADD[:WINDow]? on page 186
Results:
FETCh:SUMMary[:ALL]? on page 194
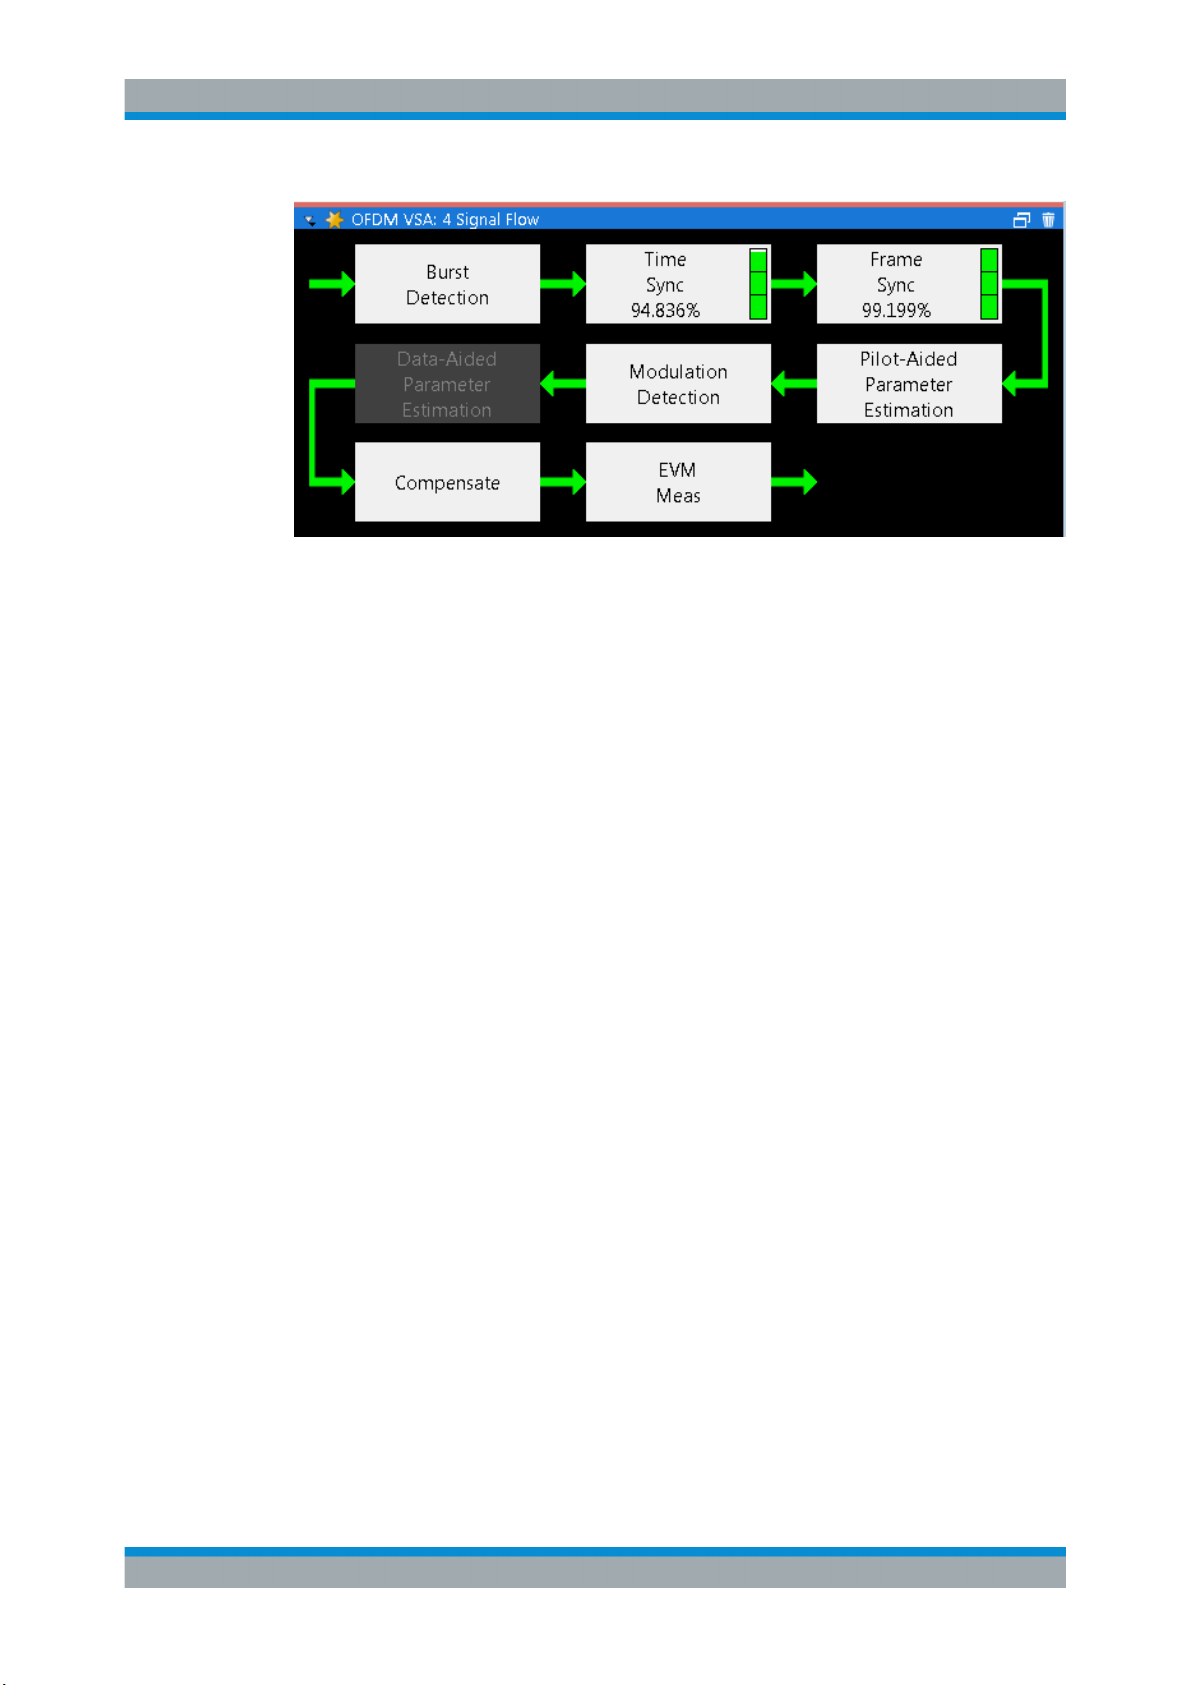
Signal Flow
The Signal Flow display shows a detailed description of the current measurement status. If demodulation is not successful, it provides useful hints on possible reasons.
Unused blocks are shown in gray.
25User Manual 1176.8980.02 ─ 02
Page 26
R&S®VSE-K96
OFDM VSA Measurement and Results
Evaluation Methods for OFDM VSA Measurements
Figure 3-18: Signal Flow display
For the synchronization blocks, a colored bar provides information about the reliability
of the synchronization result. If the level in the bar falls below the thresholds indicated
by the horizontal line, the color of the bar changes from green to yellow and finally to
red. If the synchronization of the block fails, all succeeding arrows change their color,
too.
For detailed information about the complete synchronization process, refer to Chap-
ter 4.2.2.1, "Synchronization Block", on page 35.
Remote command:
LAY:ADD? '1',RIGH,SFL, see LAYout:ADD[:WINDow]? on page 186
Retrieving results:
Chapter 9.7.2, "Retrieving Signal Flow Results", on page 196
26User Manual 1176.8980.02 ─ 02
Page 27

R&S®VSE-K96
4 Measurement Basics
4.1 General Information on OFDM Signals
4.1.1 OFDMA
Measurement Basics
General Information on OFDM Signals
Some background knowledge on basic terms and principles used in OFDM vector signal analysis is provided here for a better understanding of the required configuration
settings.
● General Information on OFDM Signals...................................................................27
● Signal Processing................................................................................................... 34
● OFDMA................................................................................................................... 27
● OFDM Parameterization......................................................................................... 28
In an OFDM system, the available spectrum is divided into multiple carriers, called subcarriers, which are orthogonal to each other. Each of these subcarriers is independently modulated by a low rate data stream.
OFDM is used as well in WLAN, WiMAX and broadcast technologies like DVB. OFDM
has several benefits including its robustness against multipath fading and its efficient
receiver architecture.
Figure 4-1 shows a representation of an OFDM signal taken from 3GPP TR 25.892.
Data symbols are independently modulated and transmitted over a high number of
closely spaced orthogonal subcarriers. In the OFDM-VSA common modulation
schemes as QPSK, 16QAM, and 64QAM can be defined as well as arbitrary distributed constellation points.
In the time domain, a guard interval may be added to each symbol to combat interOFDM-symbol-interference due to channel delay spread. In EUTRA, the guard interval
is a cyclic prefix which is inserted prior to each OFDM symbol.
Figure 4-1: Frequency-Time Representation of an OFDM Signal
27User Manual 1176.8980.02 ─ 02
Page 28
R&S®VSE-K96
Measurement Basics
General Information on OFDM Signals
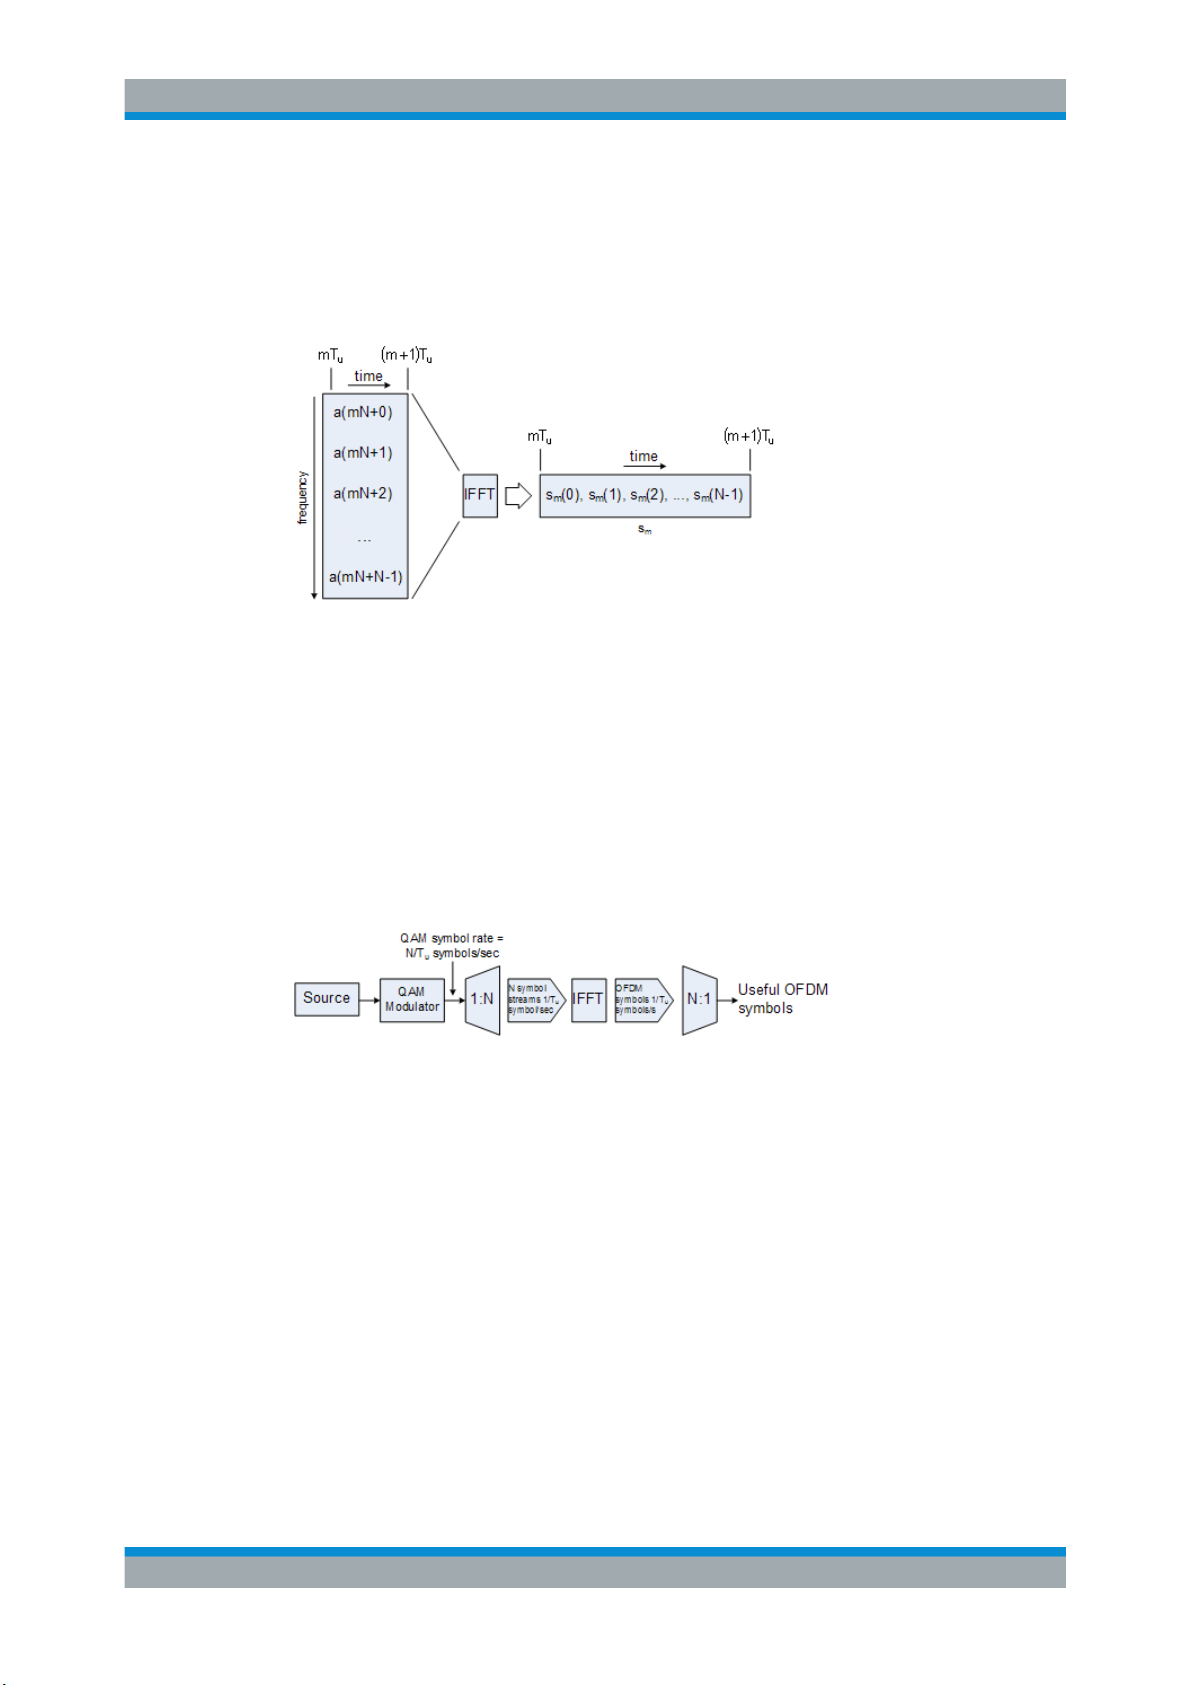
In practice, the OFDM signal can be generated using the inverse fast Fourier transform
(IFFT) digital signal processing. The IFFT converts a number N of complex data symbols used as frequency domain bins into the time domain signal. Such an N-point IFFT
is illustrated in Figure 4-2, where a(mN+n) refers to the nth subchannel modulated data
symbol, during the time period mTu < t ≤ (m+1)Tu.
Figure 4-2: OFDM useful symbol generation using an IFFT
The vector sm is defined as the useful OFDM symbol. It is the time superposition of the
N narrowband modulated subcarriers. Therefore, from a parallel stream of N sources
of data, each one independently modulated, a waveform composed of N orthogonal
subcarriers is obtained, with each subcarrier having the shape of a frequency sinc
function (see Figure 4-1).
Figure 4-3 illustrates the mapping from a serial stream of QAM symbols to N parallel
streams, used as frequency domain bins for the IFFT. The N-point time domain blocks
obtained from the IFFT are then serialized to create a time domain signal. Not shown
in Figure 4-3 is the process of cyclic prefix insertion.
Figure 4-3: OFDM Signal Generation Chain
4.1.2 OFDM Parameterization
A generic OFDM analyzer supports various OFDM standards. Therefore a common
parameterization of OFDM systems has to be defined.
4.1.2.1 Time Domain Description
The fundamental unit of an OFDM signal in the time domain is a sample.
An OFDM symbol with a length of NS samples consists of:
●
A guard interval of length N
●
An FFT interval of length N
G
FFT
28User Manual 1176.8980.02 ─ 02
Page 29
R&S®VSE-K96
Measurement Basics
General Information on OFDM Signals
N
G
N
Figure 4-4: OFDM symbol in time domain
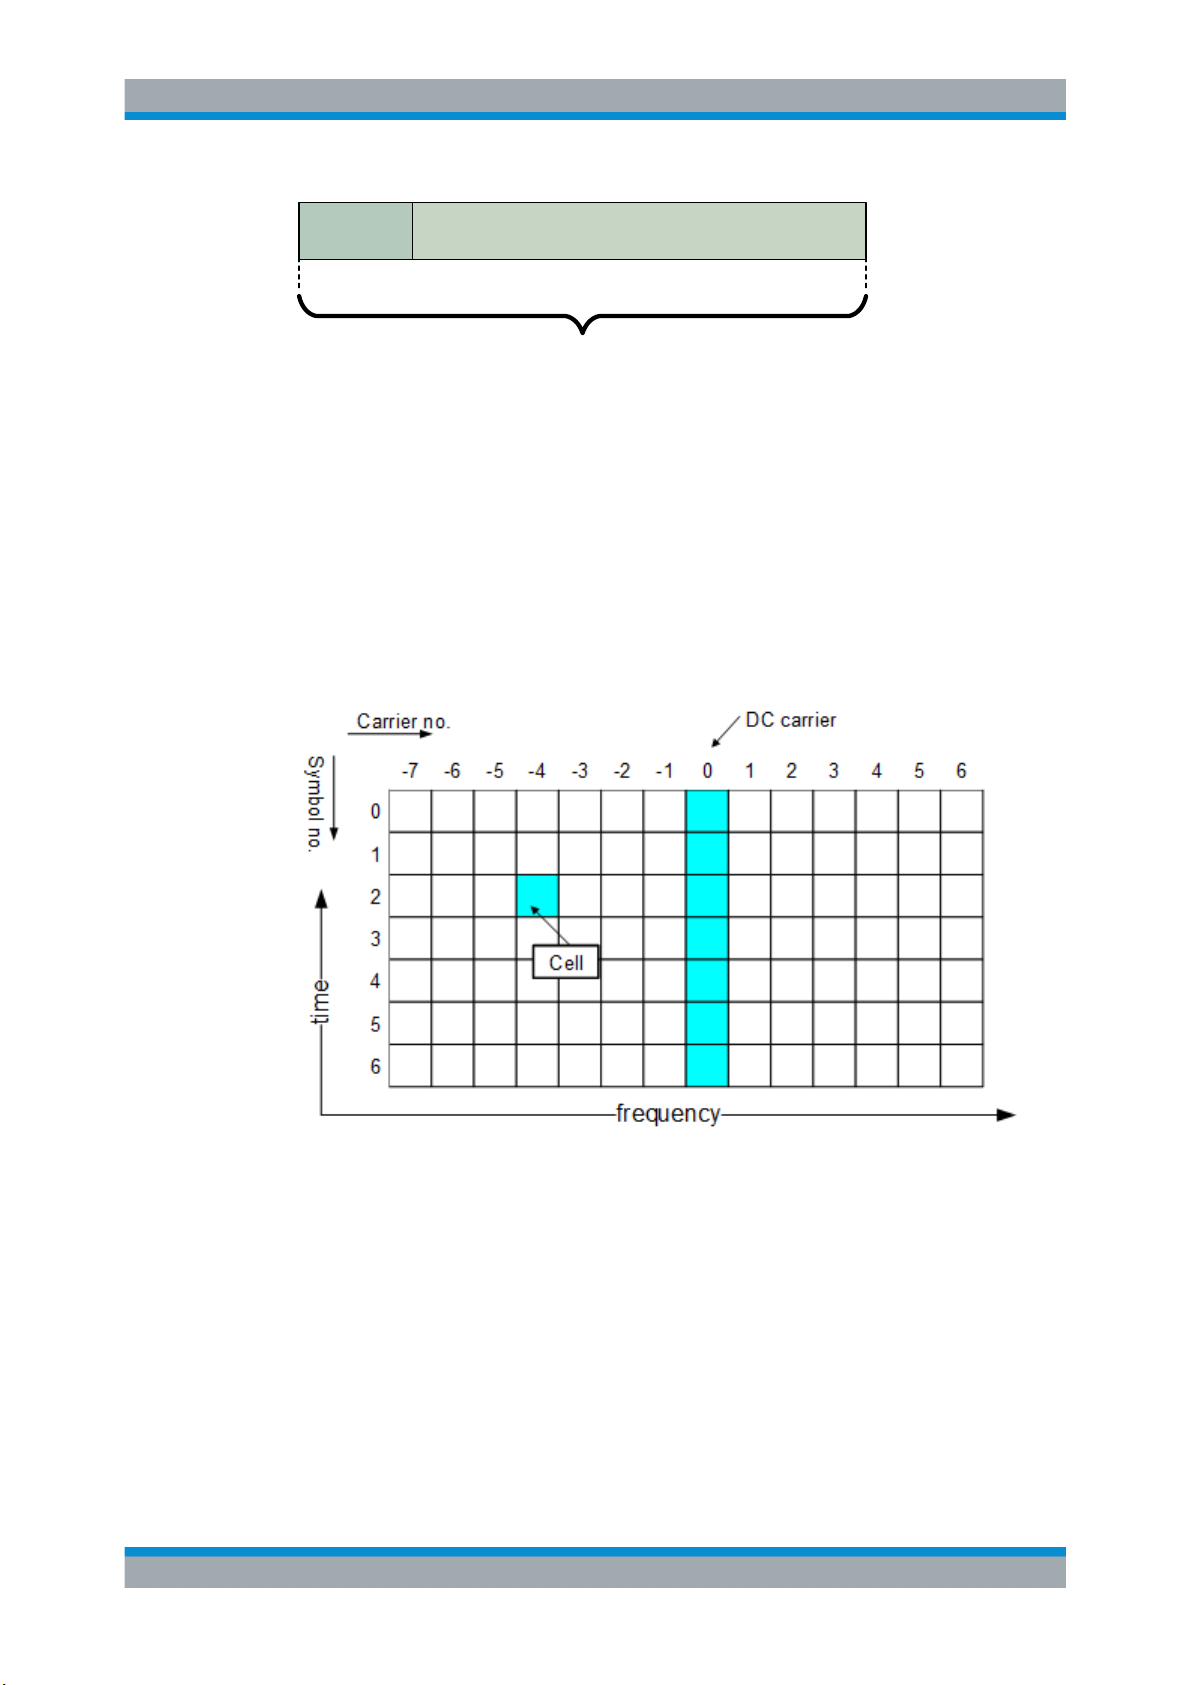
4.1.2.2 Frequency Domain Description
The FFT intervals of the OFDM symbols are transformed into the frequency domain
using a discrete Fourier transformation. The successive symbols of the OFDM signal
are displayed in time-frequency matrices. The fundamental unit of an OFDM signal in
the frequency domain is a cell.
The total area of a time frequency matrix is called frame. A frame is the highest level
unit used in OFDM VSA.
N
FFT
S
Figure 4-5: Time-Frequency Matrix
Carriers
A column of cells at the same frequency is called carrier.
The carrier number is the column index of a time-frequency matrix. The number '0' is
assigned to the DC-carrier, which lies at the transmitter center frequency. The total
number of subcarriers is N
. The DC-carrier offset determines the position of the DC
FFT
carrier relative to the lowermost subcarrier. The offset is an inherent attribute of the
FFT algorithm.
29User Manual 1176.8980.02 ─ 02
Page 30

R&S®VSE-K96
2
FFT
N
1
2
,
2
FFTFFT
NN
1
2
FFT
N
2
1
,
2
1
FFTFFT
NN
Measurement Basics
General Information on OFDM Signals
Table 4-1: Relationship between FFT length and subcarrier range
FFT Length N
even
odd
OFDM system sample rate
In an OFDM system, an FFT (with the length N
FFT bin corresponds to one subcarrier. For each FFT bin, one sample must be cap-
tured in the time domain for each OFDM symbol. The minimum number of samples
required for the measurement is thus the number of subcarriers (or the number of FFT
bins), multiplied by the number of symbols to measure. To avoid intersymbol interference, the cyclic prefix is added as the guard interval.
No_samples
Generally, the number of samples acquired per second is referred to as the sample
rate. The sample rate required by a specific OFDM system is referred to as the OFDM
system sample rate. It depends on parameters that characterize the OFDM system
and is defined by the following equation:
FFT
= (<FFT_size> + <CyclicPrefixLength>) * <No_symbols_to_measure>
min
DC-Carrier Offset Range
) is performed for each symbol. Each
FFT
SR
For the R&S VSE OFDM VSA application to demodulate OFDM symbols, it is important that the number of acquired samples in the application corresponds to the OFDM
system sample rate.
Symbols
A row of cells at the same time is called symbol.
The symbol number is the row index of a time frequency matrix. The first symbol gets
the number '0'.
Allocation Matrix
The allocation matrix defines the complete frame and subdivides the OFDM system
into the following cell types:
●
●
●
●
= <carrier_spacing>* <FFT_size>
OFDM
Pilot cells: Contain known values and are used for various synchronization and
parameter estimation purposes
Data cells: Contain the user data or "payload" of the transmission. The modulation
format of the data cells must be known or can be estimated in a modulation estimation block.
"Don't Care" cells: Cells that are not evaluated for EVM measurement, but contain signal power
Zero cells: Contain no signal power at all; Typically these are guard carriers
around DC or at the edges of the carrier axis.
30User Manual 1176.8980.02 ─ 02
Page 31

R&S®VSE-K96
Measurement Basics
General Information on OFDM Signals
Figure 4-6: Example of an allocation matrix
Pilot Matrix
A pilot matrix contains known complex numbers in the matrix cells, which are defined
as pilot cells in the allocation matrix. Within the analyzer, the pilot matrix is correlated
with the received time frequency matrix to get the frame start and the frequency offset
of the received signal relative to the given allocation matrix.
31User Manual 1176.8980.02 ─ 02
Page 32

R&S®VSE-K96
2
1
2
1
j
2
1
2
1
j
2
1
2
1
j
2
1
2
1
j
Measurement Basics
General Information on OFDM Signals
Figure 4-7: Example of a pilot matrix
Constellation Vector
A constellation vector contains all possible numbers in the complex plane that belong
to a specific modulation format. Constellation vectors must be defined for each possible data modulation format. The magnitude within the constellation vectors must be
scaled according to the pilot matrix. One entry in the constellation vector is called 'constellation point'.
Differential modulation is not supported. The respective absolute modulation scheme
must be used instead (e.g. QPSK instead of DQPSK). Periodically rotated constellations are not supported. The set union of all constellations must be used instead (e.g.
8PSK instead of PI/4-DQPSK).
Constellation Point
Figure 4-8: QPSK constellation vector
Modulation Matrix
A modulation matrix contains numbers to the underlying constellation vector for each
cell, which is defined as data cell in the allocation matrix. Clusters of data cells with the
same modulation therefore share the same number. A data cell can also contain an
unused number, that is a number for which no constellation vector is defined. In this
case, all data cells sharing that number are assumed to use one and only one of the
32User Manual 1176.8980.02 ─ 02
Page 33

R&S®VSE-K96
Measurement Basics
General Information on OFDM Signals
valid constellation vectors. This method can be used within the OFDM-VSA to allow
automatic modulation detection.
Figure 4-9: Example of a modulation matrix
4.1.2.3 Preamble Description
The OFDM demodulator shall support synchronization on repetitive preamble symbols.
A repetitive preamble contains several repetitions of one time domain block. The Fig-
ure 4-10 shows exemplarily the parameterization of a repetitive preamble symbol,
which contains a five times repetition of block T. The allocation matrix can have an
arbitrary offset to the begin of the preamble symbol. If the offset is zero or negative, the
preamble is also contained within the frame and is used for further estimation processes.
Preamble Symbol
T1
T2 T3 T4 T5
BlockLength
Frame Offset
Undefined
Symbol 0
Frame (Structure Matrix)
Figure 4-10: Description of a Repetitive Preamble Symbol
33User Manual 1176.8980.02 ─ 02
Page 34

R&S®VSE-K96
0
0.05 0.1 0.15 0.2 0.25 0.3 0. 35 0.4 0.45 0.5
-100
-90
-80
-70
-60
-50
-40
-30
-20
-10
0
10
Normalized Frequency
Frequency Response [dB]
Adjustable Channel Filter
Low
Normal
High
4.2 Signal Processing
4.2.1 Channel Filter
Measurement Basics
Signal Processing
● Channel Filter..........................................................................................................34
● OFDM Measurement...............................................................................................35
The R&S VSE OFDM VSA application can use the internal channel filter of the instrument or apply an adjustable channel filter. The filter bandwidth of the internal channel
filter is fully equalized within the digital hardware.
Alternatively to the internal filters, you can apply a channel filter with adjustable bandwidth and slope characteristics to the input signal. The R&S VSE OFDM VSA application then designs a window-based finite impulse response filter. The bandwidth is
defined as two times the 6-dB cutoff frequency. The 50-dB cutoff frequency determines
the slope characteristics.
Choosing the correct filter settings is a trade-off between selectivity and filter impulse
response length. A steep filter leads to superior selectivity between adjacent channels.
On the other hand, such a filter has a long channel impulse response, which can produce intersymbol interference if used in systems with small guard intervals. Flat filters
require a higher distance between channels and will possibly attenuate the outer carriers of the signal. In contrast, the channel impulse response is short and suited for systems with short guard intervals.
The adjustable channel filter performs a decimation at its output. Thus, the user-definable maximum output sample rate is reduced compared to the internal filter setting.
34User Manual 1176.8980.02 ─ 02
Page 35

R&S®VSE-K96
4.2.2 OFDM Measurement
Measurement Basics
Signal Processing
Capture
Buffer
R_lk
R_lk
A_lk
ON / OFF
Burst
Detection
Freq / Clock
Estimation
A_lk A_lk
Freq / Clock
Estimation
PREAMBLE / CP
Time
Sync
Compensate
Freq. / Clock Offset Channel CPE / Gain
Compensate
Freq. / Clock Offset Channel CPE / Gain
Freq. Offset
Rough
Compensate
Channel
Estimation
Channel
Estimation
FFT_SHIFT
FFT
CPE / Gain
Estimation
Data Aided Block Measurement Block
CPE / Gain
Estimation
User Defined Compensation
EVM Measurement
R_lk w/o frame sync
Compensate
Modulation
Detection
MAX_BIN_OFFSET
Frame
Sync
Synchronization Block
Data
Decision
PHASE_TRACKING
TIMING_TRACKING
GAIN_TRACKING
CHANNEL_COMP
R_lk
A_lkR_lk
Pilot Aided Block
Figure 4-11: Block Diagram of OFDM VSA
The block diagram in Figure 4-11 shows the OFDM VSA measurement from the cap-
ture buffer containing the I/Q data to the actual analysis block. The signal processing
chain can be divided in four major blocks:
●
Synchronization Block
●
Pilot Aided Block
●
Data Aided Block
●
Measurement Block
4.2.2.1 Synchronization Block
The synchronization starts with a burst detection that extracts transmission areas
within a burst signal by a power threshold. For seamless transmission, as is the case in
most broadcast systems, it is possible to bypass this block. The following time synchronization uses either the preamble or the cyclic prefix of each OFDM symbol to find the
optimum starting point for the FFT by a correlation metric. If preamble synchronization
is selected, the correlation is done between successive blocks of a repetitive preamble
structure. Alternatively, the cyclic prefix synchronization correlates the guard interval of
each symbol with the end of the FFT part. Both methods additionally return an estimation of the fractional frequency offset by evaluating the phase of the correlation maximum. This frequency offset has to be compensated before the FFT to avoid intercarrier
interference.
By default, the FFT starting point is put in the center of the guard interval assuming a
symmetric impulse response, but it can optionally be shifted within the guard interval.
After performing the FFT for each available OFDM symbol, a time-frequency matrix R
with symbol index l and subcarrier index k is available.
l,k
35User Manual 1176.8980.02 ─ 02
Page 36

R&S®VSE-K96
4.2.2.2 Pilot Aided Block
Measurement Basics
Signal Processing
The following frame synchronization determines the frame start within this matrix and
the integer carrier frequency offset. This is done by a two dimensional correlation of R
with the known pilot matrix from the configuration file. To avoid unnecessary computing
time for signals with low frequency offset, the search length in the frequency direction
can be limited by a control parameter.
Furthermore, a threshold for the reliability of time and frame synchronization can be
defined to ensure only correct frames are evaluated. This is particularly useful for 5G
signals, for example, in which the pilot structure in the second half of the frame is similar, but not identical to the first half. In this case, frame synchronization may be off by
half a frame, but since the pilots do not match completely, the reliability is poor. Thus,
the EVM results will also be poor. By defining a threshold, only the correctly synchronized frames are evaluated.
The pilot aided block within the signal processing chain uses the predefined pilot cells
for parameter estimation and subsequent compensation of the signal impairments. It
starts with maximum likelihood estimation of the remaining frequency error and sample
clock offset. While a frequency error leads to a phase offset linearly increasing with
time, the clock offset introduces an additional phase error linearly increasing with frequency. The estimator determines the most probable parameters that lead to the
phase offsets observed on the pilot cells. The resulting offset values are compensated
in the frequency domain by re-rotating the phase of the R
matrix. However, for severe
l,k
clock offsets it can be necessary to resample the received signal in the time domain
and repeat the FFT stage.
l,k
The subsequent channel estimator determines the channel transfer function at the
known pilot positions and uses interpolation to get a complete frequency response vector for all subcarriers. It does not extrapolate the channel transfer function for the guard
carriers (which are defined by zero or "don't care" cell types). Since the presented
measurement system is intended for stationary channels, the interpolation is performed
along the frequency direction only. The node values on the frequency axis are determined by averaging all available pilots of each subcarrier over time. Depending on the
layout of the pilots on the frequency axis, an interpolation filter bank with optimum Wiener filter coefficients is calculated in advance. The Wiener filter is designed under the
assumption that the maximum impulse response length does not exceed the cyclic prefix length.
Although the channel is assumed to be stationary, common phase error and power
level variations are estimated symbol by symbol over the complete frame. This takes
settling effects of oscillators and power amplifiers into account. All estimated impairments are fully compensated to get an optimum signal for the subsequent modulationdetection and data decision stage.
The modulation-detection block determines the modulation type of the data cells.
Either each carrier or each symbol can be assigned to one specific constellation. Alternatively, the modulation information provided in the configuration file is evaluated to
extract clusters of data cells with consistent modulation. The estimator uses a maximum likelihood approach, where each cluster of data cells is compared with all possible modulation hypotheses and the most probable constellation for each cluster is used
36User Manual 1176.8980.02 ─ 02
Page 37

R&S®VSE-K96
4.2.2.3 Data Aided Block
4.2.2.4 Measurement Block
Measurement Basics
Signal Processing
for the subsequent data decision. The data decision block finally outputs a reference
signal matrix A
which is an optimum estimate of the actual transmitted OFDM frame.
l,k
The data aided block can be activated optionally to refine the parameter estimations
with the help of the reference signal. Whereas the previous stages could only include
pilot cells for the estimation algorithms, the data aided part can treat data cells as additional pilots. This increases the accuracy of the estimates in good signal to noise environments without data decision errors. However, if the reference signal matrix A
con-
l,k
tains falsely decided data cells, the data aided estimation part can corrupt the results
and should be omitted.
The last part of the signal processing chain comprises the user defined compensation
and the measurement of modulation quality. The measurement block takes the
received OFDM symbols R
A
to calculate the error vector magnitude (EVM). The received OFDM symbols can
l,k
and the previously determined reference OFDM symbols
l,k
optionally be compensated by means of phase, timing and level deviations as well as
the channel transfer function.
37User Manual 1176.8980.02 ─ 02
Page 38

R&S®VSE-K96
5 Configuring OFDM VSA Measurements
Configuring OFDM VSA Measurements
Configuration Overview
OFDM VSA measurements require an additional application on the R&S VSE.
General R&S VSE functions
The application-independent functions for general tasks on the R&S VSE are also
available for OFDM VSA measurements and are described in the R&S VSE base software user manual. In particular, this comprises the following functionality:
●
Controlling instruments and capturing I/Q data
●
Data management
●
General software preferences and information
● Configuration Overview...........................................................................................38
● Signal Description................................................................................................... 40
● Input and Frontend Settings....................................................................................43
● Trigger Settings.......................................................................................................58
● Data Acquisition...................................................................................................... 61
● Burst Search........................................................................................................... 64
● Result Ranges.........................................................................................................64
● Synchronization, Demodulation and Tracking.........................................................65
● Adjusting Settings Automatically.............................................................................69
5.1 Configuration Overview
Throughout the measurement configuration, an overview of the most important currently defined settings is provided in the "Overview".
The "Overview" is displayed when you select the "Overview" icon in the main toolbar,
or the "Meas Setup > Overview" menu item.
38User Manual 1176.8980.02 ─ 02
Page 39

R&S®VSE-K96
Configuring OFDM VSA Measurements
Configuration Overview
Figure 5-1: Configuration "Overview" for OFDM VSA measurements
In addition to the main measurement settings, the "Overview" provides quick access to
the main settings dialog boxes. Thus, you can easily configure an entire measurement
channel from input over processing to evaluation by stepping through the dialog boxes
as indicated in the "Overview".
In particular, the "Overview" provides quick access to the following configuration dialog
boxes (listed in the recommended order of processing):
1. Signal Description
See Chapter 5.2, "Signal Description", on page 40
2. Input/Frontend
See Chapter 5.3, "Input and Frontend Settings", on page 43
3. Trigger
See Chapter 5.4, "Trigger Settings", on page 58
4. Data Acquisition
See Chapter 5.5, "Data Acquisition", on page 61
5. Burst Search
See Chapter 5.6, "Burst Search", on page 64
6. Result Range
See Chapter 5.7, "Result Ranges", on page 64
7. Synchronization and Demodulation Settings
See Chapter 5.8, "Synchronization, Demodulation and Tracking", on page 65
8. Tracking
See Chapter 5.8, "Synchronization, Demodulation and Tracking", on page 65
9. Result Configuration
39User Manual 1176.8980.02 ─ 02
Page 40

R&S®VSE-K96
Configuring OFDM VSA Measurements
Signal Description
See Chapter 7.1, "Result Configuration", on page 97
To configure settings
► Select any button in the "Overview" to open the corresponding dialog box.
Select a setting in the channel bar (at the top of the measurement channel tab) to
change a specific setting.
Preset Channel............................................................................................................. 40
Specifics for ..................................................................................................................40
Preset Channel
Select the "Preset Channel" button in the lower left-hand corner of the "Overview" to
restore all measurement settings in the current channel to their default values.
Remote command:
SYSTem:PRESet:CHANnel[:EXEC] on page 120
Specifics for
The channel may contain several windows for different results. Thus, the settings indicated in the "Overview" and configured in the dialog boxes vary depending on the
selected window.
Select an active window from the "Specifics for" selection list that is displayed in the
"Overview" and in all window-specific configuration dialog boxes.
The "Overview" and dialog boxes are updated to indicate the settings for the selected
window.
5.2 Signal Description
You must describe the expected input signal so that the R&S VSE OFDM VSA application application can compare the measured signal to the expected reference signal.
You can load an existing configuration file, or create one interactively using a wizard for
the current input signal (see Chapter 6, "Creating a Configuration File Using the R&S
VSE-K96 Configuration File Wizard", on page 72).
The R&S VSE OFDM VSA application provides some sample files for I/Q input data
and configuration files in the
C:\ProgramData\Rohde-Schwarz\VSE\<version_no>\user\OFDM-VSA directory.
40User Manual 1176.8980.02 ─ 02
Page 41

R&S®VSE-K96
Configuring OFDM VSA Measurements
Signal Description
Use Configuration File...................................................................................................41
Load Configuration File.................................................................................................41
Create New Configuration File......................................................................................42
FFT Size........................................................................................................................42
Cyclic Prefix Length...................................................................................................... 42
Advanced Cyclic Prefix Configuration...........................................................................42
Different cyclic prefix lengths.........................................................................................42
└ CP definition per range (Symbols / Samples).................................................43
Block Length................................................................................................................. 43
Frame Start Offset.........................................................................................................43
Use Configuration File
Determines whether the configuration from the currently loaded file is used for the
measurement. Alternatively, you can configure the OFDM signal manually.
Remote command:
CONFigure:SYSTem:CFILe on page 124
Load Configuration File
Opens a file selection dialog box to select the configuration (.XML) file for the measurement.
The name and some configuration details of the loaded file are displayed in the "Signal
Description" dialog box.
Note: Configuration files with more than 100 different modulation types cannot be loaded.
Tip:
41User Manual 1176.8980.02 ─ 02
Page 42

R&S®VSE-K96
Configuring OFDM VSA Measurements
Signal Description
You can load a configuration file simply by selecting it in a file explorer and dragging it
to the R&S VSE software. Drop it into the "Measurement Group Setup" window or the
channel bar for any R&S VSE OFDM VSA application channel.
Remote command:
MMEMory:LOAD:CFGFile on page 124
Create New Configuration File
Opens a wizard that helps you create a new configuration file interactively. See Chap-
ter 6, "Creating a Configuration File Using the R&S VSE-K96 Configuration File Wizard", on page 72.
FFT Size
Defines the length of an OFDM symbol in the time domain as the number of samples.
This setting determines the number of samples used as input for each FFT calculation.
This setting is not available if a configuration file is active (see "Use Configuration File"
on page 41). In this case, the FFT length defined in the file is displayed for reference
only.
Remote command:
CONFigure[:SYMBol]:NFFT on page 123
Cyclic Prefix Length
Specifies the length of the cyclic prefix (CP) area of an OFDM symbol in the time
domain as a number of samples. The CP length must be smaller than or equal to the
FFT Size.
Remote command:
CONFigure[:SYMBol]:NGUard<cp> on page 123
Advanced Cyclic Prefix Configuration
Additional settings for non-conventional cyclic prefixes are displayed when you select
the "Advanced" button, and hidden when you select "Basic".
By default, "Conventional Mode" is assumed, that is: each OFDM symbol has the
same cyclic prefix length. Thus, only the basic CP settings are shown.
Remote command:
CONFigure[:SYMBol]:GUARd:MODE on page 121
Different cyclic prefix lengths
Some OFDM signals change their cyclic prefix over time (e.g. 802.11ac). This setting
defines the behavior in such a case.
"Periodic"
One "slot" that consists of the two defined ranges is repeated over
and over until the number of symbols specified by the result range
parameter is reached. The ranges are repeated periodically, first
range 1, then range 2, then range 1, etc.
Figure 5-2: Non-Conventional Cyclic Prefix Case: Periodic Mode
42User Manual 1176.8980.02 ─ 02
Page 43

R&S®VSE-K96
Configuring OFDM VSA Measurements
Input and Frontend Settings
"Non-Periodic"
Remote command:
CONFigure[:SYMBol]:GUARd:PERiodic on page 122
CP definition per range (Symbols / Samples) ← Different cyclic prefix lengths
For each range, configure the number of symbols the CP length is applied to, and the
length of the CP as a number of samples.
For non-periodic CPs, the length of the second range cannot be specified. It is extended to the end of the demodulated frame.
Remote command:
CONFigure[:SYMBol]:GUARd:NSYMbols<cp> on page 122
CONFigure[:SYMBol]:NGUard<cp> on page 123
A fixed preamble has a different cyclic prefix length than the rest of
the frame (e.g. WLAN 802.11ac signals). In this case, the length of
the second range is extended until the end of the demodulated frame.
Therefore, the length of the second range cannot be specified in this
case.
Figure 5-3: Non-Conventional Cyclic Prefix Case: Non-Periodic Mode
Block Length
Instead of using the cyclic prefix for the time synchronization, the R&S VSE OFDM
VSA application can also use a preamble that contains repetitive blocks of samples (if
available in the signal). This setting specifies the length of one data block within the
repetitive preamble as a number of samples.
Remote command:
CONFigure:PREamble:BLENgth on page 121
Frame Start Offset
Specifies the time offset from the preamble start to the actual frame start as a number
of samples.
Remote command:
CONFigure:PREamble:FOFFset on page 121
5.3 Input and Frontend Settings
Access: "Overview" > "Input/Frontend"
Or: "Input & Output"
The R&S VSE can evaluate signals from different input sources.
43User Manual 1176.8980.02 ─ 02
Page 44

R&S®VSE-K96
5.3.1 Input Source Settings
Configuring OFDM VSA Measurements
Input and Frontend Settings
The frequency and amplitude settings represent the "frontend" of the measurement
setup.
For the R&S VSE OFDM VSA application, no output settings are available.
● Input Source Settings..............................................................................................44
● Frequency Settings................................................................................................. 54
● Amplitude Settings.................................................................................................. 55
Access: "Overview" > "Input/Frontend" > "Input Source"
Or: "Input & Output" > "Input Source"
The R&S VSE can control the input sources of the connected instruments.
● Radio Frequency Input............................................................................................44
● Oscilloscope Baseband Input..................................................................................49
● I/Q File Input............................................................................................................52
5.3.1.1 Radio Frequency Input
Or: "Input & Output" > "Input Source" > "Radio Frequency"
The default input source for the connected instrument is "Radio Frequency". Depending on the connected instrument, different input parameters are available.
44User Manual 1176.8980.02 ─ 02
Page 45

R&S®VSE-K96
Configuring OFDM VSA Measurements
Input and Frontend Settings
Figure 5-4: RF input source settings for an R&S FSW with B2000 option
If the Frequency Response Correction option (R&S VSE-K544) is installed, the R&S
VSE OFDM VSA application also supports frequency response correction using Touchstone (.snp) files or .fres files.
For details on user-defined frequency response correction, see the R&S VSE Base
Software User Manual.
Input Type (Instrument / File)........................................................................................46
Instrument..................................................................................................................... 46
Input Coupling ..............................................................................................................46
Impedance ................................................................................................................... 46
Direct Path ................................................................................................................... 46
High Pass Filter 1 to 3 GHz ..........................................................................................47
YIG-Preselector ............................................................................................................47
B2000 State.................................................................................................................. 47
RTO Sample Rate.........................................................................................................47
RTO Splitter Mode.........................................................................................................48
RTO IP Address............................................................................................................48
Preselector State...........................................................................................................48
45User Manual 1176.8980.02 ─ 02
Page 46

R&S®VSE-K96
Configuring OFDM VSA Measurements
Input and Frontend Settings
Preselector Mode..........................................................................................................48
10 dB Minimum Attenuation..........................................................................................49
Input Selection.............................................................................................................. 49
Input Type (Instrument / File)
Selects an instrument or a file as the type of input provided to the channel.
Remote command:
INSTrument:BLOCk:CHANnel[:SETTings]:SOURce<si> on page 130
INPut<ip>:SELect on page 129
Instrument
Specifies a configured instrument to be used for input.
Input Coupling
The RF input of the connected instrument can be coupled by alternating current (AC)
or direct current (DC).
AC coupling blocks any DC voltage from the input signal. This is the default setting to
prevent damage to the instrument. Very low frequencies in the input signal may be distorted.
However, some specifications require DC coupling. In this case, you must protect the
instrument from damaging DC input voltages manually. For details, refer to the data
sheet.
Remote command:
INPut<ip>:COUPling on page 126
Impedance
For some measurements, the reference impedance for the measured levels of the connected instrument can be set to 50 Ω or 75 Ω.
Select 75 Ω if the 50 Ω input impedance is transformed to a higher impedance using a
75 Ω adapter of the RAZ type. (That corresponds to 25Ω in series to the input impedance of the instrument.) The correction value in this case is 1.76 dB = 10 log (75Ω/
50Ω).
Remote command:
INPut<ip>:IMPedance on page 128
Direct Path
Enables or disables the use of the direct path for small frequencies.
In spectrum analyzers, passive analog mixers are used for the first conversion of the
input signal. In such mixers, the LO signal is coupled into the IF path due to its limited
isolation. The coupled LO signal becomes visible at the RF frequency 0 Hz. This effect
is referred to as LO feedthrough.
To avoid the LO feedthrough the spectrum analyzer provides an alternative signal path
to the A/D converter, referred to as the direct path. By default, the direct path is
selected automatically for RF frequencies close to zero. However, this behavior can be
deactivated. If "Direct Path" is set to "Off" , the spectrum analyzer always uses the analog mixer path.
46User Manual 1176.8980.02 ─ 02
Page 47

R&S®VSE-K96
Configuring OFDM VSA Measurements
Input and Frontend Settings
"Auto"
"Off"
Remote command:
INPut<ip>:DPATh on page 126
High Pass Filter 1 to 3 GHz
Activates an additional internal high-pass filter for RF input signals from 1 GHz to
3 GHz. This filter is used to remove the harmonics of the analyzer to measure the harmonics for a DUT, for example.
This function may require an additional hardware option on the connected instrument.
Remote command:
INPut<ip>:FILTer:HPASs[:STATe] on page 127
YIG-Preselector
Activates or deactivates the YIG-preselector, if available on the connected instrument.
Remote command:
INPut<ip>:FILTer:YIG[:STATe] on page 127
B2000 State
Activates the optional 2 GHz bandwidth extension (R&S FSW-B2000).
(Default) The direct path is used automatically for frequencies close
to zero.
The analog mixer path is always used.
Note: The R&S VSE software supports input from a connected R&S FSW with a
B2000 option installed. However, the R&S FSW interface to the oscilloscope must be
set up and aligned directly on the instrument before the R&S VSE software can start
analyzing the input.
The analysis bandwidth is defined in the data acquisition settings of the application as
usual. Note that the maximum bandwidth cannot be restricted manually as for other
bandwidth extension options.
Manual operation on the connected oscilloscope, or remote operation other than by the
R&S VSE, is not possible while the B2000 option is active.
Remote command:
SYSTem:COMMunicate:RDEVice:OSCilloscope[:STATe] on page 131
RTO Sample Rate
Determines whether the 10 GHz mode (default) or 20 GHz mode of the connected
oscilloscope is used. The 20 GHz mode achieves a higher decimation gain, but
reduces the record length by half.
This setting is only available if an R&S RTO is used to obtain the input data, either
directly or via the R&S FSW.
When using an oscilloscope as the input source, the following restrictions apply for this
setting:
●
Only available for R&S RTO models that support a sample rate of 20 GHz (see
data sheet)
●
For R&S RTO-2064 with an analysis bandwidth of 4 GHz or larger, a sample rate of
20 GHZ is always used
47User Manual 1176.8980.02 ─ 02
Page 48

R&S®VSE-K96
Configuring OFDM VSA Measurements
Input and Frontend Settings
Remote command:
Input source R&S FSW via R&S RTO:
SYSTem:COMMunicate:RDEVice:OSCilloscope:SRATe on page 132
Input source R&S RTO:
INPut<ip>:RF:CAPMode:WAVeform:SRATe on page 129
RTO Splitter Mode
Activates the use of the power splitter inserted between the [IF 2 GHZ OUT] connector
of the R&S FSW and the [CH1] and [CH3] input connectors of the oscilloscope. Note
that this mode requires an additional alignment with the power splitter.
For details see the R&S FSW I/Q Analyzer and I/Q Input User Manual.
Remote command:
SYSTem:COMMunicate:RDEVice:OSCilloscope:PSMode[:STATe] on page 132
RTO IP Address
When using the optional 2 GHz bandwidth extension (R&S FSW-B2000) with an R&S
FSW as the connected instrument, the entire measurement, as well as both instruments, are controlled by the R&S VSE software. Thus, the instruments must be connected via LAN, and the TCPIP address of the oscilloscope must be defined in the
R&S VSE software.
For tips on how to determine the computer name or TCPIP address, see the oscilloscope's user documentation.
Remote command:
SYSTem:COMMunicate:RDEVice:OSCilloscope:TCPip on page 132
Preselector State
Turns the preselector on and off.
When you turn on the preselector, you can configure the characteristics of the prese-
lector and add the preamplifier into the signal path.
When you turn off the preselector, the signal bypasses the preselector and the pream-
plifier, and is fed into the input mixer directly.
Remote command:
INPut<ip>:PRESelection[:STATe] on page 128
Preselector Mode
Selects the preselection filters to be applied to the measurement.
"Auto"
"Auto Wide"
Automatically applies all available bandpass filters in a measurement.
Available with the optional preamplifier.
Automatically applies the wideband filters consecutively:
●
Lowpass 40 MHz
●
Bandpass 30 MHz to 2250 MHz
●
Bandpass 2 GHz to 8 GHz
●
Bandpass 8 GHz to 26.5 GHz
Available with the optional preselector.
48User Manual 1176.8980.02 ─ 02
Page 49

R&S®VSE-K96
Configuring OFDM VSA Measurements
Input and Frontend Settings
"Auto Narrow"
"Manual"
Remote command:
INPut<ip>:PRESelection:SET on page 128
10 dB Minimum Attenuation
Turns the availability of attenuation levels of less than 10 dB on and off.
When you turn on this feature, the attenuation is always at least 10 dB. This minimum
attenuation protects the input mixer and avoids accidental setting of 0 dB, especially if
you measure DUTs with high RFI voltage.
When you turn it off, you can also select attenuation levels of less than 10 dB.
The setting applies to a manual selection of the attenuation as well as the automatic
selection of the attenuation.
Remote command:
INPut<ip>:ATTenuation:PROTection[:STATe] on page 125
Automatically applies the most suitable narrowband preselection filters in a measurement, depending on the bandwidth you have
selected.
For measurement frequencies up to 30 MHz, the connected instrument uses combinations of lowpass and highpass filters. For higher
frequencies, the connected instrument uses bandpass filters.
Available with the optional preselector.
Applies the filter settings you have defined manually.
Input Selection
Selects the RF input connector you would like to use for a measurement.
Note that you cannot use both RF inputs simultaneously.
Remote command:
Global: INPut<ip>:TYPE on page 130
5.3.1.2 Oscilloscope Baseband Input
Access: "Overview" > "Input" > "Input Source" > "Oscilloscope Baseband"
49User Manual 1176.8980.02 ─ 02
Page 50

R&S®VSE-K96
Configuring OFDM VSA Measurements
Input and Frontend Settings
If the Frequency Response Correction option (R&S VSE-K544) is installed, the R&S
VSE OFDM VSA application also supports frequency response correction using Touchstone (.snp) files or .fres files.
For details on user-defined frequency response correction, see the R&S VSE Base
Software User Manual.
Input Type (Instrument / File)........................................................................................50
Instrument..................................................................................................................... 50
Input Source..................................................................................................................50
I/Q Mode ...................................................................................................................... 51
I/Q Skew........................................................................................................................51
Impedance ................................................................................................................... 51
Center Frequency ........................................................................................................ 51
Signal Path....................................................................................................................52
Input Type (Instrument / File)
Selects an instrument or a file as the type of input provided to the channel.
Remote command:
INSTrument:BLOCk:CHANnel[:SETTings]:SOURce<si> on page 130
INPut<ip>:SELect on page 129
Instrument
Specifies a configured instrument to be used for input.
Input Source
Configures the source of input (and channel) on the selected instrument to be used.
"RF"
"Channel 1 | Channel 2 | Channel 3 | Channel 4 "
"Channel 1,2 (I+Q)"
"Channel 1,3 (I+Q) | Channel 2,4 (I+Q)"
"Channels 1-4 (diff. I+Q)"
Radio Frequency ("RF INPUT" connector)
Oscilloscope input channel 1, 2, 3, or 4
I/Q data provided by oscilloscope input channels 1 and 2 (for oscilloscopes with 2 channels only)
I/Q data provided by oscilloscope input channels 1 and 3, or 2 and 4
(for oscilloscopes with 4 channels only)
Differential I/Q data provided by oscilloscope input channels (for oscilloscopes with 4 channels only):
Channel 1: I (pos.)
Channel 2: Ī (neg.)
Channel 3: Q (pos.)
Channel 4: Ǭ (neg.)
Remote command:
INSTrument:BLOCk:CHANnel[:SETTings]:SOURce<si>:TYPE on page 130
50User Manual 1176.8980.02 ─ 02
Page 51

R&S®VSE-K96
Configuring OFDM VSA Measurements
Input and Frontend Settings
I/Q Mode
Defines the format of the input signal.
"I/Q"
"I Only / Low IF I"
Remote command:
INPut<ip>:IQ:OSC:TYPE on page 136
I/Q Skew
Compensates for skewed I/Q values, e.g. due to different input cables
Both components of the complex input signal (in-phase component,
quadrature component) are filtered and resampled to the sample rate
of the application.
The input signal at the channel providing I data is filtered and resampled to the sample rate of the application.
The input signal is down-converted with the center frequency (Low IF
I).
Define the delay values individually for the I and Q channels. For differential input,
changing the positive skew automatically also changes the negative skew (but not vice
versa).
Depending on the connected oscilloscope, values between ±100 ns are allowed.
Remote command:
INPut<ip>:IQ:OSC:SKEW:I on page 135
INPut<ip>:IQ:OSC:SKEW:I:INVerted on page 135
INPut<ip>:IQ:OSC:SKEW:Q on page 135
INPut<ip>:IQ:OSC:SKEW:Q:INVerted on page 135
Impedance
For some measurements, the reference impedance for the measured levels of the connected instrument can be set to 50 Ω or 75 Ω.
Select 75 Ω if the 50 Ω input impedance is transformed to a higher impedance using a
75 Ω adapter of the RAZ type. (That corresponds to 25Ω in series to the input impedance of the instrument.) The correction value in this case is 1.76 dB = 10 log (75Ω/
50Ω).
Remote command:
INPut<ip>:IMPedance on page 128
Center Frequency
Defines the center frequency for Oscilloscope Baseband Input.
Note: If the analysis bandwidth to either side of the defined center frequency exceeds
the allowed range, an error is displayed. In this case, adjust the center frequency or the
analysis bandwidth.
51User Manual 1176.8980.02 ─ 02
Page 52

R&S®VSE-K96
5.3.1.3 I/Q File Input
Configuring OFDM VSA Measurements
Input and Frontend Settings
Remote command:
[SENSe:]FREQuency:CENTer on page 137
Signal Path
Illustrates the signal path used for the currrent baseband input settings.
Access: "Overview" > "Input/Frontend" > "Input Source" > "I/Q File"
Or: "Input & Output" > "Input Source" > "I/Q File"
Alternatively to "live" data input from a connected instrument, measurement data to be
analyzed by the R&S VSE software can also be provided "offline" by a stored data file.
This allows you to perform a measurement on any instrument, store the results to a
file, and analyze the stored data partially or as a whole at any time using the R&S VSE
software.
The R&S VSE OFDM VSA application provides some sample files for I/Q input data
(and configuration files) in the
C:\ProgramData\Rohde-Schwarz\VSE\<version_no>\user\OFDM-VSA directory.
Loading a file via drag&drop
As of R&S VSE software version 1.30, you can load a file simply by selecting it in a file
explorer and dragging it to the R&S VSE software. Drop it into the "Measurement
Group Setup" window or the channel bar for any channel. The channel is automatically
configured for file input, if necessary. If the file contains all essential information, the file
input is immediately displayed in the channel. Otherwise, the "Recall I/Q Recording"
dialog box is opened for the selected file so you can enter the missing information.
If the file contains data from multiple channels (e.g. from LTE measurements), it can be
loaded to individual input sources, if the application supports them.
For details see the R&S VSE Base Software User Manual.
The "Input Source" settings defined in the "Input" dialog box are identical to those configured for a specific channel in the "Measurement Group Setup" window.
(See "Controlling Instruments and Capturing Data" in the R&S VSE User Manual).
52User Manual 1176.8980.02 ─ 02
Page 53

R&S®VSE-K96
Configuring OFDM VSA Measurements
Input and Frontend Settings
If the Frequency Response Correction option (R&S VSE-K544) is installed, the R&S
VSE OFDM VSA application also supports frequency response correction using Touchstone (.snp) files or .fres files.
For details on user-defined frequency response correction, see the R&S VSE Base
Software User Manual.
Input Type (Instrument / File)........................................................................................53
Input File....................................................................................................................... 53
Zero Padding.................................................................................................................53
Input Type (Instrument / File)
Selects an instrument or a file as the type of input provided to the channel.
Remote command:
INSTrument:BLOCk:CHANnel[:SETTings]:SOURce<si> on page 130
INPut<ip>:SELect on page 129
Input File
Specifies the I/Q data file to be used for input.
Select "Select File" to open the "Load I/Q File" dialog box.
(See "Data Management - Loading the I/Q Data File" in the R&S VSE User Manual).
Zero Padding
Enables or disables zero padding for input from an I/Q data file that requires resampling. For resampling, a number of samples are required due to filter settling. These
samples can either be taken from the provided I/Q data, or the R&S VSE software can
add the required number of samples (zeros) at the beginning and end of the file.
53User Manual 1176.8980.02 ─ 02
Page 54

R&S®VSE-K96
5.3.2 Frequency Settings
Configuring OFDM VSA Measurements
Input and Frontend Settings
If enabled, the required number of samples are inserted as zeros at the beginning and
end of the file. The entire input data is analyzed. However, the additional zeros can
effect the determined spectrum of the I/Q data. If zero padding is enabled, a status
message is displayed.
If disabled (default), no zeros are added. The required samples for filter settling are
taken from the provided I/Q data in the file. The start time in the R&S VSE Player is
adapted to the actual start (after filter settling).
Note: You can activate zero padding directly when you load the file, or afterwards in
the "Input Source" settings.
Remote command:
INPut<ip>:FILE:ZPADing on page 126
Access: "Input & Output" > "Frequency"
Center Frequency ........................................................................................................ 54
Center Frequency Stepsize...........................................................................................55
Frequency Offset ..........................................................................................................55
Center Frequency
Defines the center frequency of the signal in Hertz.
0 Hz ≤ f
f
and span
max
center
≤ f
max
depend on the instrument and are specified in the data sheet.
min
Note: For file input, you can shift the center frequency of the current measurement
compared to the stored measurement data. The maximum shift depends on the sample rate of the file data.
If the file does not provide the center frequency, it is assumed to be 0 Hz.
In order to ensure that the input data remains within the valid analysis bandwidth,
define the center frequency and the analysis bandwidth for the measurement such that
the following applies:
54User Manual 1176.8980.02 ─ 02
Page 55

R&S®VSE-K96
Configuring OFDM VSA Measurements
Input and Frontend Settings
Remote command:
[SENSe:]FREQuency:CENTer on page 137
Center Frequency Stepsize
Defines the step size when scrolling through center frequency values. The step size
can be set to a predefined value, or it can be manually set to a user-defined value.
"Auto"
"Manual"
Remote command:
[SENSe:]FREQuency:CENTer:STEP:AUTO on page 138
[SENSe:]FREQuency:CENTer:STEP on page 138
Frequency Offset
Shifts the displayed frequency range along the x-axis by the defined offset.
This parameter has no effect on the instrument's hardware, or on the captured data or
on data processing. It is simply a manipulation of the final results in which absolute frequency values are displayed. Thus, the x-axis of a spectrum display is shifted by a
constant offset if it shows absolute frequencies, but not if it shows frequencies relative
to the signal's center frequency.
A frequency offset can be used to correct the display of a signal that is slightly distorted
by the measurement setup, for example.
The allowed values range from -100 GHz to 100 GHz. The default setting is 0 Hz.
Remote command:
[SENSe:]FREQuency:OFFSet on page 138
The step size is set to the default value of 1 MHz.
Defines a user-defined step size for the center frequency. Enter the
step size in the "Value" field.
5.3.3 Amplitude Settings
Access: "Overview" > "Input/Frontend" > "Amplitude"
Or: "Input & Output" > "Amplitude"
Amplitude settings determine how the connected instrument must process or display
the expected input power levels.
Which amplitude settings are available depends on the connected instrument.
55User Manual 1176.8980.02 ─ 02
Page 56

R&S®VSE-K96
Configuring OFDM VSA Measurements
Input and Frontend Settings
Reference Level ...........................................................................................................56
└ Shifting the Display ( Offset ).......................................................................... 56
RF Attenuation ............................................................................................................. 57
└ Attenuation Mode / Value ...............................................................................57
Using Electronic Attenuation ........................................................................................57
Input Settings ............................................................................................................... 58
└ Preamplifier ....................................................................................................58
Reference Level
Defines the expected maximum reference level. Signal levels above this value may not
be measured correctly. This is indicated by an "IF Overload" status display.
The reference level can also be used to scale power diagrams; the reference level is
then used as the maximum on the y-axis.
Since the hardware of the connected instrument is adapted according to this value, it is
recommended that you set the reference level close above the expected maximum signal level. Thus you ensure an optimum measurement (no compression, good signal-tonoise ratio).
Remote command:
DISPlay[:WINDow<n>]:TRACe<t>:Y[:SCALe]:RLEVel on page 139
Shifting the Display ( Offset ) ← Reference Level
Defines an arithmetic level offset. This offset is added to the measured level. In some
result displays, the scaling of the y-axis is changed accordingly.
Define an offset if the signal is attenuated or amplified before it is fed into the R&S VSE
so the application shows correct power results. All displayed power level results are
shifted by this value.
The setting range is ±200 dB in 0.01 dB steps.
56User Manual 1176.8980.02 ─ 02
Page 57

R&S®VSE-K96
Configuring OFDM VSA Measurements
Input and Frontend Settings
Note, however, that the internal reference level (used to adjust the hardware settings to
the expected signal) ignores any "Reference Level Offset" . Thus, it is important to
keep in mind the actual power level the R&S VSE must handle. Do not rely on the displayed reference level (internal reference level = displayed reference level - offset).
Remote command:
DISPlay[:WINDow<n>]:TRACe<t>:Y[:SCALe]:RLEVel:OFFSet on page 139
RF Attenuation
Defines the attenuation applied to the RF input of the R&S VSE.
Attenuation Mode / Value ← RF Attenuation
The RF attenuation can be set automatically as a function of the selected reference
level (Auto mode). This ensures that no overload occurs at the "RF Input" connector for
the current reference level. It is the default setting.
In "Manual" mode, you can set the RF attenuation in 1 dB steps (down to 0 dB). Other
entries are rounded to the next integer value. The range is specified in the data sheet.
If the defined reference level cannot be set for the defined RF attenuation, the reference level is adjusted accordingly and the warning "limit reached" is displayed.
NOTICE! Risk of hardware damage due to high power levels. When decreasing the
attenuation manually, ensure that the power level does not exceed the maximum level
allowed at the RF input, as an overload may lead to hardware damage.
Remote command:
INPut<ip>:ATTenuation on page 140
INPut<ip>:ATTenuation:AUTO on page 140
Using Electronic Attenuation
If the (optional) Electronic Attenuation hardware is installed on the connected instrument, you can also activate an electronic attenuator.
In "Auto" mode, the settings are defined automatically; in "Manual" mode, you can
define the mechanical and electronic attenuation separately.
Note: Note that restrictions may apply concerning which frequencies electronic attenuation is available for, depending on which instrument is connected to the R&S VSE
software. Check your instrument documentation for details.
In "Auto" mode, RF attenuation is provided by the electronic attenuator as much as
possible to reduce the amount of mechanical switching required. Mechanical attenuation may provide a better signal-to-noise ratio, however.
When you switch off electronic attenuation, the RF attenuation is automatically set to
the same mode (auto/manual) as the electronic attenuation was set to. Thus, the RF
attenuation can be set to automatic mode, and the full attenuation is provided by the
mechanical attenuator, if possible.
If the defined reference level cannot be set for the given attenuation, the reference
level is adjusted accordingly and the warning "limit reached" is displayed in the status
bar.
Remote command:
INPut<ip>:EATT:STATe on page 141
INPut<ip>:EATT:AUTO on page 141
INPut<ip>:EATT on page 141
57User Manual 1176.8980.02 ─ 02
Page 58

R&S®VSE-K96
Configuring OFDM VSA Measurements
Trigger Settings
Input Settings
Some input settings affect the measured amplitude of the signal, as well.
The parameters "Input Coupling" and "Impedance" are identical to those in the "Input"
settings.
See Chapter 5.3.1.1, "Radio Frequency Input", on page 44.
Preamplifier ← Input Settings
If the (optional) internal preamplifier hardware is installed on the connected instrument,
a preamplifier can be activated for the RF input signal.
You can use a preamplifier to analyze signals from DUTs with low output power.
Depending on the connected instrument, different settings are available. See the
instrument's documentation for details.
Remote command:
INPut<ip>:GAIN:STATe on page 142
INPut<ip>:GAIN[:VALue] on page 142
5.4 Trigger Settings
or: "Input & Output" > "Trigger"
Trigger settings determine when the input signal is measured. Which settings are available depends on the connected instrument.
External triggers from one of the [TRIGGER INPUT/OUTPUT] connectors on the connected instrument are also available.
Trigger Source ..............................................................................................................59
└ Free Run ........................................................................................................59
└ External Trigger / Trigger Channel X.............................................................. 59
└ External Analog...............................................................................................59
└ RF Power .......................................................................................................59
└ Magnitude (Offline) ........................................................................................ 60
Trigger Level ................................................................................................................ 60
Drop-Out Time ..............................................................................................................60
Trigger Offset ............................................................................................................... 60
58User Manual 1176.8980.02 ─ 02
Page 59

R&S®VSE-K96
Configuring OFDM VSA Measurements
Trigger Settings
Hysteresis .................................................................................................................... 60
Trigger Holdoff ..............................................................................................................61
Slope ............................................................................................................................61
Trigger Source
Selects the trigger source. If a trigger source other than "Free Run" is set, "TRG" is displayed in the channel bar and the trigger source is indicated.
Note that the availability of trigger sources depends on the connected instrument.
Remote command:
TRIGger[:SEQuence]:SOURce on page 146
Free Run ← Trigger Source
No trigger source is considered. Data acquisition is started manually or automatically
and continues until stopped explicitly.
Remote command:
TRIG:SOUR IMM, see TRIGger[:SEQuence]:SOURce on page 146
External Trigger / Trigger Channel X ← Trigger Source
Data acquisition starts when the signal fed into the specified input connector or input
channel of the connected instrument meets or exceeds the specified trigger level.
Note: Which input and output connectors are available depends on the connected
instrument. For details, see the instrument's documentation.
For a connected R&S RTO, the following signals are used as trigger input:
●
"External Trigger": "EXT TRIGGER INPUT" connector on rear panel of instrument
●
"Trigger Channel 2"/"Trigger Channel 3"/"Trigger Channel 4": Input at channel connectors "CH 2/3/4" on front panel of instrument - if not used as an input source
Remote command:
TRIG:SOUR EXT, TRIG:SOUR EXT2, TRIG:SOUR EXT3, TRIG:SOUR EXT4
See TRIGger[:SEQuence]:SOURce on page 146
External Analog ← Trigger Source
Data acquisition starts when the signal fed into the "EXT TRIGGER INPUT" connector
on the oscilloscope meets or exceeds the specified trigger level.
This trigger source is only available if the optional 2 GHz bandwidth extension (R&S
FSW-B2000) is active in power splitter mode. For details see the R&S FSW I/Q Analyzer and I/Q Input User Manual.
Remote command:
TRIG:SOUR EXT, see TRIGger[:SEQuence]:SOURce on page 146
RF Power ← Trigger Source
Defines triggering of the measurement via signals which are outside the displayed
measurement range.
For this purpose, the software uses a level detector at the first intermediate frequency.
The resulting trigger level at the RF input depends on the RF attenuation and preampli-
fication. For details on available trigger levels, see the instrument's data sheet.
59User Manual 1176.8980.02 ─ 02
Page 60

R&S®VSE-K96
Configuring OFDM VSA Measurements
Trigger Settings
Note: If the input signal contains frequencies outside of this range (e.g. for fullspan
measurements), the measurement may be aborted. A message indicating the allowed
input frequencies is displayed in the status bar.
A "Trigger Offset" , "Trigger Polarity" and "Trigger Holdoff" (to improve the trigger stability) can be defined for the RF trigger, but no "Hysteresis" .
Remote command:
TRIG:SOUR RFP, see TRIGger[:SEQuence]:SOURce on page 146
Magnitude (Offline) ← Trigger Source
For (offline) input from a file, rather than an instrument. Triggers on a specified signal
level.
Remote command:
TRIG:SOUR MAGN, see TRIGger[:SEQuence]:SOURce on page 146
Trigger Level
Defines the trigger level for the specified trigger source.
For details on supported trigger levels, see the data sheet.
Remote command:
TRIGger[:SEQuence]:LEVel[:EXTernal<port>] on page 144
Drop-Out Time
Defines the time the input signal must stay below the trigger level before triggering
again.
Remote command:
TRIGger[:SEQuence]:DTIMe on page 143
Trigger Offset
Defines the time offset between the trigger event and the start of the measurement.
Offset > 0: Start of the measurement is delayed
Offset < 0: Measurement starts earlier (pretrigger)
(If supported by the connected instrument.)
Remote command:
TRIGger[:SEQuence]:HOLDoff[:TIME] on page 143
Hysteresis
Defines the distance in dB to the trigger level that the trigger source must exceed
before a trigger event occurs. Setting a hysteresis avoids unwanted trigger events
caused by noise oscillation around the trigger level.
This setting is only available for "IF Power" or "Magnitude (Offline)" trigger sources.
The range of the value depends on the connected instrument.
Remote command:
TRIGger[:SEQuence]:IFPower:HYSTeresis on page 144
TRIGger[:SEQuence]:MAPower:HYSTeresis on page 146
60User Manual 1176.8980.02 ─ 02
Page 61

R&S®VSE-K96
5.5 Data Acquisition
Configuring OFDM VSA Measurements
Data Acquisition
Trigger Holdoff
Defines the minimum time (in seconds) that must pass between two trigger events.
Trigger events that occur during the holdoff time are ignored.
Remote command:
TRIGger[:SEQuence]:IFPower:HOLDoff on page 144
TRIGger[:SEQuence]:MAPower:HOLDoff on page 145
Slope
For all trigger sources except time, you can define whether triggering occurs when the
signal rises to the trigger level or falls down to it.
When using the optional 2 GHz bandwidth extension (R&S FSW-B2000) with an IF
power trigger, only rising slopes can be detected.
Remote command:
TRIGger[:SEQuence]:SLOPe on page 146
Configure how data is to be acquired in the "Data Acquisition" dialog box.
Capture Time.................................................................................................................62
Capture Length............................................................................................................. 62
Swap I/Q ...................................................................................................................... 62
Sample Rate................................................................................................................. 62
Maximum Bandwidth.....................................................................................................62
Channel Filter State...................................................................................................... 63
61User Manual 1176.8980.02 ─ 02
Page 62

R&S®VSE-K96
Configuring OFDM VSA Measurements
Data Acquisition
6-dB Bandwidth.............................................................................................................63
50-dB Bandwidth...........................................................................................................63
Refresh..........................................................................................................................63
Capture Time
Specifies the duration (and therefore the amount of data) to be captured in the capture
buffer. If the capture time is too short, demodulation will fail. In particular, if the result
length does not fit in the capture buffer, demodulation will fail.
For OFDM VSA, this means:
≥
Capture Time
(ResultLength) * (FFTSize + CyclicPrefixLength) / SampleRate
Remote command:
[SENSe:]SWEep:TIME on page 150
Capture Length
Defines the number of samples to be captured during each measurement. The
required Capture Time is adapted accordingly.
A maximum of 8 000 000 samples can be captured.
Remote command:
[SENSe:]SWEep:LENGth on page 150
Swap I/Q
Activates or deactivates the inverted I/Q modulation. If the I and Q parts of the signal
from the DUT are interchanged, the R&S VSE can do the same to compensate for it.
On I and Q signals are interchanged
Inverted sideband, Q+j*I
Off I and Q signals are not interchanged
Normal sideband, I+j*Q
Remote command:
[SENSe:]SWAPiq on page 149
Sample Rate
Defines the I/Q data sample rate of the R&S VSE.
Note that the sample rate in the R&S VSE software must correspond to the OFDM sys-
tem sample rate, otherwise demodulation may fail.
Remote command:
TRACe:IQ:SRATe on page 150
Maximum Bandwidth
Depending on the connected instrument, the maximum bandwidth to be used by the
R&S VSE for I/Q data acquisition can be restricted. This setting is only available if a
bandwidth extension option is installed on the connected instrument. Otherwise the
maximum bandwidth is determined automatically.
The available values depend on the instrument and the installed bandwidth extension
options. For details see the instrument's documentation.
62User Manual 1176.8980.02 ─ 02
Page 63

R&S®VSE-K96
Configuring OFDM VSA Measurements
Data Acquisition
Remote command:
TRACe:IQ:WBANd[:STATe] on page 151
TRACe:IQ:WBANd:MBWidth on page 151
Channel Filter State
Defines whether a channel filter is applied to the I/Q data before OFDM demodulation.
Remote command:
INPut:FILTer:CHANnel[:STATe] on page 148
6-dB Bandwidth
Configures the bandwidth of the channel filter at which an attenuation of 6 dB is
reached (see Figure 5-5). The filter bandwidth cannot be higher than the current Sam-
ple Rate. If necessary, the filter bandwidth is adapted to the current sample rate.
Figure 5-5: Definition of filter bandwidths
Remote command:
INPut:FILTer:CHANnel:SDBBw on page 148
50-dB Bandwidth
Configures the 50-dB bandwidth of the channel filter. The 50-dB bandwidth is the bandwidth at which the filter reaches an attenuation of 50 dB (see Figure 5-5). This bandwidth must always be larger than the "6-dB Bandwidth" on page 63. If necessary, the
50-dB bandwidth is adapted to the current 6-dB bandwidth.
Remote command:
INPut:FILTer:CHANnel:FDBBw on page 149
Refresh
Access: "Auto Set" toolbar:
Repeats the evaluation of the data currently in the capture buffer without capturing new
data. This is useful after changing settings, for example filters or evaluation ranges.
Remote command:
INITiate:REFResh on page 148
63User Manual 1176.8980.02 ─ 02
Page 64

R&S®VSE-K96
5.6 Burst Search
Configuring OFDM VSA Measurements
Result Ranges
Access: "Overview" > "Burst Search"
Or: "Meas Setup" > "Burst Search"
During a burst search, the capture buffer is searched for bursts that comply with the
signal description. If no bursts are detected, the entire capture buffer is considered to
be a single burst. A list of the detected bursts is passed on to the next processing
stage. See also Chapter 4.2.2, "OFDM Measurement", on page 35.
Burst Search State........................................................................................................64
Burst Search State
Activates or deactivates a burst search.
Remote command:
[SENSe:]DEMod:FORMat:BURSt on page 151
5.7 Result Ranges
The result range is an extract from the capture buffer and defines the data basis used
for further analysis.
Max No of Frames to Analyze.......................................................................................64
Result Length................................................................................................................65
Max No of Frames to Analyze
Defines the maximum number of OFDM frames from the current capture buffer to be
included in analysis.
64User Manual 1176.8980.02 ─ 02
Page 65

R&S®VSE-K96
5.8 Synchronization, Demodulation and Tracking
Configuring OFDM VSA Measurements
Synchronization, Demodulation and Tracking
If a configuration file is available, the contents of the file determine the frame. If no file
is available, a single result range is considered a frame.
Remote command:
[SENSe:]DEMod:FORMat:MAXFrames on page 152
Result Length
Configures the number of OFDM symbols per frame to be analyzed. Note that this is
not the maximum, but a precise number. If this number is higher than the actual number of symbols found in the signal, the result is not considered a frame, and not analyzed.
Remote command:
[SENSe:]DEMod:FORMat:NOFSymbols on page 152
Access: "Overview" > "Sync / Demod"/"Tracking"
Or: "Meas Setup" > "Sync / Demod"/"Tracking"
The following settings determine how the input signal is synchronized, demodulated,
and tracked.
65User Manual 1176.8980.02 ─ 02
Page 66

R&S®VSE-K96
Configuring OFDM VSA Measurements
Synchronization, Demodulation and Tracking
Time Synchronization....................................................................................................66
Parameter Estimation....................................................................................................66
Modulation Detection.................................................................................................... 66
Synchronization Thresholds..........................................................................................67
└ Minimum Time Sync Metric.............................................................................67
└ Minimum Frame Sync Metric.......................................................................... 67
Phase Tracking............................................................................................................. 67
Timing Tracking.............................................................................................................68
Level Tracking...............................................................................................................68
Channel Compensation.................................................................................................68
FFT Shift relative to Cyclic Prefix Length......................................................................68
Maximum Carrier Offset................................................................................................68
Cyclic Delay.................................................................................................................. 69
Time Synchronization
Specifies the synchronization method in the time domain.
"Cyclic Prefix"
"Preamble"
Remote command:
[SENSe:]DEMod:TSYNc on page 155
The cyclic prefix method performs a correlation of the cyclic prefix
with the end of the FFT interval.
The preamble method searches for the repetitive preamble blocks.
Parameter Estimation
Defines which parts of the OFDM signal are used for the parameter estimation.
This setting is only available if a configuration file is loaded and active (see "Use Con-
figuration File" on page 41). In manual configuration mode without a configuration file,
no parameter estimation is performed.
"Pilot-Aided"
"Pilot And
Data-Aided"
Remote command:
[SENSe:]DEMod:FSYNc on page 154
Modulation Detection
Specifies how the modulation of the data cells is detected.
The R&S VSE OFDM VSA application can use the modulation configured in the config-
uration file for each cell. Alternatively, the R&S VSE OFDM VSA application tries to
detect the used modulation automatically based on the available modulation types
(which are also defined in the configuration file). For automatic detection, the R&S VSE
OFDM VSA application analyzes the modulation type per carrier or per symbol.
This setting is only available if a configuration file is loaded and active (see "Use Con-
figuration File" on page 41).
"Configuration
File"
Uses only the predefined pilot cells for parameter estimation
Uses both pilots and detected data cells for an additional synchroni-
zation step.
The modulation format configured for the cell is used
Note that if the actual modulation of a constellation point differs from
the configured modulation for the cell, the EVM is increased.
66User Manual 1176.8980.02 ─ 02
Page 67

R&S®VSE-K96
Configuring OFDM VSA Measurements
Synchronization, Demodulation and Tracking
"Symbolwise"
"Carrierwise"
Remote command:
[SENSe:]DEMod:MDETect on page 154
Synchronization Thresholds
If you require a particular reliability in synchronization results, define thresholds for the
success of synchronization required to calculate results. The current reliability is indicated in the Signal Flow.
High thresholds are useful if several similar, but not identical frames, must be distinguished. In this case, it is important that the application synchronizes only to the correct frame in order to obtain correct results.
On the other hand, if the signal quality is poor, only a low level of reliability in synchronization can be achieved. In this case, high thresholds may prevent the application
from evaluating any frames at all.
For details see Chapter 4.2.2.1, "Synchronization Block", on page 35.
Minimum Time Sync Metric ← Synchronization Thresholds
Defines the minimum reliability required for time synchronization.
Values between 0 and 1 are allowed, where:
●
0: low threshold, a very poor reliability is sufficient to synchronize successfully
(always fulfilled)
●
1: high threshold, time synchronization must be absolutely reliable to be successful
(only possible for ideal signal).
The default value is 0.5, that means: for a reliability of 50 %, time synchronization is
successful.
A common modulation format for all data cells within one OFDM symbol is determined
A common modulation format for all data cells within one OFDM carrier is determined
Minimum Frame Sync Metric ← Synchronization Thresholds
Defines the minimum reliability rate for frame synchronization.
Values between 0 and 1 are allowed, where:
●
0: low threshold, a very poor reliability is sufficient to synchronize successfully
(always fulfilled)
●
1: high threshold, frame synchronization must be absolutely reliable to be successful (only possible for ideal signal).
The default value is 0.5, that means: for a reliability of 50 %, frame synchronization is
successful.
Phase Tracking
Defines whether phase tracking is used to improve the signal quality. The compensation is done on a per-symbol basis.
This setting is only available if a configuration file is loaded and active (see "Use Con-
figuration File" on page 41).
Remote command:
SENSe:TRACking:PHASe on page 155
67User Manual 1176.8980.02 ─ 02
Page 68

R&S®VSE-K96
Configuring OFDM VSA Measurements
Synchronization, Demodulation and Tracking
Timing Tracking
Defines whether timing tracking is used to improve the signal quality (for sample clock
deviations). The compensation is done on a per-symbol basis.
This setting is only available if a configuration file is loaded and active (see "Use Con-
figuration File" on page 41).
Remote command:
SENSe:TRACking:TIME on page 156
Level Tracking
Defines whether level tracking is used to improve the signal quality (for power level
deviations). The compensation is done on a per-symbol basis.
This setting is only available if a configuration file is loaded and active (see "Use Con-
figuration File" on page 41).
Remote command:
SENSe:TRACking:LEVel on page 155
Channel Compensation
Defines whether channel tracking is used to improve the signal quality (for the channel
transfer function). The compensation is done on a per-carrier basis.
This setting is only available if a configuration file is loaded and active (see "Use Con-
figuration File" on page 41).
Remote command:
[SENSe:]COMPensate:CHANnel on page 153
FFT Shift relative to Cyclic Prefix Length
Defines the starting point of the FFT relative to the cyclic prefix length. Thus, you can
shift the FFT start sample within the guard interval. This is useful if relevant parts of the
channel impulse response fall outside the cyclic prefix interval.
A value of 0 is the first sample; a value of 1.0 is the last sample of the cyclic prefix.
Remote command:
[SENSe:]DEMod:FFTShift on page 154
Maximum Carrier Offset
The R&S VSE OFDM VSA application can compensate for possible carrier offsets.
However, searching for offsets slows down the measurement. This setting defines the
range of carriers in which the R&S VSE OFDM VSA application searches for an offset.
68User Manual 1176.8980.02 ─ 02
Page 69

R&S®VSE-K96
5.9 Adjusting Settings Automatically
Configuring OFDM VSA Measurements
Adjusting Settings Automatically
To eliminate the search for carrier offset altogether, set the number of carriers to 0. In
this case, the center frequency offset must be less than half the carrier distance to
obtain useful results.
This setting is only available if a configuration file is loaded and active (see "Use Con-
figuration File" on page 41).
Remote command:
[SENSe:]DEMod:COFFset on page 153
Cyclic Delay
Defines a cyclic shift of the FFT values for each OFDM symbol on the transmitter end
before adding the cyclic prefix. This known shift should be compensated in the receiver
to get a correct channel phase response.
Remote command:
[SENSe:]DEMod:CDD on page 153
Access: "Auto Set" toolbar
Depending on the connected instrument, some settings can be adjusted by the instrument automatically according to the current measurement settings. To do so, a measurement is performed. The duration of this measurement can be defined automatically
or manually.
To activate the automatic adjustment of a setting from the R&S VSE, select the corresponding function in the "Auto Set" toolbar or in the configuration dialog box for the setting, where available.
Adjusting settings automatically during triggered measurements
When you select an auto adjust function a measurement is performed to determine the
optimal settings. If you select an auto adjust function for a triggered measurement, you
are asked how the connected instrument should behave:
●
(default:) The measurement for adjustment waits for the next trigger
●
The measurement for adjustment is performed without waiting for a trigger.
The trigger source is temporarily set to "Free Run". After the measurement is completed, the original trigger source is restored. The trigger level is adjusted as follows for IF Power and RF Power triggers:
Trigger Level = Reference Level - 15 dB
Remote command:
[SENSe:]ADJust:CONFigure:TRIGger on page 158
Setting the Reference Level Automatically ( Auto Level ).........................................70
Auto Settings Configuration.......................................................................................... 70
69User Manual 1176.8980.02 ─ 02
Page 70

R&S®VSE-K96
Configuring OFDM VSA Measurements
Adjusting Settings Automatically
└ Automatic Measurement Time Mode and Value............................................. 70
└ Upper Level Hysteresis ..................................................................................70
└ Lower Level Hysteresis ..................................................................................71
Setting the Reference Level Automatically ( Auto Level )
The connected instrument automatically determines the optimal reference level for the
current input data. At the same time, the internal attenuators and the preamplifier are
adjusted so the signal-to-noise ratio is optimized, while signal compression, clipping
and overload conditions are minimized. This function is not available on all supported
instruments.
Remote command:
[SENSe:]ADJust:LEVel on page 158
Auto Settings Configuration
For some automatic settings, additional parameters can be configured. The "Auto Set
Config" dialog box is available when you select the icon from the "Auto Set" toolbar.
Automatic Measurement Time Mode and Value ← Auto Settings Configuration
To determine the optimal reference level automatically, a level measurement is performed on the connected instrument. You can define whether the duration of this measurement is determined automatically or manually.
To define the duration manually, enter a value in seconds.
Remote command:
[SENSe:]ADJust:CONFigure[:LEVel]:DURation:MODE on page 157
[SENSe:]ADJust:CONFigure[:LEVel]:DURation on page 156
Upper Level Hysteresis ← Auto Settings Configuration
When the reference level is adjusted automatically using the Auto Level function, the
internal attenuators and the preamplifier (if available) of the connected instrument are
also adjusted. To avoid frequent adaptation due to small changes in the input signal,
you can define a hysteresis. This setting defines an upper threshold the signal must
exceed (compared to the last measurement) before the reference level is adapted
automatically.
Remote command:
[SENSe:]ADJust:CONFigure:HYSTeresis:UPPer on page 158
70User Manual 1176.8980.02 ─ 02
Page 71

R&S®VSE-K96
Configuring OFDM VSA Measurements
Adjusting Settings Automatically
Lower Level Hysteresis ← Auto Settings Configuration
When the reference level is adjusted automatically using the Auto Level function, the
internal attenuators and the preamplifier (if available) of the connected instrument are
also adjusted. To avoid frequent adaptation due to small changes in the input signal,
you can define a hysteresis. This setting defines a lower threshold the signal must fall
below (compared to the last measurement) before the reference level is adapted automatically.
Remote command:
[SENSe:]ADJust:CONFigure:HYSTeresis:LOWer on page 157
71User Manual 1176.8980.02 ─ 02
Page 72

R&S®VSE-K96
6 Creating a Configuration File Using the R&S
Creating a Configuration File Using the R&S VSE-K96 Configuration File Wizard
VSE-K96 Configuration File Wizard
The R&S VSE-K96 Configuration File Wizard (referred to as "wizard" here) is a tool
that supports you in defining the configuration of your OFDM signal directly in the R&S
VSE OFDM VSA application.
The R&S VSE OFDM VSA application has to know the configuration of the OFDM system to be able to demodulate an OFDM signal correctly. By "configuration", we refer to
the complete description of the OFDM system:
●
The number of subcarriers (i.e. the FFT size)
●
The number of symbols
●
The number of samples in the cyclic prefix (also referred to as guard length)
●
The position (carrier number, symbol number) of the
– Pilot symbols
– Data symbols
– Zero symbols
– "Do not care" symbols
●
The modulation format of the data symbols (e.g. QPSK, 16QAM etc.)
●
The I/Q values of the pilot symbols
●
Optional: the definition of the preamble
This section describes how to generate the OFDM system configuration file in the R&S
VSE OFDM VSA application for the current input signal.
The R&S VSE OFDM VSA application provides some sample files for I/Q input data
and configuration files in the
C:\ProgramData\Rohde-Schwarz\VSE\<version_no>\user\OFDM-VSA directory.
To start the R&S VSE-K96 Configuration File Wizard
1. Configure the required input signal in the R&S VSE OFDM VSA application, either
from a connected instrument or from an input file.
2. Select "Overview" > "Signal Description" > "Create New Configuration File".
● Understanding the R&S VSE-K96 Configuration File Wizard Display.................... 73
● Configuration Steps.................................................................................................79
● Reference of Wizard Menu Functions.....................................................................86
● Example: Creating a Configuration File from an Input Signal................................. 89
72User Manual 1176.8980.02 ─ 02
Page 73

R&S®VSE-K96
6.1 Understanding the R&S VSE-K96 Configuration File
Creating a Configuration File Using the R&S VSE-K96 Configuration File Wizard
Understanding the R&S VSE-K96 Configuration File Wizard Display
Wizard Display
The following figure shows the R&S VSE-K96 Configuration File Wizard user interface.
All different areas are labeled. They are explained in more detail in the following sections.
Figure 6-1: Elements of the wizard user interface
1 = Menu functions (see Chapter 6.3, "Reference of Wizard Menu Functions", on page 86)
2 = Progress indicator (see Chapter 6.2, "Configuration Steps", on page 79)
3 = Access to wizard help (see Chapter 6.3.4, "Help", on page 89)
4 = General signal information
5 = Constellation view
6 = Matrix view
● General Signal Information..................................................................................... 73
● Constellation View...................................................................................................74
● Matrix View..............................................................................................................76
6.1.1 General Signal Information
General information on the configured signal is provided here for reference. Some values are derived from the configuration settings in the R&S VSE OFDM VSA application, others are generated by the wizard. The values displayed here are also included
in the generated configuration file. If specified in the description, some values are
shown in the "Signal Description" dialog box when you load the file in the R&S VSE
OFDM VSA application.
73User Manual 1176.8980.02 ─ 02
Page 74

R&S®VSE-K96
Creating a Configuration File Using the R&S VSE-K96 Configuration File Wizard
Understanding the R&S VSE-K96 Configuration File Wizard Display
Number of Carriers........................................................................................................74
Number of Symbols.......................................................................................................74
Cyclic Prefix Length...................................................................................................... 74
System name................................................................................................................ 74
System description........................................................................................................74
Number of Carriers
Indicates the number of subcarriers used by the signal. This value corresponds to the
FFT Size.
Number of Symbols
The number of OFDM symbols corresponds to the result length configured in the
"Result Range" settings in the R&S VSE OFDM VSA application (see "Result Length"
on page 65).
Cyclic Prefix Length
Defines the length of the cyclic prefix area between two OFDM symbols in samples.
The cyclic prefix area defines the guard interval and is expected to contain a copy of
the samples at the end of the OFDM symbol.
System name
Defines the name of the stored configuration file. The default name is C:/temp/
MyData. You can change the name in the "Settings" (see Chapter 6.3.3, "Settings",
on page 88).
System description
Provides a description of the signal configured in the file.
By default, the following main characteristics are included:
●
Number of Carriers
●
Number of Symbols
●
Cyclic Prefix Length
If you deactivate the "Default" setting, you can overwrite the text with any other.
6.1.2 Constellation View
The Constellation View shows the constellation points (= I/Q values) for the OFDM
cells in the defined result range. Using this view, you can assign the measured constellation points to specific cell types for the allocation matrix in the configuration file.
74User Manual 1176.8980.02 ─ 02
Page 75

R&S®VSE-K96
Creating a Configuration File Using the R&S VSE-K96 Configuration File Wizard
Understanding the R&S VSE-K96 Configuration File Wizard Display
Figure 6-2: Constellation view
Selection tool
Sets the cursor action to selection mode. All cells in the selection area are highlighted
in color. The Selection Mode / Zoom Mode indicator shows which color is used. Any
subsequent functions are applied to the selected cells.
Click in the diagram and move the cursor, holding the mouse button, to display a dotted rectangle and define the selection area.
Press the [Shift] key and click in the diagram to extend the selection to neighboring
symbols.
Press the [CTRL] key and click in the diagram to add further (non-neighboring) points
to the existing selection.
Zoom
Sets the cursor action to zoom mode. Click in the diagram and move the cursor, holding the mouse button, to display a rectangle and define the zoom area. The zoomed
area is enlarged in the display. Repeat the action to zoom in further.
The Selection Mode / Zoom Mode indicator above the diagram shows that zoom mode
is active.
To change the cursor function and stop zooming, select Selection tool.
Zoom Off
Displays the diagram in its original size.
75User Manual 1176.8980.02 ─ 02
Page 76

R&S®VSE-K96
Creating a Configuration File Using the R&S VSE-K96 Configuration File Wizard
Understanding the R&S VSE-K96 Configuration File Wizard Display
Note that this function does not change the cursor function. To change the cursor function and stop zooming, select Selection tool.
The Selection Mode / Zoom Mode indicator above the diagram shows that zoom mode
is active.
Selection Mode / Zoom Mode indicator
Indicates whether the current cursor action is to select cells (selection mode), or to
define the zoom area. In selection mode, the color used to highlight selected cells is
indicated.
Show non-allocated constellation points
Displays or hides the constellation points not yet allocated to a cell type in the Constellation diagram.
Show allocated constellation points
Displays or hides the constellation points already allocated to a cell type in the Constellation diagram.
6.1.3 Matrix View
The Matrix View displays two different diagrams of the measured symbols (y-axis) vs
carriers (x-axis).
●
Power vs Symbol vs Carrier diagram
Shows a colored rectangle (= OFDM cell) for each symbol and carrier, with a different color for each measured power range. Thus, you can easily identify symbols
with a similar power value, which therefore most likely belong to the same cell type.
76User Manual 1176.8980.02 ─ 02
Page 77

R&S®VSE-K96
Creating a Configuration File Using the R&S VSE-K96 Configuration File Wizard
Understanding the R&S VSE-K96 Configuration File Wizard Display
Figure 6-3: Matrix view with Power vs Symbol vs Carrier diagram
Either a colored or a black-and-white (gray shades) power indication is available
(see Black and white color map/ Colored color map). The darker the color, the
lower the power of the corresponding OFDM cell.
●
Allocation Matrix
Shows a colored point for each allocated symbol and carrier, with a different color
for each cell type.
77User Manual 1176.8980.02 ─ 02
Page 78

R&S®VSE-K96
Creating a Configuration File Using the R&S VSE-K96 Configuration File Wizard
Understanding the R&S VSE-K96 Configuration File Wizard Display
Figure 6-4: Matrix view with Allocation Matrix
Optionally, the selected symbols can be highlighted in the matrix.
Similarly to the Constellation view, you can also select cells in the Matrix view to assign
them to specific cell types.
Black and white color map
The different modulation types in the Power vs Symbol vs Carrier diagram are displayed in different shades of black, white, and gray. The lighter the shade of gray, the
higher the power level in the OFDM cell.
Colored color map
The different modulation types in the Power vs Symbol vs Carrier diagram are displayed in different colors. The used colors are indicated in the legend above the diagram.
Highlight selected cells
The cells in the area selected by the Selection tool are highlighted in the Allocation
Matrix.
Selection Mode / Zoom Mode indicator
Indicates whether the current cursor action is to select cells (selection mode), or to
define the zoom area. In selection mode, the color used to highlight selected cells is
indicated.
78User Manual 1176.8980.02 ─ 02
Page 79

R&S®VSE-K96
Creating a Configuration File Using the R&S VSE-K96 Configuration File Wizard
Configuration Steps
Selection tool
Sets the cursor action to selection mode. All cells in the selection area are highlighted
in color. The Selection Mode / Zoom Mode indicator shows which color is used. Any
subsequent functions are applied to the selected cells.
Click in the diagram and move the cursor, holding the mouse button, to display a dotted rectangle and define the selection area.
Press the [Shift] key and click in the diagram to extend the selection to neighboring
symbols.
Press the [CTRL] key and click in the diagram to add further (non-neighboring) points
to the existing selection.
Zoom
Sets the cursor action to zoom mode. Click in the diagram and move the cursor, holding the mouse button, to display a rectangle and define the zoom area. The zoomed
area is enlarged in the display. Repeat the action to zoom in further.
The Selection Mode / Zoom Mode indicator above the diagram shows that zoom mode
is active.
To change the cursor function and stop zooming, select Selection tool.
Zoom Off
Displays the diagram in its original size.
Note that this function does not change the cursor function. To change the cursor func-
tion and stop zooming, select Selection tool.
The Selection Mode / Zoom Mode indicator above the diagram shows that zoom mode
is active.
6.2 Configuration Steps
The wizard guides you through the process of creating a configuration file. The progress bar (see Figure 6-1) indicates which step you are currently working on. When
you have completed all required steps, you will have created a configuration file that
can be imported to the R&S VSE OFDM VSA application for signal analysis.
● Step 1: (Optional:) Importing Existing Files.............................................................79
● Step 2: (Optional:) Adjusting the Analysis Region.................................................. 80
● Step 3: Synchronization.......................................................................................... 80
● Step 4: Gain Adjustment......................................................................................... 81
● Steps 5 + 6: Allocation of Signal Components........................................................82
● Step 7: Storing Results........................................................................................... 83
● (Optional:) Generating a Test Signal....................................................................... 84
6.2.1 Step 1: (Optional:) Importing Existing Files
The wizard requires demodulated data as input. When you open the wizard directly
from the R&S VSE OFDM VSA application, the demodulated data from the input signal
79User Manual 1176.8980.02 ─ 02
Page 80

R&S®VSE-K96
6.2.2 Step 2: (Optional:) Adjusting the Analysis Region
Creating a Configuration File Using the R&S VSE-K96 Configuration File Wizard
Configuration Steps
is stored in a .wizv file internally. The wizard automatically loads this file when it is
started and you start with step 2.
If a configuration file already exists, you can load it to the wizard and use it to create a
new one.
To import an existing configuration file
1. Select step 1 in the progress bar ("Step-by-Step").
2. Select the .wizv file to load.
The constellation diagram and allocation matrix are updated according to the
stored data.
By default, the result range configured in the R&S VSE OFDM VSA application defines
the number of symbols displayed in the Constellation diagram. If the result range was
correctly configured to comprise exactly one frame, you do not need to adjust the
analysis region.
If necessary, for example to select frame symbols from a capture buffer that was not
triggered, you can restrict the analysis region.
To restrict the analysis region
1. Select step 2 in the progress bar ("Step-by-Step").
2. Define the first and last symbols of the result range to be analyzed.
6.2.3 Step 3: Synchronization
The wizard can synchronize the measured data in terms of time, frequency, and phase,
automatically. If necessary, you can improve the synchronization manually.
80User Manual 1176.8980.02 ─ 02
Page 81

R&S®VSE-K96
Creating a Configuration File Using the R&S VSE-K96 Configuration File Wizard
Configuration Steps
To synchronize the measured data
1. Select step 3 in the progress bar.
2. Select "Auto" to perform automatic synchronization.
3. If necessary, move the sliders for timing, frequency, or phase until the constellation
diagram shows an optimal display.
Tip: Click directly on the "Phase" slider to rotate the constellation in 45° steps.
Click on the arrows of the slider or move the slider handle to rotate the constellation by smaller degrees.
6.2.4 Step 4: Gain Adjustment
The power gain for individual OFDM cells is determined in reference to the power measured for a specific constellation. It is recommended that you define a reference constellation that comprises a large number of cells with similar power. In most cases, the
data cells of the OFDM signal are a good selection to be used as a reference.
The reference can be defined automatically or manually.
To select the reference for gain adjustment
1. Select step 4 in the progress bar.
2. Select the constellation type to be used as a reference.
3. The "Radius" defines the area around the constellation point used to detect the
symbol and calculate the power of the symbol. As a rule, the radius should be
defined such that neighboring constellation markers do not overlap.
The currently used radius is indicated by a circle around the ideal constellation
points in the Constellation diagram.
81User Manual 1176.8980.02 ─ 02
Page 82

R&S®VSE-K96
6.2.5 Steps 5 + 6: Allocation of Signal Components
Creating a Configuration File Using the R&S VSE-K96 Configuration File Wizard
Configuration Steps
To adjust the gain
1. Select "Auto" to perform a gain estimation based on the power measured in the
selected constellation type.
2. To increase the reference gain, move the slider to the right.
To reduce the reference gain, move the slider to the left.
3. Select "OK" to define the measured power of the selected cells as the reference
power for gain settings of other cells.
In this step, you must configure the main characteristics of each OFDM cell. To do so,
you must select the OFDM cells that belong to a specific cell type, configure their characteristics, and then allocate them. The result is an allocation matrix that contains information for each OFDM cell of the current OFDM frame.
How to allocate the individual signal components
The characteristics that cells of the same type have in common are referred to as
"Constellation Markers".
Select constellation markers that match your demodulated constellation, or a subset of
your demodulated constellation. If you cannot see a clear constellation, improve the
synchronization as described in Chapter 6.2.3, "Step 3: Synchronization", on page 80.
1. Select step 5 in the progress bar.
Note: Steps 5 and 6 use the same display, therefore it is not necessary to switch
from step 5 to 6.
2. The selection from Step 4: Gain Adjustment is maintained, so you can allocate the
cell type used for gain adjustment first without further settings required.
For all other cell types, in the Constellation View, select the modulation type.
The symbols with the selected modulation are highlighted.
3. Alternatively, for example for "Don't care" cells for which no characteristic modula-
tion applies, define or edit the selection manually using the Selection tool.
4. Another characteristic stored for each cell is the gain value. By default, the refer-
ence power defined in Step 4: Gain Adjustment is assumed. Thus, a "Boosting"
factor of 1.000 - relative to the reference power - is defined. For cells with different
gain values, define a different boosting factor to be applied to the reference power.
● To determine the required boosting automatically from the constellation points,
select "Auto".
82User Manual 1176.8980.02 ─ 02
Page 83

R&S®VSE-K96
Creating a Configuration File Using the R&S VSE-K96 Configuration File Wizard
Configuration Steps
● If you know the required factor, click on the boosting value and enter the value
directly.
Note: The more accurate the boosting is defined, the more accurate the EVM
results in the R&S VSE OFDM VSA application.
5. The "Radius" defines the area around the ideal constellation point used to detect
the measured constellation points that correspond to the currently selected constellation type. As a rule, the radius should be selected such that the circles around the
ideal constellation points do not overlap.
If necessary, adapt the radius around the ideal constellation points to include all
and only constellation points that belong to the selected constellation type.
6. In the Constellation View, in the "Allocation" area, select the cell type of the
selected OFDM cells, for example "Pilot" or "Data".
7. Optionally, edit the name of the cell type which is used for the legend of the Allocation Matrix. By default, the cell type and modulation are used.
8. Select the checkmark and confirm the message to allocate the selected cells to the
selected cell type.
The cells are indicated in the color shown in the legend above the Allocation
Matrix. The cells are no longer displayed if you selected only Show non-allocated
constellation points in the Constellation View.
9. If necessary, you can revert the last allocation.
The allocated OFDM cells are indicated as non-allocated (but still selected).
10. Repeat these steps until all OFDM have been allocated. When the last cell type
has been allocated, a message is displayed asking you to store the results.
Tip: In the Constellation View, select Show non-allocated constellation points and
deselect "Show allocated constellation points" on page 76 to see which cells are
still missing in the Allocation Matrix.
6.2.6 Step 7: Storing Results
When you have allocated all constellation points in the Constellation diagram to a cell
type and configured all other settings as required, store the results to file. The resulting
configuration file can then be used for analysis in the R&S VSE OFDM VSA application.
To store a configuration file
1. At the end of Steps 5 + 6: Allocation of Signal Components, when all OFDM cells
have been allocated, you are automatically asked if you want to store the configuration file.
At any other point in the configuration process, select step 7 in the progress bar
("Step-by-Step" area) of the wizard, or select the "File" > "Save Configuration File"
menu item.
83User Manual 1176.8980.02 ─ 02
Page 84

R&S®VSE-K96
6.2.7 (Optional:) Generating a Test Signal
Creating a Configuration File Using the R&S VSE-K96 Configuration File Wizard
Configuration Steps
2. Select a file name and storage location for the configuration file.
3. Select "Save".
Once an allocation matrix has been defined, the wizard can create a suitable test signal according to the configuration. This is useful, for example, if you create a configuration file based on an existing file but do not have I/Q data for it. It is also possible to
create signals that are longer than the original data used to create the configuration
file.
84User Manual 1176.8980.02 ─ 02
Page 85

R&S®VSE-K96
Creating a Configuration File Using the R&S VSE-K96 Configuration File Wizard
Configuration Steps
Bursted / Continuous.....................................................................................................85
Number of Frames (Continuous)...................................................................................85
Number of Bursts (Bursted).......................................................................................... 85
Gap Length (Bursted)....................................................................................................85
Burst Length (Bursted)..................................................................................................85
Repetition Range (Bursted)...........................................................................................85
Data Symbols................................................................................................................85
Refresh..........................................................................................................................86
Save Signal...................................................................................................................86
Preview area................................................................................................................. 86
Bursted / Continuous
Defines the type of signal to be generated: a signal with one or more bursts, or a continuous waveform. Depending on the selected type, different signal characteristics are
available.
Number of Frames (Continuous)
For continuous waveforms, the contents of the configuration file are assumed to define
a single frame. For more than one frame, the contents are repeated.
Depending on the Data Symbols setting, only the pilots are repeated, while the data is
generated randomly for all frames.
Number of Bursts (Bursted)
For bursted signals, the contents of the configuration file are assumed to define a single burst. For multiple bursts, the contents are repeated with gaps inbetween.
Gap Length (Bursted)
Defines the number of symbols between two bursts.
Burst Length (Bursted)
Defines the number of symbols within the burst. In "Auto" mode, the length is determined automatically from the configuration file. If the length is manually set to a value
larger than the number of symbols defined in the configuration file, the contents of the
file are repeated as often as necessary to obtain the specified length.
Repetition Range (Bursted)
The repetition range is required only if the specified burst length exceeds the number
of symbols in the configuration file. In "Auto" mode, the entire contents of the file are
repeated. However, you can define the symbol range to be repeated manually by specifying the start and stop symbols. This is useful, for example, if the signal contains a
preamble and only the payload data is to be extended.
Data Symbols
Defines whether the generated data symbols of the signal are taken in the order they
are defined in the configuration file ("As Loaded"), or whether "Random" data is created (with the same modulation type).
85User Manual 1176.8980.02 ─ 02
Page 86

R&S®VSE-K96
Creating a Configuration File Using the R&S VSE-K96 Configuration File Wizard
Reference of Wizard Menu Functions
Refresh
Updates the preview of the generated signal in the "Generate Test Signal" dialog box,
for example after loading a new configuration file or after making changes to the allocation matrix.
Save Signal
Saves the generated I/Q data of the test signal to a file.
Various data formats are available:
●
32-bit floating point, order IQIQIQ (*.iqw)
●
32-bit floating point, order IIIQQQ (*.iqw)
●
WV file for R&S signal generators (*.wv)
●
ASCII, I and Q alternating in new lines (*.dat)
Preview area
The preview area indicates the generated signal according to the current signal configuration.
6.3 Reference of Wizard Menu Functions
The following functions are provided in the menus of the configuration file wizard.
● File Functions..........................................................................................................86
● Edit Functions......................................................................................................... 87
● Settings................................................................................................................... 88
● Help.........................................................................................................................89
6.3.1 File Functions
New...............................................................................................................................86
Import Data from R&S FS-K96......................................................................................87
Load Configuration File.................................................................................................87
Save Configuration File.................................................................................................87
Generate Test Signal.....................................................................................................87
Exit................................................................................................................................ 87
New
Creates a new, empty configuration file. This function is similar to a preset function.
Any information from the input signal in the R&S VSE OFDM VSA application is no longer available in the wizard. You must load existing signal or configuration data to continue.
See "Import Data from R&S FS-K96" on page 87 and "Load Configuration File"
on page 87.
86User Manual 1176.8980.02 ─ 02
Page 87

R&S®VSE-K96
Creating a Configuration File Using the R&S VSE-K96 Configuration File Wizard
Reference of Wizard Menu Functions
Import Data from R&S FS-K96
Opens a file selection dialog box to import I/Q data from an existing .K96_wizv file
(created by the R&S VSE-K96 application) or .K96_wiz file created by the R&S FSK96 software option.
Load Configuration File
Opens a file selection dialog box to load an existing .xml configuration file, for example as the basis for a similar configuration.
Save Configuration File
Opens a file selection dialog box to save the current configuration to an .xml file.
This function is identical to Chapter 6.2.6, "Step 7: Storing Results", on page 83.
Note: At the end of Steps 5 + 6: Allocation of Signal Components, when all symbols
have been allocated, you are automatically asked if you want to store the configuration
file.
Generate Test Signal
Allows you to generate I/Q test data for the configured allocation matrix. This function
requires a complete allocation matrix or a loaded configuration file.
For details see Chapter 6.2.7, "(Optional:) Generating a Test Signal", on page 84.
Exit
Closes the wizard without a confirmation. Use Save Configuration File to store your
current configuration before exiting.
6.3.2 Edit Functions
Reset All Allocations..................................................................................................... 87
Undo Last Allocation..................................................................................................... 87
Extract Symbols............................................................................................................ 87
Shift Left by 1 Carrier / Shift Right by 1 Carrier.............................................................88
Reset All Allocations
Removes all applied allocations. All cells are indicated as non-allocated.
Undo Last Allocation
Reverts the most recently applied allocation. The allocated cells are indicated as nonallocated (but still selected).
This function is identical to using the
Extract Symbols
Selects a range of symbols from the current constellation for further analysis.
This function is identical to Chapter 6.2.2, "Step 2: (Optional:) Adjusting the Analysis
Region", on page 80.
icon in the Constellation View.
87User Manual 1176.8980.02 ─ 02
Page 88

R&S®VSE-K96
6.3.3 Settings
Creating a Configuration File Using the R&S VSE-K96 Configuration File Wizard
Reference of Wizard Menu Functions
Shift Left by 1 Carrier / Shift Right by 1 Carrier
Shifts the carrier information for all symbols by one carrier. This is useful to compensate for a frequency offset that could not be corrected by the automatic synchronization
function.
System name................................................................................................................ 88
System description........................................................................................................88
Cyclic Prefix Length...................................................................................................... 88
Preamble.......................................................................................................................88
└ Set Preamble.................................................................................................. 89
└ Block Length................................................................................................... 89
└ Frame Start Offset.......................................................................................... 89
Cyclic Delay Diversity....................................................................................................89
System name
Defines the name of the stored configuration file. The default name is C:/temp/
MyData. You can change the name in the "Settings" (see Chapter 6.3.3, "Settings",
on page 88).
System description
Provides a description of the signal configured in the file.
By default, the following main characteristics are included:
●
Number of Carriers
●
Number of Symbols
●
Cyclic Prefix Length
If you deactivate the "Default" setting, you can overwrite the text with any other.
Cyclic Prefix Length
Defines the length of the cyclic prefix area between two OFDM symbols in samples.
The cyclic prefix area defines the guard interval and is expected to contain a copy of
the samples at the end of the OFDM symbol.
Preamble
Preamble symbol characteristics can be stored in the configuration file. These settings
correspond to those in the "Signal Description" dialog in the R&S VSE OFDM VSA
application (see Chapter 5.2, "Signal Description", on page 40). The information can be
used by the R&S VSE OFDM VSA application, for example for synchronisation.
88User Manual 1176.8980.02 ─ 02
Page 89

R&S®VSE-K96
6.3.4 Help
Creating a Configuration File Using the R&S VSE-K96 Configuration File Wizard
Example: Creating a Configuration File from an Input Signal
Set Preamble ← Preamble
If activated, the defined preamble symbol characteristics are stored in the configuration
file.
Block Length ← Preamble
Specifies the length of one data block within the repetitive preamble as a number of
samples.
Frame Start Offset ← Preamble
Specifies the time offset from the preamble start to the actual frame start as a number
of samples.
Cyclic Delay Diversity
Defines a cyclic shift of the FFT values for each OFDM symbol before adding the cyclic
prefix.
Provides context-sensitive help on the configuration process, according to the currently
selected process step.
6.4 Example: Creating a Configuration File from an Input Signal
The wizard requires demodulated data as input for the configuration file. You can configure a basic measurement for the input signal in the R&S VSE OFDM VSA application as described in Chapter 8, "How to Perform Measurements in the R&S VSE
OFDM VSA application", on page 112, or load existing I/Q data to the application. For
this example, we will use the I/Q data in the demo file
C:\ProgramData\Rohde-Schwarz\VSE\<version_no>\user\OFDM-VSA\
WlanA_64QAM.iq.tar provided with the R&S VSE software.
The following signal parameters are already known:
●
FFT size (= number of subcarriers): 64 samples
●
Cyclic prefix length: 16 samples
●
OFDM system sample rate: 20 MHz
●
Pilot modulation: QPSK + 45°QPSK
●
Data modulation: 64QAM + BPSK
1. Define the basic signal parameters so the R&S VSE OFDM VSA application can
demodulate the data.
a) Select the "Meas Setup > Signal Description" menu item.
● Set "FFT Size" = 64.
● Set "Cyclic Prefix Length" = 16.
89User Manual 1176.8980.02 ─ 02
Page 90

R&S®VSE-K96
Creating a Configuration File Using the R&S VSE-K96 Configuration File Wizard
Example: Creating a Configuration File from an Input Signal
b) Select the "Meas Setup > Data Acquisition" menu item.
● Set "Sample Rate" = 20 MHz.
2. Drag the
C:\ProgramData\Rohde-Schwarz\VSE\<version_no>\user\OFDM-VSA\
WlanA_64QAM.iq.tar file from the file explorer to the OFDM VSA channel in the
R&S VSE software.
The input type is set to "File", and the selected file is loaded as input for the OFDM
VSA channel.
The Magnitude Capture display shows the bursted signal.
3. The green bar in the Magnitude Capture diagram does not cover an entire frame.
Increase the result range to include all symbols of a frame.
a) Select the "Meas Setup > Result Range" menu item.
● Set "Result Length" = 100.
The data is now demodulated correctly and can be used as input for a new configuration file.
4. In the "Signal Description" dialog box, select "Create New Configuration File".
90User Manual 1176.8980.02 ─ 02
Page 91

R&S®VSE-K96
Creating a Configuration File Using the R&S VSE-K96 Configuration File Wizard
Example: Creating a Configuration File from an Input Signal
5. Since it is a bursted signal and the result range is large enough, the analysis range
corresponds to exactly one frame. We can start directly with step 3, synchronization.
Our constellation diagram is slightly rotated and generally does not show an ideal
constellation, so we must improve the synchronization settings.
Figure 6-5: Constellation diagram for loaded WLAN signal data
Select step 3 in the progress bar.
a) Select "Auto" to perform automatic synchronization.
91User Manual 1176.8980.02 ─ 02
Page 92

R&S®VSE-K96
Creating a Configuration File Using the R&S VSE-K96 Configuration File Wizard
Example: Creating a Configuration File from an Input Signal
b) If necessary, move the sliders for timing, frequency, or phase until the constel-
lation diagram shows an optimal display.
Figure 6-6: Constellation diagram after automatic synchronization
6. The reference constellation for the gain calculation is best defined by the data cells
in this signal, which use a 64-QAM modulation.
Select step 4 in the progress bar.
a) In the "Gain Adjustment" dialog box, select "Constellation" = "64QAM"
92User Manual 1176.8980.02 ─ 02
Page 93

R&S®VSE-K96
Creating a Configuration File Using the R&S VSE-K96 Configuration File Wizard
Example: Creating a Configuration File from an Input Signal
b) Select "Gain Adjustment" > "Auto".
The data cells which use this modulation are highlighted both in the Constellation diagram and the Matrix view.
Figure 6-7: Highlighted data points in 64QAM constellation
The power for the highlighted constellation points will be stored as the reference
power, that is: as the boosting factor "1.0".
7. Since the data cells are already selected, we will allocate those cells in the matrix
first.
a) Select step 5 in the progress bar.
b) In the "Constellation View", "Allocation" area, select "Allocate as:" "Data"
c)
Select the green checkmark icon.
The data cells in the Allocation Matrix are indicated in the specified color for data
symbols.
8. Next we will allocate the symbols with a power level of 0 V - the "Zero" cells.
a) In the "Constellation View", select the modulation type "Zero" as a constellation
marker.
b) In the "Constellation View", "Allocation" area, select "Allocate as:" "Zero".
c)
Select the green checkmark icon.
93User Manual 1176.8980.02 ─ 02
Page 94

R&S®VSE-K96
Creating a Configuration File Using the R&S VSE-K96 Configuration File Wizard
Example: Creating a Configuration File from an Input Signal
The zero cells in the Allocation Matrix are indicated in the specified color for "Zero"
symbols.
9. Allocate the "Pilot" cells.
a) In the "Constellation View", select the modulation type "QPSK" as a constella-
tion marker.
Figure 6-8: Symbols with QPSK constellation
Although we know some of the pilots use QPSK modulation, none of the symbols are highlighted. Possibly a boosting factor was applied.
94User Manual 1176.8980.02 ─ 02
Page 95

R&S®VSE-K96
Creating a Configuration File Using the R&S VSE-K96 Configuration File Wizard
Example: Creating a Configuration File from an Input Signal
b) Select the "Boosting" : "Auto" function.
A boosting of 2.079 is detected and applied to the symbols. Now some of the
symbols are highlighted.
Figure 6-9: Symbols with QPSK modulation and applied boosting
c) In the "Constellation View", "Allocation" area, select "Allocate as:" "Pilots".
d)
Select the green checkmark icon.
The pilot cells in the Allocation Matrix are indicated in the specified color for "Pilot"
symbols, and the selected cells are stored with a boosting factor of 2.079.
10. Some of the remaining cells are data cells with a BPSK modulation.
a) In the "Constellation View", select the modulation type "BPSK" as a constella-
tion marker.
b) In the "Constellation View", "Allocation" area, select "Allocate as:" "Data".
c)
Select the green checkmark icon.
95User Manual 1176.8980.02 ─ 02
Page 96

R&S®VSE-K96
Creating a Configuration File Using the R&S VSE-K96 Configuration File Wizard
Example: Creating a Configuration File from an Input Signal
11. The last remaining cells are pilot cells with a 45°QPSK modulation.
a) In the "Constellation View", select the modulation type "45°QPSK" as a constel-
lation marker.
b) In the "Constellation View", "Allocation" area, select "Allocate as:" "Pilot".
c)
Select the green checkmark icon.
A message is displayed informing you that all symbols are allocated.
12. Store the configuration file.
Select step 7 in the progress bar.
a) Enter the file name and storage location for the configuration file:
C:\ProgramData\Rohde-Schwarz\VSE\<version_no>\user\
OFDM-VSA\MyWlanA_64QAM.xml
13. Close the wizard.
Now you can load the configuration file in the R&S VSE OFDM VSA application.
See step 4.
96User Manual 1176.8980.02 ─ 02
Page 97

R&S®VSE-K96
7 Analyzing OFDM Vector Signals
7.1 Result Configuration
Analyzing OFDM Vector Signals
Result Configuration
Access: "Overview" > "Result Configuration"
General result analysis settings concerning the trace, markers, windows etc. can be
configured. They are identical to the analysis functions in the base unit except for the
special window functions.
● Result Configuration................................................................................................97
● Table Configuration................................................................................................. 99
● Units......................................................................................................................100
● Y-Scaling............................................................................................................... 100
● Markers................................................................................................................. 102
● Trace Settings.......................................................................................................108
● Trace / Data Export Configuration.........................................................................109
Some result displays provide further settings.
Normalize EVM to......................................................................................................... 98
Frame Averaging...........................................................................................................98
Constellation Display - Modulation Type.......................................................................98
Constellation Display - Modulation................................................................................98
Constellation Display - Symbol..................................................................................... 99
Constellation Display - Carrier...................................................................................... 99
Constellation Display - Point Size................................................................................. 99
97User Manual 1176.8980.02 ─ 02
Page 98

R&S®VSE-K96
1
0
2
1
N
i
i
EVM
N
1
0
1
N
i
i
EVM
N
Analyzing OFDM Vector Signals
Result Configuration
Normalize EVM to
Specifies the OFDM cells which are averaged to get the reference magnitude for EVM
normalization (see Chapter C.1, "Error Vector Magnitude (EVM)", on page 234 for
details).
"RMS Pilots &
RMS value of the pilot and data cells
Data"
"RMS Data"
"RMS Pilots"
"Peak Pilots &
RMS value of the data cells
RMS value of the pilot cells
Peak value of the pilot and data cells
Data"
"Peak Data"
"Peak Pilots"
"None"
Peak value of the data cells
Peak value of the pilot cells
Normalization is turned off.
Remote command:
[SENSe:]DEMod:EVMCalc:NORMalize on page 159
Frame Averaging
Specifies the method of averaging over multiple OFDM frames in one capture buffer
used to get the mean EVM values in the result list.
Frame Averaging Averaged EVM over N frames
Mean square
RMS
Mean square averaging is consistent with the EVM calculation within one frame. However, some standards, e.g. 802.11a, require RMS averaging.
Remote command:
[SENSe:]DEMod:EVMCalc:FAVerage on page 159
Constellation Display - Modulation Type
The constellation diagram includes only symbols for the selected modulation types.
The selected modulation types are indicated in the constellation diagram for reference.
Remote command:
CONFigure:FILTer<n>:MODulation:TYPE on page 161
Constellation Display - Modulation
The constellation diagram includes only symbols with the selected modulation.
Remote command:
CONFigure:FILTer<n>:MODulation on page 160
98User Manual 1176.8980.02 ─ 02
Page 99

R&S®VSE-K96
Analyzing OFDM Vector Signals
Table Configuration
Constellation Display - Symbol
The constellation diagram includes all or only the specified symbol number. The first
symbol number is 0.
Remote command:
CONFigure:FILTer<n>:SYMBol on page 161
Constellation Display - Carrier
The constellation diagram includes symbols for all or only for the specified carrier number. The range of valid carrier numbers is:
[- FFT Size/2, +FFT Size/2]
Remote command:
CONFigure:FILTer<n>:CARRier on page 160
Constellation Display - Point Size
Defines the size of the individual points in a constellation diagram.
7.2 Table Configuration
Access: "Overview" > "Result Configuration" > "Table Config"
Or: "Meas Setup" > "Result Configuration" > "Table Config" tab
During each measurement, a large number of characteristic signal parameters are
determined. Select the parameters to be included in the table. For a description of the
individual parameters, see Chapter 3.1, "OFDM VSA Parameters", on page 12.
99User Manual 1176.8980.02 ─ 02
Page 100

R&S®VSE-K96
7.3 Units
Analyzing OFDM Vector Signals
Y-Scaling
Access: "Overview" > "Result Configuration" > "Units"
Or: "Meas Setup" > "Result Configuration" > "Units" tab
For some result configurations, the unit of the displayed values can be configured.
Remote command:
UNIT:EVM on page 165
UNIT:IRESponse on page 166
UNIT:SAXes on page 166
UNIT:CAXes on page 164
UNIT:TAXes on page 166
UNIT:FAXes on page 165
7.4 Y-Scaling
Access: "Overview" > "Result Configuration" > "Y Scaling"
Or: "Meas Setup" > "Result Configuration" > "Y Scaling" tab
The scaling for the vertical axis is highly configurable, using either absolute or relative
values. Note that scaling settings are window-specific and not available for all result
displays.
100User Manual 1176.8980.02 ─ 02
 Loading...