

Page 1
R&S®Scope Rider RTH
Handheld Oscilloscope
User Manual
(=J?Ü2)
1326157802
User Manual
Version 15
Page 2

This manual describes the following R&S®RTH models with firmware version 1.80:
●
R&S®RTH1004 (1317.5000K04)
●
R&S®RTH1002 (1317.5000K02)
In addition to the base unit, the following options are described:
●
R&S®RTH-K1 I2C/SPI triggering and decoding (1325.9969.02)
●
R&S®RTH-K2 UART/RS232 triggering and decoding (1325.9975.02)
●
R&S®RTH-K3 CAN/LIN triggering & decoding (1333.0550.02)
●
R&S®RTH-K9 CAN FD triggering & decoding (1326.3829.02)
●
R&S®RTH-K10 SENT triggering & decoding (1326.3835.02)
●
R&S®RTH-K15 History and segmented memory (1326.1803.02)
●
R&S®RTH-K18 Spectrum analysis (1333.0680.02)
●
R&S®RTH-K19 Advanced trigger (1326.0642.02)
●
R&S®RTH-B1 Mixed signal option (1325.9981.02)
●
R&S®RTH-K33 Frequency counter (1333.0696.02)
●
R&S®RTH-K34 Harmonic analysis (1333.0673.02)
●
R&S®RTH-K38 User scripting (1801.4632.02)
© 2020 Rohde & Schwarz GmbH & Co. KG
Mühldorfstr. 15, 81671 München, Germany
Phone: +49 89 41 29 - 0
Email: info@rohde-schwarz.com
Internet: www.rohde-schwarz.com
Subject to change – Data without tolerance limits is not binding.
R&S® is a registered trademark of Rohde & Schwarz GmbH & Co. KG.
Trade names are trademarks of the owners.
1326.1578.02 | Version 15 | R&S®Scope Rider RTH
Throughout this manual, products from Rohde & Schwarz are indicated without the ® symbol, e.g. R&S®Scope Rider RTH is indicated as R&S RTH.
Page 3

R&S®Scope Rider RTH
Contents
1 For Your Safety.......................................................................................7
2 Getting Started....................................................................................... 9
2.1 Preface........................................................................................................................... 9
2.2 Preparing for Use........................................................................................................ 11
2.3 Instrument Tour........................................................................................................... 17
2.4 Operating Basics.........................................................................................................23
2.5 Maintenance................................................................................................................ 36
3 Waveform Setup...................................................................................39
3.1 Connecting Probes..................................................................................................... 39
3.2 Vertical Setup.............................................................................................................. 40
Contents
3.3 Horizontal Setup..........................................................................................................45
3.4 Acquisition Control.....................................................................................................47
3.5 Roll Mode..................................................................................................................... 50
3.6 Trigger..........................................................................................................................51
4 Waveform Analysis..............................................................................78
4.1 Zoom............................................................................................................................ 78
4.2 Automatic Measurements.......................................................................................... 80
4.3 Cursor Measurements................................................................................................ 87
4.4 Mathematics................................................................................................................ 91
4.5 Reference Waveforms.................................................................................................93
4.6 XY-Diagram..................................................................................................................97
4.7 History (Option R&S RTH-K15).................................................................................. 98
5 Mask Testing.......................................................................................104
5.1 Accessing the Mask Mode....................................................................................... 104
5.2 Mask Test Results..................................................................................................... 104
5.3 Running Mask Tests..................................................................................................105
5.4 Mask Settings............................................................................................................ 106
6 Spectrum Analysis.............................................................................109
6.1 FFT Mode................................................................................................................... 109
6.2 Spectrum Mode (Option R&S RTH-K18)..................................................................116
3User Manual 1326.1578.02 ─ 15
Page 4

R&S®Scope Rider RTH
6.3 Harmonics Measurement (Option R&S RTH-K34)..................................................133
7 Multimeter Measurements.................................................................146
7.1 Digital Multimeter (R&S RTH1002)...........................................................................146
7.2 Voltmeter (R&S RTH1004).........................................................................................151
8 Data Logging...................................................................................... 158
8.1 Accessing the Logger Mode.................................................................................... 158
8.2 Logger Display.......................................................................................................... 158
8.3 Using the Logger.......................................................................................................159
8.4 Logger Settings.........................................................................................................162
8.5 Analyzing Logged Data............................................................................................ 164
8.6 Export of Logger Records........................................................................................169
9 Protocol Analysis...............................................................................174
Contents
9.1 Basics of Protocol Analysis.....................................................................................174
9.2 I2C (Option R&S RTH-K1).........................................................................................182
9.3 SPI (Option R&S RTH-K1).........................................................................................191
9.4 UART/RS-232/RS-422/RS-485 (Option R&S RTH-K2).............................................198
9.5 CAN and CAN FD (Options R&S RTH-K3, R&S RTH-K9).......................................205
9.6 LIN (Option R&S RTH-K3).........................................................................................220
9.7 SENT (Option R&S RTH-K10)...................................................................................229
10 Logic Analyzer (R&S RTH-B1 MSO)................................................. 253
10.1 Logic Analyzer Settings........................................................................................... 253
10.2 Triggering on Logic Channels................................................................................. 256
10.3 Analyzing Logic Channels....................................................................................... 256
11 Frequency Counter (R&S RTH-K33).................................................258
11.1 Accessing the Counter Mode...................................................................................258
11.2 Display and Control.................................................................................................. 259
11.3 Performing a Counter Measurement.......................................................................262
11.4 Counter Settings....................................................................................................... 264
12 Documenting Results........................................................................ 267
12.1 Using USB Flash Drive............................................................................................. 267
12.2 Filesystem Tools....................................................................................................... 268
4User Manual 1326.1578.02 ─ 15
Page 5

R&S®Scope Rider RTH
12.3 Instrument Settings.................................................................................................. 270
12.4 Waveforms.................................................................................................................272
12.5 Logger Records.........................................................................................................279
12.6 Quick Save with OneTouch...................................................................................... 279
12.7 Screenshots...............................................................................................................280
13 General Instrument Setup................................................................. 283
13.1 Resetting the Instrument..........................................................................................283
13.2 Disabling the Touchscreen.......................................................................................283
13.3 Selfalignment.............................................................................................................283
13.4 Setting the Date, Time and Language..................................................................... 285
13.5 Instrument Settings.................................................................................................. 286
13.6 Display Settings........................................................................................................ 288
Contents
13.7 Options.......................................................................................................................290
13.8 Updating the Firmware............................................................................................. 292
14 Network Connections........................................................................ 294
14.1 LAN Connection........................................................................................................ 294
14.2 USB connection........................................................................................................ 296
14.3 Web File Browser...................................................................................................... 296
14.4 Wireless LAN Connection (Option R&S RTH-K200/200US)...................................298
14.5 Web Interface (Option R&S RTH-K201)...................................................................301
15 Remote Control Commands..............................................................302
15.1 Conventions used in Command Description......................................................... 302
15.2 Mode...........................................................................................................................302
15.3 Waveform Setup........................................................................................................303
15.4 Waveform Analysis................................................................................................... 338
15.5 Mask Testing..............................................................................................................352
15.6 Spectrum Analysis....................................................................................................356
15.7 Digital Multimeter (R&S RTH1002)...........................................................................382
15.8 Voltmeter (R&S RTH1004).........................................................................................398
15.9 Counter Mode (R&S RTH-K33).................................................................................410
15.10 Data Logging............................................................................................................. 417
15.11 Protocol Analysis......................................................................................................429
5User Manual 1326.1578.02 ─ 15
Page 6

R&S®Scope Rider RTH
15.12 Logic Analyzer (R&S RTH-B1 MSO)........................................................................ 490
15.13 Documenting Results............................................................................................... 493
15.14 General Instrument Setup........................................................................................ 505
15.15 WLAN Connection (Option R&S RTH-K200/200US)...............................................507
15.16 User Scripting (R&S RTH-K38)................................................................................ 508
Annex.................................................................................................. 509
A SCPI Command Structure................................................................. 509
A.1 Syntax for Common Commands............................................................................. 509
A.2 Syntax for Device-Specific Commands.................................................................. 510
A.3 SCPI Parameters....................................................................................................... 512
A.4 Overview of Syntax Elements.................................................................................. 515
A.5 Structure of a Command Line..................................................................................516
Contents
A.6 Responses to Queries.............................................................................................. 517
B Command Sequence and Synchronization..................................... 518
B.1 Preventing Overlapping Execution......................................................................... 518
C User Scripting (R&S RTH-K38)......................................................... 520
C.1 Loading User Apps to the Instrument.....................................................................520
C.2 Running User Apps...................................................................................................520
C.3 About User Apps.......................................................................................................521
C.4 Demo App.................................................................................................................. 522
List of Commands..............................................................................526
6User Manual 1326.1578.02 ─ 15
Page 7

R&S®Scope Rider RTH
1 For Your Safety
To prevent electric shock, personal injury, or fire caused by high voltages, carefully
read and observe the following safety information:
●
This chapter, the first part of the safety booklet, provides warnings and safety information for usage of oscilloscopes, probes, and other measurement accessories.
●
The second part of the safety booklet provides basic safety instructions
●
Product manuals provide specific safety instructions for procedures and measurement accessories.
Electrical safety
●
Voltages higher than 30 V RMS, or 42 V peak, or 60 V DC are regarded as hazardous contact voltages. When working with hazardous contact voltages, use protective measures to preclude direct contact with the measurement setup:
– Do not touch exposed connections and components when power is applied.
– Use only insulated voltage probes, test leads and adapters.
●
Make sure that only personnel familiar with the potential risks of measuring electrical quantities controls the instrument. Observe applicable local or national safety
regulations and rules for the prevention of accidents.
●
Use only specified probes and accessories that comply with the measurement category (CAT) of your measurement task. If you use other than Rohde & Schwarz
accessories, make sure that they are suitable for the instrument and the measurement task.
●
Observe all voltage and current ratings of the instrument, the probes, and the
accessories. The lowest rated component defines the rating of the complete measurement setup. Limits and ratings are marked on the products and listed in the
data sheets.
For probes, consider that the rated voltage depends on the frequency. The voltage
limitation curves are provided in the data sheet. Do not exceed these two ratings:
– Maximum measurement voltage from the probe tip to the probe reference lead.
– Maximum floating voltage from the probe reference lead to earth ground.
●
Set the correct attenuation factor on the instrument according to the probe being
used. Otherwise, the measurement results do not reflect the actual voltage level,
and you might misjudge the actual risk.
●
Set up all connections to the instrument before applying power.
●
Do not open the instrument casing.
●
Do not use the instrument if the instrument casing, the display or any probe or
accessory are damaged. If you detect or suspect any damage, have the instrument
or accessory inspected by qualified service personnel.
●
Do not operate the instrument in wet, damp or explosive atmospheres. Make sure
that all connectors are completely dry before connecting the inputs.
●
Observe the operating conditions specified in the data sheet and in the basic safety
instructions.
For Your Safety
7User Manual 1326.1578.02 ─ 15
Page 8
R&S®Scope Rider RTH
Battery replacement
●
Disconnect power supply, probes, test leads and all other cables before opening
the battery cover.
●
Use only the specified Li-ion battery pack, which is delivered with the instrument.
You can order additional battery packs at Rohde & Schwarz, see data sheet for
order number.
●
Do not operate the instrument with the battery cover open.
●
Use only the specified power adapter, which is delivered with the instrument.
Cleaning
Remove all probes, leads, USB and LAN cables and power supply before cleaning the
instrument. Use only cleaning materials that are specified in the manual.
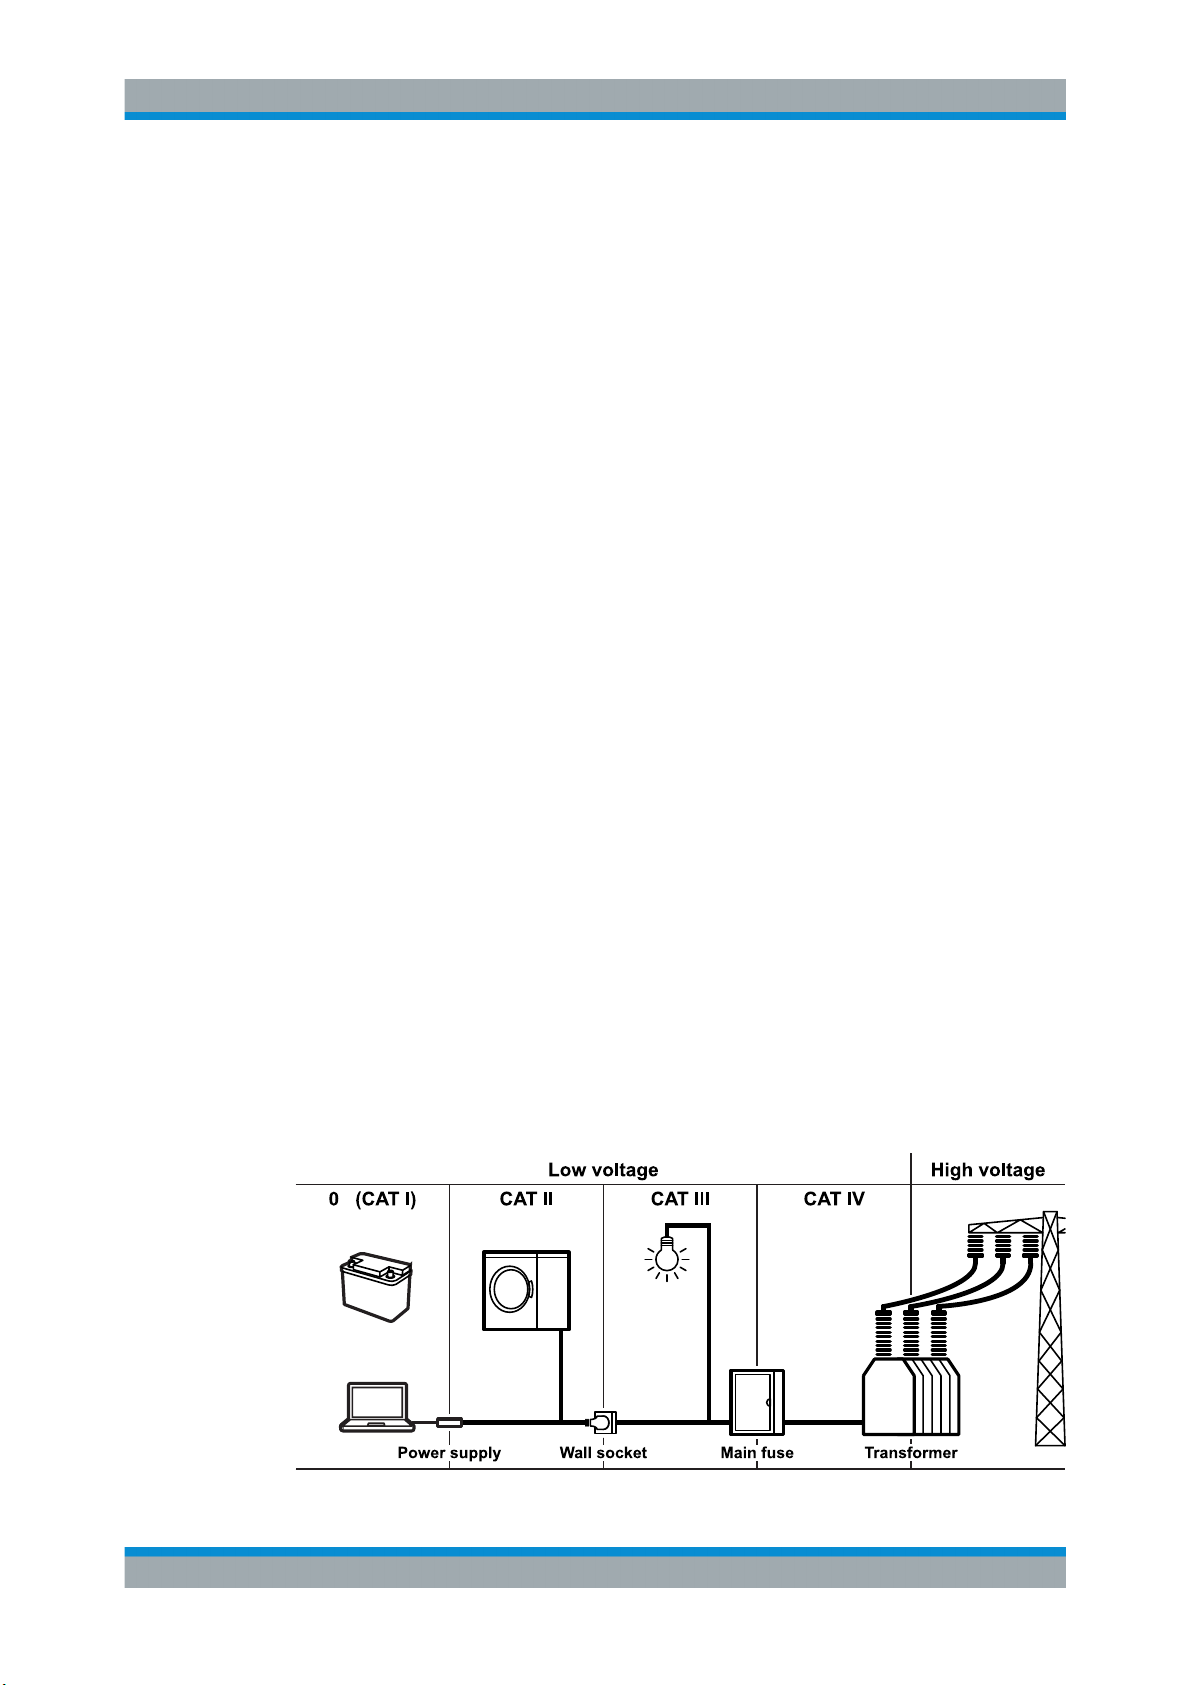
Measurement categories
IEC 61010-2-030 defines measurement categories that rate instruments on their ability
to resist short transient overvoltages that occur in addition to the working voltage. Use
the measurement instrument and accessories only in electrical environments for which
they are rated.
For Your Safety
●
O - Instruments without rated measurement category
For measurements performed on circuits not directly connected to mains, for example, electronics, circuits powered by batteries, and specially protected secondary
circuits. This measurement category is also known as CAT I.
●
CAT II:
For measurements performed on circuits directly connected to the low-voltage
installation by a standard socket outlet, for example, household appliances and
portable tools.
●
CAT III:
For measurements performed in the building installation, such as junction boxes,
circuit breakers, distribution boards, and equipment with permanent connection to
the fixed installation.
●
CAT IV:
For measurements performed at the source of the low-voltage installation, such as
electricity meters and primary overcurrent protection devices.
8User Manual 1326.1578.02 ─ 15
Page 9

R&S®Scope Rider RTH
2 Getting Started
2.1 Preface
2.1.1 Key Features
The R&S RTH is the perfect multi-purpose tool for the lab and in the field. Outstanding
key features are:
●
Full isolation of all channels and interfaces
●
CAT IV 600 V / CAT III 1000 V safety rating
●
Bandwidth 60 MHz to 500 MHz with 5 GS/s sampling rate
●
Acquisition speed up to 50.000 waveforms per second
●
2 mV/div sensitivity
●
Up to 200 V offset range
●
33 automatic measurement functions
●
Full operation using touch or keypad
●
Wireless LAN and Ethernet for web based remote control and quick data access
(optional)
Getting Started
Preface
The R&S RTH combines:
●
Lab performance oscilloscope
●
Logic analyzer with 8 digital inputs (optional)
●
Protocol analyzer with trigger and decode (optional)
●
Data logger
●
Digital multimeter (R&S RTH1002)
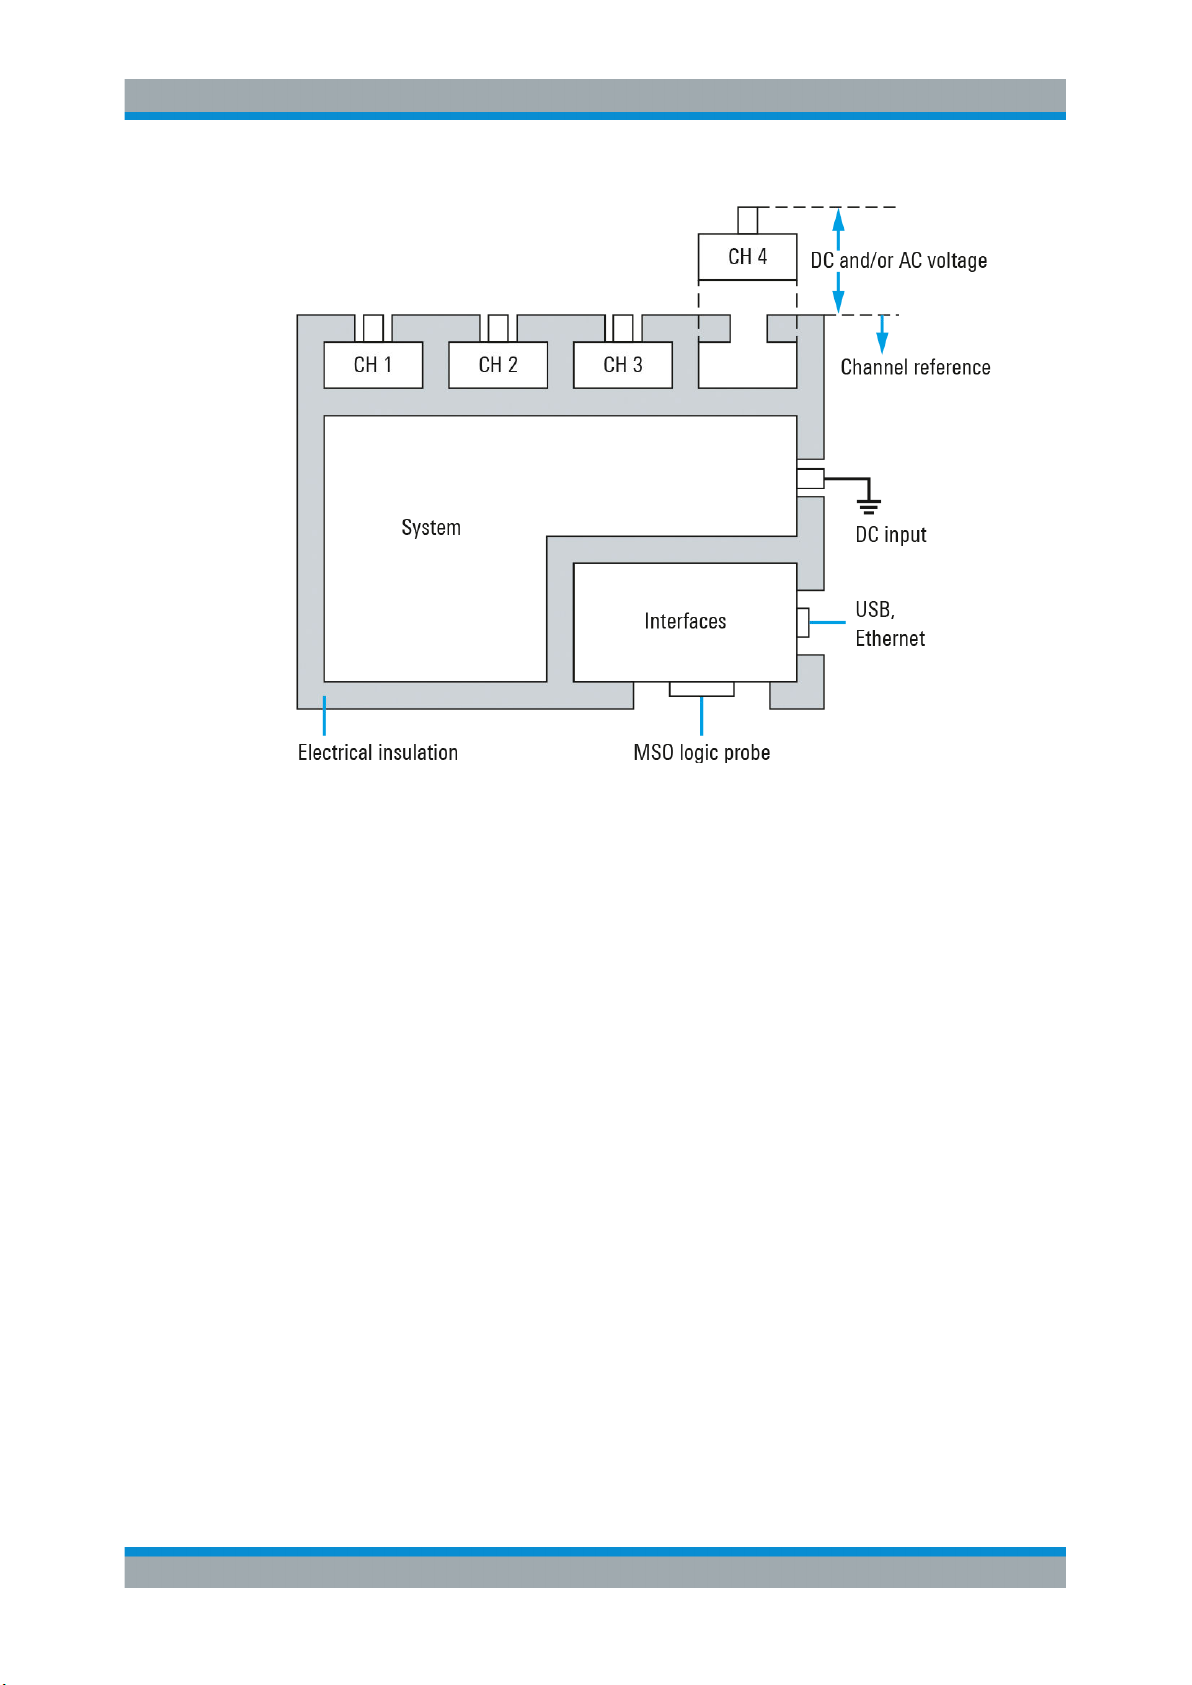
2.1.2 Input Isolation
The instrument has independently floating isolated inputs. Each input channel has its
own signal input and its own reference input. Each input channel is electrically isolated
from the other input channels. Therefore, each reference of the used inputs must be
connected to a reference voltage. Furthermore, input channels are electrically isolated
from the communication ports and the power adapter input.
9User Manual 1326.1578.02 ─ 15
Page 10
R&S®Scope Rider RTH
Getting Started
Preface
Figure 2-1: Isolation scheme of the R&S RTH
The input isolation has several advantages:
●
You can measure independently floating signals simultaneously.
●
The risk of causing a short circuit while measuring multiple signals is reduced substantially.
●
When measuring signals with different grounds, the induced ground currents are
kept to a minimum.
2.1.3 Documentation Overview
The user documentation for the R&S RTH consists of the following parts:
●
Instrument Help
The instrument help is part of the instrument's firmware. It offers quick, contextsensitive access to the complete information directly on the instrument.
●
Basic Safety Instructions
This brochure provides safety instructions and operating conditions and further
important information. The brochure is delivered with the instrument in printed form.
●
Getting Started
The Getting Started manual provides the information needed to set up and start
working with the instrument, and describes basic operations. The English edition of
this manual is delivered with the instrument in printed form. Editions in other languages and the newest version of the English manual are available on the product
website.
10User Manual 1326.1578.02 ─ 15
Page 11

R&S®Scope Rider RTH
●
User Manual
The user manual describes all instrument modes and functions in detail. It also provides an introduction to remote control and a complete description of the remote
control commands with programming examples. The newest version of the manual
is available in English on the R&S RTH product website at www.rohde-
schwarz.com/manual/rth.
●
Data Sheet
The data sheet contains the complete instrument specification. It also lists the
options and their order numbers, and optional accessories. The data sheet is available on the R&S RTH product website at www.rohde-schwarz.com/brochure-data-
sheet/rth.
●
Calibration Certificate
The document is available on https://gloris.rohde-schwarz.com/calcert.
●
Open Source Acknowledgment
The Open Source Acknowledgment document provides verbatim license text of
open source software that is used in the instrument's firmware. It is available on the
R&S RTH website at www.rohde-schwarz.com/firmware/rth, and it can be read
directly on the instrument.
●
Instrument security procedures manual
Provides information on security issues when working with the R&S RTH in secure
areas.
●
Application cards and application notes
These documents deal with special applications or background information on particular topics. See www.rohde-schwarz.com/application/rth
Getting Started
Preparing for Use
2.2 Preparing for Use
This section describes the basic steps to be taken when setting up the R&S RTH for
the first time.
11User Manual 1326.1578.02 ─ 15
Page 12

R&S®Scope Rider RTH
Shock hazard caused by high voltages
The instrument must be used in an appropriate manner to prevent electric shock, fire,
personal injury, or damage.
●
Do not open the instrument casing.
●
Do not use the instrument if the instrument casing, the display or any probe or
accessory are damaged. If you detect or suspect any damage, have the instrument
or accessory inspected by qualified service personnel.
●
Use only specified probes and accessories that comply with the measurement category of your measurement task.
If you use other than Rohde & Schwarz accessories, make sure that they are suitable to the instrument and the measurement task.
●
Do not operate the instrument in wet, damp or explosive atmospheres.
Make sure that all connectors are completely dry before connecting the inputs.
●
Voltages higher than 30 V RMS or 42 V peak or 60 V DC are regarded as hazardous contact voltages. Make sure that only electrically skilled persons use the
R&S RTH for measurements on hazardous contact voltages. These working conditions require special education and experience to perceive risks and to avoid hazards which electricity can create.
●
Observe the operating conditions specified in the data sheet.
●
Read and observe the "Safety Instructions" delivered as a printed brochure with the
instrument. Also read and observe the safety instructions in the following sections.
Getting Started
Preparing for Use
2.2.1 Unpacking the Instrument
When you receive your shipping package, unpack and inspect the package and its
contents for damage.
1. Inspect the package for damage.
If the packaging material shows any signs of stress, notify the carrier as well as
your Rohde & Schwarz service center. Keep the package and cushioning material
for inspection. Keep a damaged package and the cushioning material until the contents have been checked for completeness and the instrument has been tested.
2. Unpack the handheld scope and the accessories and check the contents for completeness, see "Package contents" on page 13.
If anything is missing, contact your Rohde & Schwarz service center.
3. Inspect the handheld scope and the accessories.
If there is any damage or defect, or if the R&S RTH does not operate properly,
notify your Rohde & Schwarz service center.
12User Manual 1326.1578.02 ─ 15
Page 13
R&S®Scope Rider RTH
Packing material
Retain the original packing material. If the instrument needs to be transported or shipped later, you can use the material to protect the control elements and connectors.
Package contents
The delivery package contains the following items:
●
R&S RTH handheld oscilloscope
●
4 Gbyte microSD card, installed in the battery compartment
●
Power adapter with cable and adapter set for various socket types
●
Battery pack
●
R&S RT-ZI10 probes (2x for R&S RTH1002; 4x for R&S RTH1004)
●
DMM test leads (only for R&S RTH1002)
●
Hand strap, attached on the handheld scope
●
Printed "Getting Started" manual and "Basic Safety Instructions" brochure
Getting Started
Preparing for Use
Optional accessories and their order numbers are listed in the data sheet.
2.2.2 Inserting and Charging the Battery
Before you can use the handheld oscilloscope for the first time, insert the battery pack
and charge it.
Risk of electrical shock during battery replacement
●
Disconnect power supply, probes, test leads and all other cables before opening
the battery cover.
●
Use only the specified Li-Ion battery pack, which is delivered with the instrument.
You can order additional battery packs at Rohde & Schwarz, see Data Sheet for
order number.
●
Do not operate the instrument with the battery cover open.
●
Use only the specified power adapter, which is delivered with the instrument.
13User Manual 1326.1578.02 ─ 15
Page 14
R&S®Scope Rider RTH
Getting Started
Preparing for Use
1. Turn off the instrument power. Remove power supply, probes, test leads and all
other cables.
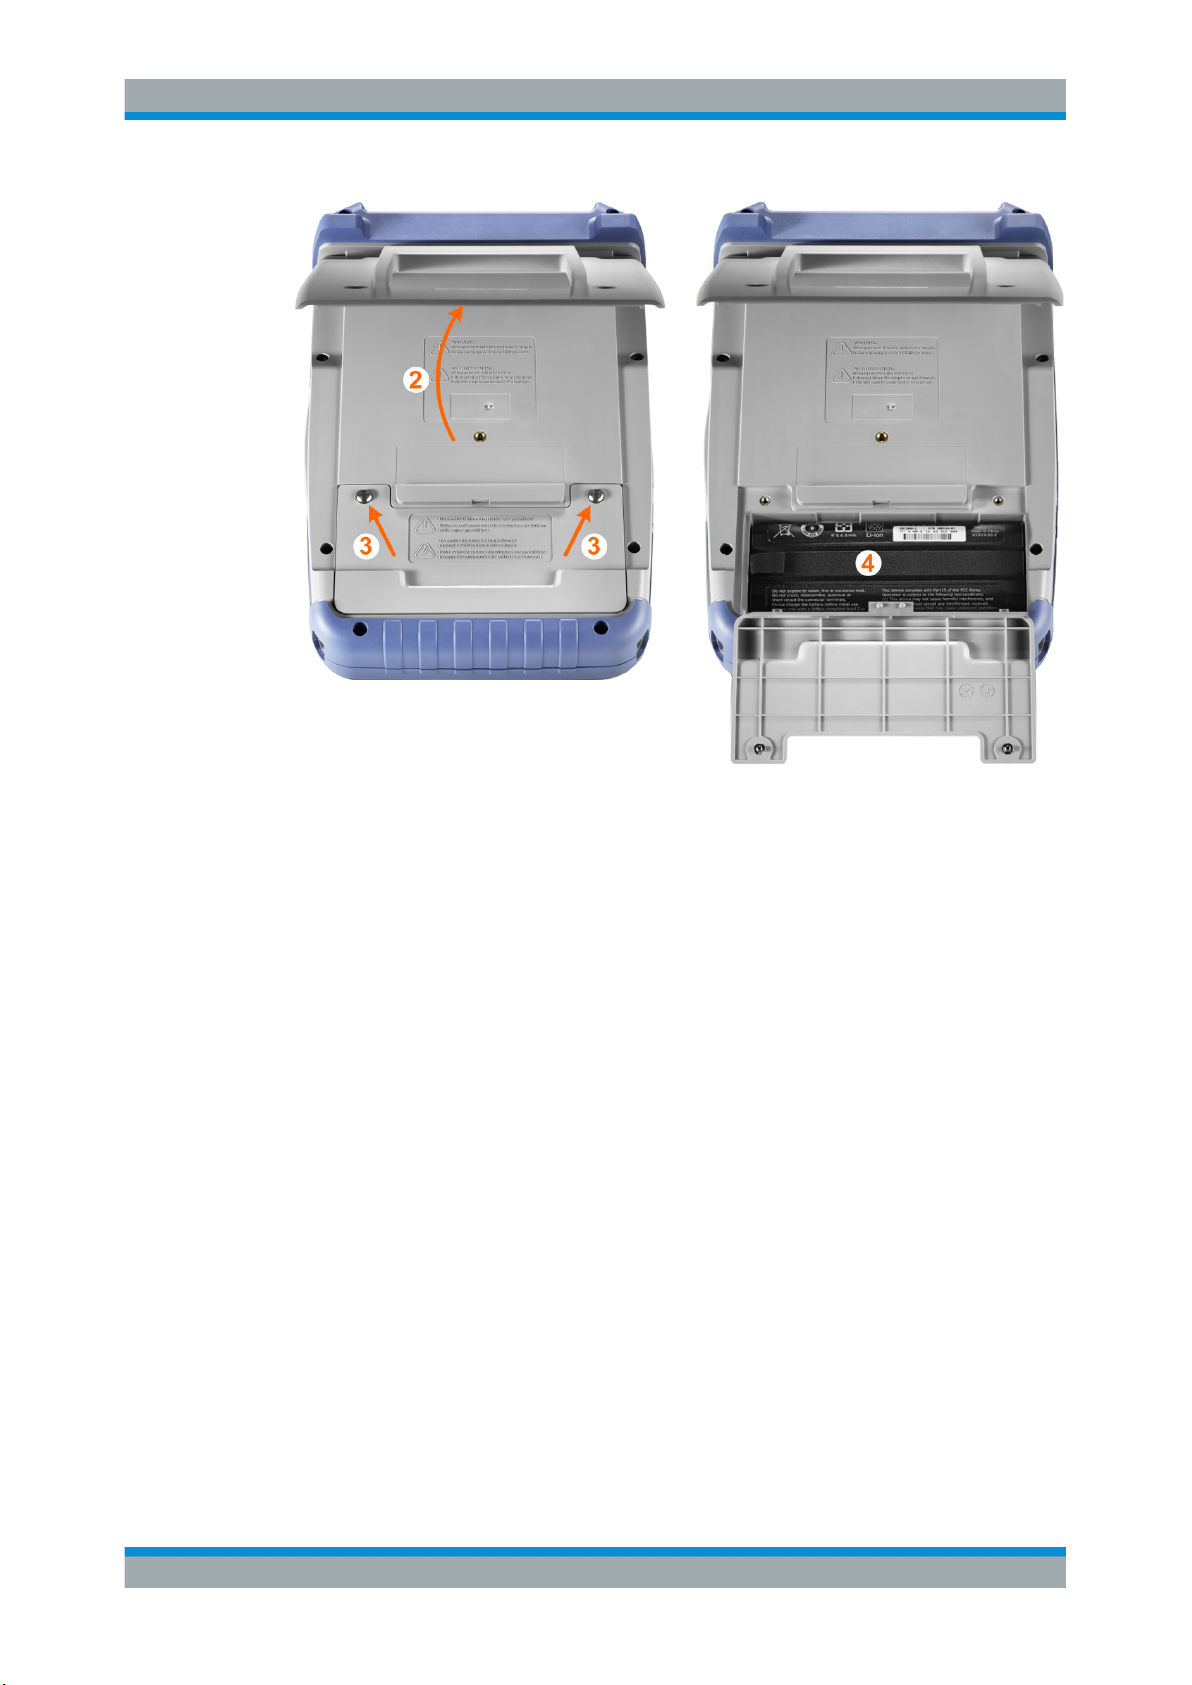
2. Fold out the tilt stand on the back of the instrument.
3. Screw open the battery cover.
4. Insert the battery pack.
5. Screw down the battery cover.
6. Connect the power adapter to the connector on the left side of the scope, and fully
charge the battery. Charging may take a few hours.
14User Manual 1326.1578.02 ─ 15
Page 15
R&S®Scope Rider RTH
Getting Started
Preparing for Use
If the instrument is on, the battery status is shown on the display.
Replace used batteries periodically by new batteries after 24 months of usage.
Observe the safety regulations in the "Batteries and rechargeable batteries/cells" chapter in the "Basis Safety Instructions" brochure, which is delivered with the instrument.
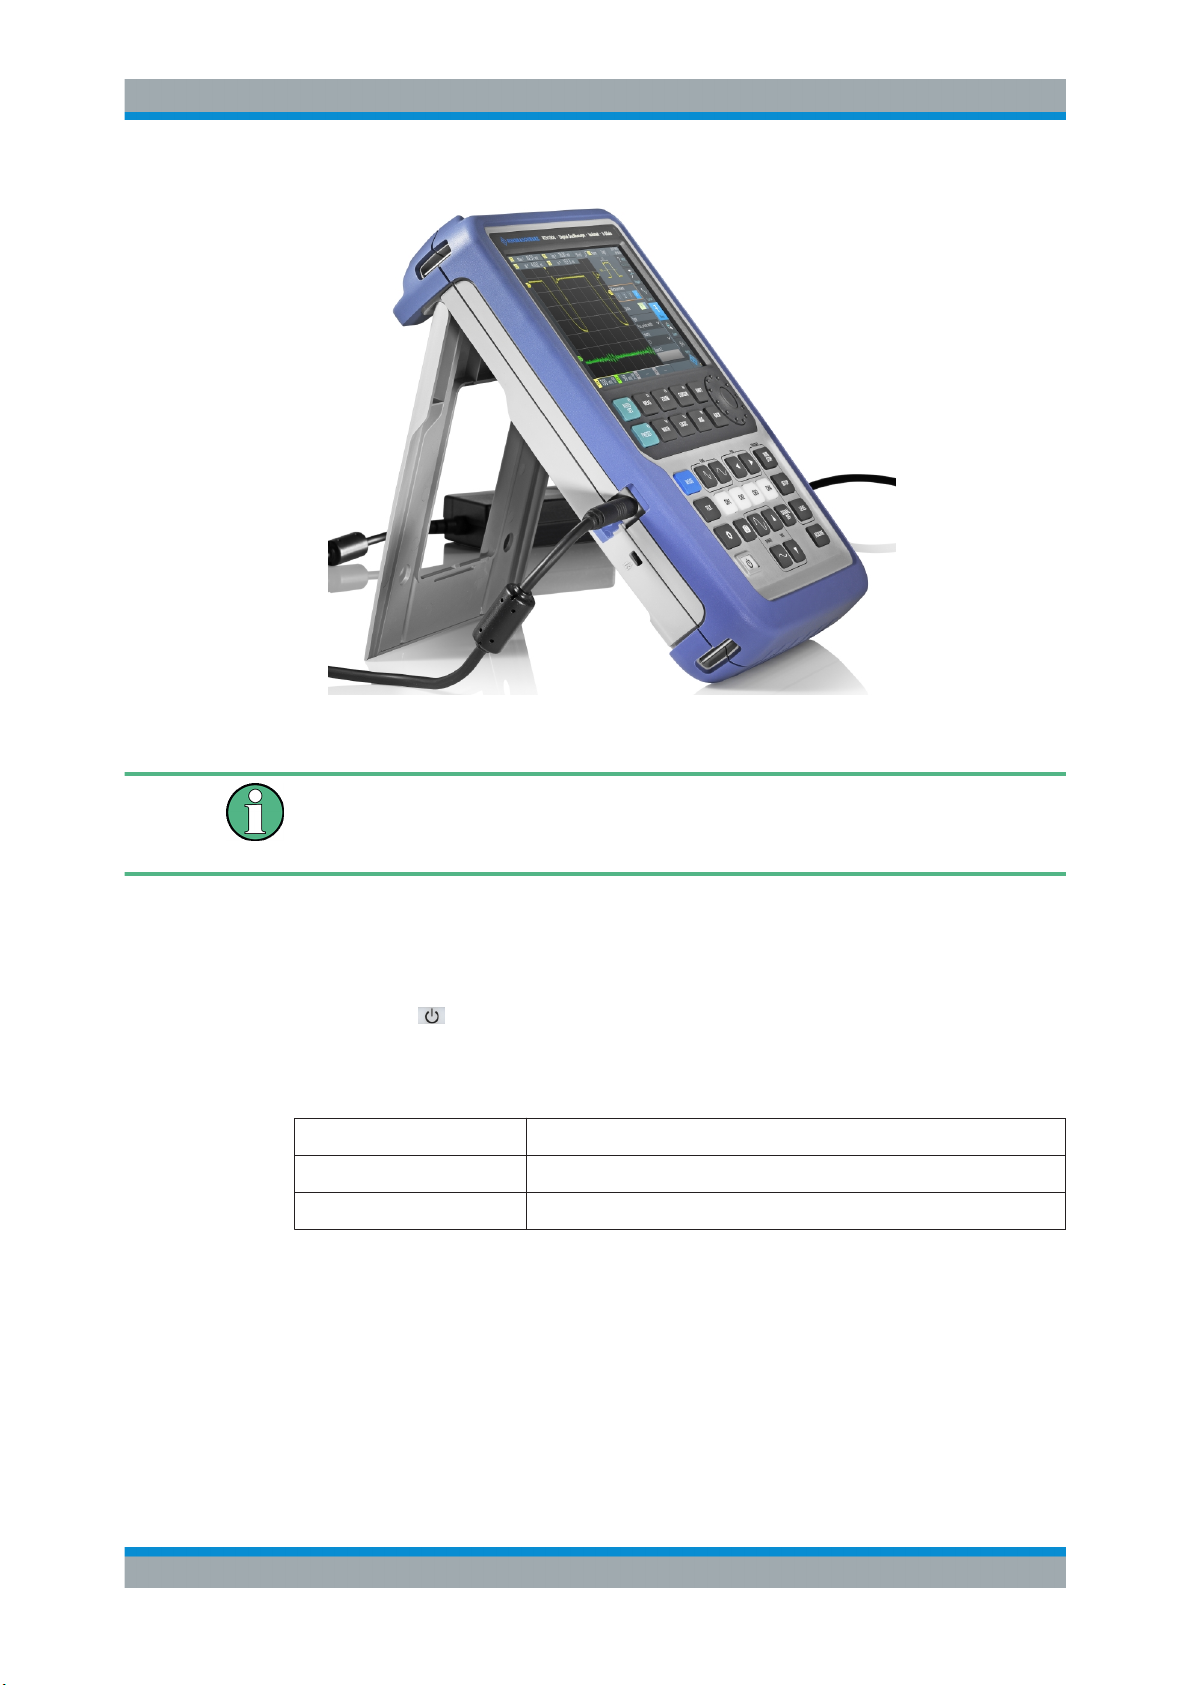
2.2.3 Powering On/Off
►
Press the
The key blinks and turns green after a few seconds.
Table 2-1: Colors of the Power key
Green Power is on
Blue Charging the battery, power is off
Orange (yellow) Battery is fully charged, power adapter is connected, power is off
If you do not use the instrument for a longer time, the battery gets exhausted. When
you connect the power supply and switch on the instrument with exhausted battery, it
takes a few minutes until the instrument can start.
[Power] key to switch the instrument on or off.
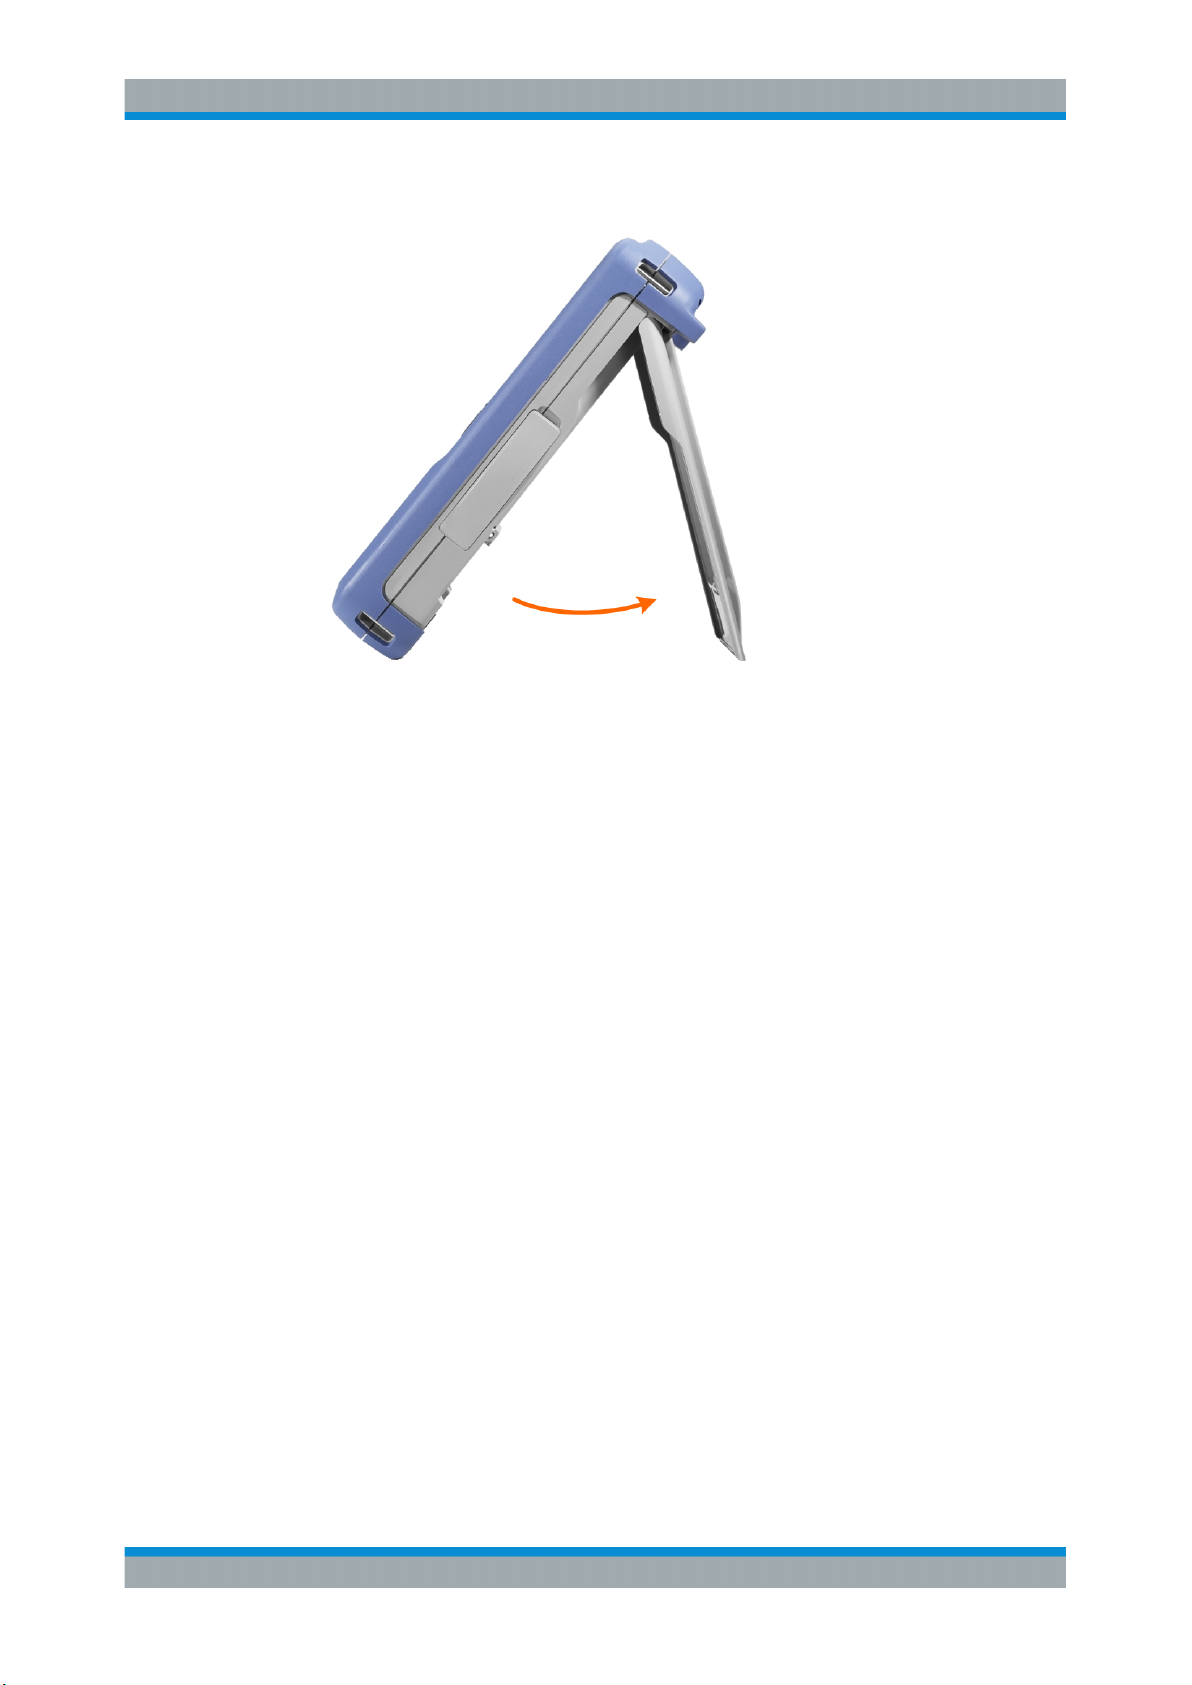
2.2.4 Using the Tilt Stand
The R&S RTH has a tilt stand for proper handling while the scope is placed on a table.
15User Manual 1326.1578.02 ─ 15
Page 16
R&S®Scope Rider RTH
► Pull the tilt stand as shown below.
Getting Started
Preparing for Use
2.2.5 EMI Suppression
Electromagnetic Interference (EMI) may affect the measurement results.
To suppress generated Electromagnetic Interference:
●
Use suitable shielded cables of high quality. For example use double-shielded RF
and LAN cables.
●
Always terminate open cable ends.
●
Note the EMC classification in the data sheet.
16User Manual 1326.1578.02 ─ 15
Page 17
R&S®Scope Rider RTH
2.3 Instrument Tour
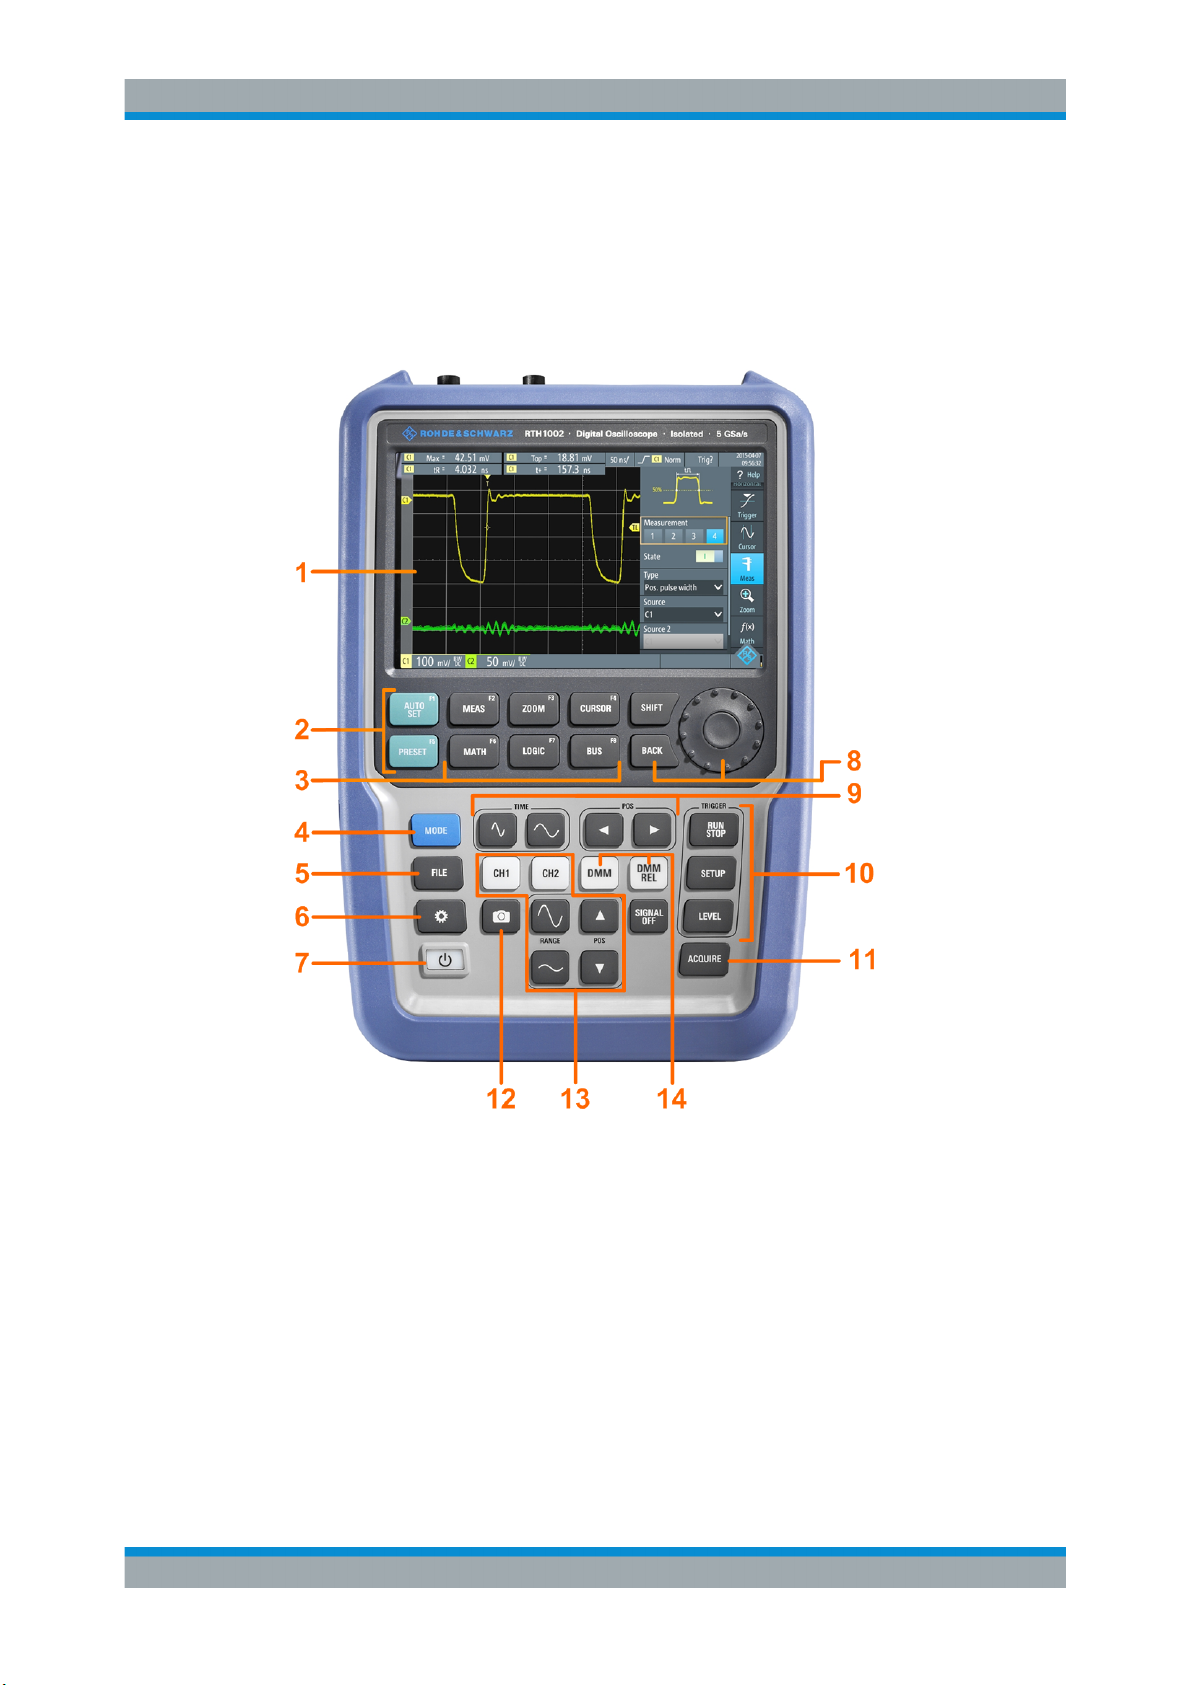
2.3.1 Front View
Getting Started
Instrument Tour
Figure 2-2: Front panel of the R&S RTH1002
1 = Touch display
2 = Waveform setup with [AUTOSET], reset to default with [PRESET]
3 = Analysis functions
4 = Mode selection
5 = Save/Recall
6 = Instrument settings
7 = Power on/off
8 = Navigation controls
9 = Horizontal settings
10 = Run/stop acquisition and trigger settings
11 = Acquisition settings
12 = Screenshot and documentation output
13 = Channels and vertical settings
14 = Multimeter measurements
17User Manual 1326.1578.02 ─ 15
Page 18
R&S®Scope Rider RTH
Getting Started
Instrument Tour
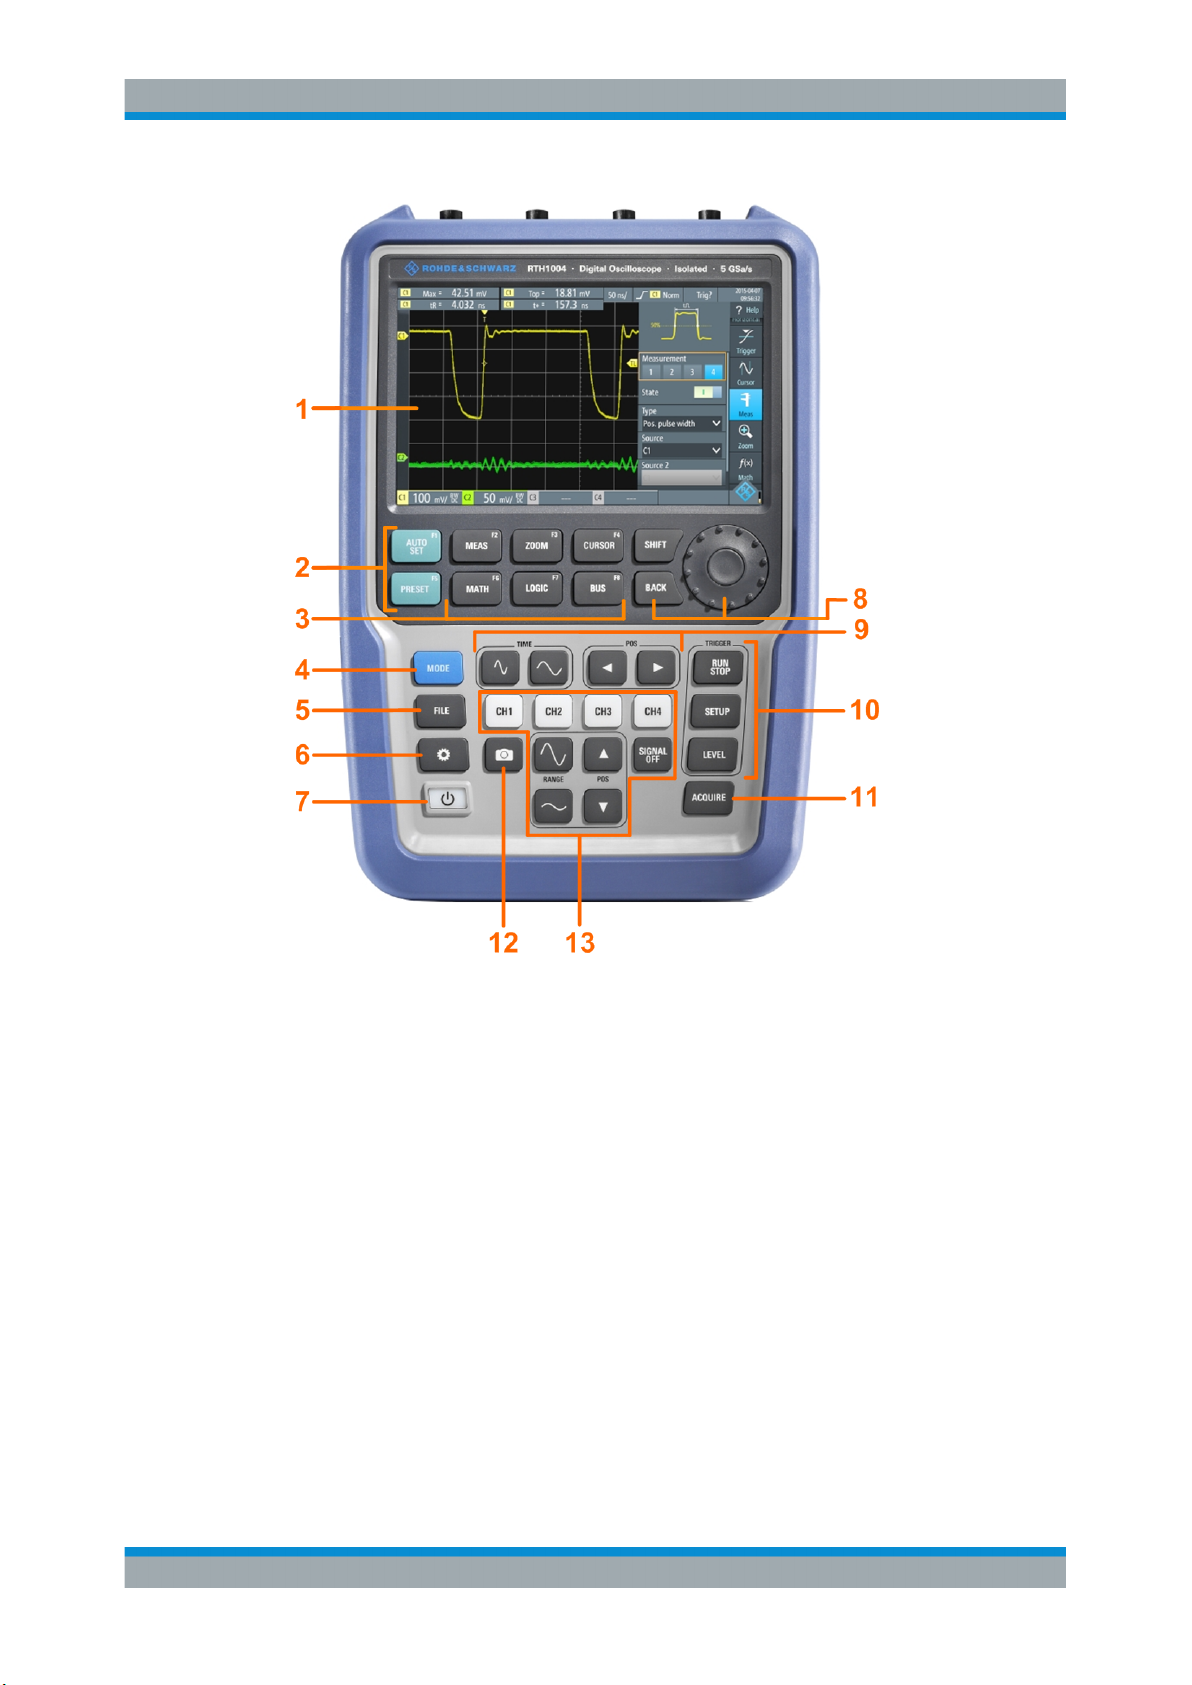
Figure 2-3: Front panel of the R&S RTH1004
1 = Touch display
2 = Waveform setup with [AUTOSET], reset to default with [PRESET]
3 = Analysis functions
4 = Mode selection
5 = Save/Recall
6 = Instrument settings
7 = Power on/off
8 = Navigation controls
9 = Horizontal settings
10 = Run/stop acquisition and trigger settings
11 = Acquisition settings
12 = Screenshot and documentation output
13 = Channels and vertical settings
For a description of the keys, see Chapter 2.4.1.3, "Using Front Panel Keys",
on page 30.
18User Manual 1326.1578.02 ─ 15
Page 19
R&S®Scope Rider RTH
2.3.2 Top View
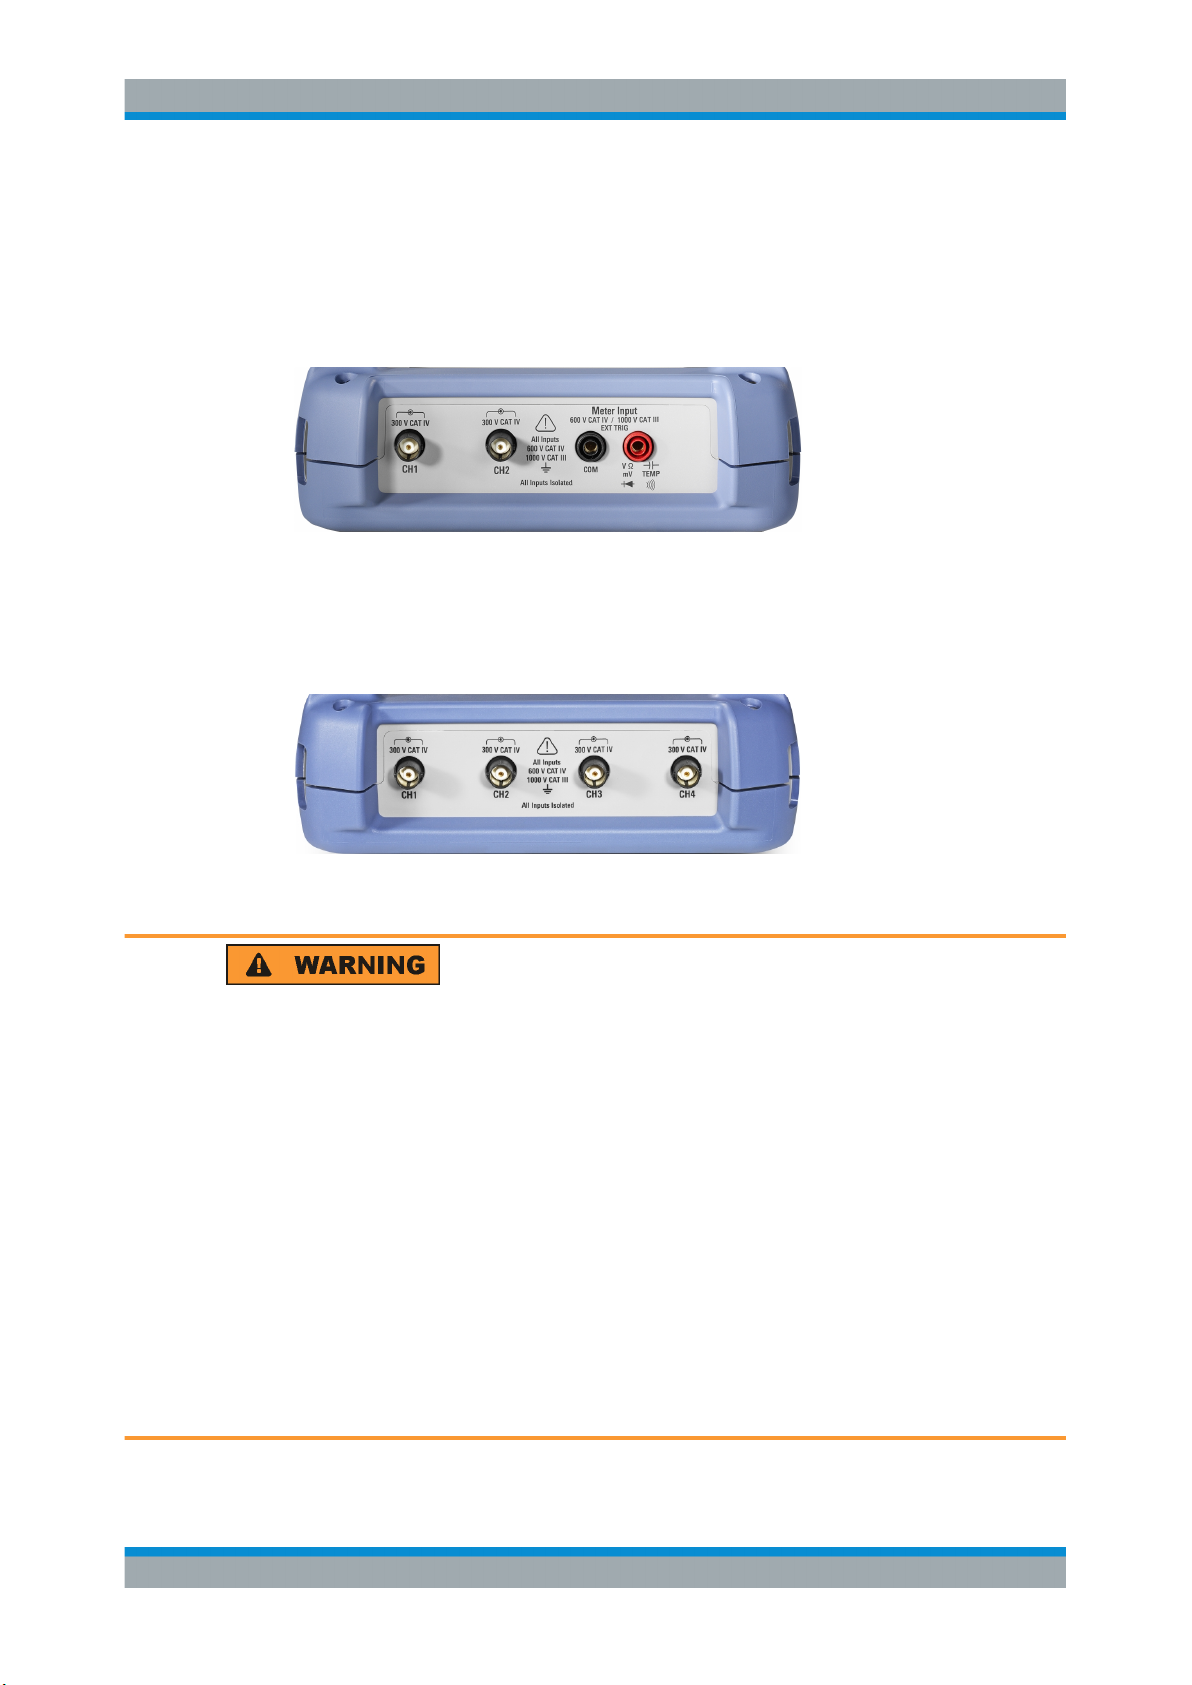
The R&S RTH1002 has two BNC input connectors CH1 and CH2, and two 4 mm
banana plug inputs for multimeter measurements. The channel inputs have double
channel-to-channel isolation that allows for independent floating measurements at
each input. The DMM input is fully isolated from scope inputs, interfaces, and ground.
Figure 2-4: Top view of R&S RTH1002
The R&S RTH1004 has four BNC input connectors CH1, CH2, CH3, CH4. The channel
inputs have double channel-to-channel isolation that allows for independent floating
measurements at each input.
Getting Started
Instrument Tour
Figure 2-5: Top view of R&S RTH1004
Shock hazard caused by high voltages
To avoid electrical shock and personal injury, and to prevent damage to the instrument
or any other products connected to it, observe the following:
●
Do not apply input voltages above the rating of the instrument and the accessories.
●
Use only probes, test leads, and adapters that comply with the measurement category (CAT) of your measurement task.
●
Test leads and measurement accessories used for multimeter measurements on a
live mains circuit must be rated for CAT III or CAT IV according to IEC 61010-031.
The voltage of the measured circuit must not exceed the rated voltage value.
Maximum input voltage:
●
At BNC inputs: CAT IV 300 V
●
With probe R&S RT-ZI10 or R&S RT-ZI11: CAT IV 600 V, CAT III 1000 V
●
Meter input: CAT IV 600 V; CAT III 1000 V
Voltage ratings: V RMS (50 to 60 Hz) for AC sine wave and V DC for DC applications.
19User Manual 1326.1578.02 ─ 15
Page 20
R&S®Scope Rider RTH
Risk of electrical shock or fire
Voltages higher than 30 V RMS or 42 V peak or 60 V DC are regarded as hazardous
contact voltages. When working with hazardous contact voltages, use appropriate protective avoid electrical shock and injuries:
●
Use only insulated probes, cables, test leads and adapters.
●
Do not touch voltages higher than 30 V RMS or 42 V peak or 60 V DC.
See also: Chapter 2.1.2, "Input Isolation", on page 9.
2.3.3 Right View
Getting Started
Instrument Tour
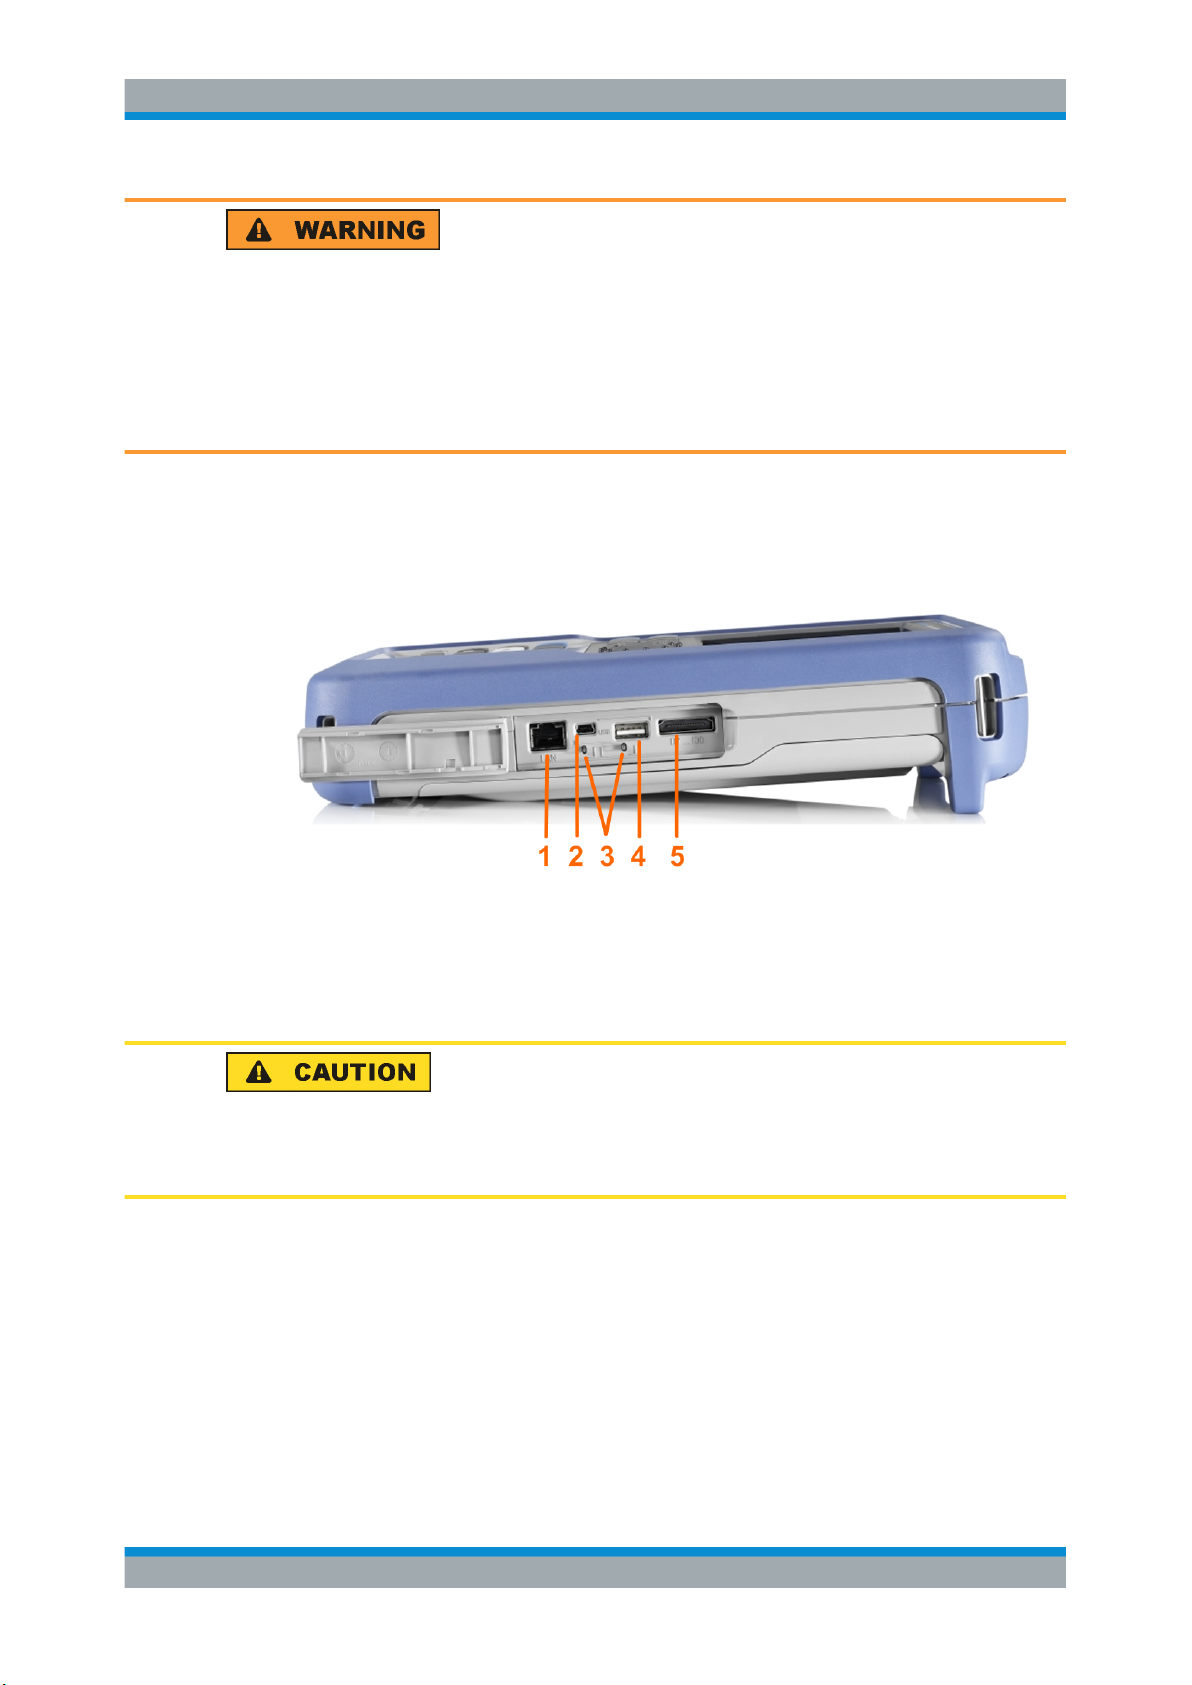
1
= LAN
2 = USB type B for remote control
3 = Probe compensation
4 = USB type A for flash drive
5 = Logic probe connector
Risk of injury or instrument damage
Always close the lids of the communication ports and DC input when they are not in
use.
LAN connector
RJ-45 connector to connect the instrument to a Local Area Network (LAN). It supports
up to 100 Mbit/s.
USB type A connector
USB type A connector to connect a USB flash drive to store and reload instrument settings and measurement data.
20User Manual 1326.1578.02 ─ 15
Page 21
R&S®Scope Rider RTH
USB type B connector (mini USB)
Mini USB connector to connect a computer for remote control of the instrument.
Probe compensation
Probe compensation terminal to support adjustment of passive probes to the oscilloscope channel.
Logic probe connector
Input for the logic probe R&S RT-ZL04. Logic analysis requires Mixed Signal Option
R&S RTH-B1, which includes the logic probe R&S RT-ZL04.
Risk of electrical shock - no CAT rating for MSO measurements
The logic probe R&S RT-ZL04 is not rated for any measurement category. To avoid
electrical shock or personal injury, and to prevent material damage, make sure that the
ground clips of the R&S RT-ZL04 are connected to protective earth on the DUT.
Getting Started
Instrument Tour
2.3.4 Left View
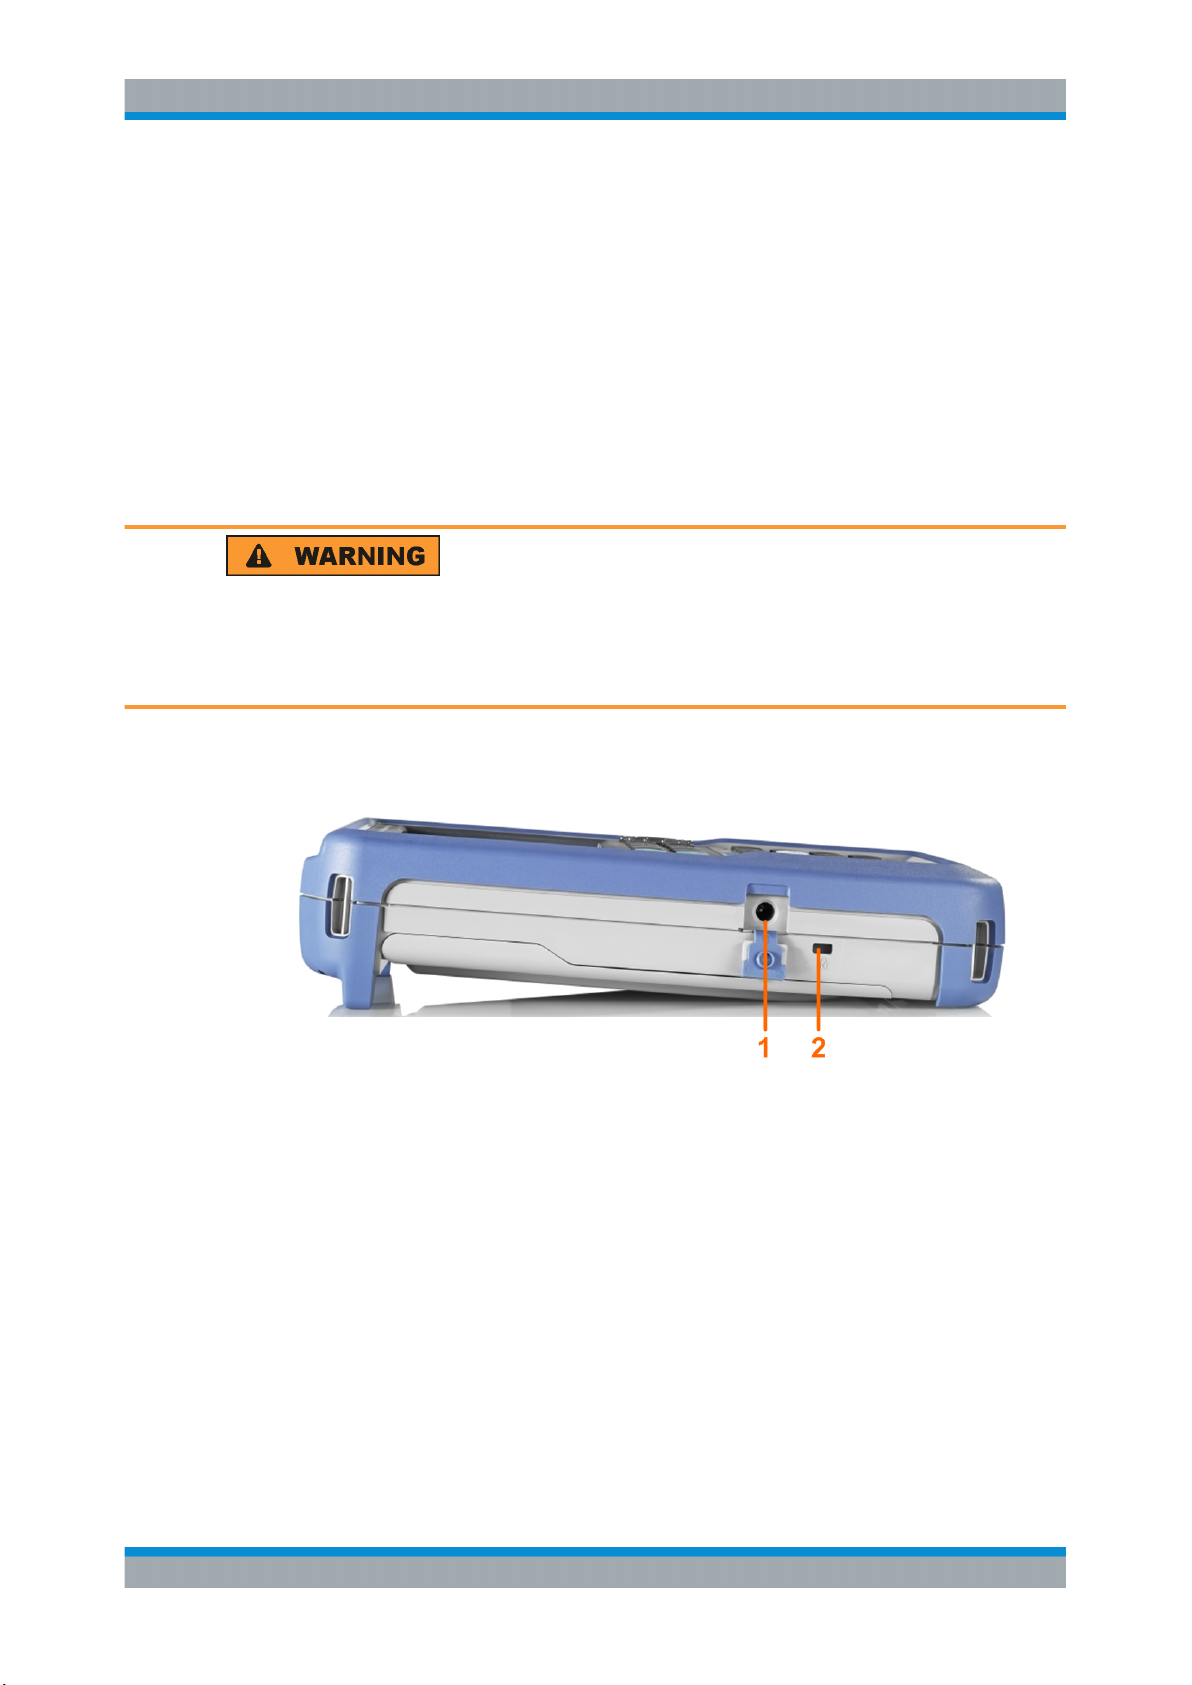
= DC input
1
2 = Kensington lock slot
DC input
Connector for the power adapter to charge the battery.
Kensington lock slot
The Kensington lock is used to secure the instrument against theft.
21User Manual 1326.1578.02 ─ 15
Page 22
R&S®Scope Rider RTH
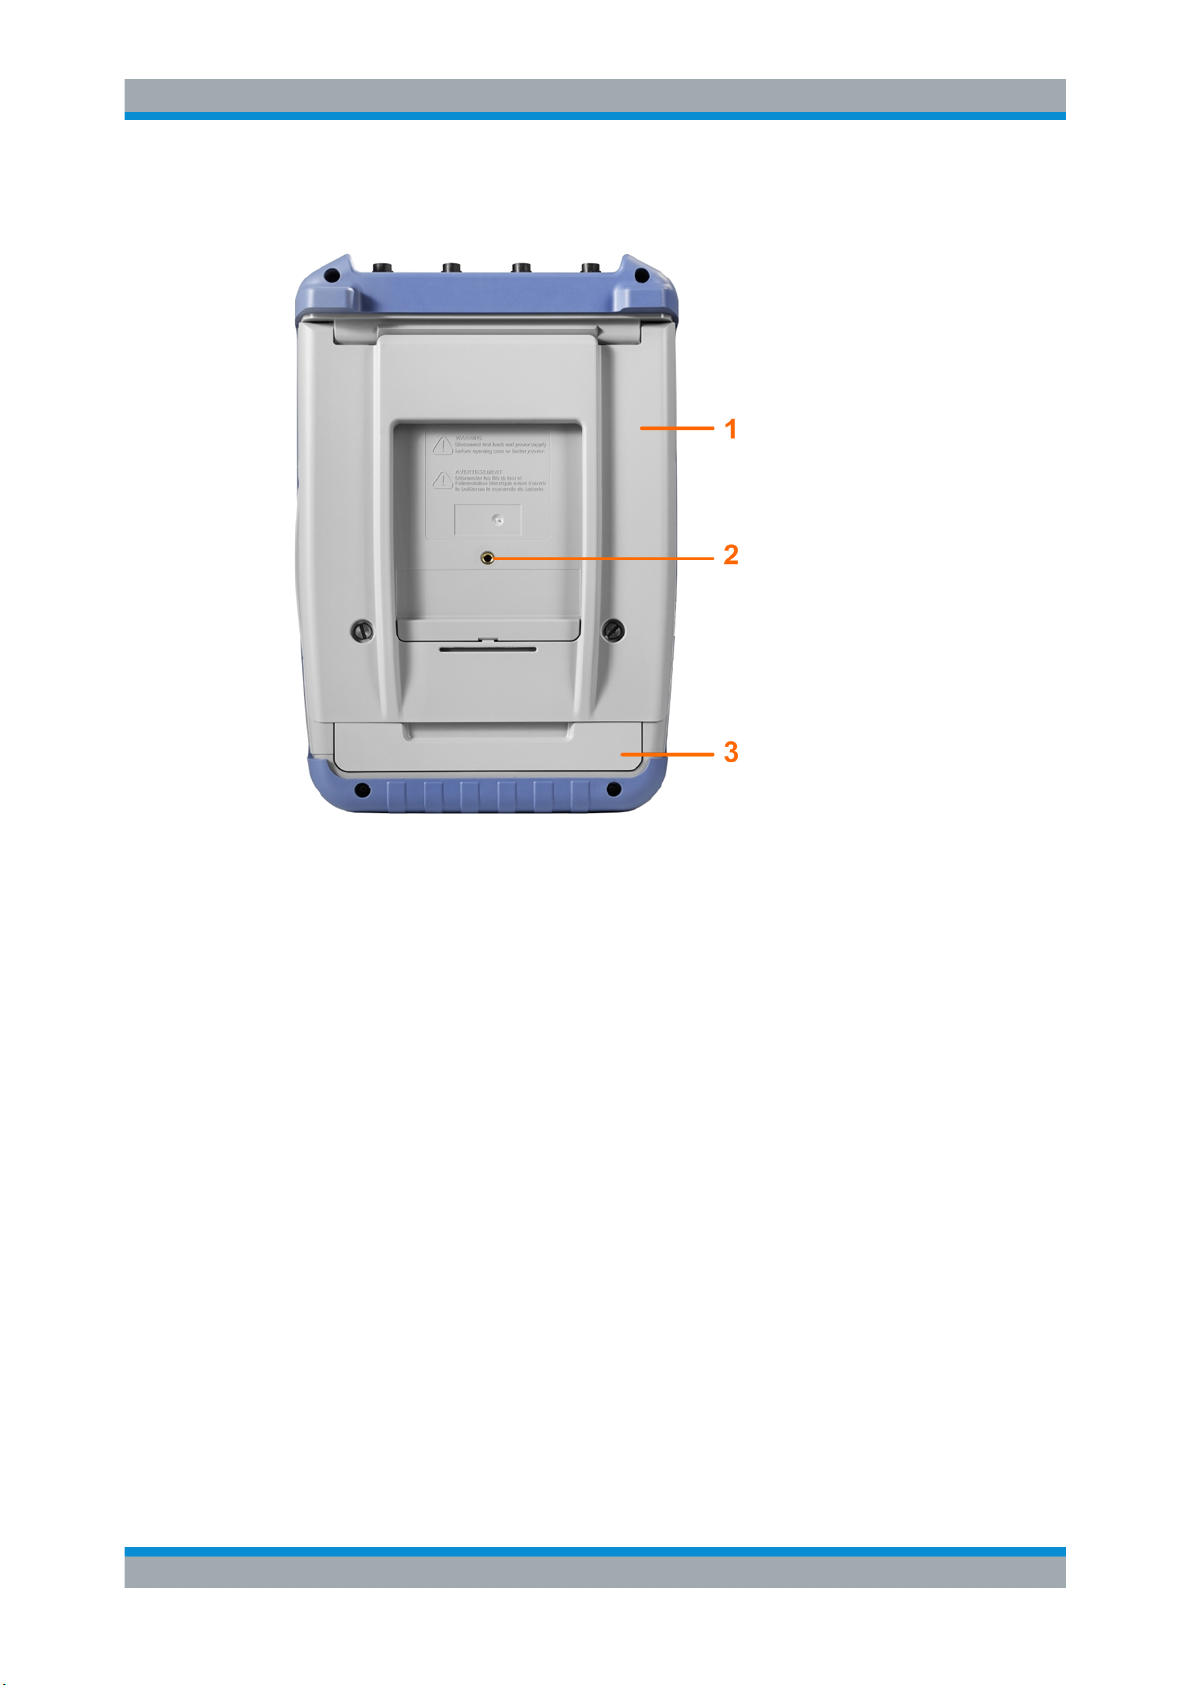
2.3.5 Rear View
Getting Started
Instrument Tour
1 = Tilt stand to fold out
2 = Thread hole M5
3 = Battery compartment
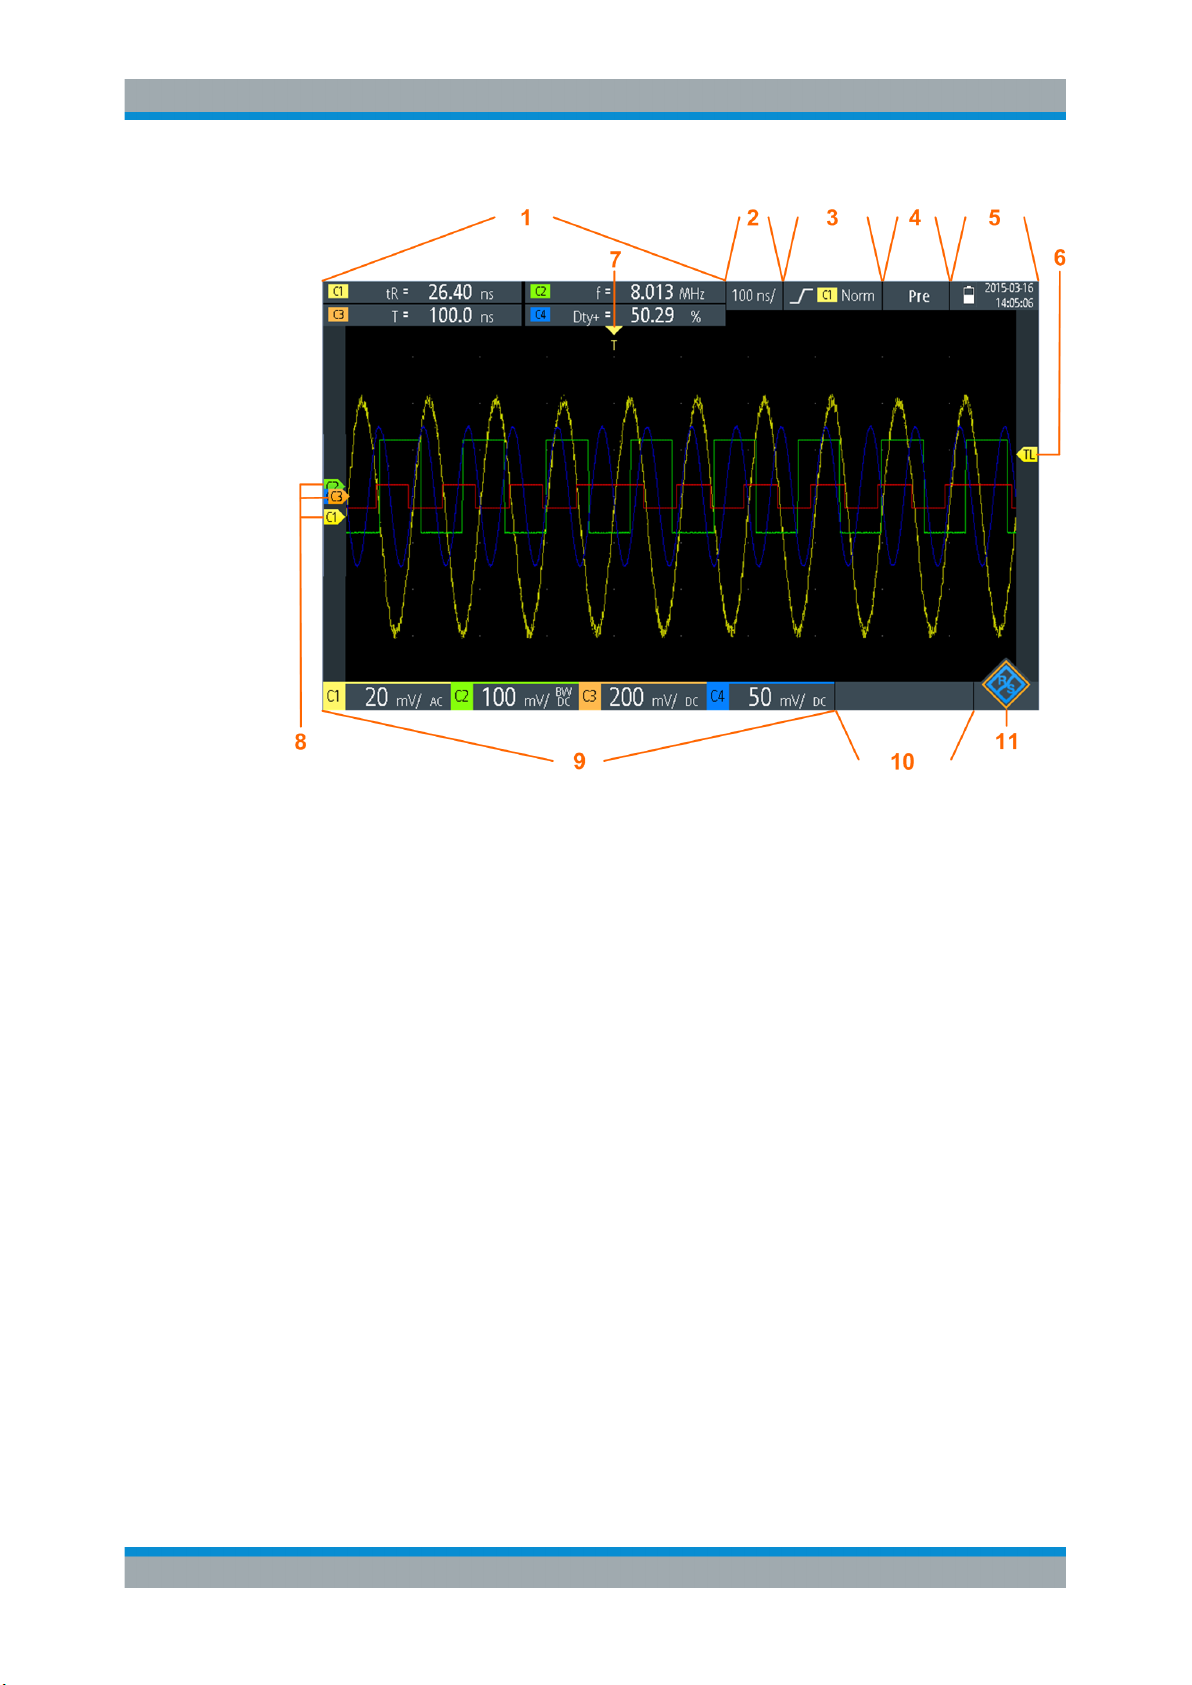
2.3.6 Display Overview
In the most important modes scope, mask and XY, the display shows the following
information.
22User Manual 1326.1578.02 ─ 15
Page 23
R&S®Scope Rider RTH
Getting Started
Operating Basics
1 = Measurement results, depends on the mode and the selected measurement
2 = Time scale (horizontal scale, in s/division)
3 = Trigger type, trigger source, and trigger mode
4 = Capture status
5 = Battery status and AC connectivity for battery charging; date and time
6 = Trigger level marker, has the color of the trigger source
7 = Trigger position marker, has the color of the trigger source
8 = Channel markers indicate the ground levels. Channel C3 has the focus
9 = Vertical settings for each active channel: vertical scale (vertical sensitivity, in V/division), bandwidth limit
(no indicator = full bandwidth, BW= limited frequency), coupling (AC or DC)
10 = Logic channels (MSO R&S RTH-B1)
11 = Menu button
You can adjust the vertical position of each waveform, the trigger level, and the trigger
position by dragging the corresponding marker on the display. Alternatively, tap a
marker to set the focus, and use the wheel to adjust position.
2.4 Operating Basics
2.4.1 Accessing the Functionality
The complete functionality is available in the menus and dialogs on the touchscreen.
You can touch the functions directly on the display, or you can use the wheel to navi-
23User Manual 1326.1578.02 ─ 15
Page 24
R&S®Scope Rider RTH
gate and select. In addition, the most important functions are applied to the keys on the
front panel to set up and perform measurement tasks quickly.
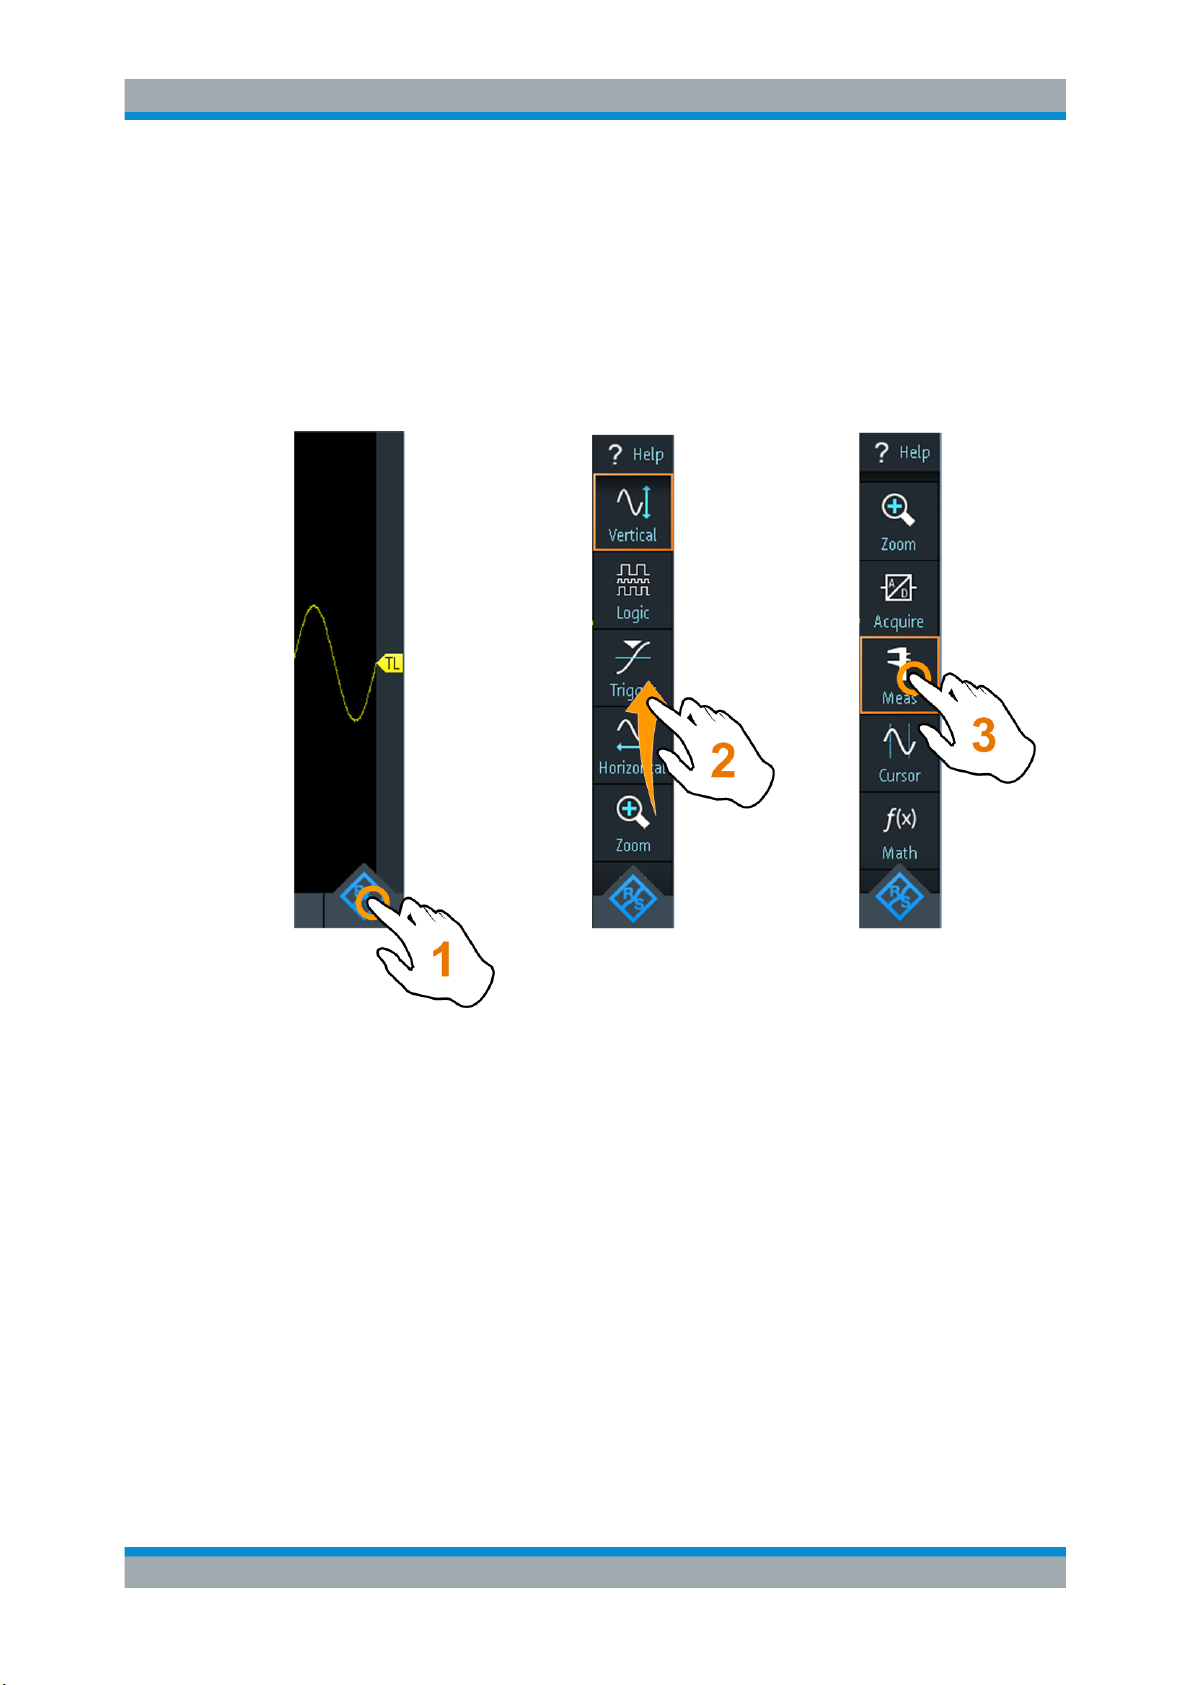
2.4.1.1 Using the Touchscreen
Using the touchscreen of the R&S RTH is as easy as using your mobile phone. To
open the menu, tap the "Menu" button - that is the R&S logo in the right bottom corner
of the display.
Getting Started
Operating Basics
Figure 2-6: Open the menu and select a menu item
24User Manual 1326.1578.02 ─ 15
Page 25
R&S®Scope Rider RTH
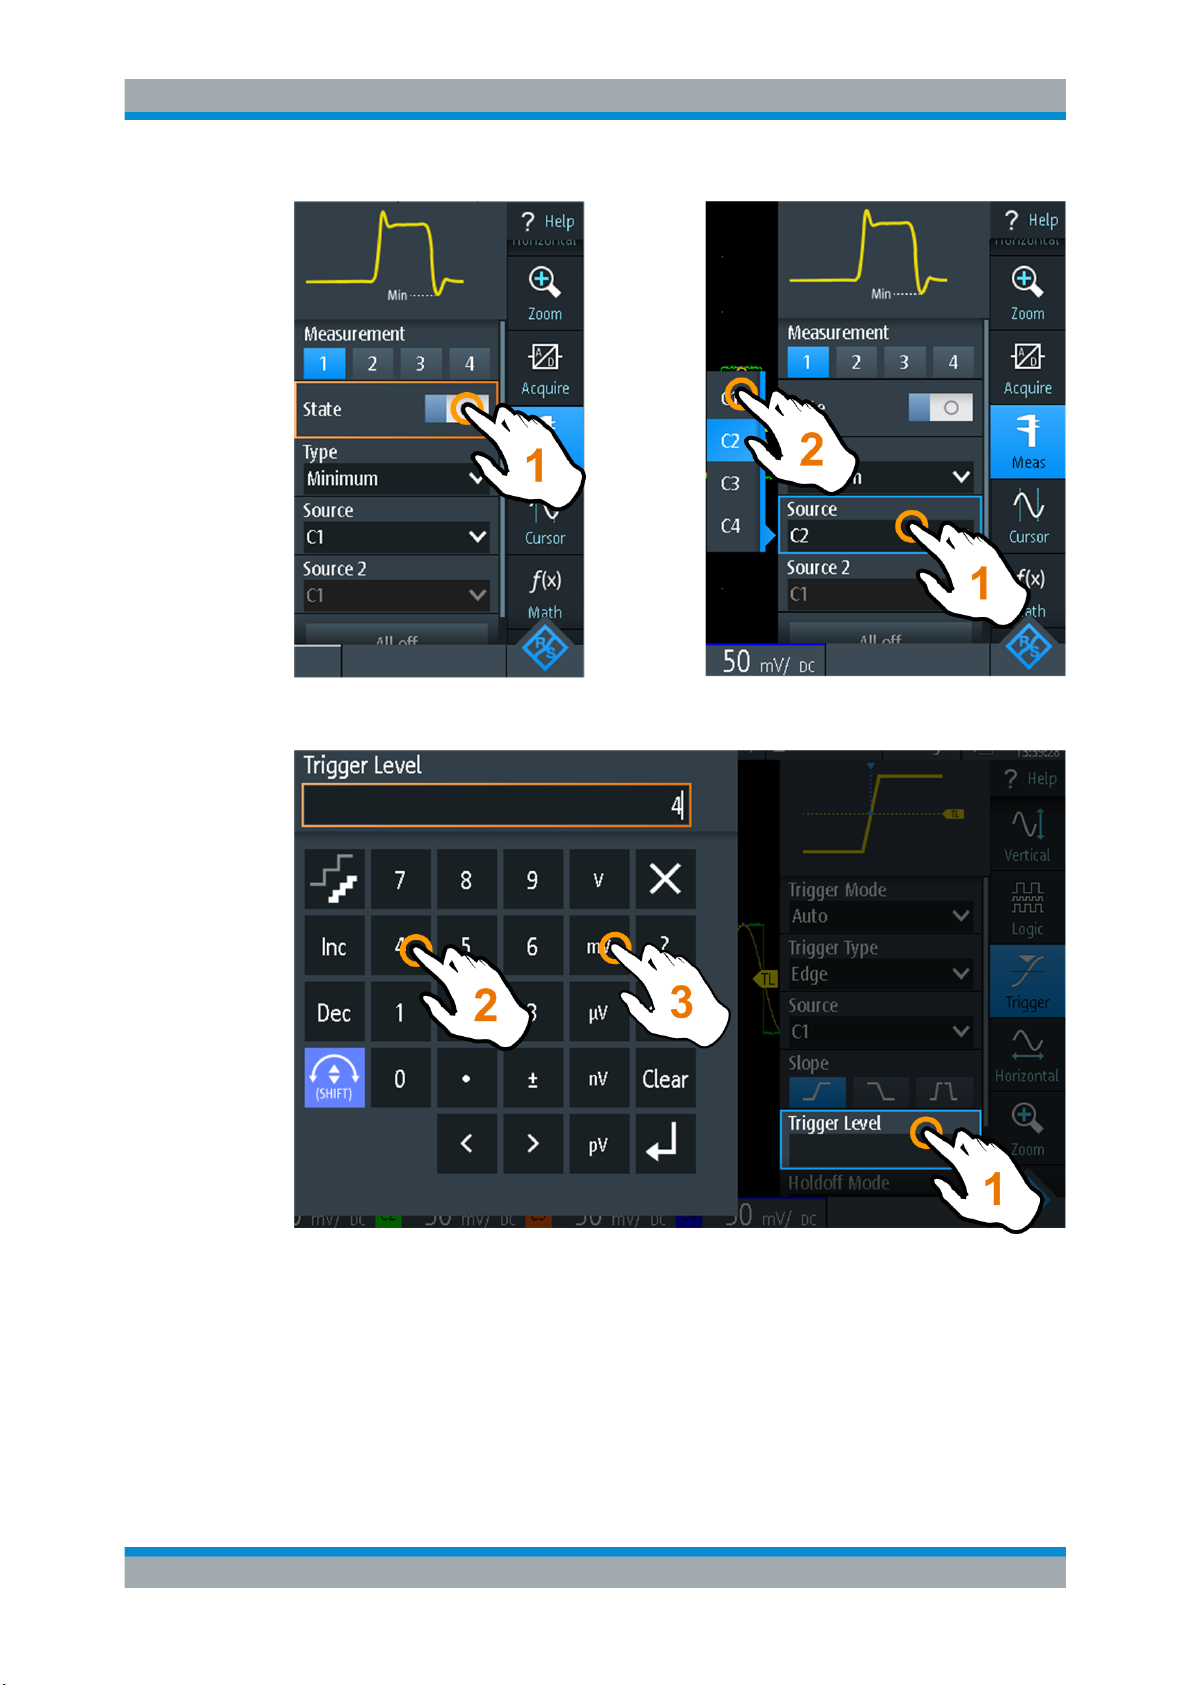
Getting Started
Operating Basics
Figure 2-7: Switch on or off (left) and select a parameter value (right)
Figure 2-8: Enter numerical value and unit
2.4.1.2 Using the Navigation Wheel
In addition or alternatively to the touchscreen, you can use the wheel to control the
R&S RTH.
25User Manual 1326.1578.02 ─ 15
Page 26

R&S®Scope Rider RTH
When using the wheel, always observe the position of the focus - the orange frame or
other highlighting that marks the active object on the screen.
●
If the focus is on the menu button or somewhere in the menu or dialogs:
– Turn the wheel to move the focus.
– Press the wheel button to apply the selection.
●
If the focus is on an element in the diagram, for example, on a waveform, cursor
line, or trigger level:
– Turn the wheel to change the position of the active element.
– Press the wheel button to toggle the active element, for example, to toggle the
The [BACK] key closes open dialogs and menus, and resets the focus to the "Menu"
button.
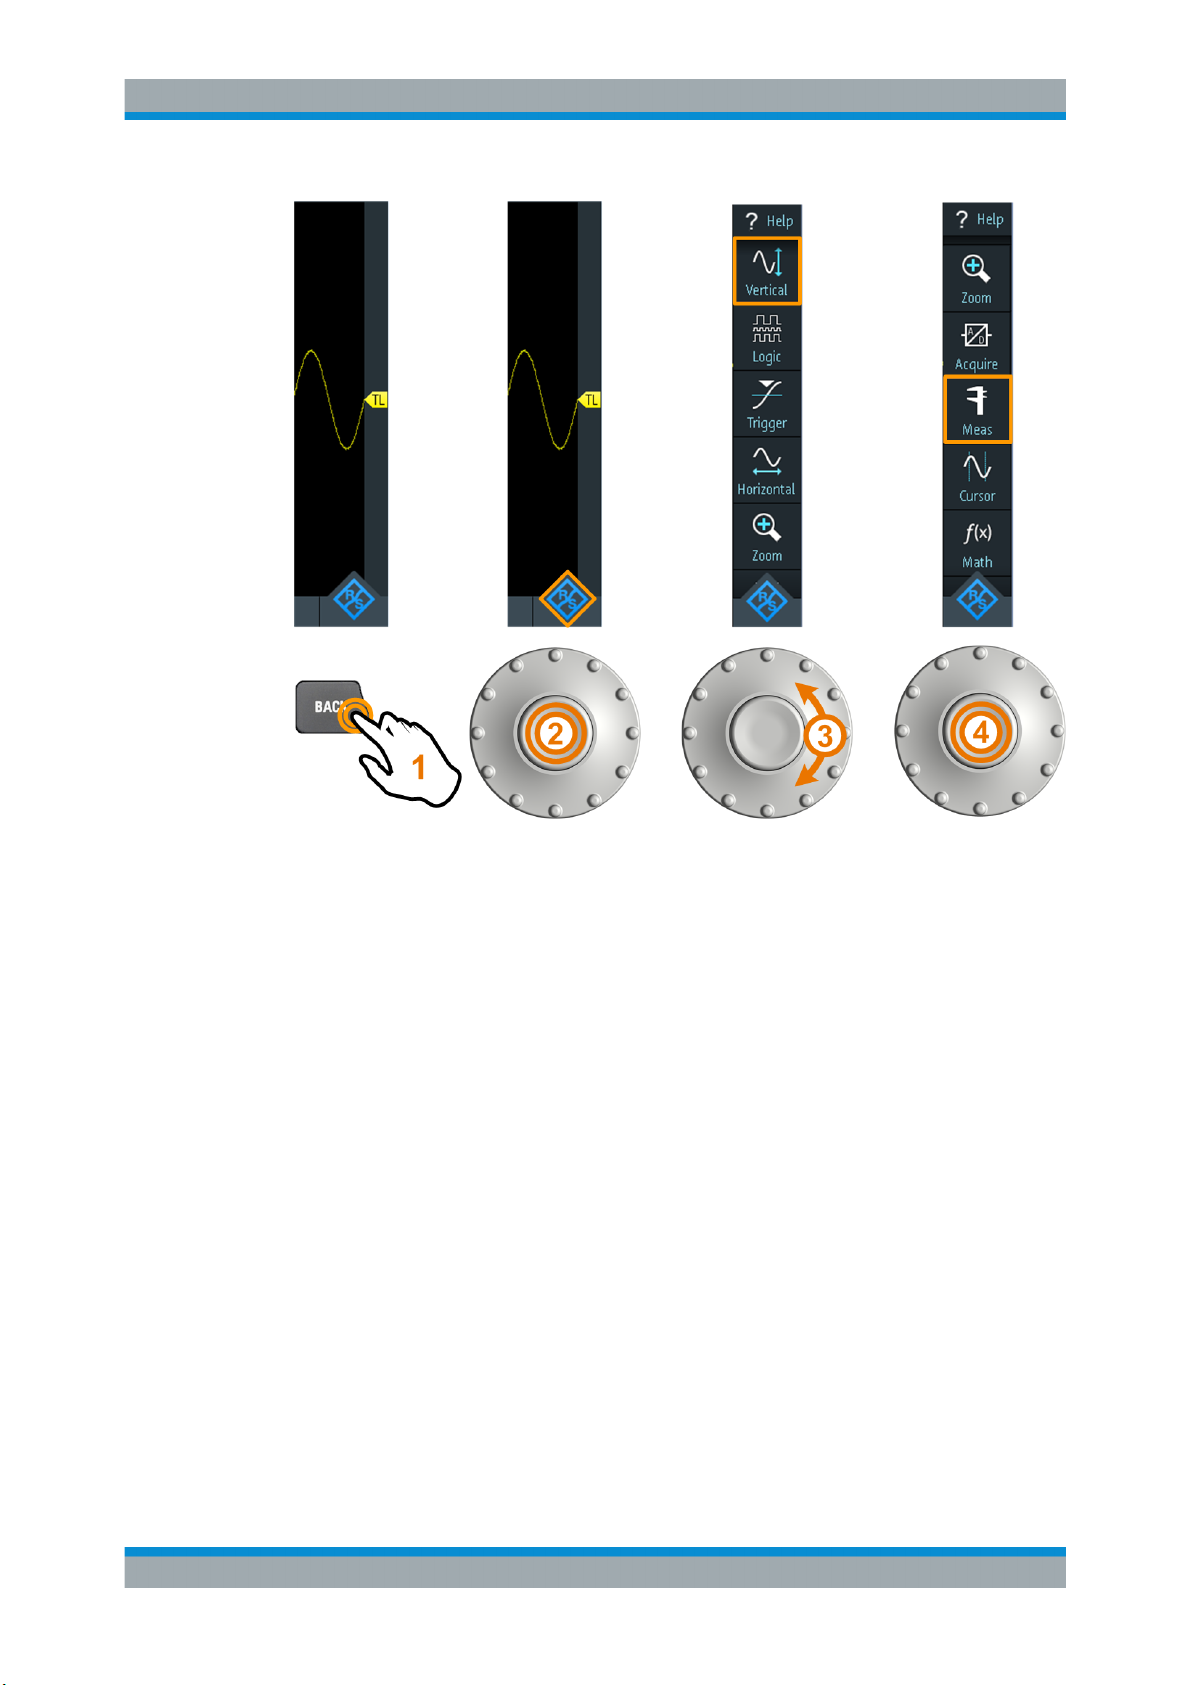
Menu navigation
The following procedure describes how to access and navigate the menu. Navigating
dialogs and selecting parameter values works in the same way. See also Figure 2-9.
Getting Started
Operating Basics
cursor lines, or zoom size and zoom position.
1. Press [BACK] until the focus is on the "Menu" button.
2. Press the wheel button to open the menu.
3. Turn the wheel to move the focus to the required menu item.
4. Press the wheel button to open the dialog, submenu, or keypad for the selected
menu item.
26User Manual 1326.1578.02 ─ 15
Page 27
R&S®Scope Rider RTH
Getting Started
Operating Basics
Figure 2-9: Open the menu and select a menu item
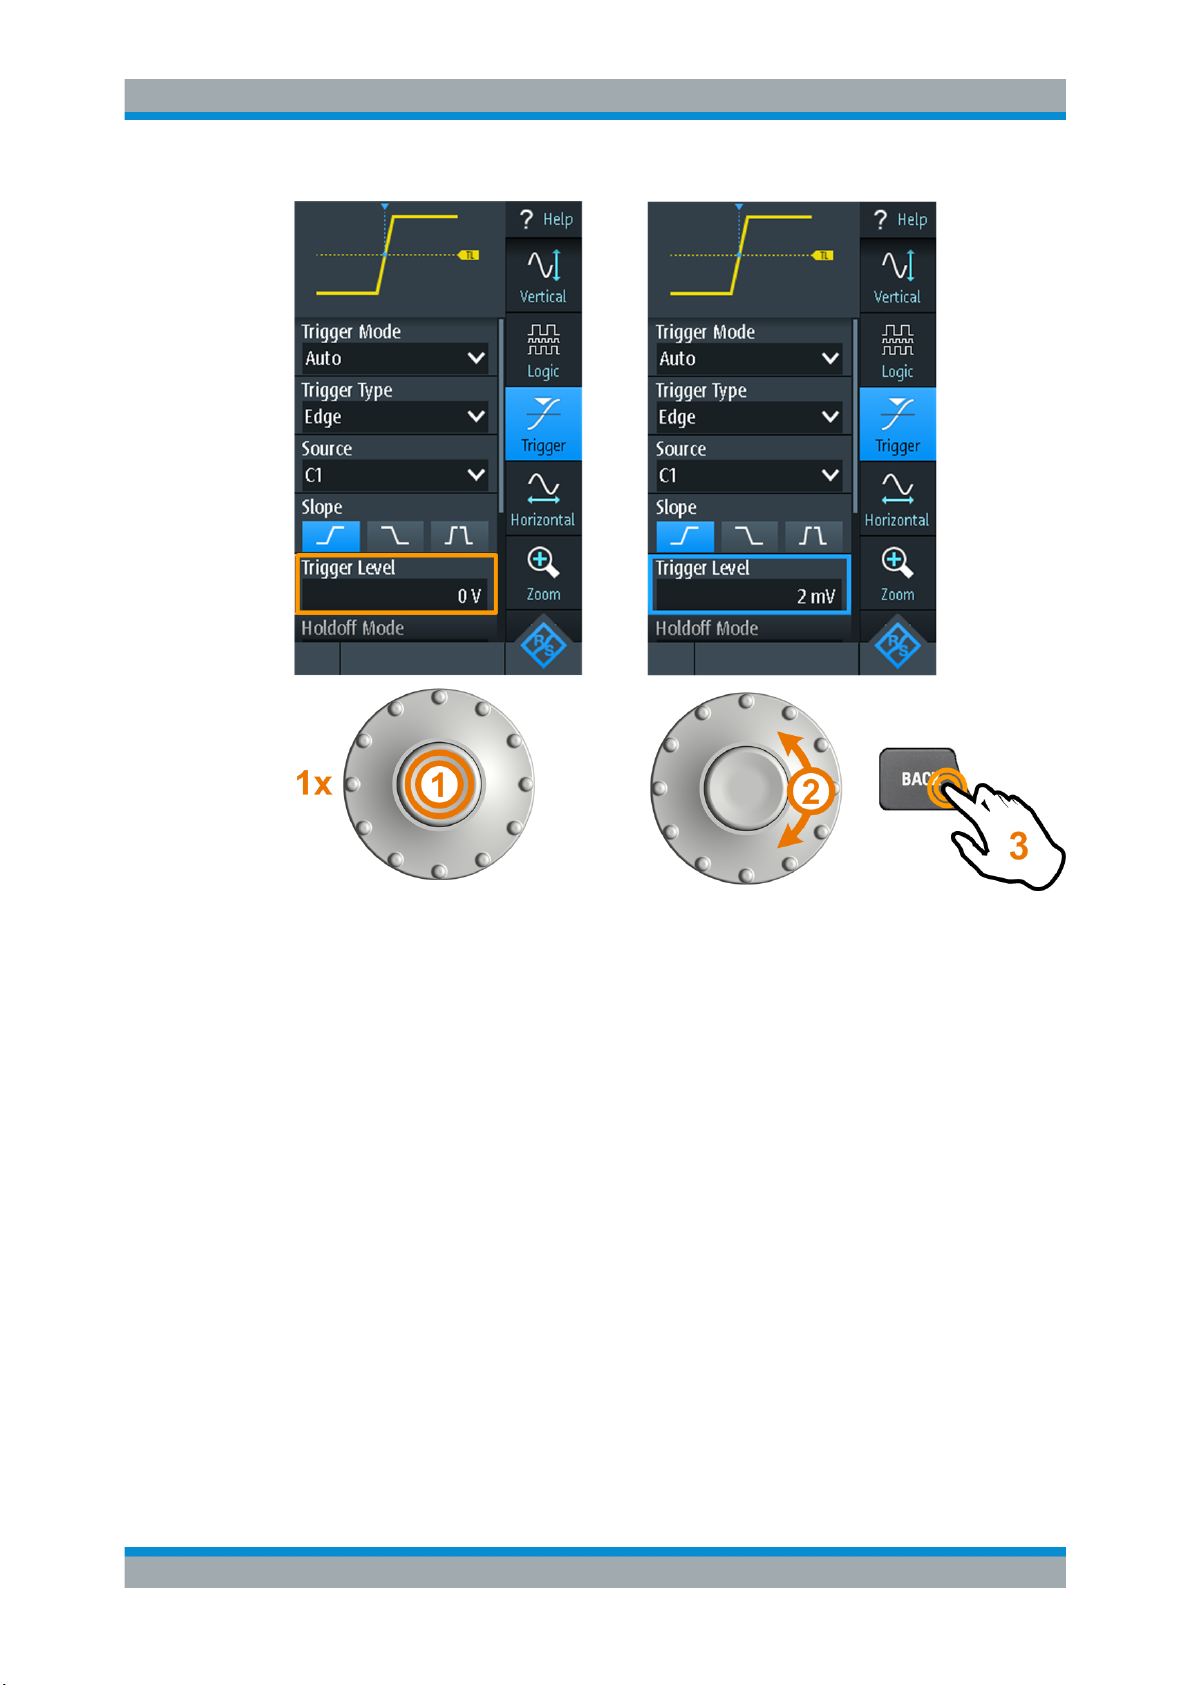
Set numerical value using the wheel
1. Set the focus to the required setting, and press the wheel button once.
2. Turn the wheel until the required value is shown.
3. Press [BACK].
27User Manual 1326.1578.02 ─ 15
Page 28
R&S®Scope Rider RTH
Getting Started
Operating Basics
Figure 2-10: Set numerical value using the wheel
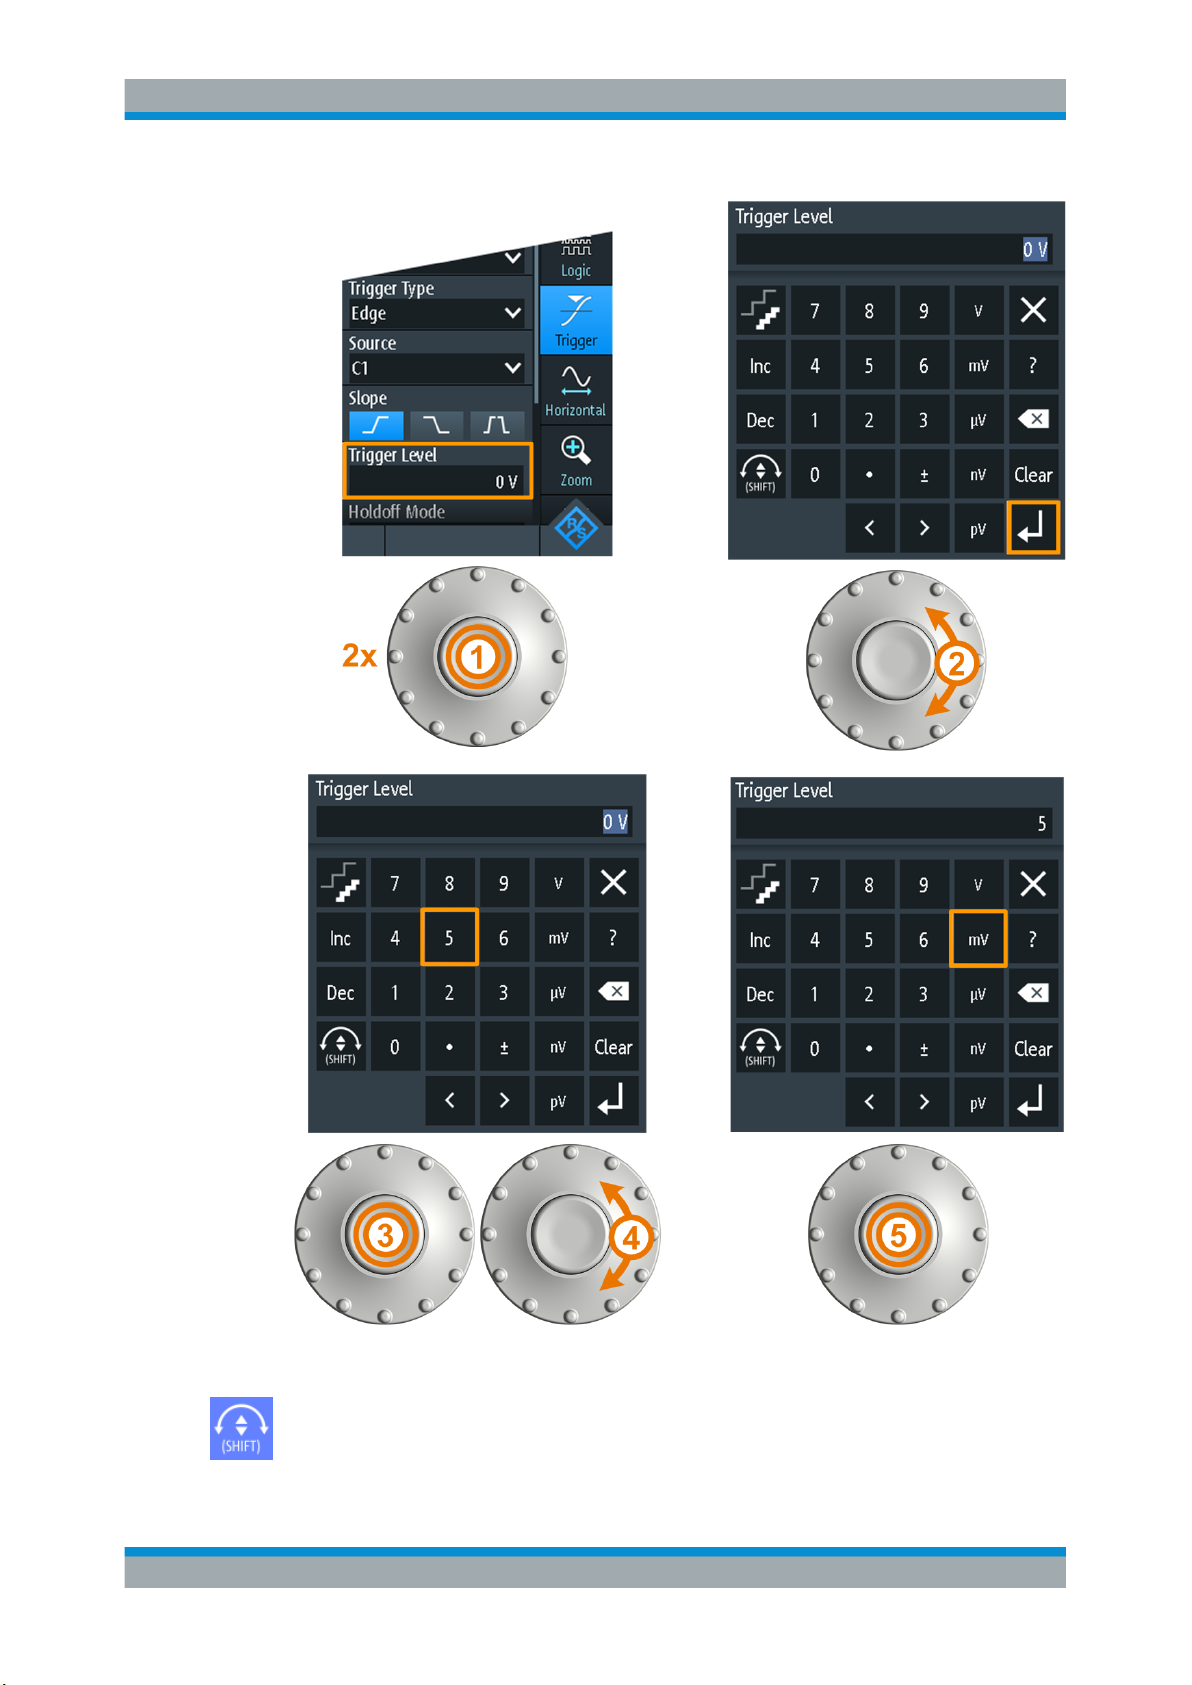
Data entry using wheel and keypad
You can enter precise numerical values on the keypad. See also Figure 2-11.
1. Set the focus to the required setting, and press the wheel button twice.
2. Turn the wheel until the focus is on the required number.
3. Press the wheel button.
4. Turn the wheel until the focus is on the required unit.
5. Press the wheel button.
28User Manual 1326.1578.02 ─ 15
Page 29
R&S®Scope Rider RTH
Getting Started
Operating Basics
Figure 2-11: Enter numerical value and unit in the keypad
The [SHIFT] button toggles the wheel focus in the keypad. If the focus is on the entry
field, turning the wheel changes the value. If the focus is in the lower part, the wheel
selects numbers and unit.
29User Manual 1326.1578.02 ─ 15
Page 30
R&S®Scope Rider RTH
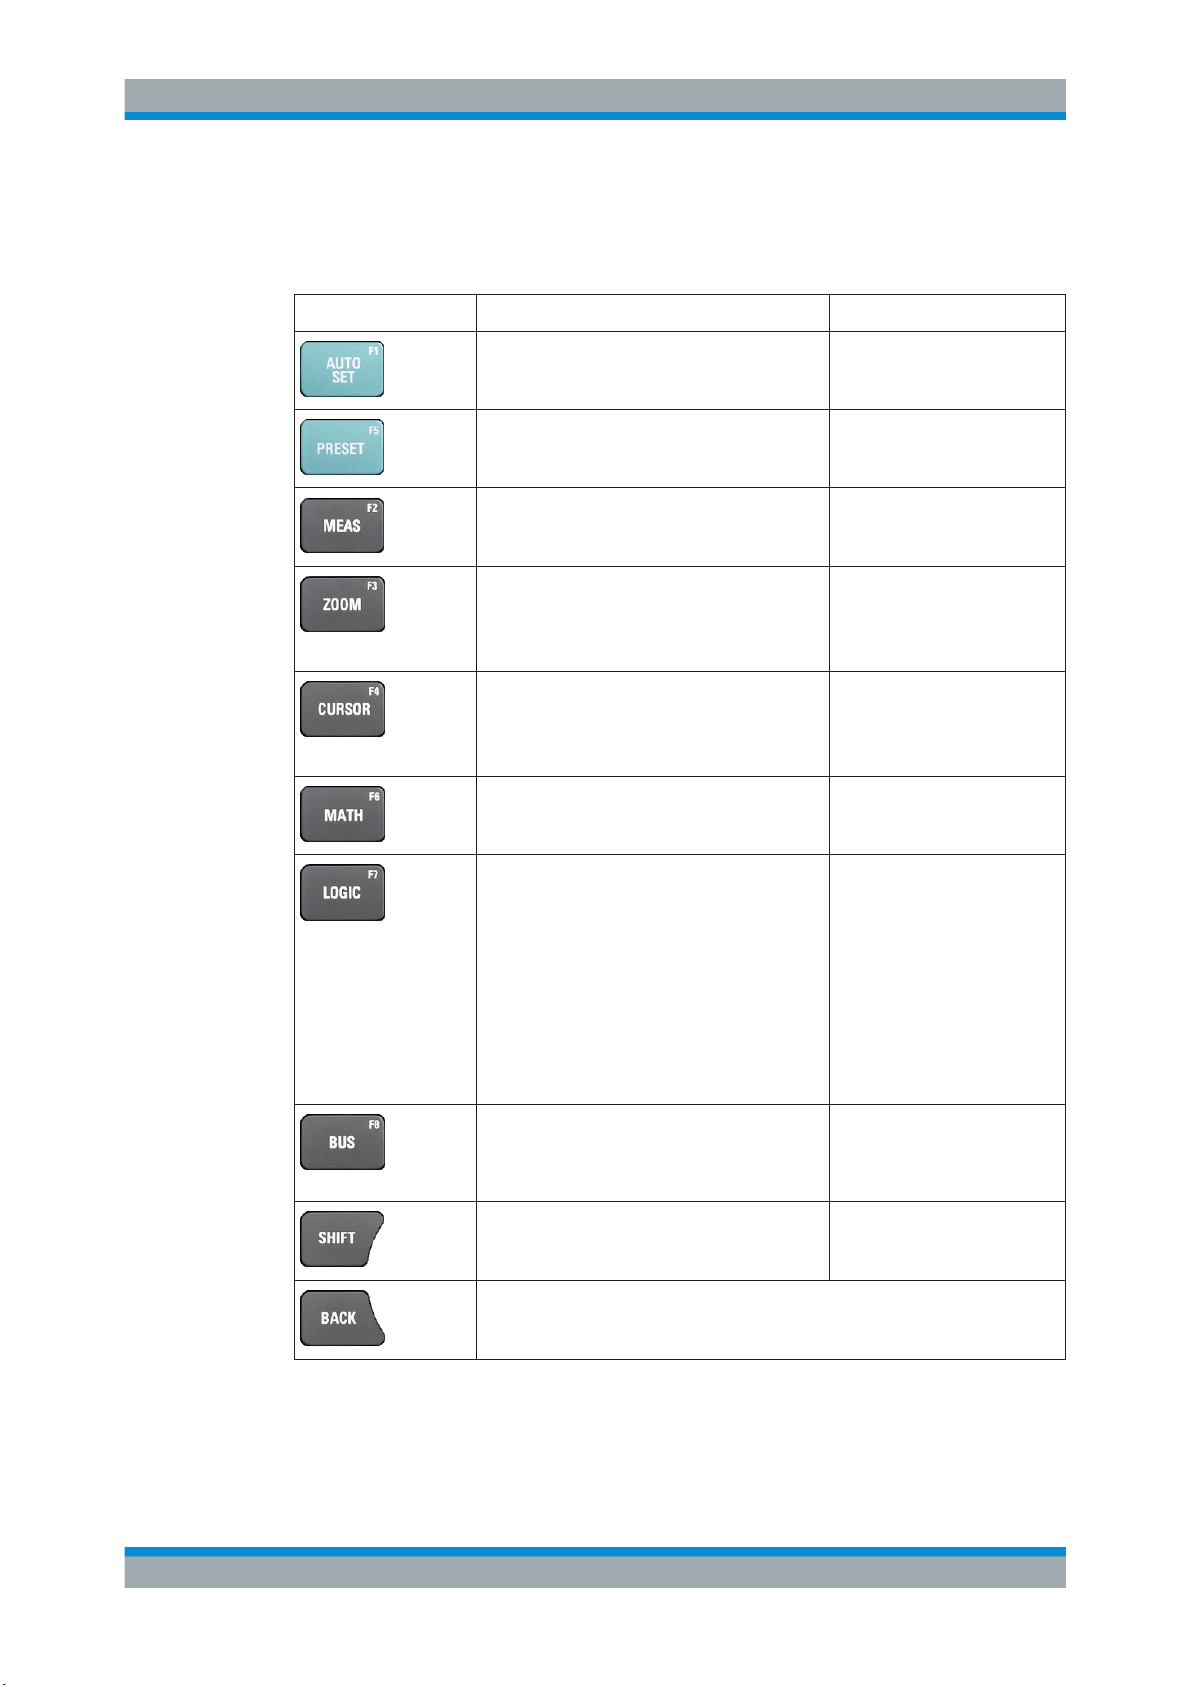
2.4.1.3 Using Front Panel Keys
For an overview of the front panel keys, see Figure 2-3
Key Press shortly Press and hold
Getting Started
Operating Basics
[AUTOSET] analyses the active channels,
adjusts the instrument settings, and displays
stable waveforms.
[PRESET] sets the instrument to the default
factory state.
[MEAS] starts or stops the last configured automatic measurements.
[ZOOM] enables or disables the zoom with the
last configuration.
If the zoom is on but not in focus, pressing the
key focuses the zoom.
[CURSOR] starts or stops the last configured
cursor measurement.
If the cursor is on but not in focus, pressing the
key sets the focus to the first cursor line.
[MATH] switches the math waveform on or off. Opens or closes the "Math"
Requires logic analyzer option R&S RTH-B1
(MSO).
The effect depends on the state of digital channels:
If the all digital channels are off, the key
switches them on and sets the focus.
If the digital channels are on but not in focus,
the key sets the focus.
If the focus is on digital channels, the key
switches them off.
Opens or closes the "Meas"
dialog to configure the measurements.
Opens or closes the "Zoom"
dialog to configure the zoom
scale and position.
Opens or closes the "Cursor"
dialog to configure the measurement.
dialog to configure the math
waveform.
Opens or closes the "Logic"
dialog to configure digital channels.
Activates or deactivates the serial bus.
Requires at least one serial triggering and
decoding option. Available options are listed in
the data sheet.
[SHIFT] opens a dialog to save and load instrument settings.
If a dialog or menu is open, [BACK] closes it. If the menu is closed, the key toggles the focus between focused element in the diagram and the Menu button.
Opens or closes the "Bus" dialog to configure serial protocols.
Press and hold for 2 seconds
to disable or enable the touchscreen.
30User Manual 1326.1578.02 ─ 15
Page 31

R&S®Scope Rider RTH
Key Press shortly Press and hold
Getting Started
Operating Basics
Open or close the "Mode", "File" or "Setup" dialog, respectively.
Saves measurement documentation:
Only screenshot if "one touch" is off. ZIP file
with selected data if "one touch" is on.
All R&S RTH:
Only R&S RTH1004:
Only R&S RTH1002: [DMM] starts or stops the meter measurements
The effect depends on the channel state:
If the channel is off, the key switches on the
channel and sets the focus. The key lights up.
If the channel is on but not in focus, the key
sets the focus. The key lights up.
(same as [MODE] = "Meter").
[DMM REL] enables or disables relative meter
measurements.
[TIME] and [POS] adjust the horizontal time scale and position of the trigger
point.
Opens or closes the "Screenshot" dialog to configure the
screenshot and the "one touch"
output.
Open or close the "Vertical"
dialog for the corresponding
channel to configure the channel settings.
Opens or closes the "Meter"
dialog to configure the measurements.
[RANGE] and [POS] set the vertical scale (vertical sensitivity) and the vertical
position of the focused waveform (analog or channel, math or reference waveform).
[SIGNAL OFF] switches off the focused waveform.
[RUN STOP] starts and stops the acquisition.
[SETUP] opens or closes the "Trigger" dialog to select the trigger type and adjust
the trigger settings.
31User Manual 1326.1578.02 ─ 15
Page 32

R&S®Scope Rider RTH
Key Press shortly Press and hold
Getting Started
Operating Basics
[LEVEL] activates the trigger level to be set using the wheel. If the trigger type
has two trigger levels, pressing the key toggles the upper and lower levels.
[ACQUIRE] opens or closes the "Acquire" dialog to adjust the acquisition mode.
[Power] key: switches the power on or off
2.4.2 Selecting the Mode
A mode comprises all settings and functions that are needed to perform a measurement task. Selecting the mode is the first setup step.
1. Press the [MODE] key.
2. Select the mode:
● On the touchscreen: Tap the required mode icon.
● Using controls: Turn the wheel until the required mode is marked, and press
the wheel button to select the mode.
32User Manual 1326.1578.02 ─ 15
Page 33

R&S®Scope Rider RTH
Remote command:
OP[:MODE] on page 302
2.4.3 Displaying an Unknown Signal
The R&S RTH can display unknown, complex signals automatically. The [AUTOSET]
function analyzes the enabled channel signals, and adjusts the horizontal, vertical, and
trigger settings to display stable waveforms.
1. Press the [PRESET] key.
[PRESET] sets the instrument to a default factory state. The previous user-defined
configuration is removed and all channels except for channel 1 are disabled.
2. Press the [AUTOSET] key.
Getting Started
Operating Basics
The waveform is displayed.
2.4.4 Getting Information and Help
In most dialogs, graphics explain the meaning of the selected setting. For further information, you can open the help, which provides functional description of the settings
with links to the corresponding remote commands, and background information.
Note: When the help window is open, you can use only the [SHIFT] and [BACK] keys.
Other keys may not work as expected. Close the help window before you use the keys.
2.4.4.1 Displaying Help
●
"To open the help window" on page 33
●
"To show information on a setting" on page 34
●
"To close the help window" on page 35
To open the help window
► Tap the "Help" icon on the top of the menu.
33User Manual 1326.1578.02 ─ 15
Page 34

R&S®Scope Rider RTH
If a dialog is open, the dialog's help topic is shown beside the dialog.
If a menu is open, the table of contents is shown.
To show information on a setting
If a dialog and the help window are open, you can easily call the information on each
setting of the dialog.
► Tap the setting's name.
The corresponding help topic is displayed.
Getting Started
Operating Basics
If you tap the switch or the entry field, you can adjust the setting without closing the
help window.
34User Manual 1326.1578.02 ─ 15
Page 35

R&S®Scope Rider RTH
To close the help window
Getting Started
Operating Basics
► Tap the "Close" icon in the upper right corner of the help window, or press [BACK].
2.4.4.2 Using the Help Window
The help window has several tabs:
●
"View": shows the selected help topic.
●
"Contents": contains a table of help contents.
●
"Index": contains index entries to search for help topics.
●
"Search": provides text search.
The help toolbar provides the following buttons:
●
Up and down arrows: browse the topics in the order of the table of contents. Up =
previous topic, down = next topic.
●
Left and right arrows: browse the topics visited before: Left = back, right = forward.
●
Magnifiers: increase or decrease the font.
●
×: closes the help window.
To search for a topic in the index
The index is sorted alphabetically. You can browse the list, or search for entries.
1. Tap the "Index" tab.
2. Tap the entry field on top of the list.
35User Manual 1326.1578.02 ─ 15
Page 36

R&S®Scope Rider RTH
3. Enter some characters of the keyword you are interested in.
You can use the Backspace key to delete single characters, and "Clear" to delete
all characters in the "Keyword" field.
4. Tap the Enter key.
Now only index entries are displayed that contain the keyword characters.
5. To delete the keyword:
a) Tap the entry field again.
b) Tap "Clear".
c) Tap the Enter key.
To search the help for a text string
1. Tap the "Search" tab.
2. Tap the entry field on the top.
3. Enter the words you want to find.
If you enter several words with blanks between, topics containing all words are
found.
To find a string of several words, enclose it in quotation marks. For example, a
search for "trigger mode" finds all topics with exactly "trigger mode". A search for
trigger mode finds all topics that contain the words trigger and mode.
Getting Started
Maintenance
4. Tap the Enter key.
A list of search results is displayed.
5. To refine the search, use "Match Whole Word" and "Match Case", and tap "Start
Search".
2.5 Maintenance
The instrument does not need periodic maintenance. Only cleaning the instrument is
essential.
The addresses of the Rohde & Schwarz support centers can be found at
www.customersupport.rohde-schwarz.com.
A list of service centers is available on www.services.rohde-schwarz.com.
2.5.1 Cleaning
1. Remove all probes, leads, USB and LAN cables and power supply.
2. Clean the outside of the instrument using a soft, dry, lint-free dust cloth.
36User Manual 1326.1578.02 ─ 15
Page 37

R&S®Scope Rider RTH
Note: Do not use any liquids for cleaning. Cleaning agents, solvents (thinners, ace-
tone), acids and bases can damage the front panel labeling, plastic parts and display.
3. Clean the touchscreen as follows:
a) Apply a small amount of standard screen cleaner to a soft cloth.
b) Wipe the screen gently with the moist, but not wet, cloth.
c) If necessary, remove any excess moisture with a dry, soft cloth.
2.5.2 Contacting Customer Support
Technical support – where and when you need it
For quick, expert help with any Rohde & Schwarz product, contact our customer support center. A team of highly qualified engineers provides support and works with you
to find a solution to your query on any aspect of the operation, programming or applications of Rohde & Schwarz products.
Getting Started
Maintenance
Contact information
Contact our customer support center at www.rohde-schwarz.com/support, or follow this
QR code:
Figure 2-12: QR code to the Rohde
&
Schwarz support page
2.5.3 Information for Technical Support
If you encounter problems that you cannot solve yourself, contact your
Rohde & Schwarz support center, see Chapter 2.5.2, "Contacting Customer Support",
on page 37. Our support center staff is optimally trained to assist you in solving problems.
The support center finds solutions more quickly and efficiently if you provide them with
information on the instrument and an error description. To create, collect and save the
required information, you can create a service report. It contains the bug report, all relevant setup information, reporting and log files, and the instrument configuration
(device footprint).
1.
Press , or open the "Setup" menu.
37User Manual 1326.1578.02 ─ 15
Page 38

R&S®Scope Rider RTH
2. Scroll down.
3. Tap "Maintenance".
4. Select "Service".
5. Tap "Service Report".
The instrument creates the .report file and saves it to the USB flash device (if
connected), or to the microSD card.
6. Attach the report file to an email in which you describe the problem. Send the email
to the customer support address for your region as listed in the internet.
2.5.4 Data Storage and Security
The instrument is delivered with the 4 Gbyte microSD card inserted and ready to use.
We recommend that you do not remove the microSD card.
All instrument configuration data and user data are stored on the microSD card. In
addition, fallback firmware is stored on the microSD card to boot the instrument if an
update failed.
Getting Started
Maintenance
If you use the instrument in a secured environment, you can remove the microSD card
before the instrument leaves this area. The microSD card slot is under the right lid
under the battery pack.
You can also change the microSD card if you need more memory. The instrument supports microSD cards up to 32 Gbyte.
2.5.5 Storing and Packing
The storage temperature range of the instrument is given in the data sheet. If the
instrument is to be stored for a longer period of time, it must be protected against dust.
Repack the instrument as it was originally packed when transporting or shipping. The
two protective foam plastic parts prevent the control elements and connectors from
being damaged. The antistatic packing foil avoids any undesired electrostatic charging
to occur.
If you do not use the original packaging, use a sturdy cardboard box of suitable size
and provide for sufficient padding to prevent the instrument from slipping inside the
package. Wrap antistatic packing foil around the instrument to protect it from electrostatic charging.
38User Manual 1326.1578.02 ─ 15
Page 39

R&S®Scope Rider RTH
3 Waveform Setup
3.1 Connecting Probes
Shock hazard caused by high voltages
Make sure to set the attenuation factor on the instrument according to the probe being
used. Otherwise, the measurement results do not reflect the actual voltage level, and
you might misjudge the actual risk.
1. Connect the probe(s) to the channel input(s) at the top of the instrument.
2. To get the most accurate waveform display and best measurement results, remove
all redundant connectors: power adapter, USB flash drive, DMM test leads and
unused channels.
Waveform Setup
Connecting Probes
3. Press and hold the [CH] key of the used input.
4. Select "Probe Setting".
5. Select the attenuation factor of the probe:
● To set a common attenuation factor, select it on the list.
● To set a user-defined attenuation factor:
– Select "User".
– Set the "Probe Factor".
The probe's attenuation factor is indicated on the probe.
No attenuation with AC coupling:
If AC coupling is set, the attenuation of passive probes has no effect, and voltage is
applied to the instrument with factor 1:1. Observe the voltage limits, otherwise you
can damage the instrument.
Current measurements:
If you measure current using a shunt resistor as a current sensor, you have to multiply the V/A-value of the resistor by the attenuation of the probe. For example, if a
1 Ω resistor and a 10:1 probe is used, the V/A-value of the resistor is 1 V/A, the
attenuation factor of the probe is 0.1, and the resulting current probe attenuation is
100 mV/A.
39User Manual 1326.1578.02 ─ 15
Page 40

R&S®Scope Rider RTH
Waveform Setup
Vertical Setup
6. Switch off the test circuit.
7. Connect the probe to the DUT.
8. Switch on the test circuit.
3.2 Vertical Setup
The controls and parameters of the vertical system adjust the scale and position of the
waveform vertically.
1. To set vertical scale and position, use the [RANGE] and [POS] keys.
2. To adjust other vertical settings, select "Vertical" in the main menu.
Vertical scale and vertical position affect the resolution of the waveform amplitude
directly. To get the full resolution, make sure that the waveforms cover most of the
screen's height.
40User Manual 1326.1578.02 ─ 15
Page 41

R&S®Scope Rider RTH
3.2.1 Vertical Settings
As long as the "Vertical" menu is open, the probe settings of active channels are
shown on top of the display.
Waveform Setup
Vertical Setup
Channel Index
Selects the channel to be configured. All settings in the channel menu belong to the
selected channel.
You can also shortly press the channel key to select a channel. If you press and hold
the channel key, the corresponding channel menu opens.
Channel <n>
Switches the selected channel on or off.
Remote command:
CHANnel<m>:STATe on page 303
Coupling
Selects the connection of the input signal. The current coupling of each channel is
shown in the channel label at the display bottom.
41User Manual 1326.1578.02 ─ 15
Page 42

R&S®Scope Rider RTH
Remote command:
CHANnel<m>:COUPling on page 306
Probe Setting
Selects the attenuation factor of the connected probe. The vertical scaling is adjusted
accordingly, and measured values are multiplied by this factor so that the displayed
values are equal to the actual signal values.
Make sure to set the attenuation factor on the instrument according to the probe being
used. Otherwise, the measurement results do not reflect the actual voltage level, and
you might misjudge the actual risk.
If AC coupling is set, the attenuation of passive probes has no effect, and voltage is
applied to the instrument with factor 1:1. Observe the voltage limits, otherwise you can
damage the instrument.
The menu lists the common attenuation factors. If the required factor is not in the list,
select "User" and set the Probe Factor.
Remote command:
CHANnel<m>:PROBe on page 304
Waveform Setup
Vertical Setup
AC coupling. A high-pass filter removes the DC offset voltage from
the input signal if the DC component of a signal is of no interest. The
waveform is centered on zero volts.
If AC coupling is set, the attenuation of passive probes has no effect,
and voltage is applied to the instrument with factor 1:1. Observe the
voltage limits, otherwise you can damage the instrument.
DC coupling, the signal passes the input unchanged.
Probe Factor
Sets a user-defined attenuation factor if the probe has an uncommon attenuation, and
the unit (V or A). The setting is available if "Probe Setting" is set to "User".
Remote command:
PROBe<m>:SETup:ATTenuation:MANual on page 305
PROBe<m>:SETup:ATTenuation:UNIT on page 305
Bandwidth
Selects the bandwidth limit. The full instrument bandwidth indicates the range of frequencies that the instrument can acquire and display accurately with less than 3 dB
attenuation.
For analog applications, the highest signal frequency determines the required oscilloscope bandwidth. The oscilloscope bandwidth should be at least 3 times higher than
the maximum frequency included in the analog test signal to measure the amplitude
with high accuracy.
Most test signals are more complex than a simple sine wave and include several spectral components. A digital signal, for example, is built up of several odd harmonics. For
digital signals, the oscilloscope bandwidth should be at least 5 times higher than the
clock frequency to be measured.
42User Manual 1326.1578.02 ─ 15
Page 43

R&S®Scope Rider RTH
The oscilloscope is not an autonomous system. You need a probe to measure the signal, and the probe has a limited bandwidth, too. The combination of oscilloscope and
probe creates a system bandwidth. To reduce the effect of the probe on the system
bandwidth, the probe bandwidth should exceed the bandwidth of the oscilloscope, the
recommended factor is 1.5 x oscilloscope bandwidth.
See also: Chapter 3.2.2, "Effect of the Bandwidth Filter", on page 45.
For FFT analysis, the channel bandwidth also determines the frequency range displayed in the spectrum (see "Frequency range" on page 110).
"Full"
"x MHz, x kHz"
Remote command:
CHANnel<m>:BANDwidth on page 307
Waveform Setup
Vertical Setup
At full bandwidth, all frequencies in the specified range are acquired
and displayed. Full bandwidth is used for most applications.
Frequency limit. Frequencies above the selected limit are removed to
reduce noise at different levels. Limited bandwidth is indicated in the
channel label.
Invert
Turns the inversion of the signal amplitude on or off. To invert means to reflect the voltage values of all signal components against the horizontal display center. Inversion is
indicated in the waveform labels by line above the channel name.
Inversion affects only the display of the signal but not the trigger. For example: if the
oscilloscope triggers on the rising edge, the trigger is not changed by inversion, but the
actually rising edge is displayed as falling edge.
Autoset does not reset inversion. In spectrum mode, the function also inverts the input
channel signal, not the spectrum.
Remote command:
CHANnel<m>:POLarity on page 307
Offset
Sets an offset voltage that is subtracted to correct a signal with DC component. The
vertical center of the selected channel is shifted by the offset value, and the signal is
repositioned within the diagram area. Negative offset values move up the waveform,
positive values move it down.
Remote command:
CHANnel<m>:OFFSet on page 306
Deskew
Sets a delay for the selected channel.
Deskew compensates delay differences between channels caused by the different
length of cables, probes, and other sources. Correct deskew values are important for
accurate triggering. The propagation delay can lead to a non-synchronous waveform
display. For example, a signal on a coax cable with of 1 meter meter has a propagation
delay of typically 5.3 ns.
43User Manual 1326.1578.02 ─ 15
Page 44

R&S®Scope Rider RTH
Remote command:
CHANnel<m>:DESKew on page 307
Technology, Value
Sets the threshold, which is used to obtain the signal state. If the signal value is higher
than the threshold, the signal state is high (1 or true for the Boolean logic). Otherwise,
if the signal value is below the threshold, the signal state is considered low (0 or false).
The threshold is used by the pattern and state trigger.
If a protocol option is installed, and the channel is used in the bus, the configured
channel threshold is also used in the bus configuration. The values are the same in
"Vertical" menu and bus configuration dialogs.
"Technology"
"Value"
Remote command:
CHANnel<m>:THReshold:TECHnology on page 308
CHANnel<m>:THReshold:USER on page 308
CHANnel<m>:THReshold:THReshold? on page 308
CHANnel<m>:THReshold:FINDlevel on page 309
Waveform Setup
Vertical Setup
Select a predefined value for one of the most common technologies,
or select "User" to define an individual threshold.
Set an individual threshold value if "Technology" is set to "User".
[RANGE] keys
The vertical [RANGE] keys set the vertical scale (vertical sensitivity) of the selected
waveform.
In FFT mode, the [RANGE] keys set the scale for the amplitude range (y-axis) in the
spectrum display.
In "Counter" mode, the [RANGE] keys set the measurement range.
Remote command:
CHANnel<m>:SCALe on page 304
CHANnel<m>:RANGe on page 304
FFT mode:
SPECtrum:FREQuency:MAGNitude:SCALe on page 357
Spectrum mode:
SPECtrum:FREQuency:SCALe on page 362
Counter mode:
COUNter<m>:SENSe:RANGe on page 415
[POS] keys
Move the selected signal up or down in the diagram. The position is a graphical setting
given in divisions, while the offset sets a voltage.
You can also drag the channel marker on the screen.
Remote command:
CHANnel<m>:POSition on page 306
Spectrum mode:
SPECtrum:FREQuency:POSition on page 362
44User Manual 1326.1578.02 ─ 15
Page 45

R&S®Scope Rider RTH
3.2.2 Effect of the Bandwidth Filter
Low-pass filters reduce the speed of the signal inside the instrument and cause a delay
of the signal on the screen. The delay time depends on the selected filter.
The following table lists the approximate delay of the signal that is caused by various
filters.
Table 3-1: Approximate signal delay dependent on the bandwidth filter
Waveform Setup
Horizontal Setup
Filter Approx. delay
200 MHz 30.2 ns
100 MHz 30.7 ns
50 MHz 138.5 ns
20 MHz 145 ns
10 MHz 166.5 ns
5 MHz 193 ns
2 MHz 270.5 ns
1 MHz 4.71 μs
3.3 Horizontal Setup
Horizontal settings, also known as timebase settings, adjust the display in horizontal
direction.
1. To set the timebase and horizontal position, use the [TIME] and [POS] keys.
Filter Approx. delay
500 kHz 9.07 μs
200 kHz 22.13 μs
100 kHz 43.87 μs
50 kHz 87.47 μs
20 kHz 218 μs
10 kHz 434.7 μs
5 kHz 869.3 μs
2 kHz 2.173 ms
1 kHz 4.347 ms
2. To adjust all horizontal settings, select "Horizontal" in the main menu.
The determining point of an acquisition is the trigger point. Two parameters define the
position of the trigger point: reference point and horizontal position (also known as trigger offset or delay). Using these parameters, you choose the part of the waveform you
want to see: around the trigger, before, or after the trigger.
45User Manual 1326.1578.02 ─ 15
Page 46

R&S®Scope Rider RTH
Horiz. position from
left ref. point (< 0)
t = 0
T
Horiz. position from right ref. point (> 0)
Horiz. position from
middle ref. point (> 0)
Waveform Setup
Horizontal Setup
Reference point
= Left
Reference point
= Middle
Reference point
= Right
Signal delay
If you have set a bandwidth limit, the signal might appear delayed on the screen. The
delay time depends on the selected filter. The effect is visible if several signals with different limits are displayed.
See also: Chapter 3.2.2, "Effect of the Bandwidth Filter", on page 45.
Description of settings
Time Scale
Sets the time scale (timebase) of the horizontal axis for all signals, in seconds per division. The value is shown in the top information bar.
Increase the scale to see a longer part of the waveform. Decrease the scale to see the
signal in more detail. The scale has a point that remains fixed on the screen when the
scale value is changing - the reference point.
To set the time scale, you can also use the [TIME] keys.
Note: In FFT mode, the time scale may be restricted depending on the selected frequency span, (see "Frequency Span" on page 113).
Remote command:
TIMebase:SCALe on page 309
TIMebase:RANGe on page 309
Horizontal Position
Sets the horizontal position of the trigger point in relation to the reference point. The
trigger position is marked by a colored triangle at the top of the diagram.
46User Manual 1326.1578.02 ─ 15
Page 47

R&S®Scope Rider RTH
You can set the trigger point even outside the diagram and analyze the signal some
time before or after the trigger. In this case, the trigger marker is shown on the left or
right side of the diagram.
To set the horizontal position, you can also use the [POS] keys.
Remote command:
TIMebase:HORizontal:POSition on page 309
Reference Point
Defines the time reference point in the diagram. You can set the reference point in the
middle, or to the right to see the signal before the trigger. If the reference point is on
the left, you see the signal after the trigger.
Remote command:
TIMebase:REFerence on page 310
3.4 Acquisition Control
Waveform Setup
Acquisition Control
Acquisition settings define the processing of the captured samples in the instrument.
► To adjust the acquisition settings, press the [ACQUIRE] key, or select "Acquire" in
the main menu.
► To start or stop acquisition, press the [RUN STOP] key.
The R&S RTH captures the input signal and converts it to digital samples. The digital
samples are processed according to the acquisition settings. The result is a waveform
record that is displayed on the screen and stored in memory.
47User Manual 1326.1578.02 ─ 15
Page 48

R&S®Scope Rider RTH
Description of settings
Waveform Setup
Acquisition Control
Figure 3-1: Acquire menu of R&S RTH1002 (without mixed signal option R&S RTH-B1)
Acquisition Mode
Defines how the waveform is built from the captured samples. There are two general
methods to build the waveform record: sample decimation and waveform arithmetic.
Sample decimation reduces the data stream of the ADC to a stream of waveform
points with lower sample rate and a less precise time resolution. The R&S RTH uses
decimation, if the waveform "Sampling Rate C1 - C4" is less than the ADC sample
rate. The acquisition modes "Sample", "Peak Detect" and "High Resolution" are decimation methods.
Waveform arithmetic builds the resulting waveform from several consecutive acquisitions of the signal. The acquisition modes "Average" and "Envelope" are arithmetic
methods.
"Sample"
One of n samples in a sample interval is recorded as waveform point,
the other samples are discarded. Usually, most signals are displayed
optimally with this acquisition mode but very short glitches might
remain undiscovered by this method.
"Peak Detect"
The minimum and the maximum of n samples are recorded as waveform points, the other samples are discarded. Thus the instrument
can detect fast signal peaks at slow time scale settings that would be
missed with other acquisition modes.
"High Resolution"
The average of n captured sample points is recorded as one waveform point. Averaging reduces the noise, the result is a more precise
waveform with higher vertical resolution.
48User Manual 1326.1578.02 ─ 15
Page 49

R&S®Scope Rider RTH
Waveform Setup
Acquisition Control
"Average"
"Envelope"
Remote command:
ACQuire:MODE on page 311
Number of Averages
Sets the number of waveforms used to calculate the average waveform.
Remote command:
ACQuire:AVERage:COUNt on page 311
Reset Waveform
Restarts the envelope and average calculation.
Remote command:
ACQuire:ARESet:IMMediate on page 311
The average is calculated from the data of the current acquisition and
several acquisitions before. The method reduces random noise. It
requires a stable, triggered and periodic signal. The number of
acquisitions for average calculation is defined with Number of Aver-
ages.
The minimum and maximum values in a sample interval over several
acquisitions are saved. The most extreme values of all acquisitions
build the envelope. The resulting diagram shows two envelope waveforms: the minimums (floor) and maximums (roof) representing the
borders in which the signal occurs.
Sampling Rate C1 - C4
Shows the number of recorded analog waveform points per second. The sample rate is
the reciprocal value of the resolution.
Sampling Rate D7 - D0
Shows the number of recorded digital waveform points per second. Only available if
the mixed signal option R&S RTH-B1 is installed, and logic channels are active.
Preselected Record Len.
Sets the record length.
"Max"
"Middle"
"Min"
Remote command:
ACQuire:POINts:PRESelect on page 311
Act. Record Len. C1 - C4
Shows the actual record length of analog channels. The actual value can be lower than
the value set with "Preselected Record Len." on page 49, depending on various conditions:
●
Number of active channels
●
"Acquisition Mode" is "Peak Detect" or "High Resolution"
●
If the history option R&S RTH-K15 is installed: "Number of Segments". A high
"Number of Segments" can restrict the record length.
Sets the maximum record length.
Limits the record length to 12.5 ksample.
Limits the record length to 1.25 ksample.
49User Manual 1326.1578.02 ─ 15
Page 50

R&S®Scope Rider RTH
●
In roll mode, if analog and digital channels are active: the minimum record length of
analog channels or digital channels is used.
●
At slow timebases: see Waveform Update.
If the "Time Scale" is set to 100 s/div or higher, the actual record length can be higher
than the value set with "Preselected Record Len." on page 49.
Act. Record Len. D7 - D0
Shows the actual record length of digital channels. Only available if the mixed signal
option R&S RTH-B1 is installed, and logic channels are active.
Waveform Update
The setting is relevant if the time scale is ≥50 ms/div. At these slow timebases, you can
select how the acquired samples are displayed.
"Intermediate"
"After full
acquisition"
Waveform Setup
Roll Mode
The acquired samples are displayed before the acquisition is completed. In this mode, the record length is limited to 125 ksample.
The acquired samples are displayed when the complete acquisition
has been recorded. Depending on the selected time scale, it takes
some time until the waveform is visible. This mode does not limit the
record length and is always used for time scales <50 ms/div.
Remote command:
ACQuire:WAVeformupd on page 312
Acquisitions per Second
Shows the number of acquired waveforms per second.
[RUN STOP] key
Starts and stops the acquisition.
Remote command:
RUN on page 310
STOP on page 310
3.5 Roll Mode
The roll mode moves the captured input data on the display from the right to the left.
The instrument shows the waveform immediately, without waiting for the complete
acquisition of the waveform record. The roll mode displays the untriggered signal. Use
the roll mode for slow, non-repetitive signals.
In roll mode, the following acquisition modes are available: sample, high resolution,
and peak detect.
To activate the roll mode:
1. Press the [MODE] key.
2. Select "Roll".
50User Manual 1326.1578.02 ─ 15
Page 51

R&S®Scope Rider RTH
To analyze the signal in roll mode, you can use:
●
Zoom
●
Automatic measurements
●
Cursor measurements
●
Mathematics
You can also save the waveform data. Saving stops the acquisition. Acquisition is
resumed when the data is written.
3.6 Trigger
Triggering means to capture the interesting part of the relevant waveforms. Choosing
the right trigger type and configuring all trigger settings correctly allows you to detect
various incidents in signals.
A trigger occurs if the trigger conditions are fulfilled. The instrument acquires continuously and keeps the sample points to fill the pretrigger part of the waveform record.
When the trigger occurs, the instrument continues acquisition until the posttrigger part
of the waveform record is filled. Then it stops acquiring and displays the waveform.
When a trigger is recognized, the instrument does not accept another trigger until the
acquisition is complete.
Waveform Setup
Trigger
Trigger conditions include:
●
Source of the trigger signal (channel)
●
Trigger type and its setup, including one or more trigger levels
●
Trigger mode
In addition, the horizontal position of the trigger point and the reference point are
important to display the interesting part of the signal. See Chapter 3.3, "Horizontal
Setup", on page 45.
The trigger level and position are marked in the grid. The markers have the color of the
trigger source. Information on the most important trigger settings is shown in the upper
information bar.
Figure 3-2: Trigger information: width trigger on channel 2, single trigger mode
► To adjust all trigger settings, press the [SETUP] key.
► To adjust the trigger level, do one of the following:
● Drag the trigger level marker on the right side of the display to the required
position.
● Press the [LEVEL] key and turn the wheel.
If the trigger type has two trigger levels, press the [LEVEL] key again to toggle
the upper and lower levels. Alternatively, press the wheel.
● Press the [SETUP] key. Select "Trigger Level", and enter the level value.
51User Manual 1326.1578.02 ─ 15
Page 52

R&S®Scope Rider RTH
► To start and stop acquisition, press the [RUN STOP] key.
3.6.1 General Trigger Settings
General trigger settings are the settings that are independent of the trigger type. The
settings specific for a trigger type are described in the following sections.
Description of settings
Waveform Setup
Trigger
Trigger Mode
The trigger mode determines the behavior of the instrument if no trigger occurs, and
also the number of acquired waveforms when a trigger occurs.
"Auto"
"Normal"
"Single"
Remote command:
TRIGger:MODE on page 314
Trigger Type
Selects the trigger type, the event type that defines the trigger point.
●
Chapter 3.6.2, "Edge Trigger", on page 54
●
Chapter 3.6.3, "Glitch Trigger", on page 55
●
Chapter 3.6.4, "Width Trigger", on page 56
The instrument triggers repeatedly after a time interval if the trigger
conditions are not fulfilled. If a real trigger occurs, it takes precedence. This mode helps to see the waveform even before the trigger
is set. Successive waveforms are not triggered at the same point of
the waveform.
The instrument acquires waveforms continuously, each time when a
trigger occurs. If no trigger occurs, no waveform is acquired and the
last acquired waveform is displayed. If no waveform was captured
before, nothing is displayed.
When a trigger occurs, the instrument acquires one waveform and
stops the acquisition.
52User Manual 1326.1578.02 ─ 15
Page 53

R&S®Scope Rider RTH
●
Chapter 3.6.5, "Video/TV Trigger", on page 58
R&S RTH-K19 trigger options
●
Chapter 3.6.7, "Pattern Trigger (R&S RTH-K19)", on page 63
●
Chapter 3.6.8, "State Trigger (R&S RTH-K19)", on page 65
●
Chapter 3.6.9, "Runt Trigger (R&S RTH-K19)", on page 66
●
Chapter 3.6.10, "Slew Rate Trigger (R&S RTH-K19)", on page 68
●
Chapter 3.6.11, "Data2Clock Trigger (R&S RTH-K19)", on page 69
●
Chapter 3.6.12, "Serial Pattern Trigger (R&S RTH-K19)", on page 71
●
Chapter 3.6.13, "Timeout Trigger (R&S RTH-K19)", on page 74
●
Chapter 3.6.14, "Interval Trigger (R&S RTH-K19)", on page 75
●
Chapter 3.6.15, "Window Trigger (R&S RTH-K19)", on page 76
Options containing special triggers
●
Chapter 3.6.16, "Protocol Trigger (R&S RTH-K1, -K2, -K3, -K9 and -K10)",
on page 77
Remote command:
TRIGger:TYPE on page 314
Source
Selects the trigger source, the channel on which the trigger condition is checked. All
possible channels are listed. You can trigger on any channel to which a signal is connected, even if the channel is not active.
For most trigger types, analog and digital channels can be used as trigger source. Digital channels require option R&S RTH-B1. For video, runt and slew rate trigger, only
analog channels are available.
Remote command:
TRIGger:SOURce on page 314
Waveform Setup
Trigger
Trigger Level
Sets the trigger voltage level.
For the Video/TV trigger, the trigger level is the threshold of the sync pulse. Make sure
that the trigger level crosses the synchronizing pulses of the video signal.
Remote command:
TRIGger:LEVel<m>:VALue on page 315
Holdoff Mode
Selects the method to define the holdoff.
The trigger holdoff defines when the next trigger after the current will be recognized.
Thus, it affects the next trigger to occur after the current one. Holdoff helps to obtain
stable triggering when the oscilloscope is triggering on undesired events.
53User Manual 1326.1578.02 ─ 15
Page 54

R&S®Scope Rider RTH
Waveform Setup
Trigger
"Off"
"Time"
"Events"
"Random"
Remote command:
TRIGger:HOLDoff:MODE on page 315
Time ← Holdoff Mode
Sets the time that has to pass at least until the next trigger occurs.
Remote command:
TRIGger:HOLDoff:TIME on page 315
Events ← Holdoff Mode
Sets the number of triggers to be skipped until the next trigger occurs.
Remote command:
TRIGger:HOLDoff:EVENts on page 316
No holdoff
Defines the holdoff as a time period. The next trigger occurs only after
the "Time" on page 54 has passed.
Defines the holdoff as a number of trigger events. The next trigger
only occurs when this number of events is reached. The number of
triggers to be skipped is defined in "Events" on page 54.
Defines the holdoff as a random time limited by "Min Time / Max
Time" on page 54. For each acquisition, the instrument selects a
new random holdoff time from the specified range.
Random holdoff prevents synchronization to discover effects invisible
with synchronized triggering, e.g. the features of a pulse train.
Min Time / Max Time ← Holdoff Mode
Set the time limits for random holdoff time. For each acquisition, the instrument selects
a new random holdoff time from the specified range.
Remote command:
TRIGger:HOLDoff:MIN on page 316
TRIGger:HOLDoff:MAX on page 316
Noise Reject
Enables a hysteresis to avoid unwanted trigger events caused by noise oscillation
around the trigger level.
Remote command:
TRIGger:MNR on page 316
3.6.2 Edge Trigger
The edge trigger is the most common trigger type. The trigger occurs when the signal
from the trigger source passes the trigger level in the specified direction (slope).
54User Manual 1326.1578.02 ─ 15
Page 55

R&S®Scope Rider RTH
Description of settings
Figure 3-3: Edge trigger
Slope
Sets the edge direction for the trigger. You can trigger on:
●
●
●
Remote command:
TRIGger:EDGE:SLOPe on page 316
Waveform Setup
Trigger
rising edge, that is a positive voltage change
falling edge, that is a negative voltage change
rising and falling edge
3.6.3 Glitch Trigger
The glitch trigger detects pulses shorter or longer than a specified time. It identifies
deviation from the nominal data rate and helps to analyze causes of even rare glitches
and their effects on other signals.
55User Manual 1326.1578.02 ─ 15
Page 56

R&S®Scope Rider RTH
Description of settings
Polarity
Sets the pulse polarity, that is the direction of the first pulse slope. You can trigger on:
●
Positive going pulses. The width is defined from the rising to the falling edge.
●
Negative going pulses. The width is defined from the falling to the rising edge.
●
Both positive and negative going pulses
Remote command:
TRIGger:GLITch:POLarity on page 317
Waveform Setup
Trigger
Range
Selects the glitches to be identified: shorter or longer than the specified "Width"
on page 56.
Remote command:
TRIGger:GLITch:RANGe on page 317
Width
Sets the pulse width of the glitch.
Remote command:
TRIGger:GLITch:WIDTh on page 317
3.6.4 Width Trigger
The width trigger compares the measured pulse width (duration of a pulse) with a given
time limit. It detects pulses with an exact pulse width, pulses shorter or longer than a
given time, as well as pulses inside or outside the allowable time range. The pulse
width is measured at the trigger level.
Using the width trigger, you can define the pulse width more precisely than with the
glitch trigger. However, using the range settings "Shorter" and "Longer", you can also
trigger on glitches.
56User Manual 1326.1578.02 ─ 15
Page 57

R&S®Scope Rider RTH
Description of settings
Figure 3-4: Width trigger
Waveform Setup
Trigger
Polarity
Sets the pulse polarity, that is the direction of the first pulse slope. You can trigger on:
●
Positive going pulses. The width is defined from the rising to the falling edge.
●
Negative going pulses. The width is defined from the falling to the rising edge.
●
Both positive and negative going pulses
Remote command:
TRIGger:WIDTh:POLarity on page 318
Range
Defines how the measured pulse width is compared with the given limits.
Figure 3-5: Pulse width is shorter or longer than a given width (same as glitch trigger)
min
max
1 2
min
max
Figure 3-6: Pulse width is inside or outside a range
1 = Inside, pulse > min width AND pulse < max width
2 = Outside, pulse < min width OR pulse > max width
57User Manual 1326.1578.02 ─ 15
Page 58

R&S®Scope Rider RTH
Waveform Setup
Trigger
±Δ
±Δ
1 2
Figure 3-7: Pulse width is equal or unequal to a given width, with optional tolerance
1 = Equal, pulse > width - Δ AND pulse < width + Δ
2 = Unequal, pulse < width - Δ OR pulse > width + Δ
Remote command:
TRIGger:WIDTh:RANGe on page 318
Width
Sets the width for comparisons equal, unequal, shorter, and longer.
Remote command:
TRIGger:WIDTh:WIDTh on page 318
±Tolerance
Sets a range Δt to the specified Width if the comparison range is equal or unequal. To
trigger on an exact pulse width, set the tolerance to 0.
Remote command:
TRIGger:WIDTh:DELTa on page 318
Min Width / Max Width
Set the lower and upper time limits defining the time range if "Inside" or "Outside" is set
for comparison.
Remote command:
TRIGger:WIDTh:MIN on page 319
TRIGger:WIDTh:MAX on page 319
3.6.5 Video/TV Trigger
The TV or video trigger is used to analyze analog baseband video signals. You can
trigger on baseband video signals from standard definition and high definition standards, and also on user defined signals.
The instrument triggers on the line start - the horizontal sync pulse. You can trigger on
all lines, or specify a line number. You can also trigger on the field or frame start.
3.6.5.1 Standard TV Trigger Settings
Access: [SETUP] key > "Trigger Type" = "Video/TV"
58User Manual 1326.1578.02 ─ 15
Page 59

R&S®Scope Rider RTH
Standard
Selects the TV standard or "Custom" for user-defined signals.
The standards PAL, PAL-M, NTSC and SECAM are available in the instrument firmware. All other standards require the advance trigger option R&S RTH-K19.
Waveform Setup
Trigger
HDTV standards are indicated by the number of active lines, the scanning system (p
for progressive scanning, i for interlaced scanning) and the frame rate. For interlaced
scanning, the field rate is used instead of the frame rate. 1080p/24sF is an HDTV standard using progressive segmented frame scanning.
"Custom" can be used for signals of other video systems, for example, medical displays, video monitors, and security cameras. To trigger on these signals, you have to
define the pulse type and length of the sync pulse, the scanning system and the line
period.
Remote command:
TRIGger:TV:STANdard on page 320
Signal Polarity
Sets the polarity of the signal. Note that the sync pulse has the opposite polarity, for
example, a positive signal has a negative sync pulse.
Figure 3-8: Signal with positive polarity and tri-level sync pulse
Remote command:
TRIGger:TV:POLarity on page 320
Mode
Selects the lines or fields on which the instrument triggers. Available modes depend on
the scanning system of the selected standard.
59User Manual 1326.1578.02 ─ 15
Page 60

R&S®Scope Rider RTH
Waveform Setup
Trigger
"All fields"
Triggers on the first video line of the frame (progressive scanning) or
field (interlaced scanning), for example, to find amplitude differences
between the fields.
"Odd fields /
Even fields"
Triggers on the first video line of the odd or even field. These modes
are available for interlaced scanning (PAL, PAL-M, SECAM, NTSC,
1080i) and progressive segmented frame scanning (1080p/24sF).
They can be used, for example, to analyze the components of a video
signal.
"All lines"
Triggers on the line start of all video lines, for example, to find maximum video levels.
"Line number"
Triggers on a specified line. Enter the line number in "Line #".
Remote command:
TRIGger:TV:MODE on page 320
Line #
Sets the number of the line to be triggered on if "Mode" is set to "Line number". Usually
the lines of the frame are counted, beginning from the frame start.
For NTSC signals, the lines are counted per field, not per frame. Therefore, you have
to set the "Field" (odd or even), and the line number in the field.
Remote command:
TRIGger:TV:LINE on page 321
TRIGger:TV:LFIeld on page 321
Trigger Level
Sets the trigger level as threshold for the synchronizing pulse. Make sure that the trigger level crosses the synchronizing pulses of the video signal.
Figure 3-9: Trigger level with bi-level (left) and tri-level (right) sync pulses
Remote command:
TRIGger:LEVel<m>:VALue on page 315
3.6.5.2 Settings for Custom Video Signals (R&S RTH-K19)
In addition to the standard TV trigger settings, triggering on custom video signals
requires a few more settings that describe the signal.
► [SETUP] key > "Trigger Type" = "Video/TV" > "Standard" = "Custom"
60User Manual 1326.1578.02 ─ 15
Page 61

R&S®Scope Rider RTH
Line period
Pulse Type
Sets the type of the sync pulse, either bi-level sync pulse (used in SDTV signals), or trilevel sync pulse (used in HDTV signals).
Waveform Setup
Trigger
Figure 3-10: Bi-level (left) and tri-level (right) sync pulses
This setting is available for user-defined video signals if "Standard" is set to "Custom".
Remote command:
TRIGger:TV:CUSTom:STYPe on page 321
Line Period
Sets the duration of a single video line, the time between two successive sync pulses.
This setting is available for user-defined video signals if "Standard" is set to "Custom".
Remote command:
TRIGger:TV:CUSTom:LDURation on page 322
Pulse Width
Sets the width of the sync pulse.
61User Manual 1326.1578.02 ─ 15
Page 62

R&S®Scope Rider RTH
Pulse width
This setting is available for user-defined video signals if "Standard" is set to "Custom".
Remote command:
TRIGger:TV:CUSTom:SDURation on page 322
Scan
Sets the scanning system.
This setting is available for user-defined video signals if "Standard" is set to "Custom".
"Interlaced"
"Progressive"
"Segmented"
Remote command:
TRIGger:TV:CUSTom:SCANmode on page 322
Waveform Setup
Trigger
Interlace scanning uses two fields to create a frame. One field contains all the odd lines (odd, first, or upper filed), the other contains all
the even lines of the image (even, second, or lower field). First the
lines of the odd filed are processed, then the lines of the even field.
Progressive scanning is a method to capture, transmit and display all
lines of a frame in sequence.
Progressive segmented frame uses progressive scanning to capture
the frame, and interlaced scanning for transmission and display.
3.6.6 External Trigger (R&S RTH1002)
The R&S RTH1002 has an edge trigger to trigger on an external signal.
1. Connect the external trigger signal to the DMM input:
a) Ground to black COM input.
b) Signal to red input.
2. Press the [SETUP] key.
3. Select "Trigger Type" = "External"
Description of settings
62User Manual 1326.1578.02 ─ 15
Page 63

R&S®Scope Rider RTH
Slope
Sets the edge direction for the trigger. You can trigger on the rising edge, the falling
edge, or riding and falling edges of the external signal.
Remote command:
TRIGger:EXTernal:SLOPe on page 322
Trigger Level
Sets the trigger voltage level.
Remote command:
TRIGger:EXTernal:LEVel on page 322
3.6.7 Pattern Trigger (R&S RTH-K19)
The pattern trigger works like a logic trigger. It provides logical combinations of the
input channels and can be used for verifying the operation of digital logic. If the channel states match the desired pattern, the pattern trigger occurs. In addition to the pattern, you can define a timing condition. In this case, the trigger occurs if the pattern
definition is true for the defined time.
Waveform Setup
Trigger
The pattern trigger has no trigger level, only threshold values to obtain the logic state
of signals are required.
► [SETUP] key > "Trigger Type" = "Pattern"
Description of settings
Figure 3-11: Pattern trigger
Set Pattern
Defines the pattern: the states of the input channels and their logical combination. If
R&S RTH-B1 is installed, active digital channels are also included in the pattern definition.
63User Manual 1326.1578.02 ─ 15
Page 64

R&S®Scope Rider RTH
Figure 3-12: Pattern definition
Waveform Setup
Trigger
The current threshold is displayed for each channel. For analog channels, the threshold is set in the "Vertical" menu > "Technology". For logic channels, the threshold is set
in the "Logic" menu. To adjust the thresholds by the instrument, use "Find Level".
The switches define the state of each channel and set the logical combination:
"1"
"0"
"X"
"AND"
The signal value is above the defined threshold.
The signal value is below the defined threshold.
The signal state does not matter.
If all defined states are true, the logical result of the pattern definition
is 1 (true).
"OR"
If at least one of the defined states is true, the logical result of the pattern definition is 1 (true).
Remote command:
TRIGger:PATTern:STATe[:CHANnel<m>] on page 323
TRIGger:PATTern:STATe:COMBination on page 323
Range
Adds additional time limitation to the defined pattern.
"None"
No time limit is set. If the defined pattern is true, the pattern trigger
occurs.
"Timeout"
Defines a minimum time during which the signals match the pattern
definition.
"Longer"
If the pattern is true longer than the "Pattern Width" time, the trigger
occurs.
"Shorter"
If the pattern is true for a time shorter than "Pattern Width", the trigger
occurs.
"Equal"
If the pattern is true for the time "Pattern Width" ± Δt ("Tolerance"),
the trigger occurs.
64User Manual 1326.1578.02 ─ 15
Page 65

R&S®Scope Rider RTH
Waveform Setup
Trigger
"Unequal"
"Inside"
"Outside"
Remote command:
TRIGger:PATTern:WIDTh:RANGe on page 324
TRIGger:PATTern:TIMeout[:TIME] on page 324
TRIGger:PATTern:WIDTh[:WIDTh] on page 324
TRIGger:PATTern:WIDTh:DELTa on page 325
TRIGger:PATTern:WIDTh:MINWidth on page 325
TRIGger:PATTern:WIDTh:MAXWidth on page 325
If the pattern is true for a time shorter than "Pattern Width" - Δt OR
longer than "Pattern Width" + Δt, the trigger occurs.
If the pattern is true for a time between "Min Pattern Width" and "Max
Pattern Width", the trigger occurs.
If the pattern is true for a time shorter than "Min Pattern Width" OR
longer than "Max Pattern Width", the trigger occurs.
3.6.8 State Trigger (R&S RTH-K19)
The state trigger verifies if the channel states match the defined pattern at the clock
edge. The trigger occurs if the logical combination of the input channels is true at the
crossing point of the selected clock edge and the trigger level.
► [SETUP] key > "Trigger Type" = "State"
Description of settings
Figure 3-13: State trigger
Clock Source
Selects the input channel of the clock signal.
Remote command:
TRIGger:STATe:CSOurce[:VALue] on page 326
Clock Slope
Sets the edge of the clock at which the instrument checks the signal states: at the rising edge, the falling edge, or at both edges.
65User Manual 1326.1578.02 ─ 15
Page 66

R&S®Scope Rider RTH
Remote command:
TRIGger:STATe:CSOurce:EDGE on page 326
Set Pattern
Defines the pattern: the states of the input channels and their logical combination. If
R&S RTH-B1 is installed, active digital channels are also included in the pattern definition.
For details, see Chapter 3.6.7, "Pattern Trigger (R&S RTH-K19)", on page 63.
Remote command:
TRIGger:STATe:CHANnel<m> on page 326
TRIGger:STATe:COMBination on page 326
3.6.9 Runt Trigger (R&S RTH-K19)
A runt is a pulse lower than normal in amplitude. The amplitude crosses the first level
twice in succession without crossing the second one. In addition to the upper and lower
levels, you can define a time limit for the runt in the same way as for width triggers. For
example, the runt trigger can detect signal parts remaining below a specified threshold
amplitude because I/O ports are in undefined state.
Waveform Setup
Trigger
UL
L L
Figure 3-14: Runt trigger without time limits
► [SETUP] key > "Trigger Type" = "Runt"
Description of settings
66User Manual 1326.1578.02 ─ 15
Page 67

R&S®Scope Rider RTH
Upper Trigger Level / Lower Trigger Level
Set the upper and lower voltage thresholds for the runt trigger. The levels define the
minimum and maximum runt amplitudes.
You can also press the [Level] key to toggle the upper and lower levels, and turn the
wheel to adjust the focused level. If the focus is on a trigger level, pressing the wheel
also toggles the levels.
Remote command:
TRIGger:LEVel<m>:RUNT:UPPer on page 327
TRIGger:LEVel<m>:RUNT:LOWer on page 327
Polarity
Sets the pulse polarity, that is the direction of the first pulse slope. You can trigger on:
●
Positive going pulses. The width is defined from the rising to the falling edge.
●
Negative going pulses. The width is defined from the falling to the rising edge.
●
Both positive and negative going pulses
Remote command:
TRIGger:RUNT:POLarity on page 327
Waveform Setup
Trigger
Range
Defines an additional time limit of the runt pulse.
"Any runt" triggers on all runts fulfilling the level condition, without time limitation. The
other comparisons are the same as for the width trigger, see "Range" on page 57.
Remote command:
TRIGger:RUNT:RANGe on page 327
Runt Width
Sets the width for comparisons equal, unequal, shorter, and longer.
Remote command:
TRIGger:RUNT:WIDTh on page 328
±Tolerance
Sets a tolerance range Δt to the specified Runt Width if the comparison range is equal
or unequal.
Remote command:
TRIGger:RUNT:DELTa on page 328
Min Runt Width / Max Runt Width
Set the lower and upper time limits if "Inside" or "Outside" is set for comparison.
Remote command:
TRIGger:RUNT:MINWidth on page 328
TRIGger:RUNT:MAXWidth on page 328
67User Manual 1326.1578.02 ─ 15
Page 68

R&S®Scope Rider RTH
3.6.10 Slew Rate Trigger (R&S RTH-K19)
The slew rate trigger is also known as transition trigger. It triggers if the transition time
from the lower to higher voltage level (or vice versa) is shorter or longer as defined, or
outside or inside a specified time range.
The slew rate trigger finds slew rates faster than expected or permissible to avoid overshooting and other interfering effects. It also detects slow edges violating the timing in
pulse series.
Figure 3-15: Slew rate trigger, transition time inside a range (t > min time AND t < max time)
Waveform Setup
Trigger
UL
L L
min
max
► [SETUP] key > "Trigger Type" = "Slew rate"
As source, only analog channels are available.
Description of settings
Upper Trigger Level / Lower Trigger Level
Set the upper and lower voltage thresholds for the slew rate trigger. The time measurement starts when the signal crosses the first trigger level, and stops when the signal
crosses the second level. The first trigger level is the upper or lower level depending
on the selected slope.
68User Manual 1326.1578.02 ─ 15
Page 69

R&S®Scope Rider RTH
Remote command:
TRIGger:LEVel<m>:SLEW:UPPer on page 329
TRIGger:LEVel<m>:SLEW:LOWer on page 329
Slope
Sets the edge direction for the trigger. You can trigger on:
●
●
●
Remote command:
TRIGger:SLEW:SLOPe on page 329
Range
Defines the time limits of the slew rate. The comparisons are the same as for the width
trigger, see "Range" on page 57.
Remote command:
TRIGger:SLEW:RANGe on page 329
Waveform Setup
Trigger
rising edge, that is a positive voltage change
falling edge, that is a negative voltage change
rising and falling edge
Time
Sets the slew rate for comparisons equal, unequal, shorter, and longer.
Remote command:
TRIGger:SLEW:RATE on page 330
±Tolerance
Sets a tolerance range Δt to the specified Time if the comparison range is equal or
unequal.
Remote command:
TRIGger:SLEW:DELTa on page 330
Min Time / Max Time
Set the lower and upper time limits if "Inside" or "Outside" is set for comparison.
Remote command:
TRIGger:SLEW:MINWidth on page 330
TRIGger:SLEW:MAXWidth on page 330
3.6.11 Data2Clock Trigger (R&S RTH-K19)
With the Data2Clock trigger - also known as setup/hold trigger - you can analyze the
relative timing between two signals: a data signal and the synchronous clock signal.
Many systems require, that the data signal must be steady for some time before and
after the clock edge, for example, the data transmission on parallel interfaces.
The reference point for the time measurement is defined by clock level and clock edge.
► [SETUP] key > "Trigger Type" = "Data2Clk"
69User Manual 1326.1578.02 ─ 15
Page 70

R&S®Scope Rider RTH
Description of settings
Waveform Setup
Trigger
Figure 3-16: Data2Clock trigger
Clock Source
Selects the input channel of the clock signal.
Remote command:
TRIGger:DATatoclock:CSOurce[:VALue] on page 331
Clock Slope
Sets the edge of the clock signal: rising, falling, or both edges. The time reference
point for the setup and hold time is the crossing point of the clock edge and the trigger
level.
Remote command:
TRIGger:DATatoclock:CSOurce:EDGE on page 331
Data Source
Selects the input channel of the data signal.
Remote command:
TRIGger:DATatoclock:DSOurce[:VALue] on page 331
Trigger on Setup & Hold
Selects how a violation of the setup and hold time is handled.
"Violation"
"OK"
Triggers on a violation of the setup or hold time
Triggers if setup and hold time keep the limits.
Remote command:
TRIGger:DATatoclock:CONDition on page 331
70User Manual 1326.1578.02 ─ 15
Page 71

R&S®Scope Rider RTH
Setup Time
Sets the minimum time before the clock edge while the data signal must stay steady.
The setup time can be negative. In this case, the hold time is always positive. If you set
a negative setup time, the hold time is adjusted by the instrument.
Remote command:
TRIGger:DATatoclock:STIMe on page 332
Hold Time
Sets the minimum time after the clock edge while the data signal must stay steady.
The hold time can be negative. In this case, the setup time is always positive. If you set
a negative hold time, the setup time is adjusted by the instrument.
Remote command:
TRIGger:DATatoclock:HTIMe on page 332
3.6.12 Serial Pattern Trigger (R&S RTH-K19)
Waveform Setup
Trigger
The serial pattern event is used to trigger on signals with serial data patterns in relation
to a clock signal - for example, on bus signals like the I²C bus. The trigger occurs during the reception of the last bit of the defined pattern.
3.6.12.1 Pattern Definition
The pattern defines the bits of the serial data to be found in the data stream.
The pattern definition described here is for the serial pattern trigger; however, a very
similar pattern editor is available for other functions, such as protocol-specific triggers.
When you tap the pattern field, a pattern editor is displayed. The current bit definition in
binary and hexadecimal format is displayed at the top of the editor, a virtual keypad is
displayed beneath it. To define a bit, select the bit in the displayed pattern, then select
the bit value from the displayed keypad. The currently selected bit is indicated by a
blue background.
71User Manual 1326.1578.02 ─ 15
Page 72

R&S®Scope Rider RTH
Waveform Setup
Trigger
Figure 3-17: Pattern editor for 14-bit pattern in hexadecimal format
The maximum length of the pattern is 32 bit, however you can reduce the number of
bits. The available bits are initially indicated by 'X', while the unused bits are indicated
by gray squares. An 'X' indicates that the logical level for the bit is not relevant (do not
care). Once you enter a value for the selected bit, the 'X' is overwritten.
You can enter the pattern in binary or hexadecimal format. Depending on which bit you
select in the pattern display, binary or hexadecimal format is automatically selected for
input. In binary format, each bit is defined individually, and only the digits 0 and 1 are
available for input. In hexadecimal format, 4 bits are defined at the same time by the
selected hexadecimal value. If fewer than 4 bits are available (due to the total number
of bits), only those hexadecimal values are available that can be defined with the
remaining number of bits. For example, for a total number of 14 bits, 3x4 bits can be
defined by any hexadecimal value. The remaining 2 bits can define a 0, 1, 2, or 3 (as
shown in Figure 3-17).
To store the defined pattern, select "Enter". The pattern editor is closed and the pattern
is inserted in the pattern settings field.
3.6.12.2 Serial Pattern Trigger Settings
Access: (Trigger) [SETUP] key > "Trigger Type" = "Serial Pattern"
72User Manual 1326.1578.02 ─ 15
Page 73

R&S®Scope Rider RTH
Description of settings
Figure 3-18: Serial pattern trigger
Clock Source.................................................................................................................73
Clock Slope................................................................................................................... 73
Data Source.................................................................................................................. 73
Set Serial Pattern.......................................................................................................... 73
Bit Order........................................................................................................................74
Waveform Setup
Trigger
Clock Source
Selects the input channel of the clock signal.
Remote command:
TRIGger:SPATtern:CSOurce[:VALue] on page 333
Clock Slope
Sets the edge at which the data value is sampled.
●
●
●
rising edge
falling edge
rising and falling edges are considered (double data rate).
At double data rate, "First Clock Edge of Pattern" defines the edge at which the first
bit of the pattern is sampled: at the rising clock edge, falling clock edge, or the first
edge that is detected ("Either").
Remote command:
TRIGger:SPATtern:CSOurce:EDGE on page 333
TRIGger:SPATtern:CSOurce:FIRStedge on page 333
Data Source
Selects the input channel of the data signal.
Remote command:
TRIGger:SPATtern:DSOurce[:VALue] on page 332
Set Serial Pattern
The pattern defines the bits of the serial data to be found in the data stream.
73User Manual 1326.1578.02 ─ 15
Page 74

R&S®Scope Rider RTH
See also Chapter 3.6.12.1, "Pattern Definition", on page 71.
Remote command:
TRIGger:SPATtern:PATTern on page 333
Bit Order
Defines if the data words start with MSB (most significant bit) or LSB (least significant
bit).
Remote command:
TRIGger:SPATtern:ORDer on page 333
3.6.13 Timeout Trigger (R&S RTH-K19)
The timeout trigger checks if the signal stays above or below the trigger level for a
specified time lapse. In other words, the trigger occurs if the signal does not cross the
trigger level during the specified time.
► [SETUP] key > "Trigger Type" = "Timeout"
Waveform Setup
Trigger
Description of settings
Figure 3-19: Timeout trigger
Range
Selects the relation of the signal level to the trigger level:
"Stays High"
"Stays Low"
"High or Low"
Remote command:
TRIGger:TIMeout:RANGe on page 334
The signal level stays above the trigger level.
The signal level stays below the trigger level.
The signal level stays above or below the trigger level.
Time
Defines the time limit for the timeout at which the instrument triggers.
Remote command:
TRIGger:TIMeout:TIME on page 334
74User Manual 1326.1578.02 ─ 15
Page 75

R&S®Scope Rider RTH
3.6.14 Interval Trigger (R&S RTH-K19)
The interval trigger analyzes the time between two pulses.
► [SETUP] key > "Trigger Type" = "Interval"
Description of settings
Waveform Setup
Trigger
Figure 3-20: Interval trigger
Slope
Sets the edge for the trigger. You can analyze the interval between positive edges or
between negative edges.
Remote command:
TRIGger:INTerval:SLOPe on page 334
Range
Defines how the time range of an interval is defined. The comparisons are the same as
for the width trigger, see "Range" on page 57.
Remote command:
TRIGger:INTerval:RANGe on page 335
Interval Width
Sets the time between two pulses for comparisons equal, unequal, shorter, and longer.
Remote command:
TRIGger:INTerval:WIDTh on page 335
±Tolerance
Sets a tolerance range Δt to the specified Interval Width if the comparison range is
equal or unequal.
Remote command:
TRIGger:INTerval:DELTa on page 335
75User Manual 1326.1578.02 ─ 15
Page 76

R&S®Scope Rider RTH
Min Interval Width / Max Interval Width
Set the lower and upper time limits of the interval if "Inside" or "Outside" is set for comparison.
Remote command:
TRIGger:INTerval:MINWidth on page 335
TRIGger:INTerval:MAXWidth on page 336
3.6.15 Window Trigger (R&S RTH-K19)
The window trigger checks the signal run in relation to a "window" that is formed by the
upper and lower voltage levels. The trigger occurs, if the waveform enters or leaves the
window, or if the waveform stays inside or outside for a defined time range.
With the window trigger, you can display longer transient effects.
► [SETUP] key > "Trigger Type" = "Window"
Description of settings
Waveform Setup
Trigger
Figure 3-21: Window trigger
Vertical Condition
Selects how the signal run is compared with the window:
"Enter"
"Exit"
"Stay Inside"
"Stay Outside"
Remote command:
TRIGger:WINDow:RANGe on page 337
Triggers when the signal crosses the upper or lower level and thus
enters the window made up of these two levels.
Triggers when the signal leaves the window.
Triggers if the signal stays between the upper and lower level for a
specified time. The time is defined in various ways by the "Range"
conditions.
Triggers if the signal stays above the upper level or below the lower
level for a specified time. The time is defined in various ways by the
"Range" conditions.
76User Manual 1326.1578.02 ─ 15
Page 77

R&S®Scope Rider RTH
Upper Trigger Level / Lower Trigger Level
Set the upper and lower voltage thresholds for the window trigger. The trigger levels
are the vertical window limits.
Remote command:
TRIGger:LEVel<m>:WINDow:UPPer on page 336
TRIGger:LEVel<m>:WINDow:LOWer on page 336
Range
Selects how the time limit of the window is defined. Time conditioning is available for
the vertical conditions "Stay Inside" and "Stay Outside".
"Longer"
"Shorter"
"Equal"
Waveform Setup
Trigger
Triggers if the signal crosses the upper or lower level after the specified "Width" time is reached.
Triggers if the signal crosses the upper or lower level before the
specified "Width" time is reached.
Triggers if the signal stays inside or outside the vertical window limits
for the time "Width" "±Tolerance".
"Unequal"
"Inside"
"Outside"
Remote command:
TRIGger:WINDow:TIME on page 336
TRIGger:WINDow:WIDTh on page 337
TRIGger:WINDow:DELTa on page 337
TRIGger:WINDow:MINWidth on page 338
TRIGger:WINDow:MAXWidth on page 338
Triggers if the signal stays inside or outside the vertical window limits
for a time unequal to "Width" "±Tolerance"
Triggers if the signal stays inside or outside the vertical window limits
at least for the time "Min Width" and for "Max Width" at the most.
"Outside" is the opposite definition of "Inside". The trigger occurs if
the signal stays inside or outside the vertical window limits for a time
shorter than "Min Width" or longer than "Max Width".
3.6.16 Protocol Trigger (R&S RTH-K1, -K2, -K3, -K9 and -K10)
The protocol trigger requires at least one of the serial protocol options.
For protocol setup and trigger settings, see:
●
Chapter 9.2.3, "I2C Trigger Settings", on page 185
●
Chapter 9.3.3, "SPI Trigger Settings", on page 194
●
Chapter 9.4.3, "UART Trigger Settings", on page 201
●
Chapter 9.5.3, "CAN Trigger Settings", on page 210
●
Chapter 9.6.3, "LIN Trigger Settings", on page 223
●
Chapter 9.7.3, "SENT Trigger Settings", on page 236
77User Manual 1326.1578.02 ─ 15
Page 78

R&S®Scope Rider RTH
4 Waveform Analysis
4.1 Zoom
The zoom magnifies a part of the waveform to view more details with a maximum
zoom factor of 100.
To activate the zoom:
► Press the [ZOOM] key.
The zoom is applied to all active analog and digital channels and math waveforms. The
waveforms are displayed with a shorter time scale while the vertical scale remains
unchanged. The zoom indicator on the bottom shows the size and position of the zoom
area in the waveform.
To adjust the zoom using the wheel:
Waveform Analysis
Zoom
1. Check if the zoom has the focus - an orange frame on the zoom indicator. If not,
press the [ZOOM] key.
Figure 4-1: Zoomed waveform and zoom indicator with focus on zoom scale
Figure 4-2: Zoom indicator with focus on zoom position
2. Turn the wheel.
Depending on the focus, the position of the zoom area or the zoom scale (time
base of the zoom) is adjusted.
3. Press the wheel to toggle the setting.
78User Manual 1326.1578.02 ─ 15
Page 79

R&S®Scope Rider RTH
4. Turn the wheel to adjust the other parameter.
To position the zoom on the touchscreen:
► Use one of these methods:
● Drag the zoom area in the zoom indicator.
● Drag the trigger position marker.
To zoom in and out using pinching & spreading gestures
You can zoom in and out as you do on a mobile phone or tablet.
1. To zoom in, touch the screen with two fingers and spread the fingers.
2. To zoom out, touch the screen with two fingers and pinch them together.
To adjust the zoom numerically in the Zoom menu:
1. Press and hold the [ZOOM] key until the "Zoom" menu opens.
Waveform Analysis
Zoom
In zoom mode, moving the trigger position marker changes the zoom position
and not the horizontal position of the waveform.
2. Adjust scale and position of the zoom in the menu.
To analyze the zoomed signal, you can use cursor measurements.
Description of settings
Zoom
Enables or disables the zoom.
Remote command:
ZOOM:ENABle on page 338
Scale
Sets the time scale of the zoomed waveform.
Remote command:
ZOOM:SCALe on page 339
Position
Sets the center position of the zoomed area in relation to the trigger point.
Note: The zoom overview also considers the horizontal position of the trigger point. If
the horizontal position is ≠ 0, the trigger point is not in the middle. In this case, the
zoom area in the overview is also shifted, even if the zoom position is 0.
79User Manual 1326.1578.02 ─ 15
Page 80

R&S®Scope Rider RTH
Remote command:
ZOOM:POSition on page 339
4.2 Automatic Measurements
You can perform up to four different measurements simultaneously.
4.2.1 Performing Automatic Measurements
To start and stop the last configured measurements
► Press the [Meas] key.
To configure automatic measurements in the Meas menu
1. Press and hold the [Meas] key until the "Meas" menu opens.
Waveform Analysis
Automatic Measurements
2. Select the number of the measurement that you want to configure.
3. If the measurement is disabled, enable "State".
4. Select the "Type".
The selection list shows all available measurement types.
5. Select the "Source".
The selection list shows all active sources that are allowed for the selected measurement type.
6. Some measurement types require additional settings. Scroll down the menu and
adjust the additional settings if necessary.
4.2.2 Measurement Results
The measurement results are shown on the left-top side of the screen.
Figure 4-3: Results of 4 active measurements
If a result cannot be determined, "---" is displayed. Adjust the horizontal and vertical
settings if the instrument cannot measure.
If the measurement result is outside the measurement range and clipping occurs, the
results are marked with < (underflow) or > (overflow). Adjust the vertical scale to get
valid results.
80User Manual 1326.1578.02 ─ 15
Page 81

R&S®Scope Rider RTH
Figure 4-4: Invalid measurement results
Meas1 = period measurement on C3, no complete period detected
Meas2 = peak to peak measurement on C1, waveform is clipped
Meas3 = pulse count on C3, no pulse detected
Remote commands:
●
MEASurement<m>:RESult:ACTual? on page 341
●
MEASurement<m>:RESult:LIMit? on page 341
4.2.3 Measurement Types
The R&S RTH provides 33 measurement types to measure time, amplitude and power
characteristics, and to count pulses and edges.
All measurement types that require only one source are also available for gated measurements using [Cursor] > "Type" = "Measure".
Waveform Analysis
Automatic Measurements
4.2.3.1 Time Measurements
Meas. type Symbol Description Graphic / formula Source
Period T
in s
Frequency f
in Hz
Rise time tR
in s
Fall time tF
in s
Time of the first period, measured on the
50% level. The measurement requires at
least one complete period of the signal.
Frequency of the signal, reciprocal value
of the measured first period.
Rise time of the first rising edge, the time
it takes the signal to rise from the 10%
level to the 90% level.
Fall time of the first falling edge, the time
it takes the signal to fall from the 90%
level to the 10% level.
ML
ML
UL
LL
UL
LL
T
f = 1 / T
T
Rise
Fall
Analog, math,
logic
Analog, math,
logic
Analog, math
Analog, math
Positive pulse
width
t+
in s
Duration of the first positive pulse: time
between a rising edge and the following
falling edge measured on the 50% level.
ML
t+
Analog, math,
logic
81User Manual 1326.1578.02 ─ 15
Page 82

R&S®Scope Rider RTH
N
k
k
x
N
1
1
Mean
N
k
k
x
N
1
2
1
RMS
RMS
||Max
Crest
k
x
Waveform Analysis
Automatic Measurements
Meas. type Symbol Description Graphic / formula Source
Negative pulse
width
Positive duty cycle Dty+
Negative duty cycle Dty-
Delay Δt
Phase
t-
in s
in %
in %
in s
∡
in °
Duration of the first negative pulse: time
between a falling edge and the following
rising edge measured on the 50% level.
Width of the first positive pulse in relation
to the period in %. The measurement
requires at least one complete period of
the signal.
Width of the first negative pulse in relation to the period in %. The measurement requires at least one complete
period of the signal.
Time difference between two slopes of
the same or different waveforms, measured on the 50% level.
Not available for cursor measurements
Phase difference between two waveforms, measured on the 50% level.
Not available for cursor measurements
t-
ML
Dty+ = t+ / T * 100%
t+
Dty- = t- / T * 100%
t-
S1
t
S2
Phase = Δt / T * 360°
1
t
Analog, math,
logic
100%0% T
100%0% T
360°0°
Analog, math,
logic
Analog, math,
logic
2 sources:
analog, math,
logic
2 sources:
analog, math,
logic
2
4.2.3.2 Amplitude Measurements
The unit of most amplitude measurement results depends on the measured source.
Meas. type Symbol Description Graphic / formula Source
Mean value Mean Arithmetic average of the complete dis-
played waveform.
RMS value RMS RMS (root mean square) value of the
voltage of the complete displayed waveform.
Crest factor Crest The crest factor is also known as peak-
to-average ratio. It is the maximum value
divided by the RMS value of the displayed waveform.
Analog, math,
logic
Analog, math
Analog, math
82User Manual 1326.1578.02 ─ 15
Page 83

R&S®Scope Rider RTH
N
k
k
x
N
1
2
Mean
1
1
σ
%100
Amplitude
TopMax
Over
local
%100
Amplitude
Min Base
Over
local
Waveform Analysis
Automatic Measurements
Meas. type Symbol Description Graphic / formula Source
Standard deviation
Minimum Min Minimum value within the displayed
Maximum Max Maximum value within the displayed
Peak to peak Pk-Pk Difference of maximum and minimum
Base level Base Low level of the displayed waveform -
σ
Standard deviation of the displayed
waveform.
waveform.
waveform.
values.
the lower maximum of the sample distribution. The measurement requires at
least one complete period of the signal.
Max
Max
Base
Analog, math
Analog, math
Min
Analog, math
Analog, math
Pk-Pk
Min
Analog, math
Top level Top High level of the displayed waveform -
the upper maximum of the sample distribution. The measurement requires at
least one complete period of the signal.
Amplitude Amp Difference between the top level and the
base level of the signal. The measurement requires at least one complete
period of the signal.
Overshoot Over
in %
Preshoot Pre
in %
Overshoot of a square wave after a rising or falling edge. It is calculated from
measurement values top level, base
level, local maximum, local minimum,
and amplitude.
Overshoot of a square wave before a rising or falling edge.
Top
Top
Amplitude
Base
Top
Base
Same equations as overshoot
Top
Base
Over+
Amplitude
Over-
Pre+
Amplitude
Pre-
Analog, math
Analog, math
Analog, math
Analog, math
83User Manual 1326.1578.02 ─ 15
Page 84

R&S®Scope Rider RTH
Waveform Analysis
Automatic Measurements
Meas. type Symbol Description Graphic / formula Source
AC AC
in V
RMS value of the AC part of a periodic
signal, calculated over all periods on the
display. The AC result is derived from the
DC and AC+DC results.
Analog, math
AC
DC
N T
DC DC
in V
AC+DC AC+DC
in V
Mean value of a periodic signal, calculated over all periods on the display. If no
complete period is available, only the
mean value of the visible waveform is
calculated.
RMS value of a periodic signal, calculated over all periods on the display. If no
complete period is available, only the
RMS value of the visible waveform is
calculated.
DC
DC
AC
N T
AC² + DC²
Analog, math
Analog, math
N T
4.2.3.3 Counting
Meas. type Symbol Description Graphic / formula Sources
Positive pulse
count
Cnt+ Number of positive pulses on the display.
The mean value of the signal is determined. If the signal passes the mean
value, an edge is counted. A positive
pulse is counted if a rising edge and a
following falling edge are detected.
N321
Analog, math,
logic
Negative pulse
count
Rising edge count Cnt↑ Number of rising edges on the display.
Falling edge count Cnt↓ Number of falling edges on the display.
Cnt- Number of negative pulses on the dis-
play. The mean value of the signal is
determined. If the signal passes the
mean value, an edge is counted. A negative pulse is counted if a falling edge
and a following rising edge are detected.
The instrument determines the mean
value of the signal and counts an edge
every time the signal passes the mean
value in the specified direction.
The instrument determines the mean
value of the signal and counts an edge
every time the signal passes the mean
value in the specified direction.
N321
N321
N321
Analog, math,
logic
Analog, math,
logic
Analog, math,
logic
84User Manual 1326.1578.02 ─ 15
Page 85

R&S®Scope Rider RTH
-
+
-
Waveform Analysis
Automatic Measurements
4.2.3.4 Area Measurements
Meas. type Symbol Description Graphic / formula Sources
Area Area
in Vs or
As
Area between the waveform and the xaxis.
T
is the evaluation time, time of a full
Eval
waveform or limited by cursor lines.
Analog, math
4.2.3.5 Power Measurements
Power measurements require two sources, one voltage source and one current
source. They are not available for cursor measurements and logic channel sources.
Meas. type Symbol Description Graphic / formula Sources
Active power P
in W
Apparent power S
in VA
Active or real power is the energy of the
system that can be used to do work.
Complex power S is the magnitude of
the vector sum of real and reactive
power.
Im
Im
2 sources:
S
φ
P
φ
Q
Re
S
Q
P
Re
analog, math
2 sources:
analog, math
Reactive power Q
in var
Power factor PF
(no unit)
Reactive power is temporally stored in a
system because of the inductive and
capacitive elements.
Power factor is a measure of the system
efficiency. The value varies between -1
and 1.
Im
S
φ
P
PF = cos(φ)
Im
S
φ
P
2 sources:
analog, math
Q
Re
2 sources:
analog, math
Q
Re
4.2.3.6 PWM Measurements
Pulse width modulated signals are commonly used in power electronics. For drive control, the PWM signal contains a sinusoidal signal with a fundamental frequency f and
the associated RMS voltage, which an AC motor reacts on. The PWM measurements
of R&S RTH display the frequency and RMS value of this fundamental. This also works
85User Manual 1326.1578.02 ─ 15
Page 86

R&S®Scope Rider RTH
1/ f
V
V
1/ f
V
1/ f
Waveform Analysis
Automatic Measurements
for bipolar PWM signals, as it can be observed in multi-level drive controls or in a differential phase to phase measurement (L1-L2).
Meas. type Symbol Description Graphic / formula Sources
V PWM V PWM
in V
f PWM f PWM
in Hz
V/f PWM V/f
in Vs
4.2.4 Measurement Settings
Access: "Meas" menu
RMS voltage of the fundamental in the
PWM signal, measured over the complete displayed waveform.
Fundamental frequency in the PWM signal, measured over the complete displayed waveform.
Ratio of RMS fundamental voltage over
fundamental frequency of the PWM signal, measured over the complete displayed waveform.
Analog, math
Analog, math
Analog, math
Measurement
Selects the measurement to be configured in the menu. You can perform up to four different measurements simultaneously.
State
Enables or disables the selected measurement.
86User Manual 1326.1578.02 ─ 15
Page 87

R&S®Scope Rider RTH
Remote command:
MEASurement<m>:ENABle on page 339
Type
Selects the measurement type. For a detailed description, see Chapter 4.2.3, "Mea-
surement Types", on page 81.
Remote command:
MEASurement<m>:TYPE on page 340
Source / Source 2
Defines the waveform to be measured. For delay, phase, and power measurements, 2
sources are required.
The sources can be any active input signal, math or reference waveform. Available
source waveforms depend on the measurement type, see Chapter 4.2.3, "Measure-
ment Types", on page 81.
Remote command:
MEASurement<m>:SOURce on page 340
Waveform Analysis
Cursor Measurements
All off
Disables all active measurements.
Remote command:
MEASurement<m>:AOFF on page 341
Slope
Sets the slope for the delay measurement type.
"Positive"
"Negative"
"Either"
Remote command:
MEASurement<m>:DELay:SLOPe on page 341
Delay between the first rising edge of each source waveform.
Delay between the first falling edge of each source waveform.
Delay between the first edge of each source waveform, no matter if it
is rising or falling.
4.3 Cursor Measurements
The cursor measurement determines the results at the current cursor positions, or performs gated automatic measurements between the cursor lines. The cursors can be
positioned manually at fixed positions, or they can follow the waveform.
You can perform cursor measurements on analog input signals, math waveform, XYdiagram, as well as on logic channels (requires option R&S RTH-B1).
Cursor measurements on spectrum displays are also available, if the option R&S RTHK18 is installed (see Chapter 6.2.7, "Cursor Measurements on Spectrums",
on page 128).
87User Manual 1326.1578.02 ─ 15
Page 88

R&S®Scope Rider RTH
4.3.1 Performing Cursor Measurements
To start and stop the last configured measurement
► Press the [Cursor] key.
To configure the cursor measurement in the Cursor menu
1. Press and hold the [Cursor] key until the "Cursor" menu opens.
2. Select the "Type" of the cursor.
3. For horizontal, track and measure types, select the "Source" channel that you want
to measure.
4. Scroll down the menu and adjust the additional settings, which are required for the
selected cursor type.
4.3.2 Cursor Types and Results
Waveform Analysis
Cursor Measurements
The results of cursor measurements are displayed at the top of the display. 4 cursor
types are available.
Vertical cursors
For vertical cursors, two results are displayed by default: the absolute value of the time
difference between the cursor lines Δt and its inverse value 1/Δt. Optionally, the positions of the cursor lines t1 and t2 are also measured. The results are time values and
do not depend on any waveform, thus no source is required.
●
CURSor:TDELta? on page 344
●
CURSor:ITDelta? on page 344
●
CURSor:X1Position on page 344
●
CURSor:X2Position on page 344
Horizontal cursors
For horizontal cursors, the vertical values of the cursor positions y1 and y2 are measured. These are usually voltage or current values. The absolute value of the difference between the positions Δy is also displayed.
●
CURSor:Y1Position on page 345
●
CURSor:Y2Position on page 345
●
CURSor:DELTa? on page 344
88User Manual 1326.1578.02 ─ 15
Page 89

R&S®Scope Rider RTH
Track cursors
Two vertical cursor lines are coupled to the waveform. The instrument measures the
vertical values y1 and y2 of the crossings between the cursor lines and the waveform.
It also measures the absolute values of the difference between the positions Δy and of
the time difference between the cursor lines Δt
●
CURSor:Y1AMplitude? on page 345
●
CURSor:Y2AMplitude? on page 345
●
CURSor:DELTa? on page 344
●
CURSor:TDELta? on page 344
Measurements
Two vertical cursor lines define a gate for two parallel automatic measurements. All
automatic measurements that need only one source are available. Delay, phase, and
power measurements are not provided for cursor measurements, they require two
sources.
Waveform Analysis
Cursor Measurements
See Chapter 4.2.3, "Measurement Types", on page 81.
If the measurement result is outside the measurement range and clipping occurs, the
results are marked with < (underflow) or > (overflow). Adjust the vertical scale to get
valid results.
●
CURSor:MEASurement<m>:RESult:ACTual? on page 345
●
CURSor:MEASurement<m>:RESult:LIMit? on page 345
4.3.3 Settings for Cursor Measurements
Access: "Cursor" menu
89User Manual 1326.1578.02 ─ 15
Page 90

R&S®Scope Rider RTH
Waveform Analysis
Cursor Measurements
State
Enables or disables the cursor measurement.
Remote command:
CURSor:STATe on page 342
Type
Defines the type of the cursor measurement.
For details, see Chapter 4.3.2, "Cursor Types and Results", on page 88.
"Vertical"
"Horizontal"
"Track"
"Measure"
Remote command:
CURSor:FUNCtion on page 342
Source
Defines the source on which the cursor measurement is performed. The source can be
any active analog or digital input signal, math waveform, or bus (requires option).
The source setting is not available for the cursor type "Vertical", and for measurements
in the XY-diagram.
Remote command:
CURSor:SOURce on page 342
Displays two vertical cursor lines and measures their timing parameters.
Displays two horizontal cursor lines and measures their amplitude
parameters.
Displays two vertical cursor lines and couples them to the source
waveform. The amplitude characteristcs and the time difference of the
crossing points are measured.
Displays two vertical cursor lines that define a gate for two simultaneous automatic measurements.
90User Manual 1326.1578.02 ─ 15
Page 91

R&S®Scope Rider RTH
Show Position
Shows the position values of the vertical cursor lines t1 and t2 in the measurement
results. The setting is only available for the vertical cursor type.
Meas Type 1 / Meas Type 2
Set the automatic measurements to be performed on the source waveform between
the cursor lines. The setting is only available for the "Measure" cursor type.
All automatic measurements that need only one source are available. Delay, phase,
and power measurements are not provided for cursor measurements, they require two
sources.
For a description of the measurement types, see Chapter 4.2.3, "Measurement Types",
on page 81.
Remote command:
CURSor:MEASurement<m>:TYPE on page 343
Waveform Analysis
Mathematics
Track Scaling
If enabled, the position of the cursor lines is adjusted if the vertical or horizontal scales
are changed. The cursor lines keep their relative position to the waveform.
If disabled, the cursor lines remain on their position on the display if the scaling is
changed.
Remote command:
CURSor:SCPLing on page 343
Coupling
Couples the cursor lines so that the distance between the two lines remains the same
if one cursor is moved.
Remote command:
CURSor:COUPling on page 343
Set to Screen
Sets the cursors to a default position on the screen. This is helpful if the cursors have
disappeared from the display or need to be moved for a larger distance.
Remote command:
CURSor:SCReen on page 343
4.4 Mathematics
A math waveform is a calculated waveform. You can calculate data out of one or two
different sources using several predefined operations.
► To configure the math waveform, press and hold the [MATH] key until the menu
opens.
91User Manual 1326.1578.02 ─ 15
Page 92

R&S®Scope Rider RTH
► To activate or deactivate the last configured math waveform, shortly press the
[MATH] key.
► To adjust vertical scale and position of the math waveform, use the [RANGE] and
[POS] keys.
You can analyize math waveforms in the same way as channel waveforms: use zoom,
perform automatic and cursor measurements, save as reference waveform, and perform mask tests.
Description of settings
Waveform Analysis
Mathematics
State
Activates the waveform and displays it.
Remote command:
REFCurve:STATe on page 348
CALCulate:MATH:STATe on page 346
Source 1 / Source 2
Sets the source(s) for the defined mathematic operation.
Operation
Select an operation to calculate the math waveform.
"S1 + S2"
"S1 - S2"
Addition: Adds the values of "Source 1" and ""Source 2"".
Subtraction: Subtracts the values of "Source 2" from the values of
"Source 1".
92User Manual 1326.1578.02 ─ 15
Page 93

R&S®Scope Rider RTH
Waveform Analysis
Reference Waveforms
"S1 * S2"
"-S1,"
"|S1|"
"S12"
Multiplication: Multiplies the values of "Source 1" and "Source 2".
Inverse: Inverts all voltage values of "Source 1", i.e. all values are
mirrored at the ground level. Thus, a positive voltage offset becomes
negative.
Abs. Value: Calculates the absolute value of "Source 1". All negative
values are inverted to positive values.
Square: Squares the value of "Source 1".
Remote command:
CALCulate:MATH[:EXPRession][:DEFine] on page 346
[RANGE] keys
The vertical [RANGE] keys set the vertical scale (vertical sensitivity) of the math waveform.
Remote command:
CALCulate:MATH:VERTical:SCALe on page 347
CALCulate:MATH:VERTical:RANGe on page 347
[POS] keys
Move the math waveform or down in the diagram. The position is a graphical setting
given in divisions.
You can also drag the waveform marker on the screen.
Remote command:
CALCulate:MATH:VERTical:POSition on page 347
4.5 Reference Waveforms
To compare waveforms and analyze differences between waveforms, you can use a
reference waveform. You can also save reference waveforms and load them for further
use. The display of a reference waveform is independent from that of the source waveform; you can change the vertical scale and position
93User Manual 1326.1578.02 ─ 15
Page 94

R&S®Scope Rider RTH
To create and save a reference waveform
1. Set up the waveform that will be the reference.
2. Open the "Ref" menu.
3. Select the "Source" waveform.
4. Select "Update".
The reference waveform is created, activated, and shown on top of the original
waveform.
5. You can change the vertical scale and position using the [RANGE] and [POS] keys.
6. To save the reference, select "Save".
7. Select the "File Type" (format BIN, XML, or CSV).
8. Select the "File Name" and enter the file name.
4.5.1 Settings for Reference Waveforms
Waveform Analysis
Reference Waveforms
Access: "Ref" menu
Source
Selects the waveform to be taken as reference waveform. Any active channel or math
waveform can be used.
Remote command:
REFCurve:SOURce on page 347
Update
Creates the reference waveform from the source waveform.
Remote command:
REFCurve:UPDate on page 347
State
Activates the waveform and displays it.
94User Manual 1326.1578.02 ─ 15
Page 95

R&S®Scope Rider RTH
Remote command:
REFCurve:STATe on page 348
CALCulate:MATH:STATe on page 346
Vertical Position
Sets the vertical position of the reference waveform.
You can also tap the waveform label "R" to set the focus to the reference waveform,
and use the [RANGE] and [POS] keys to adjust the display.
Remote command:
REFCurve:POSition on page 348
Save/ Load
Saves or loads a reference waveform. The default directory is C:/Users/<user>/
Rohde-Schwarz/RTH/ReferenceCurves.
Select the "File Type" (format BIN, XML, or CSV) and enter the "File Name". See also
Chapter 4.5.2, "Waveform Files", on page 95.
Remote command:
REFCurve:NAME on page 348
REFCurve:SAVE on page 348
REFCurve:OPEN on page 348
REFCurve:DELete on page 348
Waveform Analysis
Reference Waveforms
4.5.2 Waveform Files
Reference waveforms can be stored in XML, CSV, or BIN format.
If you want to reload reference waveforms on the instrument, save them in BIN or CSV
format. XML files cannot be reloaded.
Waveform data is saved in two files. One file contains the waveform data values and is
indicated by *Wfm.* in the file name. The second file contains the header data, for
example, time scale, vertical scale, vertical position, acquisition mode, and more.
Header data is required to reload the waveform from data, or to analyze the data values of the data file.
4.5.2.1 Waveform Header Files
The header files of XML and BIN waveform files are written in XML format. The header
files of CSV waveform files are written in CSV format. You can open the header files
and use their information for data analysis.
CSV header files only contain the property names and values, one property per row.
VerticalScale:0.05:
HorizontalScale:5e-08:
95User Manual 1326.1578.02 ─ 15
Page 96

R&S®Scope Rider RTH
XML header files contain more information than CSV header files. For analysis, only
Name and Value are needed.
<Prop Name="VerticalScale" Value="0.05" UserValue="0.05" Step="0.001" Default="0.05"
Min="0.001" Max="100" StepDefault="0.001" StepFactor="10" UnitId="77"
UnitName="V/div" BitGroupSize="0" Format="0"></Prop>
<Prop Name="HorizontalScale" Value="1e-07" UserValue="1e-07" Step="1e-09"
Default="1e-07" Min="1e-09" Max="500" StepDefault="1e-09" StepFactor="10"
UnitId="75" UnitName="s/div" BitGroupSize="0" Format="0"></Prop>
Header files contain the following properties:
Value Description
Vertical settings
VerticalScale Vertical scale of the waveform in Volts per division, or other unit / division
VerticalOffset Vertical offset of the waveform in Volts, or other unit
VerticalPosition Vertical position of the waveform in divisions
Waveform Analysis
Reference Waveforms
Horizontal and acquisition settings
HorizontalScale Time scale in seconds per division
HorizontalLeft Horizontal start value of the waveform (time in s)
HorizontalResolutionPP Time between two recorded samples
HorizontalAcquisitionMode Sample, Peak Detect, High Res, Envelope, or Average
HorizontalDecimationFactor At long time bases, if the number of captured samples is higher than the
Samples
HorizontalTraceLength Record length, number of recorded waveform samples, which are stored
PostSettlingSamples Number of additional samples after the end of the waveform record.
PreSettlingSamples Number of additional samples before the beginning of waveform samples.
4.5.2.2 Waveform Data Files
The waveform data files are indicated by *Wfm.* in the file name. They contain the
actual waveform data, the Y-values of the samples. Mostly, the Y-values are voltages:
available record length, decimation takes effect. If the time scale is ≤5 μs/
div, the decimation factor is 1.
in the memory
They ensure that all measurements can be performed on the reloaded
waveform that could be performed on the original waveform.
Y0; Y1; Y2; Y3; ...
Before and after the waveform data, the instrument writes some presettling and postsettling samples. The overall number of values in the data file is:
ValuesNumber = PreSettlingSamples + HorizontalTraceLength + PostSettlingSamples
For envelope waveforms, the number of values in the file doubles. Two Y-values for
each sample are written, one for the upper and one for the lower envelope:
96User Manual 1326.1578.02 ─ 15
Page 97

R&S®Scope Rider RTH
Ymin0; Ymax0; Ymin1; Ymax1; Ymin2; Ymax2; Ymin3; Ymax3;...
In peak detect acquisition mode, the number of values depends on the decimation factor. If the decimation factor is 1, one value per sample is written. At higher decimation
factors, two values per sample are written.
In CSV files, the data values of one sample are written in one row. Envelope data, for
example, looks like this:
-0.0125490196078431 -0.0619607843137255
-0.0133333333333333 -0.0627450980392157
-0.0149019607843137 -0.0650980392156863
XML files are easy to read:
<sample>
<datamax>-0.012549</datamax>
<datamin>-0.0619608</datamin>
</sample>
<sample>
<datamax>-0.0133333</datamax>
<datamin>-0.0627451</datamin>
</sample>
<sample>
<datamax>-0.014902</datamax>
<datamin>-0.065098</datamin>
</sample>
Waveform Analysis
XY-Diagram
4.6 XY-Diagram
XY-diagrams combine the voltage or current levels of two input signals in one diagram.
They use the level of a second signal as the x-axis, rather than a time base. This
allows you to perform phase shift measurements, for example.
1. Press the [Mode] key.
2. Select "XY".
3. Make sure that the signals, the trigger, and the acquisition are set up correctly. The
following menus are available in XY-mode:
● "Vertical", see Chapter 3.2, "Vertical Setup", on page 40.
● "Horizontal", see Chapter 3.3, "Horizontal Setup", on page 45.
● "Trigger", see Chapter 3.6, "Trigger", on page 51.
● "Acquire", see Chapter 3.4, "Acquisition Control", on page 47.
To analyze the signal in XY-mode, you can use cursor measurements. You can select
vertical or horizontal cursors, couple the cursor lines or set them to screen. All other
cursor settings are not relevant for measuring the XY-diagram.
97User Manual 1326.1578.02 ─ 15
Page 98

R&S®Scope Rider RTH
Waveform Analysis
Description of settings
History (Option R&S
RTH-K15)
Source X
Defines the signal that supplies the x-values of the XY-diagram, replacing the usual
time base. The source can be any of the active analog channels.
Source Y
Defines the signal to be displayed in y-direction in an XY-diagram. The source can be
any of the active analog channels.
4.7 History (Option R&S RTH-K15)
The history option R&S RTH-K15 accesses the data of previous acquisitions and provides them for further analysis. Using this option, you can analyze, for example, packet
communication on serial buses, radar pulses, laser pulses, and signals that occur in
short bursts with long idle times.
If history is enabled and an acquisition runs, the instrument stores the captured waveforms, processes the data and displays the current waveform. Each stored waveform is
called a segment. When the acquisition is stopped, the history player is shown to
access the stored segments, and to display and analyze them. When you start a new
acquisition, the history is cleared and written anew.
The history stores the following data during acquisition:
●
All active analog channels.
●
All logic channels if at least one logic is active (with option R&S RTH-B1).
●
Decoded bus data if the bus is active (with option R&S RTH-K1 and/or R&S RTHK2).
98User Manual 1326.1578.02 ─ 15
Page 99

R&S®Scope Rider RTH
Waveform Analysis
To enable the history:
1. Tap the Menu button, and select "History" on the menu.
2. Enable "History".
4.7.1 History Settings
Access: "History" menu
History (Option R&S
RTH-K15)
History
Enables the history function. The instrument stores the captured waveforms in segments. After stopping the acquisition, you can analyze them.
Remote command:
CHANnel<m>:HISTory[:STATe] on page 349
Number of Segments
Sets the number of segments to be stored.
Note: If zoom or mathematics are active during acquisition, the actual number of
stored segments can be less than the defined number. To avoid the decrease of stored
waveforms, disable zoom and mathematics before you acquire the waveforms. You
can enable zoom and mathematics later in stop mode and use them to analyze any of
the history segments.
Remote command:
CHANnel<m>:HISTory:NSEGments on page 349
Player Speed
Defines how fast the history player shows the stored segments.
99User Manual 1326.1578.02 ─ 15
Page 100

R&S®Scope Rider RTH
Remote command:
CHANnel<m>:HISTory:TPACq on page 349
Player Control Position
Sets the position of the history player window on the display. You can drag the window
on the touchscreen to another position. If so, a "User" position is indicated.
Available Acquisition
Shows the number of segments that are currently stored in the history.
Remote command:
ACQuire:AVAilable? on page 349
Start Acquisition / Stop Acquisition
Define the index of the first and the last history segment that the history player shows.
Change these values if you want to see a smaller range of subsequent segments from
the history. The newest segment has always the index "0". Older segments have a
negative index. The number of available segments is shown in "Available Acquisition".
Remote command:
CHANnel<m>:HISTory:STARt on page 350
CHANnel<m>:HISTory:STOP on page 350
Waveform Analysis
History (Option R&S RTH-K15)
Time Format
Defines if the timestamp in the history player window shows the absolute or relative
time. Absolute time is the date and the daytime of the current acquisition. Relative time
is the difference to the newest segment (index = 0).
See also "Timestamp" on page 101.
4.7.2 Displaying History Data
In the history player window, you start and stop the playback of the stored segments,
and you can display a particular acquisition.
= Timestamp, here: absolute time
1
2 = Index of the oldest, current, and newest (= 0) segment
3 = Slider to set the displayed segment
4 = Control buttons: Play, Step Forward, Step Back, and Repeat
100User Manual 1326.1578.02 ─ 15
 Loading...