


®
R&S
RTP
High-Performance
Oscilloscope
Getting Started
(=Uñ^2)
1337994602
Version 07

This manual describes the following R&S®RTP models with firmware version 5.10
and higher:
●
R&S®RTP044 (1320.5007K04)
●
R&S®RTP064 (1320.5007K06)
●
R&S®RTP084 (1320.5007K08)
●
R&S®RTP134 (1320.5007K13)
●
R&S®RTP164 (1320.5007K16)
© 2021 Rohde & Schwarz GmbH & Co. KG
Mühldorfstr. 15, 81671 München, Germany
Phone: +49 89 41 29 - 0
Email: info@rohde-schwarz.com
Internet: www.rohde-schwarz.com
Subject to change – data without tolerance limits is not binding.
R&S® is a registered trademark of Rohde & Schwarz GmbH & Co. KG.
Trade names are trademarks of the owners.
1337.9946.02 | Version 07 | R&S®RTP
Throughout this manual, products from Rohde & Schwarz are indicated without the ® symbol, e.g.
R&S®RTP is indicated as R&S RTP.

R&S®RTP
Contents
1 Safety and regulatory information....................................... 5
1.1 Safety instructions................................................................................5
1.2 Labels on the product.........................................................................11
1.3 Warning messages in the documentation........................................12
1.4 Korea certification class A.................................................................12
2 Key Features........................................................................ 13
3 Documentation overview.................................................... 14
3.1 Manuals and instrument help............................................................ 14
Contents
3.2 Data sheet and brochure....................................................................15
3.3 Release notes, open source acknowledgment................................ 16
3.4 Application notes, application cards, videos...................................16
4 Preparing for use................................................................. 17
4.1 Lifting and carrying............................................................................ 17
4.2 Unpacking and checking....................................................................17
4.3 Choosing the operating site.............................................................. 17
4.4 Setting up the product........................................................................18
4.5 Considerations for test setup............................................................ 20
4.6 Connecting to power.......................................................................... 21
4.7 Switching on or off............................................................................. 22
4.8 Connecting external devices............................................................. 23
5 Instrument tour.................................................................... 26
5.1 Front panel.......................................................................................... 26
5.2 Rear panel............................................................................................29
5.3 Keys and controls...............................................................................32
3Getting Started 1337.9946.02 ─ 07

R&S®RTP
Contents
6 Operating the instrument....................................................44
6.1 Means of manual interaction............................................................. 44
6.2 Touchscreen display...........................................................................45
6.3 App cockpit......................................................................................... 52
6.4 Working with waveforms....................................................................53
6.5 Rohde & Schwarz smartgrid.............................................................. 56
6.6 Toolbar................................................................................................. 57
6.7 Displaying results............................................................................... 66
6.8 Using dialog boxes............................................................................. 68
6.9 Entering data....................................................................................... 69
6.10 Instrument information and notifications.........................................72
6.11 Getting information and help.............................................................73
7 Setting up the instrument................................................... 77
7.1 Performing a self-alignment.............................................................. 77
7.2 Setting the display language............................................................. 78
8 Contacting customer support............................................ 79
Index..................................................................................... 80
4Getting Started 1337.9946.02 ─ 07

R&S®RTP
Safety and regulatory information
Safety instructions
1 Safety and regulatory information
The product documentation helps you to use the product safely and efficiently.
Follow the instructions provided here and in the Chapter 1.1, "Safety instructions",
on page 5.
Intended use
The R&S RTP oscilloscope is designed for measurements on circuits that are
only indirectly connected to the mains or not connected at all. It is not rated for
any measurement category.
The product is intended for the development, production and verification of electronic components and devices in industrial, administrative, and laboratory environments. Use the product only for its designated purpose. Observe the operating
conditions and performance limits stated in the data sheet.
Where do I find safety information?
Safety information is part of the product documentation. It warns you of potential
dangers and gives instructions on how to prevent personal injury or damage
caused by dangerous situations. Safety information is provided as follows:
●
In Chapter 1.1, "Safety instructions", on page 5. The same information is
provided in many languages as printed "Safety Instructions". The printed
"Safety Instructions" are delivered with the product.
●
Throughout the documentation, safety instructions are provided when you
need to take care during setup or operation.
1.1 Safety instructions
Products from the Rohde & Schwarz group of companies are manufactured
according to the highest technical standards. To use the products safely, follow
the instructions provided here and in the product documentation. Keep the product documentation nearby and offer it to other users.
Use the product only for its intended use and within its performance limits. Intended use and limits are described in the product documentation such as the data
sheet, manuals and the printed "Safety Instructions". If you are unsure about the
appropriate use, contact Rohde & Schwarz customer service.
5Getting Started 1337.9946.02 ─ 07

R&S®RTP
Using the product requires specialists or specially trained personnel. These users
also need sound knowledge of at least one of the languages in which the user
interfaces and the product documentation are available.
Never open the casing of the product. Only service personnel authorized by
Rohde & Schwarz are allowed to repair the product. If any part of the product is
damaged or broken, stop using the product. Contact Rohde & Schwarz customer
service at http://www.customersupport.rohde-schwarz.com.
In these safety instructions, the term "product" covers instruments (oscilloscopes), probes and their accessories.
Lifting and carrying the instrument
Check the data sheet for the maximum weight of the instrument. A single person
can only carry a maximum of 18 kg safely depending on age, gender and physical
condition. If your instrument is heavier than 18 kg, do not move or carry it by yourself.
Safety and regulatory information
Safety instructions
Use the instrument handles to move or carry the instrument. Do not use the
mounted accessories instead of the handles. Accessories are not designed to
carry the weight of the instrument.
To move the instrument safely, you can use lifting or transporting equipment such
as lift trucks and forklifts. Follow the instructions provided by the equipment manufacturer.
Choosing the operating site
Only use the product indoors. The product casing is not waterproof. Water that
enters can electrically connect the casing with live parts, which can lead to electric shock, serious personal injury or death if you touch the casing. If
Rohde & Schwarz provides accessories designed for your product, e.g. a carrying
bag, you can use the product outdoors.
You can operate the product up to the altitude specified in the data sheet. The
lowest specified altitude for a product of the measurement setup defines the altitude for the complete setup.
The product is suitable for pollution degree 2 environments where nonconductive
contamination can occur. For more information on environmental conditions such
as ambient temperature and humidity, see the data sheet.
6Getting Started 1337.9946.02 ─ 07

R&S®RTP
Setting up the product
Always place the product on a stable, flat and level surface with the bottom of the
product facing down. If the product is designed for different positions, secure the
product so that it cannot fall over.
If the product has foldable feet, always fold the feet completely in or out to ensure
stability. The feet can collapse if they are not folded out completely or if the product is moved without lifting it. The foldable feet are designed to carry the weight of
the product, but not an extra load.
If stacking is possible, keep in mind that a stack of products can fall over and
cause injury.
If you mount products in a rack, ensure that the rack has sufficient load capacity
and stability. Observe the specifications of the rack manufacturer. Always install
the products from the bottom shelf to the top shelf so that the rack stands
securely. Secure the product so that it cannot fall off the rack.
Safety and regulatory information
Safety instructions
Connecting to power and grounding
The mains power supply input of the instrument complies with overvoltage category II. It has to be connected to a fixed installation used to supply energy-consuming equipment such as household appliances and similar loads. Be aware
that electrically powered products have risks, such as electric shock, fire, personal injury or even death.
Take the following measures for your safety:
●
Do not use an isolating transformer to connect the instrument to the mains
power supply.
●
Before switching on the product, ensure that the voltage and frequency indicated on the product match the available power source. If the power adapter
does not adjust automatically, set the correct value and check the rating of the
fuse.
●
Only use the power cable delivered with the product. It complies with countryspecific safety requirements. Only insert the plug into an outlet with protective
conductor terminal.
●
If a product has an exchangeable fuse, its type and characteristics are indicated next to the fuse holder. Before changing the fuse, switch off the instrument
and disconnect it from the power source. How to change the fuse is described
in the product documentation.
7Getting Started 1337.9946.02 ─ 07

R&S®RTP
●
Only use intact cables and route them carefully so that they cannot be damaged. Check the power cables regularly to ensure that they are undamaged.
Also ensure that nobody can trip over loose cables.
●
If the product needs an external power supply, use the power supply that is
delivered with the product or that is recommended in the product documentation or a power supply that conforms to the country-specific regulations.
●
Ensure that you can disconnect the product from the power source at any
time. Pull the power plug to disconnect the product. The power plug must be
easily accessible. If the product is integrated into a system that does not meet
these requirements, provide an easily accessible circuit breaker at the system
level.
Performing measurements
Take the following measures for your safety:
●
To ascertain voltage-free state, use an appropriate voltage tester. Any measurement setup including an oscilloscope is not suitable for this purpose.
Safety and regulatory information
Safety instructions
●
The maximum input voltage on channel inputs and the external trigger input
must not exceed the value specified in the data sheet.
●
Observe all voltage and current ratings of the instrument, the probes, and the
accessories. Limits and ratings are marked on the products and listed in the
data sheets.
Consider that the rated voltage depends on the frequency. The voltage limitation curves or values are provided in the data sheet. Do not exceed the maximum measurement voltage from the probe tip to the probe reference lead.
●
Never cause any short circuits when measuring sources with high output currents.
●
Use only probes and accessories that comply with the measurement category
(CAT) of your measurement task. The measurement category of the products
is defined in the data sheet. If you use other than Rohde & Schwarz accessories, make sure that they are suitable for the instrument and the measurement
task.
●
Set the correct attenuation factor on the instrument according to the probe
being used. Otherwise, the measurement results do not reflect the actual voltage level, and you might misjudge the actual risk.
●
When working with high voltages and current probes, observe the additional
operating conditions specified in this safety instructions.
●
The probe pins are extremely pointed and can easily penetrate clothes and
the skin. Handle the probe pins with great care. To exchange a probe pin, use
8Getting Started 1337.9946.02 ─ 07

R&S®RTP
tweezers or pliers to avoid injuries. When transporting the accessories, always
use the box supplied with the probe.
●
Prevent the probe from receiving mechanical shock. Avoid putting excessive
strain on the probe cable or exposing it to sharp bends. Touching a broken
cable during measurements can cause injuries.
●
Set up all probe connections to the instrument before applying power.
Working with hazardous voltages
Voltages higher than 30 V RMS, or 42 V peak, or 60 V DC are regarded as hazardous contact voltages. Direct contact with them can cause serious injuries.
Make sure that only electrically skilled persons use the products for measurements on hazardous contact voltages. These working conditions require special
education and experience to perceive risks and to avoid hazards which electricity
can create.
Safety and regulatory information
Safety instructions
When working with hazardous contact voltages, use protective measures to preclude direct contact with the measurement setup:
●
Do not touch exposed connections and components when power is applied.
●
Switch off the test circuit while connecting and disconnecting probe leads.
●
Use only insulated voltage probes, test leads and adapters.
●
Make sure that the input leads fulfill the safety requirements for your measurement.
The delivered input leads might have a jacket wear indicator that indicates a
worn jacket by different jacket color. In this case, do not use the input lead.
Replace it with a new one.
●
Do not use 4 mm banana plugs without protection against contact.
Working with current probes
When working with current probes, you can measure high-frequency currents or
currents that contain high-frequency components.
●
Switch off the test circuit while connecting the probe.
●
Do not attach the clamp to bare unisolated conductors. To avoid injury from a
short circuit, measure at a location on an insulated wire where the insulation is
sufficient for the circuit voltage.
●
Connect the probe only to the secondary side of a breaker. With this measure,
you avoid injury, if a short circuit occurs.
9Getting Started 1337.9946.02 ─ 07

R&S®RTP
●
The following effects can cause burns and fire or damage to the measurement
site:
– Eddy current loss can cause heating of the sensor head.
– Dielectric heating can cause heating of cord insulation and other materials.
Measurement categories
IEC 61010-2-030 defines measurement categories that rate instruments on their
ability to resist short transient overvoltages that occur in addition to the working
voltage. Use the measurement setup only in electrical environments for which
they are rated.
●
0 - Instruments without rated measurement category
For measurements performed on circuits not directly connected to mains, for
example, electronics, circuits powered by batteries, and specially protected
secondary circuits. This measurement category is also known as CAT I.
Safety and regulatory information
Safety instructions
●
CAT II:
For measurements performed on circuits directly connected to the low-voltage
installation by a standard socket outlet, for example, household appliances
and portable tools.
●
CAT III:
For measurements performed in the building installation, such as junction
boxes, circuit breakers, distribution boards, and equipment with permanent
connection to the fixed installation.
●
CAT IV:
For measurements performed at the source of the low-voltage installation,
such as electricity meters and primary overcurrent protection devices.
10Getting Started 1337.9946.02 ─ 07

R&S®RTP
Safety and regulatory information
Labels on the product
Cleaning the product
Use a dry, lint-free cloth to clean the product. When cleaning, keep in mind that
the casing is not waterproof. Do not use liquid cleaning agents.
Meaning of safety labels
Safety labels on the product warn against potential hazards.
Potential hazard
Read the product documentation to avoid personal injury or product damage.
Heavy product
Be careful when lifting, moving or carrying the product. Carrying the product requires
at least two people or transport equipment.
Electrical hazard
Indicates live parts. Risk of electric shock, fire, personal injury or even death.
Protective conductor terminal
Connect this terminal to a grounded external conductor or to protective ground. This
protects you against electric shock should an electric problem occur.
1.2 Labels on the product
Labels on the casing inform about:
●
Personal safety, see "Meaning of safety labels" on page 11
●
Product and environment safety, see Table 1-1
●
Identification of the product
Table 1-1: Labels regarding product and environment safety
Chassis grounding terminal
Take care when handling electrostatic sensitive devices.
Labeling in line with EN 50419 for disposal of electrical and electronic equipment after
the product has come to the end of its service life.
For more information, see the product user manual, chapter "Disposal".
11Getting Started 1337.9946.02 ─ 07

R&S®RTP
Safety and regulatory information
Korea certification class A
1.3 Warning messages in the documentation
A warning message points out a risk or danger that you need to be aware of. The
signal word indicates the severity of the safety hazard and how likely it will occur
if you do not follow the safety precautions.
WARNING
Potentially hazardous situation. Could result in death or serious injury if not avoided.
CAUTION
Potentially hazardous situation. Could result in minor or moderate injury if not
avoided.
NOTICE
Potential risks of damage. Could result in damage to the supported product or to
other property.
1.4 Korea certification class A
이 기기는 업무용(A급) 전자파 적합기기로서 판매자 또는 사용자는 이 점을 주의하
시기 바라며, 가정외의 지역에서 사용하는 것을 목적으로 합니다.
12Getting Started 1337.9946.02 ─ 07

R&S®RTP
Key Features
2 Key Features
The R&S RTP high-performance oscilloscopes combine superior signal integrity
with fastest acquisition rate. It combines multiple instrument capabilities for timecorrelated debugging in one box. Outstanding key features are:
Real-time signal integrity
●
Superior frontend performance
●
Real-time de-embedding and advanced triggering
●
Hardware accelerated processing for faster results
●
Comprehensive analysis tools, for example, powerful protocol analysis, jitter
analysis functions, automatic compliance tests, spectrograms, and precise
and wideband RF analysis
Multiple instrument capability
●
Time-correlated analysis of different signal types
●
Easy-to-use serial protocol analysis for various protocols used in embedded
design, mobile communications and more
●
General purpose mixed signal option
●
Multi-channel power consumption analysis with up to 8 additional voltage and
8 additional current measurement channels and very high dynamic range
Compact and configurable
●
Most compact high-end instrument platform
●
Highest configuration flexibility
●
Advanced user interface
For a detailed specification, refer to the data sheet.
13Getting Started 1337.9946.02 ─ 07

R&S®RTP
Documentation overview
Manuals and instrument help
3 Documentation overview
This section provides an overview of the R&S RTP user documentation.
3.1 Manuals and instrument help
You find the manuals on the product page at:
www.rohde-schwarz.com/manual/rtp
Getting started manual
Introduces the R&S RTP and describes how to set up and start working with the
instrument, and describes basic operations. A printed English version is included
in the delivery. Editions in other languages are available on the product website.
Instrument help
The help offers quick, context-sensitive access to the complete information for the
firmware basic functionality and applications.
User manual (Instrument)
Describes all instrument functions in detail. It also provides an introduction to
remote control, a complete description of the remote control commands with programming examples, and information on maintenance and instrument interfaces.
Includes the contents of the getting started manual.
The online version of the user manual provides the complete contents for immediate display on the internet.
Manuals for compliance test options
For compliance test options, extra test procedure manuals are available. Test fixtures are described in printed manuals, which are delivered with the fixture.
●
The following test procedure manuals are available:
– USB 2.0 Compliance Test Procedures
– Ethernet Compliance Tests Procedures
– MIPI D-PHY Compliance Tests Procedures
14Getting Started 1337.9946.02 ─ 07

R&S®RTP
– PCIe Compliance Tests Procedures
– DDR3 Compliance Tests Procedures
– DDR4 Compliance Tests Procedures
– ScopeSuite Automation
●
The following test fixture manuals are available:
– R&S RT-ZF1 USB 2.0 Compliance Test Fixture Set
– R&S RT-ZF2 Ethernet Compliance Test Fixture Set
– R&S RT-ZF3 Frequency Converter Board (100BASE-T1)
– R&S RT-ZF4 10BASE-Te Test Fixture
– R&S RT-ZF5 Ethernet Probing Fixture
– R&S RT-ZF6 Frequency Converter Board (1000BASE-T1)
– R&S RT-ZF7 Automotive Ethernet T&D Fixture
– R&S RT-ZF7A SMA Adaptor
Documentation overview
Data sheet and brochure
– R&S RT-ZF8 Automotive Ethernet Compliance Test Fixture
Safety instructions
Provides safety information in many languages. The printed document is delivered with the product.
Instrument security procedures manual
Deals with security issues when working with the R&S RTP in secure areas.
Service Manual
Describes the performance test for checking the rated specifications, module
replacement, firmware update, troubleshooting and fault elimination, and contains
mechanical drawings and spare part lists. The service manual is available for registered users on the global Rohde & Schwarz information system (GLORIS,
https://gloris.rohde-schwarz.com).
3.2 Data sheet and brochure
The data sheet contains the technical specifications of the R&S RTP. It also lists
the options with their order numbers and optional accessories. The brochure provides an overview of the instrument and deals with the specific characteristics.
15Getting Started 1337.9946.02 ─ 07

R&S®RTP
Application notes, application cards, videos
See www.rohde-schwarz.com/brochure-datasheet/rtp
Documentation overview
3.3 Release notes, open source acknowledgment
The release notes list new features, improvements and known issues of the current firmware version, and describe the firmware installation. The open source
acknowledgment document provides verbatim license texts of the used open
source software. It can also be read directly on the instrument.
See www.rohde-schwarz.com/firmware/rtp.
3.4 Application notes, application cards, videos
These documents deal with special applications or background information on
particular topics.
See www.rohde-schwarz.com/application/rtp and Oscilloscopes Application Vid-
eos - Media Center
16Getting Started 1337.9946.02 ─ 07

R&S®RTP
Choosing the operating site
Preparing for use
4 Preparing for use
Here, you can find basic information about setting up the instrument for the first
time or when changing the operating site.
4.1 Lifting and carrying
See: "Lifting and carrying the instrument" on page 6.
4.2 Unpacking and checking
1. Unpack the product carefully.
2. Retain the original packing material. Use it when transporting or shipping the
product later.
3. Using the delivery notes, check the equipment for completeness.
4. Check the equipment for damage.
If the delivery is incomplete or equipment is damaged, contact
Rohde & Schwarz.
4.3 Choosing the operating site
Specific operating conditions ensure proper operation and avoid damage to the
product and connected devices. For information on environmental conditions
such as ambient temperature and humidity, see the data sheet.
See also "Choosing the operating site" on page 6.
17Getting Started 1337.9946.02 ─ 07

R&S®RTP
Electromagnetic compatibility classes
The electromagnetic compatibility (EMC) class indicates where you can operate
the product. The EMC class of the product is given in the data sheet under "General data".
●
Class B equipment is suitable for use in:
– Residential environments
– Environments that are directly connected to a low-voltage supply network
that supplies residential buildings
●
Class A equipment is intended for use in industrial environments. It can cause
radio disturbances in residential environments due to possible conducted and
radiated disturbances. It is therefore not suitable for class B environments.
If class A equipment causes radio disturbances, take appropriate measures to
eliminate them.
Preparing for use
Setting up the product
4.4 Setting up the product
When setting up the instrument, follow the safety instructions:
●
"Setting up the product" on page 7
●
"Intended use" on page 5
4.4.1 Placing the product on a bench top
For standalone operation, place the instrument on a horizontal bench with even,
flat surface. The instrument can be used in horizontal position, standing on its
feet, or with the support feet on the bottom extended.
To place the product on a bench top
1. Place the product on a stable, flat and level surface. Ensure that the surface
can support the weight of the product. For information on the weight, see the
data sheet.
2. CAUTION! Foldable feet can collapse. See "Setting up the product"
on page 7.
Always fold the feet completely in or out. With folded-out feet, do not place
anything on top or underneath.
18Getting Started 1337.9946.02 ─ 07

R&S®RTP
3. CAUTION! The product can fall over and cause injury. The top surface is too
small for stacking. Never stack another product on top of the product.
As an alternative, you can mount several products in a rack.
4. NOTICE! Overheating can damage the product.
Prevent overheating as follows:
● Keep a minimum distance of 10 cm between the fan openings of the prod-
uct and any object in the vicinity.
● Do not place the product next to heat-generating equipment such as radia-
tors or other products.
Preparing for use
Setting up the product
4.4.2 Mounting the product in a rack
The instrument can be installed in a rack using a rack adapter kit. The order number is given in the data sheet. The installation instructions are part of the adapter
kit.
To prepare the rack
1. Observe the requirements and instructions in "Setting up the product"
on page 7.
2. NOTICE! Insufficient airflow can cause overheating and damage the product.
Design and implement an efficient ventilation concept for the rack.
To mount the R&S RTP in a rack
1. Use an adapter kit that fits the dimensions of the R&S RTP to prepare the
instrument for rack mounting. For information on the dimensions, see data
sheet.
a) Order the rack adapter kit designed for the R&S RTP. For the order num-
ber, see data sheet.
19Getting Started 1337.9946.02 ─ 07

R&S®RTP
Considerations for test setup
b) Mount the adapter kit. Follow the assembly instructions provided with the
adapter kit.
2. Push the product onto the shelf until the rack brackets fit closely to the rack.
3. Tighten all screws at the rack brackets with a tightening torque of 1.2 Nm to
secure the product at the rack.
To unmount the product from a rack
1. Loosen the screws at the rack brackets.
2. Remove the product from the rack.
3. If placing the product on a bench top again, unmount the adapter kit from the
product. Follow the instructions provided with the adapter kit.
Preparing for use
4.5 Considerations for test setup
Observe safety instructions, see "Performing measurements" on page 8.
Cable selection and electromagnetic interference (EMI)
Electromagnetic interference (EMI) can affect the measurement results.
To suppress electromagnetic radiation during operation:
●
Use high-quality shielded cables, for example, double-shielded RF and LAN
cables.
●
Always terminate open cable ends.
●
Ensure that connected external devices comply with EMC regulations.
Signal input and output levels
Information on signal levels is provided in the data sheet. Keep the signal levels
within the specified ranges to avoid damage to the product and connected devices.
Preventing electrostatic discharge (ESD)
Electrostatic discharge is most likely to occur when you connect or disconnect a
DUT.
20Getting Started 1337.9946.02 ─ 07

R&S®RTP
► NOTICE! Risk of electrostatic discharge. Electrostatic discharge can damage
the electronic components of the product and the device under test (DUT).
Ground yourself to prevent electrostatic discharge damage:
a) Use a wrist strap and cord to connect yourself to ground.
b) Use a conductive floor mat and heel strap combination.
During operation, if the firmware observes a serious unexpected disturbance (e.g.
due to ESD), it resets some hardware components and initiates a new alignment
to ensure proper instrument functioning. Then it restores the user settings to the
state before the disturbance.
Preparing for use
Connecting to power
4.6 Connecting to power
For safety information, see "Connecting to power and grounding" on page 7.
The R&S RTP can be used with different AC power voltages and adapts itself
automatically to it.
The instrument has a C20 connector. A list of appropriate power cables is given in
the user manual. Refer to the data sheet for the requirements of voltage and frequency.
The nominal ranges are:
●
100 V to 240 V AC at 50 Hz to 60 Hz, and 100 V to 130 V at 400 Hz, with
maximal 10% voltage fluctuation on line
●
max. 13 A to 4.7 A
1. Plug the AC power cable into the AC power connector on the rear panel of the
product. Only use the AC power cable delivered with the product.
2. Plug the AC power cable into a power outlet with ground contact.
The required ratings are listed next to the AC power connector and in the data
sheet.
21Getting Started 1337.9946.02 ─ 07

R&S®RTP
Preparing for use
Switching on or off
4.7 Switching on or off
The instrument is switched on or off with the power switch and the [Power] key.
The [Power] key is located in the bottom left corner of the front panel. The power
switch is located at the rear panel of the instrument.
Table 4-1: Overview of power states
Status LED Power switch
Off
Standby
Ready
(unlighted)
orange
green
[0] (off)
[I] (on)
[I] (on)
To switch on the product
The product is off but connected to power.
1. Set the switch on the power supply to position [I].
The power key on the front panel lights up.
2. Press the [Power] key on the front panel.
The instrument performs a system check, boots the operating system, and
then starts the R&S RTP firmware.
The [Power] key turns green and the illuminated keys on the front panel light
up. If the previous session was terminated regularly, the oscilloscope uses the
last settings.
Before you start measurements, be sure to comply with the warm-up phase
specified in the data sheet.
To shut down the product
The product is in the ready state.
► Press the [Power] key.
All current settings are saved, and the software shuts down. The [Power] key
turns orange. The standby power supplies only the power switch circuits.
The
"Exit" icon in the "Menu" shuts down only the firmware application. To shut
down the instrument completely, use the [Power] key.
22Getting Started 1337.9946.02 ─ 07

R&S®RTP
Connecting external devices
To disconnect from power
The product is in the standby state.
1. NOTICE! Risk of data loss. If you disconnect the product from power when it
is in the ready state, you can lose settings and data. Shut it down first.
Set the switch on the power supply to position [0].
The LED of the [Power] key is switched off.
2. Disconnect the product from the power source.
Preparing for use
4.8 Connecting external devices
The following interfaces for external devices are provided:
●
USB connectors at the front and rear panel of the instrument
●
Monitor connectors DVI-D and DisplayPort at the rear panel of the instrument
● Connecting USB devices................................................................................ 23
● Connecting an external monitor...................................................................... 25
4.8.1 Connecting USB devices
The USB interfaces on the front and rear panels allow you to connect USB devices directly to the instrument. The number of USB connectors can be increased
by using USB hubs. Due to the large number of available USB devices, there is
almost no limit to the expansions that are possible with the R&S RTP.
The following USB devices can be useful, for example:
●
USB flash drives to save screenshots and measurement results, and for easy
installation of firmware applications
●
Keyboard and/or mouse to simplify the operation and the entry of data, comments, filenames, etc.
You can connect or disconnect all USB devices during operation of the instrument.
Installing USB devices on R&S RTP is easy under the Windows operating system, because all USB devices are plug&play. After a device is connected to the
USB interface, Windows automatically searches for a suitable device driver.
23Getting Started 1337.9946.02 ─ 07

R&S®RTP
Connecting external devices
If the operating system does not find a suitable driver, it prompts you to specify a
directory that contains the driver software. If the driver software is on a storage
media, connect the appropriate drive to the instrument before proceeding. If the
instrument is integrated in a network, you can also install driver data stored in a
network directory.
When a USB device is disconnected from the R&S RTP, Windows immediately
detects the change in hardware configuration and deactivates the corresponding
driver.
The properties of external USB devices are configured in the operating system,
not in the R&S RTP software. It is recommended that you use mouse and keyboard to access and modify the settings of the Windows operating system.
To access Windows, press the Windows key on the external keyboard, or select
"Menu" > "Minimize Application" on the R&S RTP menu.
Preparing for use
Connecting a USB flash drive
If the installation of a USB flash drive is successful, Windows informs you that the
device is ready to use. The device is made available as a new drive ("D:") and is
displayed in Windows Explorer. The name of the drive depends on the manufacturer.
Connecting a keyboard
The keyboard is detected automatically when it is connected. The default input
language is English – US.
To configure the keyboard properties:
1. Tap the "Find" icon (magnifier) on the Windows taskbar.
2. Type keybord.
3. Select "Edit language and keyboard options".
Connecting a mouse
The mouse is detected automatically when it is connected. To configure the
mouse properties:
1. Tap the "Find" icon (magnifier) on the Windows taskbar.
2. Type mouse.
24Getting Started 1337.9946.02 ─ 07

R&S®RTP
Connecting external devices
3. Select "Mouse settings".
Preparing for use
4.8.2 Connecting an external monitor
You can connect an external monitor or projector to the R&S RTP. The following
connectors are available:
●
"DVI-D" on page 30
●
"DisplayPort" on page 31
Before connecting an external monitor, ensure that the monitor and the R&S RTP
are connected to a ground contact. Otherwise the instrument can be damaged.
After connecting an additional monitor or projector to the instrument, configure it
for usage. The relevant settings are Windows settings but you can configure the
displays directly in the instrument setup.
1. Check the input type of the monitor or projector. Make sure to select the correct cable. To use a VGA monitor, you need an active DVI-D to VGA adapter.
2. Open "Menu" > "Settings" > "Display".
3. Select the "Monitors" tab.
4. Select how to display the screen.
5. To access Windows display settings, tap "Additional settings".
The touchscreen of the R&S RTP has a screen resolution of 1280 x 800 pixel.
Many external monitors have a higher screen resolution. If the screen resolution
of the monitor is set higher than the instrument's resolution, the application window uses a 1280 x 800 area of the monitor display. For full screen display, adjust
the monitor's screen resolution using "Additional display settings".
25Getting Started 1337.9946.02 ─ 07

R&S®RTP
Instrument tour
Front panel
5 Instrument tour
This chapter describes the front and rear panels of the instrument including all
function keys and connectors.
5.1 Front panel
This section provides an overview of the R&S RTP front panel and explains the
various connectors and the option slots at the front.
Figure 5-1: Front panel of R&S RTP
1 = Touchscreen
2 = Setup controls
3 = Horizontal controls
4 = Trigger controls
5 = Analysis keys
26Getting Started 1337.9946.02 ─ 07

R&S®RTP
Instrument tour
Front panel
6 = Navigation controls
7 = External trigger input
8 = Vertical controls
9 = Input channels
10 = Two option slots for R&S RTP-B1 (MSO) or R&S RTP-B1E (for R&S RT-ZVC) , R&S RTP-
B6 (waveform generator), R&S RTP-B7 (pulse source)
11 = USB connectors
12 = Connectors for probe compensation and grounding
13 = [Power] key
The keys and controls are described in Chapter 5.3, "Keys and controls",
on page 32.
5.1.1 Connectors
Channel inputs and external trigger input
The R&S RTP has four channel inputs to connect the input signals, and an external trigger input to control the measurement by an external signal.
The input connectors are provided with a special Rohde & Schwarz active probe
interface, and they are BNC compatible. Thus, the instrument can automatically
detect active probes that have the Rohde & Schwarz probe interface.
The maximum input voltage on channel inputs and the external trigger input is
5 V peak. The input impedance of the inputs is 50 Ω.
USB
Two USB type A connectors that comply with standard USB 3.1 gen 1. They are
used to connect devices like keyboard, mouse and USB flash drive.
Note: Electromagnetic interference (EMI) can affect the measurement results. To
avoid any impact, do not use USB connecting cables exceeding 1 m.
Probe Compensation
Probe compensation terminal to support adjustment of passive probes to the
oscilloscope channel.
Protective earth conductor, 4 mm banana jack to connect
ground of DUT and test fixtures, and wrist strap.
27Getting Started 1337.9946.02 ─ 07

R&S®RTP
Square wave signal for probe compensation, 1 kHz and 1 Vpp.
Ground connector for probes.
Instrument tour
Front panel
5.1.2 Option slots
Three options R&S RTP-B1/B6/B7 can be installed in one R&S RTP - two at the
front panel, and one at the rear panel. Each option can be installed only once,
and the slot assignment depends on the available options. To ensure correct
installation and calibration, installation is done only at Rohde & Schwarz service
centers.
Mixed signal option R&S RTP-B1 / digital extension port R&S RTP-B1E
The mixed signal option R&S RTP-B1 provides logic analizer functionality and 16
digital channels. It also can connect the R&S RT-ZVC multi-channel power probe.
The connectors are used to connect two logical probes with 8 digital channels
each (D0 to D7 and D8 to D15), or two flat interface cables of R&S RT-ZVC.
The digital extension port R&S RTP-B1E provides the connectors for the
R&S RT-ZVC multi-channel power probe without MSO. The connectors are used
to connect two flat interface cables of R&S RT-ZVC.
One of the options can be installed in one of option slots at the front panel, or in
the option slot at the rear panel.
The maximum input voltage is 40 V peak at 100 kΩ input impedance. The maximum input frequency for a signal with the minimum input voltage swing of
500 mV (Vpp) is 400 MHz. For detailed specifications, refer to the data sheet.
Waveform generator option R&S RTP-B6
The waveform generator generates various function and arbitrary waveforms,
sweeps, and parallel patterns. For detailed specifications, refer to the data sheet.
The option can be installed in one of option slots at the front panel.
The module provides the following connectors:
[Gen1, Gen2] BNC connectors
[PattGen] Connector for the pattern generator
Pulse source option R&S RTP-B7
The pulse source outputs a symmetrical differential pulse signal. For detailed
specifications, refer to the data sheet.
The option can be installed in one of option slots at the front panel.
28Getting Started 1337.9946.02 ─ 07

R&S®RTP
Instrument tour
Rear panel
The module has four connectors.
●
Out, : 2.92 mm connectors (K type) for pulse signal output
●
Ref,
: 2.92 mm connectors (K type) for reference signal output
5.2 Rear panel
This section explains the rear panel of the R&S RTP, including the various connectors and the option slot.
Figure 5-2: Rear panel of R&S RTP
1 = AC power supply connector and main power switch
2 = USB device connector, type B
3 = USB connectors, type A
4 = LAN connector
5 = DVI-D connector for external monitor
29Getting Started 1337.9946.02 ─ 07

R&S®RTP
Instrument tour
Rear panel
6 = DisplayPort connector
7 = GPIB connector
8 = Exchangeable solid state disk (SSD, option R&S RTP-B18)
9 = Aux Out connector
10 = External trigger output
11 = Ref In, Ref Out: reference input, and output of the OCXO reference signal
12 = Digital data interface (DDI, optional)
13 = Option slot
14 = Kensington lock slot to secure the instrument against theft
AC power supply connector and main power switch
Connection to the AC power line. The R&S RTP can be used with different AC
power voltages and adapts itself automatically to it. The nominal voltage and frequency ranges are displayed on the rear panel and quoted in the data sheet.
If grounding is not ensured by the mains system, ground the oscilloscope using
the protective earth conductor on the front panel and an appropriate cable.
The AC main power switch also interrupts the power supply of the OCXO.
When you power up the instrument, be sure to comply with the warm-up phase
specified in the data sheet before you start measurements.
USB Device
USB 3.0 interface of type B (device USB), to be used for remote control of the
instrument.
USB
Four USB type A connectors. Two connectors comply with standard USB 3.1 gen
1, and the other two with standard USB 2.0. They are used to connect devices
like keyboard, mouse and flash drive to store and reload instrument settings and
measurement data.
Note: Electromagnetic interference (EMI) can affect the measurement results. To
avoid any impact, do not use USB connecting cables exceeding 1 m.
LAN
8-pin RJ-45 connector used to connect the instrument to a Local Area Network
(LAN). It supports up to 1000 Mbit/s (10/100/1000BASE-T Ethernet).
DVI-D
Digital connector for an external monitor or projector. The monitor shows the complete content of the instrument's screen.
30Getting Started 1337.9946.02 ─ 07

R&S®RTP
DisplayPort
DisplayPort connector for an external monitor or projector. It supports DisplayPort
version 1.1a.
GBIP
Connector with GBIP interface. For detailed specifications, refer to the data sheet.
Aux Out
Output of the internal calibration signal, if the signal is configured to external destination.
Trigger Out
The BNC connector for external trigger output is used to provide the internal trigger signal of the oscilloscope to trigger other instruments for synchronized measurements.
When a trigger occurs, the R&S RTP creates a pulse of 5 V with a source impedance of 50 Ω and delivers it to the external trigger output. The instrument can
also send the pulse on mask test violation or violation of measurement limits and
margins.
Instrument tour
Rear panel
If the connector is terminated with 50 Ω, the signal level is 2.5 V (50 mA). With
1 MΩ termination, the level is 5 V. A short-circuit of the connector to ground creates current of 100 mA.
To enable the trigger out signal, select "Trigger" menu > "Ctrl/Action". Here you
also adjust polarity, delay, and length of the pulse. The default is a positive pulse
of 100 ns. The minimum delay is 800 ns.
Ref In, Ref Out
BNC connectors for input of a reference signal, and for output of the OCXO reference signal.
The input frequency ranges from 1 MHz to 20 MHz in 1 MHz steps. The input
impedance is 50 Ω.
The output frequency of the OCXO is 10 MHz, the impedance is 50 Ω. For
detailed specifications, refer to the data sheet.
DDI 40G
Optional digital data interface for input and output of digital data.
31Getting Started 1337.9946.02 ─ 07

R&S®RTP
Option slot
Slot to install one of the options R&S RTP-B1 (MSO) or R&S RTP-B1E (for
R&S RT-ZVC) if both slots at the front panel are used for other options. To install
the option, the R&S RTP-B21 slot adapter is required. The options and their connectors are briefly described in Chapter 5.1, "Front panel", on page 26.
Instrument tour
Keys and controls
5.3 Keys and controls
5.3.1 Power key
The [Power] key is located on the lower left corner of the front panel. It starts up
and shuts down the instrument's software.
The light of the key shows the instrument state:
●
Standby, the main power switch is on, the software is shut down: orange.
●
The instrument is ready for operation: green.
See also: Chapter 4.7, "Switching on or off", on page 22.
5.3.2 Setup controls
Setup keys set the instrument to a defined state, change basic settings, and provide saving and help functions. The intensity rotary knob adjusts the display contrast for several display elements.
[Autoset]
The instrument analyzes the enabled channel signals, and adjusts appropriate
horizontal, vertical, and trigger settings to display stable waveforms.
[Preset]
Resets the instrument to a default state. All measurements, mask tests, zoom,
and most individual settings are deleted, and all channels except for channel 1
are disabled. You can define preset configurations and save them to a file. The
[Preset] key can be configured to set either factory defaults or a user-defined preset configuration.
32Getting Started 1337.9946.02 ─ 07

R&S®RTP
[Save Recall]
Opens and closes the "File" dialog box, where you can:
●
Save instrument settings (user settings)
●
Load instrument settings which were saved before
●
Save waveform data and measurement results
●
Define a naming pattern for autonaming of files
[Setup]
Opens and closes the "Setup" dialog box, where you can:
●
Access Windows configuration and install firmware updates
●
Configure the touchscreen
●
Check and install option keys for software options
●
Check availability of hardware options
●
Configure remote settings, LAN settings, and GPIB
Camera
Starts a saving action, or opens a report. By default, the key saves a screenshot
of the waveform display. You can assign the function to the key.
Instrument tour
Keys and controls
Quick Action
Starts an external application, opens the graphical recall, or deletes the all measurement results, waveforms, and the history. The function is assigned to the key
in "File" menu > "Frontpanel Setup" > "Hardkeys". By default, the key opens the
setup dialog box.
[Help]
Opens the appropriate help topic for the active tab. If no dialog box is open, the
contents page of the help appears.
[Display]
Opens and closes the "Display" dialog box to configure the appearance of the
waveforms, the diagram layout, color tables, and the XY-diagram. You can also
assign name labels to the waveforms.
[Touch Lock]
Locks the touchscreen to prevent unintended use. When the touchscreen is off,
the key is illuminated. Press again to unlock the touchscreen.
33Getting Started 1337.9946.02 ─ 07
R&S®RTP
[Intensity]
Adjusts the intensity of the waveforms on the screen, or the background transparency of dialog boxes, or the transparency of result boxes. If a dialog box is open,
turning the knob changes the transparency of dialog boxes. If a result box is
open, the transparency of result boxes is changed. Otherwise the waveform
intensity is adjusted. Press the knob to toggle between the three settings. The
controlled parameter and its value are shown in the input box in the lower right
corner of the screen.
Instrument tour
Keys and controls
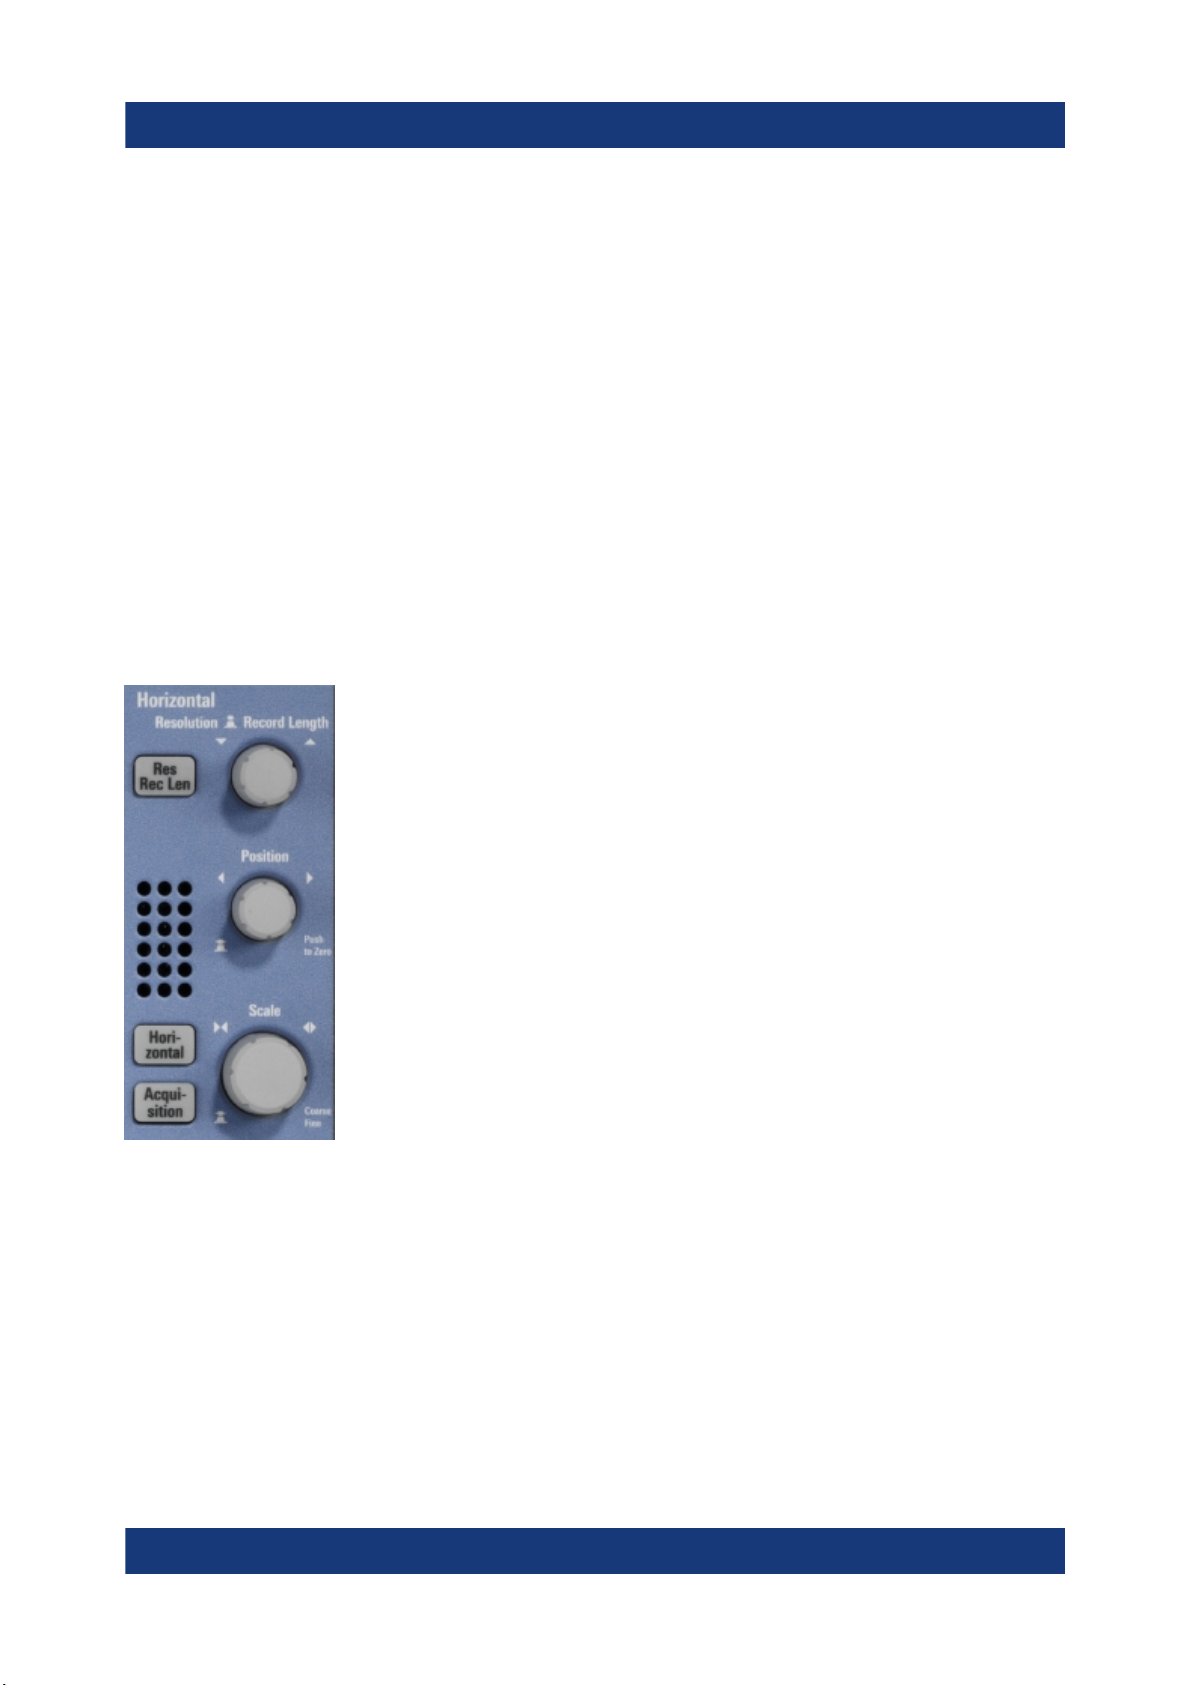
5.3.3 Horizontal controls
The keys and rotary knobs in the Horizontal functional block adjust the acquisition
settings and horizontal parameters. These settings are effective for all channel
waveforms.
[Res Rec Len], [Horizontal]
Open and close the "Setup" tab in the "Horizontal" dialog box, where you can:
●
Adjust the time scale, and acquisition time
●
Adjust the horizontal position, and reference point
●
Adjust the resolution and the record length
●
Enable the roll mode
34Getting Started 1337.9946.02 ─ 07

R&S®RTP
[Acquisition]
Opens and closes the "Acquisition" tab in the "Horizontal" dialog box, where you
can define the acquisition processing (acquisition mode and waveform arithmetic).
[Resolution / Record Length]
The rotary knob changes the resolution or the record length. Press the knob to
toggle the setting. The controlled parameter and its value are shown in the input
box in the lower right corner of the screen.
For resolution, turn clockwise to increase the resolution: the time between two
acquisition points gets shorter. Record length and sample rate increase while the
acquisition time remains constant.
For record length, turn clockwise to increase the record length, and the resolution
increases too - the time between to acquisition points gets shorter.
Instrument tour
Keys and controls
[Position]
The rotary knob changes the horizontal position of the waveform or the position of
the reference point on the screen.
You can select if the knob changes the position or the reference point in "File"
menu > "Frontpanel Setup" > "Knobs". To set the value to zero, press the knob.
The current value is shown in the input box in the lower right corner of the screen.
"Horizontal position" defines the time distance of the reference point from the zero
point of the diagram. Turn clockwise to move the waveform to the right.
"Reference point" defines the position of the reference point on the screen. Turn
clockwise to move it to the right. The reference point marks the rescaling center
of the time scale. It is indicated by a gray triangle outline at the top of the diagram. If you modify the time scale, the reference point remains fixed on the
screen, and the scale is stretched or compressed to both sides of the reference
point.
[Scale]
The rotary knob adjusts the time scale for all signals. The time scale is also
known as timebase.
Turn clockwise to stretch the waveforms. Doing so, the scale value time/div
decreases.
Press the knob to toggle between coarse and fine scale adjustment.
35Getting Started 1337.9946.02 ─ 07
R&S®RTP
Instrument tour
Keys and controls
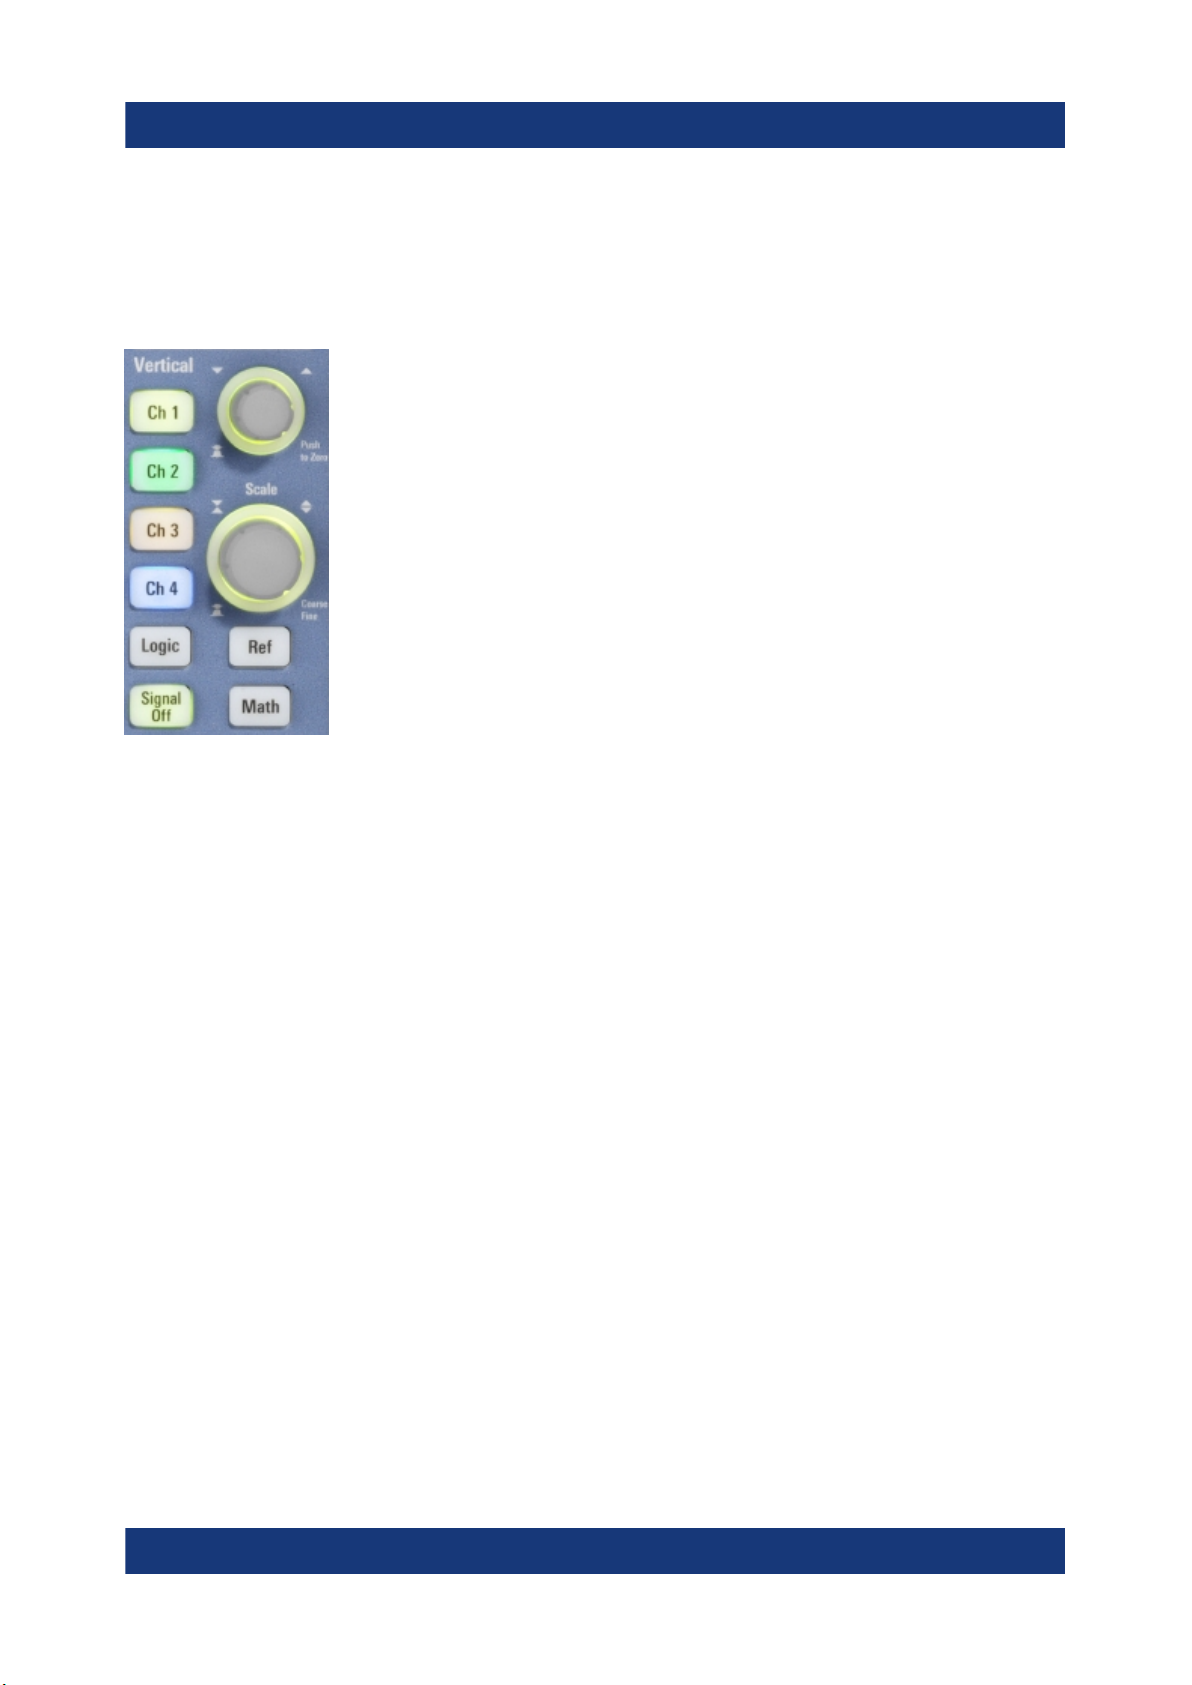
5.3.4 Vertical controls
The keys and knobs in the Vertical functional block select a signal and adjust the
vertical scale and position of the selected signal.
[Ch <n>]
Turns on, selects, and configures a channel. If the channel is active, the key lights
up in the corresponding channel color .
The effect of the keypress depends on state of the channel:
●
If channel is off: Pressing the key turns on the channel and selects it.
●
If the channel is on, but not selected: Pressing the key selects the channel
waveform.
●
If the waveform is selected: Pressing the key opens the "Vertical" dialog box
for the appropriate channel.
The vertical rotary knobs are focused on the selected waveform. They are illuminated in the color of the selected waveform.
[Logic]
Opens the dialog box for configuration of parallel buses and digital channels. The
key lights up if you enable at least one parallel bus. You can switch off the
selected bus using the [Signal Off] key.
[Ref]
Opens the "Reference" dialog box, where you can configure and display reference waveforms. Press the key repeatedly to switch the reference waveform.
If a reference waveform is selected, the vertical rotary knobs are illuminated in
white or light gray (default colors), depending on the selected waveform.
36Getting Started 1337.9946.02 ─ 07

R&S®RTP
[Math]
Opens the "Math" dialog box, where you can configure the calculation of mathematical waveforms using various mathematic operations on other waveforms.
Press the key repeatedly to switch the math waveform.
If a math waveform is selected, the vertical rotary knobs are illuminated in brown
(default color), the brightness of the color depends on the selected waveform.
[Position] (upper knob)
The upper rotary knob changes the vertical position or the offset of the selected
waveform. The horizontal axis and the selected waveform are moved vertically.
The knob lights up in the color of the selected waveform.
You can select if the knob changes the position or the offset in "Menu" > "Settings" > "Frontpanel" > "Knobs" dialog.
●
Position indicates the vertical location in divisions.
●
Offset moves the vertical center of the selected channel to the offset value.
Instrument tour
Keys and controls
[Scale]
This rotary knob adjusts the vertical scale for the selected waveform. The knob
lights up in the color of the selected waveform.
Turn clockwise to stretch the waveform. Doing so, the scale value V/div decreases.
Press the knob to toggle between coarse and fine scale adjustment.
[Signal Off]
Turns off the selected signal and selects the next channel, math, or reference
waveform.
The key is illuminated in the color of the selected signal and changes the color
according to the new selection.
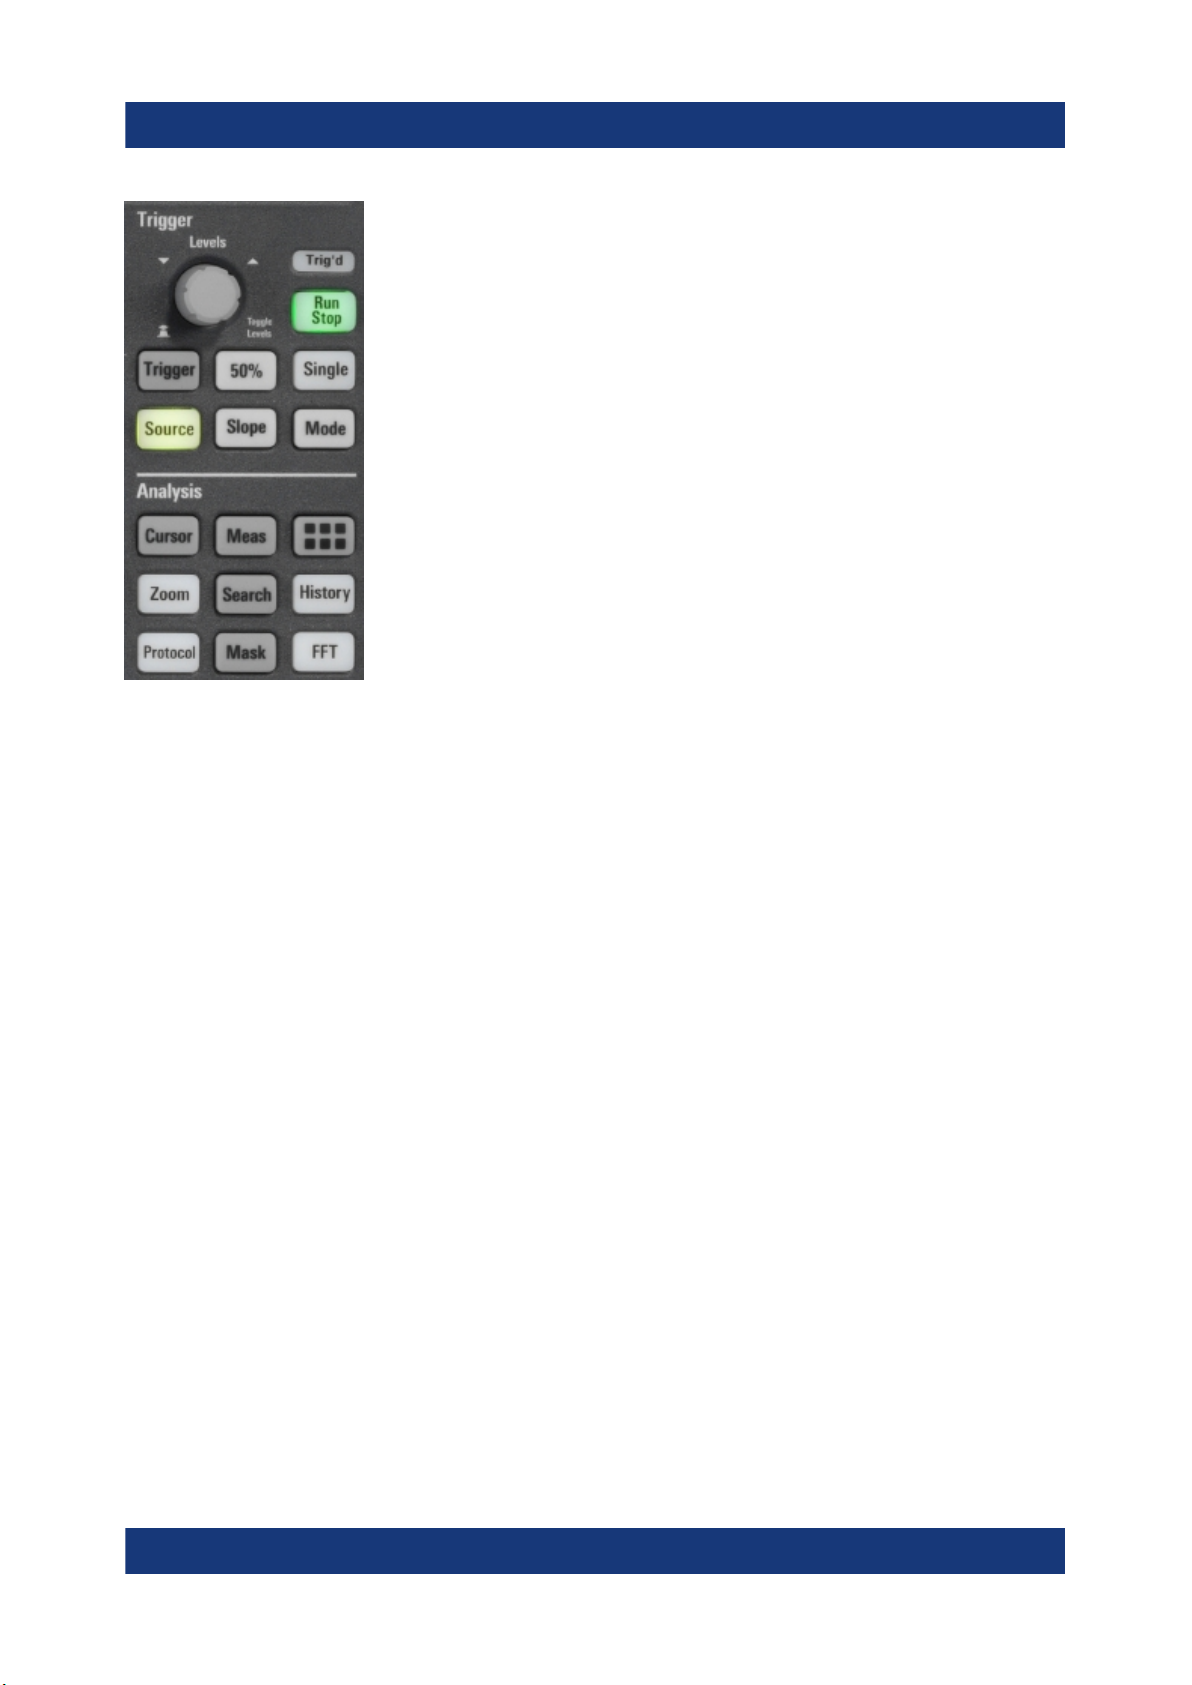
5.3.5 Trigger controls
The keys and knob in the Trigger functional block adjust the trigger and start or
stop acquisition.
37Getting Started 1337.9946.02 ─ 07
R&S®RTP
Instrument tour
Keys and controls
[Trigger]
Opens and closes the "Trigger" dialog box, where you can:
●
Select a trigger type and configure it.
●
Set general trigger parameters and control the acquisition run.
●
Qualify the trigger event with logic patterns.
●
Configure a sequence of subsequent trigger events.
●
Set up the zone trigger if option R&S RTP-K19 is installed.
[Levels]
The rotary knob sets the trigger level for all trigger types. Turn clockwise to move
up the trigger level. If the selected trigger type requires two trigger levels - upper
and lower level - press the knob to toggle between the two levels.
[Source]
Opens a dialog box where you can select the trigger source. Press the key again
to switch the source. The key lights up in the color of the selected trigger source.
[Slope]
Toggles the trigger slope or trigger polarity, dependent on the trigger type. The
current setting is shown on the trigger label, which is in the upper part of the signal bar.
38Getting Started 1337.9946.02 ─ 07

R&S®RTP
[Mode]
Toggles the trigger mode between Auto and Normal. The current setting is shown
on the trigger label.
[Run Stop]
Starts and stops the continuous acquisition. A green light indicates a running
acquisition. A red light shows that acquisition is stopped.
[Single]
Starts a defined number of acquisitions. A green light indicates a running acquisition. A red light shows that acquisition is stopped. Press the key again to stop
running acquisitions.
To set the number of acquisitions, press the [Trigger] key, select the "Ctrl/Action"
tab, and set "Average count (N-single count)".
Instrument tour
Keys and controls
5.3.6 Analysis keys
The keys in the Analysis functional block provide direct access to measurement
and analyzing functions. If you press [Cursor], [Zoom] or [Meas], the action starts
on first keypress, and a second keypress opens the corresponding dialog box. If
you press another function key, the dialog box opens.
[Cursor]
Displays vertical and horizontal cursors in the active diagram and opens the "Cursor Results" box.
Cursors are markers which are placed at points of interest on a waveform. The
instrument measures the cursor positions and delta values between parallel cursors.
If you press the key while a cursor measurement is enabled, the "Cursors" dialog
box opens.
In the "Cursors" dialog box, you can:
●
Configure up to 4 cursor sets
39Getting Started 1337.9946.02 ─ 07

R&S®RTP
●
Define style and labels of the cursors
●
Connect the cursor to the waveform and couple the cursors
[Meas]
Starts the default automatic measurement for the active waveform and opens the
"Measurement" result box.
If you press the [Meas] key while a measurement is enabled, the "Measurements"
dialog box is displayed, where you can:
●
Configure amplitude and time measurements, eye, spectrum, and histogram
measurements
●
Configure gated measurement
●
Configure long term and statistic measurements
●
Configure actions to be executed if specified limits are exceeded
App Cockpit
Opens the "App Cockpit" dialog box, where you can start an application or analysis function directly, without knowing its position in the menu or toolbar.
Instrument tour
Keys and controls
[Zoom]
Displays a zoom diagram for the active diagram. The key is illuminated if at least
one zoom is active. If you press the key while the zoom function is on, the "Zoom"
dialog box opens, where you can configure several zoom areas for detailed signal
observation.
[Protocol]
Opens the "Protocol" dialog box which contains the configuration of serial buses
and the settings for decoding the signals.
The key lights up if the decoding of a serial bus is active. You can switch off the
decoded bus using the [Signal Off] key.
[Search]
Opens and closes the "Search" dialog box, where you can:
●
Configure trigger events to be searched for
●
Limit the search by gating
●
Configure the presentation of search results
[Mask]
Opens and closes the "Masks" dialog box. Masks are used for error detection and
compliance tests of digital signals.
40Getting Started 1337.9946.02 ─ 07
R&S®RTP
You can:
●
Configure masks and masks segments
●
Define mask test parameters
●
Configure actions triggered by mask violation
●
Configure the mask display
[History]
The sample memory contains several stored acquisitions before the current one,
which is shown in the display. Press the key to open the quick access "History"
dialog box, where you can view the stored acquisitions and use them for further
analysis. Press the key again to open the main "History" dialog box with more settings and information.
The key is illuminated as long as a history acquisition or replay is displayed.
[FFT]
Opens and closes the FFT setup.
Instrument tour
Keys and controls
The key lights up if an FFT is active. You can switch off the FFT math waveform
using the [Signal Off] key.
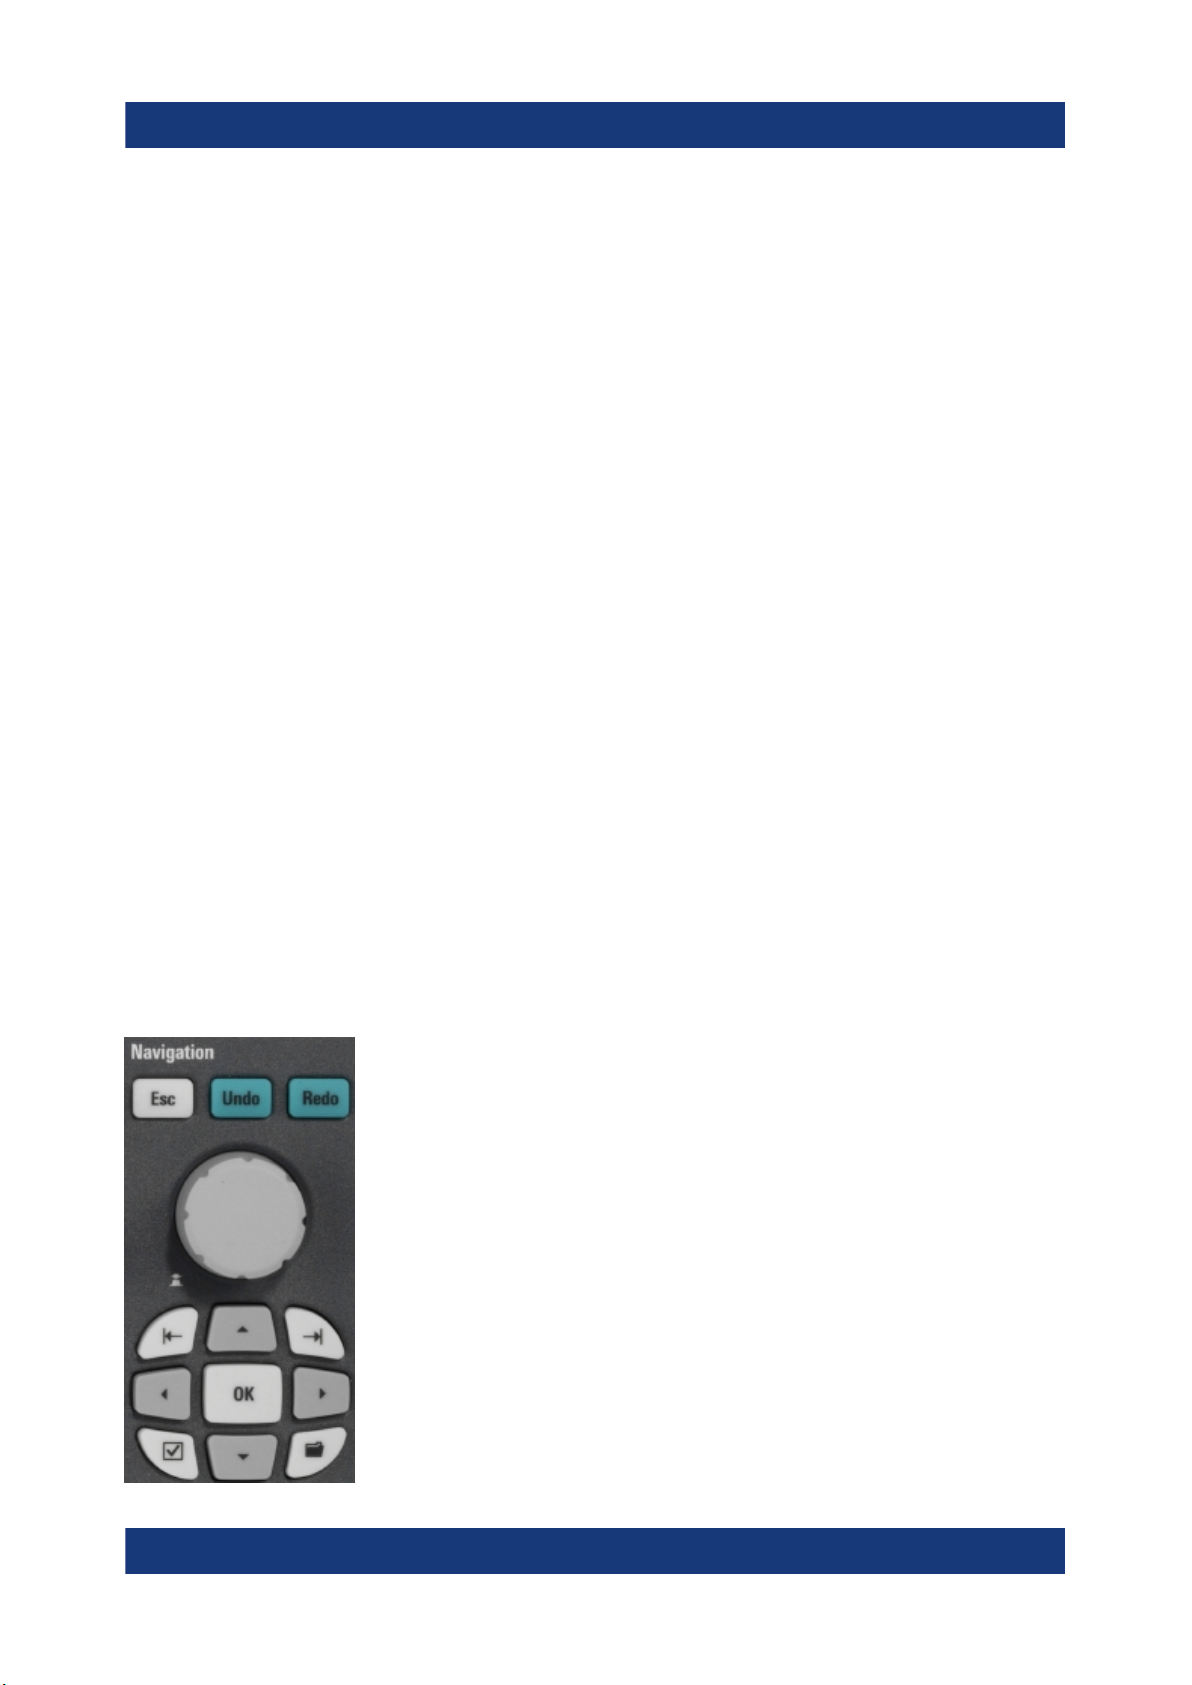
5.3.7 Navigation controls
The rotary knob and the navigation keys provide an alternative way to navigate in
dialog boxes and to enter numeric data.
See also: Chapter 6.8, "Using dialog boxes", on page 68
41Getting Started 1337.9946.02 ─ 07

R&S®RTP
[Navigation] rotary knob
The [Navigation] knob has various functions:
●
In numeric entry fields: turn to increase or decrease the value.
●
In tables: press to activate the edit mode, turn clockwise to increase the value
or turn counterclockwise to decrease it, and press to enter the value and
move to the next cell.
●
To set cursor positions, histogram areas, and mask points in input boxes:
press to toggle the parameter, turn clockwise to increase the value or turn
counterclockwise to decrease it.
●
To move zoom area, cursor line, or gate in diagrams: Turn to move the element that has the focus, and press to toggle the focus.
[Esc]
Closes a dialog box or input box.
[Undo]
Reverses the last setting actions step by step. Undo is not possible after load and
recall actions, and after creating a reference waveform.
Instrument tour
Keys and controls
[Redo]
Recovers the undo steps in reverse order.
[OK]
The [OK] key has various functions:
●
In dialog boxes and opened selection lists: the key applies the selected value.
●
In tables: the key activates the edit mode. If the table cell is in edit mode, the
key confirms the value, quits the edit mode and moves to the next cell.
Field left, Field right
In dialog boxes and tables, the keys move the focus.
In diagrams, they switch the focus between zoom areas, cursor lines, and gates.
Checkmark [☑]
The checkmark key [☑] has different functions depending on the focus:
●
In usual dialog box: if the focus is on a selection list, the key opens the list and
applies the selected value.
●
In tables: activates the edit mode.
Tab
The tab key has various functions:
42Getting Started 1337.9946.02 ─ 07

R&S®RTP
●
In dialog boxes with only horizontal tabs, the key switches the horizontal tabs.
●
In dialog boxes with horizontal and vertical tabs, the key switches the tabthat
has the focus.
●
In a table or diagram, the key moves the focus in the same way as the [▶] key.
Up arrow [▲], Down arrow [▼]
The up and down arrow keys have the following effects:
●
In numeric edit fields: increase or decrease the parameter value.
●
In tables: scroll vertically through the rows.
●
In dialog boxes, for option buttons in a column: select an option. In an open
selection list, the keys scroll the list.
Left arrow [◀], Right arrow [▶]
The left and right arrow keys have the following effects:
●
In edit fields: move the cursor.
●
In tables: scroll horizontally through the columns.
●
In dialog boxes, for option buttons in a row: select an option.
Instrument tour
Keys and controls
43Getting Started 1337.9946.02 ─ 07

R&S®RTP
Operating the instrument
Means of manual interaction
6 Operating the instrument
There are three ways to operate the R&S RTP.
Manual operation
Use the touchscreen, keys and rotary knobs, or an optional mouse and/or keyboard. The principles of manual operation are explained in this section.
Remote control
Create programs to automatize repeating settings, tests, and measurements. The
instrument is connected to a computer that runs the program.
This way of operation is described in the user manual, chapter "Remote Control
Commands".
Remote operation
The remote desktop connection of Windows can be used for instrument control
and file transfer. Even on computers with non-Windows operating systems, a
remote desktop connection is possible using RDP applications.
For details, refer to the user manual, chapter "Remote Desktop Connection".
Remote monitoring and control of the instrument from a connected computer is
also possible with a standard web browser and a LAN connection.
For details, refer to the user manual, chapter "Web Control".
Alternatively, you can use Virtual Network Computing (VNC), which requires
installation of the VNC server on the R&S RTP. Installation and configuration are
described in the application note "Remote Monitoring and Control of the
R&S RTP with a Web Browser", available on the Rohde & Schwarz internet site.
6.1 Means of manual interaction
The R&S RTP provides the following means of manual interaction, which you can
use alternatively or complementary:
●
Touchscreen:
44Getting Started 1337.9946.02 ─ 07

R&S®RTP
Using the touchscreen is the direct interaction way. Use your finger to place
waveforms on the screen, mark areas for zoom and histograms, set parameters in dialog boxes, enter data, and much more. The control elements and
actions on the screen are based on common concepts, and you will easily
become familiar with the user interface.
Tapping the screen works like clicking mouse buttons:
– Tap = click: Selects a parameter or provokes an action.
– Double-tap = double-click has the same effect as touch and hold = right-
click: Opens the on-screen keyboard or keypad, or a specific editor if available
Use gestures to scale the waveform:
– Spread or pinch two fingers horizontally to change the horizontal scale
(timebase).
– Spread or pinch two fingers vertically to change the vertical scale of the
active waveform.
Operating the instrument
Touchscreen display
●
Function keys and rotary knobs:
The front panel provides nearly all functions and controls to operate the instrument in the classic ways, without touchscreen. As an exception, the signal bar
cannot be used with front panel controls.
●
Optional mouse and/or keyboard:
These devices work conform to Windows standards. The navigation keys on
the front panel correspond to the keys on the keyboard.
The usage of the touchscreen and navigation keys is described in detail in the following sections.
6.2 Touchscreen display
6.2.1 Information on the display
The touchscreen of the instrument shows the waveforms and measurement
results, and also information and everything that you need to control the instrument. All waveform-related display elements are shown in Figure 6-1. An overview of control elements - like dialog box, toolbar - is given in Chapter 6.2.2,
"Control elements on the touchscreen", on page 50.
45Getting Started 1337.9946.02 ─ 07

R&S®RTP
Operating the instrument
Touchscreen display
Figure 6-1: Display information
1 = Diagram
2 = Grid
3 = Trigger position
4 = Reference point (distance from trigger position to reference point = horizontal position)
5 = Trigger, horizontal and acquisition label
6 = Notifications
7 = Zoom area
8 = Zoom diagram
9 = Trigger level
10 = Signal bar with inactive waveforms (10a), minimized live waveform (10b) and signal icon
with vertical settings (10c)
11 = Histogram area
12 = Histogram
Diagram
A diagram shows one or more waveforms: channel, reference, and math waveforms together with histograms, masks etc. Zoom details, XY-waveforms, spectra
and other special waveforms are shown in separate diagrams.
46Getting Started 1337.9946.02 ─ 07

R&S®RTP
Operating the instrument
Touchscreen display
By default, the diagram name contains the diagram number and the short names
of the waveforms shown inside. To change the diagram name, touch and hold the
tab name. The on-screen keyboard opens to enter the new name. Names must
be unique.
To arrange the diagrams on the screen, the Rohde & Schwarz SmartGrid function
helps you to find the target place simply and quickly. For details, see Chapter 6.5,
"Rohde & Schwarz smartgrid", on page 56. You can also adjust the diagram size
by dragging the diagram border.
Grid
The grid shows the vertical and horizontal divisions. The division lines are labeled
with the correspondent values. The grid labels have the color of the waveform to
which they belong. If several waveforms are shown in one diagram, the grid has
the color of the selected waveform.
Trigger position and trigger level
The blue markers show the horizontal position of the trigger and the vertical trigger level. You can touch and move the trigger markers in the diagram to set the
positions. The trigger point is the zero point of the diagram.
The trigger position can be moved outside the diagram. A red trigger position
marker indicates that the trigger position is not visible.
Trigger, Horizontal, Acquisition
The "Trigger", "Horizontal" and "Acquisition" labels show the main timebase and
trigger settings. If you tap a label, the relevant dialog box opens.
Figure 6-2: Trigger label on the toolbar
1 = Trigger source
2 = Trigger type
3 = Trigger level
4 = Trigger mode
5 = Trigger state
6 = Trigger slope
47Getting Started 1337.9946.02 ─ 07

R&S®RTP
Figure 6-3: Horizontal label on the toolbar
1 = Time scale
2 = Horizontal position
Figure 6-4: Acquisition label on the toolbar
1 = Sample rate
2 = Record length
3 = Decimation
4 = Number of acquired waveforms
Operating the instrument
Touchscreen display
Reference point
The reference point marks the rescaling center. If you modify the time scale, the
reference point remains fixed on the screen, and the scale is stretched or compressed to both sides of the reference point.
You can define the position of the reference point ("Menu" > "Horizontal" > "Reference point"), and also its time distance from the trigger point of the diagram (Position knob).
Notification
The "Notification" button on the toolbar points to the status messages of the
instrument. To open the message box, tap the button. See also: Chapter 6.10,
"Instrument information and notifications", on page 72.
Zoom diagram and zoom area
Zoomed waveforms are shown in separate zoom diagrams, in addition to the
waveform diagrams. On the original waveform diagram, a rectangle indicates the
zoomed section of the waveform - this is the zoom area. You can modify the
zoom area by dragging the rectangle as a whole, and by dragging its edges. To
toggle between these modes, tap the zoom area. You can also set exact positions.
The frames of the zoom area and of the associated zoom diagram have the same
color, different zooms are marked with different colors. So it is easy to assign
zoom area and zoom diagram.
48Getting Started 1337.9946.02 ─ 07
R&S®RTP
Operating the instrument
Touchscreen display
As for waveform diagrams, you can change the name of the zoom diagram. A
zoom in a zoom and coupled zooms are also possible.
All zooming possibilities are described in detail in the user manual, chapter
"Zoom".
Signal bar
The signal bar is the control center for all waveforms. All enabled waveforms are
shown on the left side of the signal bar. Inactive waveforms are shown on the
right side of the toolbar. Tap an inactive waveform to enable it.
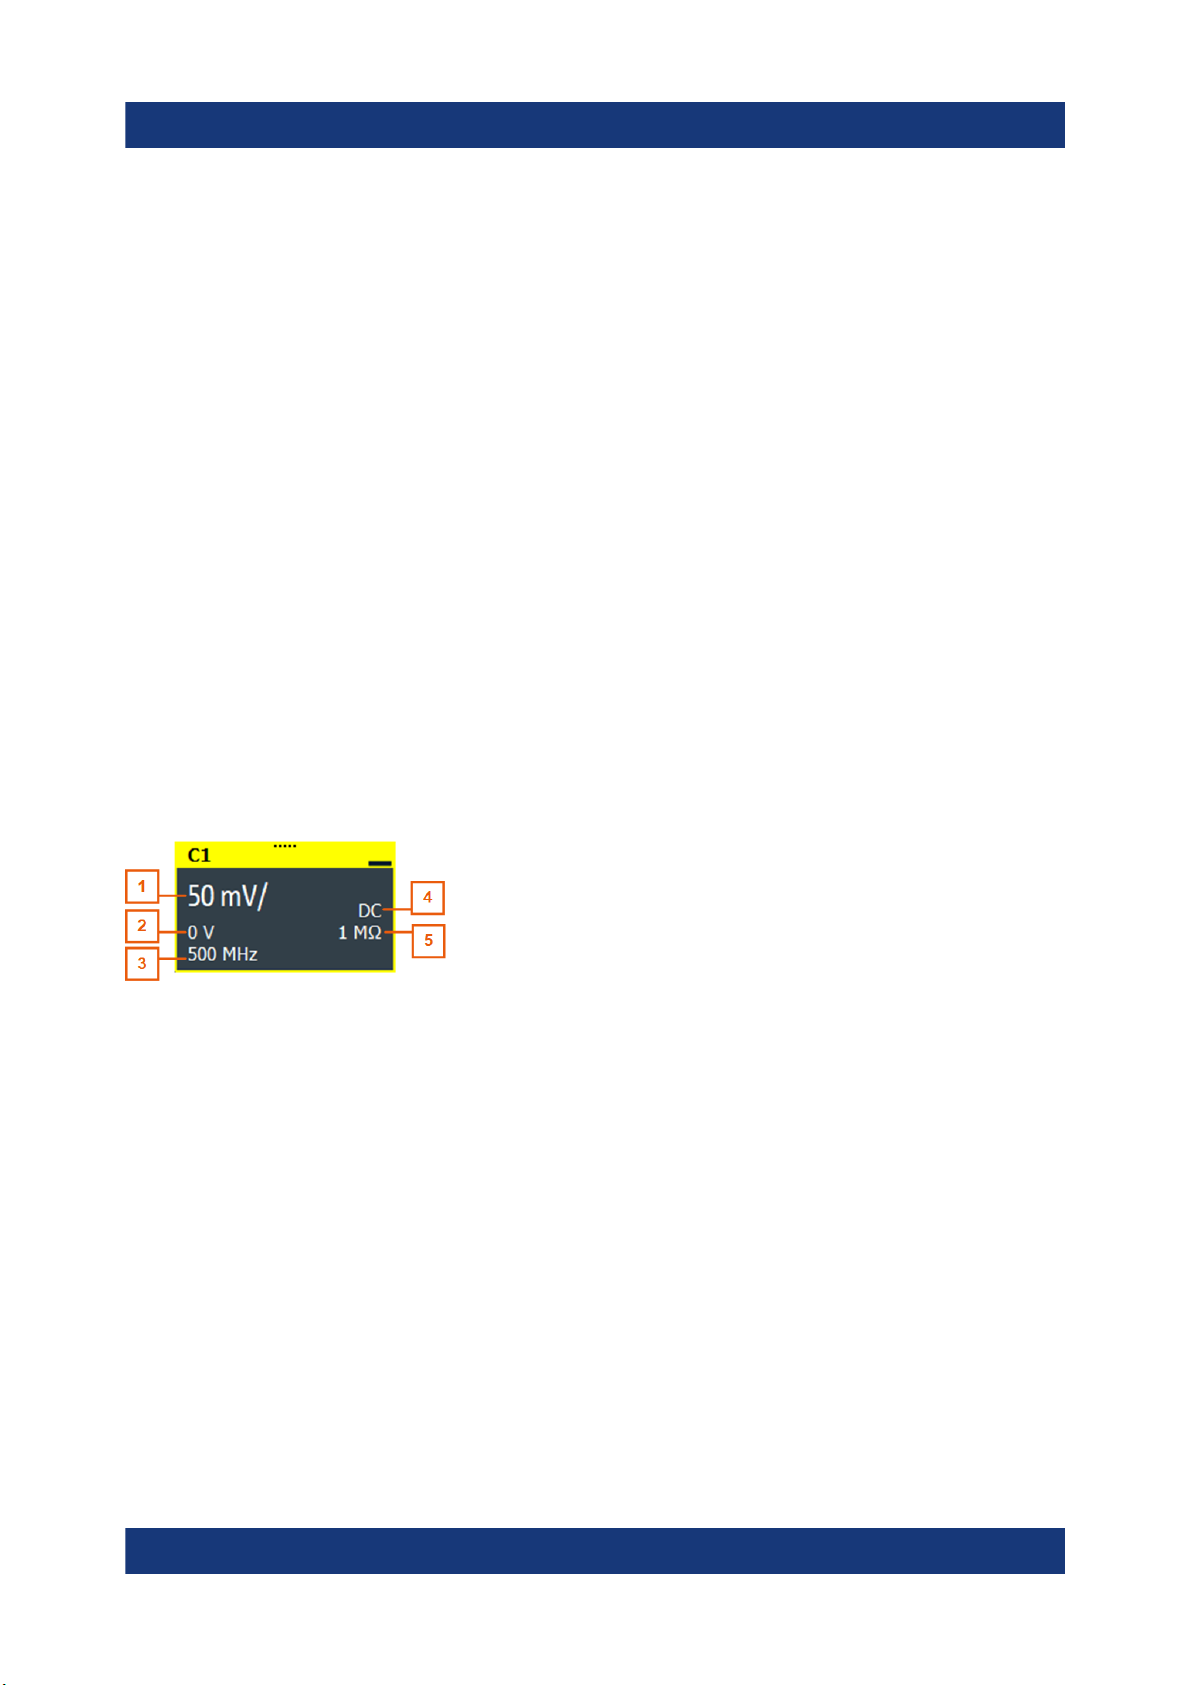
Each waveform is represented by a signal icon. If the waveform is shown in a diagram, the signal icon displays its main vertical and acquisition settings. If you tap
the "Minimize" icon on the signal icon, the waveform switches from the diagram
area to the signal icon: the icon shows the real-time preview of the waveform. If
you tap a signal icon, the dialog box with vertical settings for this waveform
opens. See Chapter 6.4, "Working with waveforms", on page 53 for a detailed
description.
In Figure 6-1, the signal icons C1 and C2 show the main settings, and the waveforms are displayed in diagrams. Other waveforms are minimized and shown in
the signal icon.
Figure 6-5: Signal label
1 = Vertical scale
2 = Offset
3 = Bandwidth
4 = Coupling
5 = Termination
If the signal bar contains many icons and not all icons are visible, touch one of the
icons and scroll left or right until the required icon appears.
You can also switch off the signal bar: "Menu" > "Settings" > "Appearance" >
"Diagram" > "Show signal bar".
49Getting Started 1337.9946.02 ─ 07
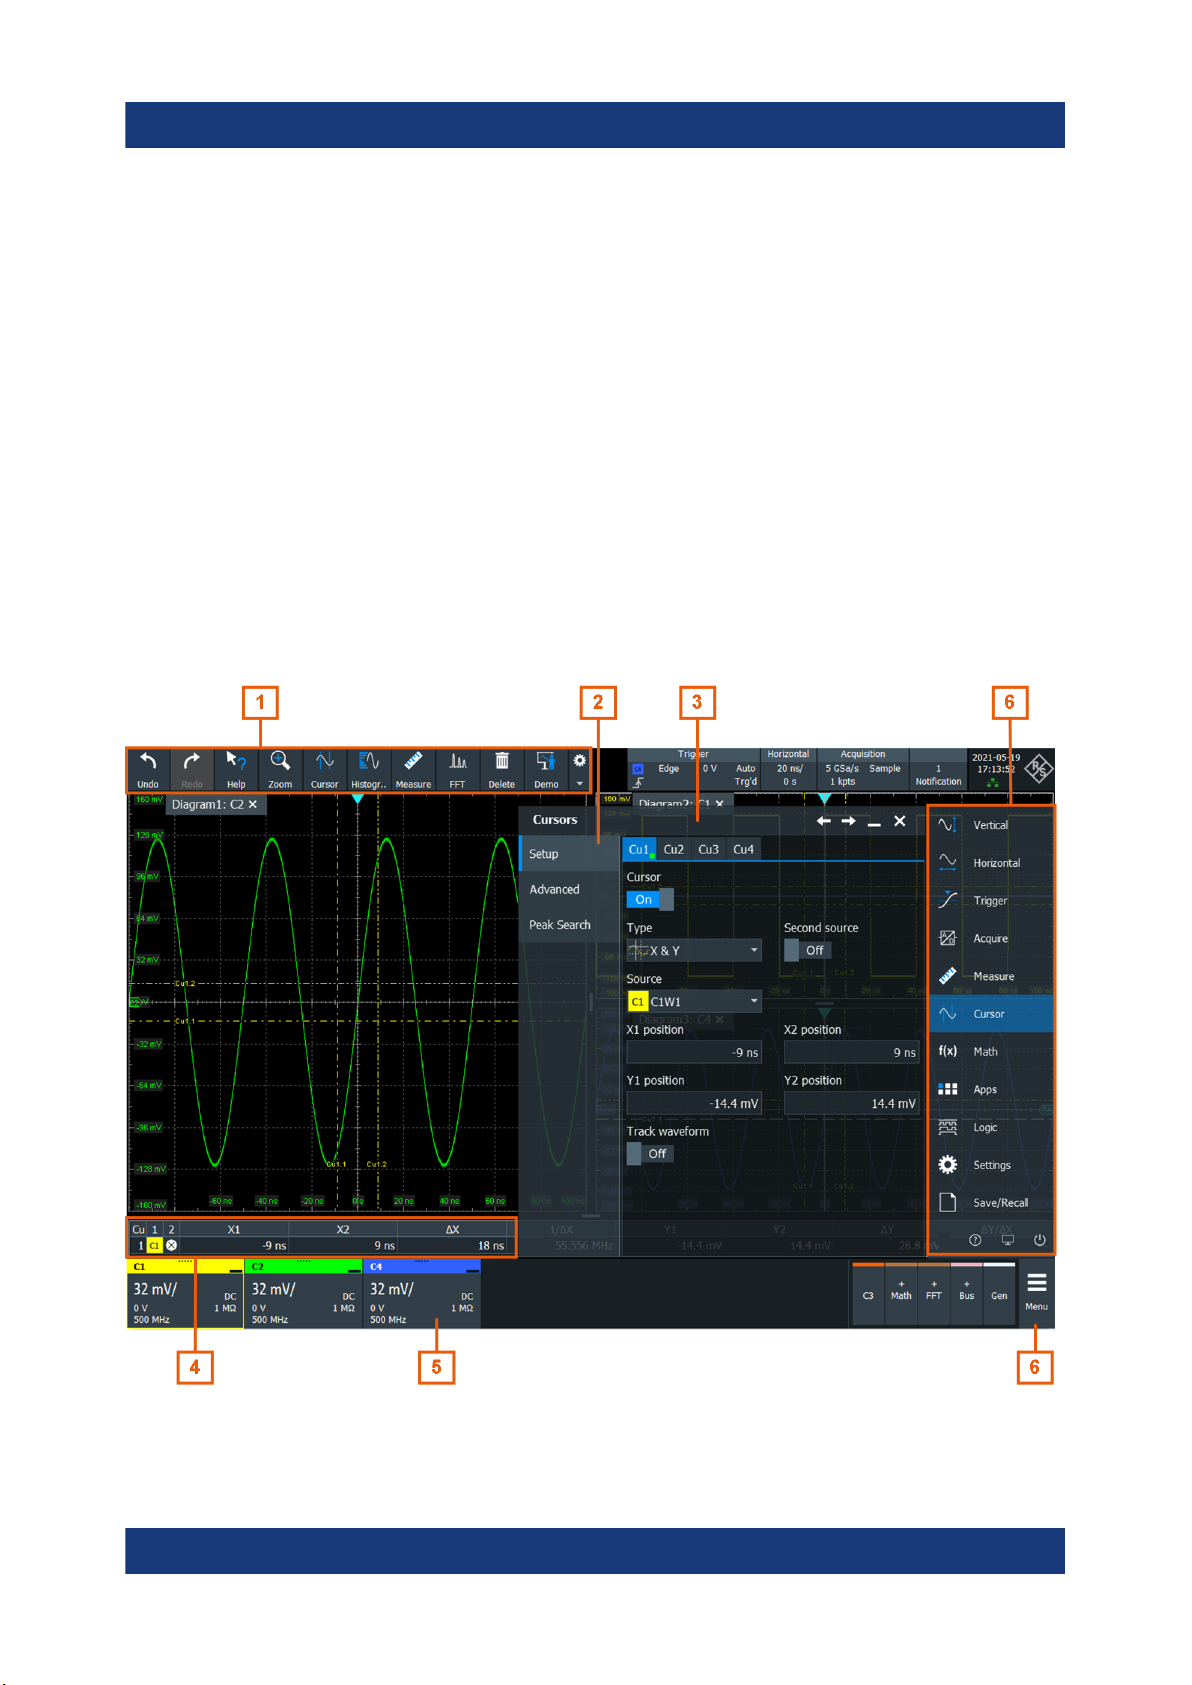
R&S®RTP
Histogram and histogram area
A histogram shows the frequency of occurrence of voltage or time values in a bar
chart directly in the diagram. The rectangular histogram area indicates the part of
the waveform that is considered in the histogram. The vertical histogram counts
the voltage values, and the horizontal histogram counts time values. You can
switch between vertical and horizontal mode, and modify the histogram area by
dragging the rectangle as a whole, by dragging its edges, or by setting exact positions.
Operating the instrument
Touchscreen display
6.2.2 Control elements on the touchscreen
The touchscreen provides everything you need to control the instrument, to analyze waveforms, and to get measurement results. Figure 6-6 shows the control
elements on a glance.
Figure 6-6: Control elements on the touchscreen
50Getting Started 1337.9946.02 ─ 07

R&S®RTP
Operating the instrument
Touchscreen display
1 = Toolbar
2 = Tab in a dialog box
3 = Dialog box
4 = Result table (docked)
5 = Signal bar
6 = Menu
Not shown = Input box
Toolbar (1)
The icons on the toolbar provide quick and easy access to the most important
functionality. For a detailed description, refer to Chapter 6.6, "Toolbar",
on page 57.
If you adjust the settings of an analyzing function, e.g., cursor measurement, the
toolbar assist is shown instead of the icons. The toolbar assist provides the most
important settings of the current action. If you need more settings, "Advanced
Setup" opens the corresponding dialog box.
Dialog box (2, 3)
The tabs of the dialog boxes contain all task-oriented settings and operations,
and black buttons for calling related tabs. The usage of dialog boxes is described
in Chapter 6.8, "Using dialog boxes", on page 68.
Result table (4)
If you perform cursor or automatic measurements, mask testing, or a search, the
result table shows the results of the action. The position of the result table is
adjustable. It can be docked (default for measurements), floating, minimized to a
result icon on the signal bar, or displayed in a separate diagram on the screen.
For details, see "To define the default position of measurement results"
on page 66.
Signal bar (5)
The signal bar shows all enables waveforms as described in "Signal bar"
on page 49.
Menu (6)
The menu provides access to the complete functionality of the R&S RTP.
51Getting Started 1337.9946.02 ─ 07
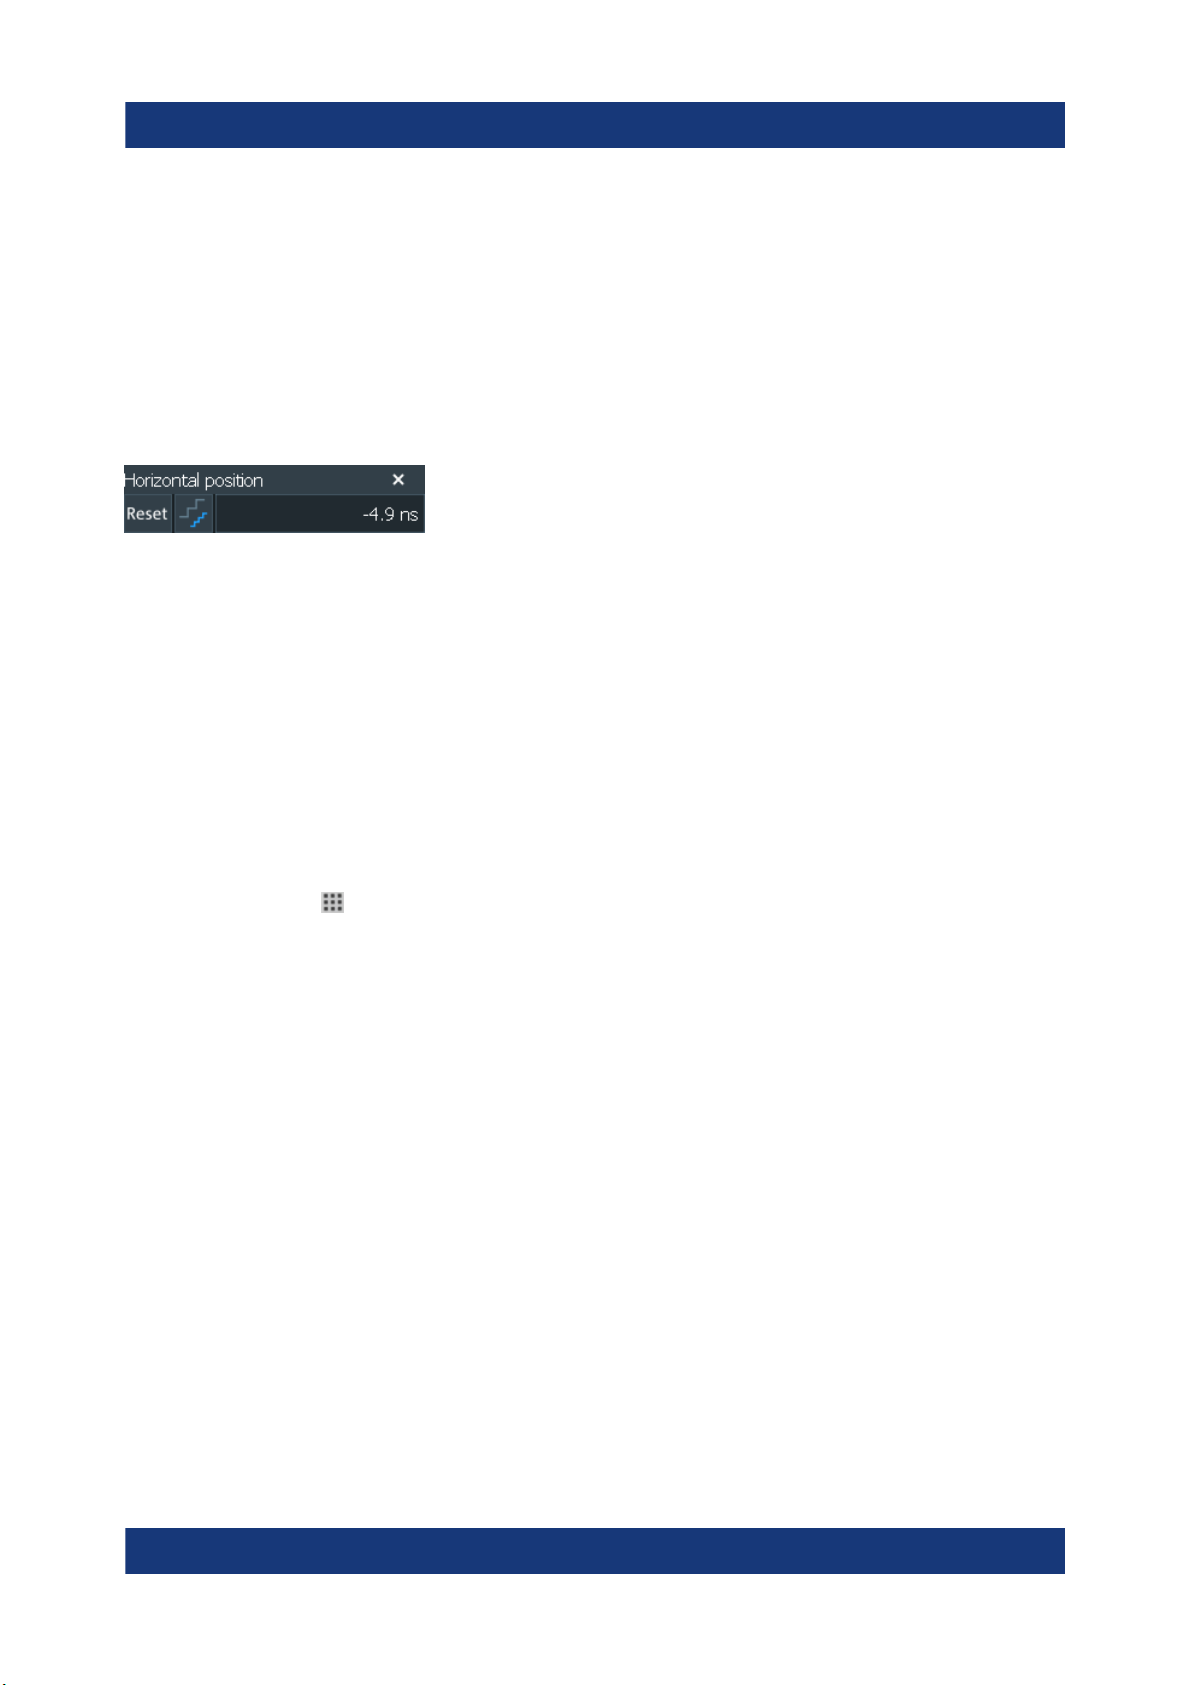
R&S®RTP
Input box
The input box appears if you adjust a value using one of the rotary knobs, or if
you drag an element on the screen, for example, a cursor line. The input box
shows the current value of the modified parameter. You can enter the exact
numerical value, change the step size, and - if available - autoset the value
directly in the input box. The box title shows the name of the currently adjusted
parameter. The input box is helpful when using the multi-function rotary knobs, for
example, horizontal or vertical [Position] knobs.
See also: Chapter 6.9, "Entering data", on page 69.
Operating the instrument
App cockpit
6.3 App cockpit
The app cockpit provides fast access to all available applications.
► To open the app cockpit:
● Open "Menu" > "Apps".
● Press the app key on the frontpanel.
52Getting Started 1337.9946.02 ─ 07

R&S®RTP
Operating the instrument
Working with waveforms
6.4 Working with waveforms
The R&S RTP can create and display many waveform types. The most importand
are:
●
Channel waveforms:
Up to three waveforms per input channel can be shown. For a four-channel
instrument, 12 channel waveforms are available.
●
Reference waveforms:
Four waveforms can be used as reference for comparison and analysis.
●
Math waveforms:
Eight mathematic waveforms can be created with mathematic operations performed on channel, reference, and other math waveforms.
●
Zoom waveforms:
53Getting Started 1337.9946.02 ─ 07

R&S®RTP
Show the details of waveforms.
●
XY-waveforms:
Four XY-waveforms can be created. Each XY-waveform is built from the voltage values of two source waveforms.
●
Digital waveforms:
The Mixed Signal Option R&S RTP-B1 provides 16 digital channels grouped
in two logic probes (pods) with 8 channels each.
Waveform handling
The R&S RTP can show and analyze many waveforms. To handle this multitude
while keeping track of it, the R&S RTP provides intelligent support:
●
The color system helps to distinguish the waveforms. The color of the vertical
rotary knobs indicates the signal that is focused (selected). The color of each
waveform can be changed, the color of its signal icon and of the illuminated
keys is adjusted to the new color. Alternatively, a color table can be assigned
to a waveform.
Settings: "Menu" > "Settings" > "Appearance" > "Colors" tab.
Operating the instrument
Working with waveforms
●
Waveforms can be minimized to signal icons showing a small real-time signal
view. Thus, more space in the diagram area is available without switching off
waveforms.
●
Diagrams are displayed on tabs – you can arrange them side by side or one
above the other. To change the diagram name, double-tap the tab name.
●
The Rohde & Schwarz SmartGrid function helps to arrange the diagrams.
Waveform states
Depending on its place on the screen and the effect of settings, a waveform has
one of the following states:
●
Off
●
Active:
The waveform is shown in a diagram
●
Selected:
One of the active waveforms that has the focus. In each diagram, one of the
assigned waveforms is selected – it appears "on top" in the diagram, and the
grid labels have the color of the selected waveform. Some of the toolbar functions, like cursor and histogram measurements are performed on the selected
waveform. All waveform-specific settings are applied to the selected waveform
of the selected diagram.
54Getting Started 1337.9946.02 ─ 07

R&S®RTP
The vertical [Position] and the [Scale] knobs are illuminated with the color of
the selected waveform.
In Figure 6-1, C1 is the selected waveform: The frame of the diagram and the
signal icon are highlighted.
●
Minimized:
The waveform is shown as real-time signal view in its signal icon.
To switch a waveform on
A channel waveform is activated as soon as you connect the probe. You can
switch it on and off according to your needs.
► Choose one of the following ways:
● Press the channel key.
● In the "Vertical" dialog box, select the channel and tap "Channel" > "On".
The waveform is now active, selected, and is shown in the diagram.
Operating the instrument
Working with waveforms
To select a waveform
► Choose one of the following ways:
● Tap the waveform in the waveform diagram.
● To select a channel, reference, or math waveform, press the corresponding key.
● Tap the signal icon.
Note: Zoom waveforms in zoom diagrams cannot be selected.
To minimize a waveform
► Choose on of the following ways:
● Tap the "Minimize" icon in the upper right corner of the waveform's signal
label in the signal bar.
● Drag the waveform from the diagram to the signal bar.
The waveform disappears from the diagram and the minimized signal view is
shown in the signal icon.
► To set the waveform back to its previous diagram immediately, use "Undo".
To arrange a waveform using the SmartGrid
See Chapter 6.5, "Rohde & Schwarz smartgrid", on page 56.
55Getting Started 1337.9946.02 ─ 07
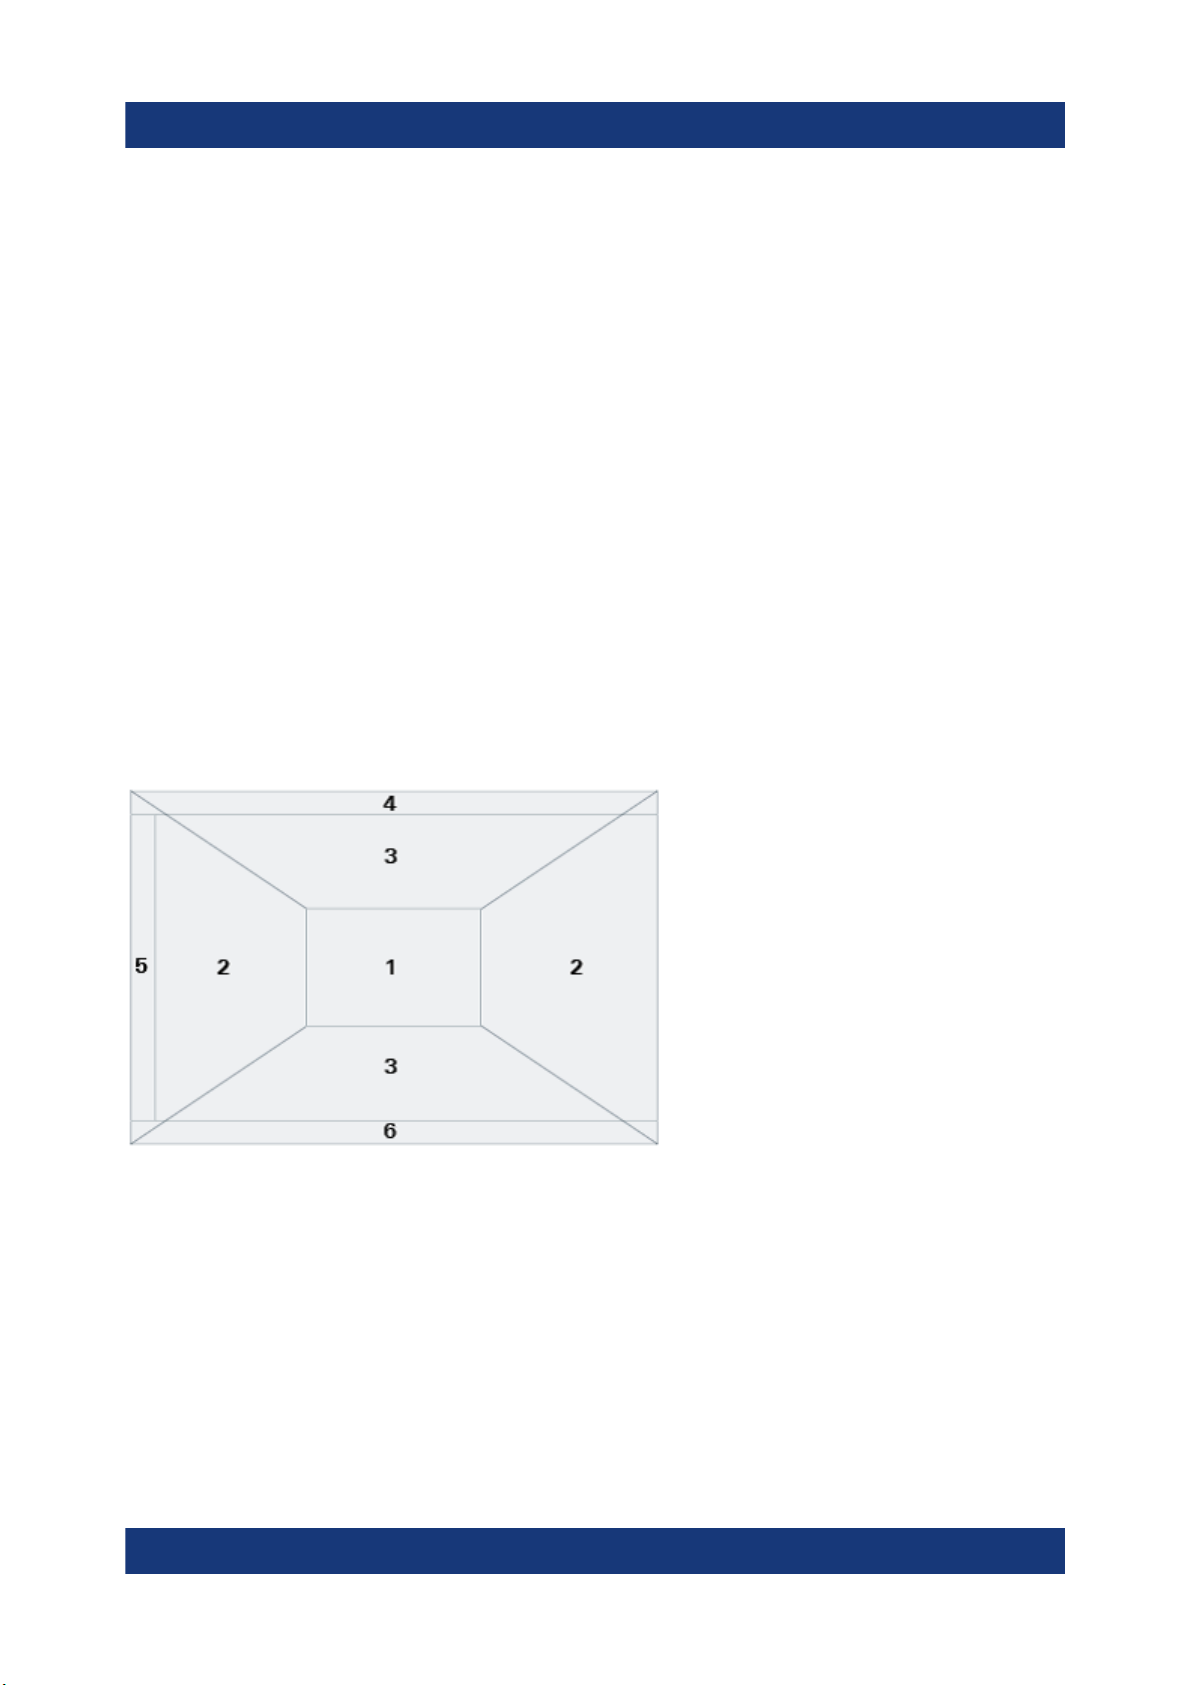
R&S®RTP
Operating the instrument
Rohde & Schwarz smartgrid
To switch off a waveform
► Do one of the following:
● Select the waveform, and then press the [Signal Off] key.
● To switch off a minimized waveform, tap the "Close" icon in the upper right
corner of the minimized signal view.
● Disable "Channel" in the "Vertical" > "Setup" tab.
● Tap the "Delete" icon (Recycle bin) in the toolbar, and then the waveform.
If several waveforms overlap or lie close together, the upper (selected)
waveform is switched off.
6.5 Rohde & Schwarz smartgrid
The Rohde & Schwarz SmartGrid helps to create and arrange the diagrams on
the screen with drag&drop. The diagram layout depends on the position where
you drop the signal icon, in relation to an existing diagram.
Figure 6-7: SmartGrid positions
1 = In the existing diagram, overlay of signal
2 = New diagram on the left or right
3 = New diagram above or below
4 = New diagram on top of the existing diagram
5 = XY-diagram
6 = YX-diagram
The diagram configuration is deleted when you use [Preset] and *RST.
56Getting Started 1337.9946.02 ─ 07
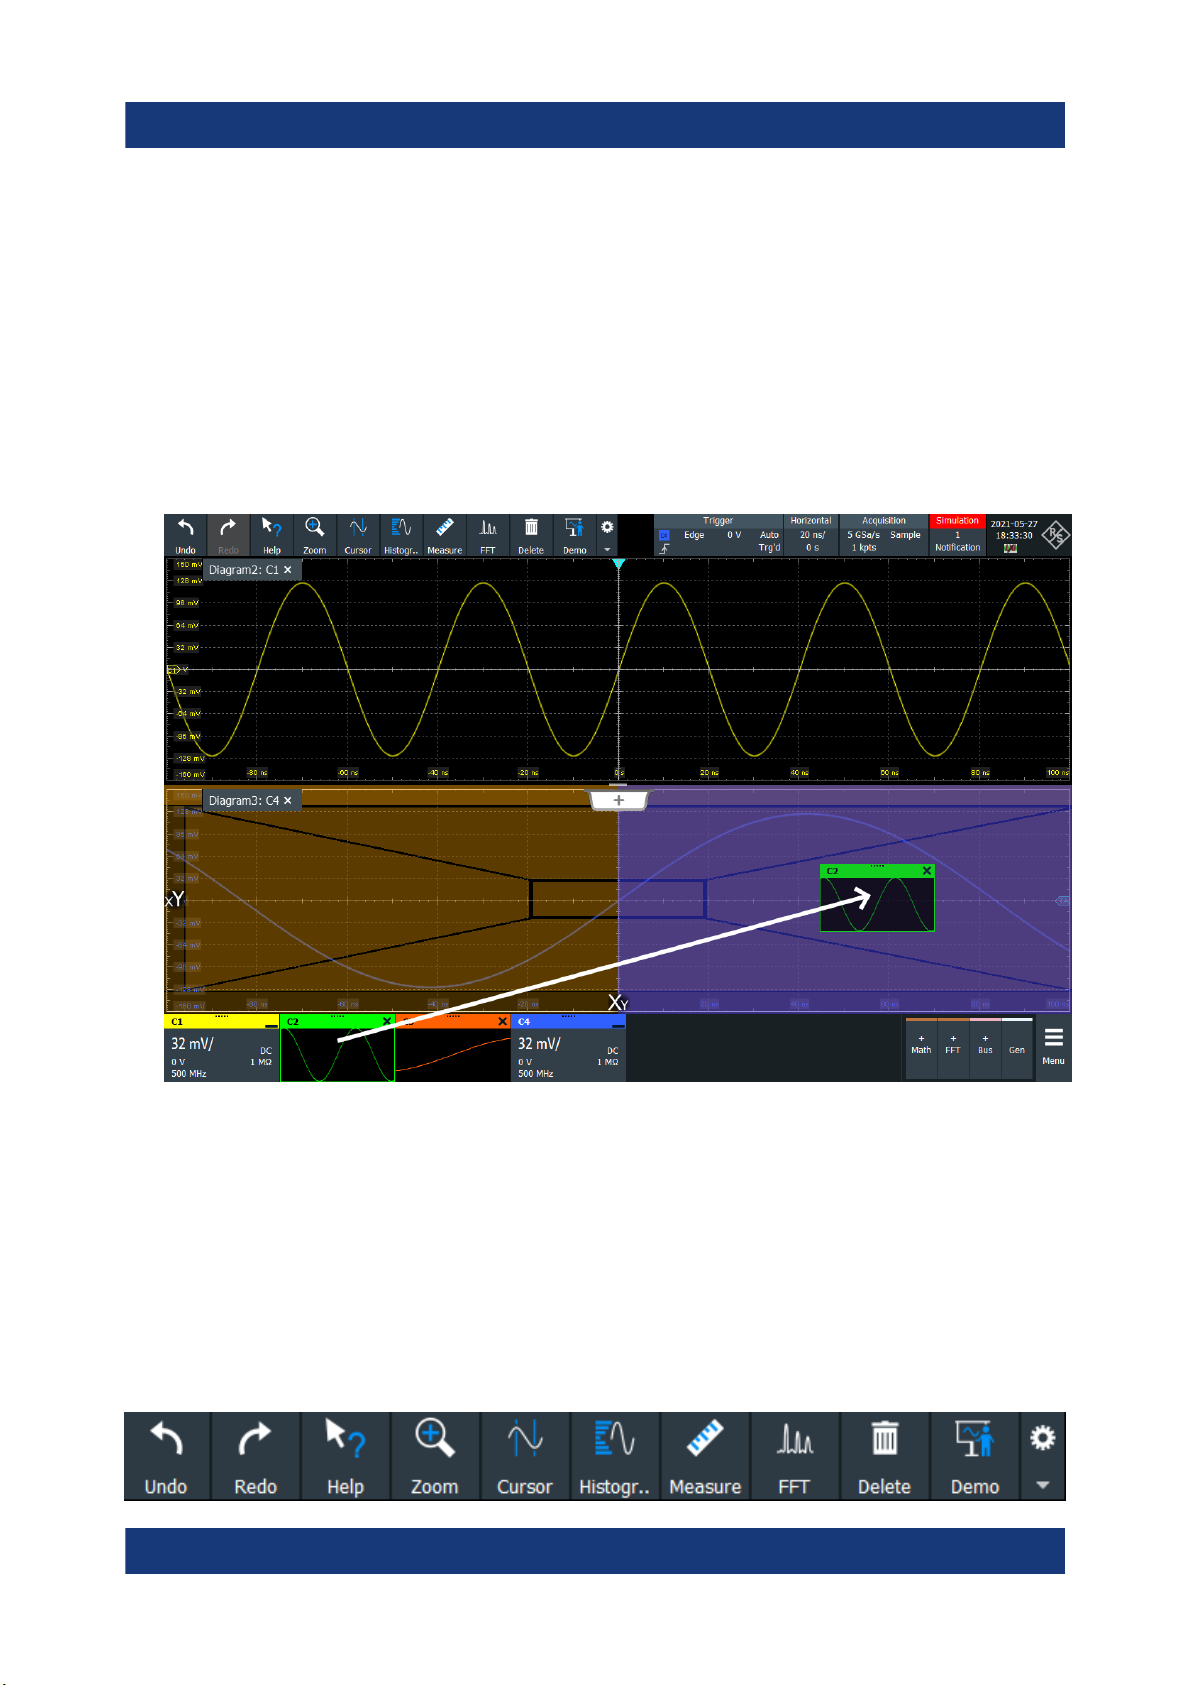
R&S®RTP
To arrange a waveform using the SmartGrid
You can arrange waveforms in one of the existing diagrams, or in a new diagram.
1. Drag the signal icon to the diagram area, and move it around.
The Rohde & Schwarz SmartGrid appears and a blue area shows where the
waveform will be placed.
2. Drop the waveform in the target area.
The waveform appears in an existing or in a new diagram, and it is selected
for further actions.
Operating the instrument
Toolbar
3. To change the size of a diagram, tap the handle between two diagram frames
and drag it to the required position.
6.6 Toolbar
The toolbar provides direct access to important control and measurement functions.
57Getting Started 1337.9946.02 ─ 07

R&S®RTP
By default, the toolbar shows the most frequently used functions. You can configure the content of the toolbar, see Chapter 6.6.2, "Configuring the toolbar",
on page 59.
Operating the instrument
Toolbar
6.6.1 Using the toolbar
Using the toolbar is easy and straightforward.
Some of the toolbar functions are one-click actions. These actions are performed
immediately when you tap the icon.
Other toolbar functions are analyzing functions. These actions are interactive
actions.
To use analyzing functions (interactive actions)
1. If several waveforms are shown in the diagram, select the waveform that you
want to analyze.
See: "To select a waveform" on page 55
2. Tap the icon of the function in the toolbar.
3. Check and adjust the settings in the toolbar assist.
4. To define the analyzed area, do one of the following:
58Getting Started 1337.9946.02 ─ 07

R&S®RTP
● Tap the required diagram.
● Drag a rectangle on the diagram.
Operating the instrument
Toolbar
6.6.2 Configuring the toolbar
You can configure the content of the toolbar so that only the required functions
are displayed. Furthermore, date and time can be hidden. The toolbar configuration is part of the user preferences. It is retained when you switch off and on the
instrument, and you can save it in the user preferences and user-defined preset.
1. To open the toolbar configuration, tap the icon in the toolbar:
2. Select the required toolbar functions:
● Disable the functions that you do not need.
● Enable the functions that you want to add to the toolbar.
A detailed description of the toolbar functions is given in Chapter 6.6.3, "Toolbar
functions", on page 59.
6.6.3 Toolbar functions
This section describes all toolbar functions in detail.
59Getting Started 1337.9946.02 ─ 07

R&S®RTP
Operating the instrument
Toolbar
One-click actions Interactive actions
Undo Zoom
Redo Search
Help Cursor
Graphical Saveset Mask Test
Saveset Histogram
Image Measure
Report Quick meas
Clear FFT
Autoset and Preset Label
Run / Stop and Single Save Reference
Find Level Save Waveform
60Getting Started 1337.9946.02 ─ 07

R&S®RTP
Operating the instrument
Toolbar
One-click actions Interactive actions
Force Trigger Zone trigger
Demo Spectrogram (option R&S RTP-K37)
You can configure the content of the toolbar, see Chapter 6.6.2, "Configuring
the toolbar", on page 59.
The following list describes at first the default toolbar functions and then the additional functions.
Undo
Undoes the last setting actions step by step. Some actions cannot be
revoked: locking the touchscreen with [Touch Lock], and saving data. The undo
stack is deleted during the following actions: Reloading settings from file, and reference waveform actions (save, load and preset with active reference waveform).
Redo
Recovers the undo steps in reverse order.
Help
Enables the tooltip display. A short description appears when you tap a
parameter in a dialog. To open the corresponding help topic, tap the "Show Help"
button in the lower right corner of the tooltip. See also: Chapter 6.11, "Getting
information and help", on page 73.
Graphical Saveset
Opens a window to select and load instrument settings that were previously stored in a saveset. A graphical preview helps you to find the required settings.
Saveset
Saves the current instrument settings in a saveset.
You can reload the saveset using the "Graphical Saveset" toolbar icon, or using
"Menu" >"Save/Recall" > "Recall" tab > "Saveset with preview".
The filename is created according to the autonaming pattern, defined in "Menu" >
"Settings" > "Save/Recall" > "Autonaming" tab.
61Getting Started 1337.9946.02 ─ 07

R&S®RTP
Image
Saves a screenshot of the current display using the settings defined in
"Menu" >"Save/Recall" > "Save" tab > "Screenshot".
Report
Creates a report of the current measurement settings and results using the
settings defined in "Menu" > "Save/Recall" > "Save" tab > "Report".
Clear
Deletes all measurement results including long term measurement and statistics, all waveforms, and the history.
Autoset and Preset
Performs an autoset, or a preset to a default state. The icons have
the same functionality as the corresponding keys on the front panel. They are
useful when you control the instrument remotely.
Operating the instrument
Toolbar
Run / Stop and Single
Starts and stops the continuous acquisition, or starts a defined number of acquisition cycles. The icons have the same functionality as the corresponding keys on the front panel. They are useful when you control the instrument remotely.
Find Level
Analyses the signal and sets the trigger level to the middle of the signal
peaks.
Force Trigger
Starts an immediate single acquisition. If the acquisition is running in normal mode and no valid trigger occurs, use "Force Trigger" to confirm that a signal
is available. Then you can use the displayed waveform to determine how to trigger on it.
Demo
Opens the "Demo" dialog, where you can find examples of operating the
R&S RTP.
Zoom
The zoom icon on the toolbar shows the last selected zoom type. A short
tap on the icon activates the selected zoom.
62Getting Started 1337.9946.02 ─ 07

R&S®RTP
To use another zoom type, select it in the toolbar assist.
Standard zoom ← Zoom
Displays a magnified section of the diagram in an additional zoom diagram.
It is a display zoom, instrument settings are not changed.
Tap the icon and drag a rectangle on the diagram to mark the zoom area. An
additional zoom diagram appears. You can use the tool repeatedly on the zoom
diagram to get a more detailed view.
Touch and hold the zoom area to open the "Zoom" dialog box.
Hardware zoom ← Zoom
Changes the instrument settings - horizontal and vertical scales as well as
trigger level and offset - to display a part of the diagram in greater detail.
Tap the icon and drag a rectangle on the diagram to mark the area to be zoomed.
The diagram changes and shows the magnified area. To return to the previous
display, use the "Undo" function.
Operating the instrument
Toolbar
Coupled zoom ← Zoom
Creates a coupled zoom area and its related zoom diagram. If you change
the size of one zoom area, the size of all coupled zoom areas is changed as well.
First, create a zoom using the "Standard" zoom. Then tap "Coupled zoom" and
tap the existing zoom area. The zoom area is duplicated. Drag the duplicate to
the required position.
Fingertip zoom ← Zoom
Magnifies the waveforms around your fingertip.
Tap the icon and put your finger on the waveform. The touched part of the waveform is displayed in a magnifier. Drag your finger on the screen to move the magnifier. You can change the zoom factor using the [Navigation] knob.
Search
Performs a search according to the settings in the "Search Setup" dialog
box. Tap the icon and then tap the diagram with the waveform to be searched, or
drag a rectangle to define a search gate. The search is performed on the selected
waveform.
Performs a search. Tap the icon and adjust the settings in the sidebar. Tap the
diagram with the waveform to be searched, or drag a rectangle to define a search
gate. The search is performed on the selected waveform.
63Getting Started 1337.9946.02 ─ 07
R&S®RTP
Cursor
The cursor icon shows the last selected cursor type. A short tap on the
icon activates the selected cursor.
To use another cursor type, select it in the toolbar assist, and adjust the settings.
Tap the diagram where you want to set the cursors, or draw a rectangle in the diagram to position the cursor lines. The resulting cursor lines measure the selected
waveform, and the results are shown. You can adjust the cursor source, type and
position in the result box. Move the cursor lines by dragging them in the diagram,
or by turning the navigation knob. Pressing the knob switches the parameter to be
changed.
Mask Test
Starts the on-screen mask definition and the testing against the defined
mask.
Tap the icon and then tap the points that build the mask. To finish the shape definition, tap "Finish segment" in the toolbar assist. To create a rectangular mask,
draw a rectangle on the screen. You can add more segments to the test, and add
another test. You can also move the mask segments on the screen.
Operating the instrument
Toolbar
To configure the mask test settings, tap the icon in the "Mask" result box.
Histogram
The histogram icon on the toolbar shows the last selected histogram type.
A short tap on the icon activates the selected histogram.
To use another histogram type, select it in the toolbar assist, and adjust the
source.
Tap the icon and then drag a rectangle on the diagram to mark the histogram
area. The histogram for the selected waveform appears.
To change settings, touch and hold the histogram area, and the histogram toolbar
assist opens.
Measure
Starts an automatic measurement.
You can run up to 8 automatic measurement groups in parallel. The "Automatic
measurment" icon starts the measurement groups one after the other.
A measurement group consists of minimum one measurement, and can consist of
many measurements of the same category. Tap the icon, and select the category
and the measurements in the toolbar assist. Tap the diagram with the waveform
to be measured. To define a measurement gate, draw a rectangle on the screen.
64Getting Started 1337.9946.02 ─ 07
R&S®RTP
To modify the measurement, double-tap one of the result values.
Quick meas
Performs a set of measurements on the selected waveform or on the
selected gate. You can configure up to 8 measurements to be included in quick
measurement.
Tap the icon and then tap the diagram with the waveform to be measured or draw
a rectangle to define the gate.
FFT
Transforms a waveform to the frequency spectrum by fast Fourier transform (FFT). The FFT trace is shown in a new diagram.
Tap the icon and adjust the settings in the toolbar assist. Tap the diagram with the
waveform to be transformed. The FFT diagram is created from the selected
waveform.
Operating the instrument
Toolbar
To adjust FFT settings, double-tap the FFT diagram.
Label
Defines a waveform label that names or explains the waveform. Tap the
icon and then tap the waveform to be labeled. Enter the label text using the onscreen keyboard. The text is shown in the same color as the waveform. If you tap
the display background, the label is assigned to the selected waveform. You can
drag the label to another position.
Save Reference
Copies the selected source waveform with all its settings to the reference
waveform. If the acquisition is running, the reference waveform is a snapshot.
You can configure up to four reference waveforms.
Tap the icon, and select the required reference waveform (R1 to R4) in the toolbar
assist. Tap the waveform to be copied as reference.
Save Waveform
Exports the waveform data to file using the settings defined in "Menu" >
"Save/Recall" > "Save" tab > "Waveform" > "Setup" tab.
The filename is created according to the autonaming pattern.
Tap the icon and then tap the waveform to be exported. If you tap the display
background, the selected waveform is exported, or a multichannel export is performed if configured.
65Getting Started 1337.9946.02 ─ 07
R&S®RTP
Zone trigger
Defines a zone trigger, which combines the trigger condition with the intersection or non-intersection of one or more zones or masks.
Tap the icon and then tap the corner points of the zone on the screen. Tap "Finish
zone". You can add more zones to the trigger condition.
Spectrogram (option R&S RTP-K37)
Starts an FFT and the spectrogram. The FFT trace and the spectrogram
are shown in separate diagrams.
Tap the icon. Select the source in the sidebar, or tap diagram with the waveform
to be transformed. The diagrams are created from the selected waveform.
Delete
Removes waveforms, measurements, zoom, histograms, mask segments
and other elements from the display.
Operating the instrument
Displaying results
Tap the icon and then tap the element to be deleted, or the waveform to be
switched off.
6.7 Displaying results
The results of measurements, mask tests, searches, protocol decoding and others are displayed immediately. There are several places to display the results:
●
In a table that is docked below the diagram (not available for mask test
results)
●
In a floating result box in front of the diagrams, which you can move on the
display
●
In a minimized view (result icon) on the signal bar
●
In a separate that can be arranged similar to a diagram
The default position and the font size can be adjusted.
To define the default position of measurement results
For results of automatic, cursor measurements and protocol measurements, the
docked position below the diagram is the initial default position.
To change the default position of the results:
► Open the "Menu" > "Settings" > "Appearance" dialog.
66Getting Started 1337.9946.02 ─ 07
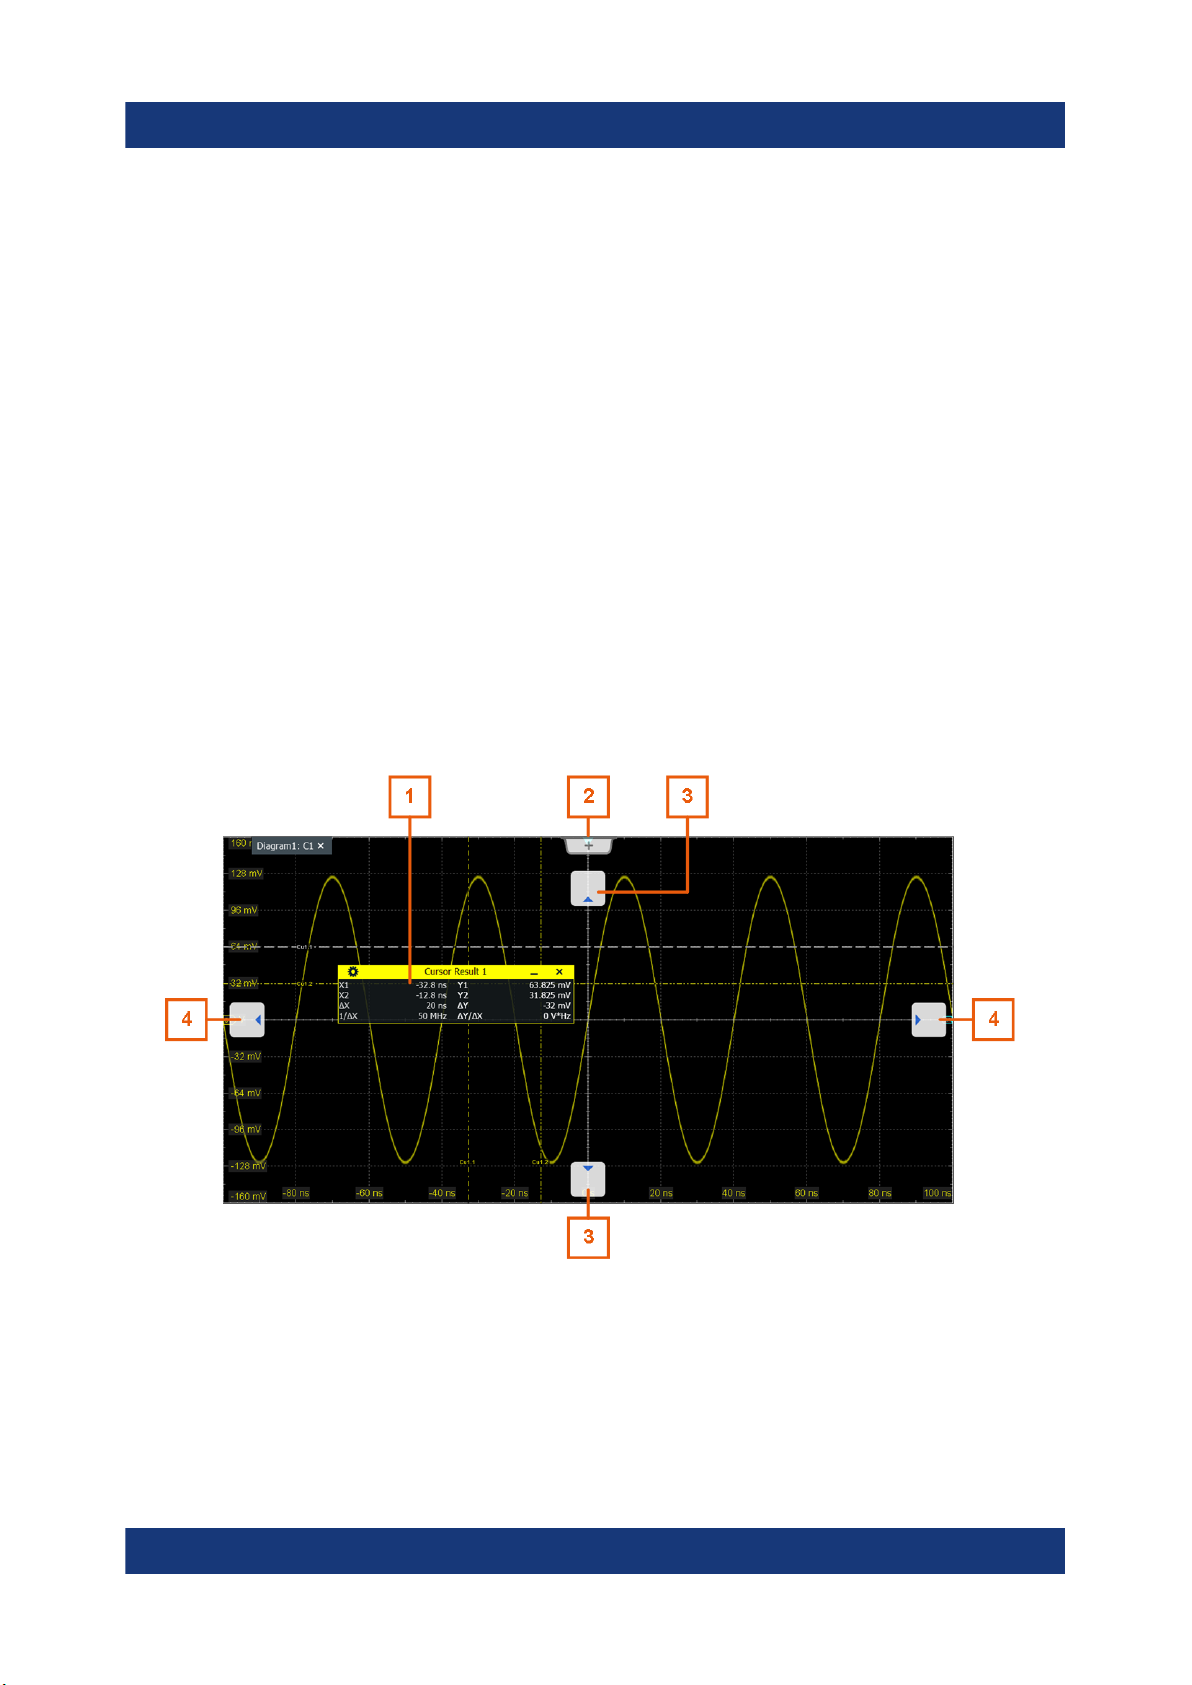
R&S®RTP
Operating the instrument
Displaying results
● Automatic measurements: select "Measurement" tab > "Result position".
● Cursor measurements: select "Cursor" tab > "Result position".
● Protocols: select "Protocol" tab > "Result position".
To arrange the results on the display
1. If the results are listed in a docked table, touch and hold a result line and drag
it.
The results are now shown in a result box.
Note: Once you undock the measurement results, you cannot move the result
box back to the docked position.
2. Touch and hold the title of the result box and drag the box on the screen. The
SmartGrid indicates where the result box will be placed.
● If you drop the box on one of the buttons, the results are shown in a separate tab besides, above, or below the diagram.
● If you drop the box on the signal bar, a result icon is created.
● If you drop the box somewhere else, a floating result box is placed.
1 = Floating result box
2 = New tab
3 = Table in a tab above or below
4 = Table in a tab on the left or right
67Getting Started 1337.9946.02 ─ 07
R&S®RTP
Operating the instrument
To open the corresponding setup dialog box
1. Double-tap one of the result values.
If a result box is shown, you can also tap the icon.
2. In the toolbar assist, tap "Advanced Setup" .
The dialog box with corresponding settings opens.
To adjust the font size of results
1. Open the "Menu" > "Settings" > "Appearance" dialog.
2. Select the "Dialogs" tab.
3. Set the "Result dialog" > "Font size".
Using dialog boxes
6.8 Using dialog boxes
All functionality is provided in dialog boxes as known from computer programs.
You can control the instrument intuitively with the touchscreen. This section provides an overview of the accessing methods and describes how to use the dialog
boxes.
Each dialog box has four icons in the upper right corner:
Go back: opens the previously opened dialog box.
Go forward: opens the next dialog box.
Minimizes the dialog box to a small box that only contains the last selected function.
Closes the dialog box.
For direct access to important control and measurement functions, use the
toolbar, see Chapter 6.6, "Toolbar", on page 57.
To open a dialog box
► Perform one of the following actions:
68Getting Started 1337.9946.02 ─ 07
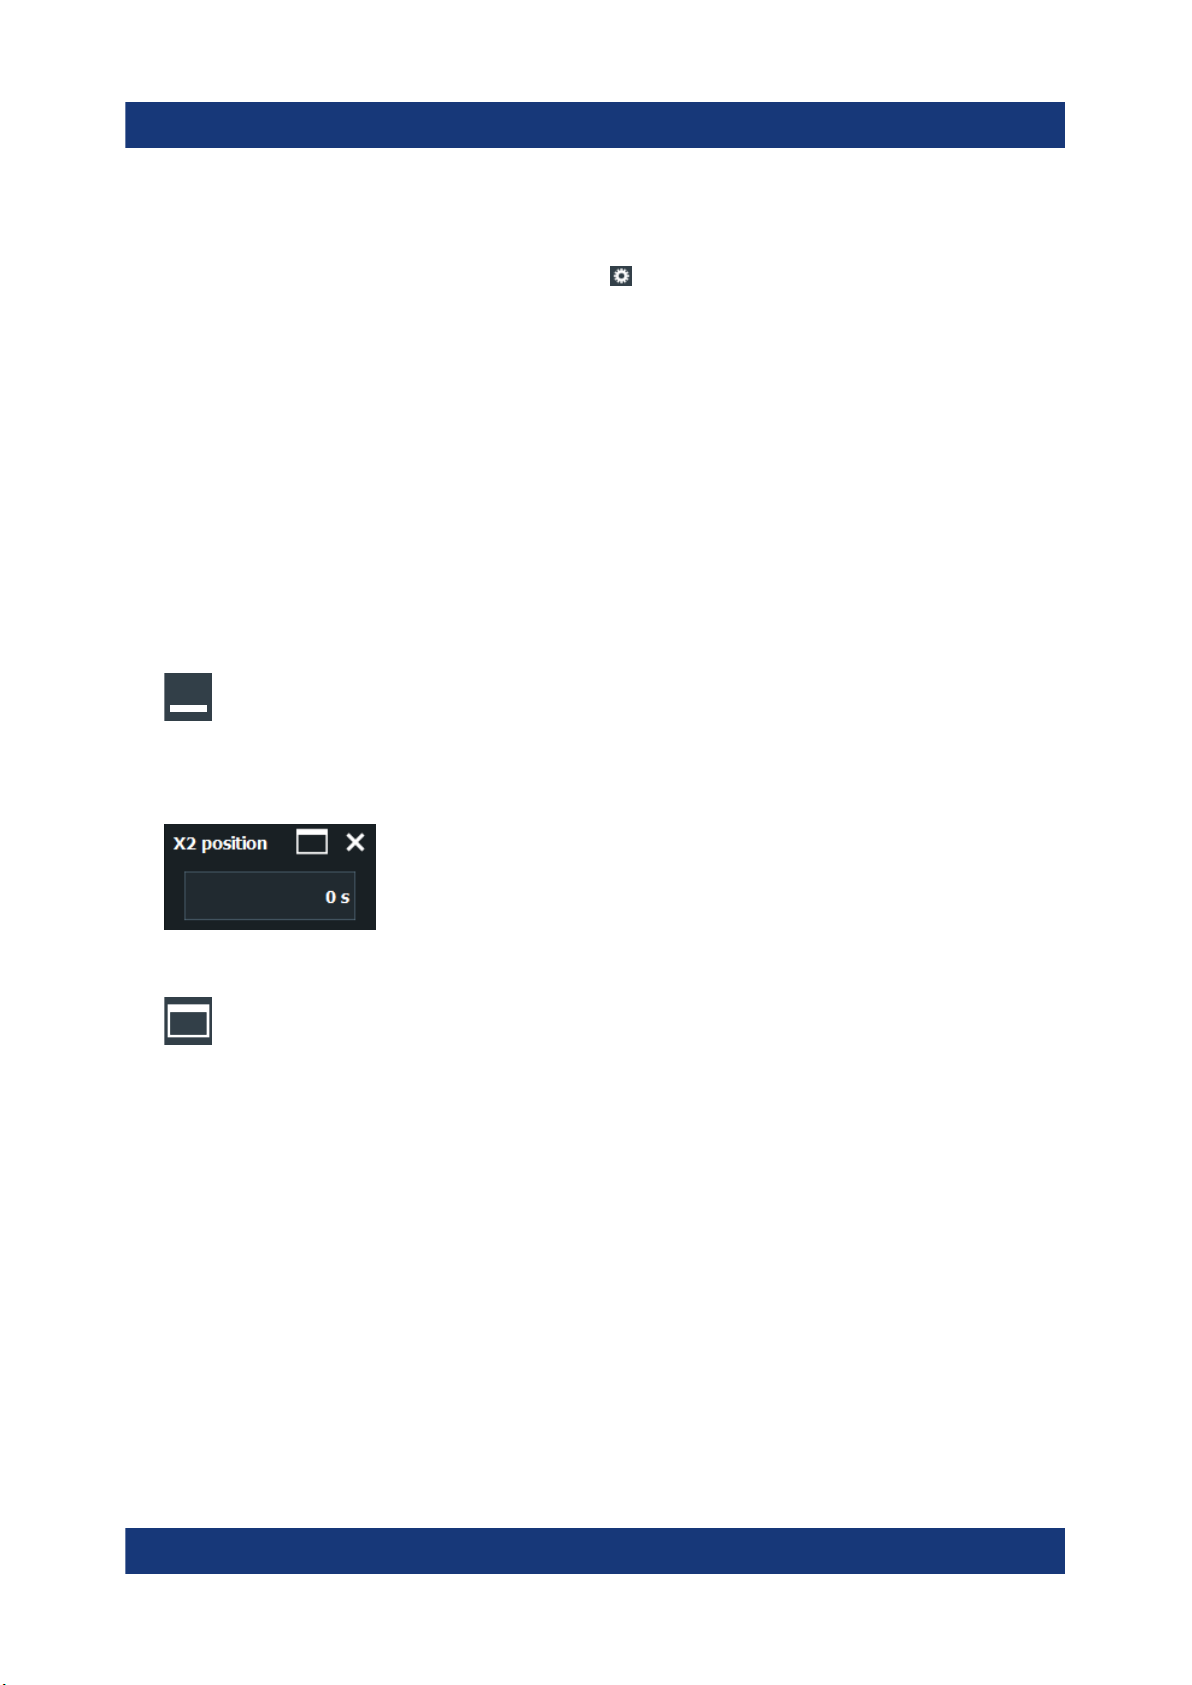
R&S®RTP
● Open the "Menu", and select the menu entry.
● Press the function key on the front panel.
● Double-tap a result icon, or tap the icon in a result box to open the cor-
responding dialog box.
● To open the "Vertical" dialog box of a waveform, tap the signal icon.
● Tap the "Horizontal", "Acquistion" or "Trigger" label to open the corre-
sponding dialog box.
To minimize a dialog box
If you want to change only one setting during analysis, and you need to change it
often, you can display a small box that only contains the required setting.
1. Tap the setting that you need to modify.
2. Tap the "Minimize" icon in the upper right corner of the dialog box.
Operating the instrument
Entering data
The dialog box turns into a small box that contains only the setting, that was
last selected.
3. To restore the complete dialog box, tap the "Maximize" icon in the small box.
To close a dialog box
► Tap the "Close" icon in the upper right corner.
6.9 Entering data
To set parameter values and enter other data, you use the various knobs and the
on-screen keypad or keyboard.
69Getting Started 1337.9946.02 ─ 07
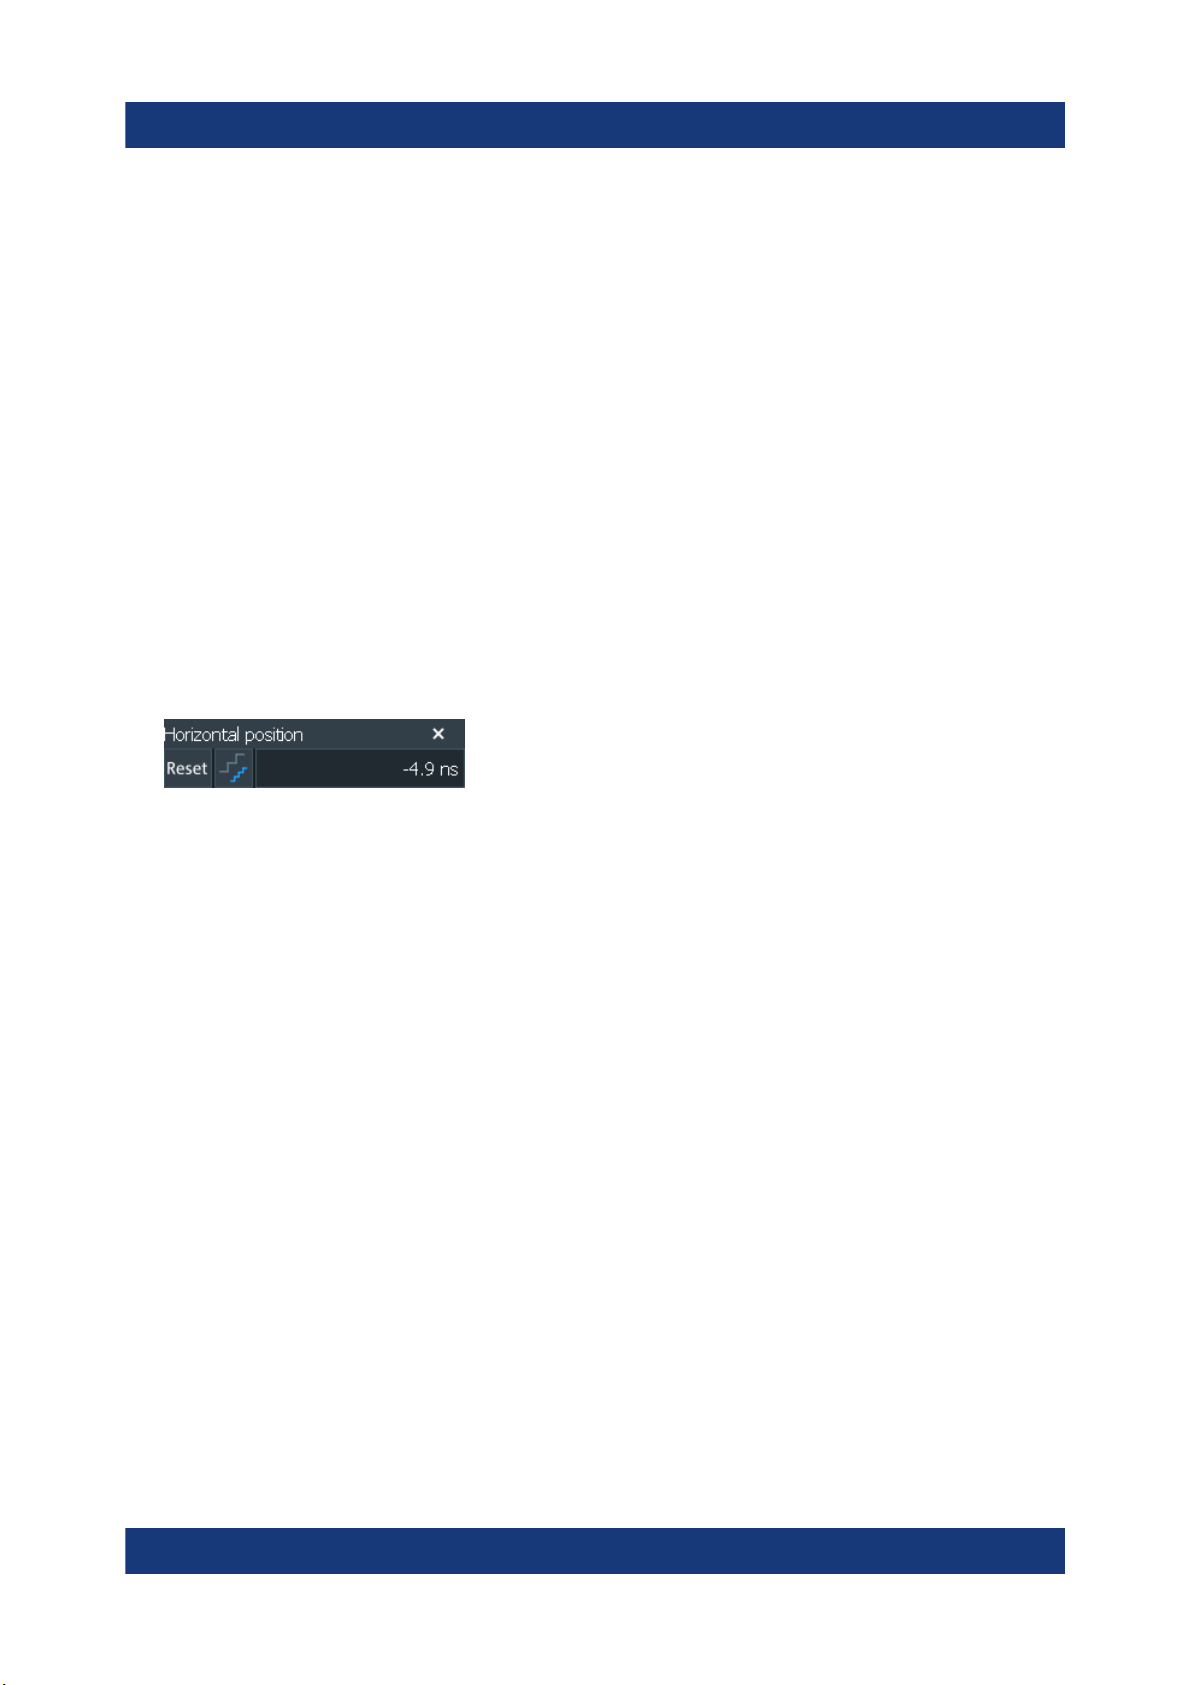
R&S®RTP
Using scale, position and level knobs
The instrument has dedicated rotary knobs to set vertical and horizontal positions
and scale, and the trigger level. When you turn a knob, the input box appears in
the lower right corner of the screen, showing the parameter name and current
value.
1. Turn the knob to change the value.
2. Press the knob:
● [Scale]: to toggle the increment.
● [Position]: to set to zero.
● [Levels]: to set the trigger level to 50% of the signal.
3. The input box also provides settings
● Tap the "Steps" icon to toggle the increment.
● Tap the "Reset" icon to set the parameter to the autoset value (if availa-
ble).
Operating the instrument
Entering data
The [Navigation] knob is described in Chapter 5.3, "Keys and controls",
on page 32.
To enter values with the on-screen keypad
For data input in dialog boxes, the touchscreen provides an on-screen keypad to
enter numeric values and units. For text input, the on-screen keyboard with English key layout is used.
1. Double-tap the entry field.
The on-screen keypad opens.
70Getting Started 1337.9946.02 ─ 07
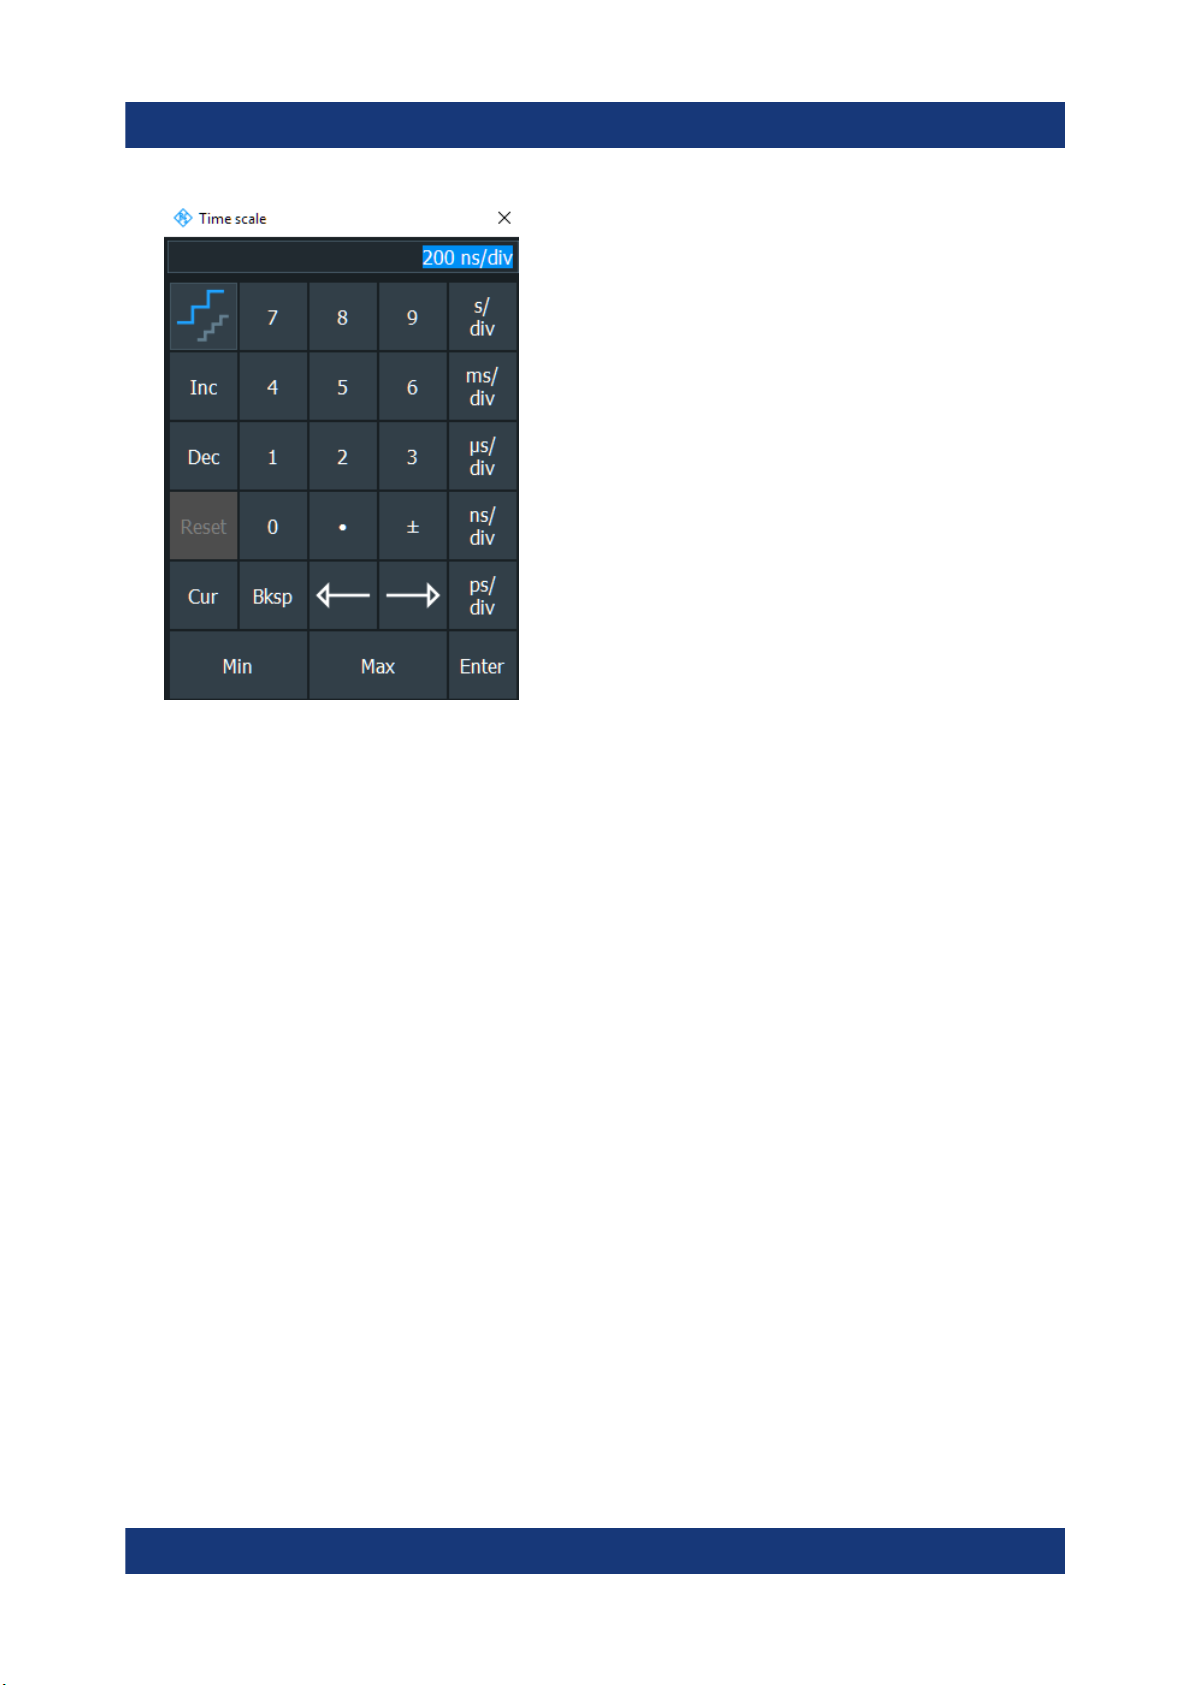
R&S®RTP
Operating the instrument
Entering data
2. Enter the numeric value using the following methods:
● To use the default value, tap "Reset" (if available).
● To use the minimum or maximum value, tap "Min" or "Max", respectively.
● To increase the displayed value in fixed steps, tap "Inc".
To decrease the value in fixed steps, tap "Dec".
To toggle between small steps and large steps, tap the "Steps" icon.
● To get the value that was used before the keypad was displayed, tap
"Cur".
● To enter a user-defined value, tap the numbers and complete the entry by
tapping the unit button.
– The arrow buttons move the cursor left or right.
– "Bksp" deletes the last character before the cursor.
– "±" changes the sign of the value.
To enter data with the on-screen keyboard
1. Double-tap the entry field to open the on-screen keyboard.
If available, you can also tap the keyboard icon on the right of the entry field.
71Getting Started 1337.9946.02 ─ 07
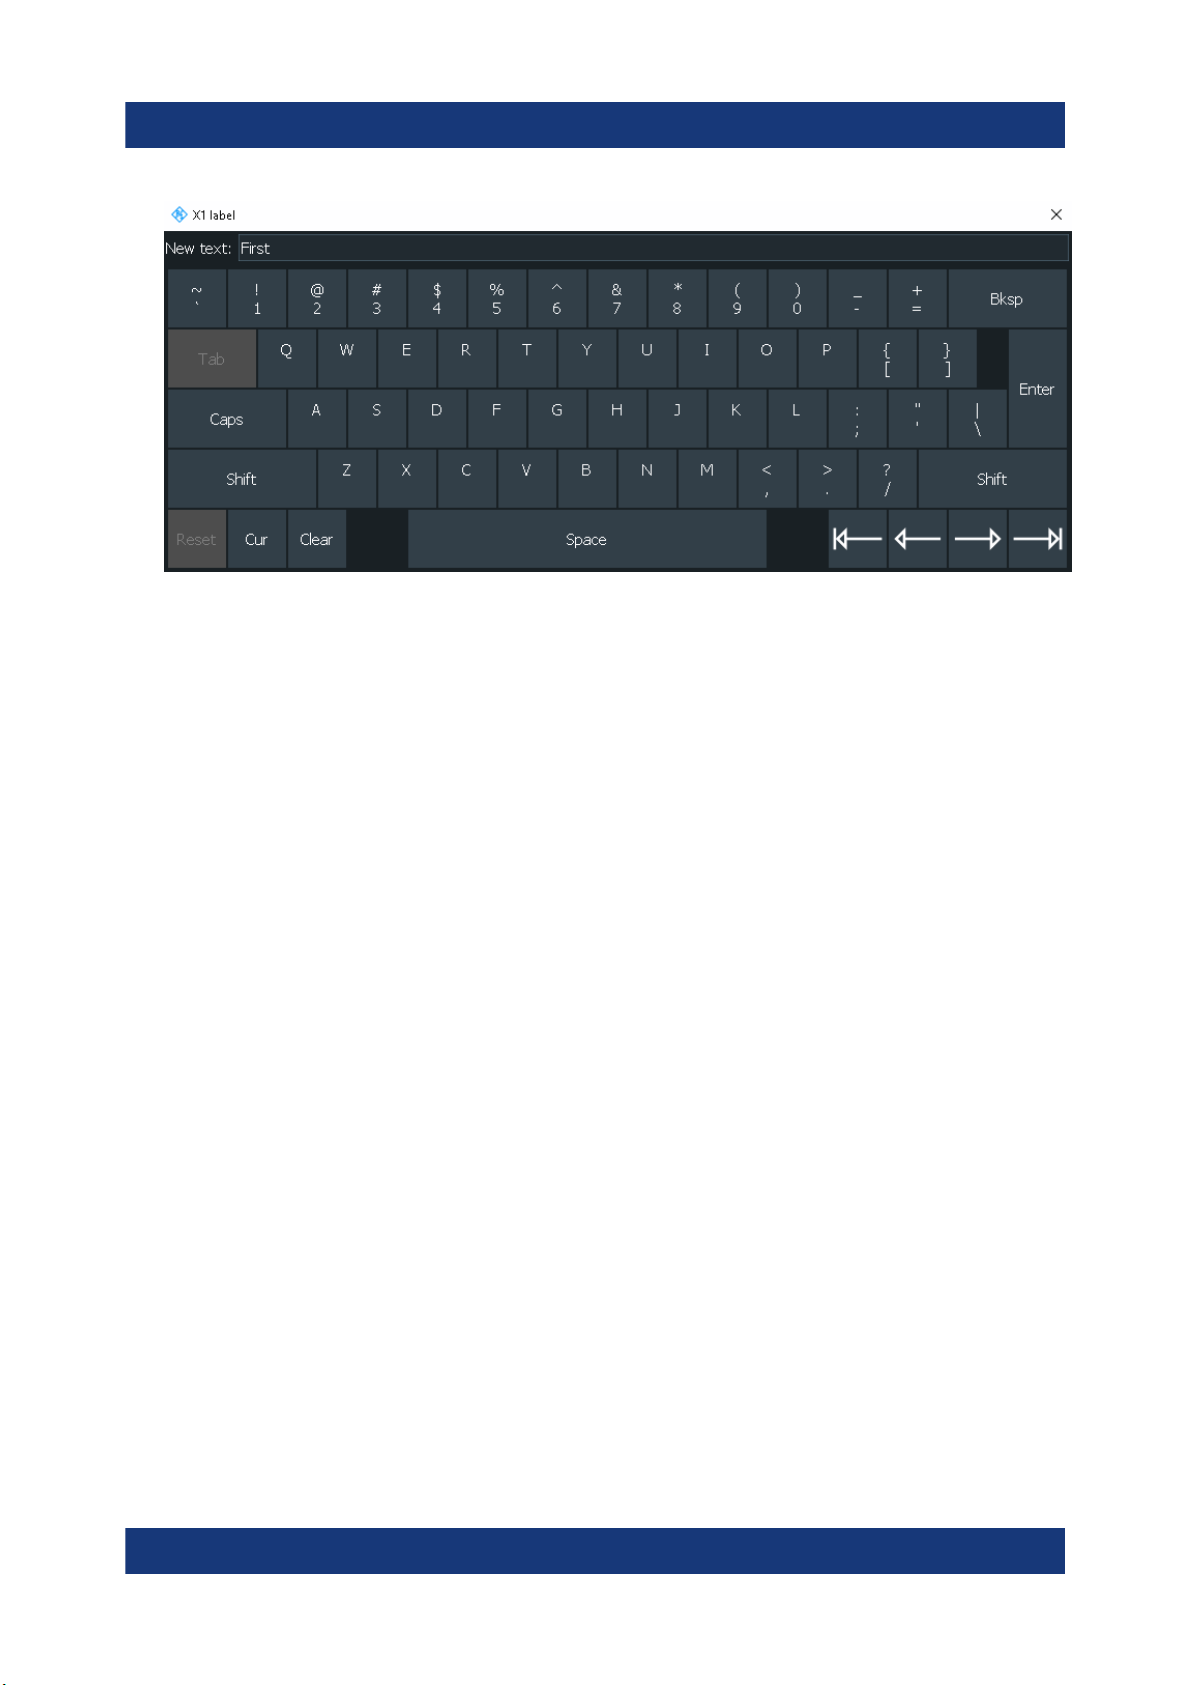
R&S®RTP
Instrument information and notifications
2. Enter the text as you would on a normal keyboard.
● To enter a series of capital characters, tap "Caps".
To enter one capital character, tap "Shift".
● To use the currently defined value, tap "Cur". This is the value that was
used before the keyboard was displayed.
● The arrow buttons move the cursor left or right.
● "Bksp" deletes the last character before the cursor.
Operating the instrument
3. Tap "Enter" to complete the entry.
To enter numeric data in a dialog box with navigation controls
1. To navigate to the entry field, press the [⇤] and [⇥] keys.
2. To change the value with a small step size, turn the rotary knob.
Alternatively, press the [▲] and [▼] keys for a larger step size.
If you edit numeric data in tables, the entry field must be in edit mode. To activate
the edit mode, press ENTER, or the [☑] key, or the navigation rotary knob.
6.10 Instrument information and notifications
In the upper right corner of the screen, you see the Rohde & Schwarz logo, date
and time, the symbolic information on LAN connection and the notifications status.
72Getting Started 1337.9946.02 ─ 07
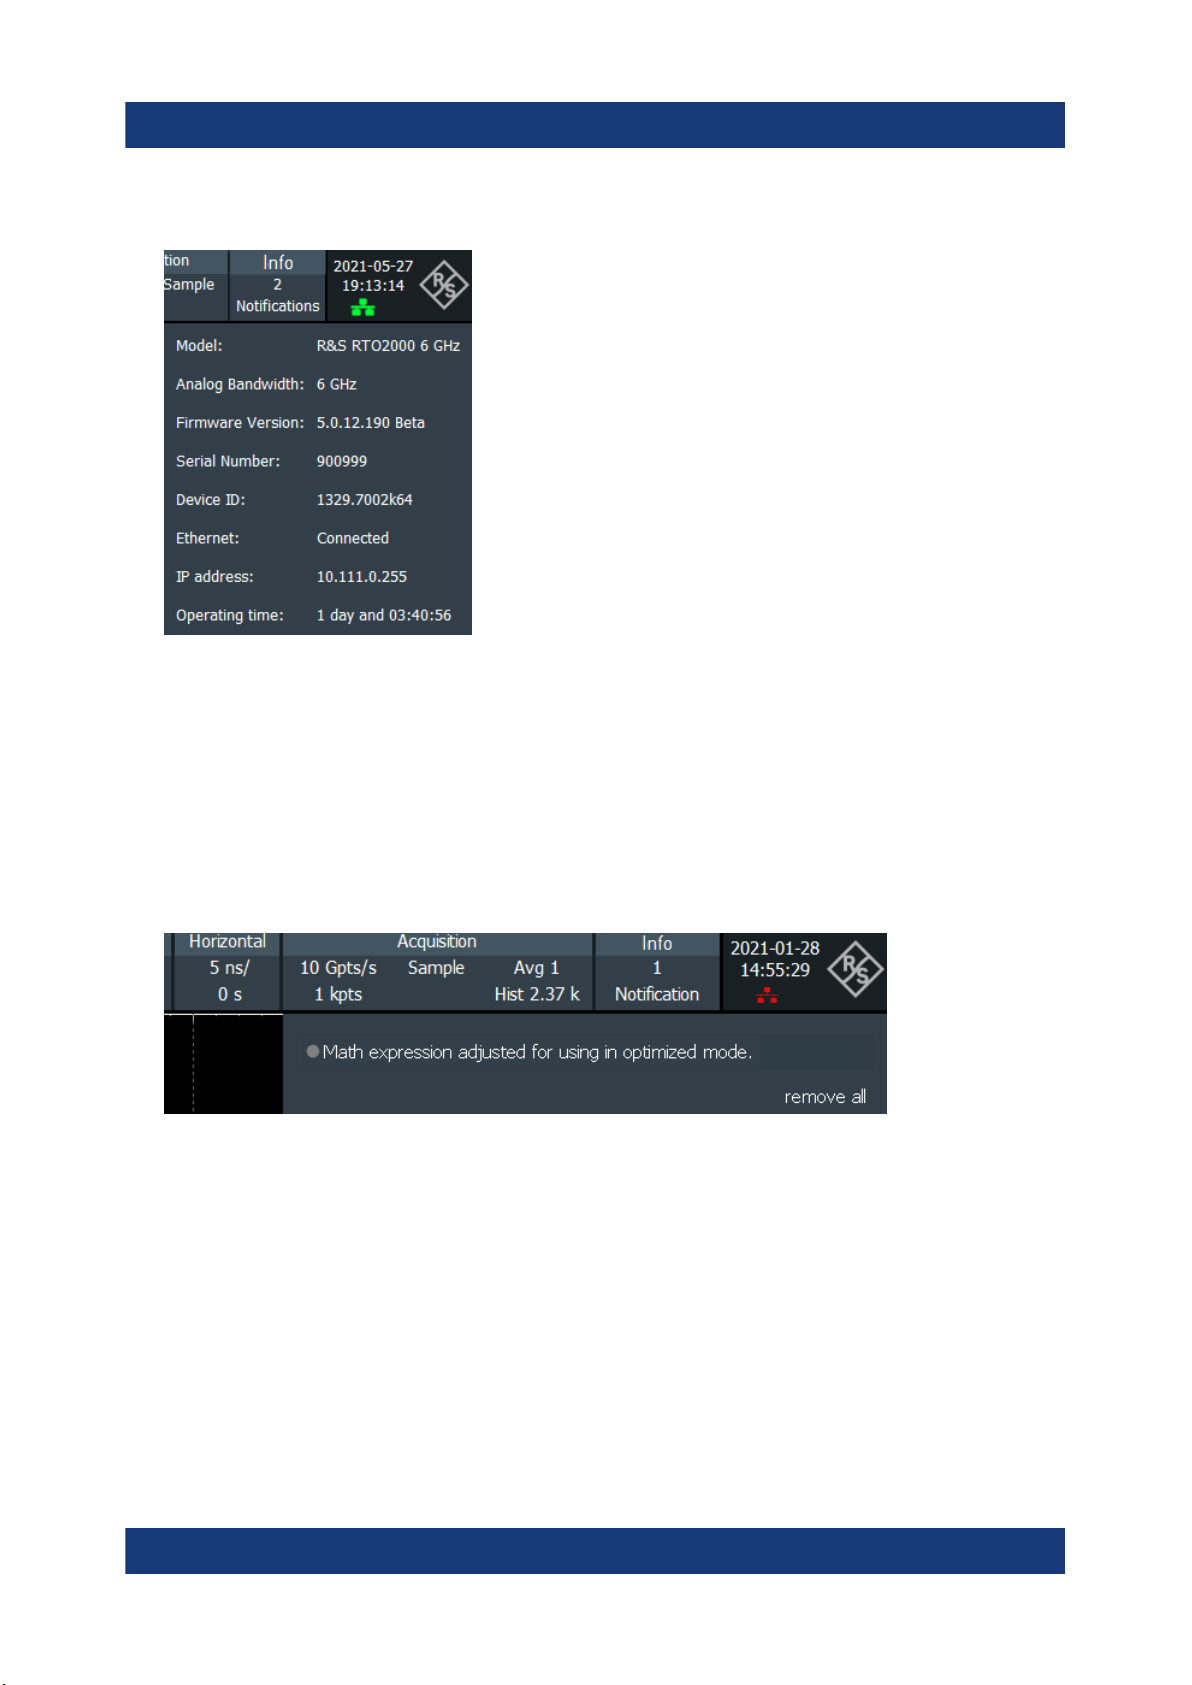
R&S®RTP
► To see the instrument information, tap the Rohde & Schwarz logo.
Notifications are status messages, information on mismatching settings and similar information. They are displayed for a few seconds and saved.
Operating the instrument
Getting information and help
The color of the dot before the text indicates the severity: gray for information,
orange for warnings, and red for errors.
► To read the notifications, tap "Notification".
You can also delete the list of notifications.
1. To hide the date and time, open "Menu" > "Settings" > "Appearance" > "Diagram" tab.
2. Disable "Show date / time".
6.11 Getting information and help
If you need information on the instrument's functionality, you can use the following
sources:
73Getting Started 1337.9946.02 ─ 07

R&S®RTP
●
Tooltips give a short description of the parameter.
●
The context help provides functional description on a setting, and the corresponding remote command.
●
The general help opens the help window with a table of contents, where you
can browse and search for information.
●
Videos explain various analyzing and measurement tasks.
They are available in the R&S®RTP - Media Center.
Operating the instrument
Getting information and help
6.11.1 Displaying help
To display tooltips and context help
1. Enable the "Help" icon on the toolbar.
2. Tap the parameter for which you need information.
The tooltip opens.
3. To open the corresponding help topic, tap the "Show Help" button in the lower
right corner of the tooltip.
The "Help" window opens and displays the comprehensive description and
the corresponding remote command. You can browse the help for further
information.
Note: The tooltip icon disables automatically when you tap a parameter. To
show another tooltip, tap the tooltip icon again.
To open general help
1. Open the "Menu".
2. Tap the "Help" icon.
The help window opens with the "Contents" page, where you can select the
topics.
6.11.2 Using the help window
The Help window contains several tabs:
●
"View" - shows the selected help topic
74Getting Started 1337.9946.02 ─ 07

R&S®RTP
●
"Contents" - contains a table of help contents
●
"Index" - contains index entries to search for help topics
●
"Search" - provides text search
The Help toolbar provides some buttons:
●
To browse the topics in the order of the table of contents: Up arrow = previous
topic, Down arrow = next topic
●
To browse the topics visited before: Left arrow = back, Right arrow = forward
●
To increase or decrease the font
To navigate the Help, use the touchscreen.
Operating the instrument
Getting information and help
To search for a topic in the index
The index is sorted alphabetically. You can browse the list, or search for entries in
the list.
1. Switch to the "Index" tab.
2. Select the "Keyboard" icon besides the entry field.
3. Enter the first characters of the keyword you are interested in.
The entries containing these characters are displayed.
4. Double-tap the suitable index entry.
The "View" tab with the corresponding help topic is displayed.
To search topics for a text string
1. Switch to the "Search" tab.
2. Select the "Keyboard" icon besides the entry field.
3. Enter the string you want to find.
If you enter several strings with blanks between, topics containing all words
are found (same as AND operator).
For advanced search, consider the following:
● To find a defined string of several words, enclose it in quotation marks. For
example, a search for "trigger qualification" finds all topics with exactly
75Getting Started 1337.9946.02 ─ 07

R&S®RTP
"trigger qualification". A search for trigger qualification finds all topics that
contain the words trigger and qualification.
● Use "Match whole word" and "Match case" to refine the search.
● Use operators AND, OR, and NOT.
To close the Help window
► Select the "Close" icon in the upper right corner of the help window.
Or: Press the [Esc] key.
Operating the instrument
Getting information and help
76Getting Started 1337.9946.02 ─ 07

R&S®RTP
Setting up the instrument
Performing a self-alignment
7 Setting up the instrument
Basic setup procedures for the instrument are the following:
● Performing a self-alignment............................................................................ 77
● Setting the display language...........................................................................78
7.1 Performing a self-alignment
The self-alignment aligns the data from several input channels vertically and horizontally to synchronize the timebases, amplitudes and positions. The self-alignment process includes a basic hardware check.
Recommendation on performing the self-alignment:
●
When putting the instrument into operation for the first time
●
After a firmware update
●
Once a week
●
When major temperature changes occur (> 5°)
1. Warm up the instrument before you start the self-alignment. The minimum
warm-up time is indicated in the data sheet.
2. Remove the probes from the input connectors.
3. In the "Menu" > "Settings" menu, select "Maintenance".
4. In the "Alignment" tab, tap "Start Alignment".
The alignment is performed, the process might take several minutes. A message box informs you about the running process, wait until this message box
closes.
The overall pass/fail result is shown in the "Overall alignment state" field. The
results of the individual alignment steps for each input channel are indicated in
the "Results" tab. This information is required if problems arise.
77Getting Started 1337.9946.02 ─ 07

R&S®RTP
Setting up the instrument
Setting the display language
7.2 Setting the display language
You can change the language in which the dialog boxes, result boxes and other
screen information is displayed. A reboot of the instrument is not necessary.
1. Open the "Menu" > "Settings" > "System" dialog.
2. Select the "Localization" tab.
3. Tap the "Language" button. The button shows the current language.
4. Select the required language.
The instrument changes the language after a few seconds.
78Getting Started 1337.9946.02 ─ 07

R&S®RTP
Contacting customer support
8 Contacting customer support
Technical support – where and when you need it
For quick, expert help with any Rohde & Schwarz product, contact our customer
support center. A team of highly qualified engineers provides support and works
with you to find a solution to your query on any aspect of the operation, programming or applications of Rohde & Schwarz products.
Contact information
Contact our customer support center at www.rohde-schwarz.com/support, or fol-
low this QR code:
Figure 8-1: QR code to the Rohde & Schwarz support page
79Getting Started 1337.9946.02 ─ 07

R&S®RTP
Index
Index
A
Acquisition
Key ......................................................35
Single, multiple ................................... 39
Start .................................................... 39
Stop .................................................... 39
Active waveform ...................................... 54
Aligning
Input channels .................................... 77
App Cockpit key ...................................... 40
Arranging waveforms .............................. 56
Auto trigger mode ....................................39
Autoset
Key ......................................................32
B
Bench top operation ................................ 18
Brochure ..................................................15
C
Cable, USB ..............................................27
Camera key ............................................. 33
Ch <n> keys ............................................ 36
Channel
Ch <n> keys ........................................36
Offset .................................................. 37
Waveforms ..........................................53
Connectors
Channel input ......................................27
External trigger input ...........................27
Coupled zoom
quick access ....................................... 63
Cursor key ............................................... 39
Cursors ....................................................63
Customer support ....................................79
D
Data entry ................................................69
Data sheet ............................................... 15
Delete ...................................................... 66
Demo .......................................................62
Diagrams ................................................. 46
Dialog boxes ............................................50
Background transparency ...................34
Usage ................................................. 68
Digital waveforms .................................... 53
Display
Key ......................................................33
Overview .............................................45
Display elements
Diagram .............................................. 45
Input box ............................................. 50
Menu ...................................................50
Result box ...........................................50
Signal bar ............................................45
Toolbar ................................................ 50
DisplayPort ........................................ 25, 31
DVI-D .................................................25, 30
DVI-D connector ......................................30
E
Esc key ....................................................42
External monitor ................................ 25, 30
External trigger output ............................. 31
F
FFT ..........................................................65
Key ......................................................41
Find
Remote control command ...................74
Find trigger level ......................................62
Function generator option ....................... 28
G
GBIP connector ....................................... 31
Getting started .........................................14
Grid ..........................................................47
Grounding ................................................21
H
Hardware zoom ....................................... 63
Help ................................................... 14, 61
Key ......................................................33
Open ................................................... 74
Search for topic ...................................75
Using ...................................................74
Histograms .............................................. 64
Area .................................................... 50
Diagram .............................................. 50
History key ...............................................41
Horizontal
Controls .............................................. 34
Key ......................................................34
80Getting Started 1337.9946.02 ─ 07

R&S®RTP
Index
Label ................................................... 49
Position ............................................... 35
Reference point .................................. 35
I
Input box ..................................................50
Intensity key ............................................ 34
Intensity of display elements ................... 34
K
Keyboard
On-screen ........................................... 69
Usage ................................................. 44
Keyboard, connecting ..............................24
Keypad .................................................... 69
L
Label ........................................................65
LAN
Connector ........................................... 30
Language
Changing ............................................ 78
Levels knob ............................................. 38
Lock touchscreen .................................... 33
Logic key ................................................. 36
Logic probe connector .............................28
M
Mask key ................................................. 40
Mask test ................................................. 64
Math key ..................................................37
Math waveforms ................................ 37, 53
Meas key ................................................. 40
Measurement .......................................... 64
Minimized waveform ................................54
Mixed Signal Option ................................ 28
Mode
Key (trigger) ........................................ 39
Monitor .............................................. 25, 30
Mouse
Usage ................................................. 44
Mouse, connecting .................................. 24
MSO ........................................................ 28
N
Navigation controls
Data input ........................................... 72
Keys ....................................................42
Overview .............................................41
Normal trigger mode ................................39
Notification ...............................................48
Numeric data entry .................................. 69
O
OCXO ......................................................31
Offset
Channel .............................................. 37
OK key .....................................................42
On/Off key ............................................... 32
Open source acknowledgment ................16
Operation
Concepts .............................................44
Manual ................................................ 44
Options
hardware installation ...........................28
R&S RTP-B1 (MSO) ........................... 28
R&S RTP-B1E (for R&S RT-ZVC) ...... 28
R&S RTP-B6 (waveform and function
generator) ........................................... 28
P
Position
Horizontal ............................................35
Vertical ................................................ 37
Power
Connector ........................................... 30
Key ......................................................32
On/Off ................................................. 21
Preset key ............................................... 32
Probes
Compensation .....................................27
Projector .................................................. 25
Protocol key .............................................40
Q
Quick Action key ......................................33
Quick measurements .............................. 65
R
Rack mounting ........................................ 19
Record length
Rotary knob ........................................ 35
Redo ........................................................61
Key ......................................................42
Ref In .......................................................31
Ref key .................................................... 36
Ref Out .................................................... 31
Reference point ................................. 35, 48
Reference waveforms ....................... 36, 53
Release notes ......................................... 16
81Getting Started 1337.9946.02 ─ 07

R&S®RTP
Index
Remote control ........................................ 44
Find command using help ...................74
Remote Desktop ......................................44
Remote operation ....................................44
Res Rec Len key ..................................... 34
Resolution
Rotary knob ........................................ 35
Result boxes ............................................50
Background transparency ...................34
Displaying ........................................... 66
Results
Configuring display ............................. 66
Run ..........................................................39
Run / Stop ............................................... 62
Run Stop key ...........................................39
S
Safety instructions ................................... 15
Save Recall key .......................................33
Save Reference .......................................65
Save Waveform .......................................65
Scale
Horizontal, rotary knob ........................35
Vertical, rotary knob ............................ 37
Screen resolution .................................... 25
Search ..................................................... 63
Key ......................................................40
Searching
In help ................................................. 75
Select
Waveform ............................................55
Selected waveform ..................................54
Self-alignment ......................................... 77
Service manual ........................................15
Setup
Controls .............................................. 32
Key ......................................................33
Signal bar ................................................ 49
Signal icons ............................................. 49
Signal label ..............................................49
Signal Off key .......................................... 37
Signal view .............................................. 49
Single ...................................................... 62
Single key ................................................39
Slope
Key ......................................................38
SmartGrid ................................................ 56
Source key .............................................. 38
Spectrogram ............................................66
Switch off
Waveform ............................................56
Switch on
Waveform ............................................55
T
Temperature
Changes ............................................. 77
Text entry ................................................. 69
Time base ................................................35
Time scale ............................................... 35
Toolbar .....................................................57
Coupled zoom .....................................63
Cursor ................................................. 63
Delete ................................................. 66
FFT ..................................................... 65
Find level ............................................ 62
Hardware zoom .................................. 63
Hide/show icons ..................................59
Histogram ........................................... 64
Label ................................................... 65
Load saveset ...................................... 61
Masks ................................................. 64
Measure ..............................................64
Overview .............................................59
Quick measurement ............................65
Redo ................................................... 61
Run / Stop ...........................................62
Save Reference .................................. 65
Save Waveform .................................. 65
Search ................................................ 63
Show tooltips ...................................... 61
Single ..................................................62
Undo ................................................... 61
Zone trigger ........................................ 65
Zoom ...................................................63
Tooltips .................................................... 61
Show ...................................................74
Touch Lock key ........................................33
Touchscreen
Compared with mouse ........................44
Control elements .................................50
Lock, unlock ........................................33
Usage ................................................. 44
Transparency ...........................................34
Trigger
Controls .............................................. 37
External output ....................................31
Key ......................................................38
Label ................................................... 49
82Getting Started 1337.9946.02 ─ 07

R&S®RTP
Index
Level ............................................. 38, 47
Mode ...................................................39
Position ............................................... 47
Slope ...................................................38
Source ................................................ 38
Trigger level
Find .....................................................62
U
Undo ........................................................61
Key ......................................................42
Unlock touchscreen .................................33
USB
Cable .................................................. 27
Connecting devices ............................ 23
Connector ........................................... 27
Device .................................................30
USB flash drive, connecting .................... 24
User manual ............................................ 14
V
Vertical
Controls .............................................. 36
Position / Offset .................................. 37
VNC .........................................................44
Z
Zone trigger ............................................. 65
Zoom
Area .................................................... 48
Diagram .............................................. 48
Key ......................................................40
Quick access ...................................... 63
Waveforms ..........................................53
W
Waveform generator option .....................28
Waveforms
Arrange ............................................... 56
Channel .............................................. 53
Display intensity ..................................34
Math ....................................................53
Minimize ..............................................55
Overview and usage ........................... 53
Reference ........................................... 53
Select ..................................................55
States ..................................................54
Switch off ............................................ 56
Switch on ............................................ 55
XY ....................................................... 53
Zoom ...................................................53
Web interface .......................................... 44
Windows
Access ................................................ 24
X
XY-waveforms ......................................... 53
83Getting Started 1337.9946.02 ─ 07
 Loading...