

Rohde&Schwarz R&S®ZNrun User Manual
R&S®ZNrun
Vector Network Analyzer
Automation Suite
User Manual
(;Úñ62)
1176990602
Version 09

This manual describes the R&S®ZNrun application software and related options:
●
R&S®ZNRUN-K1 "Automated test software for VNAs",
local license (1326.7124.02) or floating license (1326.7124.51)
●
R&S®ZNRUN-K2 "Multi-client capability",
local license (1326.7130.02) or floating license (1326.7130.51)
●
R&S®ZNRUN-K5 "DUT/VNA multiplicity",
local license (1334.4250.02) or floating license (1334.4250.51)
●
R&S®ZNRUN-K6 "Measurement tuning capability",
local license (1334.4237.02) or floating license (1334.4237.51)
●
R&S®ZNPC, license dongle for local licenses (1325.6601.02)
●
R&S®ZNPC-FL, license dongle for floating licenses (1325.6601.03)
© 2022 Rohde & Schwarz GmbH & Co. KG
Muehldorfstr. 15, 81671 Muenchen, Germany
Phone: +49 89 41 29 - 0
Email: info@rohde-schwarz.com
Internet: www.rohde-schwarz.com
Subject to change – data without tolerance limits is not binding.
R&S® is a registered trademark of Rohde & Schwarz GmbH & Co. KG.
Trade names are trademarks of the owners.
1176.9906.02 | Version 09 | R&S®ZNrun
The following abbreviation is used throughout this manual: R&S® is abbreviated as R&S.

R&S®ZNrun
Contents
Contents
1 Introduction............................................................................................ 5
2 Getting Started....................................................................................... 7
3 Application Overview...........................................................................11
4 ZNrun Workbench................................................................................15
5 ZNrun Calibration Client......................................................................61
6 ZNrun Measurement Client................................................................. 69
7 ZNrun Cable Test Client.......................................................................71
8 ZNrun Settings app..............................................................................79
Glossary: Frequently used terms.......................................................85
3User Manual 1176.9906.02 ─ 09

R&S®ZNrun
Contents
4User Manual 1176.9906.02 ─ 09

R&S®ZNrun
Introduction
1 Introduction
R&S ZNrun is a PC-based software suite for the definition, configuration and execution
of automated VNA tests. It controls the involved measurement devices (VNAs, switch
matrices, calibration units) and supports many Rohde & Schwarz instruments. A plugin interface is provided to control additional measurement equipment and devices
under test via VISA connections.
R&S ZNrun stands for modularity, extensibility, compatibility and optimized speed of
measurement execution. Therefore it is ideal for use in high volume production of multiport devices requiring control during test, e.g. for testing the RF properties in various
operating states.
Setting up R&S ZNrun for testing is as simple as describing the test setup (test equipment, DUTs) and defining the test sequence. Configurations are modular and reusable
and therefore minimize your configuration time. Based on the configuration,
R&S ZNrun calculates a connection plan, which is optimized for both quality and measurement speed. It also calculates an initialization sequence, calibration plan and a
speed-optimized test plan. At execution time, R&S ZNrun verifies that the measurement can be performed with the connected measurement equipment.
Another use case of R&S ZNrun is cable testing. Refer to Chapter 7,
"ZNrun Cable Test Client", on page 71.
R&S ZNrun comes with the following applications:
●
ZNrun Server
The core of the software suite. Runs and manages Measurement Execution Units
(MEUs). A plug-in interface enables user-defined extensions, such as custom devices and post processors. See Chapter 3, "Application Overview", on page 11.
●
ZNrun Workbench
The main graphical user interface (GUI) of R&S ZNrun. Allows you to develop, test
and tune a MEU, before it is used in the production field. Deploys the MEU to a
ZNrun Server and communicates with the server during MEU execution. Integrates
or gives access to the other R&S ZNrun applications (ZNrun Calibration Client,
ZNrun Measurement Client, ZNrun Visualization Client). See Chapter 4,
"ZNrun Workbench", on page 15.
●
ZNrun Calibration Client
A GUI application for guiding a technician through all the steps of the calibration
process. For laboratory use, it offers a more advanced interface, which allows definition of user-defined calibration tasks. See Chapter 5, "ZNrun Calibration Client",
on page 61.
●
ZNrun Measurement Client
An application for controlling the execution of a MEU on a ZNrun Server. Provides
a graphical and a remote control interface (SCPI commands). A plug-in interface
enables user-defined extensions, such as the creation of custom log files and
reports. See Chapter 6, "ZNrun Measurement Client", on page 69.
●
ZNrun Visualization Client
5User Manual 1176.9906.02 ─ 09

R&S®ZNrun
Introduction
The ZNrun Visualization Client allows you to visualize and document measurement
results. It is available as a stand-alone application and integrated in the
ZNrun Workbench. See Chapter 4.5.2, "Visualization Workspace", on page 55.
●
ZNrun Cable Test Client
The ZNrun Cable Test Client allows even more streamlined measurements with
predefined MEUs. This client is particularly useful if the user has to measure a multitude of DUTs (e.g. cables), where standard measurements and appropriate calibrations are requested. See Chapter 7, "ZNrun Cable Test Client", on page 71.
6User Manual 1176.9906.02 ─ 09

R&S®ZNrun
2.1 Installation
Getting Started
2 Getting Started
R&S ZNrun can be installed on a single PC running Windows 10 (32-bit or 64-bit). A
full installation requires up to 600 Mbyte available disk space for the 32-bit, and up to
1.5 Gbyte for the 64-bit installation.
The installer must be run with administrative privileges and possibly finishes with a
reboot. The following components are automatically installed, if not already present on
the target PC:
●
.NET Framework 4.7.2
●
R&S VISA library (32-bit or 64-bit), the Rohde & Schwarz implementation of the
VISA I/O API
●
R&S License Server software
Installation
The following features are offered for installation:
●
"ZNrun Server", "Cable Test Client", "Calibration Client", "Measurement Client",
"Visualization Client", "Workbench": see Chapter 1, "Introduction", on page 5
●
"Templates (Examples)": R&S ZNrun also provides a rich application programming
interface for the creation of custom plug-ins and clients. To get you started with this
API, examples are provided as a Visual Studio 2017 solution. The template examples are installed at
C:\ProgramData\Rohde-Schwarz\ZNrun\2.50x\Resources\Templates.
●
"Multiple VNA Control": currently not supported
●
"Generic Python Plugin": enables Python scripting of ZNrun Server plug-ins.
7User Manual 1176.9906.02 ─ 09

R&S®ZNrun
2.2 Running Your First Measurement
Getting Started
Licensing
●
"Generic Report Generator Plugin": allows a plugin developer to create PDF
reports from a plugin
●
"Default Plug-ins": Currently only comprises a single plug-in for the ZNrun Measurement Client. Its source code is included in the "Templates (Examples)" installer
feature.
Note that the provided plug-ins are not part of the regular software maintenance.
For development of custom device or post-processor plugins, you need Microsoft Visual Studio 2017 or higher.
Before running your first measurement (using a single VNA), make sure the
ZNrun Server machine can access VNA via remote control, using communication interfaces such as LAN, USB, or GPIB. If peripheral devices (calibration units, switch matrices, ...) are also needed, connect them to the VNA.
To run your first measurement on real hardware, perform the following steps:
1. Start the ZNrun Server: select "R&S ZNrun 2.50 > ZNrun Server" from the Win-
dows Start menu.
2. Run the ZNrun Workbench: select "R&S ZNrun 2.50" > "ZNrun Workbench" from
the Windows start menu.
The ZNrun Workbench allows you to create a ZNrun project.
3. Click the "Start" button in the main toolbar of the ZNrun Workbench to trigger the
following actions:
a) The workbench sends the project to the server. If the project is valid, the server
creates a "Measurement Execution Unit" (MEU) from it.
b) The server executes the first measurement cycle.
To run a measurement, a ZNrun Server with a valid license R&S ZNRUN-K1 is
required. The license is contained in the Licensing and must be installed on the same
machine where the ZNrun Server runs.
2.3 Licensing
Running the ZNrun Server requires a valid core license R&S ZNRUN-K1, and, depending on the desired features, additional licenses for options R&S ZNRUN-K2 etc.
Licenses are available as local and floating variants.
●
Local licenses must be available on the ZNrun Server.
8User Manual 1176.9906.02 ─ 09
R&S®ZNrun
Getting Started
Licensing
●
Floating licenses can also reside on remote license servers that can be reached
by the ZNrun Server's license server via LAN.
R&S ZNPC license dongle
R&S ZNRUN licenses "live" on dedicated R&S ZNPC IC chips that are delivered as a
smart card and a USB dongle. You can either use the smart card with a smart card
reader, or remove the license chip and insert it into the USB dongle.
Figure 2-1: R&S ZNPC license dongle
In any case, the license chip must be properly detected by the license server instance
on the PC it is physically connected to. Make sure the RSSmartCardService driver is
installed, when the smart card or dongle is connected to this PC for the first time.
R&S License Server
The R&S License Server is used for option management on a PC, device or server. It
supports:
●
parallel usage of local dongles by multiple applications ("shared access")
●
license verification via LAN, using https connections to central license servers with
floating licenses
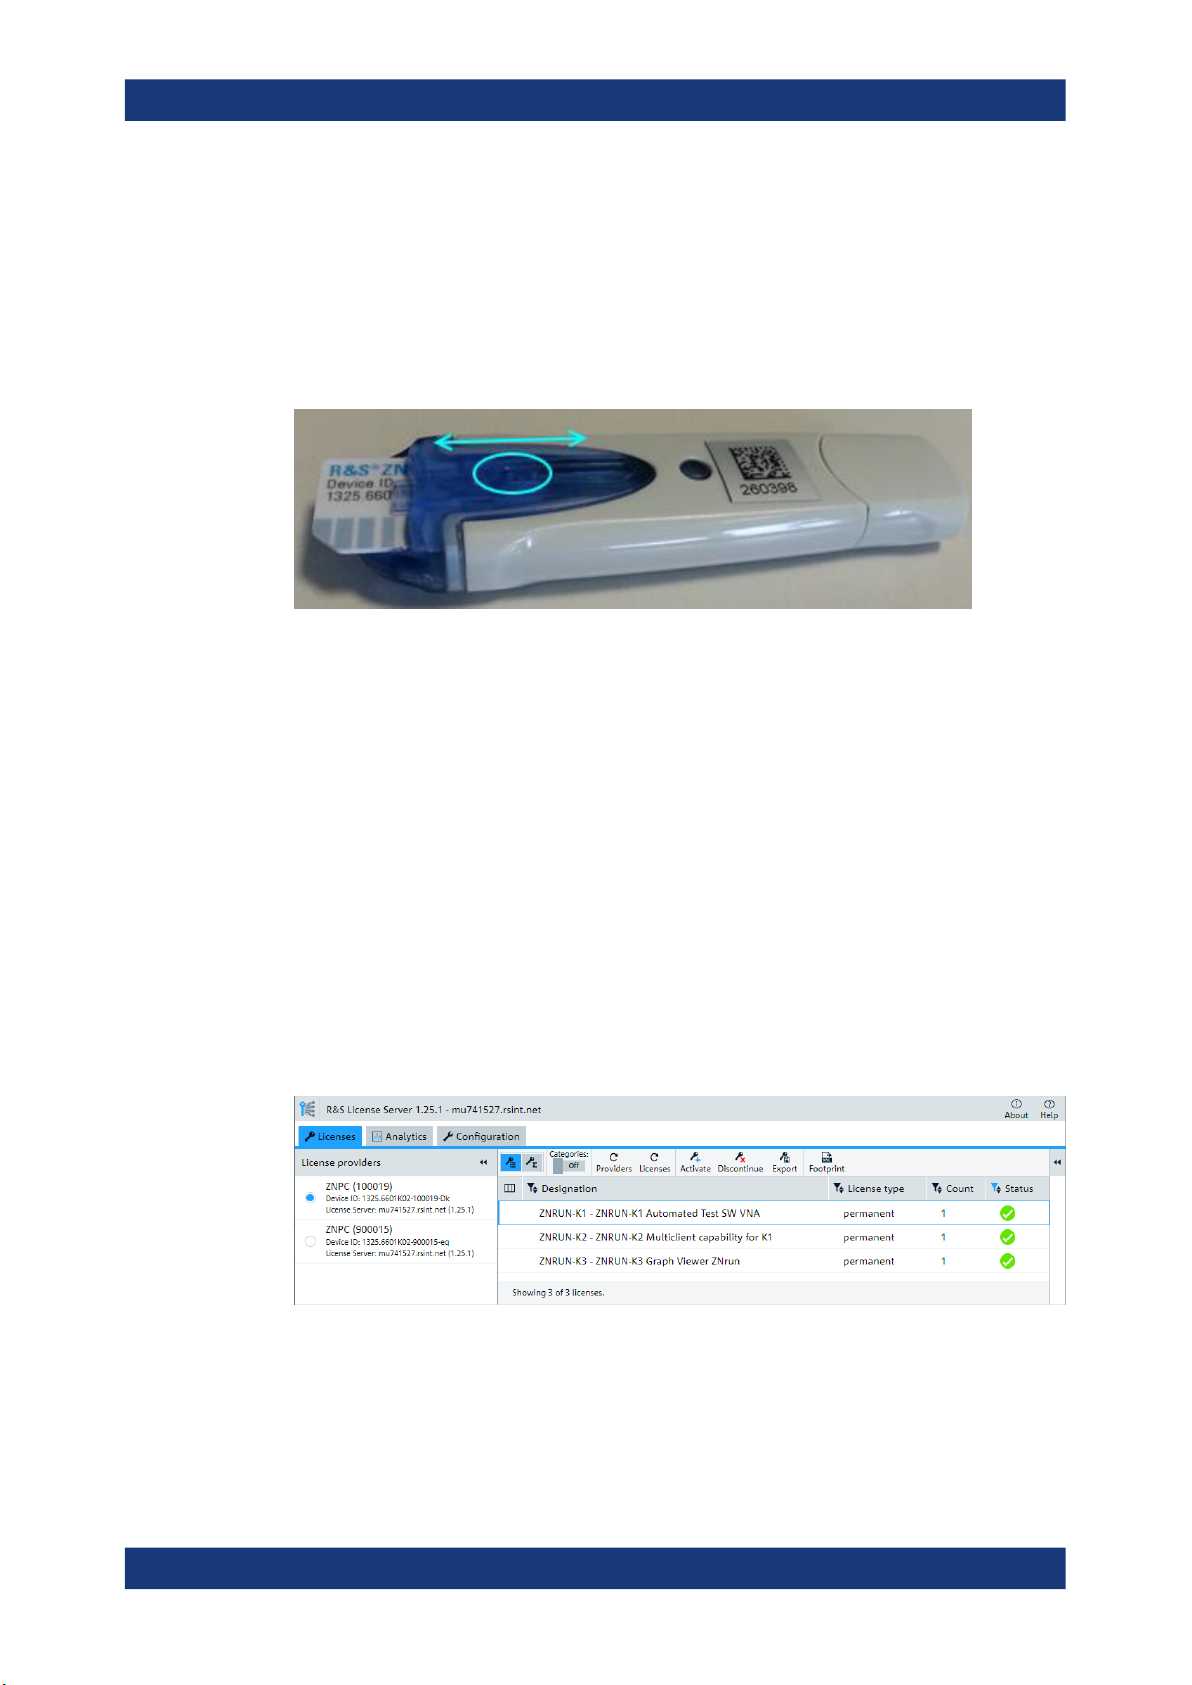
If the ZNrun Server complains about missing licenses, run the R&S License Server
Manager browser app from the Windows start menu of the ZNrun Server PC ("Start" >
"R&S License Server" > "R&S License Server Manager"). Make sure the required
R&S ZNPC licenses are visible in the "Licenses" tab.
If you want to use local licenses but no local licenses are visible, verify that the smart
card or license dongle is properly inserted into the smart card reader or USB port of the
ZNrun Server PC, respectively. If a license dongle is used, make sure that the IC chip
is fully inserted into the dongle (see Figure 2-1).
9User Manual 1176.9906.02 ─ 09
R&S®ZNrun
Getting Started
Licensing
If you want to use floating licenses, make sure to define one or more remote floating
license servers in the license server manager of the ZNrun Server PC and check their
connection state.
●
Local licenses are only allowed on a license dongle R&S ZNPC, floating licenses
only on a license dongle R&S ZNPC-FL.
●
A floating license server must be equipped with the license dongle R&S ZNPC-FL.
For more information, see the R&S License Server "Managing Floating Licenses" help,
which can be opened from the "Help" icon in the top right corner of the local
R&S License Server Manager web interface. A PDF user manual with identical content
can be accessed via the R&S License Server folder in the Windows start menu ("Open
License Server Manual").
Both help and manual cover the following topics:
●
how to manage local licenses
●
how to set up a floating license server
●
how to connect to and obtain licenses from a floating license server
10User Manual 1176.9906.02 ─ 09

R&S®ZNrun
Application Overview
Client-Server Architecture
3 Application Overview
The R&S ZNrun software suite consists of a central server component (ZNrun Server)
and a set of client applications (ZNrun Workbench, ZNrun Calibration Client,
ZNrun Measurement Client, ZNrun Visualization Client). See Chapter 1, "Introduction",
on page 5.
ZNrun
Workbench
Measurement
Devices
&
DUT
VISA / USB
LAN
ZNrun
Visualization
Client
3.1 Client-Server Architecture
ZNrun
Server
ZNrun
Calibration
Client
ZNrun
Cable Test
Client
ZNrun
Measurement
Client
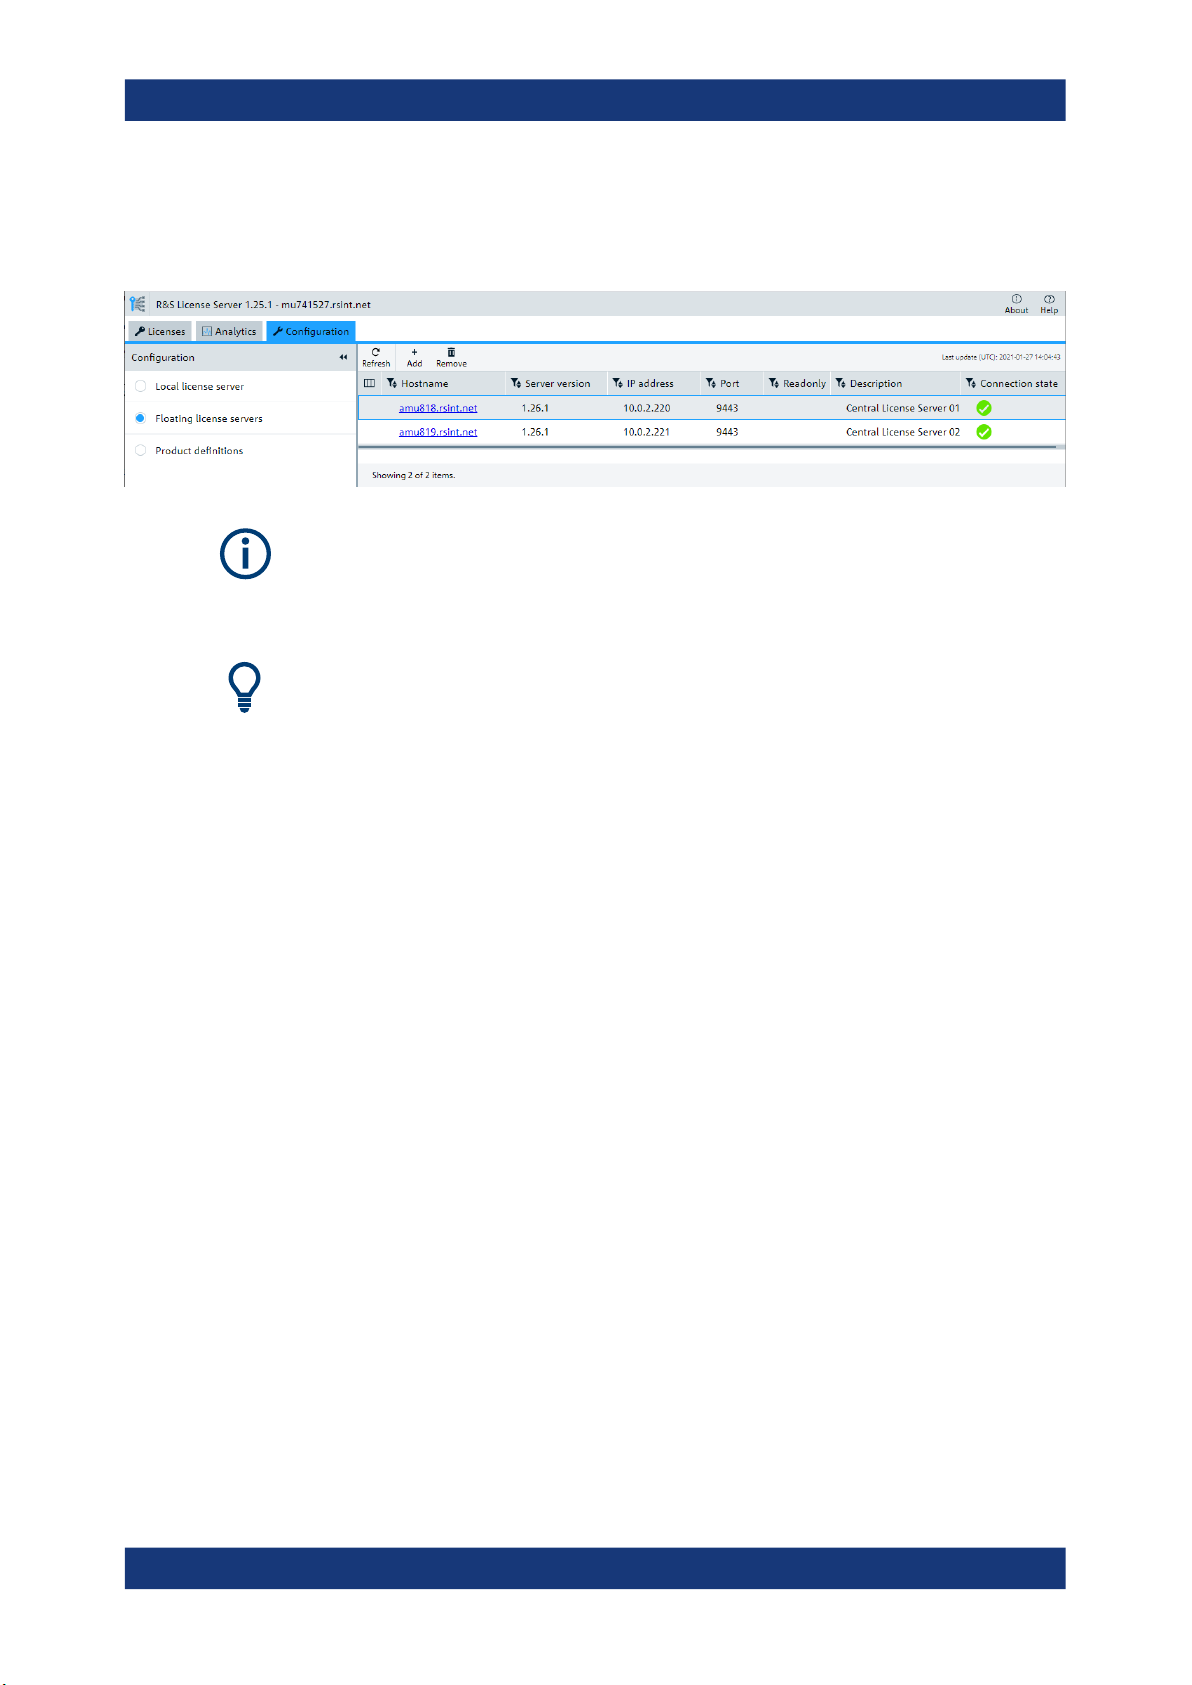
The ZNrun Server manages the communication with the measurement instruments
and the DUT. Rohde & Schwarz instruments are controlled via VISA and/or proprietary
USB protocols. Additional test equipment and DUTs can be controlled via VISA or the
RFFE/GPIO ports of the R&S ZNA, R&S ZNB or R&S ZNBT. Any type of hardware or
software interface can be integrated with R&S ZNrun via the plug-in interface.
The ZNrun Workbench allows you to create ZNrun project files, which, when
deployed to the ZNrun Server, define one or more server-side Measurement Execution
Units (MEUs).
Before starting the actual measurement, the involved vector network analyzers have to
be calibrated for full system error correction and/or absolute power level correctness.
For this purpose, the R&S ZNrun provides the ZNrun Calibration Client, a simple
graphical user interface, suitable for guiding a technician through the required calibration steps. For laboratory use, it offers an advanced interface that allows to define custom calibration tasks.
The ZNrun Measurement Client allows you to connect to a Measurement Execution
Unit that was previously uploaded to the ZNrun Server. It provides a graphical user
11User Manual 1176.9906.02 ─ 09
R&S®ZNrun
3.2 ZNrun Server
Application Overview
DUT-Centric Approach
interface for measurement execution. It shows a stop watch timer that is synchronized
with the measurements, which makes it easy to measure the execution time of measurement cycles or single steps. The measurements steps can be performed without
interruption – in a so called measurement cycle – or step by step. It is also possible to
execute several measurement cycles in succession. Measurement results are written
to the hard disk on-the-fly.
It can take some seconds until all parameters have been uploaded to the devices and
all communication paths have been tested. However, this upload is done only once: all
following measurements require a minimum amount of setup time.
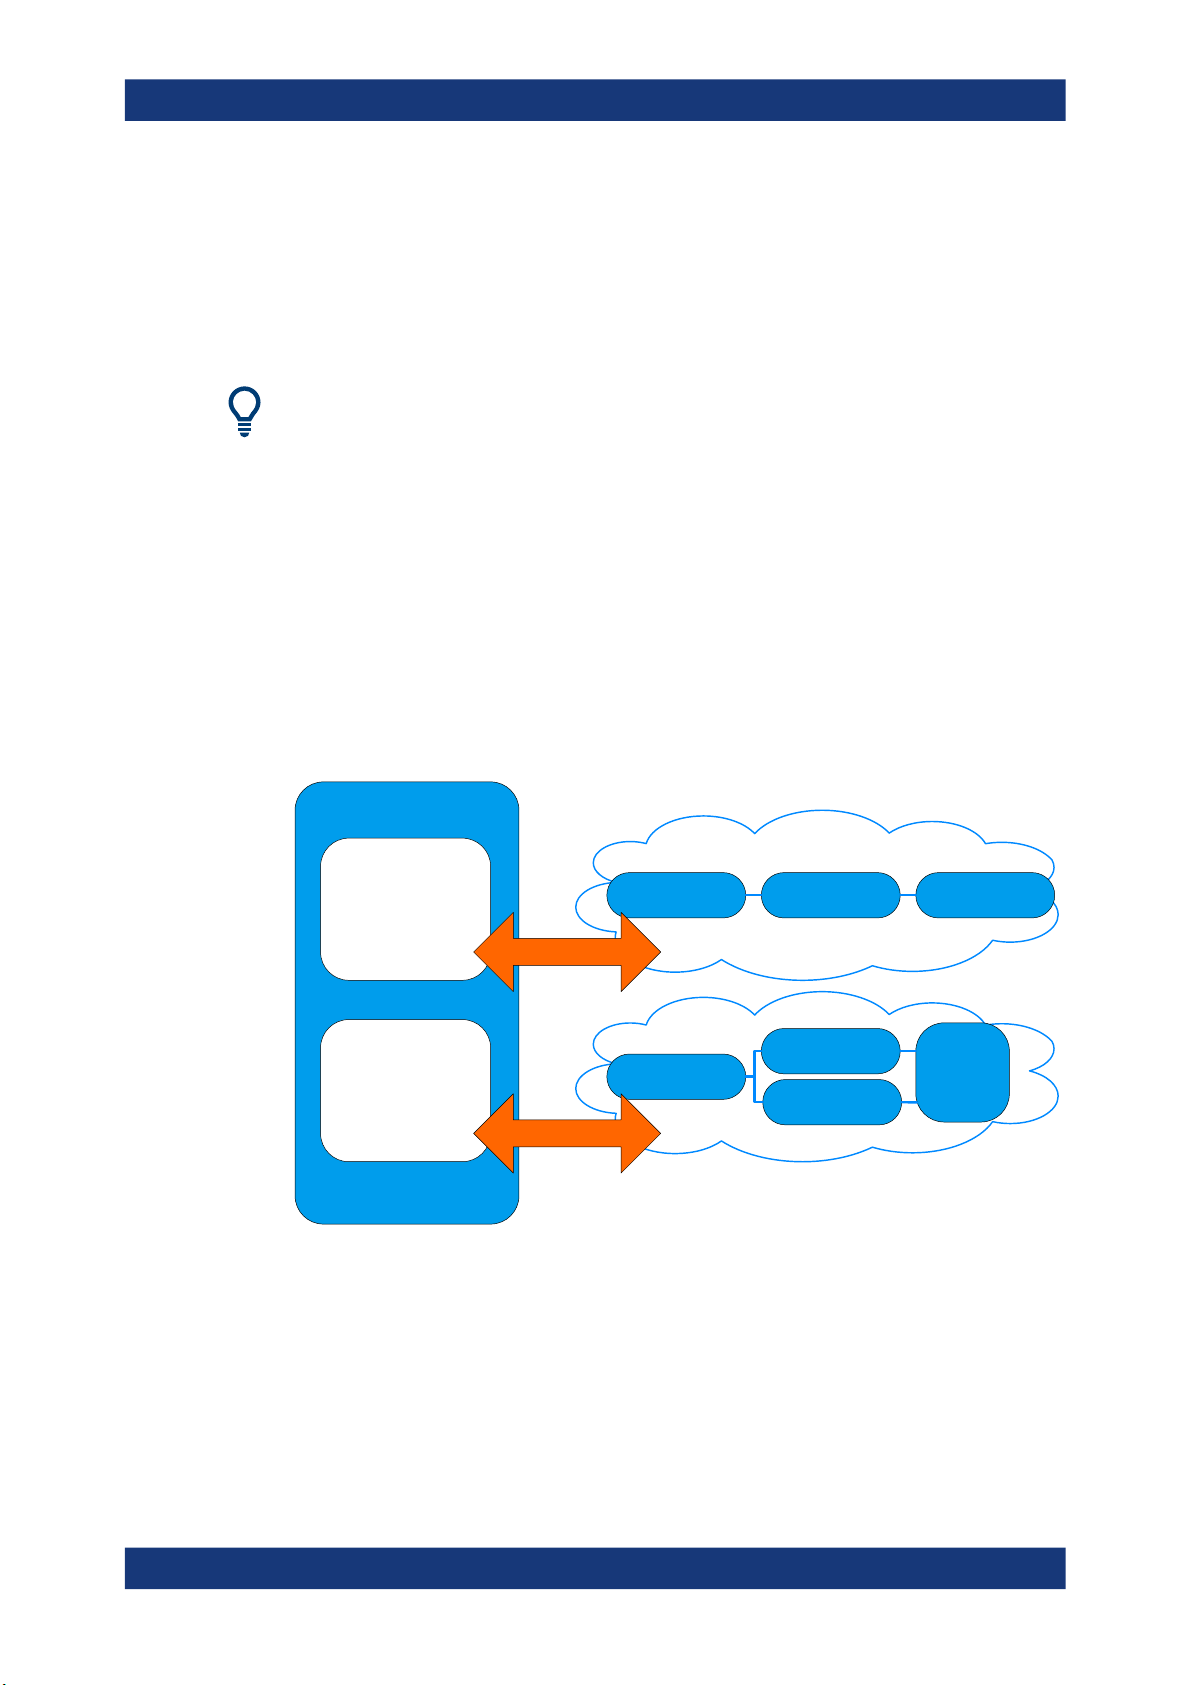
The ZNrun Server can accommodate multiple Measurement Execution Units, but with
option R&S ZNrun-K1 alone you can only run one at a time. For parallel execution of
multiple Measurement Execution Units, you need option R&S ZNrun-K2.
In addition to VISA, the server can communicate over arbitrary communication interfaces via plug-ins. Plug-ins allow external hardware (such as DUTs and 3rd party measurement equipment) to be synchronized with measurements.
ZNrun Server
Measurement
Execution
Unit
A
Measurement
Execution
Unit
B
Figure 3-1: ZNrun
communicate
VNA 2
communicate
Server with two Measurement Execution Units
Measurement
Instruments
Matrix 1VNA 1 DUT 1
&
DUT
Measurement
Matrix 2a
Instruments
&
Matrix 2b
DUT
DUT
2
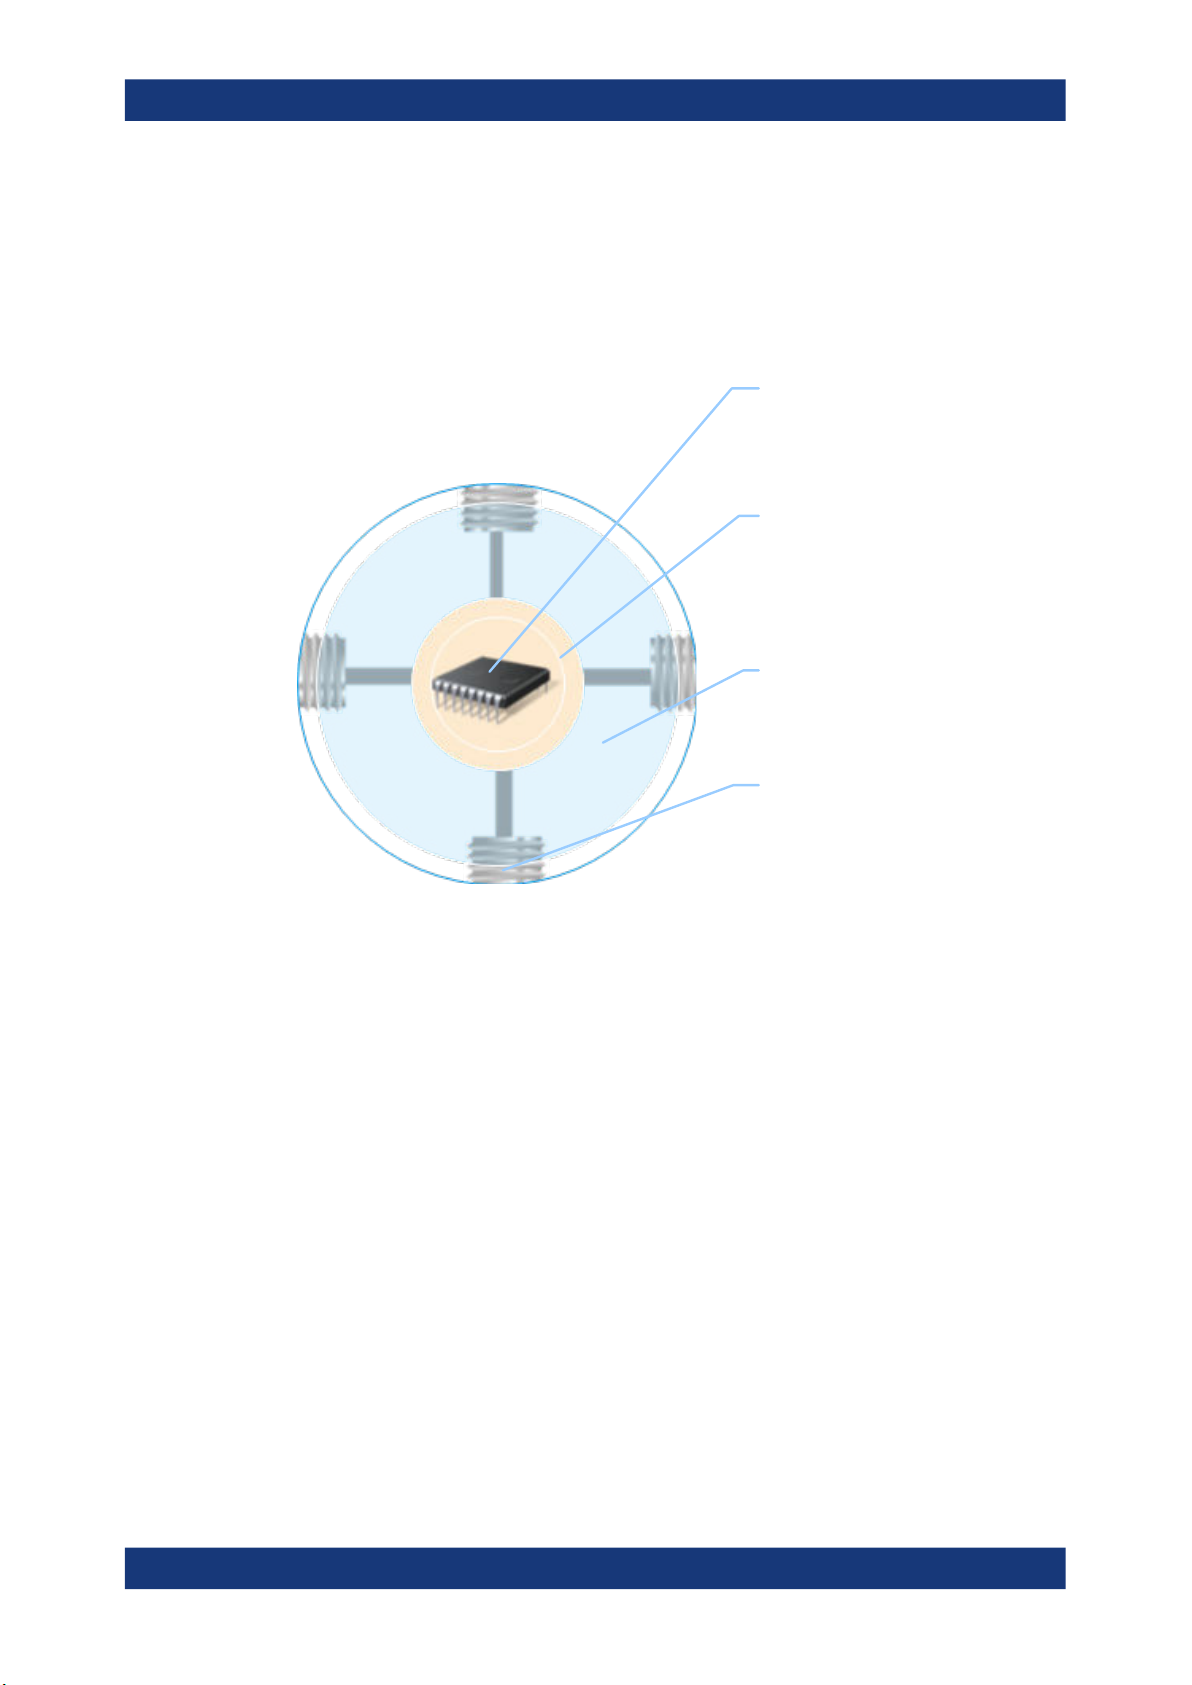
3.3 DUT-Centric Approach
The DUT and its measurements represent the core of the R&S ZNrun data model
("DUT Measurement Plan").
12User Manual 1176.9906.02 ─ 09
R&S®ZNrun
Application Overview
ZNrun Project Files
Typically, DUTs are implemented as "system on a chip" and do not support coaxial connectors. Such a DUT comprises several logical ports that are connected to physical
ports using a measurement adapter. The measurement devices can be connected to
the physical ports of the measurement adapter.
DUT
· port groups
· measurement parameters
· stimulus Data
· state switch
Logical Ports
· single-ended
· balanced
· correction parameters
Measurement Adapter
· electrical lengths
Figure 3-2: DUT model
The DUT Measurement Plan defines the parameters to be measured at or between
certain logical ports. It also defines how the measurement is done, e.g. it describes the
stimuli the VNA provides during the measurement.
At certain points in time during a measurement sequence, the ZNrun Server possibly
needs to interact with the DUT to change its operating state. The DUT Measurement
Plan defines those interactions using "DUT State Switches" or plug-ins.
3.4 ZNrun Project Files
A ZNrun project file is an XML file (with root element Project), containing one or
more MeasurementExecutionUnit XML elements.
Each MeasurementExecutionUnit element describes an executable measurement
task on the ZNrun Server. It comprises three main child elements:
●
a MeasurementDevicesPlan element, describing the measurement equipment
configuration
Physical Ports
· coaxial connectors
· color marks
· connected to test ports of
measurement devices
13User Manual 1176.9906.02 ─ 09

R&S®ZNrun
Application Overview
ZNrun Project Files
●
a DutMeasurementPlan element, describing the DUT, the measurement adapter
(test fixture), and the measurement parameters
●
an optional ConnectionPlan element describing the physical connections
between measurement devices and measurement adapter. Normally, the
ConnectionPlan is calculated on the ZNrun server as part of the optimization
process, but it can also be specified explicitly
●
The structure of the XML files is defined in various XML schema files that can be
found at <ZNrun InstallDir>\Server\Schemas.
●
The ZNrun Workbench creates ZNrun projects that contain only a single
MeasurementExecutionUnit. Its child elements (MeasurementDevicesPlan,
DutMeasurementPlan, ConnectionPlan, ...) are distributed to separate files,
which makes it easier to reuse them in other ZNrun projects.
14User Manual 1176.9906.02 ─ 09

R&S®ZNrun
ZNrun Workbench
4 ZNrun Workbench
The ZNrun Workbench application provides the main graphical user interface (GUI) of
R&S ZNrun. It can be used to develop, test and tune a Measurement Execution Unit
(MEU) before it is used in the production field. Furthermore, it gives convenient access
to the other client applications (ZNrun Calibration Client, ZNrun Measurement Client,
ZNrun Visualization Client).
The ZNrun Workbench supports the two core features of the R&S ZNrun application:
●
Multiplicity (with option R&S ZNrun-K5)
– DUT multiplicity
A key feature of the ZNrun Workbench is DUT multiplicity. The ZNrun Workbench natively supports the configuration of measurements on multiple DUTs.
– VNA multiplicity
The ZNrun Workbench also supports the configuration and execution of a MEU
with multiple vector network analyzers.
●
Tuning (with option R&S ZNrun-K6)
Tuning is a special feature of the R&S ZNrun framework. It can be used to change
and optimize the configuration of a MEU during the execution to maximize the use
of the measurement. Furthermore, tuning comes with three tools to enhance the
capabilities of the configuration of a MEU with the ZNrun Workbench: "Save
Changes", "Create Snapshot", and "Recall Snapshot".
Additionally you can use the ZNrun Workbench to roll out a MEU to multiple test stations.
Workflow
The workflow with the ZNrun Workbench is separated into five phases:
Getting Started Calibration Phase
Figure 4-1: ZNrun
Configuration Phase
Workbench workflow
Execution and
Visualization Phase
Rollout Phase
● Application Overview...............................................................................................16
● Getting Started........................................................................................................24
● Configuration Phase................................................................................................25
● Calibration Phase....................................................................................................54
● Execution and Visualization Phase.........................................................................54
● Rollout Phase..........................................................................................................56
15User Manual 1176.9906.02 ─ 09
R&S®ZNrun
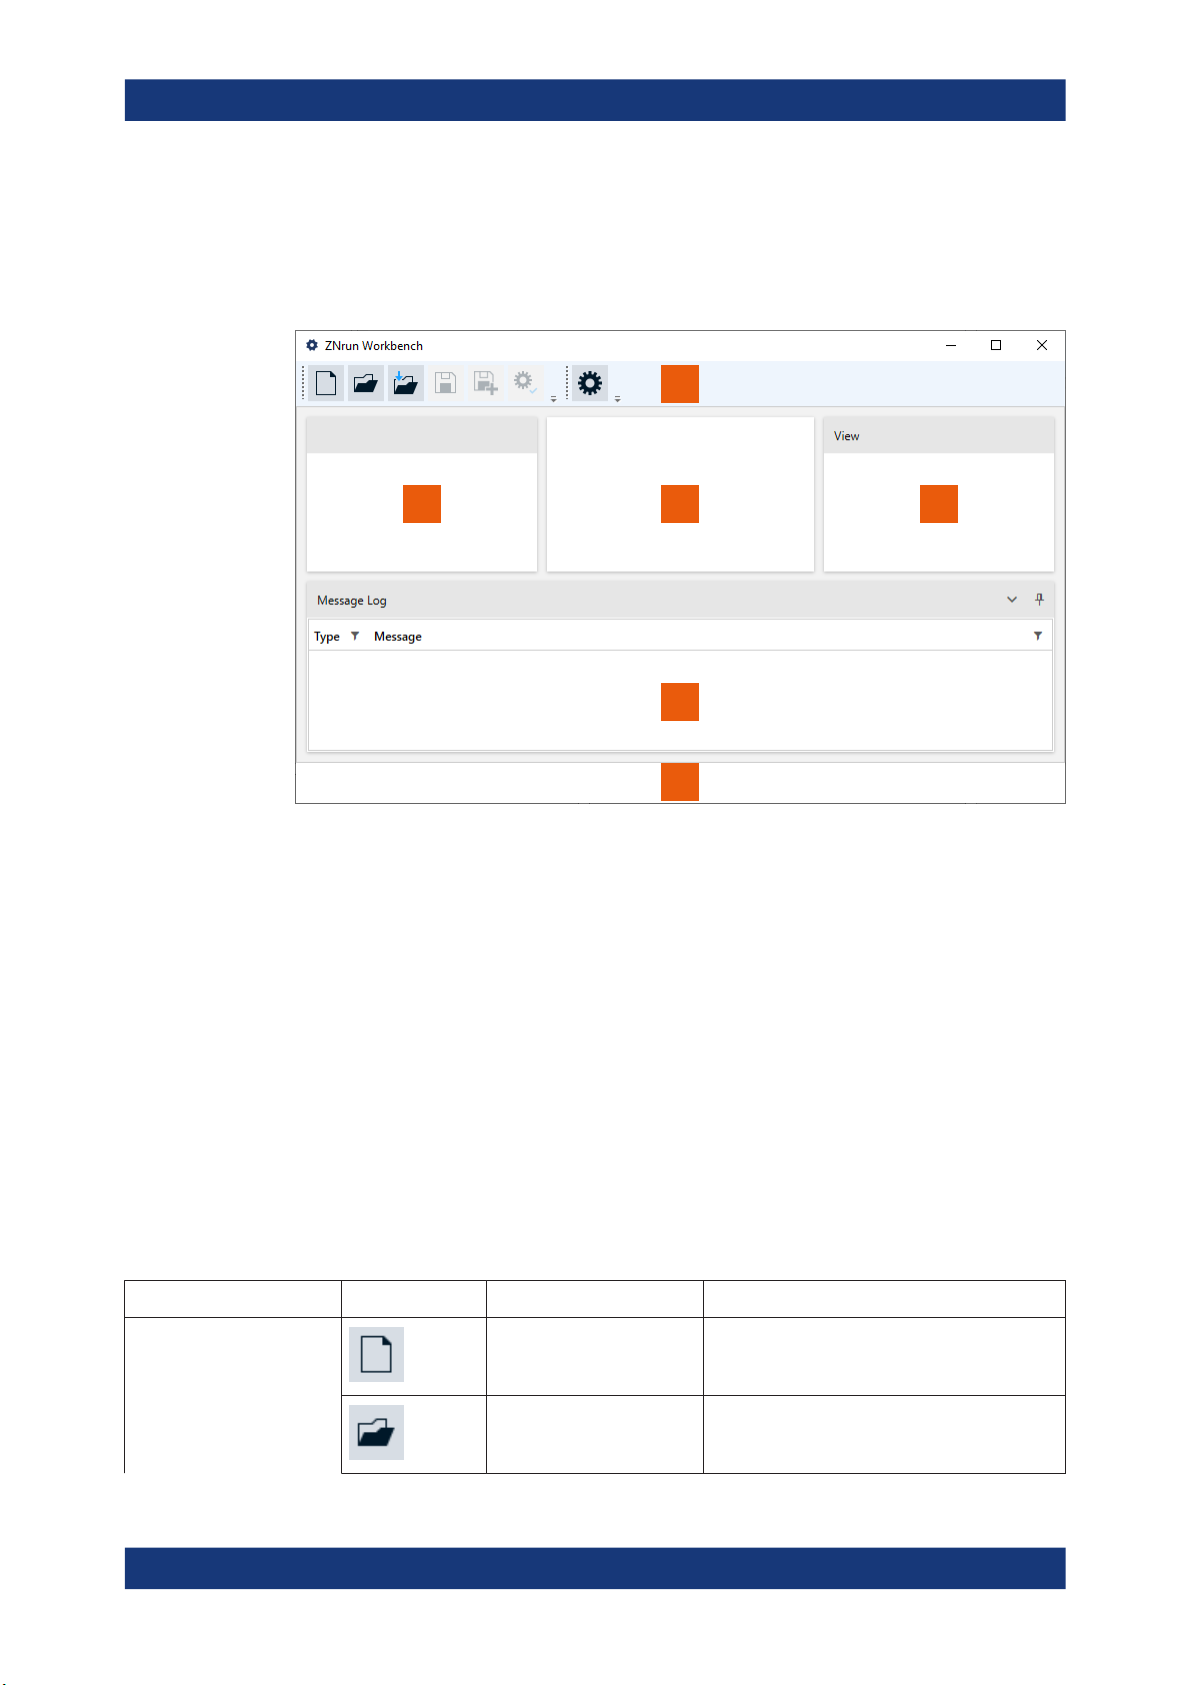
4.1 Application Overview
ZNrun Workbench
Application Overview
The ZNrun Workbench is the central graphical user interface to start and control the
components of the R&S ZNrun. The same layout is used for all application phases.
1
2
Figure 4-2: Overview of the ZNrun Workbench layout
1 = Main toolbar
2 = "DUT Center" panel
3 = Workspace
4 = "View" panel
5 = Log panel
6 = Status bar
4.1.1 Main Toolbar
3 4
5
6
The main toolbar contains the controls to configure and execute a Measurement Execution Unit (MEU). It allows you to start the calibration client, see Chapter 4.4, "Calibra-
tion Phase", on page 54, and the visualization client, see Chapter 4.5, "Execution and
Visualization Phase", on page 54.
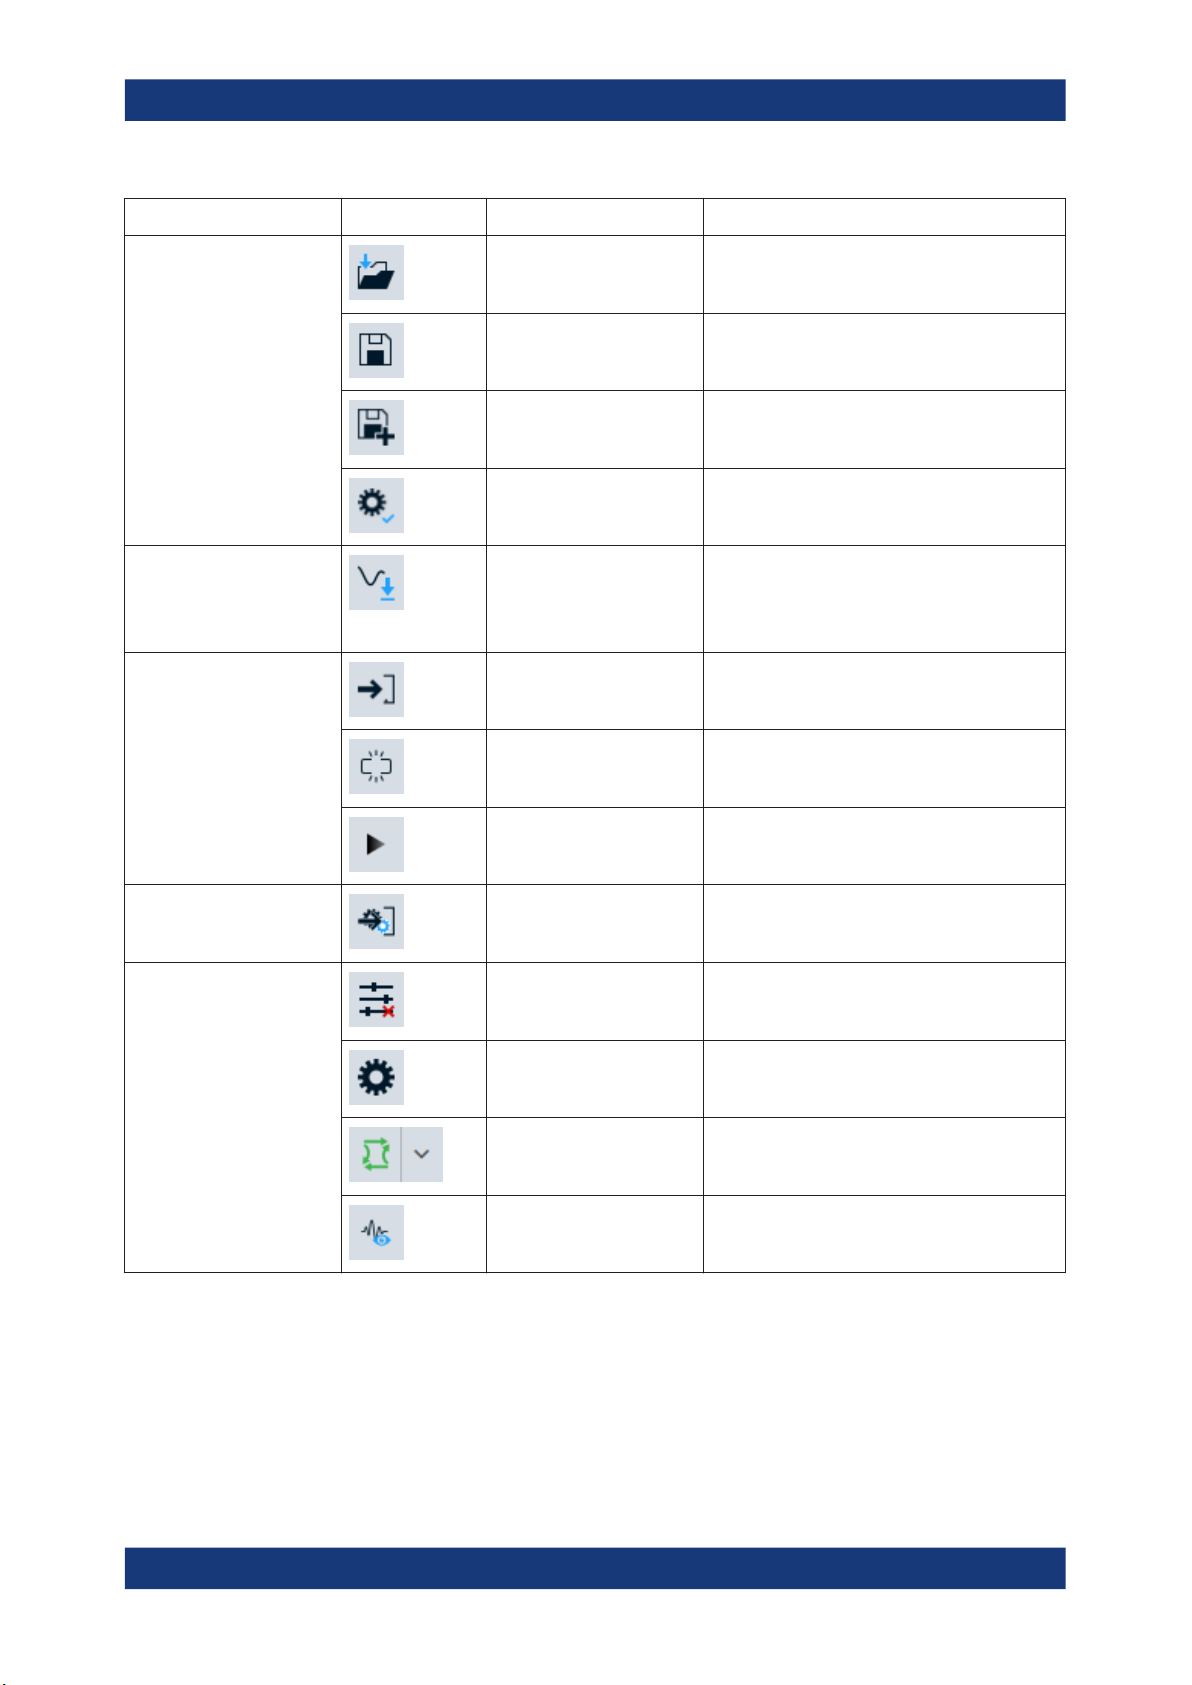
In the configuration phase, the main toolbar has four functional tool groups:
Table 4-1: Main toolbar actions in configuration phase
Group Icon Name Action
Basic commands New Creates a MEU configuration with the
ZNrun Workbench data structure.
Open workbench file Loads an existing MEU configuration from a
ZNrun Workbench data structure.
16User Manual 1176.9906.02 ─ 09
R&S®ZNrun
ZNrun Workbench
Application Overview
Group Icon Name Action
Open ZNrun project Loads the data structure from an existing
R&S ZNrun project.
Save Saves all changes to the working ZNrun Work-
bench file system.
Save as Saves the MEU configuration in the ZNrun Work-
bench file system format.
Validate Validates the MEU configuration
Import tools Import stimuli Stimuli can be imported from XML files contain-
ing valid DutMeasurementPlan serializations.
For details, see Chapter 4.3.3, "Import Stimuli",
on page 52.
Execution tools Go to execution Switches to the execution phase (see Chap-
ter 4.5, "Execution and Visualization Phase",
on page 54 for details).
Repeat Activates the continuous loop of the measure-
ment cycle.
Start Switches to the execution phase and starts the
measurement cycle.
Rollout tools Go to rollout Switches to the rollout phase (see Chapter 4.6,
"Rollout Phase", on page 56 for details)
Settings tools Activate tuning Activates the tuning in the execution phase (see
Chapter 4.5.1.1, "Tuning", on page 55 for
details).
Settings Launches the "Settings" dialog (Chapter 4.1.7,
"Options", on page 23)
DUT-related calibration Launches the calibration client (see Chapter 4.4,
"Calibration Phase", on page 54)
Launch visualization client Launches the visualization client (see Chap-
ter 4.5.2, "Visualization Workspace",
on page 55)
In the execution phase, the main toolbar also has four functional groups:
17User Manual 1176.9906.02 ─ 09

R&S®ZNrun
Table 4-2: Main toolbar actions in execution phase
ZNrun Workbench
Application Overview
Group
Settings tools Activate tuning Activates tuning (see Chapter 4.5.1.1, "Tuning",
Execution tools Leave Leaves the execution phase and returns to the
Name Action
on page 55 for details).
Once tuning is activated, it cannot be deactivated unless you leave the execution phase.
Settings Launches the "Settings" dialog (Chapter 4.1.7,
"Options", on page 23)
Launch visualization client Launches the visualization client (see Chap-
ter 4.5.2, "Visualization Workspace",
on page 55)
configuration phase.
Repeat Activates or deactivates the continuous loop of
the measurement cycle.
Start Starts the execution of the measurement cycle.
Step Performs one step in the measurement cycle.
Abort Aborts the running execution of the measure-
ment cycle.
Log cycle execution Logs the execution of one complete cycle to a
log file on the system.
Show connections (PDF) Shows the connection plan of the current MEU in
your PDF file viewer.
Tuning tools Save Saves the changed configuration to the
ZNrun Workbench data structure.
Create snapshot Saves a temporary copy of the current configura-
tion. If a changed configuration is saved, the
snapshot is deleted.
Recall snapshot Loads the configuration of the snapshot. If no
snapshot exists, the original configuration is loaded.
Visualization tools Add new visualization Adds a new visualization workspace in the work-
space area.
18User Manual 1176.9906.02 ─ 09
R&S®ZNrun
ZNrun Workbench
Application Overview
Group
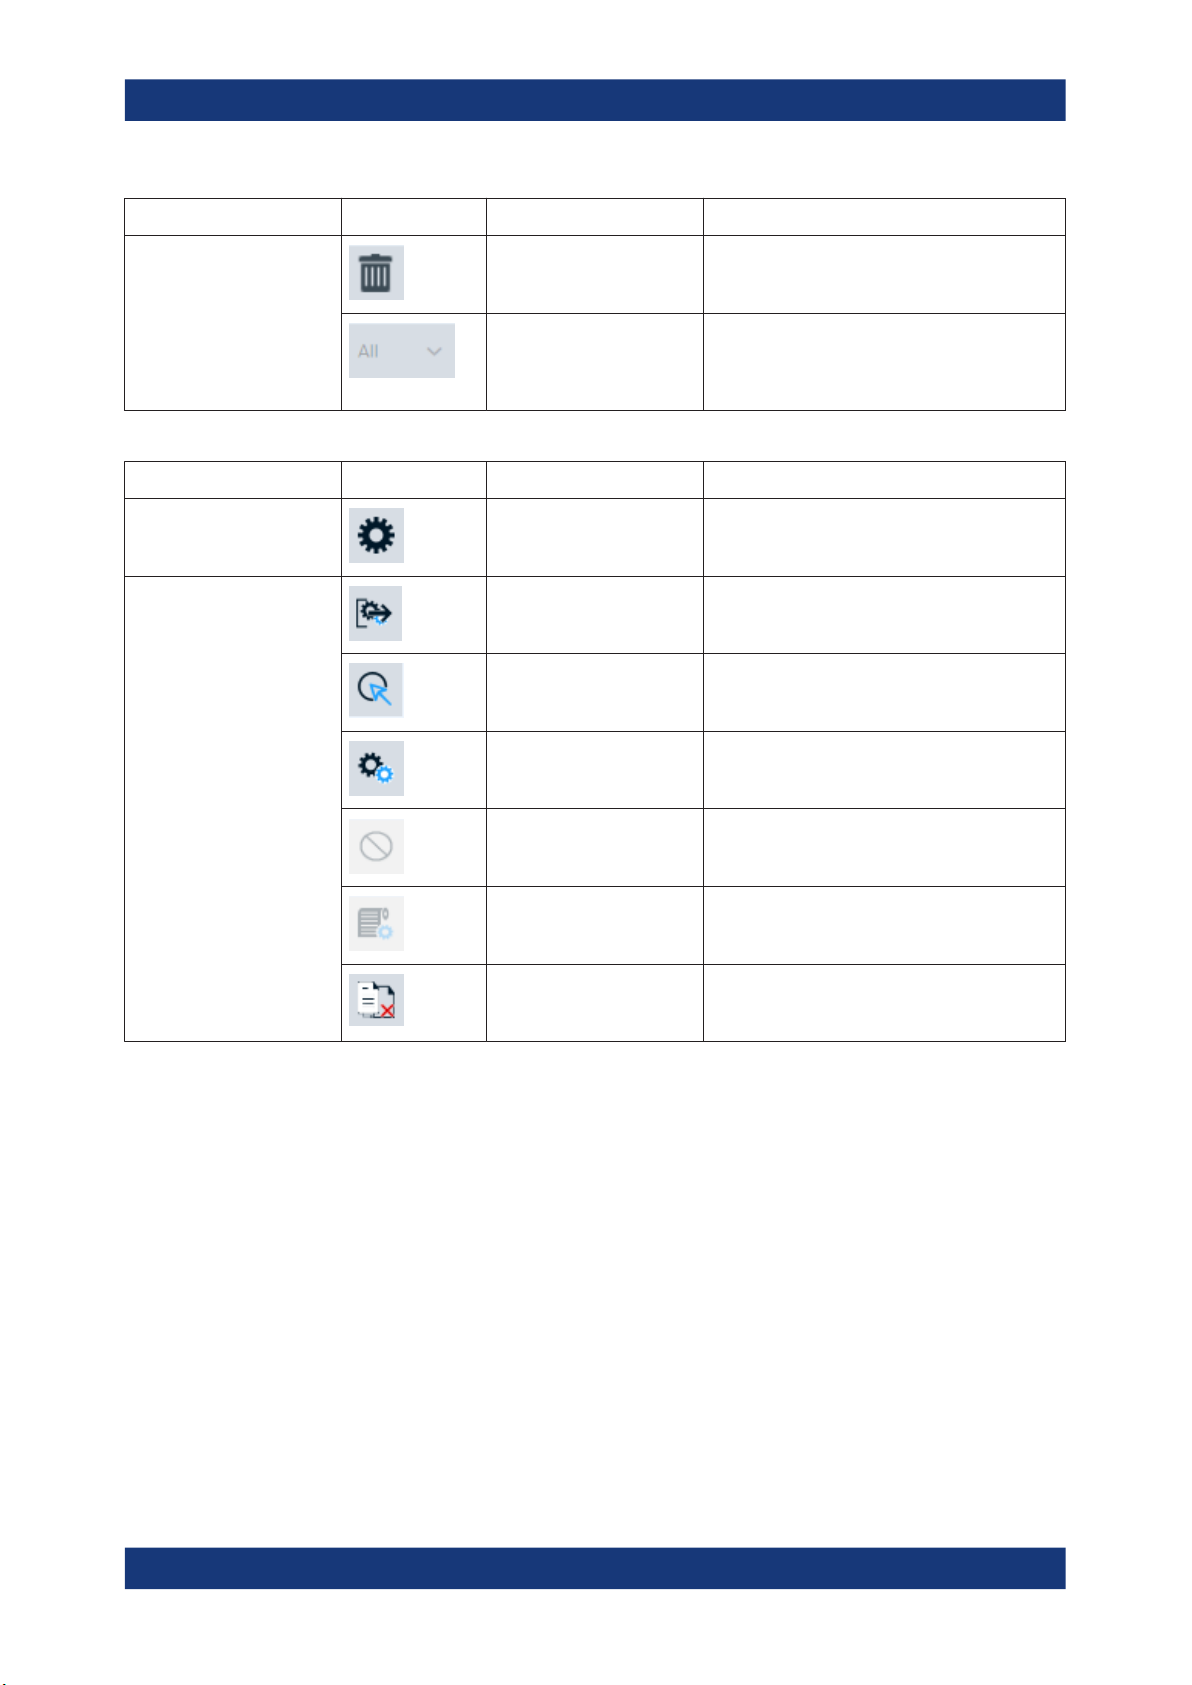
Table 4-3: Main toolbar actions in rollout phase
Group
Settings tools Settings Launches the "Settings" dialog (Chapter 4.1.7,
Rollout tools Leave rollout Leaves the rollout phase and returns to the con-
Name Action
Remove Drag and drop charts from the visualization
workspace to the bin to remove charts.
DUT selection Choose a DUT index from the dropdown menu.
If a new graph is created in the workspace, only
the measurements related to the DUT index are
displayed.
Name Action
"Options", on page 23)
figuration phase.
Generate projects Generates MEUs from the master MEU and the
test stations according to your rollout plan.
Roll out Rolls out generated MEUs to their dedicated test
stations.
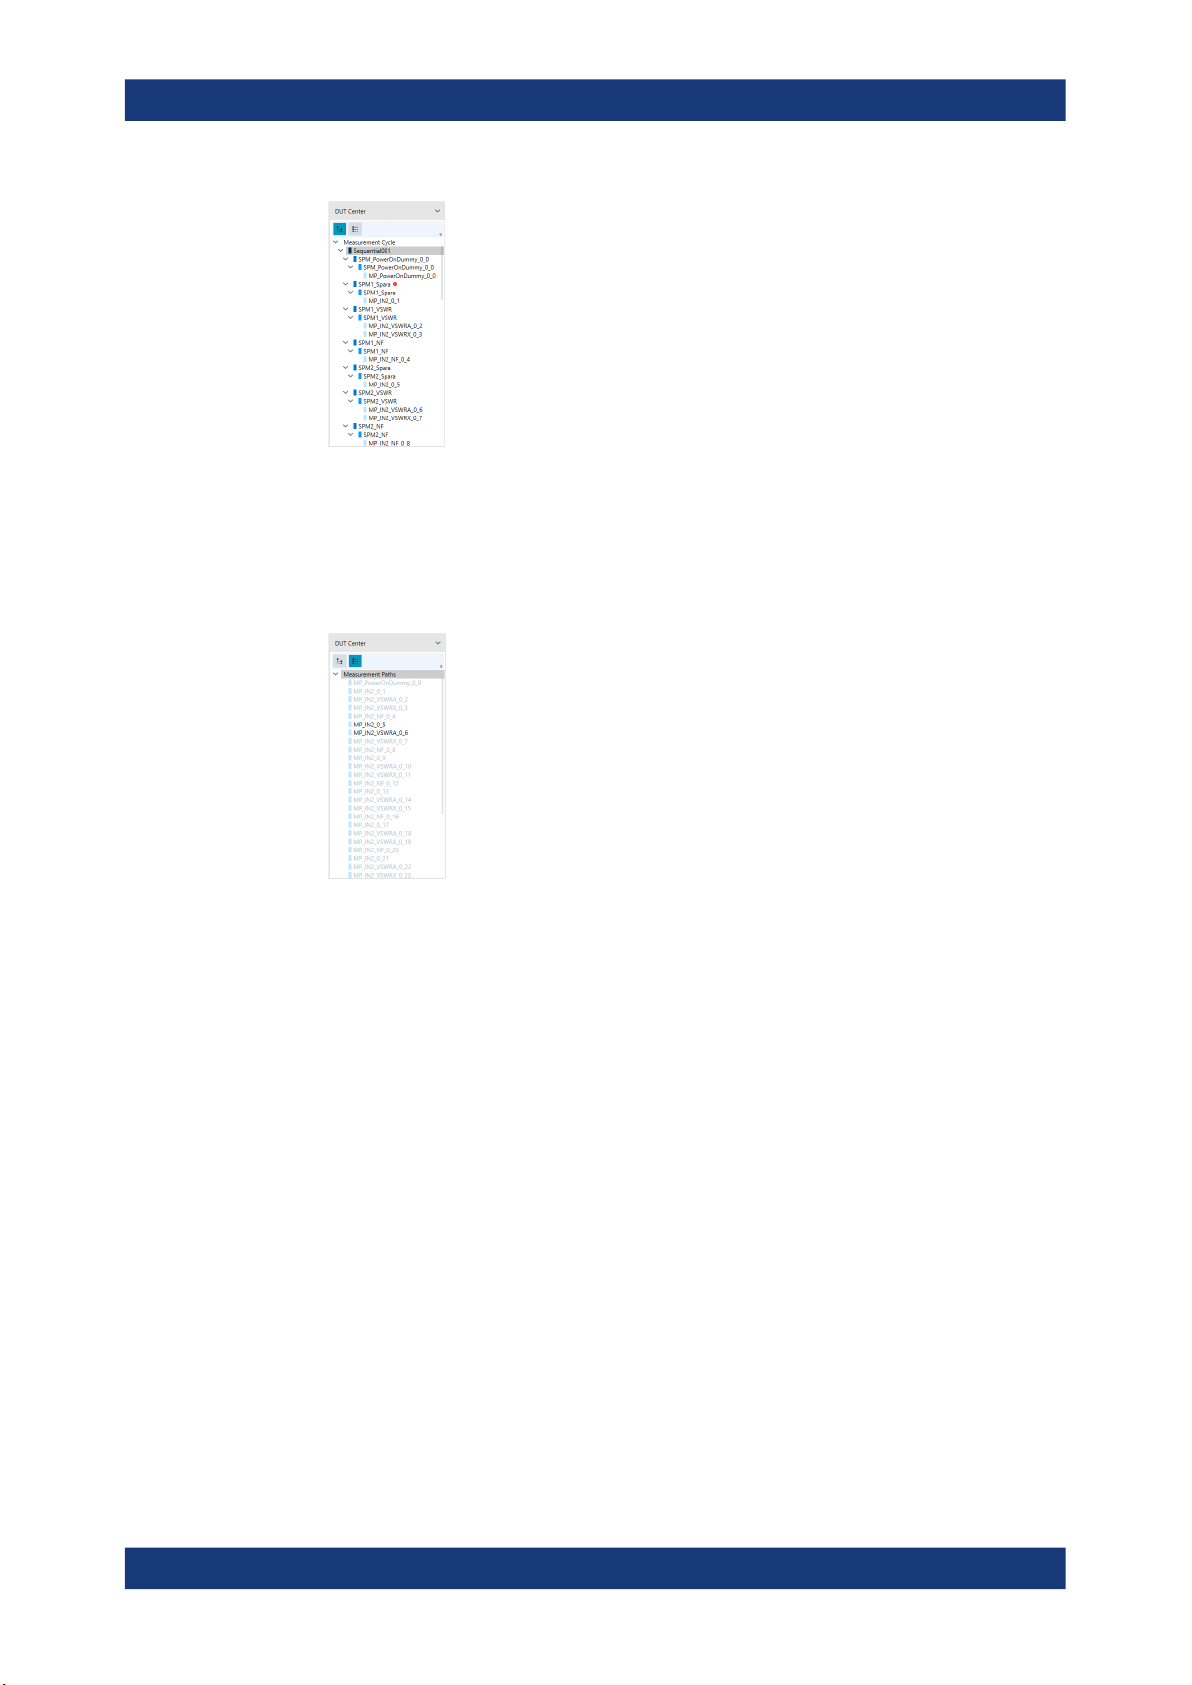
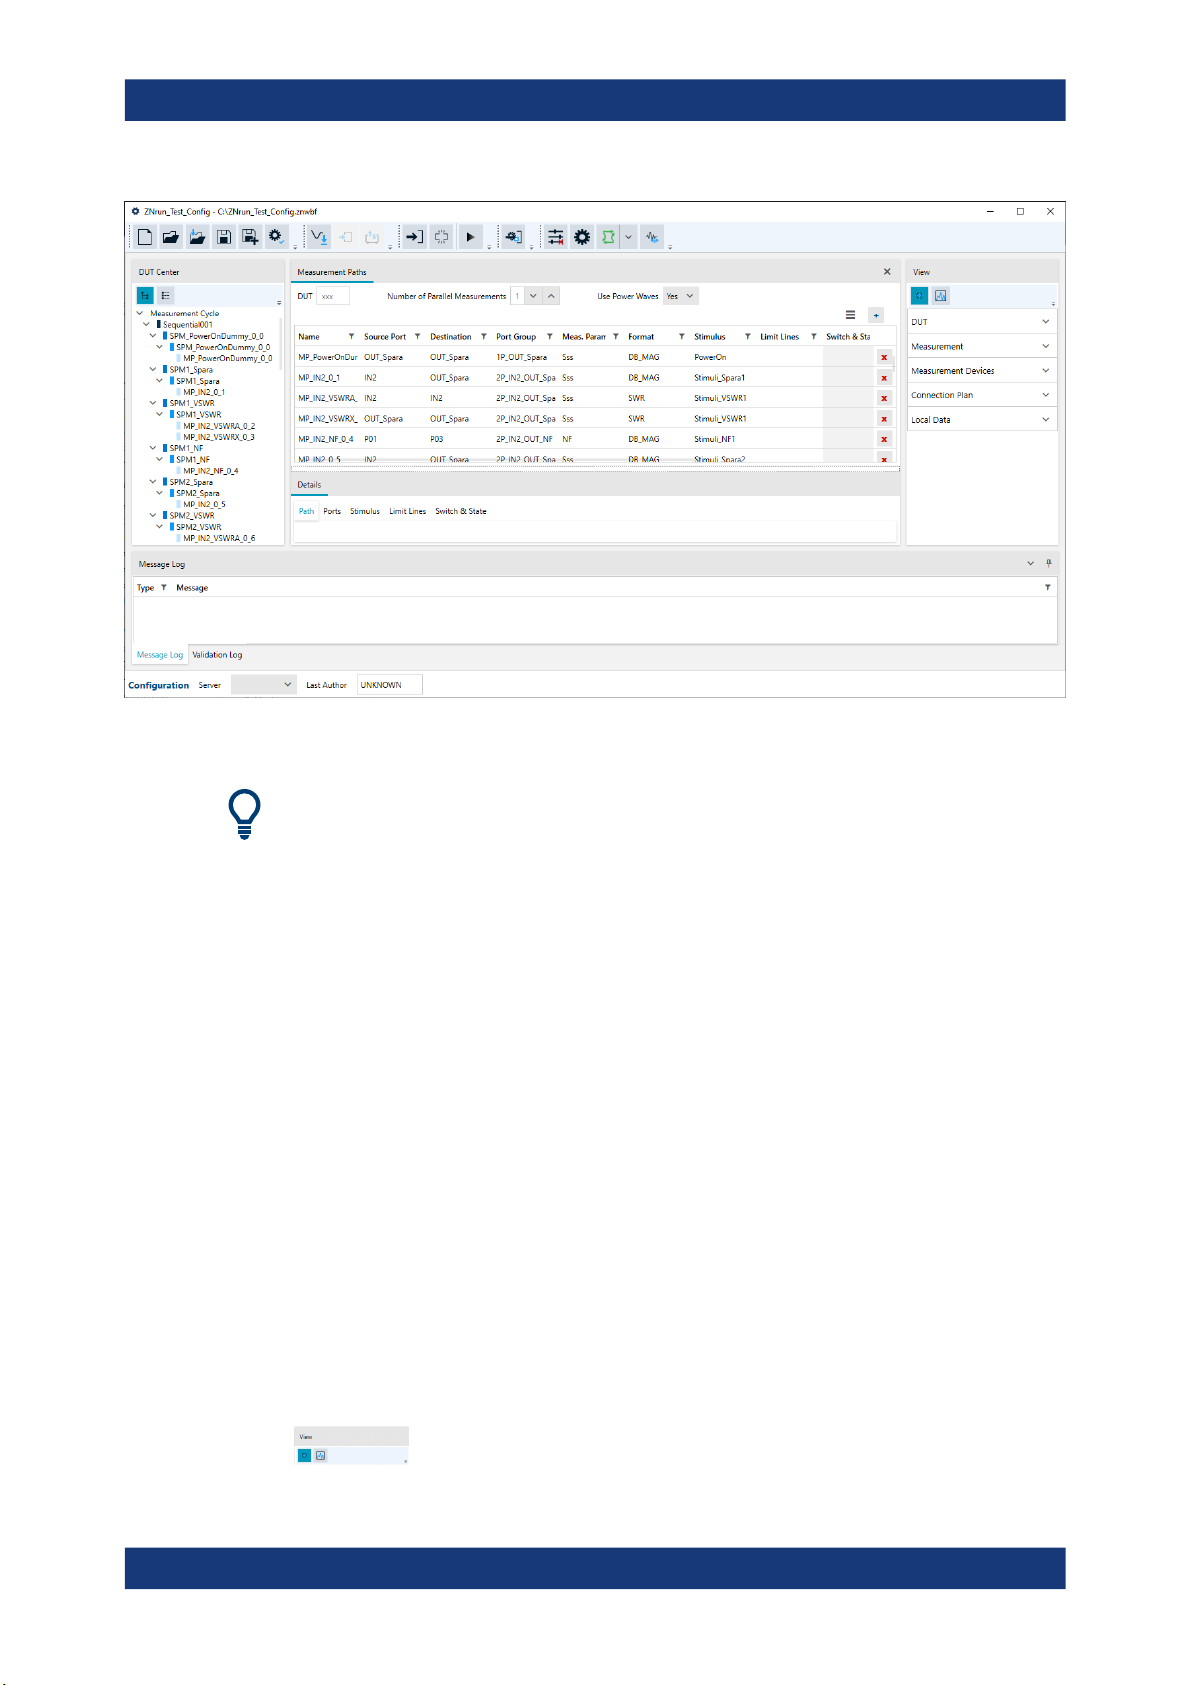
4.1.2 DUT Center
The "DUT Center" displays the measurement cycle with all its measurement paths. You
can select between two different representations:
●
"Structured Shape": Visualization of the measurement cycle in a tree-like structure.
For every element (sequential context, parallel context, or step) a breakpoint for
the execution phase of the whole measurement cycle can be set or deleted from
the context menu. If a breakpoint is set, a red dot is displayed on the right of the
specific element.
Abort Aborts queued packages to be rolled out.
Log rollout status Logs the status of current rollout session to a log
file on the file system.
Overwrite Activates or deactivates whether or not existing
generated MEUs shall be overwritten during
"Generate projects".
19User Manual 1176.9906.02 ─ 09
R&S®ZNrun
ZNrun Workbench
Application Overview
In the example above, a breakpoint is set for StimulusPortgroupMeasurement
"SPM1_Spara".
●
"Flattened Shape": Flat outline of all measurements currently available. All measurements used in the measurement cycle are grayed out. Every measurement
can be released (i.e. excluded) from the measurement cycle with the right click
context menu.
In the example above, measurement paths "MP_IN2_0_5" and
"MP_IN2_VSWRA_0_6" are released.
Hovering over a measurement path displays additional information. In the configuration
phase, the port group, stimulus and switch & state are shown. In the execution phase,
a short notation for the measurement parameter, the destination port, and the source
port are shown.
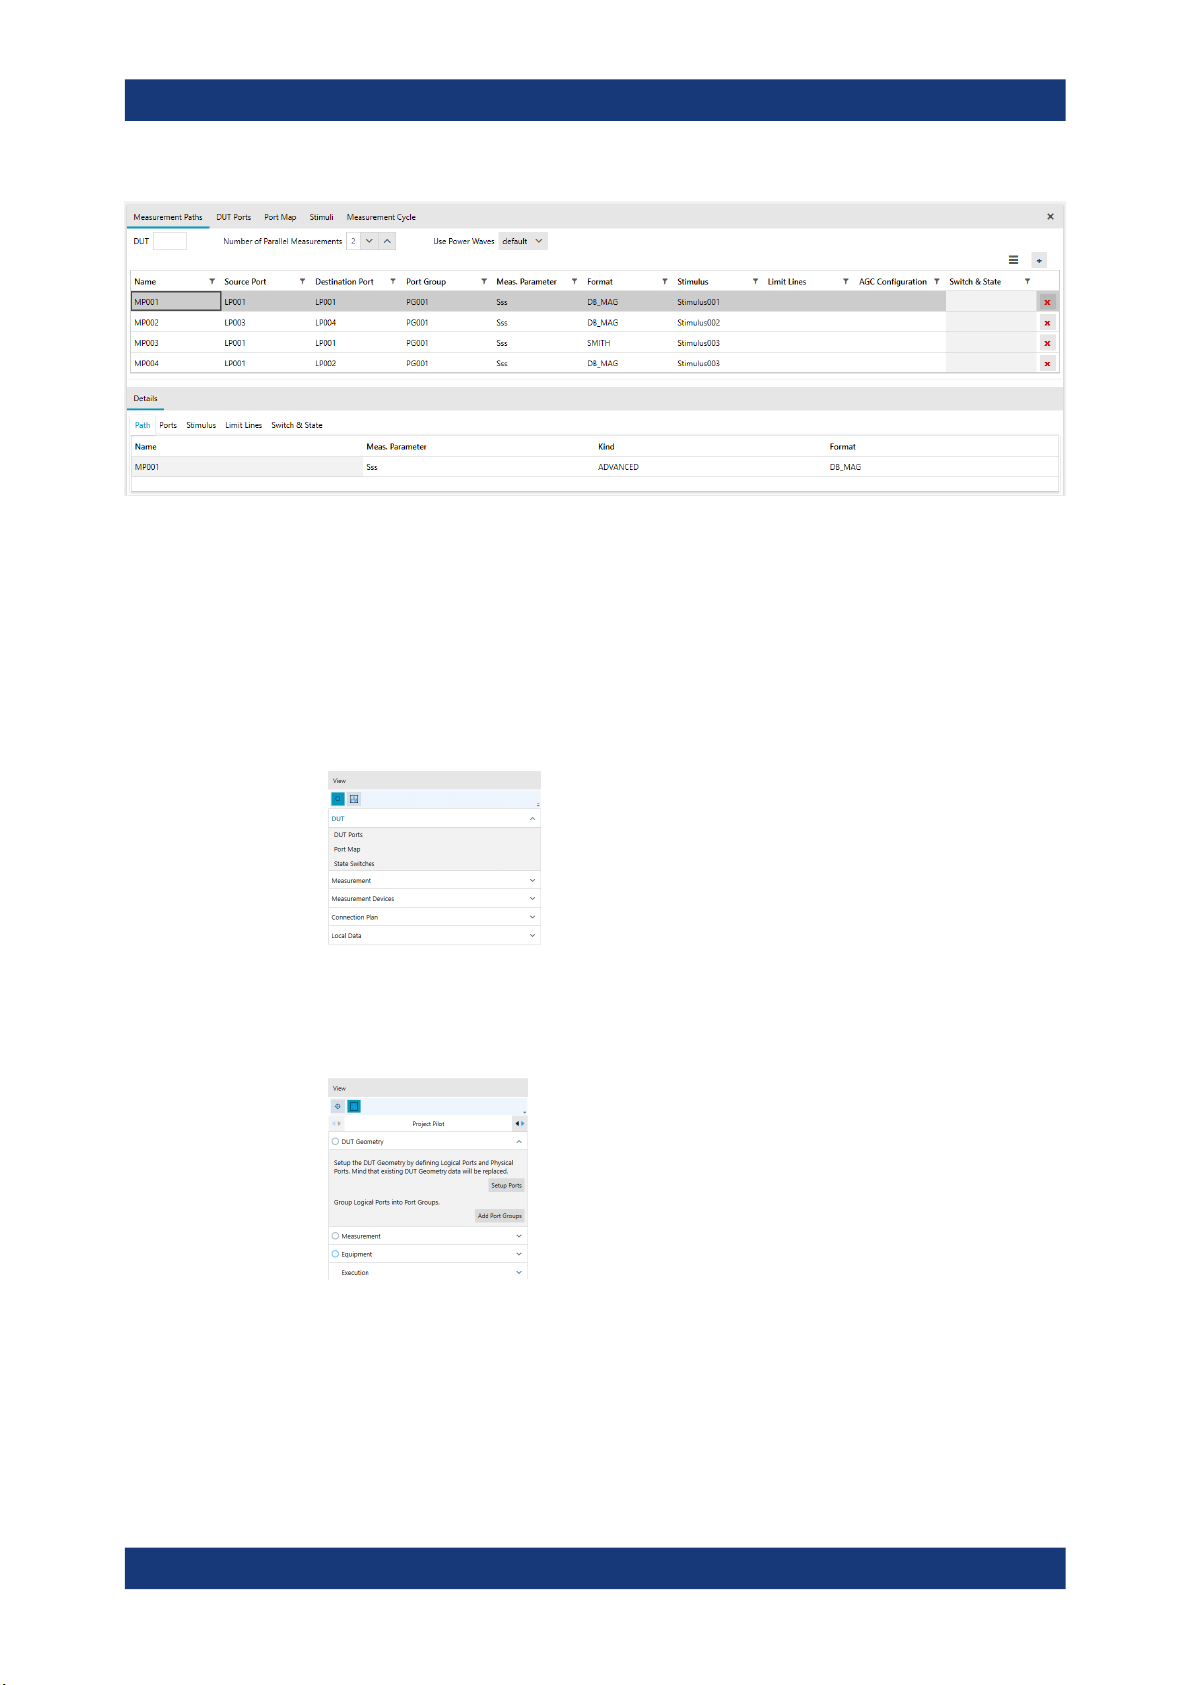
4.1.3 Workspace
The main window area is reserved for the configuration of the MEU or for the visualization of measurements. Each configuration group can be displayed in the workspace as
a separate tab. In the top half of each tab, a list overview of all configurations is shown.
In the bottom half, a more detailed configuration of each list element is displayed. See
section Chapter 4.3.2, "Expert Mode", on page 30 for a detailed explanation of all
configuration capabilities.
All tabs in the workspace are floatable and dockable.
20User Manual 1176.9906.02 ─ 09
R&S®ZNrun
4.1.4 Configuration View
ZNrun Workbench
Application Overview
Figure 4-3: Populated workspace
The "Configuration View" is the main tool for selecting configuration settings. It offers
two different modes:
●
In "Expert" mode, all configuration settings are listed. Selecting a configuration setting opens the corresponding tab in the workspace.
See Chapter 4.3.2, "Expert Mode", on page 30 for details.
●
The "Project Pilot" mode lets you quickly configure MEUs from scratch. A reduced
quantity of configuration settings and the automation of most of the configurations
simplifies the configuration phase.
The "Project Pilot" can also be used to modify an existing ZNrun Workbench project. See Chapter 4.3.1, "Project Pilot", on page 26 for details.
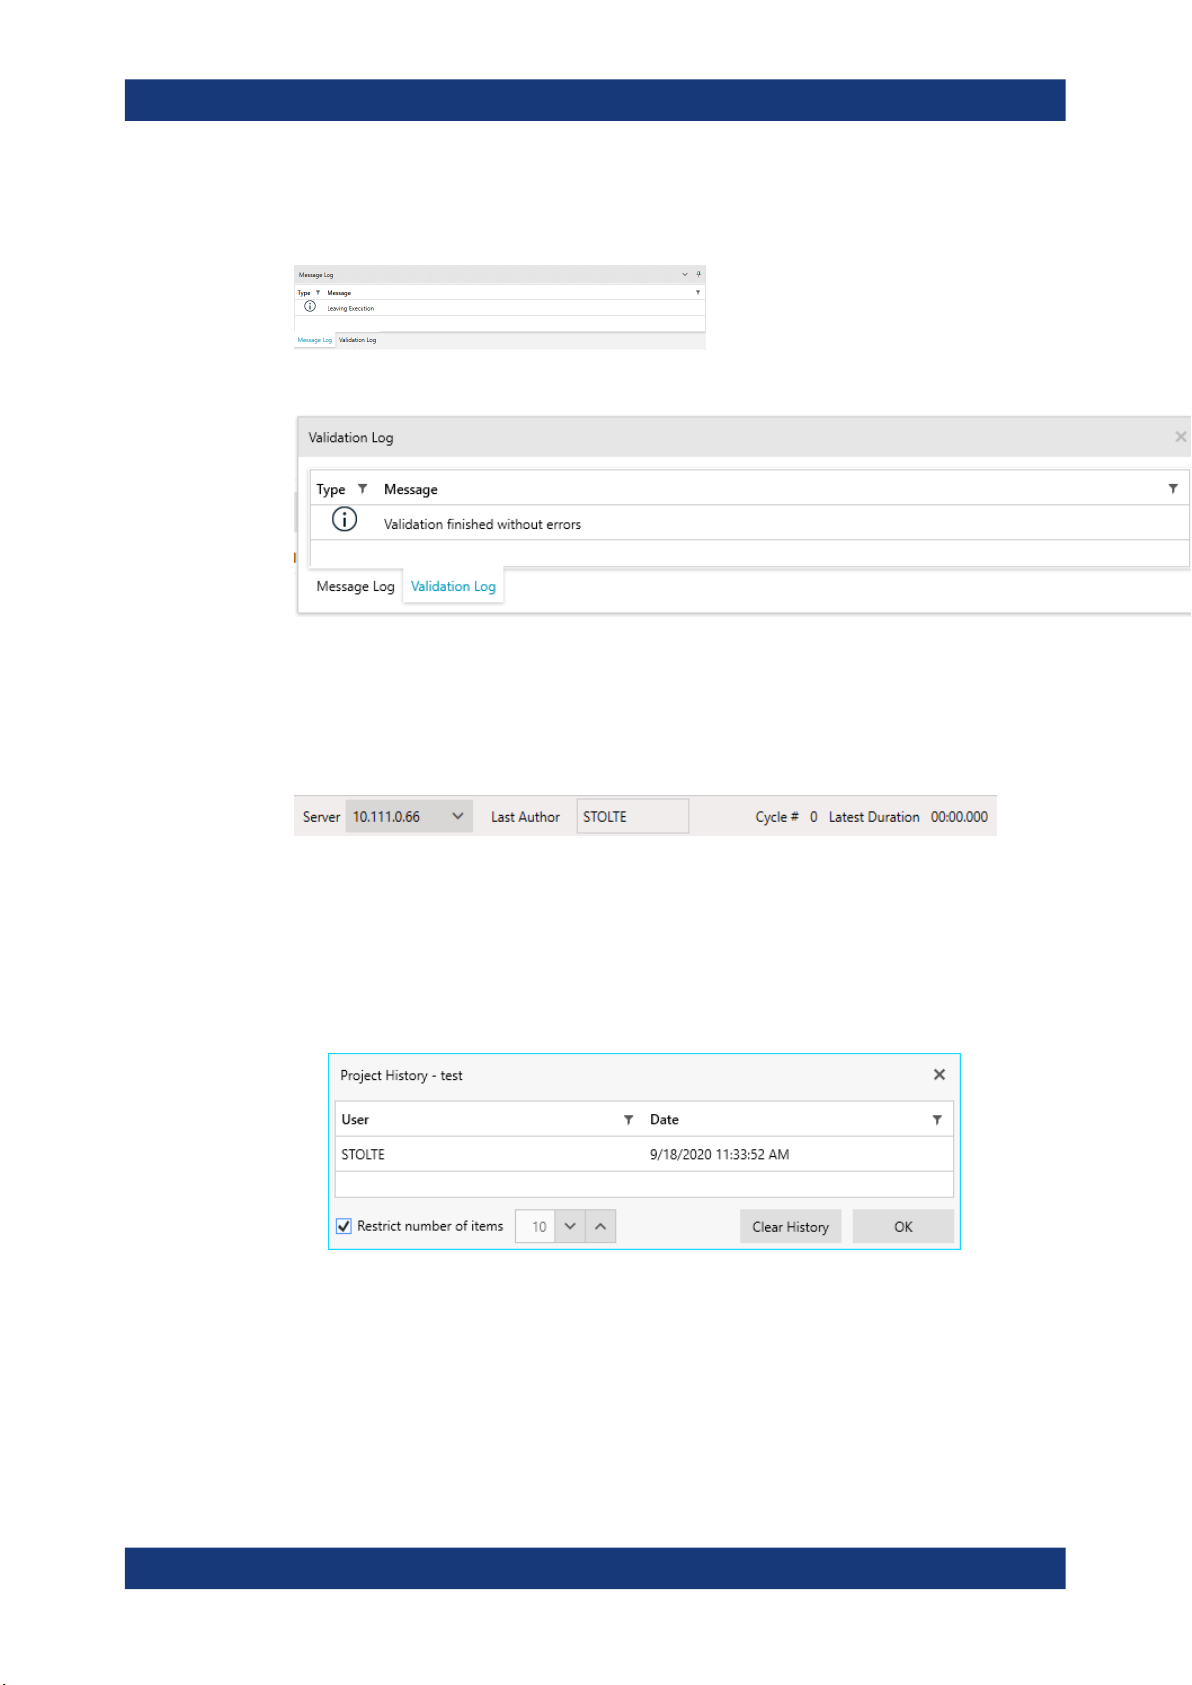
4.1.5 Log Views
By default, the log views are docked at the bottom of the ZNrun Workbench window.
21User Manual 1176.9906.02 ─ 09
R&S®ZNrun
ZNrun Workbench
Application Overview
The "Message Log" displays upcoming events during the execution of the ZNrun Workbench.
The "Validation Log" displays MEU validation results.
From its context menu, you can copy the selected message to the clipboard, or clear
the related log.
4.1.6 Status Bar
The status bar of the ZNrun Workbench window gives access to the following information/settings:
●
Server connection
Select an item from the list of detected ZNrun Servers
●
Project (modification) history
The last author is displayed in the status bar. Click the corresponding status bar
section to view the full project history.
The project (modification) history is tracked in the ProjectHistory.xml file, that
is maintained by the ZNrun Workbench together with the Project.xml.
●
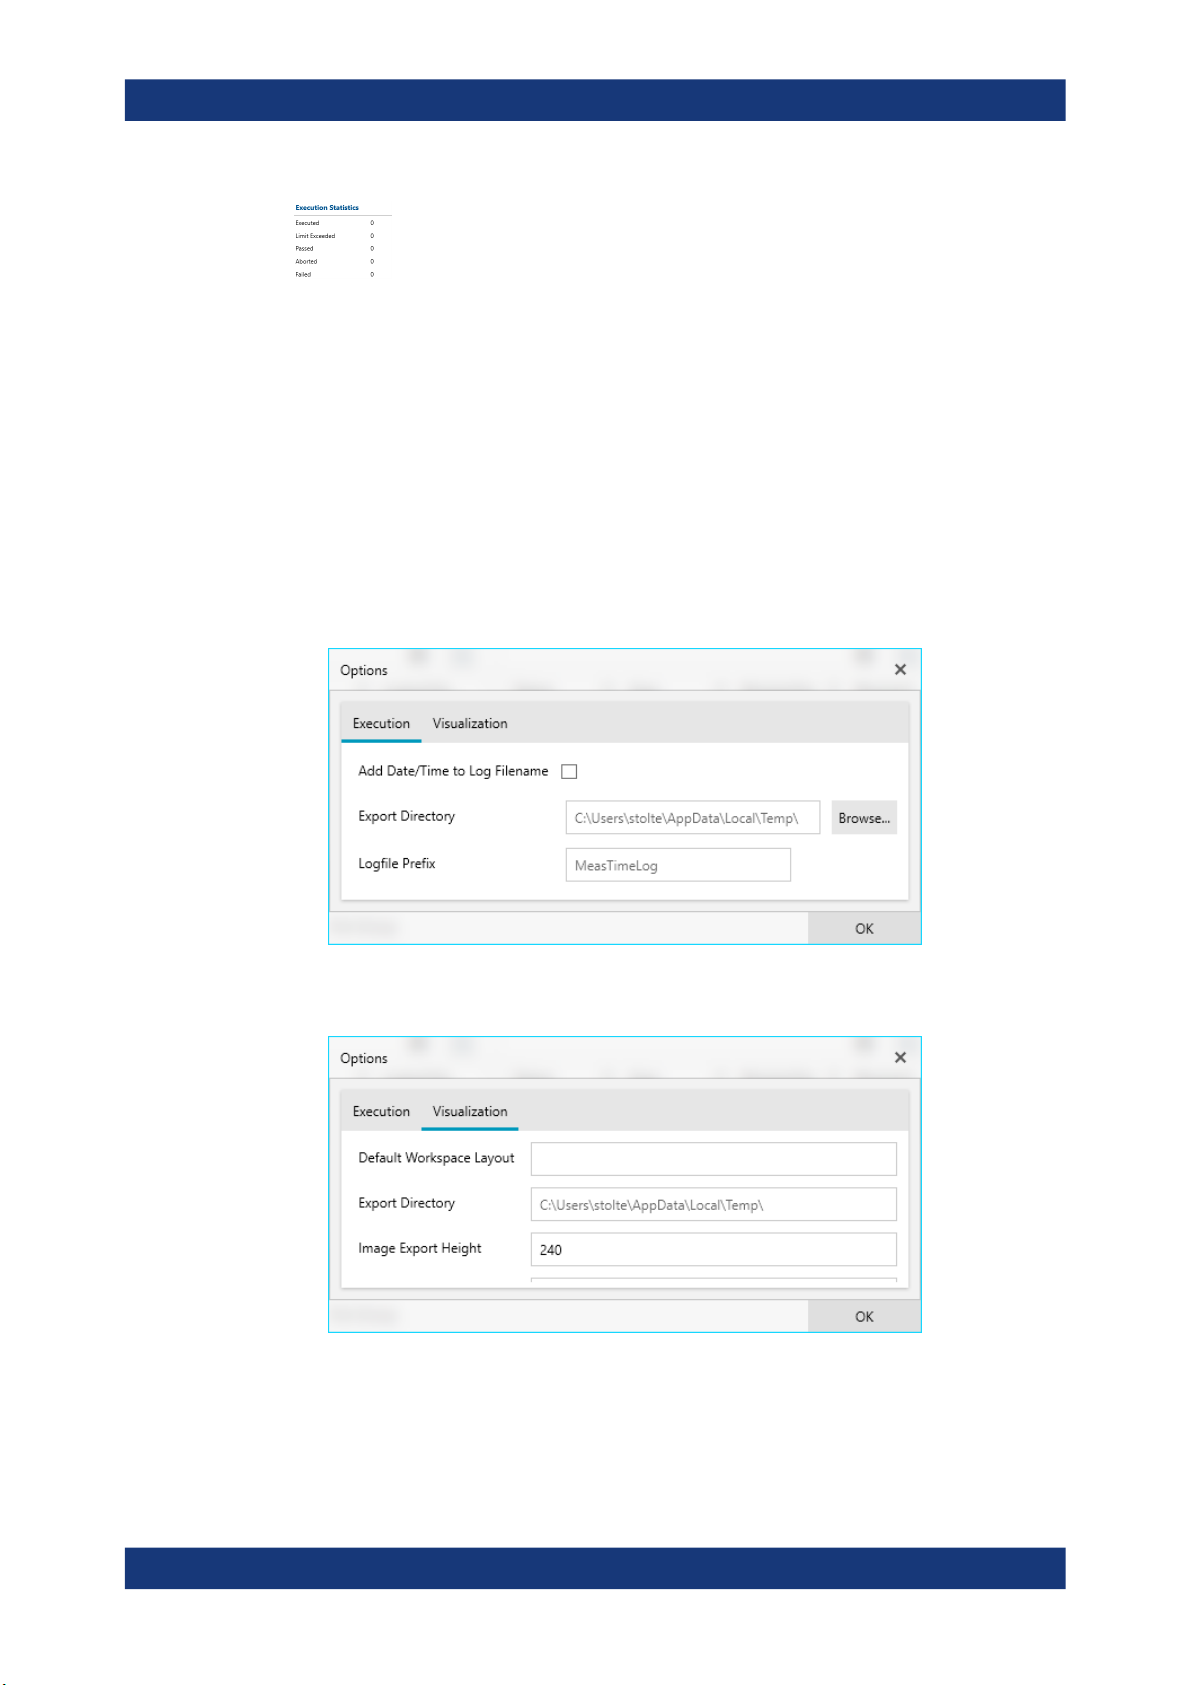
Measurement execution status, including the number of measurement cycles and
the duration of the last measurement cycle (execution phase only)
Hovering over the measurement execution status calls up a popup that displays
the detailed execution statistics:
22User Manual 1176.9906.02 ─ 09
R&S®ZNrun
4.1.7 Options
ZNrun Workbench
Application Overview
Authenticated users (optional)
You can limit the projects that can be run on a particular ZNrun Server to those last
modified by a particular group of users, see "User Authentication Service"
on page 83.
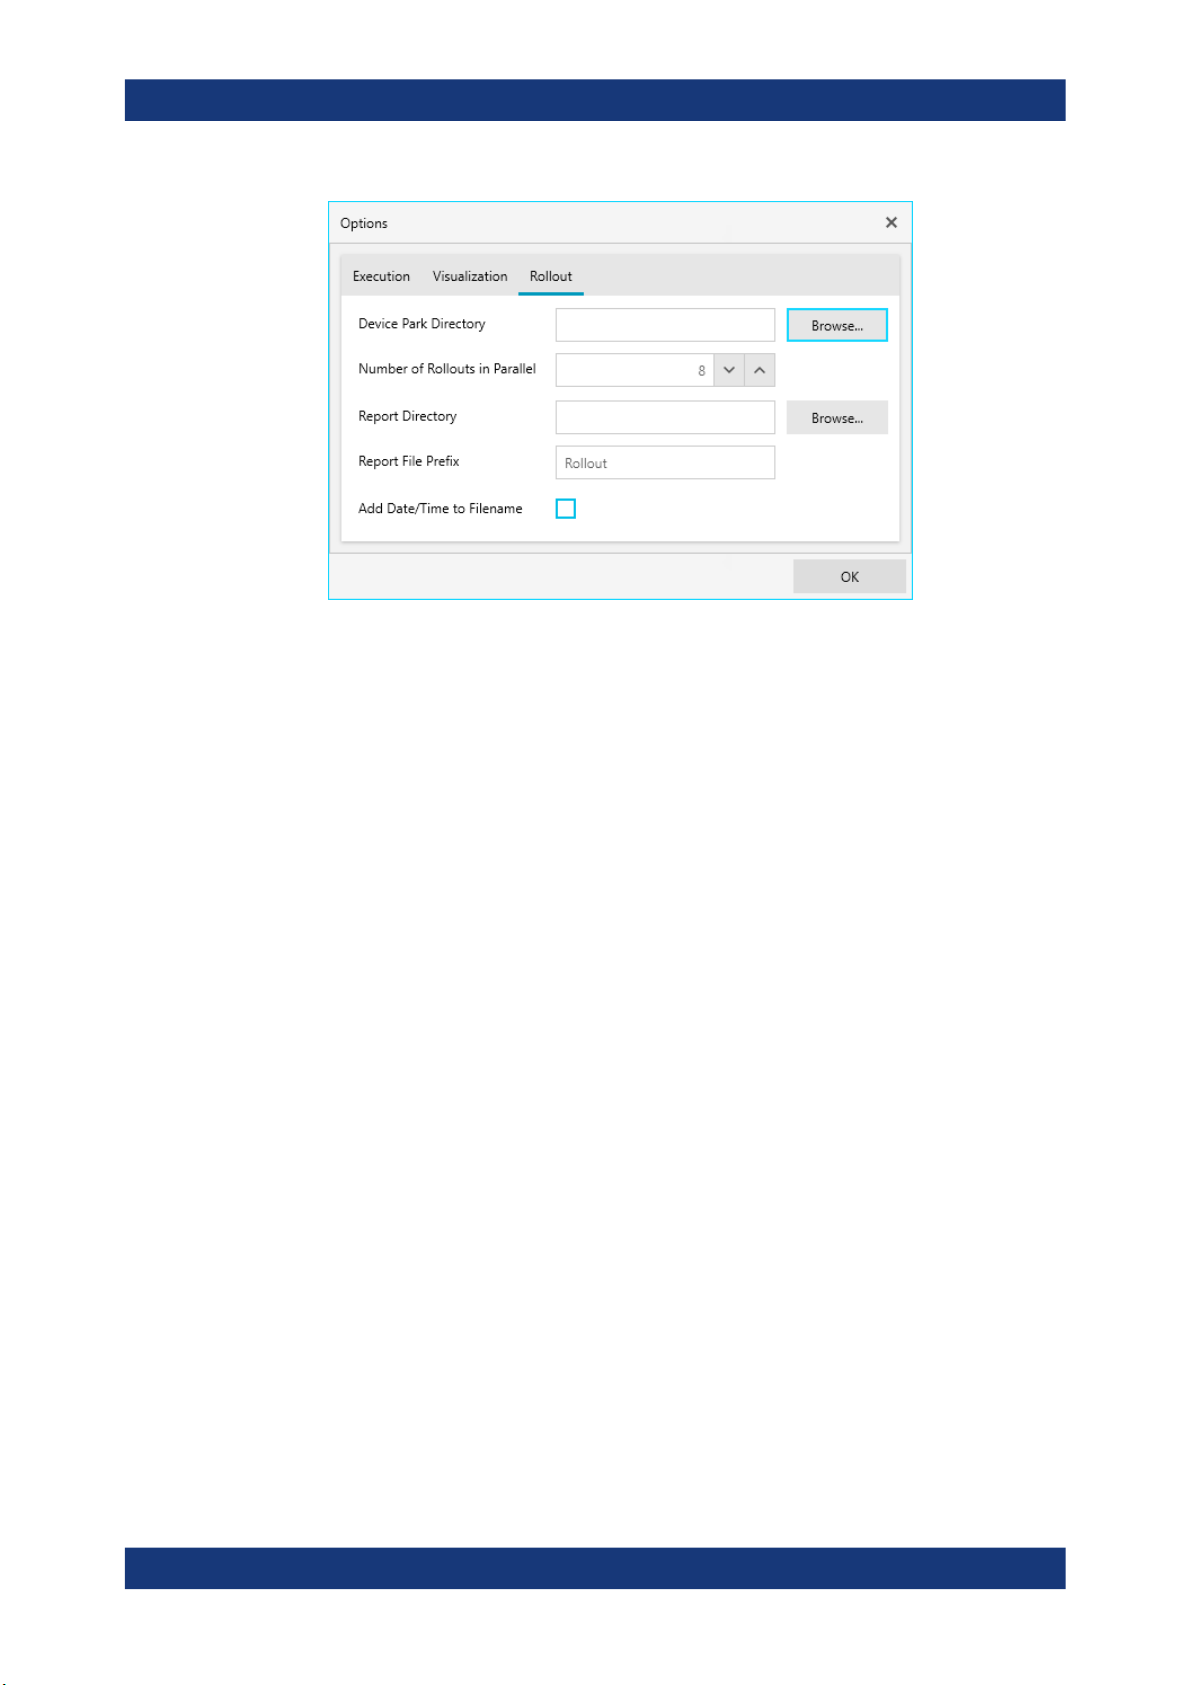
The "Options" dialog is accessible via the main toolbar.
●
On the "Execution" tab, you can choose to add date and time to the created measurement cycle log file names. Furthermore, you can specify the export directory
and define the logfile prefix.
●
On the "Visualization" tab, you can set the default workspace layout.
Furthermore, you can specify the export directory, and the height of the images
exported from the visualization workspace.
●
On the "Rollout" tab, you can specifiy where your Device Park is located and how
many rollouts shall be performed in parallel. See Chapter 4.6, "Rollout Phase",
on page 56 for details. Furthermore, you can specify the report directory and
define the report file prefix.
23User Manual 1176.9906.02 ─ 09
R&S®ZNrun
ZNrun Workbench
Getting Started
4.2 Getting Started
There are three ways to get started with the ZNrun Workbench:
●
You can create a Measurement Execution Unit (MEU) configuration with the
ZNrun Workbench data structure using the first button in the main toolbar
●
You can open an already existing MEU configuration from a ZNrun Workbench file
(*.znwbf).
●
You can load the MEU configuration from a ZNrun project file of a previous
R&S ZNrun version. The ZNrun Workbench automatically converts the ZNrun project to a ZNrun Workbench project.
24User Manual 1176.9906.02 ─ 09
R&S®ZNrun
ZNrun Workbench
Configuration Phase
Figure 4-4: Successfully loaded ZNrun Workbench file.
●
If loading the MEU configuration from file was unsuccessful, an error message is
displayed in the Message Log.
●
If a ZNrun Server IP-address is specified in the ZNrun Workbench file, and the
server is available, the workbench uses this server for execution of the MEU. Otherwise, a R&S ZNrun server has to be selected from the drop-down menu of the
available server connections.
After creating or loading a MEU configuration, the following actions in the main tool bar
are enabled:
●
Save all changes to the working ZNrun Workbench file system.
●
Save your MEU configuration in the ZNrun Workbench file system format.
●
Validate the MEU configuration.
4.3 Configuration Phase
In the configuration phase, you use Configuration View to define or modify the MEU.
From this phase, calibration of devices or execution of measurements can be started.
Additionally it is possible to switch to Chapter 4.6, "Rollout Phase", on page 56.
To change between "Project Pilot" and "Expert" mode, go to the "View" widget and
select the appropriate icon.
25User Manual 1176.9906.02 ─ 09

R&S®ZNrun
4.3.1 Project Pilot
4.3.1.1 DUT Geometry
ZNrun Workbench
Configuration Phase
left icon = Expert Mode
right icon = Project Pilot
The "Project Pilot" allows you to configure MEUs from scratch quickly. The "Project
Pilot" proceeds in four steps:
Figure 4-5: Workflow in the project pilot mode
Figure 4-6: Project Pilot, step 1: DUT Geometry definition
The "DUT Geometry" definition is subdivided into three steps:
1. Set up the logical and physical ports.
2. Group logical ports into port groups.
3. Configure the DUT ports in detail.
If at least one physical port, one logical port and one port group are defined, the
change indicator next to DUT geometry label turns from gray to blue.
1. Set up the logical and physical ports
Use the "Setup Ports" button to open the corresponding dialog.
26User Manual 1176.9906.02 ─ 09
 Loading...