

Rohde&Schwarz R&S®ZNL Analog Demodulation User Manual

R&S®ZNL
Analog Demodulation Mode
(SA Option R&S®FPL1‑K7)
User Manual
(;ÜÉí2)
1178599502
Version 12

This manual applies to the following R&S®ZNL models with firmware version 1.61 and higher:
●
R&S®ZNL3, 5 kHz to 3 GHz, 2 ports, N(f) connectors, order no. 1323.0012K03
●
R&S®ZNL4, 5 kHz to 4.5 GHz, 2 ports, N(f) connectors, order no. 1323.0012K04
●
R&S®ZNL6, 5 kHz to 6 GHz, 2 ports, N(f) connectors, order no. 1323.0012K06
●
R&S®ZNL14, 5 kHz to 14 GHz, 2 ports, N(f) connectors, order no. 1323.0012K14
Serial numbers 101200 and higher
●
R&S®ZNL20, 5 kHz to 20 GHz, 2 ports, 3.5 mm (m) connectors, order no. 1323.0012K20
Serial numbers 101200 and higher
The following firmware options are described:
●
R&S®ZNL3-B1 Spectrum Analysis (1323.1802.02)
●
R&S®ZNL4-B1 Spectrum Analysis (1303.8099.02)
●
R&S®ZNL6-B1 Spectrum Analysis (1323.2067.02)
●
R&S®ZNL14-B1 Spectrum Analysis (1303.8082.02)
●
R&S®ZNL20-B1 Spectrum Analysis (1303.8101.02)
●
R&S FPL1-K7 Analog Demodulation AM/FM/PM (1323.1731.02)
© 2022 Rohde & Schwarz GmbH & Co. KG
Muehldorfstr. 15, 81671 Muenchen, Germany
Phone: +49 89 41 29 - 0
Email: info@rohde-schwarz.com
Internet: www.rohde-schwarz.com
Subject to change – data without tolerance limits is not binding.
R&S® is a registered trademark of Rohde & Schwarz GmbH & Co. KG.
All other trademarks are the properties of their respective owners.
1178.5995.02 | Version 12 | R&S®ZNL
Throughout this manual, products from Rohde & Schwarz are indicated without the ® symbol, e.g. R&S®ZNL is indicated as
R&S ZNL.

R&S®ZNL
Contents
Contents
1 Preface.................................................................................................... 5
1.1 Documentation overview..............................................................................................5
1.2 Conventions used in the documentation....................................................................7
2 Welcome to the R&S FPL1-K7 AM/FM/PM Modulation Analysis
application.............................................................................................. 9
2.1 Starting AM/FM/PM Modulation Analysis....................................................................9
2.2 Understanding the display information.................................................................... 10
3 Measurements and result displays.................................................... 13
4 Measurement basics............................................................................24
4.1 Demodulation process............................................................................................... 24
4.2 Demodulation bandwidth........................................................................................... 26
4.3 Sample rate and demodulation bandwidth...............................................................27
4.4 AF triggers................................................................................................................... 28
4.5 AF filters.......................................................................................................................28
4.6 Time domain zoom......................................................................................................29
5 Configuration........................................................................................31
5.1 Configuration overview.............................................................................................. 31
5.2 Configuration according to standards......................................................................33
5.3 Input and frontend settings........................................................................................35
5.4 Trigger configuration..................................................................................................41
5.5 Data acquisition.......................................................................................................... 45
5.6 Demodulation display.................................................................................................49
5.7 Demodulation.............................................................................................................. 49
5.8 Output settings............................................................................................................69
5.9 Adjusting settings automatically...............................................................................69
6 Analysis................................................................................................ 73
6.1 Trace settings..............................................................................................................73
6.2 Spectrogram settings................................................................................................. 76
6.3 Trace / data export configuration.............................................................................. 81
3User Manual 1178.5995.02 ─ 12

R&S®ZNL
Contents
6.4 Working with markers in the R&S FPL1-K7 AM/FM/PM Modulation Analysis appli-
cation............................................................................................................................84
7 I/Q data import and export................................................................ 104
8 How to perform measurements in the R&S FPL1-K7 AM/FM/PM
Modulation Analysis application...................................................... 105
8.1 How to export trace data and numerical results.................................................... 106
9 Measurement example: demodulating an FM signal...................... 107
10 Optimizing and troubleshooting the measurement........................ 112
11 Remote commands for AM/FM/PM Modulation Analysis............... 113
11.1 Introduction............................................................................................................... 114
11.2 Common suffixes...................................................................................................... 119
11.3 Activating analog modulation analysis...................................................................119
11.4 Configuring the measurement.................................................................................122
11.5 Capturing data and performing sweeps................................................................. 167
11.6 Configuring the result display................................................................................. 170
11.7 Retrieving results......................................................................................................178
11.8 Analyzing results...................................................................................................... 190
11.9 Importing and exporting I/Q data and results........................................................ 264
11.10 Deprecated commands.............................................................................................265
11.11 Programming example............................................................................................. 266
Annex.................................................................................................. 269
A Predefined standards and settings.................................................. 269
List of commands (analog demodulation mode)............................ 271
Index....................................................................................................280
4User Manual 1178.5995.02 ─ 12

R&S®ZNL
Preface
Documentation overview
1 Preface
This chapter provides safety-related information, an overview of the user documentation and the conventions used in the documentation.
1.1 Documentation overview
This section provides an overview of the R&S ZNL user documentation. Unless specified otherwise, you find the documents at:
www.rohde-schwarz.com/manual/ZNL or www.rohde-schwarz.com/manual/ZNLE.
1.1.1 Getting started manual
Introduces the R&S ZNL and describes how to set up and start working with the product. Includes basic operations, typical measurement examples, and general information, e.g. safety instructions, etc.
A printed version is delivered with the instrument. A PDF version is available for download on the Internet.
1.1.2 User manuals and help
Separate user manuals are provided for the base unit and the firmware applications:
●
Base unit manual
Contains the description of all instrument modes and functions. It also provides an
introduction to remote control, a complete description of the remote control commands with programming examples, and information on maintenance, instrument
interfaces and error messages. Includes the contents of the getting started manual.
●
Firmware application manual
Contains the description of the specific functions of a firmware application, including remote control commands. Basic information on operating the R&S ZNL is not
included.
The contents of the user manuals are available as help in the R&S ZNL. The help
offers quick, context-sensitive access to the complete information for the base unit and
the firmware applications.
All user manuals are also available for download or for immediate display on the Internet.
1.1.3 Service manual
Describes the performance test for checking compliance with rated specifications, firmware update, troubleshooting, adjustments, installing options and maintenance.
5User Manual 1178.5995.02 ─ 12

R&S®ZNL
Preface
Documentation overview
The service manual is available for registered users on the global Rohde & Schwarz
information system (GLORIS):
https://gloris.rohde-schwarz.com
1.1.4 Instrument security procedures
Deals with security issues when working with the R&S ZNL in secure areas. It is available for download on the Internet.
1.1.5 Printed safety instructions
Provides safety information in many languages. The printed document is delivered with
the product.
1.1.6 Data sheets and brochures
The data sheet contains the technical specifications of the R&S ZNL. It also lists the
firmware applications and their order numbers, and optional accessories.
The brochure provides an overview of the instrument and deals with the specific characteristics.
See www.rohde-schwarz.com/brochure-datasheet/ZNL or www.rohde-schwarz.com/
brochure-datasheet/ZNLE.
1.1.7 Release notes and open source acknowledgment (OSA)
The release notes list new features, improvements and known issues of the current
firmware version, and describe the firmware installation.
The software makes use of several valuable open source software packages. An opensource acknowledgment document provides verbatim license texts of the used open
source software.
See www.rohde-schwarz.com/firmware/ZNL or www.rohde-schwarz.com/firmware/
ZNLE.
1.1.8 Application notes, application cards, white papers, etc.
These documents deal with special applications or background information on particular topics.
See www.rohde-schwarz.com/application/ZNL or www.rohde-schwarz.com/application/
ZNLE.
6User Manual 1178.5995.02 ─ 12

R&S®ZNL
Preface
Conventions used in the documentation
1.1.9 Calibration certificate
The document is available on https://gloris.rohde-schwarz.com/calcert. You need the
device ID of your instrument, which you can find on a label on the rear panel.
1.2 Conventions used in the documentation
1.2.1 Typographical conventions
The following text markers are used throughout this documentation:
Convention Description
"Graphical user interface elements"
[Keys] Key and knob names are enclosed by square brackets.
Filenames, commands,
program code
Input Input to be entered by the user is displayed in italics.
Links Links that you can click are displayed in blue font.
"References" References to other parts of the documentation are enclosed by quota-
All names of graphical user interface elements on the screen, such as
dialog boxes, menus, options, buttons, and softkeys are enclosed by
quotation marks.
Filenames, commands, coding samples and screen output are distinguished by their font.
tion marks.
1.2.2 Conventions for procedure descriptions
When operating the instrument, several alternative methods may be available to perform the same task. In this case, the procedure using the touchscreen is described.
Any elements that can be activated by touching can also be clicked using an additionally connected mouse. The alternative procedure using the keys on the instrument or
the on-screen keyboard is only described if it deviates from the standard operating procedures.
The term "select" may refer to any of the described methods, i.e. using a finger on the
touchscreen, a mouse pointer in the display, or a key on the instrument or on a keyboard.
1.2.3 Notes on screenshots
When describing the functions of the product, we use sample screenshots. These
screenshots are meant to illustrate as many as possible of the provided functions and
possible interdependencies between parameters. The shown values may not represent
realistic usage scenarios.
7User Manual 1178.5995.02 ─ 12

R&S®ZNL
Preface
Conventions used in the documentation
The screenshots usually show a fully equipped product, that is: with all options installed. Thus, some functions shown in the screenshots may not be available in your particular product configuration.
8User Manual 1178.5995.02 ─ 12

R&S®ZNL
Welcome to the R&S FPL1-K7 AM/FM/PM Modulation Analysis application
Starting AM/FM/PM Modulation Analysis
2 Welcome to the R&S FPL1-K7 AM/FM/PM
Modulation Analysis application
The R&S FPL1-K7 AM/FM/PM Modulation Analysis application option converts the
R&S ZNL into an analog modulation analyzer for amplitude-, frequency- or phasemodulated signals. It measures not only characteristics of the useful modulation, but
also factors such as residual FM or synchronous modulation.
The R&S FPL1-K7 AM/FM/PM Modulation Analysis application features:
●
AM, FM, and PM demodulation, with various result displays:
– Modulation signal versus time
– Spectrum of the modulation signal (FFT)
– RF signal power versus time
– Spectrum of the RF signal
●
Determining maximum, minimum and average or current values in parallel over a
selected number of measurements
●
Maximum accuracy and temperature stability due to sampling (digitization) already
at the IF and digital down-conversion to the baseband (I/Q)
●
Error-free AM to FM conversion and vice versa, without deviation errors, frequency
response or frequency drift at DC coupling
●
Relative demodulation, in relation to a user-defined or measured reference value
Availability of the R&S FPL1-K7 AM/FM/PM Modulation Analysis application
The R&S FPL1-K7 AM/FM/PM Modulation Analysis application becomes available
when you equip the R&S ZNLxx with the optional spectrum analyzer hardware option
R&S ZNLxx-B1 and the optional AM/FM/PM Modulation Analysis firmware (R&S FPL1K7).
For the R&S ZNLE and for R&S ZNL14 and R&S ZNL20 with serial numbers below
101200, these options are not available.
This user manual contains a description of the functionality that the application provides, including remote control operation.
All functions not discussed in this manual are the same as in the base unit and are
described in the R&S ZNL User Manual. The latest version is available for download at
the product homepage http://www.rohde-schwarz.com/product/ZNL.
2.1 Starting AM/FM/PM Modulation Analysis
AM/FM/PM Modulation Analysis is a separate application on the R&S ZNL.
To activate AM/FM/PM Modulation Analysis
1. Select the [MODE] key.
9User Manual 1178.5995.02 ─ 12

R&S®ZNL
Welcome to the R&S FPL1-K7 AM/FM/PM Modulation Analysis application
Understanding the display information
A dialog box opens that contains all operating modes and applications currently
available on your R&S ZNL.
2. Select the "Analog Demod" item.
The R&S ZNL opens a new channel setup for the application for analog modulation
analysis.
The measurement is started immediately with the default settings. It can be configured
in the analog modulation analysis "Overview" dialog box, which is displayed when you
select the "Overview" softkey from any menu (see Chapter 5.1, "Configuration over-
view", on page 31).
Multiple Channel Setups and Sequencer Function
When you activate an application, a new channel setup is created which determines
the measurement settings for that application ("Channel"). The same application can
be activated with different measurement settings by creating several "Channel"s for the
same application.
The number of channel setups that can be configured at the same time depends on the
available memory on the instrument.
Only one measurement can be performed at any time, namely the one in the currently
active channel setup. However, to perform the configured measurements consecutively, a Sequencer function is provided.
If activated, the measurements configured in the currently defined "Channel"s are performed one after the other in the order of the tabs. The currently active measurement is
indicated by a
The result displays of the individual channel setups are updated in the tabs (as well as
the "MultiView" ) as the measurements are performed. Sequential operation itself is
independent of the currently displayed tab.
For details on the Sequencer function, see the R&S ZNL User Manual.
symbol in the tab label.
2.2 Understanding the display information
The following figure shows a measurement diagram during analog modulation analysis. All different information areas are labeled. They are explained in more detail in the
following sections.
10User Manual 1178.5995.02 ─ 12

R&S®ZNL
Welcome to the R&S FPL1-K7 AM/FM/PM Modulation Analysis application
Understanding the display information
1
2
3
4
5
1 = Channel Setup bar for firmware and measurement settings
2 = Diagram area
3 = Window title bar with diagram-specific (trace) information
4 = Instrument status bar with error messages and date/time display
5 = Diagram footer with diagram-specific information, depending on result display
Channel Setup bar information
In the Analog Modulation Analysis application, the R&S ZNL shows the following settings:
Table 2-1: Information displayed in the channel setup bar in the application for analog modulation
Ref Level Reference level
Offset Reference level offset
AQT Measurement time for data acquisition.
RBW Resolution bandwidth
DBW Demodulation bandwidth
Freq Center frequency for the RF signal
analysis
Window title bar information
For each diagram, the header provides the following information:
1 2 345 6 7 8 9
Figure 2-1: Window title bar information in the application for analog modulation analysis
11User Manual 1178.5995.02 ─ 12

R&S®ZNL
Welcome to the R&S FPL1-K7 AM/FM/PM Modulation Analysis application
Understanding the display information
1 = Window number
2 = Window type
3 = Trace color
4 = Trace number
5 = Detector
6 = Trace mode
7 = Reference value (at the defined reference position)
8 = AF coupling (AC/DC), only in AF time domains, if applicable
9 = Results are selected for demodulation output
Diagram footer information
The diagram footer (beneath the diagram) contains the following information, depending on the evaluation:
"RF Spectrum"
CF: Center frequency
of input signal
RF Time domain
CF: Center frequency
of input signal
AF Spectrum
AF CF: center frequency of demodulated signal
AF Time domain
CF: Center frequency
of input signal
Sweep points Span: measured span
Sweep points Time per division
Sweep points AF Span: evaluated span
Sweep points Time per division
For most modes, the number of sweep points shown in the display are indicated in the
diagram footer. In zoom mode, the (rounded) number of currently displayed points are
indicated.
Status bar information
Global instrument settings, the instrument status and any irregularities are indicated in
the status bar beneath the diagram.
12User Manual 1178.5995.02 ─ 12

R&S®ZNL
Measurements and result displays
3 Measurements and result displays
Access: "Overview" > "Display Config"
Or: [MEAS] > "Display Config"
The data that was measured by the R&S ZNL can be evaluated using various different
methods. In the Analog Modulation Analysis application, up to six evaluation methods
can be displayed simultaneously in separate windows. The results can be displayed as
absolute deviations or relative to a reference value or level.
The abbreviation "AF" (for Audio Frequency) refers to the demodulated AM, FM or PM
signal.
Basis for evaluation
All evaluations are based on the I/Q data set acquired during the measurement. The
spectrum of the modulated signal to be evaluated is determined by the demodulation
bandwidth. However, it can be restricted to a limited span ( "AF Span" ) if only part of
the signal is of interest. Furthermore, the time base for evaluations in the time domain
can be restricted to analyze a smaller extract in more detail, see Chapter 4.6, "Time
domain zoom", on page 29.
AM Time Domain ..........................................................................................................13
FM Time Domain ..........................................................................................................14
PM Time Domain ..........................................................................................................15
AM Spectrum ............................................................................................................... 16
FM Spectrum ................................................................................................................17
PM Spectrum ............................................................................................................... 18
RF Time Domain ..........................................................................................................19
RF Spectrum ................................................................................................................20
Result Summary ...........................................................................................................21
Marker Table ................................................................................................................ 23
Marker Peak List .......................................................................................................... 23
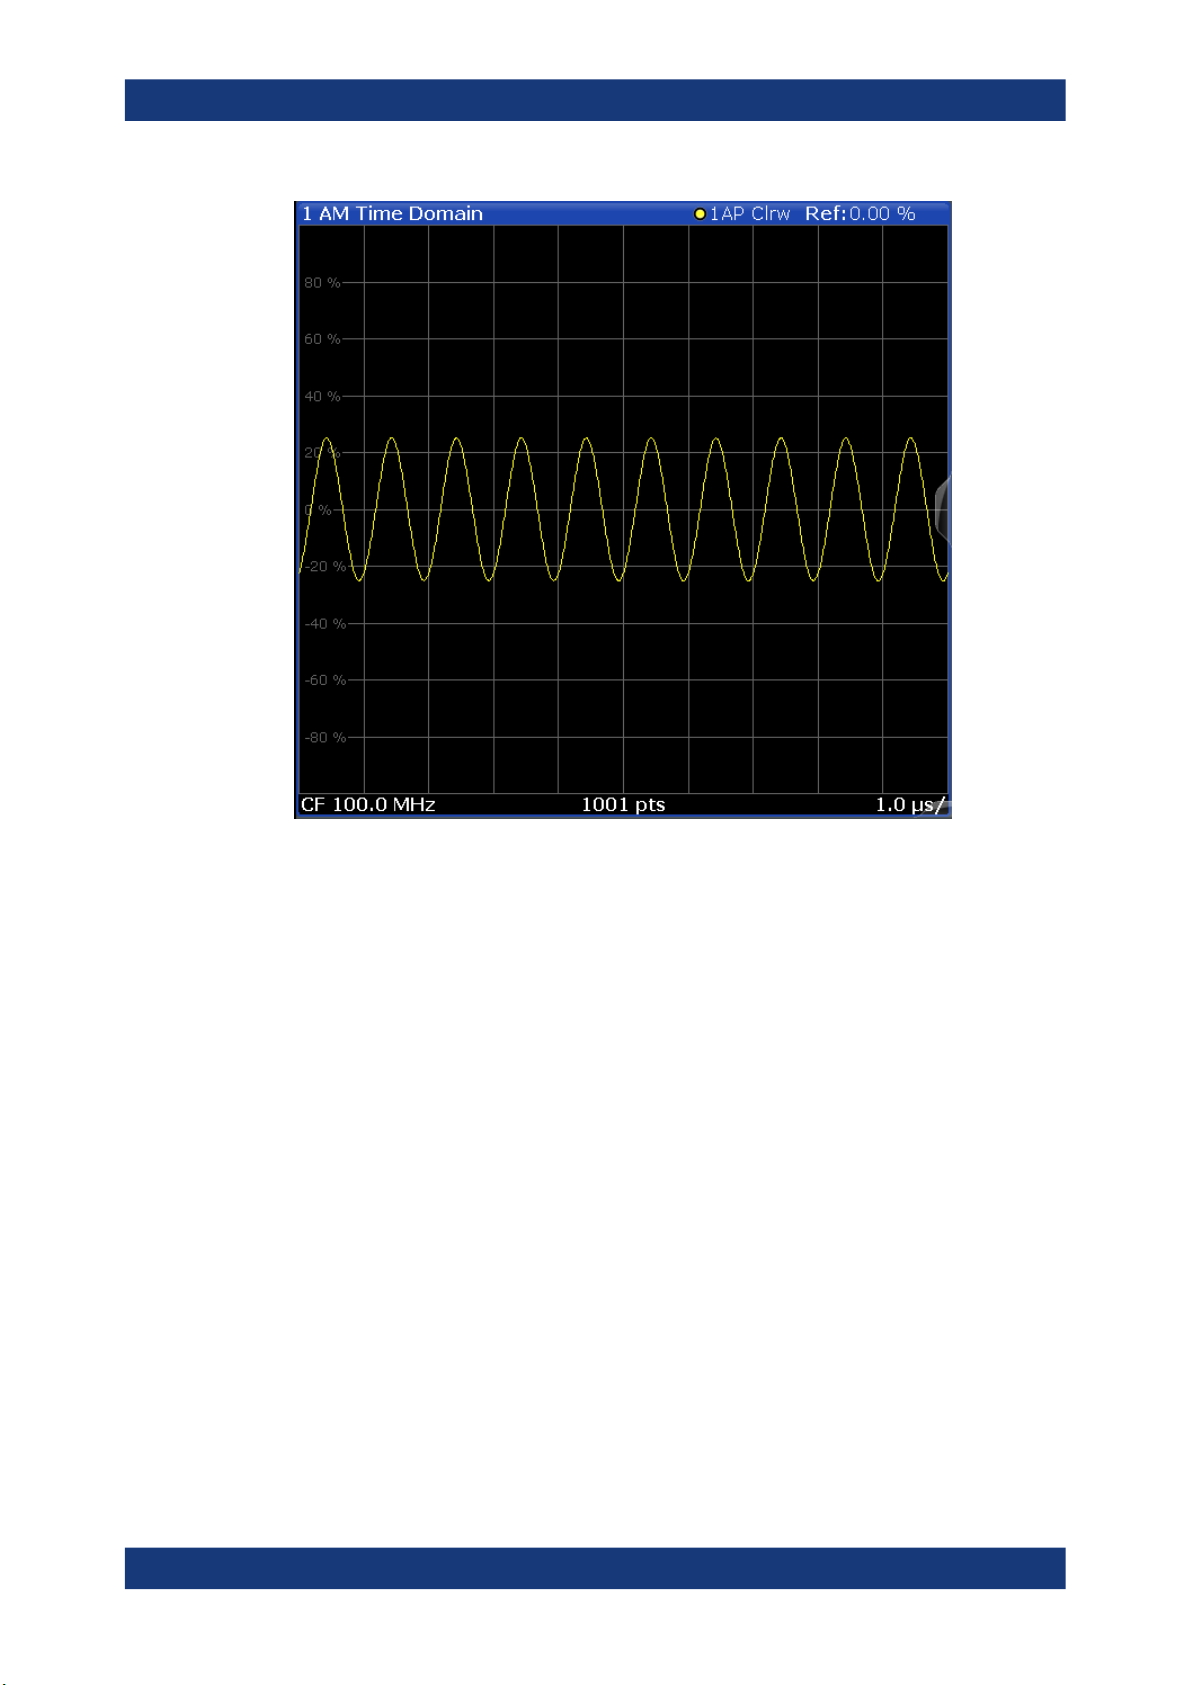
AM Time Domain
Displays the modulation depth of the demodulated AM signal (in %) versus time.
13User Manual 1178.5995.02 ─ 12
R&S®ZNL
Measurements and result displays
Optionally, the settling time can be evaluated and displayed, see Chapter 5.7.7, "Set-
tling time", on page 67.
Remote command:
LAY:ADD? '1',RIGH,'XTIM:AM:REL'
(See LAYout:ADD[:WINDow]? on page 171)
FM Time Domain
Displays the frequency spectrum of the demodulated FM signal versus time.
14User Manual 1178.5995.02 ─ 12

R&S®ZNL
Measurements and result displays
Optionally, the settling time can be evaluated and displayed, see Chapter 5.7.7, "Set-
tling time", on page 67.
Remote command:
LAY:ADD? '1',RIGH,'XTIM:FM'
(See LAYout:ADD[:WINDow]? on page 171)
PM Time Domain
Displays the phase deviations of the demodulated PM signal (in rad or °) versus time.
15User Manual 1178.5995.02 ─ 12

R&S®ZNL
Measurements and result displays
Optionally, the settling time can be evaluated and displayed, see Chapter 5.7.7, "Set-
tling time", on page 67.
Remote command:
LAY:ADD? '1',RIGH,'XTIM:PM'
(See LAYout:ADD[:WINDow]? on page 171)
AM Spectrum
Displays the modulation depth of the demodulated AM signal (in % or dB) versus AF
span. The spectrum is calculated from the demodulated AM signal in the time domain
via FFT.
16User Manual 1178.5995.02 ─ 12

R&S®ZNL
Measurements and result displays
Remote command:
LAY:ADD? '1',RIGH,'XTIMe:AM:REL:AFSPectrum1'
(see LAYout:ADD[:WINDow]? on page 171)
FM Spectrum
Displays the frequency deviations of the demodulated FM signal (in Hz or dB) versus
AF span. The spectrum is calculated from the demodulated AM signal in the time
domain via FFT.
17User Manual 1178.5995.02 ─ 12

R&S®ZNL
Measurements and result displays
Remote command:
LAY:ADD? '1',RIGH,'XTIMe:FM:AFSPectrum1'
(see LAYout:ADD[:WINDow]? on page 171)
PM Spectrum
Displays the phase deviations of the demodulated PM signal (in rad, ° or dB) versus
AF span. The spectrum is calculated from the demodulated AM signal in the time
domain via FFT.
18User Manual 1178.5995.02 ─ 12

R&S®ZNL
Measurements and result displays
Remote command:
LAY:ADD? '1',RIGH,'XTIMe:PM:AFSPectrum1'
(see LAYout:ADD[:WINDow]? on page 171)
RF Time Domain
Displays the RF power of the input signal versus time. The level values represent the
magnitude of the I/Q data set.
19User Manual 1178.5995.02 ─ 12

R&S®ZNL
Measurements and result displays
Optionally, the settling time can be evaluated and displayed, see Chapter 5.7.7, "Set-
tling time", on page 67.
Remote command:
LAY:ADD? '1',RIGH,'XTIM:AM'
(see LAYout:ADD[:WINDow]? on page 171)
RF Spectrum
Displays the spectrum of the input signal. In contrast to the Spectrum application, the
frequency values are determined using FFT from the recorded I/Q data set.
20User Manual 1178.5995.02 ─ 12

R&S®ZNL
Measurements and result displays
Remote command:
LAY:ADD? '1',RIGH,'XTIM:SPECTRUM'
(see LAYout:ADD[:WINDow]? on page 171)
Result Summary
The "result summary" displays the results of the demodulation functions for all windows
in a table.
The following general results are provided:
For each demodulation, the following results are provided:
Label Description
"Carr Power" Measured carrier power
"Carr Offset" Carrier offset to nominal center frequency
"Mod. Depth" Modulation depth
21User Manual 1178.5995.02 ─ 12

R&S®ZNL
Measurements and result displays
Table 3-1: Result summary description
Label Description
"Settling Time" Time after which signal remains in a specified value range.
Only evaluated and displayed if enabled, see Chapter 5.7.7, "Settling time",
on page 67.
"+Peak" Positive peak (maximum)
"-Peak" Negative peak (minimum)
"+/-Peak/2" Average of positive and negative peaks
"RMS" Root Mean Square value
"Mod Freq" Modulation frequency
"SINAD" Signal-to-noise-and-distortion
(Calculated only if AF Spectrum is displayed)
Measures the ratio of the total power to the power of noise and harmonic distortions.
The noise and harmonic power is calculated inside the AF spectrum span. The DC
offset is removed before the calculation.
"DISTORT" Modulation distortion in %
(Calculated only if "SINAD" is also calculated)
Measures the distortion of the modulation in relation to the total power of the signal
inside the AF spectrum span. Indicates the quality of the modulation.
"THD" Total harmonic distortion
The ratio of the harmonics to the fundamental and harmonics. All harmonics inside
the AF spectrum span are considered up to the tenth harmonic.
(Calculated only if AF Spectrum is displayed)
Note: Relative demodulation results. Optionally, the demodulation results in relation to
user-defined or measured reference values are determined. See Chapter 5.7.6, "Result
table settings", on page 64.
In addition, the following general information for the input signal is provided:
●
"Carrier Power": the power of the carrier without modulation
●
"Carrier Offset": the deviation of the calculated carrier frequency to the ideal carrier
frequency
●
"Modulation Depth" (AM or "RF Time Domain" only): the difference in amplitude the
carrier signal is modulated with
22User Manual 1178.5995.02 ─ 12

R&S®ZNL
Measurements and result displays
Remote command:
LAY:ADD? '1',RIGH,RSUM, see LAYout:ADD[:WINDow]? on page 171
Results:
Chapter 11.7.3, "Retrieving result summary values", on page 183
Marker Table
Displays a table with the current marker values for the active markers.
This table is displayed automatically if configured accordingly.
(See " Marker Table Display " on page 88).
Tip: To navigate within long marker tables, simply scroll through the entries with your
finger on the touchscreen.
Remote command:
LAY:ADD? '1',RIGH, MTAB, see LAYout:ADD[:WINDow]? on page 171
Results:
CALCulate<n>:MARKer<m>:X on page 207
CALCulate<n>:MARKer<m>:Y? on page 208
Marker Peak List
The marker peak list determines the frequencies and levels of peaks in the spectrum or
time domain. How many peaks are displayed can be defined, as well as the sort order.
In addition, the detected peaks can be indicated in the diagram. The peak list can also
be exported to a file for analysis in an external application.
Remote command:
LAY:ADD? '1',RIGH, PEAK, see LAYout:ADD[:WINDow]? on page 171
Results:
CALCulate<n>:MARKer<m>:X on page 207
CALCulate<n>:MARKer<m>:Y? on page 208
23User Manual 1178.5995.02 ─ 12

R&S®ZNL
Measurement basics
Demodulation process
4 Measurement basics
Some background knowledge on basic terms and principles used in Analog Modulation
Analysis measurements is provided here for a better understanding of the required
configuration settings.
● Demodulation process............................................................................................ 24
● Demodulation bandwidth.........................................................................................26
● Sample rate and demodulation bandwidth..............................................................27
● AF triggers...............................................................................................................28
● AF filters..................................................................................................................28
● Time domain zoom..................................................................................................29
4.1 Demodulation process
The demodulation process is shown in Figure 4-1. All calculations are performed simultaneously with the same I/Q data set. Magnitude (= amplitude) and phase of the complex I/Q pairs are determined. The frequency result is obtained from the differential
phase.
For details on general I/Q data processing in the R&S ZNL, refer to the reference part
of the I/Q Analysis remote control description in the R&S ZNL User Manual.
24User Manual 1178.5995.02 ─ 12

R&S®ZNL
Measurement basics
Demodulation process
Figure 4-1: Block diagram of software demodulator
25User Manual 1178.5995.02 ─ 12

R&S®ZNL
Measurement basics
Demodulation bandwidth
The AM DC, FM DC and PM DC raw data of the demodulators is fed into the "Trace
Arithmetic" block that combines consecutive data sets. Possible trace modes are:
Clear Write, Max Hold, Min Hold and Average. The output data of the "Trace Arithmetic" block can be read via remote control ([SENS:]ADEM:<evaluation>:RES?,
see [SENSe:]ADEMod:AM[:ABSolute][:TDOMain]:RESult? on page 179.
The collected measured values are evaluated by the selected detector. The result is
displayed on the screen and can be read out via remote control.
In addition, important parameters are calculated:
●
A counter determines the modulation frequency for AM, FM, and PM.
●
average power = carrier power (RF power)
●
average frequency = carrier frequency offset (FM)
●
The modulation depth or the frequency or phase deviation; the deviations are
determined from the trace data
AC coupling is possible with FM and PM display.
4.2 Demodulation bandwidth
The demodulation bandwidth determines the span of the signal that is demodulated. It
is not the 3-dB bandwidth of the filter, but the useful bandwidth which is distortion-free
regarding phase and amplitude.
Therefore the following formulas apply:
●
AM: demodulation bandwidth ≥ 2 x modulation frequency
●
FM: demodulation bandwidth ≥ 2 x (frequency deviation + modulation frequency)
●
PM: demodulation bandwidth ≥ 2 x modulation frequency x (1 + phase deviation)
If the center frequency of the analyzer is not set exactly to the signal frequency, the
demodulation bandwidth must be increased by the carrier offset, in addition to the
requirement described above. The bandwidth must also be increased if FM or PM AC
coupling is selected.
In general, select the demodulation bandwidth as narrow as possible to improve the
S/N ratio. The residual FM caused by noise floor and phase noise increases dramatically with the bandwidth, especially with FM.
For help on determining the adequate demodulation bandwidth, see "Determining the
demodulation bandwidth" on page 112.
A practical example is described in Chapter 9, "Measurement example: demodulating
an FM signal", on page 107.
26User Manual 1178.5995.02 ─ 12

R&S®ZNL
Measurement basics
Sample rate and demodulation bandwidth
4.3 Sample rate and demodulation bandwidth
The maximum demodulation bandwidths that can be obtained during the measurement, depending on the sample rate, are listed in the tables below for different demodulation filter types. The allowed value range of the measurement time and trigger offset
depends on the selected demodulation bandwidth and demodulation filter. If the AF filter or the AF trigger are not active, the measurement time increases by 20 %.
A maximum of 24 million samples can be captured, assuming sufficient memory is
available; thus the maximum measurement time can be determined according to the
following formula:
Meas.time
The minimum trigger offset is (-Meas.time
Table 4-1: Available demodulation bandwidths and corresponding sample rates
Demodulation BW Sample Rate (Flat Top) Sample Rate (Gaussian Top)
= Sample count
max
/ sample rate
max
max
)
100 Hz 122.0703125 Hz 400 Hz
200 Hz 244.140625 Hz 800 Hz
400 Hz 488.28125 Hz 1.6 kHz
800 Hz 976.5625 Hz 3.2 kHz
1.6 kHz 1.953125 kHz 6.4 kHz
3.2 kHz 3.90625 kHz 12.8 kHz
6.4 kHz 7.8125 kHz 25.6 kHz
12.5 kHz 15.625 kHz 50 kHz
25 kHz 31.25 kHz 100 kHz
50 kHz 62.5 kHz 200 kHz
100 kHz 125 kHz 400 kHz
200 kHz 250 kHz 800 kHz
400 kHz 500 kHz 1.6 MHz
800 kHz 1 MHz 3.2 MHz
1.6 MHz 2 MHz 6.4 MHz
3 MHz 4 MHz 12 MHz
5 MHz 8 MHz 20 MHz
8 MHz 16 MHz 32 MHz
10 MHz 32 MHz 40 MHz
18 MHz* 32 MHz 72 MHz
28 MHz* 64 MHz 112 MHz
27User Manual 1178.5995.02 ─ 12

R&S®ZNL
Measurement basics
AF filters
Demodulation BW Sample Rate (Flat Top) Sample Rate (Gaussian Top)
40 MHz* 64 MHz 160 MHz
* Gaussian filter curve is limited by I/Q bandwidth
Flat top filters require an I/Q bandwidth at least the size of the demodulation bandwidth
on the R&S ZNL. Gauss filters require at least twice the size of the demodulation bandwidth on the R&S ZNL. If necessary, install optional bandwidth extensions on the
R&S ZNL to use the required demodulation filter.
Large numbers of samples
Principally, the R&S ZNL can handle up to 24 million samples. However, when 480001
samples are exceeded, all traces that are not currently being displayed in a window are
deactivated to improve performance. The traces can only be activated again when the
samples are reduced.
Effects of measurement time on the stability of measurement results
Despite amplitude and frequency modulation, the display of carrier power and carrier
frequency offset is stable.
Stability is achieved by a digital filter which sufficiently suppresses the modulation. As
a prerequisite, the measurement time must be ≥ 3 x 1 / modulation frequency, i.e. at
least three periods of the AF signal are recorded.
The mean carrier power for calculating the AM is also calculated with a digital filter.
The filter returns stable results after a measurement time of ≥ 3 x 1 / modulation frequency, i.e. at least three cycles of the AF signal must be recorded before a stable AM
can be shown.
4.4 AF triggers
The Analog Modulation Analysis application allows triggering to the demodulated signal. The display is stable if a minimum of five modulation periods are within the recording time.
Triggering is always DC-coupled. Therefore triggering is possible directly to the point
where a specific carrier level, phase or frequency is exceeded or not attained.
4.5 AF filters
Additional filters applied after demodulation help filter out unwanted signals, or correct
pre-emphasized input signals. A CCITT filter allows you to evaluate the signal by simulating the characteristics of human hearing.
28User Manual 1178.5995.02 ─ 12

R&S®ZNL
Measurement basics
Time domain zoom
4.6 Time domain zoom
For evaluations in the time domain, the demodulated data for a particular time span
can be extracted and displayed in more detail using the "Time Domain Zoom" function.
Zooming is useful if the measurement time is very large and thus each sweep point
represents a large time span. The time domain zoom function distributes the available
sweep points only among the time span defined by the zoom area length. The time
span displayed per division of the diagram is decreased. Thus, the display of the
extracted time span becomes more precise.
Figure 4-2: FM time domain measurement with a very long measurement time (200 ms)
Figure 4-3: FM time domain measurement with time domain zoom (2.0 ms per division)
The time domain zoom area affects not only the diagram display, but the entire evaluation for the current window.
In contrast to the time domain zoom, the graphical zoom is available for all diagram
evaluations. However, the graphical zoom is useful only if more measured values than
trace points are available. The (time) span represented by each measurement point
remains the same.
29User Manual 1178.5995.02 ─ 12

R&S®ZNL
Measurement basics
Time domain zoom
Time domain zoom Graphical zoom
30User Manual 1178.5995.02 ─ 12
 Loading...