

Rohde&Schwarz R&S®WinIQSIM2™ User Manual

TM
R&S®WinIQSIM2
Signal Generation Software
User Manual
(;ÛÅQ2)
1177553302
Version 07

This document describes R&S®WinIQSIM2TM and its options.
●
R&S®WinIQSIM2-K261
●
R&S®WinIQSIM2-K262
This manual version corresponds to software version 4.90.108.xx and later of R&S®WinIQSIM2TM.
© 2021 Rohde & Schwarz GmbH & Co. KG
Mühldorfstr. 15, 81671 München, Germany
Phone: +49 89 41 29 - 0
Email: info@rohde-schwarz.com
Internet: www.rohde-schwarz.com
Subject to change – data without tolerance limits is not binding.
R&S® is a registered trademark of Rohde & Schwarz GmbH & Co. KG.
Trade names are trademarks of the owners.
1177.5533.02 | Version 07 | R&S®WinIQSIM2
Throughout this manual, products from Rohde & Schwarz are indicated without the ® symbol or without trademark, e.g. R&S®WinIQSIM2TM is abbreviated as R&S WinIQSIM2.
TM

R&S®WinIQSIM2
1 Welcome to the Simulation Software R&S WinIQSIM2.......................7
1.1 Key Features................................................................................................................10
1.2 Related Rohde & Schwarz Instruments.................................................................... 10
1.3 Documentation Overview........................................................................................... 11
1.4 Typographical Conventions....................................................................................... 13
1.5 Notes on Screenshots................................................................................................ 13
2 Getting Started..................................................................................... 14
2.1 Installing the R&S WinIQSIM2 Software....................................................................14
2.2 Starting R&S WinIQSIM2............................................................................................ 16
2.3 Trying Out R&S WinIQSIM2........................................................................................17
TM
Contents
Contents
2.4 Overview of R&S WinIQSIM2......................................................................................32
2.5 Controlling R&S WinIQSIM2.......................................................................................34
2.6 Getting Information and Help.....................................................................................42
3 Configuring the Baseband Source..................................................... 45
3.1 How to Access the Functions in the Baseband Block............................................ 45
3.2 Generating Signals According to Digital Standards................................................46
3.3 Common Functions and Settings in the Baseband................................................. 49
3.4 Generating Custom Digital Modulated Signals........................................................ 60
3.5 Generating Multi-Carrier Continuous Wave Signals................................................92
3.6 Generating Multi Carrier Signals............................................................................. 101
3.7 Generating Multi Segment Waveform Files............................................................ 118
3.8 Import IQ Data........................................................................................................... 129
4 Adding Noise to the Signal............................................................... 144
4.1 About the AWGN Generator.....................................................................................144
4.2 AWGN Settings..........................................................................................................147
4.3 How to Configure the Noise Generator for Receiver Tests................................... 152
5 Displaying Simulated Waveforms Graphically................................155
5.1 About the Graphical Signal Display........................................................................ 155
5.2 Graphical Signal Display Settings...........................................................................163
5.3 How to Verify the Generated Signal with the Graphics Display........................... 170
3User Manual 1177.5533.02 ─ 07

R&S®WinIQSIM2
6 Setting Up Instruments......................................................................179
6.1 Available Instruments Settings................................................................................180
6.2 Configure Instruments Settings.............................................................................. 182
6.3 Configuring Remote Operating Modes................................................................... 185
6.4 How to Access and Configure an Instrument........................................................ 189
7 Transferring Data............................................................................... 194
7.1 Waveform Transmission Settings............................................................................194
7.2 How to Transmit Waveform Data to Instruments or Files..................................... 196
8 File and Data Management................................................................200
8.1 About the File System.............................................................................................. 200
8.2 Storing and Recalling Application Settings........................................................... 202
8.3 Accessing Files with User Data............................................................................... 208
TM
Contents
8.4 Exporting Remote Command Lists......................................................................... 212
8.5 Loading, Importing and Exporting Lists................................................................. 212
8.6 Using the File Manager.............................................................................................212
8.7 Transferring a File to an Instrument........................................................................215
9 General Functions of the Signal Generation Software...................216
9.1 Setup.......................................................................................................................... 217
9.2 Querying Error Messages & Info Key......................................................................220
10 Automation of R&S WinIQSIM2........................................................ 224
10.1 Remote Control Interfaces and Protocols.............................................................. 225
10.2 How to Set Up a Remote Control Connection........................................................ 229
10.3 Automating Tasks with Remote Command Scripts............................................... 236
10.4 How to Use the SCPI Record Function................................................................... 241
11 Remote Control Commands..............................................................248
11.1 Conventions Used in SCPI Command Descriptions..............................................248
11.2 Common Commands................................................................................................248
11.3 Tags for Waveforms, Data and Control Lists..........................................................253
11.4 MMEMory Subsystem...............................................................................................276
11.5 Transmission Commands........................................................................................ 286
11.6 SOURce:AWGN Subsystem..................................................................................... 297
11.7 SOURce:BB:ARB:MCAR Subsystem...................................................................... 304
4User Manual 1177.5533.02 ─ 07

R&S®WinIQSIM2
11.8 SOURce:BB:ARB:WSEG Subsystem......................................................................319
11.9 SOURce:BB:DM Subsystem.................................................................................... 328
11.10 SOURce:BB:IMPort Subsystem...............................................................................358
11.11 SOURce:BB:MCCW Subsystem.............................................................................. 369
11.12 SOURce:BB:PROGress Subsystem General Commands.....................................382
11.13 STATus Subsystem................................................................................................... 383
11.14 SYSTem Subsystem..................................................................................................387
12 Troubleshooting and Error Messages..............................................393
12.1 Error Messages......................................................................................................... 393
12.2 SCPI-Error Messages................................................................................................394
12.3 Device-Specific Error Messages..............................................................................394
12.4 Resolving Network Connection Failures................................................................ 395
TM
Contents
12.5 Obtaining Technical Support................................................................................... 396
Annex.................................................................................................. 397
A Reference Information on Remote Control......................................397
A.1 Additional Basics on Remote Control.....................................................................397
B Extensions for User Files..................................................................419
C Elements and Controls of the Graphical User Interface.................421
C.1 Status Information Displayed in the Info Line........................................................421
C.2 Elements Displayed for Interactions....................................................................... 422
List of commands.............................................................................. 425
Index....................................................................................................432
5User Manual 1177.5533.02 ─ 07

R&S®WinIQSIM2
TM
Contents
6User Manual 1177.5533.02 ─ 07

R&S®WinIQSIM2
1 Welcome to the Simulation Software
TM
Welcome to the Simulation Software R&S WinIQSIM2
R&S WinIQSIM2
The R&S WinIQSIM2 simulation software is a Windows-PC based program that creates digitally modulated signal waveforms. Offering waveform signals in accordance
with the definitions in the digital standards or with user-definable characteristics,
R&S WinIQSIM2 is an indispensable application for anyone engaged in state-of-the-art
digital modulation.
R&S WinIQSIM2 enables you to generate waveform files of various digitally modulated
signals in accordance with the definitions in the digital standards or with user-definable
characteristics.
Waveforms are files with settings provided for repeatable tests with the same test signal. Irrespectively of the way these waveform files are generated, they are always
played from an instrument, e.g. the vector signal generator R&S SMW. The signal calculation is performed in advance and the instrument acts as a player.
Features and functions
In addition to the wide range of digital standards, the functions of R&S WinIQSIM2 also
comprise single carrier modulation, the generation of multi carrier signals, WCDMA
and third-order signals.
The software calculates I and Q baseband signals on a Windows PC system comprising almost the same functionalities as Rohde & Schwarz vector signal generators.
R&S WinIQSIM2 includes the characteristics of an R&S instrument, if defined. In addition, an internal AWGN noise generator allows you to superimpose noise on the generated signal.
The graphical signal display function visualizes a generated signal in various graphical
views for quick evaluation and verification of the signal characteristics.
You can transmit a generated signal directly to a connected instrument in the network
over LAN, or via USB or GPIB. Alternatively, you can store it locally in a file and
retrieve it later on the instrument. The instrument plays back the loaded waveform file
and thus generates the corresponding signal.
7User Manual 1177.5533.02 ─ 07

R&S®WinIQSIM2
TM
Welcome to the Simulation Software R&S WinIQSIM2
Required equipment of an instrument
The following equipment is required for playing waveform files on the instrument:
●
ARB (arbitrary waveform generator) or a waveform memory playback
An instrument must be equipped with an ARB or a waveform memory, allowing the
playback of waveform files.
●
Digital standard option
To play waveform file generated by R&S WinIQSIM2, install corresponding digital
standard option on the instrument. The instrument processes waveform files, if the
full software option or waveform software option is installed.
For example, after installing option R&S SMW-K55 (full) or R&S SMW-K255 (waveform), you can process EUTRA/LTE waveform files generated by R&S WinIQSIM2
on the R&S SMW.
●
Multicarrier CW signal generation
To process multicarrier waveforms, the instrument must be equipped with the corresponding option provided for R&S WinIQSIM2 waveform files.
●
AWGN
Similarly, an instrument must have installed the corresponding R&S WinIQSIM2
option for processing additive white Gaussian noise.
See Chapter 1.2, "Related Rohde & Schwarz Instruments", on page 10 for the list of
instruments from Rohde & Schwarz that can process waveform files.
For information on the available options, see the data sheet of the instrument.
GUI appearance and operation
The graphical user interface of R&S WinIQSIM2 is based on the GUI design of the
R&S SMW vector signal generator. It also resembles the user interface of the R&S
SMBV, or the R&S SMU signal generator family.
8User Manual 1177.5533.02 ─ 07
R&S®WinIQSIM2
TM
Welcome to the Simulation Software R&S WinIQSIM2
3 4
2
1
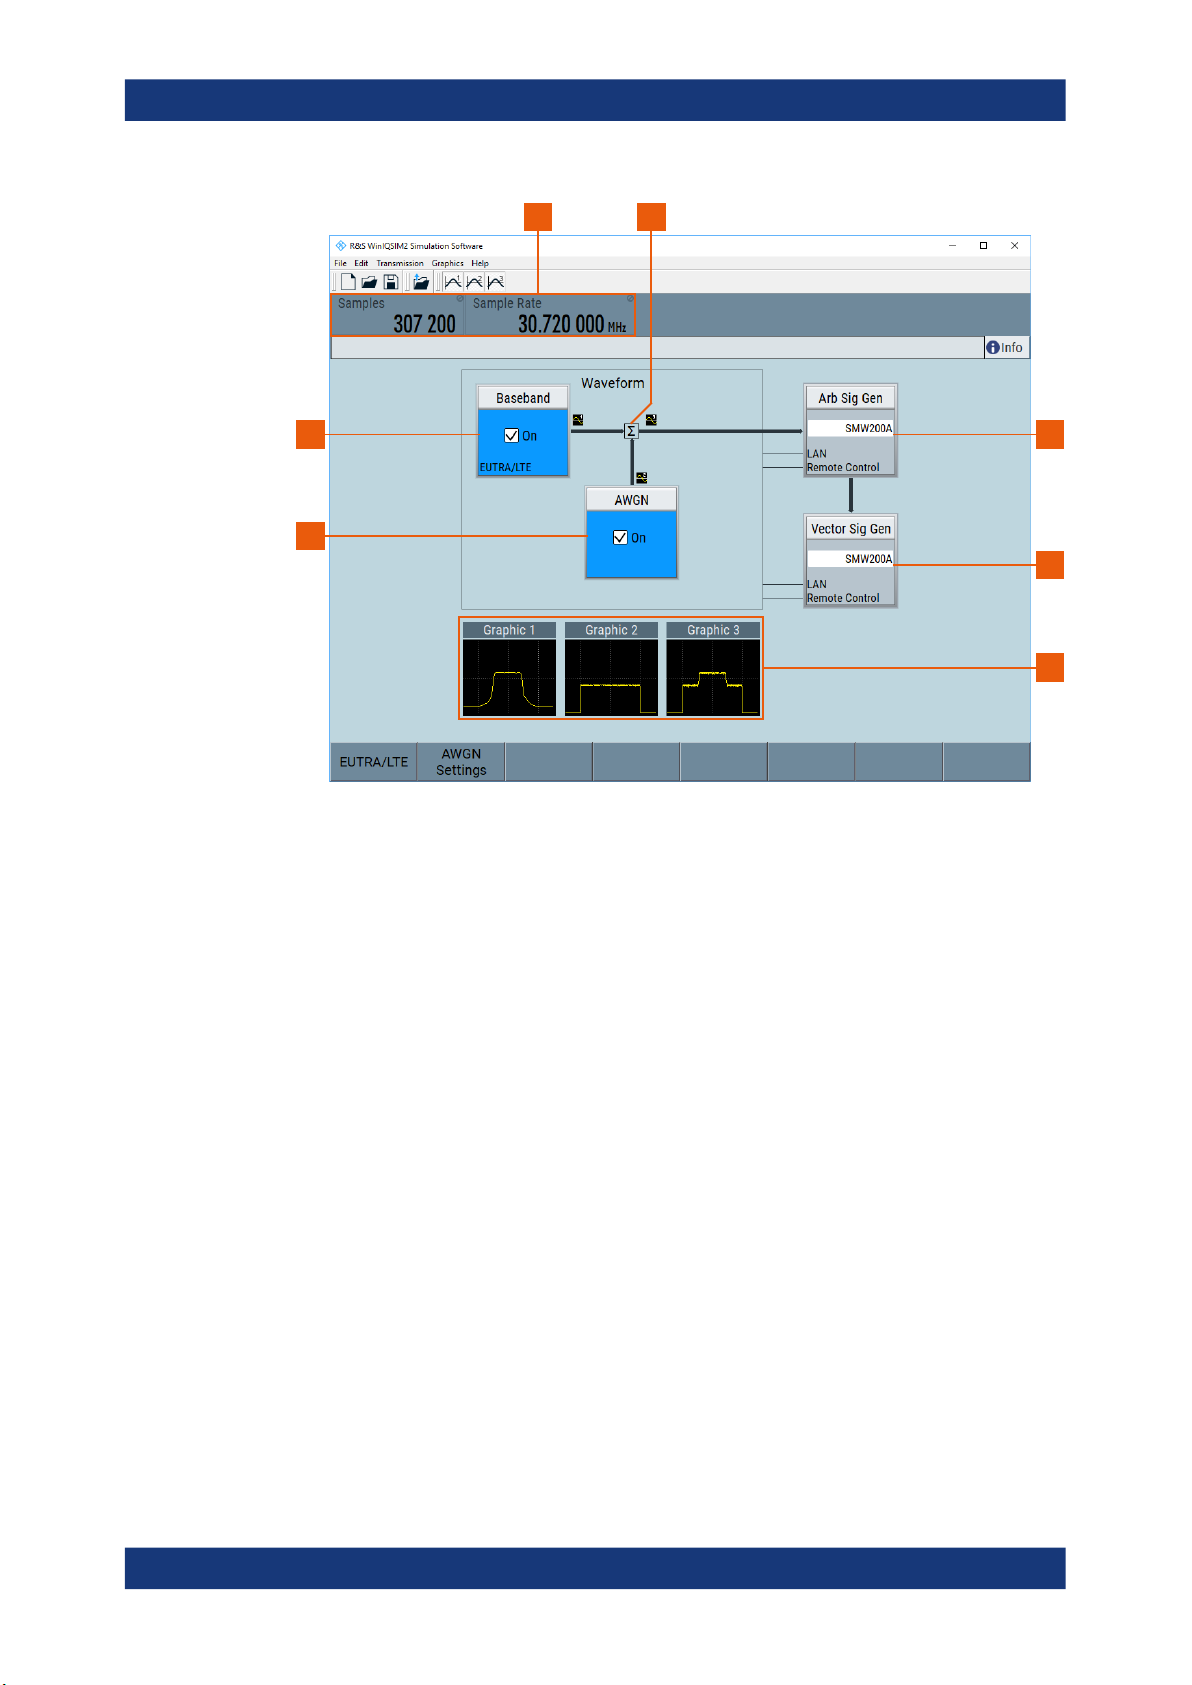
Figure 1-1: R&S WinIQSIM2 application window with signal flow
1 = noise signal
2 = digital waveform signal
3 = main parameters of the waveform signal
4 = superimposed signal
5 = connected arbitrary waveform signal generator
6 = connected vector signal generator
7 = graphical display of the digital waveform, noise and superimposed signals
5
6
7
The application window displays the signal generation in a block diagram. It indicates
the current state of the functional blocks and allows you to display the current signal
configuration graphically. The signal flow follows the logical left-to-right direction. The
status bar above the block diagram shows the main characteristics of the signal. Thus
you can see the status of signal configuration and active interfering components at a
glance.
Comprehensive graphic display modes in time and frequency domain allow simulation
and analysis of characteristics of digital communication systems. You can display for
example i(t) and q(t), vector diagrams or spectrums.
You can configure the signal directly in the block diagram. R&S WinIQSIM2 offers intuitive and straight forward operation with a high degree of self-explanation due to the
logically structured signal flow, dialogs and menus.
Related descriptions
The embedded context-sensitive help systems provide the help content related to the
element you are currently interacting with. The table of contents, the index and the find
9User Manual 1177.5533.02 ─ 07

R&S®WinIQSIM2
TM
Welcome to the Simulation Software R&S WinIQSIM2
functions supports you in finding the information if you are using the documentation in
pdf format or printable form. In particular in printed documents, you can find it helpful to
use this section and get familiar with the structure of this description.
The description follows the procedure as you likely configure a new signal generation
task. It starts with configuring the baseband source, describes how you can assign a
noise or interferer signal and validate the signal with the graphics display. Setting up an
instrument and transmitting the waveform file to the destination instrument complete
the process description.
Finally, the description deals with general functions of R&S WinIQSIM2, information
about remote control, like network connection and remote control commands, as well
as error messages and troubleshooting.
1.1 Key Features
Outstanding features of R&S WinIQSIM2 are:
●
Generation of all important digital communication standard signals
●
Generation of custom digital signals, like single, multi-carrier CW or multi-segment
waveforms
●
Generation of noise signals with selectable bandwidth
●
Importing I/Q samples for additional filtering or superimposing
●
Comprehensive graphic display modes
●
Intuitive operation via the block diagram
●
Signal transmission to instruments via GPIB, USB, LAN, or file transfer via USB
stick
●
Direct control of instruments via LAN (remote desktop)
Related Rohde
& Schwarz Instruments
For a detailed specification, refer to the data sheet.
1.2 Related Rohde & Schwarz Instruments
Waveform signals computed by R&S WinIQSIM2 can be loaded onto and processed
by Rohde & Schwarz instruments as listed below. These instruments are equipped with
an ARB generator or provide a waveform memory playback.
Generation of waveforms for ARB generators
●
R&S SMW
●
R&S SMM
●
R&S SMBVB
●
R&S SMCVB
●
R&S SGT
●
R&S SMBV
10User Manual 1177.5533.02 ─ 07

R&S®WinIQSIM2
TM
●
R&S SMU
●
R&S SMJ
●
R&S AMU
●
R&S AFQ
●
R&S EX-IQ-BOX (waveform generation without data transfer)
●
R&S BTC
●
R&S SFU
●
R&S CMW (R&S CMW100 and R&S CMW500)
Control of vector signal generators
The following vector signal generators can be used for generation of radio frequency
(RF) signals. Moreover, these vector signal generators can be controlled by
R&S WinIQSIM2:
●
R&S SMW
●
R&S SMM
●
R&S SMBVB
●
R&S SMCVB
●
R&S SGT
●
R&S SMBV
●
R&S SMU
●
R&S SMJ
Welcome to the Simulation Software R&S WinIQSIM2
Documentation Overview
1.3 Documentation Overview
This section provides an overview of the R&S WinIQSIM2 user documentation. Unless
specified otherwise, you find the documents on the R&S WinIQSIM2 product page at:
www.rohde-schwarz.com/manual/winiqsim2
1.3.1 Quick Start Guide Manual
Introduces the R&S WinIQSIM2 and describes how to set up and start working with the
product. Includes basic operations, typical measurement examples, and general information, e.g. safety instructions, etc. A printed version is delivered with the instrument.
1.3.2 Operating Manual and Help
Separate manuals for the base unit and the software options are provided for download:
●
Base unit manual
Contains the description of all instrument modes and functions. It also provides an
introduction to remote control, a complete description of the remote control com-
11User Manual 1177.5533.02 ─ 07

R&S®WinIQSIM2
1.3.3 Service Manual
TM
mands with programming examples, and information on maintenance, instrument
interfaces and error messages. Includes the contents of the getting started manual.
●
Software option manual
Contains the description of the specific functions of an option. Basic information on
operating the R&S WinIQSIM2 is not included.
The contents of the user manuals are available as help in the R&S WinIQSIM2. The
help offers quick, context-sensitive access to the complete information for the base unit
and the software options.
All user manuals are also available for download or for immediate display on the Internet.
Describes the performance test for checking the rated specifications, module replacement and repair, firmware update, troubleshooting and fault elimination, and contains
mechanical drawings and spare part lists.
Welcome to the Simulation Software R&S WinIQSIM2
Documentation Overview
The service manual is available for registered users on the global Rohde & Schwarz
information system (GLORIS, https://gloris.rohde-schwarz.com).
1.3.4 Instrument Security Procedures
Deals with security issues when working with the R&S WinIQSIM2 in secure areas. It is
available for download on the Internet.
1.3.5 Basic Safety Instructions
Contains safety instructions, operating conditions and further important information.
The printed document is delivered with the instrument.
1.3.6 Data Sheets and Brochures
The data sheet contains the technical specifications of the R&S WinIQSIM2. It also
lists the options and their order numbers and optional accessories.
The brochure provides an overview of the instrument and deals with the specific characteristics.
See www.rohde-schwarz.com/brochure-datasheet/winiqsim2
1.3.7 Release Notes and Open Source Acknowledgment (OSA)
The release notes list new features, improvements and known issues of the current
software version, and describe the software installation.
12User Manual 1177.5533.02 ─ 07

R&S®WinIQSIM2
1.3.8 Application Notes, Application Cards, White Papers, etc.
1.4 Typographical Conventions
TM
Welcome to the Simulation Software R&S WinIQSIM2
Notes on Screenshots
The open source acknowledgment document provides verbatim license texts of the
used open source software.
See www.rohde-schwarz.com/software/winiqsim2
These documents deal with special applications or background information on particular topics.
See www.rohde-schwarz.com/application/winiqsim2.
The following text markers are used throughout this documentation:
Convention Description
"Graphical user interface elements"
[Keys] Key and knob names are enclosed by square brackets.
Filenames, commands,
program code
Input Input to be entered by the user is displayed in italics.
Links Links that you can click are displayed in blue font.
"References" References to other parts of the documentation are enclosed by quota-
All names of graphical user interface elements on the screen, such as
dialog boxes, menus, options, buttons, and softkeys are enclosed by
quotation marks.
Filenames, commands, coding samples and screen output are distinguished by their font.
tion marks.
1.5 Notes on Screenshots
When describing the functions of the product, we use sample screenshots. These
screenshots are meant to illustrate as many as possible of the provided functions and
possible interdependencies between parameters. The shown values may not represent
realistic usage scenarios.
The screenshots usually show a fully equipped product, that is: with all options installed. Thus, some functions shown in the screenshots may not be available in your particular product configuration.
13User Manual 1177.5533.02 ─ 07

R&S®WinIQSIM2
2 Getting Started
2.1 Installing the R&S WinIQSIM2 Software
TM
Getting Started
Installing the R&S WinIQSIM2 Software
This section describes the basic steps to be taken when starting up R&S WinIQSIM2
the first time.
● Installing the R&S WinIQSIM2 Software.................................................................14
● Starting R&S WinIQSIM2........................................................................................16
● Trying Out R&S WinIQSIM2....................................................................................17
● Overview of R&S WinIQSIM2................................................................................. 32
● Controlling R&S WinIQSIM2................................................................................... 34
● Getting Information and Help.................................................................................. 42
R&S WinIQSIM2 is a stand-alone, PC-based application that creates waveform files of
digitally modulated signals.
You find the up-to-date version of R&S WinIQSIM2 and the corresponding release
notes describing the improvements and modifications on the product homepage "http://
www.rohde-schwarz.com/product/WinIQSIM2.html > Download > Software".
Software and hardware requirements
To install and run R&S WinIQSIM2, the following hardware and software requirements
have to be met:
Table 2-1: Software requirements
Operating system
System type
VISA runtime
library
Options Remarks
Microsoft® Windows 10, version
1607 "Anniversary Edition" and later
●
64-bit operating system
●
x64-based or x86-based processor
●
R&S VISA, IO libraries for
instrument control
●
National Instruments VISA 4.0.
or higher (optional)
●
other VISA runtime library
Any other versions or operating systems are
not supported. The installation process checks
the operating system and aborts the installation if your PC is not compatible.
You can only run the latest WinIQSIM2 software on a 64-bit operating system. 64-bit
installation files have the extension "x64":
WinIQSIM2_v.vv.vvv.vv.x64.exe
VISA driver is bundled with a GPIB (IEC/
IEEE)-bus card from National Instruments (NI)
or Agilent. If none of these cards are used,
there is the option to perform data transmission via TCP/IP connection over LAN.
Drivers can be obtained from R&S or NI
directly.
14User Manual 1177.5533.02 ─ 07
R&S®WinIQSIM2
TM
Getting Started
Installing the R&S
Table 2-2: Hardware requirements
AMD / Intel CPU 1 GHz 2 GHz
RAM 1 GB
Display resolution 1024 x 800 pixels ≥ 1024 x 800 pixels
GPIB (IEC/IEEE)bus card
Free HD space 600 MB 2 GB
Minimum requirements Recommended hardware
2 GB
Note: The installation process
checks the RAM size and aborts the
installation if the minimum memory
size is not given.
●
National Instruments
●
Agilent
optional
WinIQSIM2 Software
To install the software
To install the software, perform the following:
●
Administrator rights are required to install and run the program.
●
It is recommended that you uninstall any previous version of R&S WinIQSIM2
before installing the new version (see To uninstall a previous software version).
1. In the windows explorer, execute WinIQSIM2_v.vv.vvv.vv.x64.exe.
<v.vv.vvv.vv.x64> stands for the current version of the 64-bit software as in
Table 2-1.
2. Follow the instructions of the installation wizard.
The setup file installs all software components R&S WinIQSIM2 requires for operation.
Table 2-3: Default file location (software installation for all users)
File type File location File name
User settings and data
(waveforms, save/recall,
etc.)
Program data
%APPDATA%\Rohde-Schwarz\winiqsim2
%PROGRAMFILES(X86)%\Rohde-Schwarz\
WinIQSIM2\xx.x
*.wv, *.savrcl, etc.
WinIQSIM2_Start.cmd
To uninstall a previous software version
To uninstall a previous version, perform the following:
1. In the taskbar, select the "Windows Start" button.
2. Select "Settings > Control Panel > Programs > Programs and Features".
3. In the list of programs, select "R&S WinIQSIM2_v.vv.vvv.vv.x64".
15User Manual 1177.5533.02 ─ 07

R&S®WinIQSIM2
TM
Getting Started
4. Remove the program with "Uninstall/Change > Uninstall".
The script file identifies and removes any currently installed items of R&S WinIQSIM2.
2.2 Starting R&S WinIQSIM2
To access R&S WinIQSIM2 easily, create a shortcut to the *.exe file and place it on
the desktop of your computer.
Access:
1. On your computer, perform one of the following:
a) Select "Start > All Programs > R&S WinIQSIM2 > R&S WinIQSIM2 v.vv.vvv.vv"
b) Double-click the shortcut icon on the desktop.
After starting up, the main application window appears.
Starting R&S
WinIQSIM2
Figure 2-1: R&S WinIQSIM2 main application window in initial state
2.
Select "File > New" (or the icon alternatively) to start from an initial state.
16User Manual 1177.5533.02 ─ 07

R&S®WinIQSIM2
TM
Getting Started
2.3 Trying Out R&S WinIQSIM2
The following is an example on how to use R&S WinIQSIM2 to generate a single carrier waveform with AWGN and load it in the ARB of an R&S SMW200A .
The workflow includes the following steps:
● Configuring the Instrument......................................................................................17
● Selecting the Instrument......................................................................................... 19
● Generating a Waveform Signal...............................................................................19
● Adding Noise to the Waveform Signal.................................................................... 22
● Visualizing the Waveform Signal.............................................................................23
● Transmitting the Waveform to the R&S SMW200A.................................................30
● Transmitting the Waveform to a File....................................................................... 31
2.3.1 Configuring the Instrument
Before you can transmit a signal to a signal generator, you must configure the destination instrument and the connection between the PC with instrument and R&S WinIQSIM2.
Trying Out R&S
WinIQSIM2
R&S WinIQSIM2 allows you to scan the LAN, GPIB, or USB interfaces for connected
instruments ("Arb Sig Gen or Vector Sig Gen"). Detected instruments are automatically
assigned to the list of "Available Instruments", including the associated information on
the connection.
Alternatively, you can create and configure an instrument manually, as described in "To
add an instrument manually" on page 190.
The general instrument settings affect various functions, e.g. the maximum size of the
waveform file. We recommend that you configure a detected instrument first before
creating the waveform file.
To scan for instruments
1. Connect the instrument to the LAN, e.g. an R&S SMW200A with option R&S SMWB10.
2. Switch on the instrument.
3. In the menu bar of R&S WinIQSIM2, select "File > New" to start the software from
an initial state.
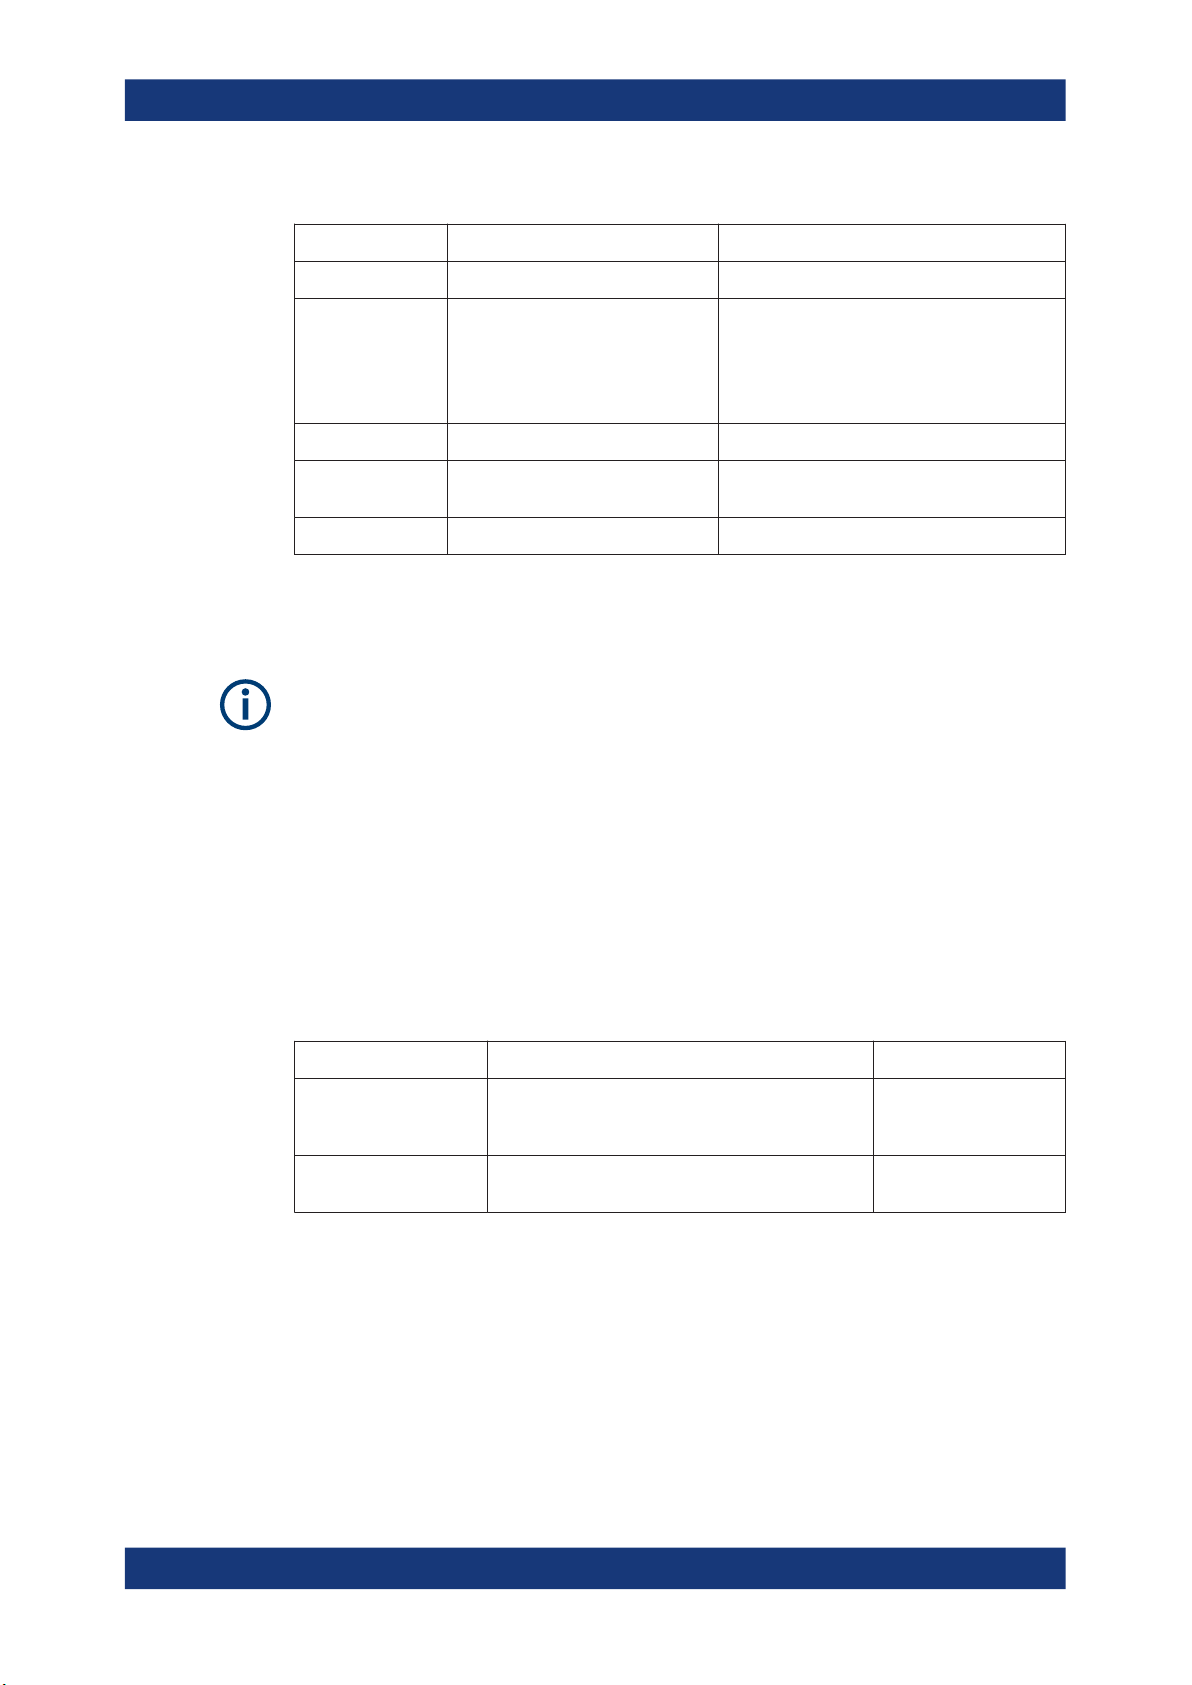
4. In the block diagram, select "Arb Sig Gen > Instruments".
The "Configure Instruments" dialog opens allowing you to perform the following:
● Search for instruments in a network
● Search for instruments in a dedicated subnet of the network
● Search for instruments with USB/GPIB connection to a PC with R&S WinIQ-
SIM2 installed
● Configure detected instruments
17User Manual 1177.5533.02 ─ 07
R&S®WinIQSIM2
TM
Getting Started
Trying Out R&S
WinIQSIM2
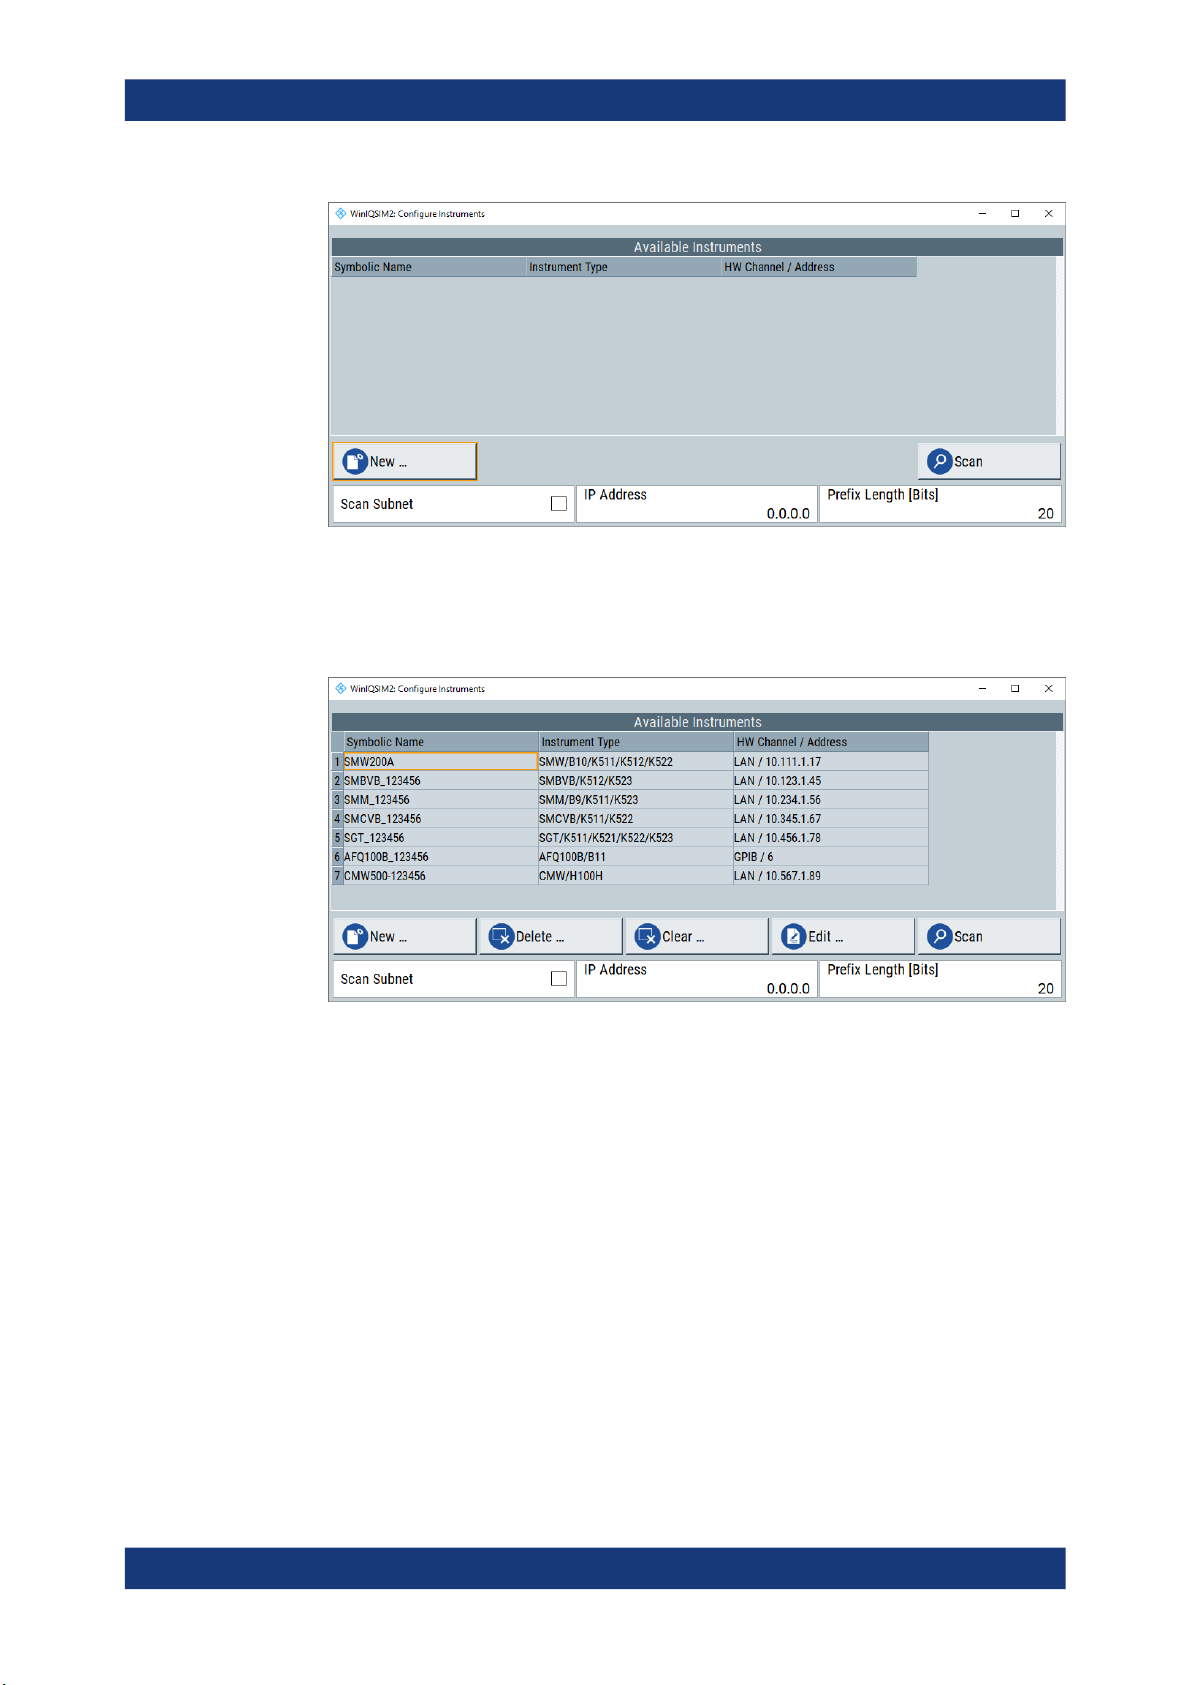
5. Select "Scan" to search for instruments.
All instruments found in the network and instruments connected via the GPIB or
USB interfaces are displayed in the list of "Available Instruments". R&S WinIQSIM2
retrieves all information on connection to the instrument automatically.
Note: R&S WinIQSIM2 does not clear the list of "Available Instruments" before a
scan. Any instruments found during a scan are added to the list.
6. If you found your R&S SMW200A in the list, close the dialog.
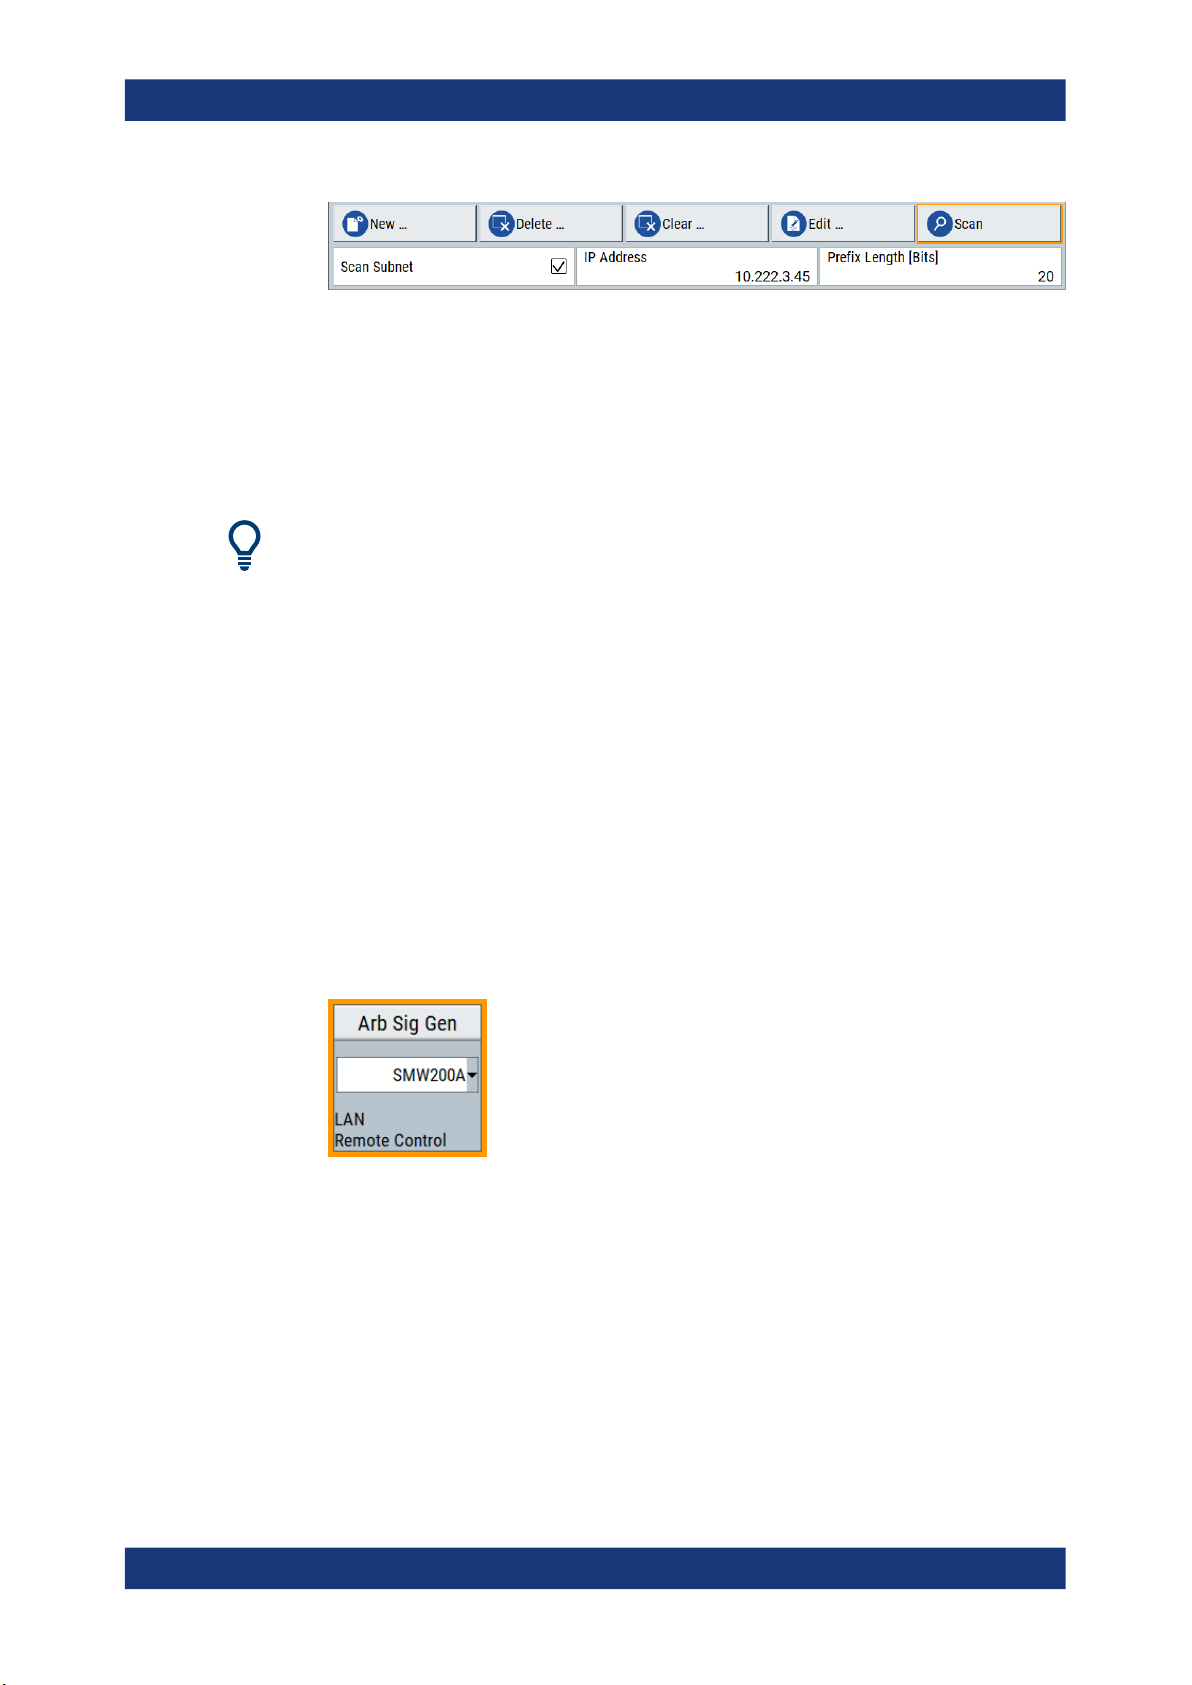
To scan a subnet of the network
To accelerate the scan of the network you can specify subnet parameters and an IP
address of an instrument, that you know of.
1. Open the "Configure Instruments" dialog as described in "To scan for instruments"
on page 17.
2. Select "Scan Subnet > On".
3. Set the IP address of an instrument within the subnet, e.g. "10.222.3.45".
4. Set the prefix length of the subnet, e.g. "20" bits.
5. Select "Scan".
18User Manual 1177.5533.02 ─ 07
R&S®WinIQSIM2
TM
Getting Started
Trying Out R&S
The scan procedure searches for instruments within the subnet, to which the IP
address "10.222.3.45" belongs
To modify the configuration of detected instruments
You can configure search results of the list and modify the configuration of detected
instruments, see Chapter 6.2, "Configure Instruments Settings", on page 182.
Troubleshooting non-detected instruments after scan
If the instrument you want to work with is not listed, check if the following prerequisites
are fulfilled, and scan for the instrument again:
●
Is the instrument switched on?
●
Is the instrument accessible via LAN, GPIB, or USB?
●
Is the firewall of the instruments' operating system deactivated?
WinIQSIM2
2.3.2 Selecting the Instrument
Before you can create a waveform, you must select and configure any instrument in
advance (see also Chapter 2.3.1, "Configuring the Instrument", on page 17).
For the calculation, it is not imperative that a real instrument is connected. You can
also create a waveform based on a manually configured instrument (offline).
► In the instrument selection list of the "Arb SigGen" block, select e.g. "SMW200A".
The R&S SMW200A is selected as the ARB signal generator used to create the
waveform signal.
2.3.3 Generating a Waveform Signal
The example task is to configure a digital signal in accordance with the EUTRA/LTE
standard. It introduces the way to access the settings and the configuration principle
common for digital standards, and the R&S WinIQSIM2 software.
19User Manual 1177.5533.02 ─ 07

R&S®WinIQSIM2
TM
Getting Started
Trying Out R&S
WinIQSIM2
We use one of the provided EUTRA test models (E-TM), to show how to configure and
generate a test signal.
1. In the menu bar, select "File > new" to start from an initial state.
R&S WinIQSIM2 sets all settings to default, except selected instruments in the
"ARB Sig Gen" and "Vector Sig Gen" blocks.
2. In the block diagram, select "Baseband > EUTRA/LTE".
The "EUTRA/LTE" settings dialog contains the parameters to configure the waveform signal.
3. In the "General" tab, select "Link Direction > Downlink (OFDMA)".
4. Select "Test Models > E-TM1_1__10MHz".
20User Manual 1177.5533.02 ─ 07

R&S®WinIQSIM2
TM
Getting Started
Trying Out R&S
WinIQSIM2
5. Confirm with "Select".
The "Test Models" is a function for quick selection and settings adjustment according to one of the various EUTRA test models (E-TM). A standard "File Select" function enables you to select form files with predefined settings.
The dialog closes automatically and the user interface confirms the name of the
selected file.
6. Select "General DL Settings" to have a look at the channel bandwidth and the
occupied bandwidth of the selected signal.
Figure 2-2: Test model E-TM1_1_10MHz bandwidth parameters
1 = "Channel Bandwidth > 10 MHz"
2 = "Occupied Bandwidth > 9.015 MHz"
The selected test model operates with a channel bandwidth of 10 MHz. The signal
occupies 9.015 MHz.
1
2
7. Close the "General DL Settings" dialog.
21User Manual 1177.5533.02 ─ 07

R&S®WinIQSIM2
TM
Getting Started
Trying Out R&S
WinIQSIM2
8. In the "General" tab, select "State > On".
R&S WinIQSIM2 calculates the EUTRA/LTE test signal with the selected channel
bandwidth. It displays the characteristic signal parameters, i.e. the number of
"Samples" and the used "Sample Rate" in the status bar of the main window.
2.3.4 Adding Noise to the Waveform Signal
In R&S WinIQSIM2, you can also superimpose the waveform with noise.
In the example, we generate an average white Gaussian noise (AWGN) signal that is
to be superimposed with the interference-free LTE signal. The minimum noise to system bandwidth ratio is two.
1. In the block diagram, select "AWGN".
The "AWGN Settings" dialog contains the parameters for configuring additive white
Gaussian noise, noise level or CW interfering.
2. In the "General" tab, select "Mode > Additive Noise".
3. Set "System Bandwidth > 10 MHz".
4. Enter "Min. Noise/System Bandwidth Ratio > 2".
5. In the "Noise Power / Output Results" tab, enter "Bit Rate > 270.833333 kbps".
22User Manual 1177.5533.02 ─ 07

R&S®WinIQSIM2
TM
Getting Started
6. Enter "Carrier/Noise Ratio > 30 dB".
7. In the "General" tab, select state "On".
R&S WinIQSIM2 generates the noise signal.
2.3.5 Visualizing the Waveform Signal
Trying Out R&S
WinIQSIM2
It is often useful to verify a generated waveform before storing or transmission. This
example shows you how to configure the display function of the R&S WinIQSIM2, and
how to view the signals in particular, both the baseband and the AWGN, and the superimposed signal. The example uses the waveform generated as described in Chap-
ter 2.3.3, "Generating a Waveform Signal", on page 19, and the AWGN signal of Chap-
ter 2.3.4, "Adding Noise to the Waveform Signal", on page 22.
The graphics panel is an important tool for checking the signal configuration. In this
panel, you can display the generated I/Q signal as I/Q diagram, and derived representations thereof like the vector diagram or the signal spectrum. For more information,
see Chapter 5, "Displaying Simulated Waveforms Graphically", on page 155.
To display the baseband waveform signal
1. In the menu bar of the main window, select "Graphics > Graphic 1 > Graphic 1
(Preview Only)".
R&S WinIQSIM2 indicates the graphics preview in the block diagram.
A small icon assigned directly to the signal line indicates the shown waveform.
To access the graphic settings, perform one of the following:
a) Double-click the small graphics display.
23User Manual 1177.5533.02 ─ 07
R&S®WinIQSIM2
TM
Getting Started
Trying Out R&S
WinIQSIM2
b) In the menu bar, select "Graphics > Graphic 1 > Graphic 1 (Complete)".
The "Graphic 1" settings dialog opens displaying "Viewport" and "Options:" settings
to configure the operating range of the waveform and specify the signal that you
want to monitor.
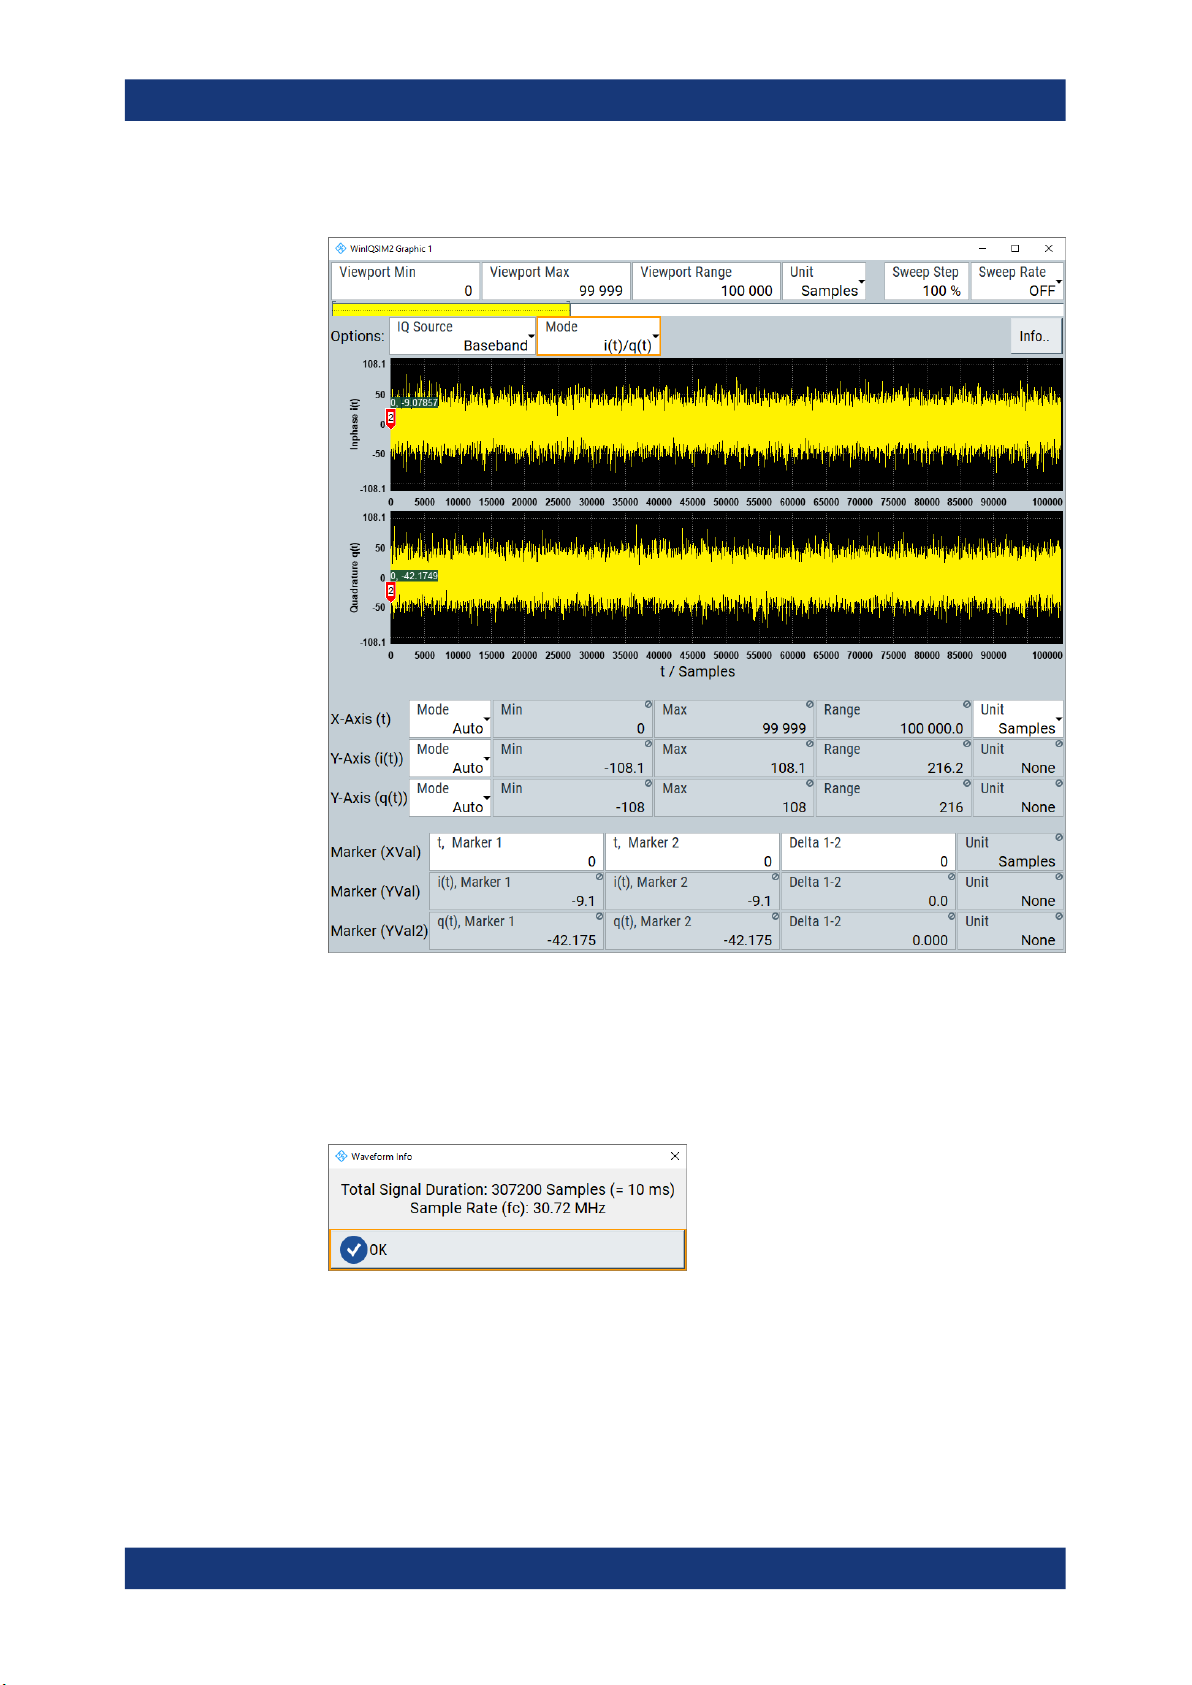
2. To configure the waveform operating range, specify the "Viewport" parameters.
3. To check signal duration and sample rate, click the "Info.." button.
4. To configure the I/Q parameters, try out the following:
a) Select "IQ Source > Baseband".
b) Select "Mode > FFT Magnitude".
24User Manual 1177.5533.02 ─ 07
R&S®WinIQSIM2
TM
Getting Started
Trying Out R&S
WinIQSIM2
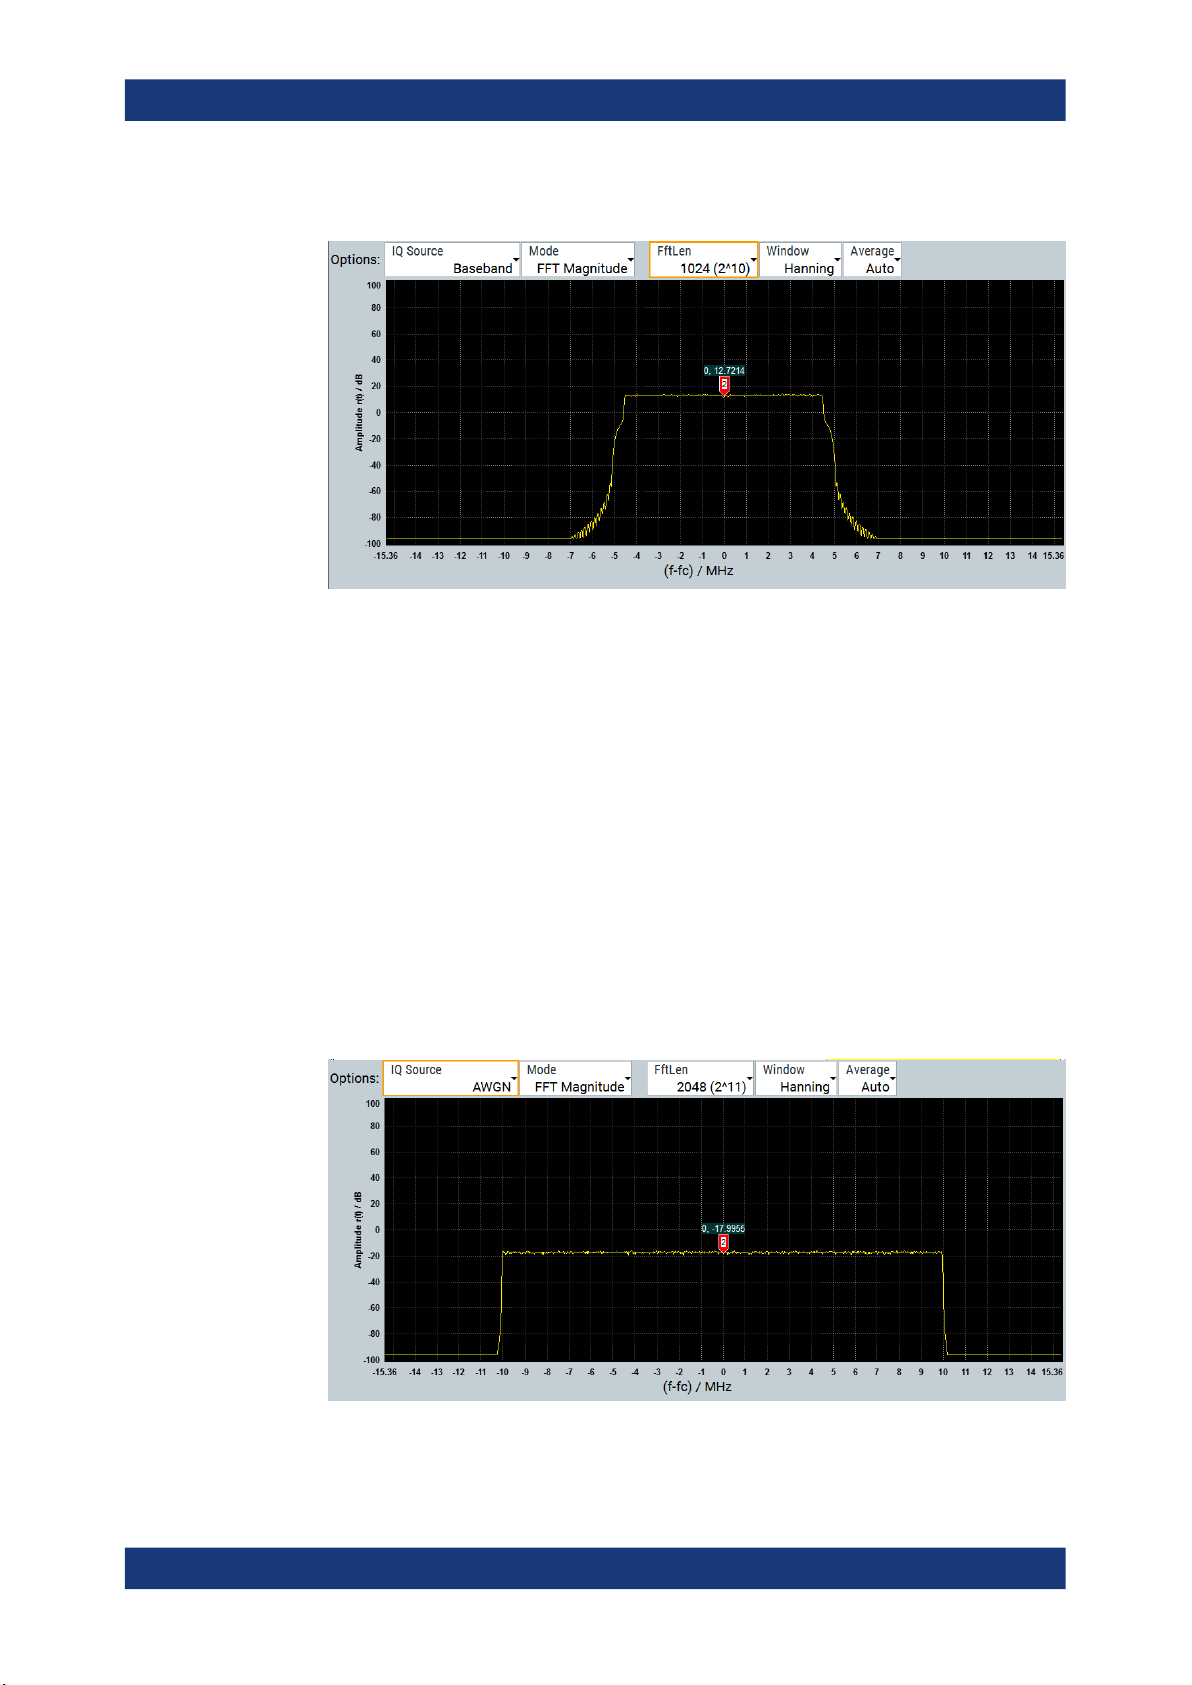
c) Select "FftLen > 2048 (2^11)".
The power spectrum displays the frequency versus the amplitude of the baseband
signal of the waveform.
For related settings, see Chapter 5, "Displaying Simulated Waveforms Graphically",
on page 155.
To display the AWGN signal
In this example, we use the second graphic function to display the AWGN signal. Perform the following steps:
1. In the menu bar of the main window, select "Graphics > Graphic 2 > Graphic 2
(Complete)".
2. In the "Graphic" dialog, select "IQ Source > AWGN".
3. Select "Mode > FFT Magnitude".
4. Select "Len > 2048 (2^11)".
The power spectrum displays the generated additive white gaussian noise signal.
25User Manual 1177.5533.02 ─ 07
R&S®WinIQSIM2
TM
Getting Started
Trying Out R&S
WinIQSIM2
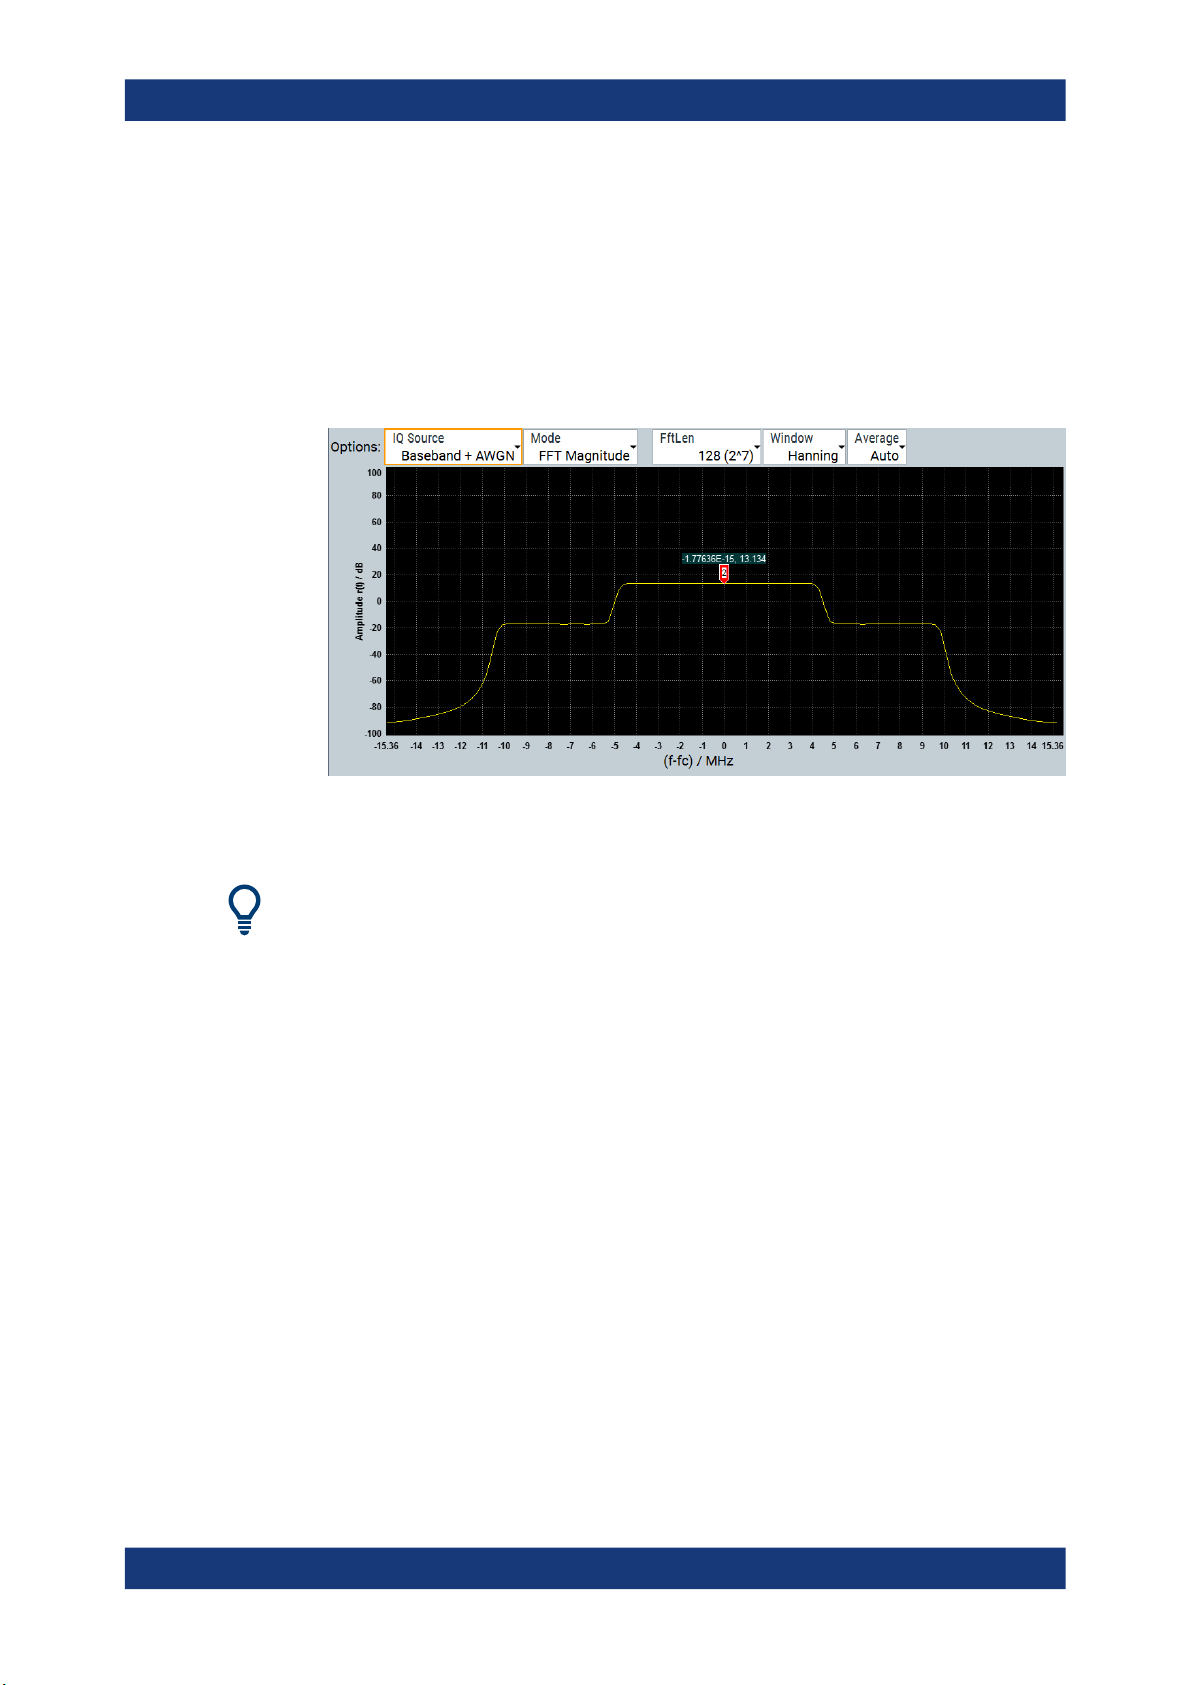
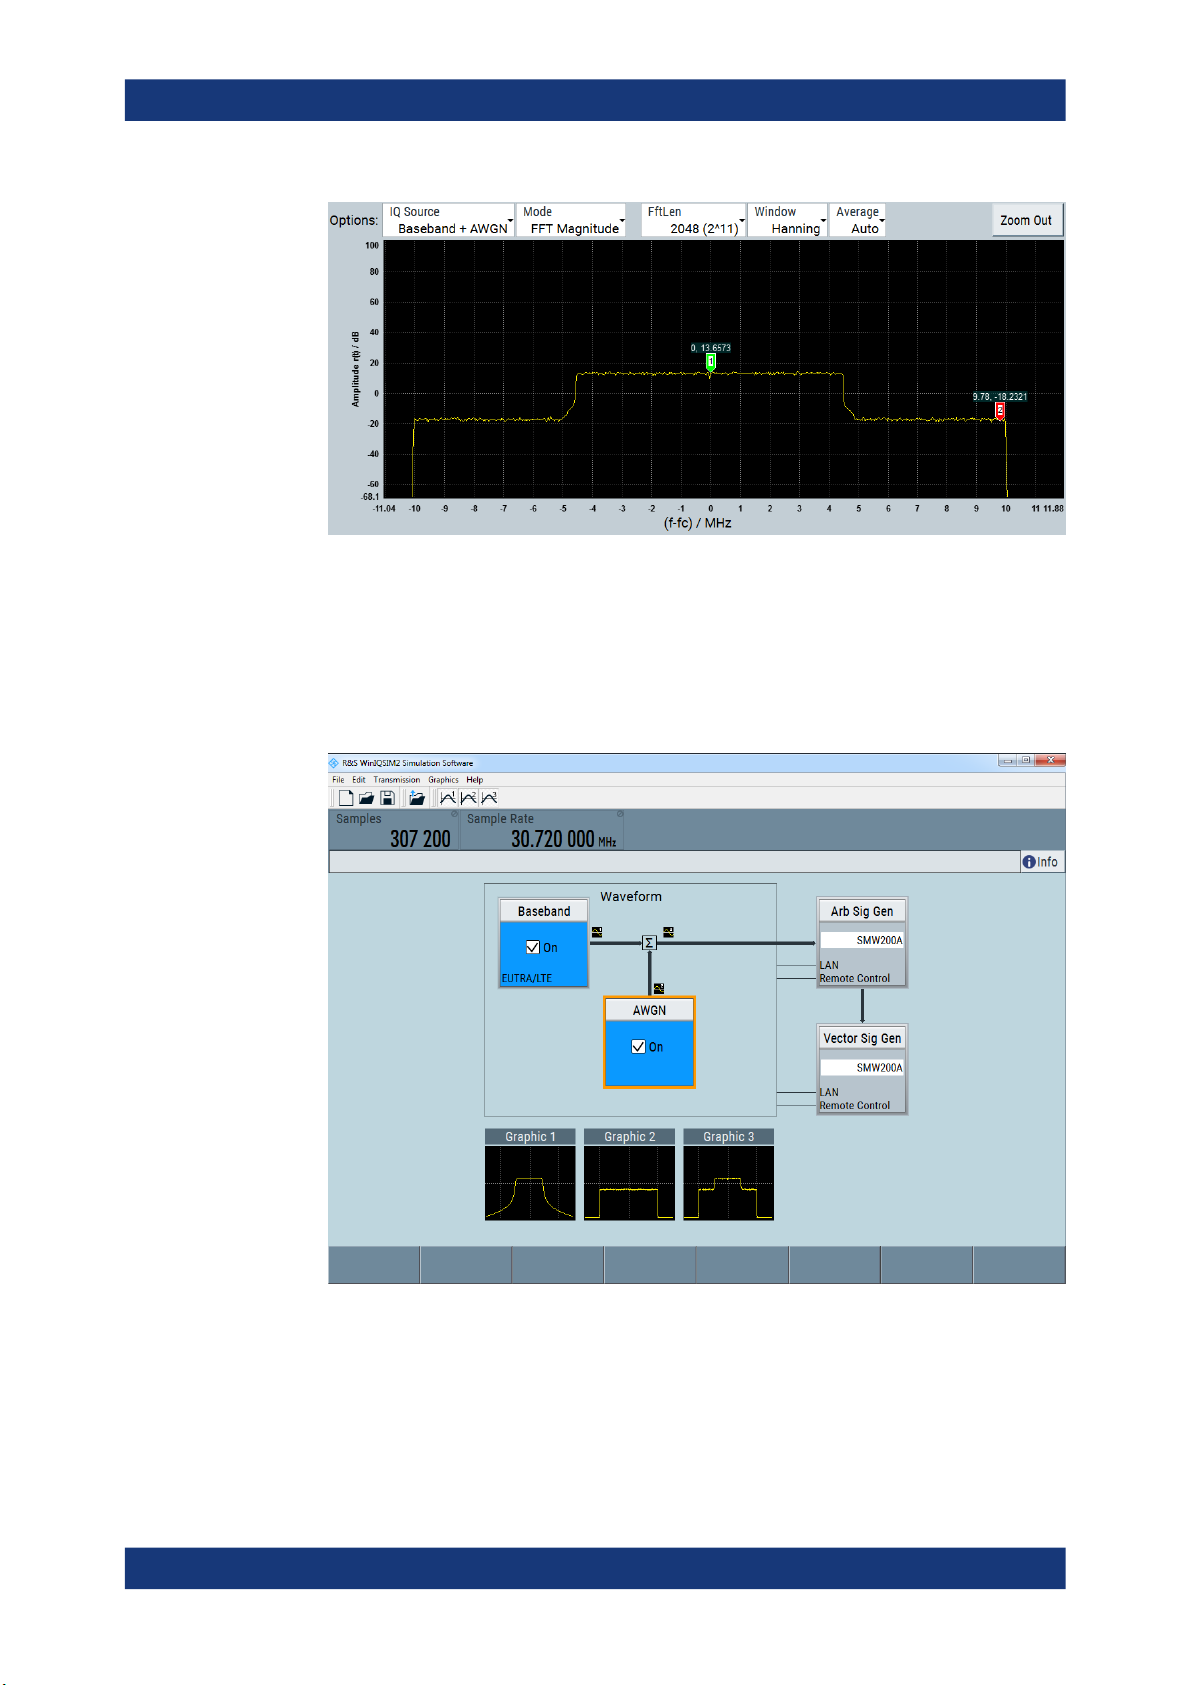
To display the baseband signal superimposed with AWGN
1. In the menu bar of the main window, select "Graphics > Graphic 3 > Graphic 3
(Complete)".
2. Select "IQ Source > Baseband + AWGN".
3. Select "Mode > FFT Magnitude".
4. Select "Len > 2048 (2^11)".
The power spectrum displays the waveform derived from the baseband signal
superimposed with the AWGN signal.
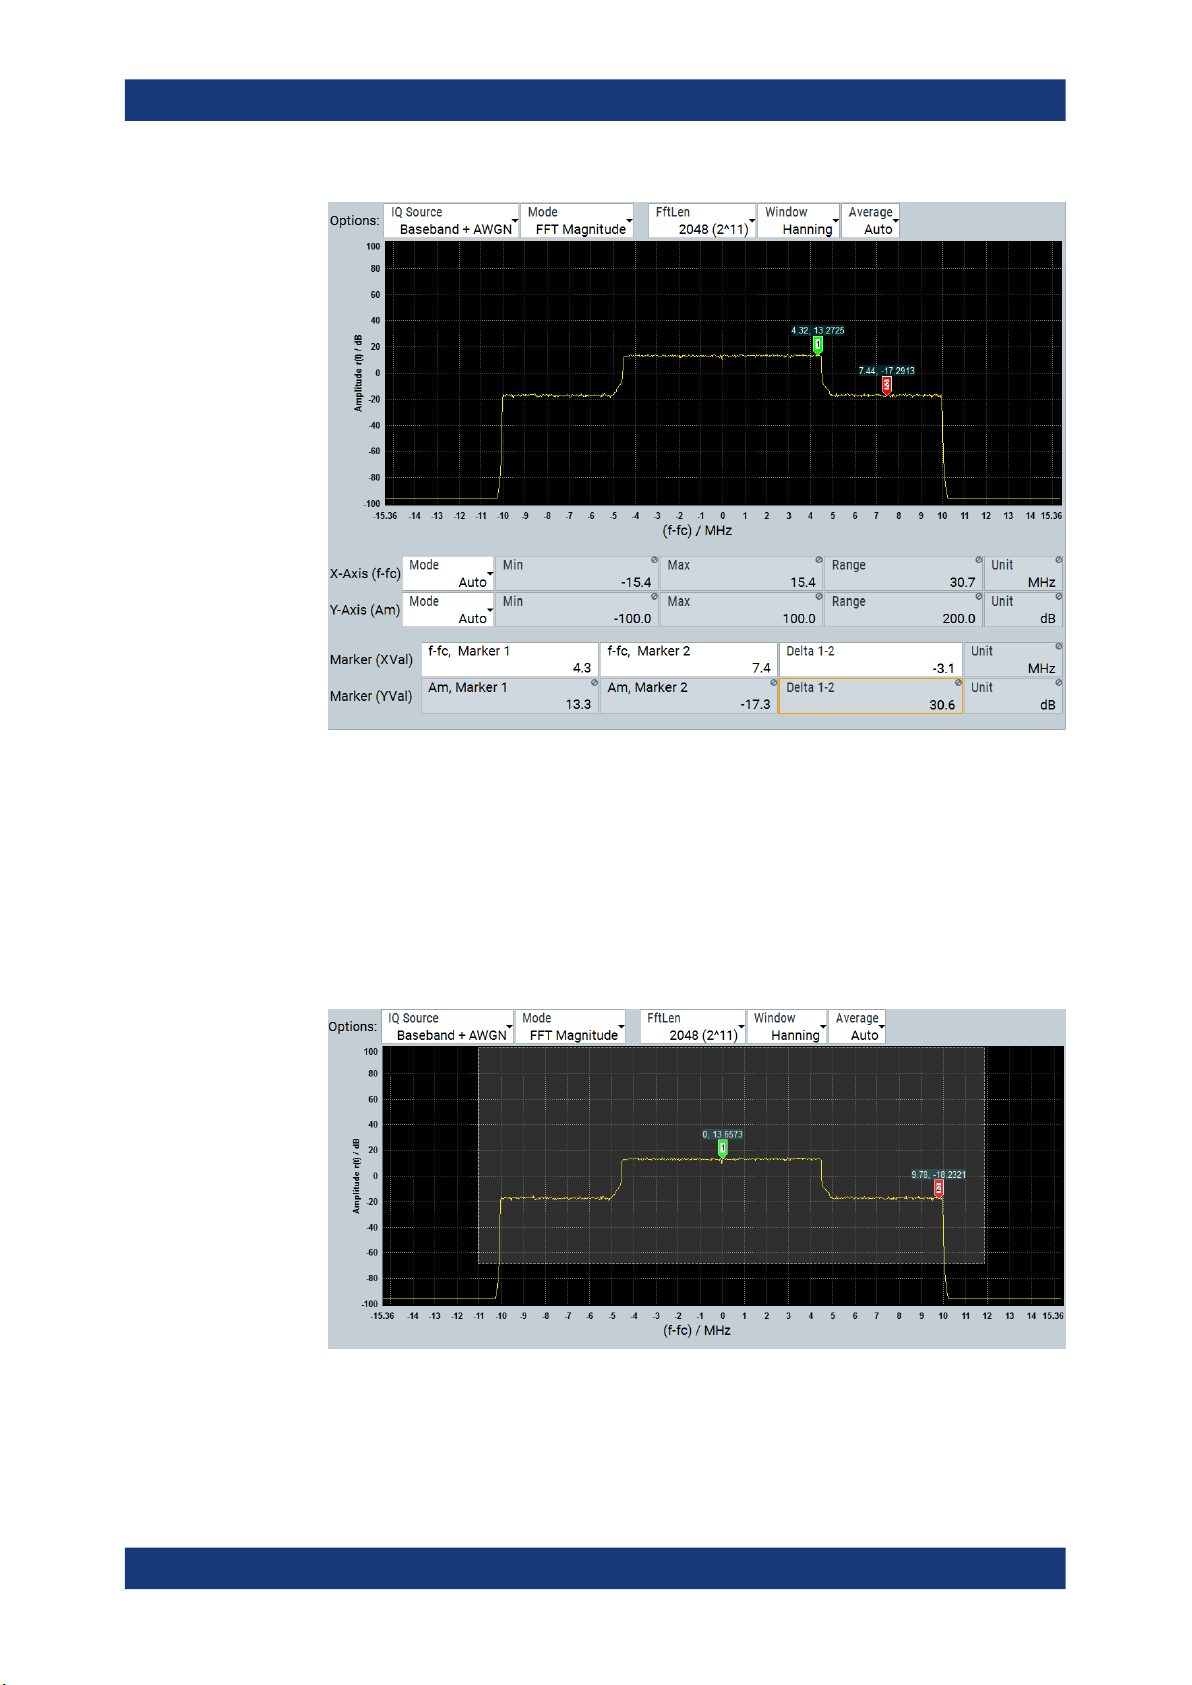
To retrieve more information, zoom in the spectrum and place the markers to the positions to measure the corresponding values (see To zoom a particular area of the wave-
form).
Using markers to analyze the signal
Using the markers you can determine particular readings of the signals, e.g. to verify
the settings directly in the graph. You can position the markers in the diagram to find
out the appropriate values.
In the following examples, we set the markers to determine the occupied bandwidth of
the baseband waveform, and the carrier/noise ratio.
To determine the occupied bandwidth of the baseband signal
1. Open the "Graphics 3" dialog.
2. In the diagram, drag the first marker to the left:
a) Left-click the first marker.
b) Keep the mouse key pressed.
R&S WinIQSIM2 denotes the current X-axis position by a colored line.
3. Drag and drop the marker to the start position of baseband signal (on-time).
26User Manual 1177.5533.02 ─ 07

R&S®WinIQSIM2
TM
Trying Out R&S WinIQSIM2
4. Accordingly, move the second marker to the end position.
Getting Started
You can see the current X and Y-axis positions of the markers in the diagram, or in
the "Marker" fields in the lower section of the dialog. The calculated "Delta 1-2" frequency value reflects the occupied bandwidth of the EUTRA/LTE signal approximately, see Generating a Waveform Signal, step 6.
To determine the carrier to noise ratio
1. Open the "Graphics 3" dialog.
2. In the diagram, left-click and hold the first marker.
3. Drag and drop "Marker 1" to the top level of the noise signal.
4. Accordingly, move the second marker to the top level of the baseband waveform
signal.
27User Manual 1177.5533.02 ─ 07
R&S®WinIQSIM2
TM
Getting Started
Trying Out R&S
WinIQSIM2
R&S WinIQSIM2 determines the carrier/noise ratio of approximately 30 dB based
on the markers amplitude values.
To zoom a particular area of the waveform
To retrieve more information, you can enlarge any section of the graph and thus visualize particular values of the signal in detail.
1. Left-click and hold the upper left corner of the section you want to zoom.
2. Draw the zoom rectangle.
A dotted rectangular frame denotes the marked area.
3. Release the mouse button.
28User Manual 1177.5533.02 ─ 07
R&S®WinIQSIM2
TM
Getting Started
Trying Out R&S
WinIQSIM2
R&S WinIQSIM2 enlarges the selected section. Now you can analyze the signal
trace in more detail visually.
4. To return to the initial size, select "Zoom Out".
To display the graphics in the main window
► Close all graphics dialogs.
R&S WinIQSIM2 shows the small graphics preview of all active diagrams. "Graphic
1" displays the baseband signal, in "Graphic 2" you can see the AWGN signal, and
in "Graphic 3" the baseband signal interfered with noise.
29User Manual 1177.5533.02 ─ 07
R&S®WinIQSIM2
TM
Getting Started
Trying Out R&S
2.3.6 Transmitting the Waveform to the R&S SMW200A
Transferring the waveform file to the signal generator, requires that the connection
between R&S WinIQSIM2 and the R&S SMW200A is established.
You can see the connection at a glance in the block diagram denoted by the two thin
control lines, see Chapter 2.5.1.4, "Block Diagram", on page 37.
If the lines are crossed, establish the connection as described in Chapter 2.3.1, "Con-
figuring the Instrument", on page 17 and Chapter 2.3.2, "Selecting the Instrument",
on page 19.
In addition, the following requirements must be met:
●
Enabled file transfer via LAN and the used interface protocol
●
Enabled write permission on the instrument's file system
For more information on security settings, see the user manual of the instrument.
To transmit the generated waveform to the R&S SMW200A
WinIQSIM2
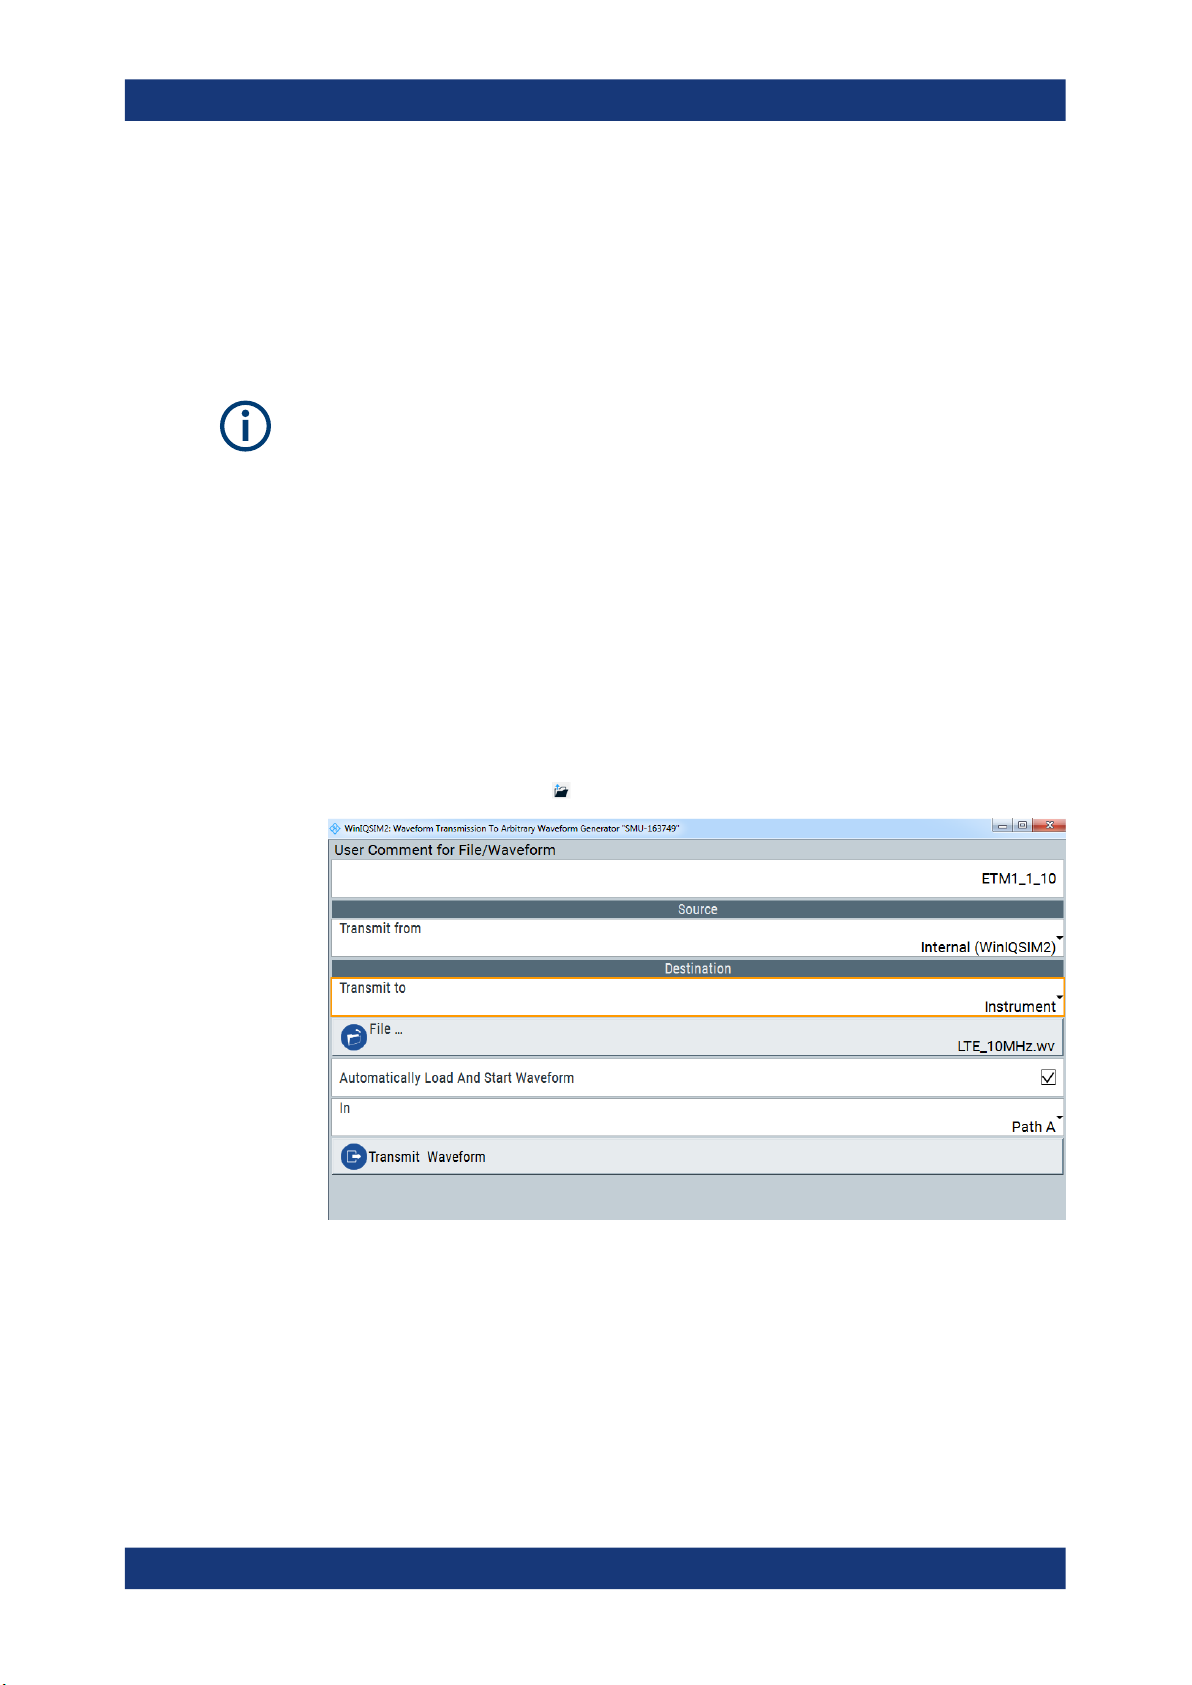
1. To configure the transmission, perform one of the following:
a) In the menu bar, select "Transmission > Transmit".
b)
In the tool bar, select .
The "Waveform Transmission To Arbitrary Signal Generator" dialog opens.
2. Select "Source > Internal (WinIQSIM2)"
R&S WinIQSIM2 selects the last generated waveform data automatically.
3. Select "Destination > Transmit To > Instrument".
4. Select "File" to determine the file name and directory for storing on the instrument.
a) Select/create the destination directory on the instrument.
b) Enter the "File Name".
30User Manual 1177.5533.02 ─ 07
 Loading...