

Rohde&Schwarz R&S®VSE-K91 WLAN Measurements User Manual
R&S®VSE-K91
WLAN Measurements Application
User Manual
(;ÚçØ2)
1176897402
Version 12

This manual applies to the following software, version 2.20 and later:
●
R&S®VSE Enterprise Edition base software (1345.1105.06)
●
R&S®VSE Basic Edition base software (1345.1011.06)
The following firmware options are described:
●
R&S VSE-K91 WLAN 802.11a,b,g (1320.7597.02) / R&S VSE-KT91 (1345.1840.02)
●
R&S VSE-K91ac WLAN 802.11ac (1320.7616.02) / R&S VSE-KT91ac (1345.1811.02)
●
R&S VSE-K91ax WLAN 802.11ax (1345.1411.02) / R&S VSE-KT91ax (1345.1805.02)
●
R&S VSE-K91be WLAN 802.11be (1345.1428.02) / R&S VSE-KT91be (1345.1986.02)
●
R&S VSE-K91n WLAN 802.11n (1320.7600.02) / R&S VSE-KT91n (1345.1828.02)
●
R&S VSE-K91p WLAN 802.11p (1320.7680.02) / R&S VSE-KT91p (1345.1692.02)
© 2022 Rohde & Schwarz GmbH & Co. KG
Muehldorfstr. 15, 81671 Muenchen, Germany
Phone: +49 89 41 29 - 0
Email: info@rohde-schwarz.com
Internet: www.rohde-schwarz.com
Subject to change – data without tolerance limits is not binding.
R&S® is a registered trademark of Rohde & Schwarz GmbH & Co. KG.
All other trademarks are the properties of their respective owners.
1176.8974.02 | Version 12 | R&S®VSE-K91
Throughout this manual, products from Rohde & Schwarz are indicated without the ® symbol, e.g. R&S®VSE is indicated as
R&S VSE.

R&S®VSE-K91
1.1 Starting the R&S VSE WLAN application....................................................................6
1.2 Understanding the display information...................................................................... 7
2.1 Modulation accuracy, flatness and tolerance parameters...................................... 10
2.2 Evaluation methods for WLAN IQ measurements................................................... 21
3.1 Signal processing for multicarrier measurements (IEEE 802.11a, g (OFDM), j, p)
3.2 Signal processing for single-carrier measurements (IEEE 802.11b, g (DSSS)).... 66
Contents
Contents
1 Welcome to the R&S VSE WLAN application...................................... 5
2 WLAN I/Q measurement (modulation accuracy, flatness and toler-
ance)......................................................................................................10
3 Measurement basics............................................................................59
...................................................................................................................................... 59
3.3 Signal processing for MIMO measurements (IEEE IEEE 802.11ac, ax, n, be)....... 72
3.4 Signal processing for high-efficiency wireless measurements (IEEE 802.11ax)..81
3.5 Signal processing for extremely high throughput (EHT) wireless measurements
(IEEE 802.11be)............................................................................................................86
3.6 Channels and carriers................................................................................................ 88
3.7 Recognized vs. analyzed PPDUs...............................................................................89
3.8 Demodulation parameters - logical filters................................................................ 89
3.9 Trigger basics..............................................................................................................91
4 WLAN I/Q measurement configuration.............................................. 96
4.1 Configuration overview.............................................................................................. 96
4.2 Signal description....................................................................................................... 98
4.3 Input and frontend settings........................................................................................99
4.4 Signal capture (data acquisition).............................................................................115
4.5 Synchronization and OFDM demodulation.............................................................126
4.6 Tracking and channel estimation............................................................................ 127
4.7 Demodulation............................................................................................................ 131
4.8 Evaluation range....................................................................................................... 162
4.9 Result configuration................................................................................................. 168
4.10 Automatic settings....................................................................................................170
5 Analysis.............................................................................................. 172
3User Manual 1176.8974.02 ─ 12

R&S®VSE-K91
6.1 How to determine modulation accuracy, flatness and tolerance parameters for
6.2 How to analyze WLAN signals in a MIMO measurement setup............................ 174
7.1 Optimizing the measurement results...................................................................... 177
7.2 Error messages and warnings.................................................................................178
8.1 Common suffixes...................................................................................................... 180
8.2 Introduction............................................................................................................... 181
8.3 Activating WLAN 802.11 measurements.................................................................186
8.4 Configuring the WLAN I/Q measurement (Modulation accuracy, flatness and tol-
Contents
6 How to perform measurements in the R&S VSE WLAN application
............................................................................................................. 173
WLAN signals............................................................................................................ 173
7 Optimizing and troubleshooting the measurement........................ 177
8 Remote commands for WLAN measurements................................ 180
erance)....................................................................................................................... 186
8.5 Configuring the result display................................................................................. 301
8.6 Retrieving results......................................................................................................321
8.7 Analysis..................................................................................................................... 363
8.8 Status registers......................................................................................................... 365
8.9 Deprecated commands.............................................................................................369
8.10 Programming examples (R&S VSE WLAN application)........................................ 372
Annex.................................................................................................. 377
A Menu reference...................................................................................377
A.1 Common R&S VSE menus....................................................................................... 377
A.2 WLAN I/Q measurements menus.............................................................................379
B Reference of toolbar functions......................................................... 382
C Sample rate, record length and analysis bandwidth...................... 386
List of commands (WLAN)................................................................ 387
Index....................................................................................................397
4User Manual 1176.8974.02 ─ 12

R&S®VSE-K91
1 Welcome to the R&S VSE WLAN applica-
Welcome to the R&S VSE WLAN application
tion
The R&S VSE WLAN application extends the functionality of the R&S VSE to enable
accurate and reproducible Tx measurements of a WLAN device under test (DUT) in
accordance with the standards specified for the device. The following standards are
currently supported (if the corresponding option is installed):
●
IEEE standard 802.11a
●
IEEE standard 802.11ac (SISO + MIMO)
●
IEEE standard 802.11ax (SISO + MIMO)
●
IEEE standard 802.11b
●
IEEE standard 802.11g (OFDM)
●
IEEE standard 802.11g (DSSS)
●
IEEE standard 802.11j
●
IEEE standard 802.11n (SISO + MIMO)
●
IEEE standard 802.11p
The R&S VSE WLAN application features:
Modulation measurements
●
Constellation diagram for demodulated signal
●
Constellation diagram for individual carriers
●
I/Q offset and I/Q imbalance
●
Modulation error (EVM) for individual carriers or symbols
●
Amplitude response and group-delay distortion (spectrum flatness)
●
Carrier and symbol frequency errors
Further measurements and results
●
Amplitude statistics (CCDF) and crest factor
●
FFT, also over a selected part of the signal, e.g. preamble
●
Payload bit information
●
Transmit spectrum mask
●
Freq/Phase Err vs. Preamble
This user manual contains a description of the functionality that is specific to the application, including remote control operation.
Functions that are not discussed in this manual are the same as in the I/Q Analyzer
application and are described in the R&S VSE Base Software User Manual. The latest
version is available for download at the product homepage http://www.rohde-
schwarz.com/product/VSE.html.
5User Manual 1176.8974.02 ─ 12
R&S®VSE-K91
1.1 Starting the R&S VSE WLAN application
Welcome to the R&S VSE WLAN application
Starting the R&S VSE WLAN application
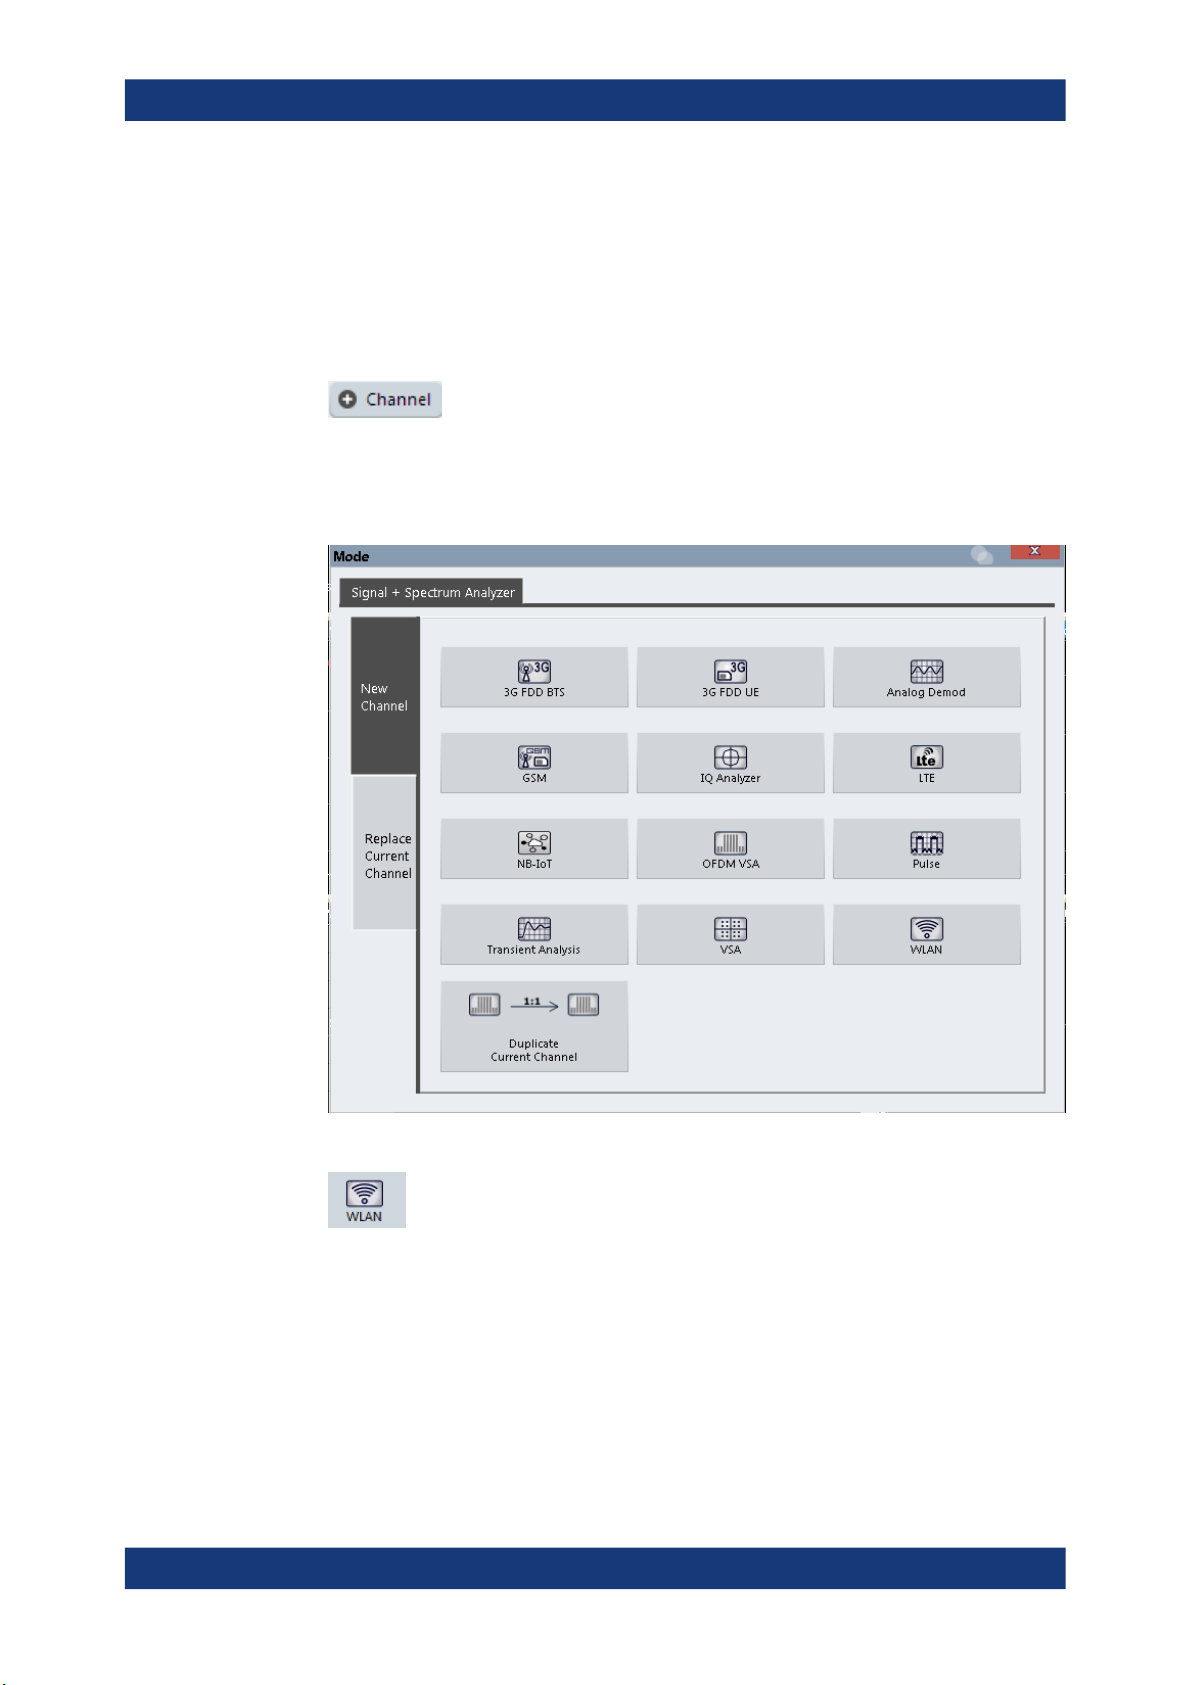
The WLAN measurement requires a special application on the R&S VSE. It is activated
by creating a new measurement channel in WLAN mode.
To activate the R&S VSE WLAN application
1.
Select the "Add Channel" function in the Sequence tool window.
A dialog box opens that contains all operating modes and applications currently
available in your R&S VSE.
2. Select the "WLAN" item.
The R&S VSE opens a new measurement channel for the R&S VSE WLAN application.
6User Manual 1176.8974.02 ─ 12

R&S®VSE-K91
1.2 Understanding the display information
Welcome to the R&S VSE WLAN application
Understanding the display information
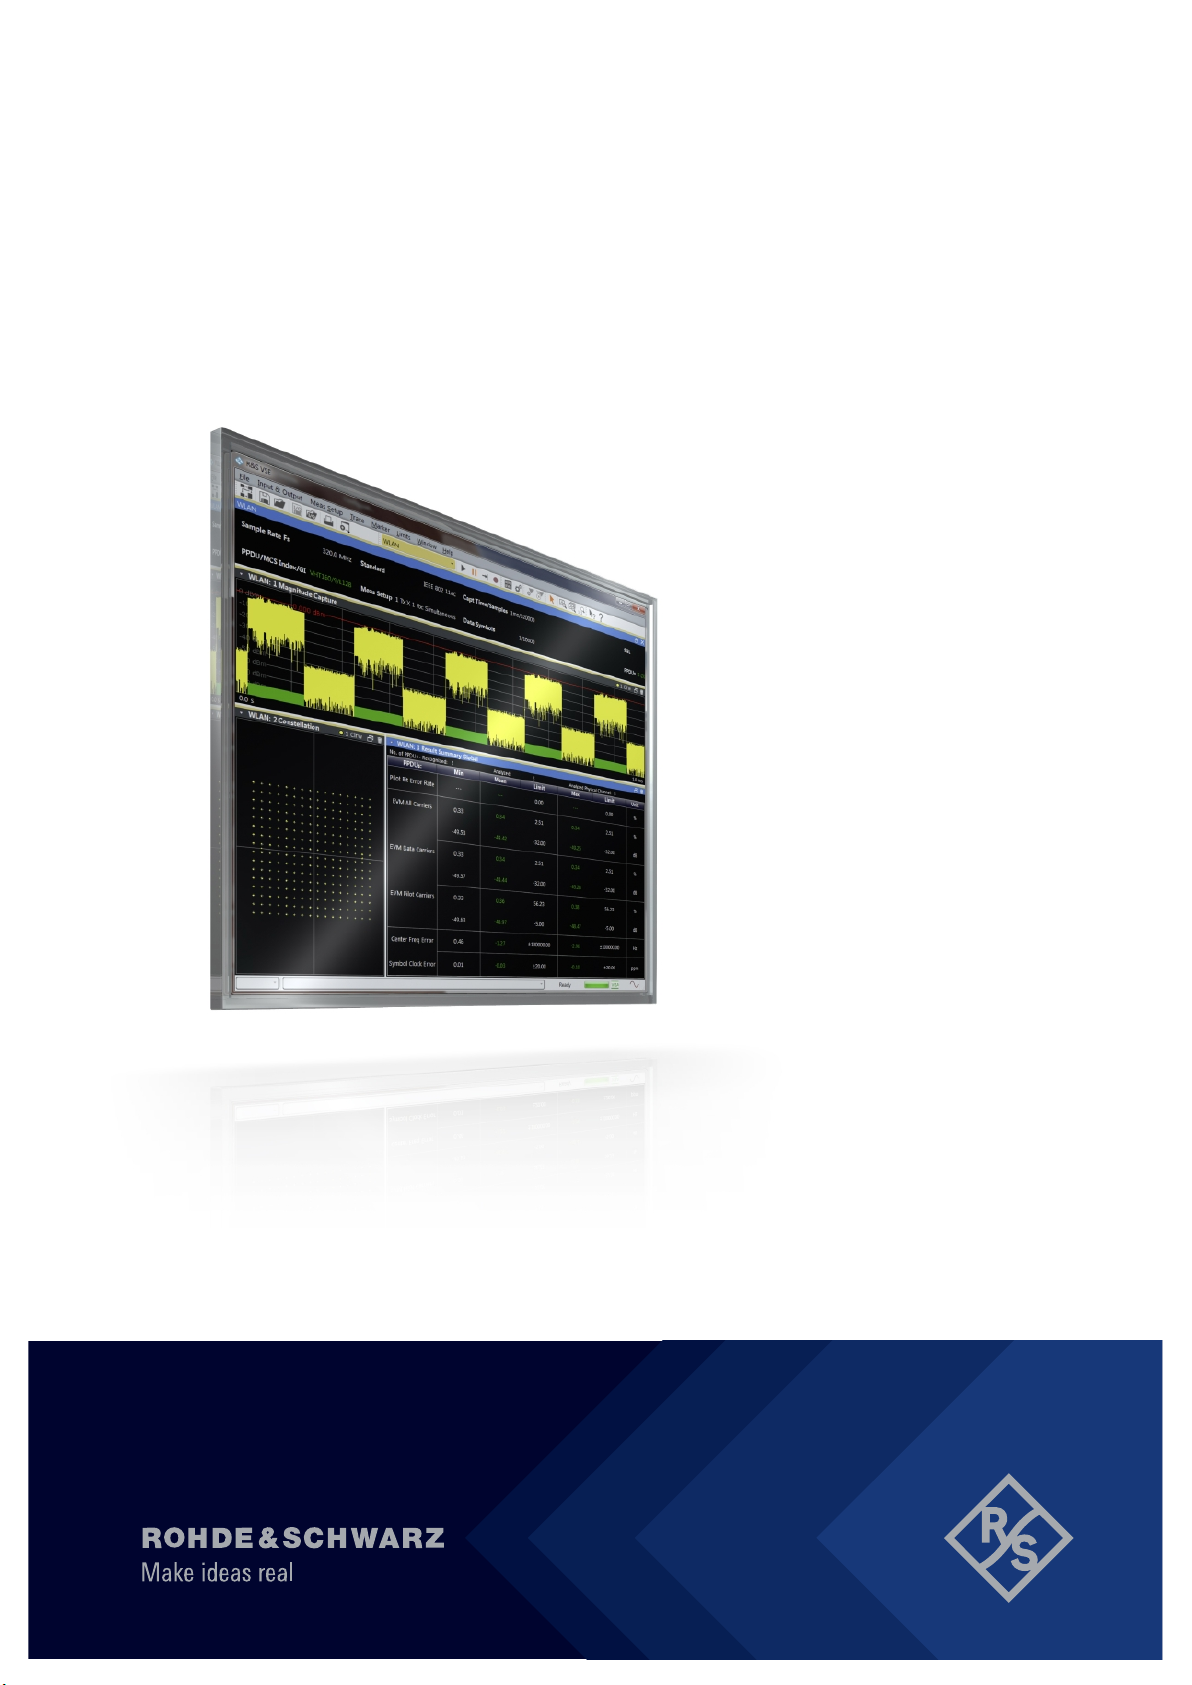
The following figure shows a measurement diagram during analyzer operation. All
information areas are labeled. They are explained in more detail in the following sections.
1
2
3
4
5
1 = Color coding for windows of same channel
2 = Channel bar with measurement settings
3 = Window title bar with diagram-specific (trace) information
4 = Diagram area
5 = Diagram footer with diagram-specific information, depending on result display
Channel bar information
In the R&S VSE WLAN application, the R&S VSE shows the following settings:
Table 1-1: Information displayed in the channel bar in the WLAN application
Label Description
Sample Rate Fs Input sample rate
PPDU / MCS Index / GI WLAN 802.11a, ac, n:
The PPDU type, MCS Index and Guard Interval used for the analysis of
the signal; Depending on the demodulation settings, these values are
either detected automatically from the signal or the user settings are
applied.
PPDU / Data Rate WLAN 802.11b:
The PPDU type and data rate used for the analysis of the signal; Depending on the demodulation settings, these values are either detected automatically from the signal or the user settings are applied.
7User Manual 1176.8974.02 ─ 12
R&S®VSE-K91
Welcome to the R&S VSE WLAN application
Understanding the display information
Label Description
Standard Selected WLAN measurement standard
Meas Setup Number of Transmitter (Tx) and Receiver (Rx) channels used in the mea-
surement (for MIMO)
Capt time / Samples Duration of signal capture and number of samples captured
Data Symbols The minimum and maximum number of data symbols that a PPDU may
have if it is to be considered in results analysis.
PPDUs [x of y (z)] For statistical evaluation over PPDUs (see "PPDU Statistic Count / No of
PPDUs to Analyze" on page 164):
<x> PPDUs of totally required <y> PPDUs have been analyzed so far.
<z> PPDUs were analyzed in the most recent sweep.
In addition, the channel bar also displays information on instrument settings that affect
the measurement results even though this is not immediately apparent from the display
of the measured values (e.g. transducer or trigger settings). This information is displayed only when applicable for the current measurement. For details see the
R&S VSE Base Software User Manual.
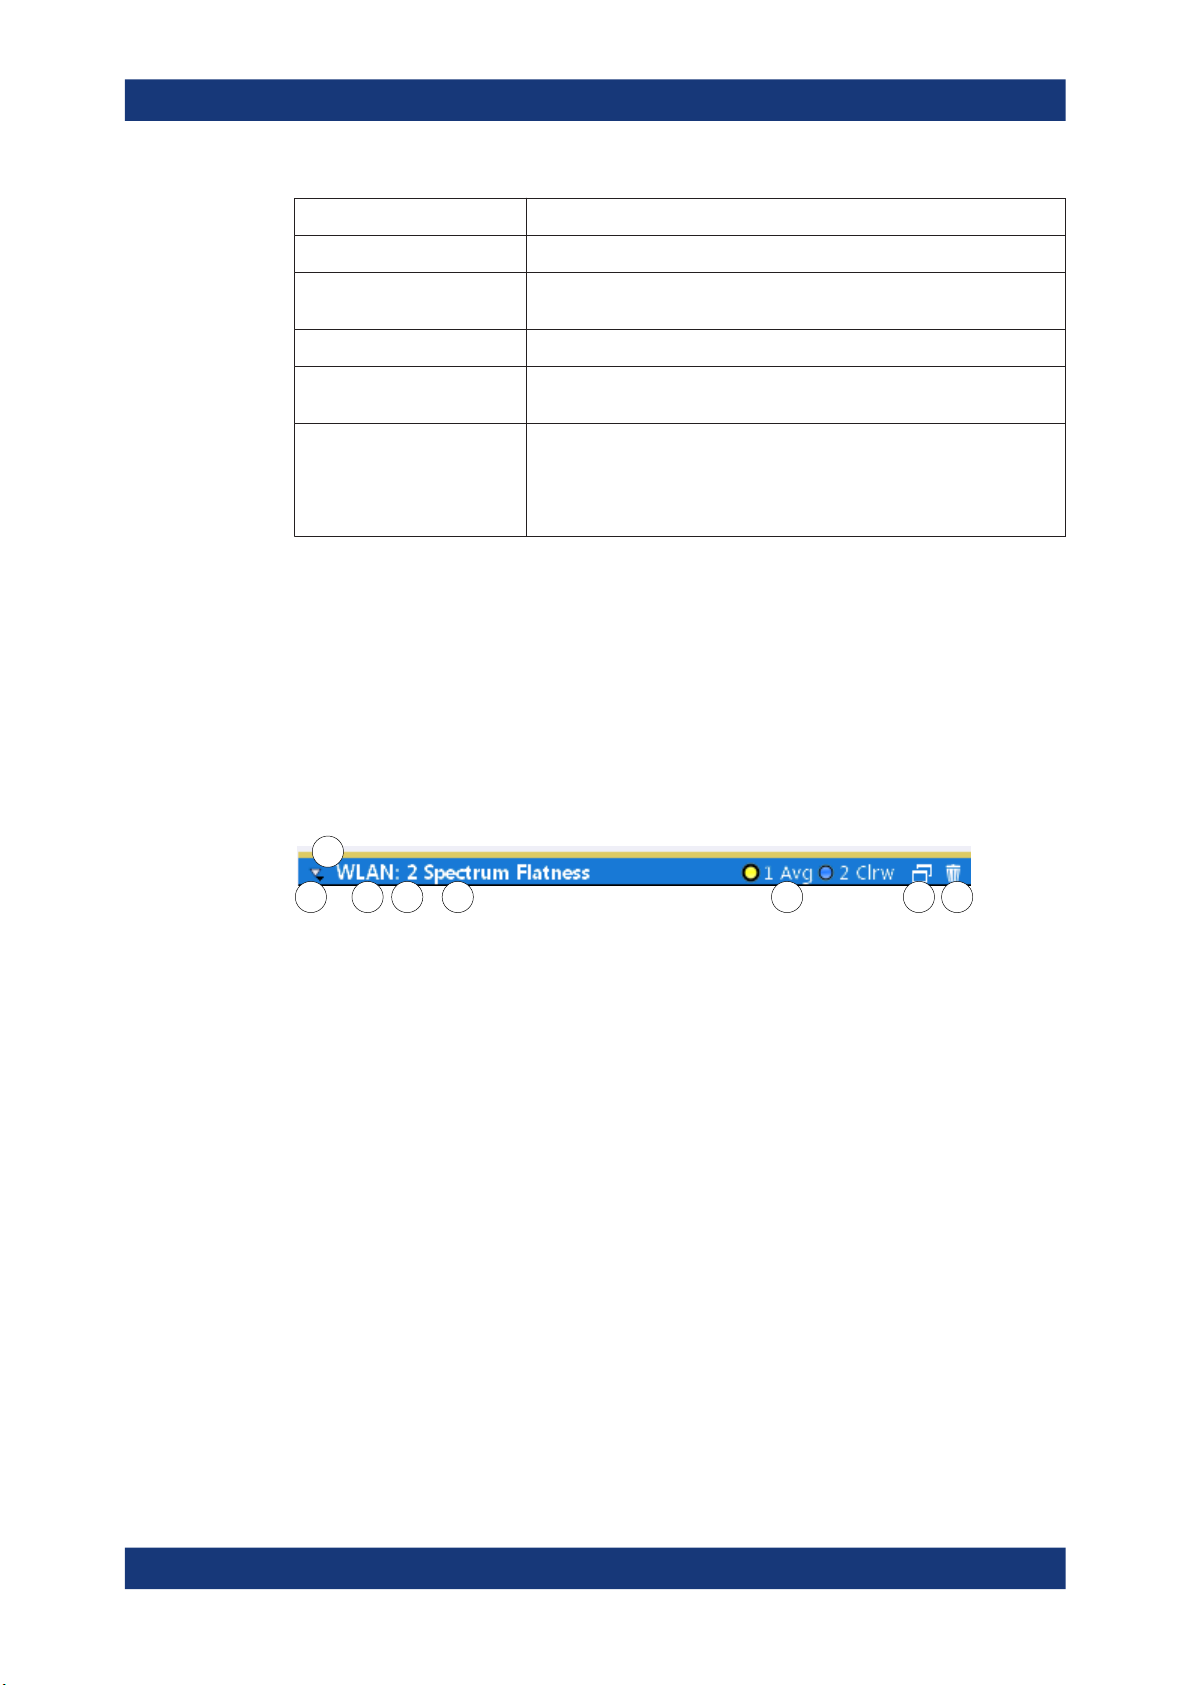
Window title bar information
For each diagram, the header provides the following information:
1 2 5 6 7304
Figure 1-1: Window title bar information in the WLAN application
0 = Color coding for windows of same channel
1 = Edit result display function
2 = Channel name
3 = Window number
4 = Window type
5 = Trace color, trace number, trace mode
6 = Dock/undock window function
7 = Close window function
Diagram footer information
The diagram footer (beneath the diagram) contains the start and stop values for the
displayed x-axis range.
Diagram area
The diagram area displays the results according to the selected result displays (see
Chapter 2, "WLAN I/Q measurement (modulation accuracy, flatness and tolerance)",
on page 10).
8User Manual 1176.8974.02 ─ 12

R&S®VSE-K91
Welcome to the R&S VSE WLAN application
Understanding the display information
Status bar information
The software status, errors and warnings and any irregularities in the software are indicated in the status bar at the bottom of the R&S VSE window.
9User Manual 1176.8974.02 ─ 12
R&S®VSE-K91
2 WLAN I/Q measurement (modulation accu-
2.1 Modulation accuracy, flatness and tolerance parame-
WLAN I/Q measurement (modulation accuracy, flatness and tolerance)
Modulation accuracy, flatness and tolerance parameters
racy, flatness and tolerance)
The default WLAN I/Q measurement captures the I/Q data from the WLAN signal using
a (nearly rectangular) filter with a relatively large bandwidth. The I/Q data captured with
this filter includes magnitude and phase information. That allows the R&S VSE WLAN
application to demodulate broadband signals and determine various characteristic signal parameters in just one measurement. Modulation accuracy, spectrum flatness, center frequency tolerance and symbol clock tolerance are only a few of the characteristic
parameters.
● Modulation accuracy, flatness and tolerance parameters.......................................10
● Evaluation methods for WLAN IQ measurements.................................................. 21
ters
The default WLAN I/Q measurement (Modulation Accuracy, Flatness,...) captures the
I/Q data from the WLAN signal and determines all the following I/Q parameters in a
single sweep.
Table 2-1: WLAN I/Q parameters for IEEE 802.11a, ac, ax, g (OFDM), j, n, p, be
Parameter Description Keyword for remote
query (FETCh:BURSt:)
General measurement parameters
Sample RateFsInput sample rate
PPDU Type of analyzed PPDUs
MCS Index Modulation and Coding Scheme (MCS) index of the analyzed
PPDUs
Data Rate Data rate used for analysis of the signal
(IEEE 802.11a only)
GI
/ GI+HE-LTF
/ GI+EHT-LTF
Guard interval length for current measurement
Guard interval and high-efficiency long training field length
(IEEE 802.11ax only)
Guard interval and length of EHT long training field (IEEE
802.11be only)
PPDU:TYPE
MCSindex
GINTerval
Meas Setup Number of Transmitter (Tx) and Receiver (Rx) channels used
in the measurement
Capture time Duration of signal capture
Samples Number of samples captured
*) the limits can be changed via remote control (not manually, see Chapter 8.4.10, "Limits", on page 295);
in this case, the currently defined limits are displayed here
10User Manual 1176.8974.02 ─ 12
R&S®VSE-K91
WLAN I/Q measurement (modulation accuracy, flatness and tolerance)
Modulation accuracy, flatness and tolerance parameters
Parameter Description Keyword for remote
query (FETCh:BURSt:)
Data Symbols The minimum and maximum number of data symbols that a
PPDU can have if it is to be considered in results analysis
PPDU parameters
Analyzed
PPDUs
Number of recognized
PPDUs
(global)
Number of
analyzed
PPDUs
(global)
Number of
analyzed
PPDUs in
physical channel
TX and Rx carrier parameters
I/Q offset [dB] Transmitter center frequency leakage relative to the total Tx
For statistical evaluation of PPDUs (see "PPDU Statistic
Count / No of PPDUs to Analyze" on page 164): <x> PPDUs of
the required <y> PPDUs have been analyzed so far. <z> indicates the number of analyzed PPDUs in the most recent
sweep.
Number of PPDUs recognized in capture buffer
Number of analyzed PPDUs in capture buffer
Number of PPDUs analyzed in entire signal (if available)
channel power (see Chapter 2.1.1, "I/Q offset", on page 14)
COUNt
COUNt:ALL
IQOFset
Gain imbalance [%/dB]
Quadrature
offset [°]
I/Q skew [s] Delay of the transmission of the data on the I path compared
PPDU power
[dBm]
Crest factor
[dB]
MIMO Cross
Power [dB]
MIMO Channel Power
[dBm]
*) the limits can be changed via remote control (not manually, see Chapter 8.4.10, "Limits", on page 295);
in this case, the currently defined limits are displayed here
Amplification of the quadrature phase component of the signal
relative to the amplification of the in-phase component (see
Chapter 2.1.2, "Gain imbalance", on page 15)
Deviation of the quadrature phase angle from the ideal 90°
(see Chapter 2.1.3, "Quadrature offset", on page 16).
to the Q path (see Chapter 2.1.4, "I/Q skew", on page 17)
Mean PPDU power
The ratio of the peak power to the mean power of the signal
(also called Peak to Average Power Ratio, PAPR).
Sum of RMS power from all cross streams
RMS power for each effective channel path from all active carriers.
GIMBalance
QUADoffset
IQSKew
CRESt
MCPower
MCHPower
11User Manual 1176.8974.02 ─ 12
R&S®VSE-K91
WLAN I/Q measurement (modulation accuracy, flatness and tolerance)
Modulation accuracy, flatness and tolerance parameters
Parameter Description Keyword for remote
query (FETCh:BURSt:)
Center frequency error
[Hz]
Symbol clock
error [ppm]
CPE Common phase error
Stream parameters
BER Pilot [%] Bit error rate (BER) of the pilot carriers
EVM all carriers [%/dB]
Frequency error between the signal and the current center frequency of the R&S VSE; the corresponding limits specified in
the standard are also indicated*)
The absolute frequency error includes the frequency error of
the R&S VSE and that of the DUT. If possible, synchronize the
transmitter connected instrument and the DUT using an external reference.
See R&S VSE base software user manual > Configuring
Instruments
Clock error between the signal and the sample clock of the
R&S VSE in parts per million (ppm), i.e. the symbol timing
error; the corresponding limits specified in the standard are
also indicated *)
If possible, synchronize the transmitter connected instrument
and the DUT using an external reference.
See R&S VSE base software user manual > Configuring
Instruments
EVM (Error Vector Magnitude) of the payload symbols over all
carriers; the corresponding limits specified in the standard are
also indicated*)
CFERror
CPERror
BERPilot
EVM:ALL
EVM data carriers [%/dB]
EVM pilot carriers [%/dB]
*) the limits can be changed via remote control (not manually, see Chapter 8.4.10, "Limits", on page 295);
in this case, the currently defined limits are displayed here
Table 2-2: WLAN I/Q parameters for IEEE 802.11b or g (DSSS)
Parameter Description Keyword for remote
Sample RateFsInput sample rate
PPDU Type of the analyzed PPDU
Data Rate Data rate used for analysis of the signal
Meas Setup Number of Transmitter (Tx) and Receiver (Rx) channels used in
Capture time Duration of signal capture
No. of Samples Number of samples captured (= sample rate * capture time)
EVM (Error Vector Magnitude) of the payload symbols over all
data carriers; the corresponding limits specified in the standard
are also indicated*)
EVM (Error Vector Magnitude) of the payload symbols over all
pilot carriers; the corresponding limits specified in the standard
are also indicated*)
the measurement
EVM:DATA
EVM:PILot
query
(FETCh:BURSt:)
PPDU:TYPE
12User Manual 1176.8974.02 ─ 12
R&S®VSE-K91
WLAN I/Q measurement (modulation accuracy, flatness and tolerance)
Modulation accuracy, flatness and tolerance parameters
Parameter Description Keyword for remote
query
(FETCh:BURSt:)
PSDU Data
Length
PPDU parameters
Analyzed
PPDUs
Number of recognized
PPDUs
(global)
Number of
analyzed
PPDUs
(global)
Number of
analyzed
PPDUs in
physical channel
Peak vector
error
The duration in seconds of the PSDU data
For statistical evaluation of PPDUs (see "PPDU Statistic Count /
No of PPDUs to Analyze" on page 164): <x> PPDUs of the
required <y> PPDUs have been analyzed so far. <z> indicates
the number of analyzed PPDUs in the most recent sweep.
Number of PPDUs recognized in capture buffer
Number of analyzed PPDUs in capture buffer
Number of PPDUs analyzed in entire signal (if available)
Peak vector error (EVM) over the complete PPDU including the
preamble in % and in dB; calculated according to the IEEE
802.11b or g (DSSS) definition of the normalized error vector
magnitude (see Chapter 2.1.7.2, "Peak vector error (IEEE
method)", on page 19);
The corresponding limits specified in the standard are also indicated *)
COUNt
COUNt:ALL
EVM:DIRect
PPDU EVM EVM (Error Vector Magnitude) over the complete PPDU includ-
ing the preamble in % and dB
I/Q offset [dB] Transmitter center frequency leakage relative to the total Tx
channel power (see Chapter 2.1.1, "I/Q offset", on page 14)
Gain imbalance [%/dB]
Quadrature
error [°]
Center frequency error
[Hz]
Amplification of the quadrature phase component of the signal
relative to the amplification of the in-phase component (see
Chapter 2.1.2, "Gain imbalance", on page 15)
Measure for the crosstalk of the Q-branch into the I-branch (see
"Gain imbalance, I/Q offset, quadrature error" on page 69).
Frequency error between the signal and the current center frequency of the R&S VSE; the corresponding limits specified in the
standard are also indicated*)
The absolute frequency error includes the frequency error of the
R&S VSE and that of the DUT. If possible, synchronize the transmitter connected instrument and the DUT using an external reference.
See R&S VSE base software user manual > Configuring Instruments
PPDU:EVM:ALL
IQOFset
GIMBalance
QUADoffset
CFERror
13User Manual 1176.8974.02 ─ 12
R&S®VSE-K91
WLAN I/Q measurement (modulation accuracy, flatness and tolerance)
Modulation accuracy, flatness and tolerance parameters
Parameter Description Keyword for remote
query
(FETCh:BURSt:)
Chip clock
error [ppm]
Rise time Time the signal needs to increase its power level from 10% to
Fall time Time the signal needs to decrease its power level from 90% to
Mean power
[dBm]
Peak power
[dBm]
Crest factor
[dB]
Clock error between the signal and the chip clock of the
R&S VSE in parts per million (ppm), i.e. the chip timing error; the
corresponding limits specified in the standard are also indicated
*)
If possible, synchronize the transmitter connected instrument
and the DUT using an external reference.
See R&S VSE base software user manual > Configuring Instruments
90% of the maximum or the average power (depending on the
reference power setting)
The corresponding limits specified in the standard are also indicated *)
10% of the maximum or the average power (depending on the
reference power setting)
The corresponding limits specified in the standard are also indicated *)
Mean PPDU power
Peak PPDU power
The ratio of the peak power to the mean power of the PPDU
(also called Peak to Average Power Ratio, PAPR).
TRISe
TFALl
PEAK
CRESt
The R&S VSE WLAN application also performs statistical evaluation over several
PPDUs and displays one or more of the following results:
Table 2-3: Calculated summary results
Result type Description
Min Minimum measured value
Mean/ Limit Mean measured value / limit defined in standard
Max/Limit Maximum measured value / limit defined in standard
2.1.1 I/Q offset
An I/Q offset indicates a carrier offset with fixed amplitude. This results in a constant
shift of the I/Q axes. The offset is normalized by the mean symbol power and displayed
in dB.
14User Manual 1176.8974.02 ─ 12
R&S®VSE-K91
2.1.2 Gain imbalance
WLAN I/Q measurement (modulation accuracy, flatness and tolerance)
Modulation accuracy, flatness and tolerance parameters
Figure 2-1: I/Q offset in a vector diagram
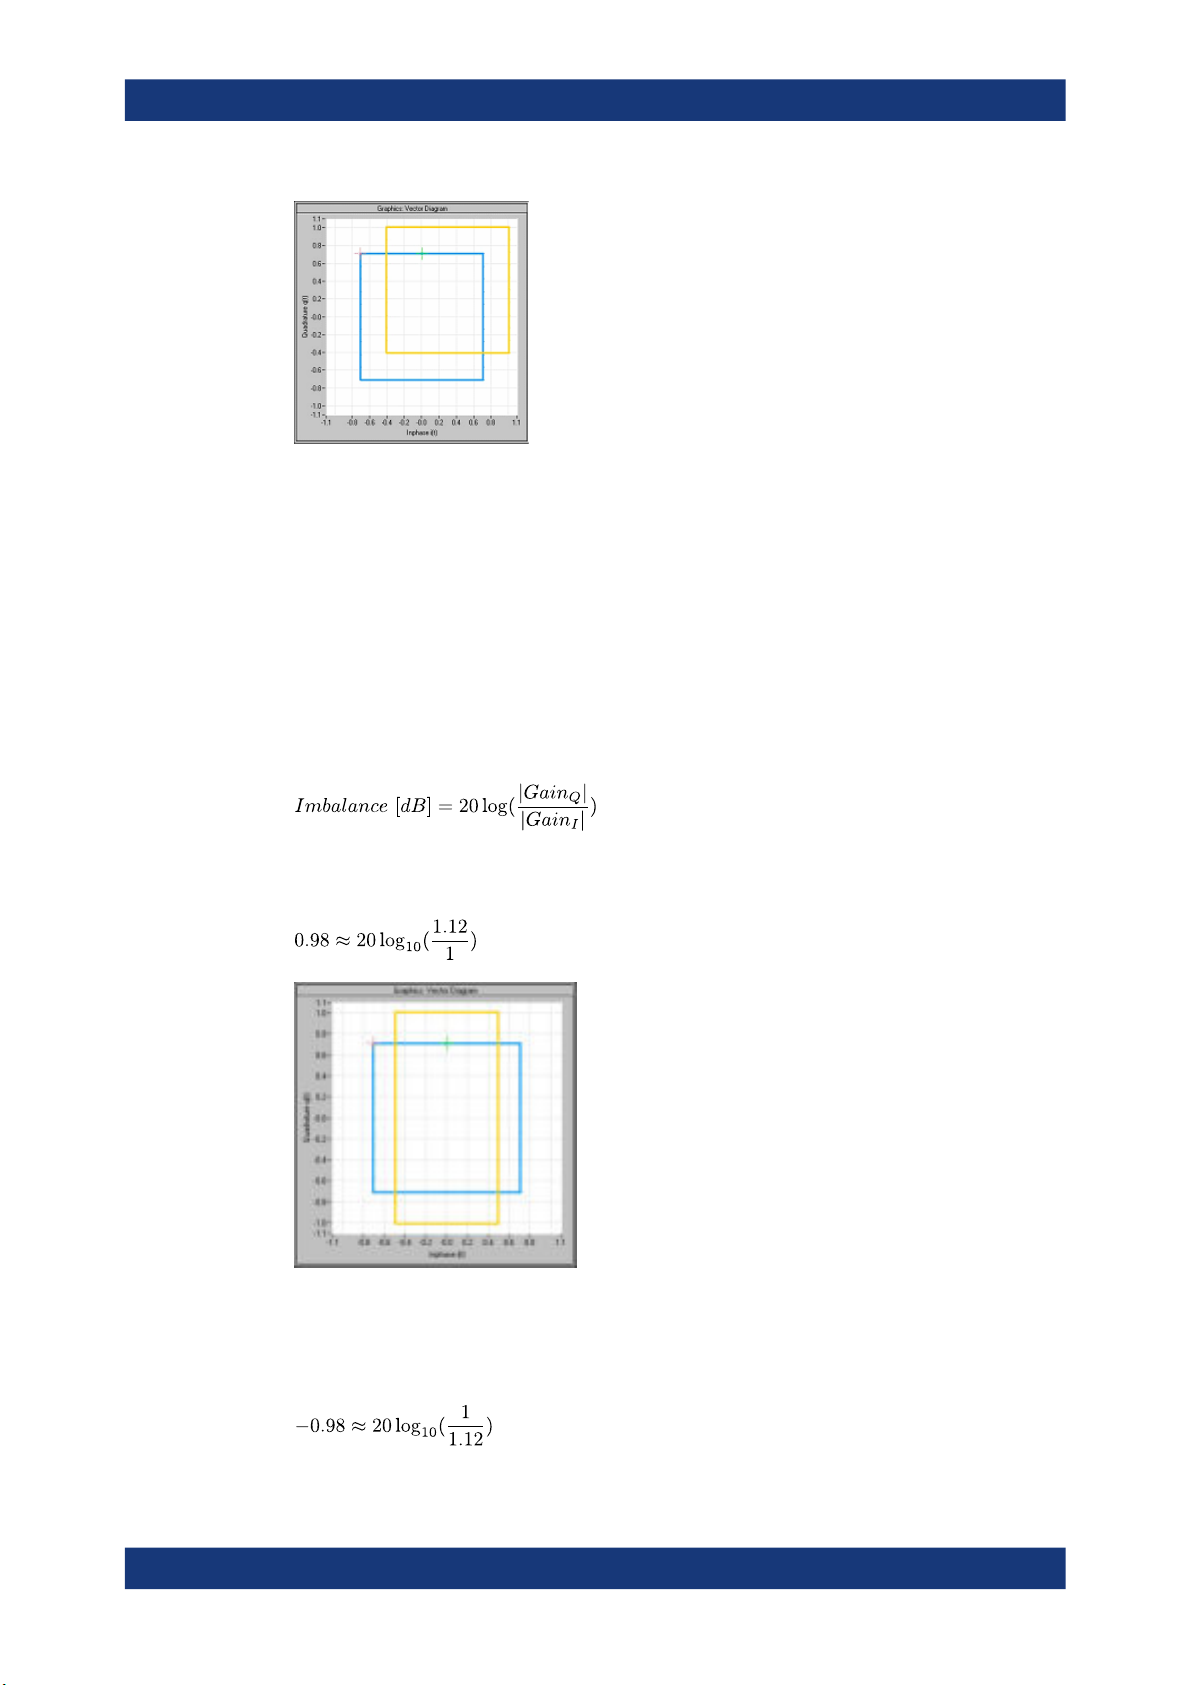
An ideal I/Q modulator amplifies the I and Q signal path by exactly the same degree.
The imbalance corresponds to the difference in amplification of the I and Q channel
and therefore to the difference in amplitude of the signal components. In the vector diagram, the length of the I vector changes relative to the length of the Q vector.
The result is displayed in dB and %, where 1 dB offset corresponds to roughly 12 %
difference between the I and Q gain, according to the following equation:
Positive values mean that the Q vector is amplified more than the I vector by the corresponding percentage. For example, using the figures mentioned above:
Figure 2-2: Positive gain imbalance
Negative values mean that the I vector is amplified more than the Q vector by the corresponding percentage. For example, using the figures mentioned above:
15User Manual 1176.8974.02 ─ 12
R&S®VSE-K91
2.1.3 Quadrature offset
WLAN I/Q measurement (modulation accuracy, flatness and tolerance)
Modulation accuracy, flatness and tolerance parameters
Figure 2-3: Negative gain imbalance
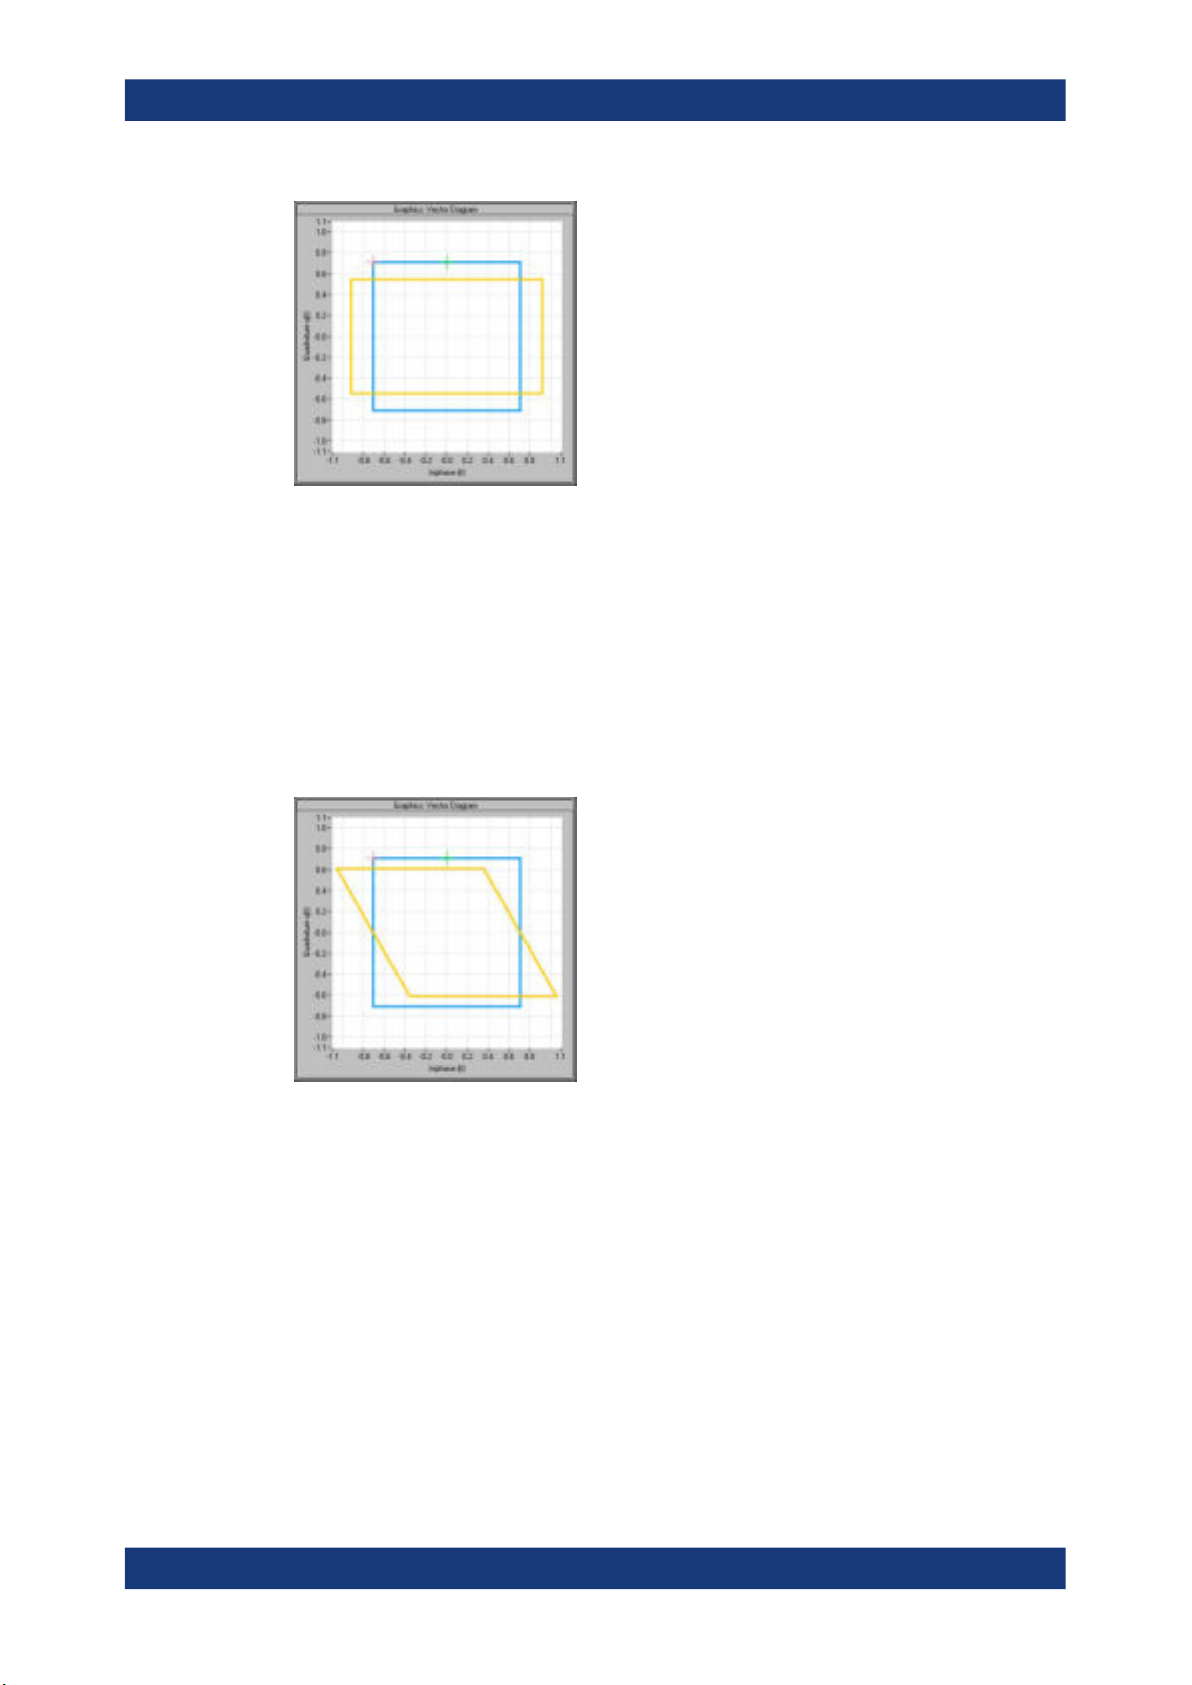
An ideal I/Q modulator sets the phase angle between the I and Q path mixer to exactly
90 degrees. With a quadrature offset, the phase angle deviates from the ideal 90
degrees, the amplitudes of both components are of the same size. In the vector diagram, the quadrature offset causes the coordinate system to shift.
A positive quadrature offset means a phase angle greater than 90 degrees:
Figure 2-4: Positive quadrature offset
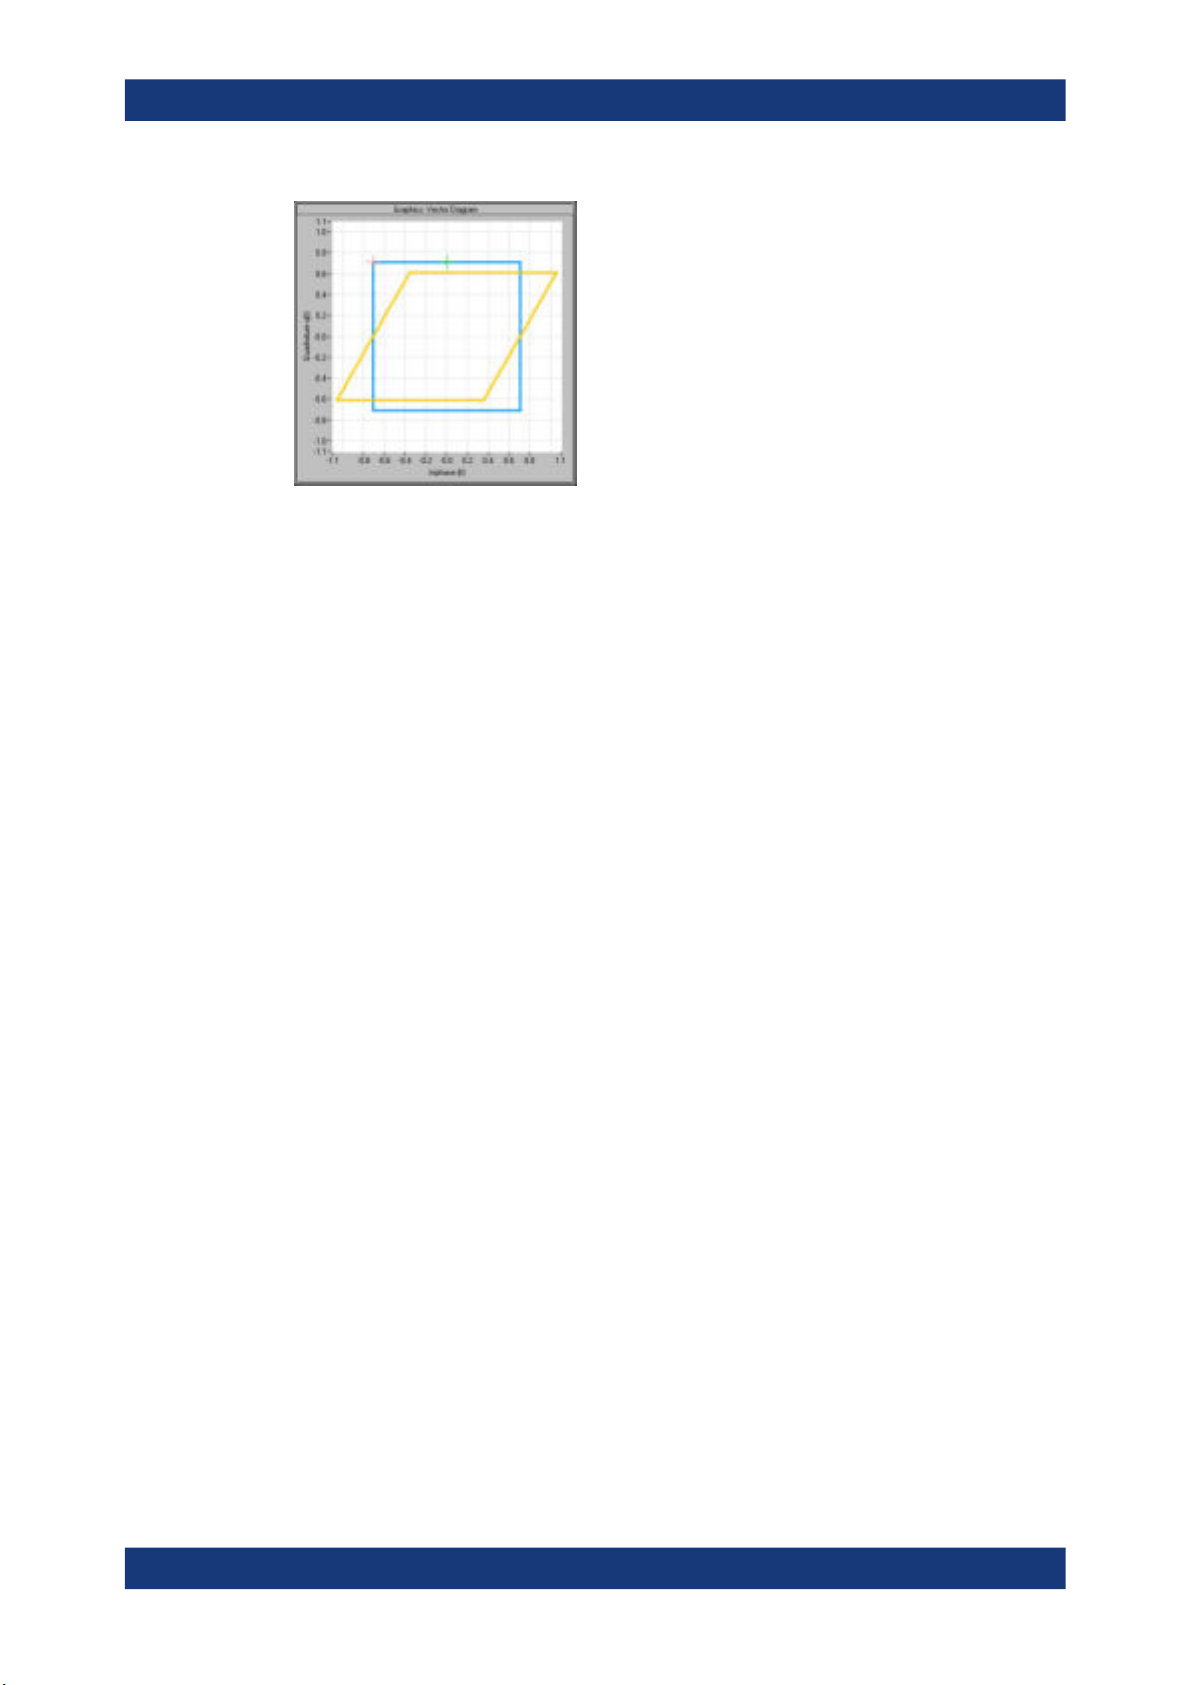
A negative quadrature offset means a phase angle less than 90 degrees:
16User Manual 1176.8974.02 ─ 12
R&S®VSE-K91
2.1.4 I/Q skew
WLAN I/Q measurement (modulation accuracy, flatness and tolerance)
Modulation accuracy, flatness and tolerance parameters
Figure 2-5: Negative quadrature offset
If transmission of the data on the I path is delayed compared to the Q path, or vice
versa, the I/Q data becomes skewed.
The I/Q skew results can be compensated for together with Gain imbalance and Quad-
rature offset (see "I/Q Mismatch Compensation" on page 130).
2.1.5 I/Q mismatch
I/Q mismatch is a comprehensive term for Gain imbalance, Quadrature offset, and I/Q
skew.
Compensation for I/Q mismatch is useful, for example, if the device under test is
known to be affected by these impairments but the EVM without these effects is of
interest. Note, however, that measurements strictly according to IEEE 802.11-2012,
IEEE 802.11ac-2013 WLAN standard must not use compensation.
2.1.6 RF carrier suppression (IEEE 802.11b, g (DSSS))
Standard definition
The RF carrier suppression, measured at the channel center frequency, shall be at
least 15 dB below the peak SIN(x)/x power spectrum. The RF carrier suppression shall
be measured while transmitting a repetitive 01 data sequence with the scrambler disabled using DQPSK modulation. A 100 kHz resolution bandwidth shall be used to perform this measurement.
Comparison to IQ offset measurement in the R&S VSE WLAN application
The IQ offset measurement in the R&S VSE WLAN application returns the current carrier feedthrough normalized to the mean power at the symbol timings. This measure-
17User Manual 1176.8974.02 ─ 12
R&S®VSE-K91
2.1.7 EVM measurement
WLAN I/Q measurement (modulation accuracy, flatness and tolerance)
Modulation accuracy, flatness and tolerance parameters
ment does not require a special test signal and is independent of the transmit filter
shape.
The RF carrier suppression measured according to the standard is inversely proportional to the IQ offset measured in the R&S VSE WLAN application. The difference (in
dB) between the two values depends on the transmit filter shape. Determine it with a
reference measurement.
The following table lists the difference exemplarily for three transmit filter shapes
(±0.5 dB):
Transmit filter – IQ-Offset [dB] – RF-Carrier-Suppression [dB]
Rectangular 11 dB
Root raised cosine, "α" = 0.3 10 dB
Gaussian, "α" = 0.3 9 dB
The R&S VSE WLAN application provides two different types of EVM calculation.
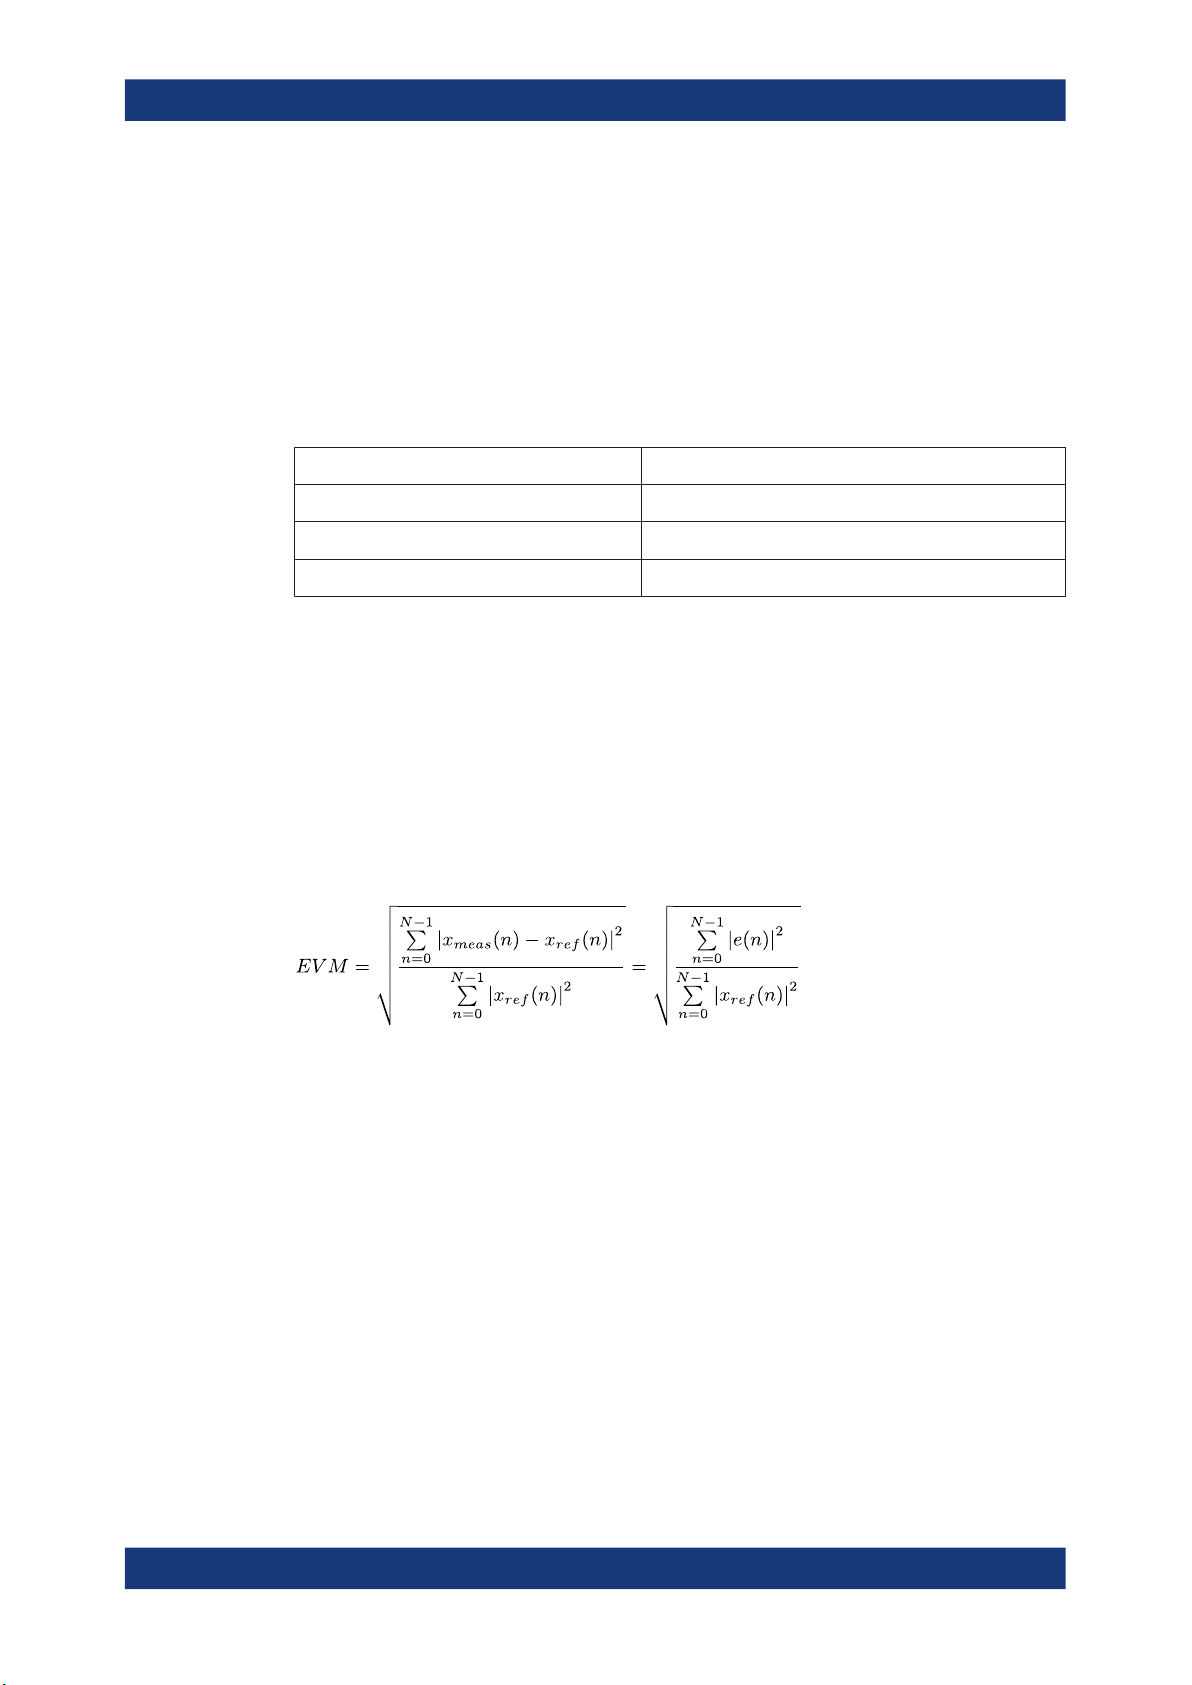
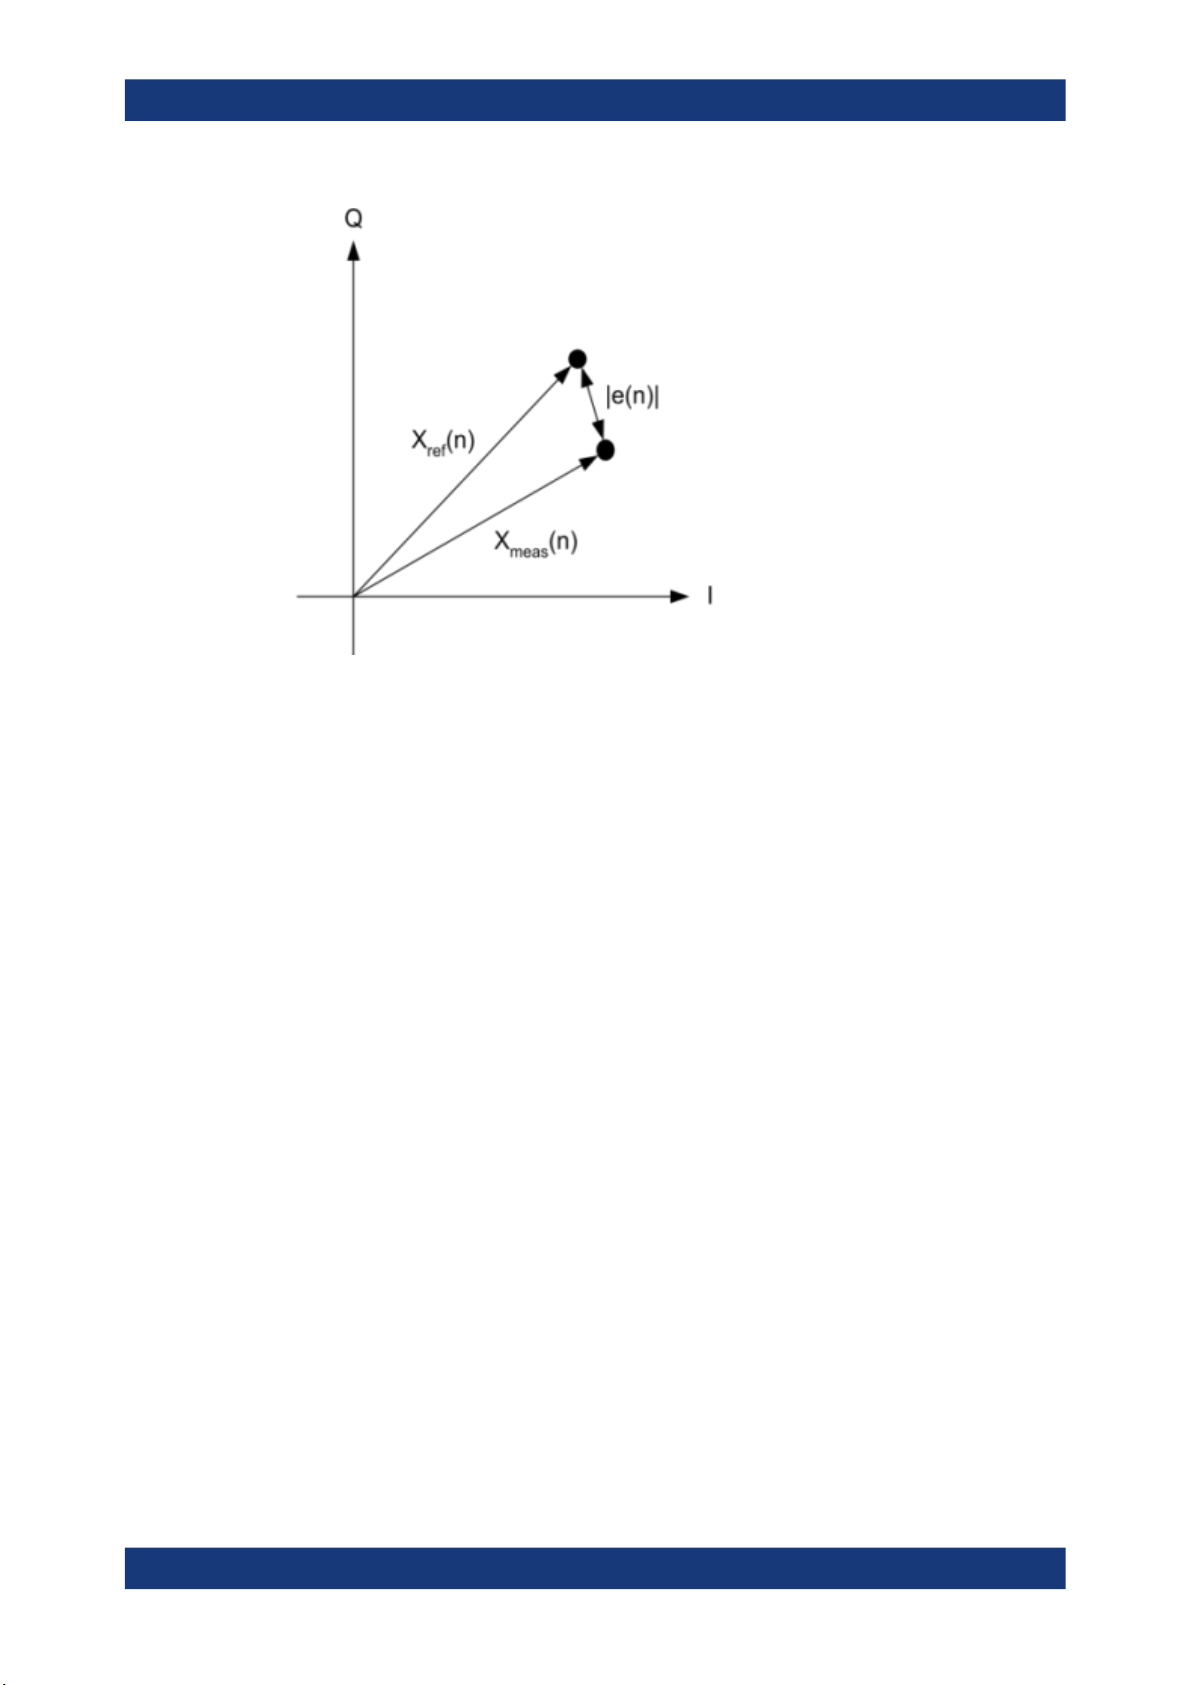
2.1.7.1 PPDU EVM (direct method)
The PPDU EVM (direct) method evaluates the root mean square EVM over one PPDU.
That is the square root of the averaged error power normalized by the averaged reference power:
Before calculation of the EVM, tracking errors in the measured signal are compensated
for if specified by the user. In the ideal reference signal, the tracking errors are always
compensated for. Tracking errors include phase (center frequency error + common
phase error), timing (sampling frequency error) and gain errors. Quadrature offset and
gain imbalance errors, however, are not corrected.
The PPDU EVM is not part of the IEEE standard and no limit check is specified. Nevertheless, this commonly used EVM calculation can provide some insight in modulation
quality and enables comparisons to other modulation standards.
18User Manual 1176.8974.02 ─ 12
R&S®VSE-K91
WLAN I/Q measurement (modulation accuracy, flatness and tolerance)
Modulation accuracy, flatness and tolerance parameters
Figure 2-6: I/Q diagram for EVM calculation
2.1.7.2 Peak vector error (IEEE method)
The peak vector error (Peak EVM) is defined in section 18.4.7.8 "Transmit modulation
accuracy" of the IEEE 802.11b standard. The phase, timing and gain tracking errors of
the measurement signal (center frequency error, common phase error, sampling frequency error) are compensated for before EVM calculation.
The standard does not specify a normalization factor for the error vector magnitude. To
get an EVM value that is independent of the level, the R&S VSE WLAN application
normalizes the EVM values. Thus, an EVM of 100% indicates that the error power on
the I- or Q-channels equals the mean power on the I- or Q-channels, respectively.
The peak vector error is the maximum EVM over all payload symbols and all active
carriers for one PPDU. If more than one PPDU is analyzed the Min / Mean / Max columns show the minimum, mean or maximum Peak EVM of all analyzed PPDUs. This
can be the case, for example, if several analyzed PPDUs are in the capture buffer or
due to the PPDU Statistic Count / No of PPDUs to Analyze setting.
The IEEE 802.11b or g (DSSS) standards allow a peak vector error of less than 35%.
In contrary to the specification, the R&S VSE WLAN application does not limit the measurement to 1000 chips length, but searches the maximum over the whole PPDU.
2.1.8 Unused tone error
Similarly to the adjacent channel power requirements for other WLAN standards, the
IEEE 802.11ax standard specifies limits for power leakage into neighboring resource
units (IEEE P802.11ax/D1.2, "Transmitter modulation accuracy (EVM) test" section). In
high-efficiency wireless signals, the subcarriers or frequencies that are not used for
active transmission are referred to as unused tones. Thus, the parameter that indicates
19User Manual 1176.8974.02 ─ 12

R&S®VSE-K91
WLAN I/Q measurement (modulation accuracy, flatness and tolerance)
Modulation accuracy, flatness and tolerance parameters
the power leakage into adjacent resource units is referred to as the unused tone error.
The R&S VSE WLAN application provides a dedicated result display for the IEEE
802.11ax standard for HE trigger-based PPDUs.
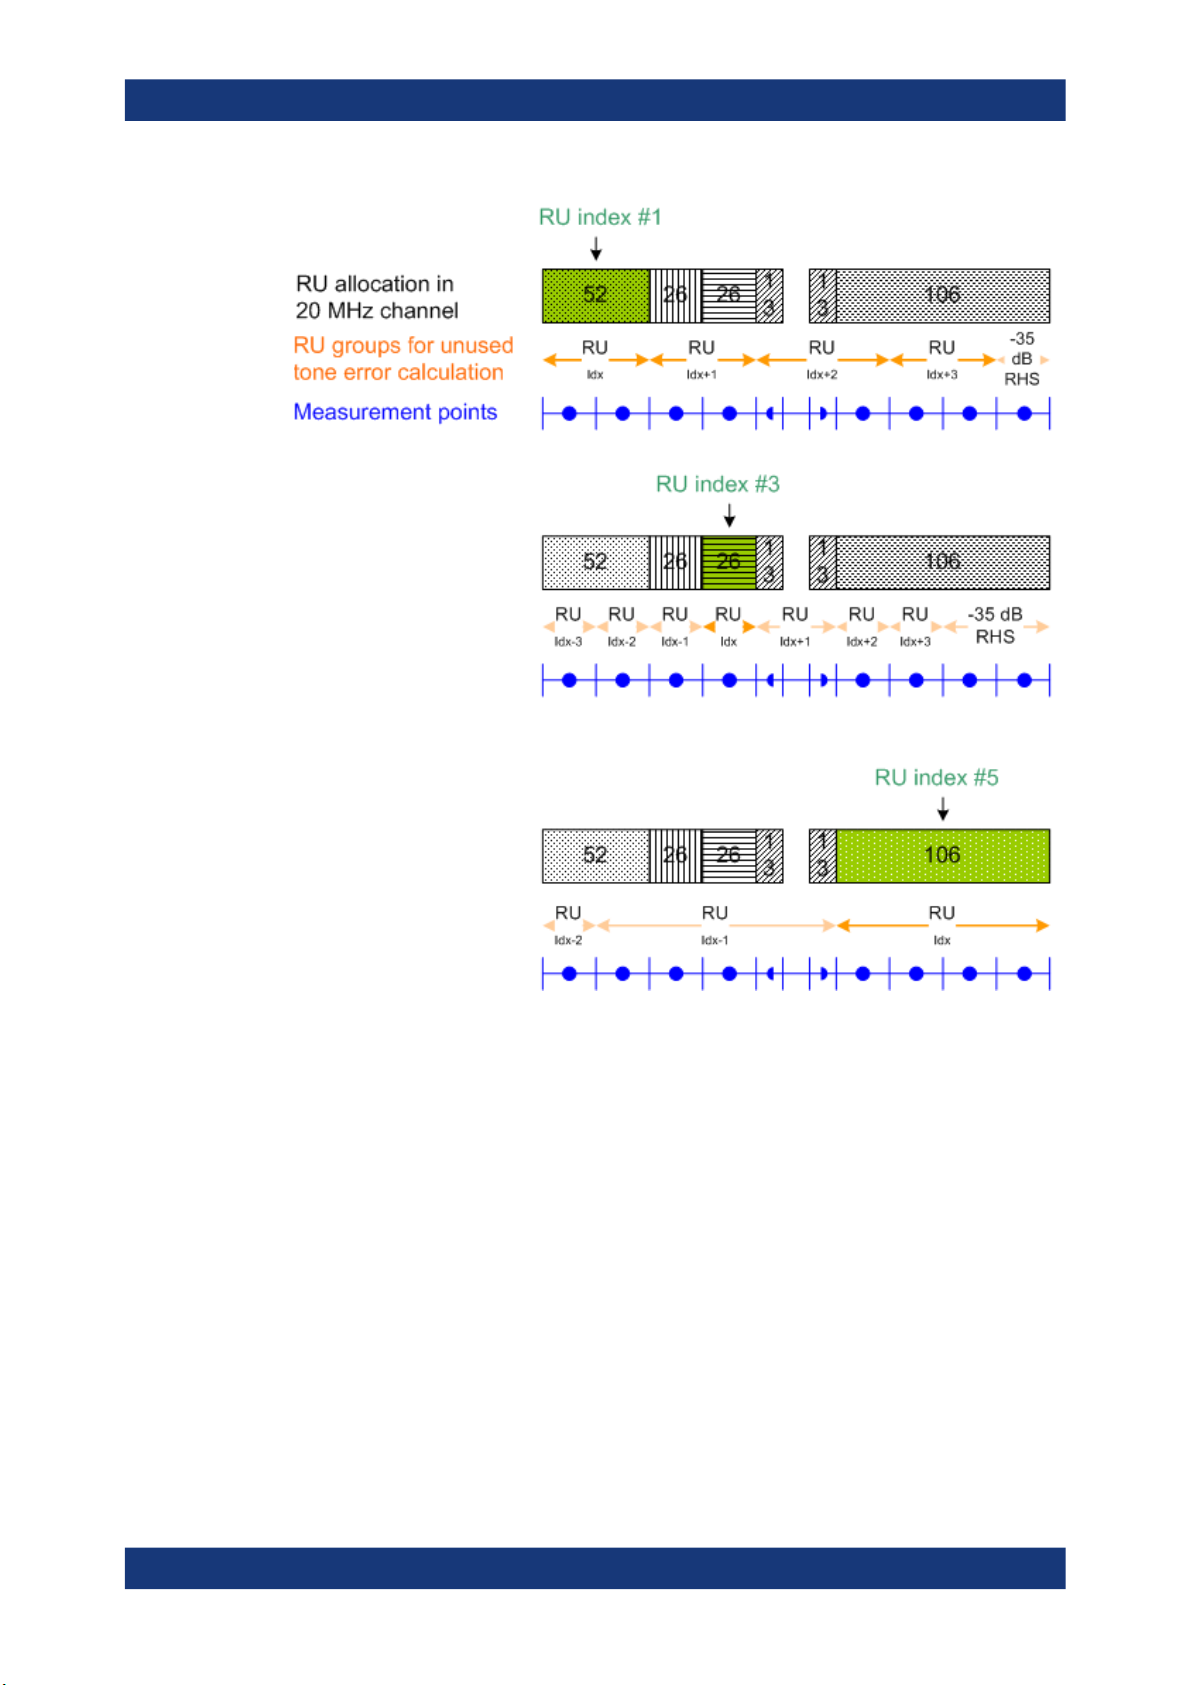
The region in which the power leakage must be determined depends on the size and
position within the channel of the resource unit being checked. Up to 3 times the number of subcarriers contained in the resource unit are checked on either side of it. Any
remaining subcarriers are checked against the fixed limit of -35 dB. However, only subcarriers in the same channel are evaluated. If the resource unit is at the edge of the
channel, possibly no or not enough adjacent subcarriers are available in the channel.
Assuming the resource unit contains n carriers, the adjacent n subcarriers are
assigned a certain limit, the next n subcarriers have another limit, and the third n subcarriers have yet another limit. All subcarriers beyond that have a fixed limit of -35 dB
in relation to the EVM tolerance limit for the original resource unit ("[IEEE P802.11ax/
D1.2] Equation (28-123)").
Since the n subcarriers can be allocated to several different resource units, we refer to
such a subset as an RU group. The RU group containing the resource unit to be
checked is referred to as RU
are referred to as RU groups RU
remaining subcarriers are referred to as the RU groups -35
. The other subsets evaluated on either side of the RU
Idx
Idx-1
, RU
Idx-2
, RU
, and RU
Idx-3
, RU
Idx+1
dB
LHS (left-hand side)
Idx+2
, RU
Idx+3
Idx
. The
and -35 dB RHS (right-hand side).
The size of the evaluated RU groups corresponds to the size of the RU
, even if the
Idx
actual resource unit allocation in the channel differs. However, the R&S VSE WLAN
application measures one unused tone value for each set of 26 subcarriers. For each
RU group, the mean, maximum, and minimum of these values is determined. In the
Unused Tone Error Summary, the "RU Size [RU26]" is indicated as the quotient of the
RU size divided by the RU26 size (see "[IEEE P802.11ax/D1.2] Equation (28-123)").
Thus, the "RU Size [RU26]" also indicates the number of measurement points determined for each RU group.
Figure 2-7 illustrates the RU groups for which the unused tone error is determined for
different RU indexes. The blue dots indicate individual power measurement points in
the channel.
20User Manual 1176.8974.02 ─ 12
R&S®VSE-K91
WLAN I/Q measurement (modulation accuracy, flatness and tolerance)
Evaluation methods for WLAN IQ measurements
Figure 2-7: RU groups to be checked for unused tone error for different RU indexes
2.2 Evaluation methods for WLAN IQ measurements
The captured I/Q data from the WLAN signal can be evaluated using various different
methods without having to start a new measurement or sweep. Which results are displayed depends on the selected evaluation.
21User Manual 1176.8974.02 ─ 12

R&S®VSE-K91
WLAN I/Q measurement (modulation accuracy, flatness and tolerance)
Evaluation methods for WLAN IQ measurements
Result display windows
For each measurement, a separate measurement channel is activated. Each measurement channel can provide multiple result displays, which are displayed in individual
windows. The measurement windows can be rearranged and configured in the
R&S VSE to meet your requirements. All windows that belong to the same measurement (including the channel bar) are indicated by a colored line at the top of the window title bar.
►
To add further result displays for the WLAN 802.11 channel, select the
Window" icon from the toolbar, or select the "Window > New Window" menu item.
For details on working with channels and windows, see the "Operating Basics"
chapter in the R&S VSE base software user manual.
The selected evaluation method not only affects the result display in a window, but also
the results of the trace data query in remote control (see TRACe[:DATA]?
on page 351).
The WLAN measurements provide the following evaluation methods:
AM/AM.......................................................................................................................... 23
AM/PM.......................................................................................................................... 23
AM/EVM........................................................................................................................24
Bitstream.......................................................................................................................25
Constellation................................................................................................................. 27
Constellation vs Carrier.................................................................................................28
EVM vs Carrier..............................................................................................................29
EVM vs Chip................................................................................................................. 29
EVM vs Symbol.............................................................................................................30
FFT Spectrum............................................................................................................... 31
Freq. Error vs Preamble................................................................................................32
Gain Imbalance vs Carrier............................................................................................ 33
Group Delay..................................................................................................................34
Magnitude Capture........................................................................................................35
Phase Error vs Preamble..............................................................................................36
Phase Tracking............................................................................................................. 37
PLCP Header (IEEE 802.11b, g (DSSS).......................................................................37
PvT Full PPDU..............................................................................................................38
PvT Rising Edge........................................................................................................... 40
PvT Falling Edge...........................................................................................................41
Quad Error vs Carrier....................................................................................................41
Result Summary Detailed............................................................................................. 42
Result Summary Global................................................................................................ 43
Signal Content Detailed (IEEE 802.11ax, be)............................................................... 45
Signal Field................................................................................................................... 46
└ IEEE 802.11a, g (OFDM), j, p......................................................................... 47
└ IEEE 802.11ac................................................................................................ 48
└ IEEE 802.11n..................................................................................................49
└ IEEE 802.11ax HE SU PPDU (DL/UL), HE Extended Range SU PPDU........50
└ IEEE 802.11ax HE MU PPDU (DL).................................................................51
└ IEEE 802.11ax HE Trigger-based PPDU (UL)................................................52
"Add
22User Manual 1176.8974.02 ─ 12

R&S®VSE-K91
WLAN I/Q measurement (modulation accuracy, flatness and tolerance)
Evaluation methods for WLAN IQ measurements
└ IEEE 802.11be EHT MU PPDU (DL) / IEEE 802.11be EHT trigger-based
PPDU (UL)......................................................................................................53
Spectrum Flatness........................................................................................................ 54
Spectrum Flatness Result Summary.............................................................................56
Unused Tone Error........................................................................................................ 56
Unused Tone Error Summary........................................................................................57
AM/AM
This result display shows the measured and the reference signal in the time domain.
For each sample, the x-axis value represents the amplitude of the reference signal and
the y-axis value represents the amplitude of the measured signal.
The reference signal is derived from the measured signal after frequency and time synchronization, channel equalization and demodulation of the signal. The equivalent time
domain representation of the reference signal is calculated by reapplying all the impairments that were removed before demodulation.
The trace is determined by calculating a polynomial regression model of a specified
degree (see "Polynomial degree for curve fitting" on page 170) for the scattered measurement vs. reference signal data. The resulting regression polynomial is indicated in
the window title of the result display.
Note: The measured signal and reference signal are complex signals.
This result display is not available for single-carrier measurements (IEEE 802.11b, g
(DSSS)) or IEEE 802.11ax, be.
Remote command:
LAY:ADD? '1',RIGH,AMAM, see LAYout:ADD[:WINDow]? on page 306
Or:
CONFigure:BURSt:AM:AM[:IMMediate] on page 313
Polynomial degree:
CONFigure:BURSt:AM:AM:POLYnomial on page 320
Results:
TRACe[:DATA]?, see Chapter 8.6.3.1, "AM/AM", on page 356
AM/PM
This result display shows the measured and the reference signal in the time domain.
For each sample, the x-axis value represents the amplitude of the reference signal.
The y-axis value represents the angle difference of the measured signal minus the reference signal.
23User Manual 1176.8974.02 ─ 12

R&S®VSE-K91
WLAN I/Q measurement (modulation accuracy, flatness and tolerance)
Evaluation methods for WLAN IQ measurements
This result display is not available for single-carrier measurements (IEEE 802.11b, g
(DSSS)).
Remote command:
LAY:ADD? '1',RIGH,AMPM, see LAYout:ADD[:WINDow]? on page 306
Or:
CONFigure:BURSt:AM:PM[:IMMediate] on page 314
Querying results:
TRACe[:DATA]?, see Chapter 8.6.3.2, "AM/PM", on page 356
AM/EVM
This result display shows the measured and the reference signal in the time domain.
For each sample, the x-axis value represents the amplitude of the reference signal.
The y-axis value represents the length of the error vector between the measured signal
and the reference signal.
The length of the error vector is normalized with the power of the corresponding reference signal sample.
This result display is not available for single-carrier measurements (IEEE 802.11b, g
(DSSS)).
Remote command:
LAY:ADD? '1',RIGH,AMEV, see LAYout:ADD[:WINDow]? on page 306
Or:
CONFigure:BURSt:AM:EVM[:IMMediate] on page 314
24User Manual 1176.8974.02 ─ 12

R&S®VSE-K91
WLAN I/Q measurement (modulation accuracy, flatness and tolerance)
Evaluation methods for WLAN IQ measurements
Querying results:
TRACe[:DATA]?, see Chapter 8.6.3.3, "AM/EVM", on page 356
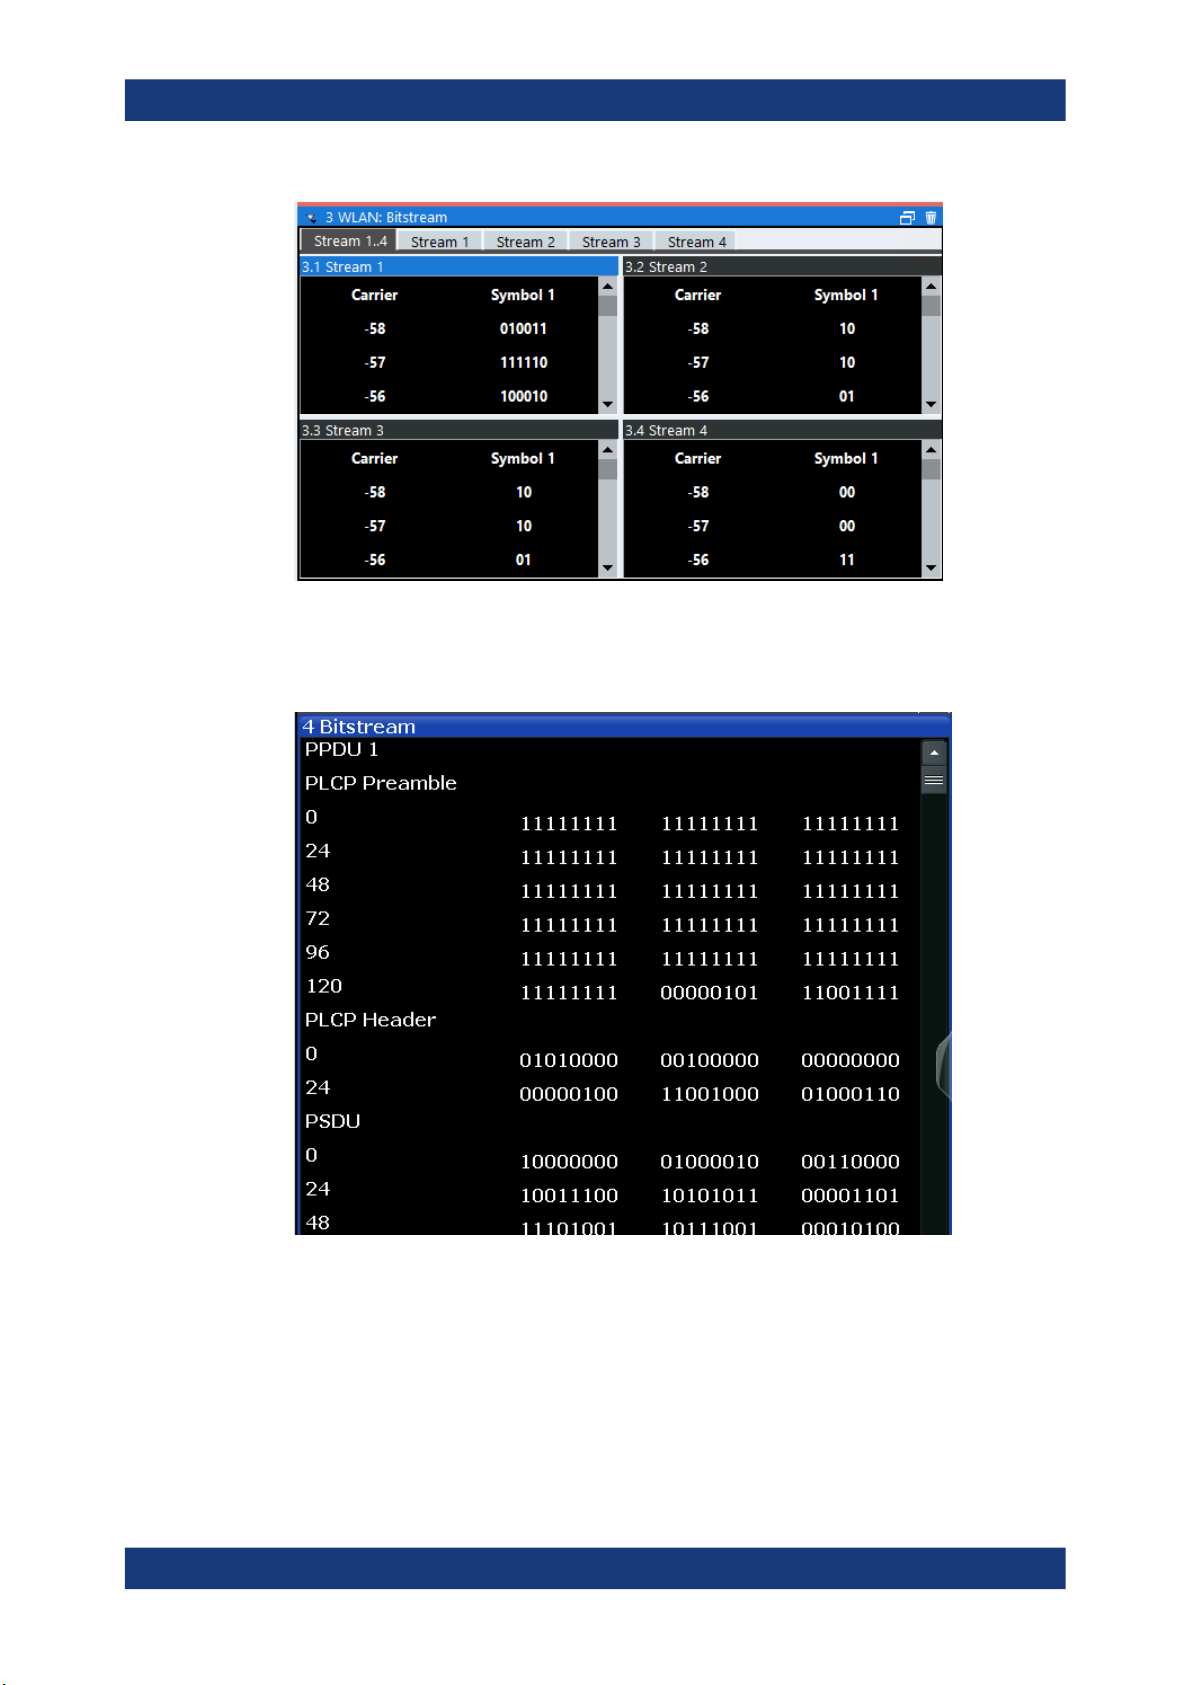
Bitstream
This result display shows a demodulated payload data stream for all analyzed PPDUs
of the currently captured I/Q data as indicated in the "Magnitude Capture" display. The
bitstream is derived from the constellation diagram points using the 'constellation bit
encoding' from the corresponding WLAN standard. See, for example, IEEE Std.
802.11-2012 'Fig. 18-10 BPSK, QPSK, 16-QAM and 64-QAM constellation bit encoding'. Thus, the bitstream is NOT channel-decoded.
For multicarrier measurements (IEEE 802.11a, ac, g (OFDM), j, n, p), the results are
grouped by symbol and carrier.
Figure 2-8: Bitstream result display for IEEE 802.11a, ac, g (OFDM), j, n, p standards
For MIMO measurements (IEEE 802.11ac, ax, n, be), the results are grouped by
stream, symbol and carrier.
25User Manual 1176.8974.02 ─ 12
R&S®VSE-K91
WLAN I/Q measurement (modulation accuracy, flatness and tolerance)
Evaluation methods for WLAN IQ measurements
Figure 2-9: Bitstream result display for IEEE 802.11n MIMO measurements
For single-carrier measurements (IEEE 802.11b, g (DSSS)) the results are grouped by
PPDU.
Figure 2-10: Bitstream result display for IEEE 802.11b, g (DSSS) standards
The numeric trace results for this evaluation method are described in Chapter 8.6.3.4,
"Bitstream", on page 356.
Remote command:
LAY:ADD? '1',RIGH, BITS, see LAYout:ADD[:WINDow]? on page 306
Or:
CONFigure:BURSt:STATistics:BSTReam[:IMMediate] on page 317
26User Manual 1176.8974.02 ─ 12

R&S®VSE-K91
WLAN I/Q measurement (modulation accuracy, flatness and tolerance)
Evaluation methods for WLAN IQ measurements
Querying results:
TRACe[:DATA]?, see Chapter 8.6.3.4, "Bitstream", on page 356
Constellation
This result display shows the in-phase and quadrature phase results for all payload
symbols and all carriers for the analyzed PPDUs of the current capture buffer. The
Tracking/Channel Estimation according to the user settings is applied.
The inphase results (I) are displayed on the x-axis, the quadrature phase (Q) results on
the y-axis.
Figure 2-11: Constellation result display for IEEE 802.11n MIMO measurements
The numeric trace results for this evaluation method are described in Chapter 8.6.3.5,
"Constellation", on page 357.
Remote command:
LAY:ADD? '1',RIGH, CONS, see LAYout:ADD[:WINDow]? on page 306
Or:
CONFigure:BURSt:CONSt:CSYMbol[:IMMediate] on page 314
27User Manual 1176.8974.02 ─ 12
R&S®VSE-K91
WLAN I/Q measurement (modulation accuracy, flatness and tolerance)
Evaluation methods for WLAN IQ measurements
Querying results:
TRACe[:DATA]?, see Chapter 8.6.3.5, "Constellation", on page 357
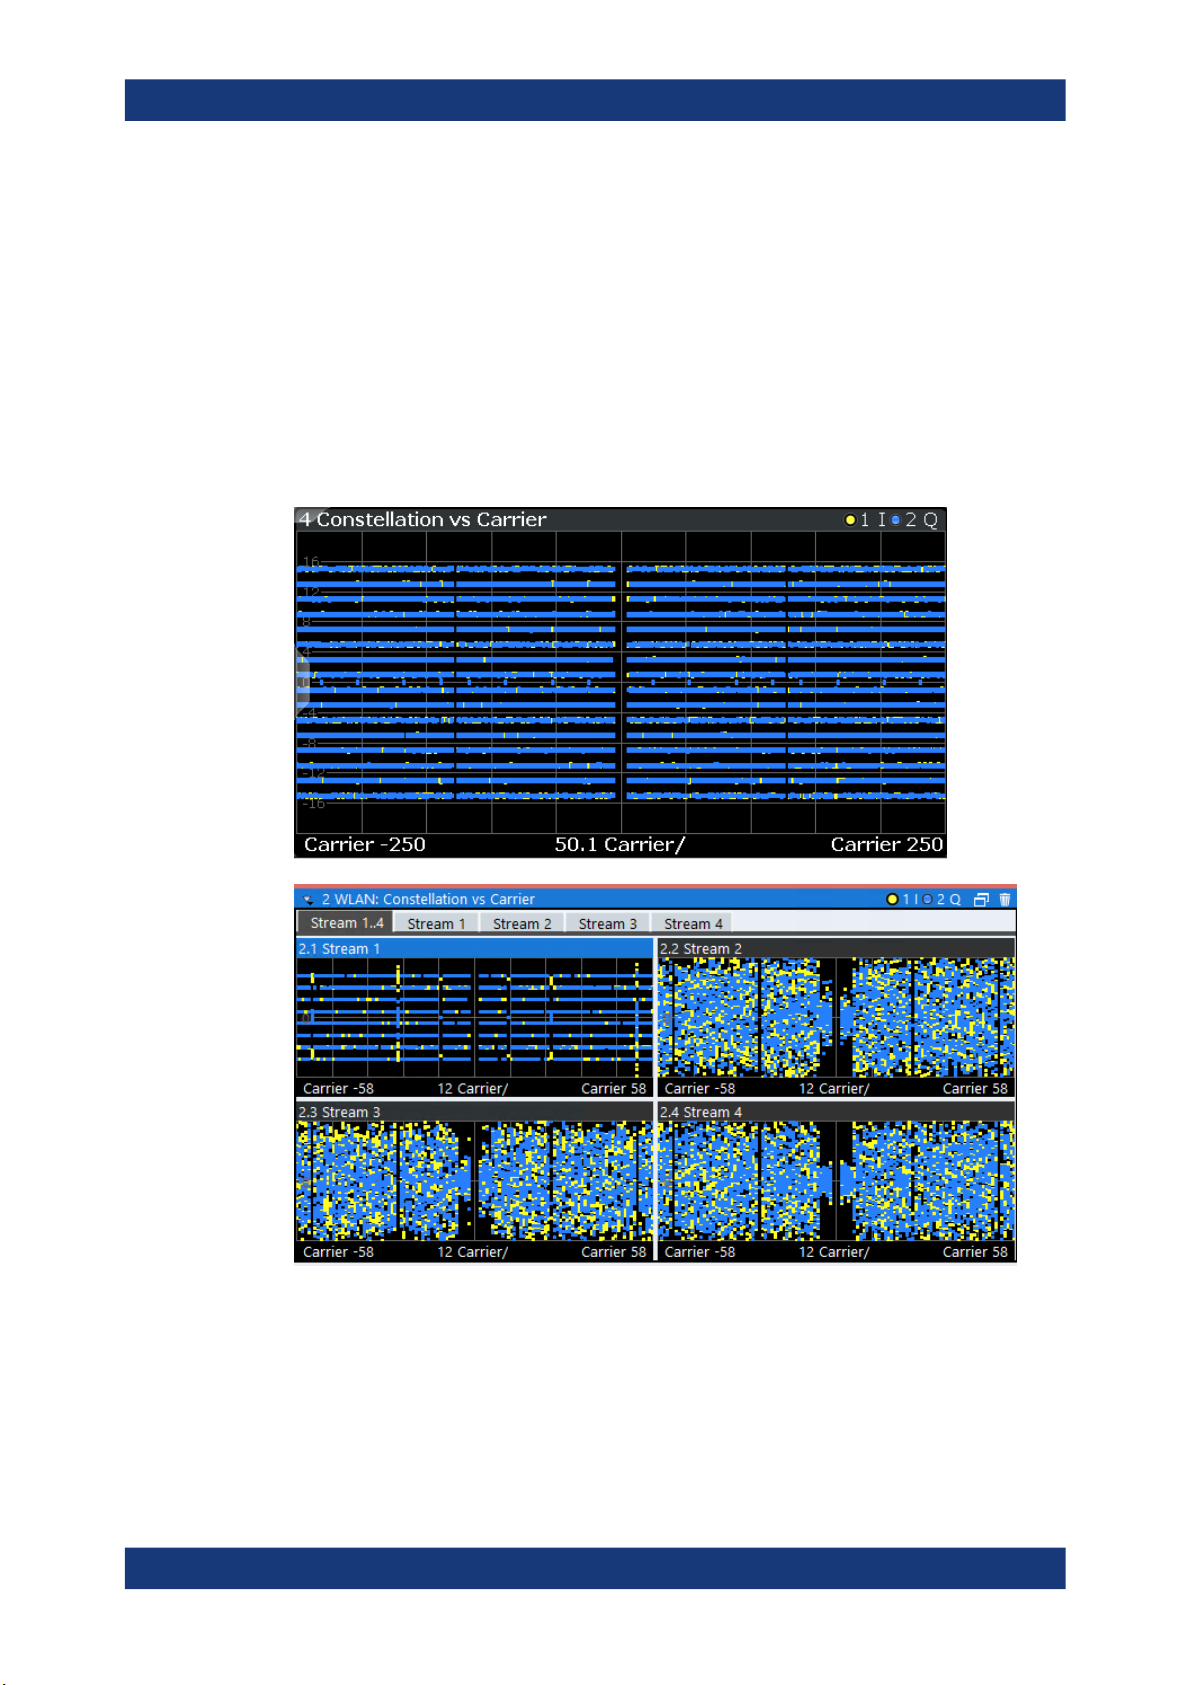
Constellation vs Carrier
This result display shows the in-phase and quadrature phase results for all payload
symbols and all carriers for the analyzed PPDUs of the current capture buffer. The
Tracking/Channel Estimation according to the user settings is applied.
This result display is not available for single-carrier measurements (IEEE 802.11b, g
(DSSS)).
The x-axis represents the carriers. The magnitude of the in-phase and quadrature part
is shown on the y-axis, both are displayed as separate traces (I-> trace 1, Q-> trace 2).
Figure 2-12: Constellation vs. carrier result display for IEEE 802.11n MIMO measurements
The numeric trace results for this evaluation method are described in Chapter 8.6.3.6,
"Constellation vs carrier", on page 358.
Remote command:
LAY:ADD? '1',RIGH, CVC, see LAYout:ADD[:WINDow]? on page 306
Or:
28User Manual 1176.8974.02 ─ 12
R&S®VSE-K91
WLAN I/Q measurement (modulation accuracy, flatness and tolerance)
Evaluation methods for WLAN IQ measurements
CONFigure:BURSt:CONSt:CCARrier[:IMMediate] on page 314
Querying results:
TRACe[:DATA]?, see Chapter 8.6.3.6, "Constellation vs carrier", on page 358
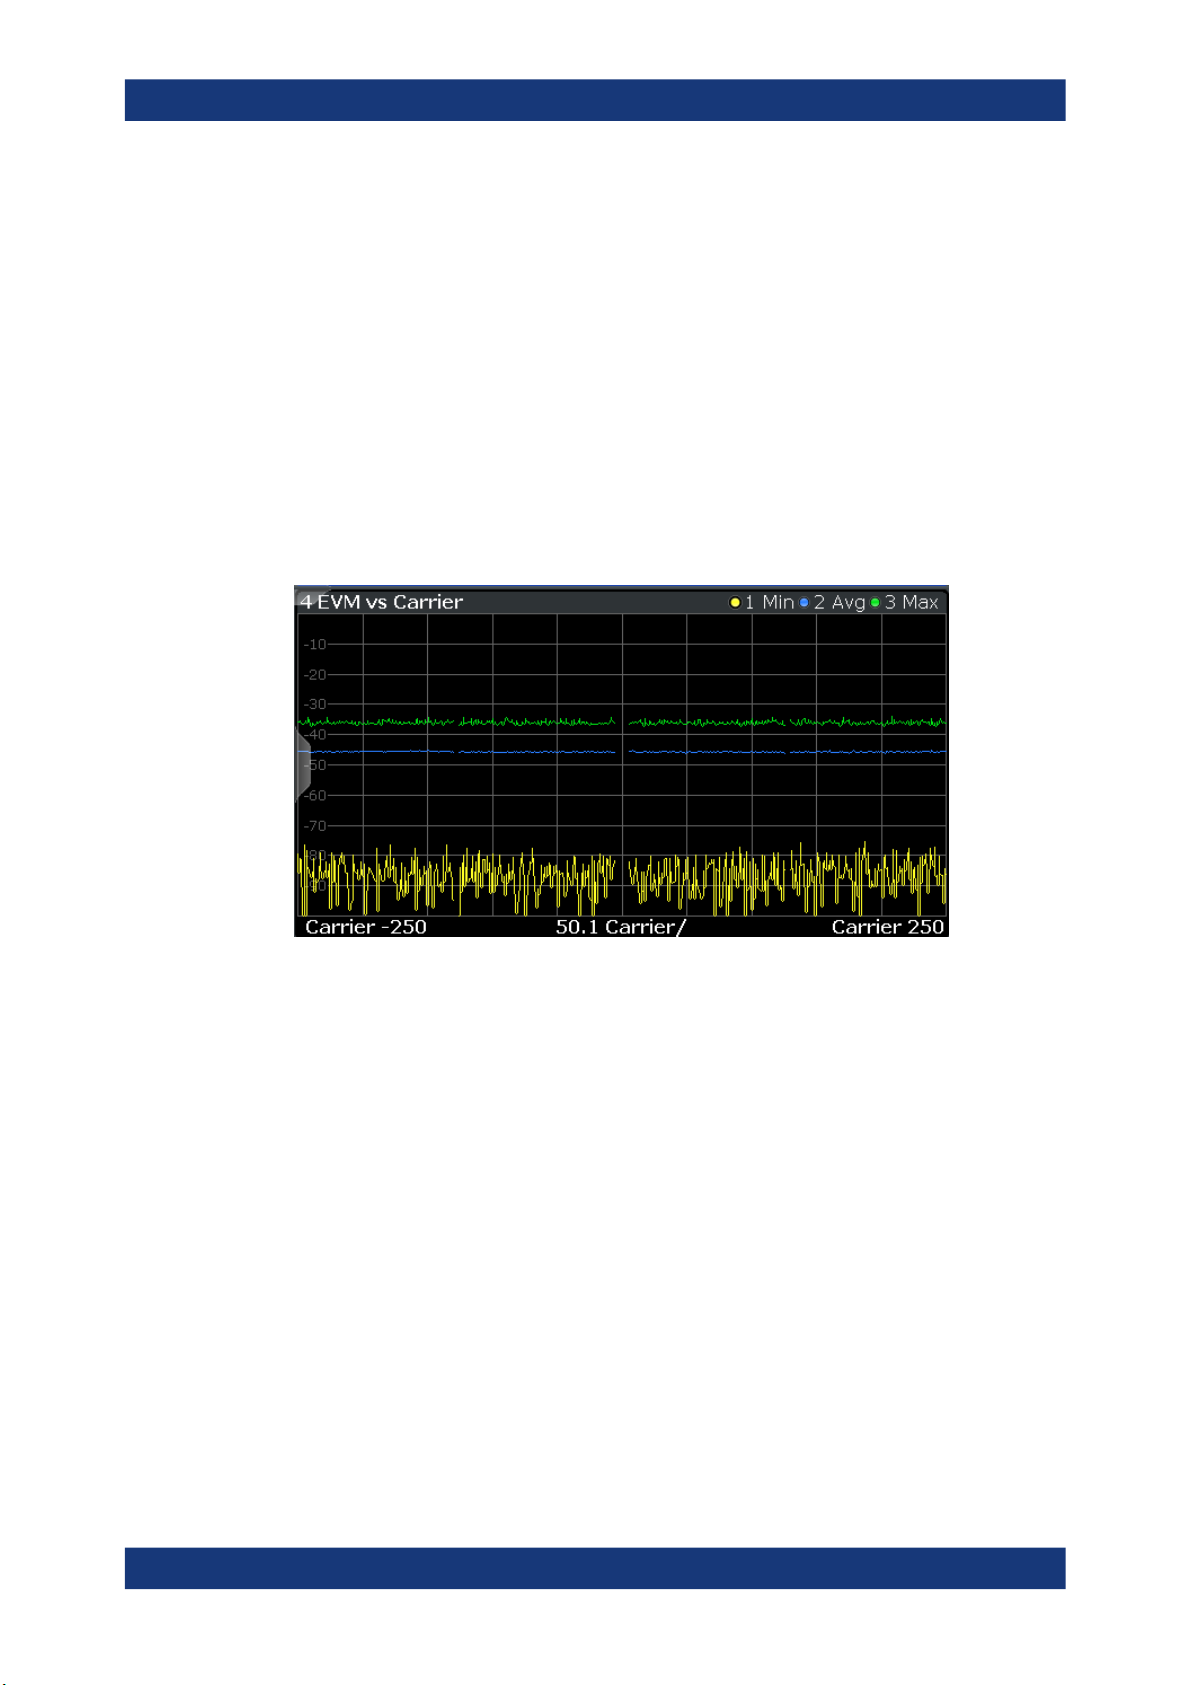
EVM vs Carrier
This result display shows all EVM values recorded on a per-subcarrier basis over the
number of analyzed PPDUs as defined by the "Evaluation Range > Statistics". The
Tracking/Channel Estimation according to the user settings is applied (see Chap-
ter 4.6, "Tracking and channel estimation", on page 127). The minimum, average and
maximum traces are displayed.
For IEEE 802.11be measurements, the results are displayed for the RUs selected in
the PPDU configuration, see "Result displays for multi-user PPDUs" on page 149.
This result display is not available for single-carrier measurements (IEEE 802.11b, g
(DSSS)).
The numeric trace results for this evaluation method are described in Chapter 8.6.3.9,
"EVM vs carrier", on page 359.
Remote command:
LAY:ADD? '1',RIGH, EVC, see LAYout:ADD[:WINDow]? on page 306
Or:
CONFigure:BURSt:EVM:ECARrier[:IMMediate] on page 314
Querying results:
TRACe[:DATA]?, see Chapter 8.6.3.9, "EVM vs carrier", on page 359
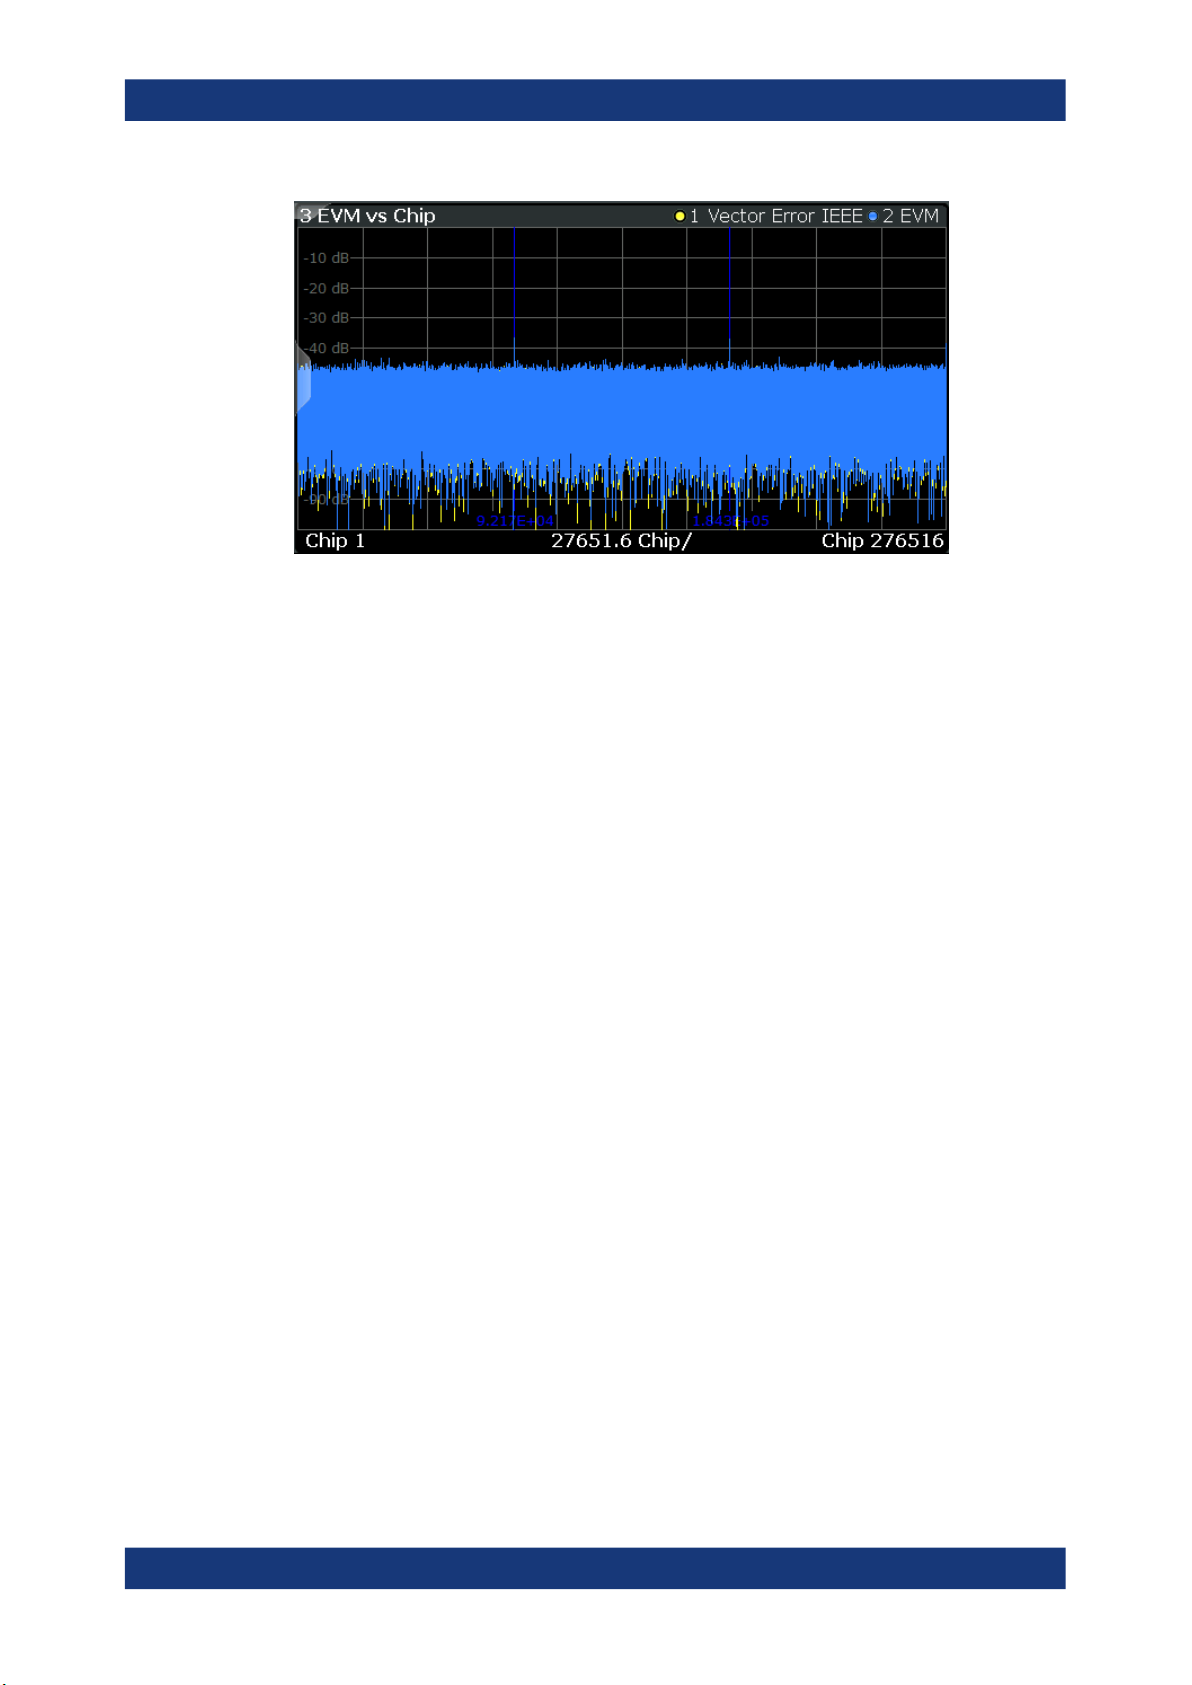
EVM vs Chip
This result display shows the error vector magnitude per chip.
This result display is only available for single-carrier measurements (IEEE 802.11b, g
(DSSS)).
Since the R&S VSE WLAN application provides two different methods to calculate the
EVM, two traces are displayed:
29User Manual 1176.8974.02 ─ 12
R&S®VSE-K91
WLAN I/Q measurement (modulation accuracy, flatness and tolerance)
Evaluation methods for WLAN IQ measurements
●
"Vector Error IEEE" shows the error vector magnitude as defined in the IEEE
802.11b or g (DSSS) standards (see also "Error vector magnitude (EVM) - IEEE
802.11b or g (DSSS) method" on page 70)
●
"EVM" shows the error vector magnitude calculated with an alternative method that
provides higher accuracy of the estimations (see also "Error vector magnitude
(EVM) - R&S VSE method" on page 70).
Remote command:
LAY:ADD? '1',RIGH, EVCH, see LAYout:ADD[:WINDow]? on page 306
Or:
CONFigure:BURSt:EVM:EVCHip[:IMMediate] on page 314
CONFigure:BURSt:EVM:ESYMbol[:IMMediate] on page 315
Querying results:
TRACe[:DATA]?, see Chapter 8.6.3.10, "EVM vs chip", on page 360
EVM vs Symbol
This result display shows all EVM values calculated on a per-carrier basis over the
number of analyzed PPDUs as defined by the "Evaluation Range > Statistics" settings
(see "PPDU Statistic Count / No of PPDUs to Analyze" on page 164). The Tracking/
Channel Estimation according to the user settings is applied (see Chapter 4.6, "Track-
ing and channel estimation", on page 127). The minimum, average and maximum
traces are displayed.
30User Manual 1176.8974.02 ─ 12
 Loading...