

Rohde&Schwarz R&S®VSE-K7 Analog Demodulation User Manual
R&S®VSE-K7
AM/FM/PM Modulation Analysis
Application
User Manual
(;ÚçW2)
1176893902
Version 12

This manual applies to the following software, version 2.20 and later:
●
R&S®VSE Enterprise Edition base software (1345.1105.06)
●
R&S®VSE Basic Edition base software (1345.1011.06)
The following software options are described:
●
R&S VSE-K7 (1320.7539.xx)
●
R&S®CMA-K310 (1320.7945.xx)
●
R&S VSE-KT7 (1345.1928.02)
© 2022 Rohde & Schwarz GmbH & Co. KG
Muehldorfstr. 15, 81671 Muenchen, Germany
Phone: +49 89 41 29 - 0
Email: info@rohde-schwarz.com
Internet: www.rohde-schwarz.com
Subject to change – data without tolerance limits is not binding.
R&S® is a registered trademark of Rohde & Schwarz GmbH & Co. KG.
All other trademarks are the properties of their respective owners.
1176.8939.02 | Version 12 | R&S®VSE-K7
Throughout this manual, products from Rohde & Schwarz are indicated without the ® symbol, e.g. R&S®VSE is indicated as
R&S VSE.

R&S®VSE-K7
1.1 About this manual.........................................................................................................9
1.2 Typographical conventions........................................................................................10
2.1 Starting the R&S VSE AM/FM/PM Modulation Analysis application.......................11
2.2 Understanding the display information.................................................................... 12
4.1 Demodulation process............................................................................................... 25
Contents
Contents
1 Preface.................................................................................................... 9
2 Welcome to the R&S VSE AM/FM/PM Modulation Analysis applica-
tion.........................................................................................................11
3 Measurements and result displays.................................................... 15
4 Measurement basics............................................................................25
4.2 Demodulation bandwidth........................................................................................... 27
4.3 Sample rate and demodulation bandwidth...............................................................27
4.4 AF filters.......................................................................................................................28
4.5 Time domain zoom......................................................................................................28
4.6 Working with spectrograms.......................................................................................30
4.6.1 Time frames.................................................................................................................. 32
4.6.2 Color maps....................................................................................................................33
5 Configuration........................................................................................36
5.1 Configuration according to digital standards.......................................................... 36
5.2 Configuration overview.............................................................................................. 38
5.3 Input and frontend settings........................................................................................40
5.3.1 Input source settings..................................................................................................... 40
5.3.1.1 Radio frequency input................................................................................................... 40
5.3.1.2 I/Q file input................................................................................................................... 46
5.3.2 Amplitude...................................................................................................................... 48
5.3.3 Frequency..................................................................................................................... 52
5.4 Trigger source settings.............................................................................................. 54
5.5 Data acquisition.......................................................................................................... 58
5.5.1 Bandwidth settings........................................................................................................ 58
5.5.2 Capture settings............................................................................................................ 59
3User Manual 1176.8939.02 ─ 12

R&S®VSE-K7
5.6 Demodulation.............................................................................................................. 62
5.6.1 Basic demodulation measurement parameters (Demod)..............................................62
5.6.2 Demodulation spectrum................................................................................................ 66
5.6.2.1 AF evaluation................................................................................................................ 66
5.6.2.2 RF evaluation................................................................................................................ 67
5.6.3 AF filter..........................................................................................................................69
5.6.4 Scaling.......................................................................................................................... 72
5.6.4.1 AF evaluation................................................................................................................ 72
5.6.4.2 RF evaluation................................................................................................................ 74
5.6.5 Units.............................................................................................................................. 76
5.6.6 Result table settings......................................................................................................77
5.6.7 Settling time.................................................................................................................. 79
5.7 Adjusting settings automatically...............................................................................81
Contents
6 Analysis................................................................................................ 84
6.1 Trace settings..............................................................................................................84
6.2 Trace / data export configuration.............................................................................. 87
6.3 Spectrogram settings................................................................................................. 90
6.3.1 General spectrogram settings....................................................................................... 90
6.3.2 Color map settings........................................................................................................ 92
6.4 Working with markers in the R&S VSE AM/FM/PM Modulation Analysis applica-
tion................................................................................................................................94
6.4.1 Marker settings..............................................................................................................95
6.4.1.1 Individual marker setup................................................................................................. 95
6.4.1.2 General marker settings................................................................................................98
6.4.2 Marker search settings and positioning functions....................................................... 100
6.4.2.1 Marker search settings................................................................................................101
6.4.2.2 Positioning functions................................................................................................... 102
6.4.3 Marker function configuration......................................................................................103
6.4.3.1 Measuring characteristic bandwidths (n db down marker)..........................................104
6.4.3.2 Phase noise measurement marker............................................................................. 106
6.4.3.3 Marker peak list...........................................................................................................109
6.4.3.4 Deactivating all marker functions.................................................................................111
6.5 Working with limit lines in the R&S VSE AM/FM/PM Modulation Analysis applica-
tion..............................................................................................................................112
4User Manual 1176.8939.02 ─ 12

R&S®VSE-K7
6.5.1 Basics on limit lines..................................................................................................... 112
6.5.2 Limit line settings and functions...................................................................................115
6.5.2.1 Limit line management................................................................................................ 116
6.5.2.2 Limit line details...........................................................................................................119
6.5.3 How to define limit lines.............................................................................................. 121
6.6 Zoom functions......................................................................................................... 124
9.1 Introduction............................................................................................................... 130
9.1.1 Conventions used in descriptions............................................................................... 130
Contents
7 How to perform measurements in the R&S VSE AM/FM/PM Modula-
tion Analysis application...................................................................126
8 Optimizing and troubleshooting the measurement........................ 128
9 Remote commands for analog modulation analysis...................... 129
9.1.2 Long and short form.................................................................................................... 131
9.1.3 Numeric suffixes..........................................................................................................131
9.1.4 Optional keywords.......................................................................................................131
9.1.5 Alternative keywords................................................................................................... 132
9.1.6 SCPI parameters.........................................................................................................132
9.1.6.1 Numeric values........................................................................................................... 132
9.1.6.2 Boolean....................................................................................................................... 133
9.1.6.3 Character data............................................................................................................ 134
9.1.6.4 Character strings.........................................................................................................134
9.1.6.5 Block data................................................................................................................... 134
9.2 Common suffixes...................................................................................................... 134
9.3 Activating AM/FM/PM Modulation Analysis measurements................................. 135
9.4 Configuring the measurement................................................................................. 135
9.4.1 Restoring the default configuration (preset)................................................................ 135
9.4.2 Managing standard settings........................................................................................ 136
9.4.3 Configuring data input................................................................................................. 137
9.4.3.1 RF input.......................................................................................................................137
9.4.3.2 Configuring oscilloscope baseband input....................................................................148
9.4.3.3 Using external mixers..................................................................................................152
Basic settings.............................................................................................................. 152
Mixer settings.............................................................................................................. 154
5User Manual 1176.8939.02 ─ 12

R&S®VSE-K7
9.4.3.4 Remote commands for external frontend control........................................................ 161
9.4.3.5 Working with power sensors....................................................................................... 170
9.4.4 Frequency settings......................................................................................................178
9.4.5 Configuring the vertical axis (amplitude, scaling)........................................................180
9.4.5.1 Amplitude settings.......................................................................................................180
9.4.5.2 Configuring the attenuation......................................................................................... 182
9.4.5.3 Configuring a preamplifier........................................................................................... 185
9.4.5.4 Scaling the Y-axis........................................................................................................186
Contents
Programming example: working with an external mixer..............................................160
Commands for initial configuration..............................................................................161
Commands for alignment............................................................................................ 168
Configuring power sensors......................................................................................... 171
Configuring power sensor measurements.................................................................. 172
9.4.6 Configuring data acquisition........................................................................................189
9.4.7 Triggering.................................................................................................................... 193
9.4.7.1 Configuring the triggering conditions...........................................................................193
9.4.7.2 Configuring the trigger output......................................................................................201
9.4.8 Configuring demodulation........................................................................................... 203
9.4.8.1 Basic demodulation settings....................................................................................... 204
9.4.8.2 Time domain zoom settings........................................................................................ 206
9.4.8.3 Configuring the demodulation spectrum..................................................................... 208
AF evaluation.............................................................................................................. 208
RF evaluation.............................................................................................................. 210
9.4.8.4 (Post-processing) AF filters......................................................................................... 211
9.4.8.5 Defining the scaling and units..................................................................................... 216
9.4.8.6 Scaling for AF evaluation............................................................................................ 216
9.4.8.7 Scaling for RF evaluation............................................................................................ 217
9.4.8.8 Units............................................................................................................................ 217
9.4.8.9 Relative demodulation results..................................................................................... 218
9.4.8.10 Settling time................................................................................................................ 221
9.4.9 Adjusting settings automatically.................................................................................. 222
9.4.10 Configuring standard traces........................................................................................ 226
9.4.11 Configuring spectrograms........................................................................................... 232
6User Manual 1176.8939.02 ─ 12

R&S®VSE-K7
9.4.11.1 Configuring a spectrogram measurement...................................................................232
9.4.11.2 Configuring the color map........................................................................................... 236
9.5 Configuring the result display................................................................................. 238
9.5.1 Global layout commands.............................................................................................238
9.5.2 Working with windows in the display...........................................................................241
9.5.3 General window commands........................................................................................247
9.6 Retrieving results......................................................................................................248
9.6.1 Retrieving trace results............................................................................................... 248
9.6.2 Exporting trace results................................................................................................ 251
9.6.3 Retrieving result summary values............................................................................... 254
9.7 Analyzing results...................................................................................................... 258
9.7.1 Working with markers remotely...................................................................................258
9.7.1.1 Setting up individual markers...................................................................................... 259
Contents
9.7.1.2 General marker settings..............................................................................................266
9.7.1.3 Marker search (spectrograms).................................................................................... 268
Using markers............................................................................................................. 268
Using delta markers.................................................................................................... 272
9.7.1.4 Marker search settings................................................................................................276
9.7.1.5 Positioning the marker................................................................................................ 277
Positioning normal markers.........................................................................................277
Positioning delta markers............................................................................................280
9.7.1.6 Configuring special marker functions.......................................................................... 282
Fixed reference marker settings..................................................................................283
Marker peak lists......................................................................................................... 285
N db down marker.......................................................................................................289
Phase noise measurement marker............................................................................. 292
9.7.2 Defining limit checks................................................................................................... 293
9.7.2.1 Configuring limit lines.................................................................................................. 293
9.7.2.2 Managing limit lines.....................................................................................................303
9.7.2.3 Checking the results of a limit check...........................................................................305
9.7.2.4 Programming example: using limit lines......................................................................306
Example: configuring limit lines...................................................................................306
Example: performing a limit check.............................................................................. 307
7User Manual 1176.8939.02 ─ 12

R&S®VSE-K7
9.7.3 Zooming into the display............................................................................................. 309
9.7.3.1 Using the single zoom.................................................................................................309
9.7.3.2 Using the multiple zoom..............................................................................................310
9.8 Programming example............................................................................................. 312
A.1 Menu reference..........................................................................................................315
A.1.1 Common R&S VSE menus......................................................................................... 315
A.1.1.1 File menu.................................................................................................................... 315
A.1.1.2 Window menu............................................................................................................. 316
A.1.1.3 Help menu...................................................................................................................317
A.1.2 Analog demodulation menus.......................................................................................317
Contents
Annex.................................................................................................. 315
A Reference............................................................................................315
A.1.2.1 Edit menu.................................................................................................................... 318
A.1.2.2 Input & output menu....................................................................................................318
A.1.2.3 Meas setup menu........................................................................................................318
A.1.2.4 Trace menu................................................................................................................. 319
A.1.2.5 Marker menu............................................................................................................... 319
A.1.2.6 Limits menu.................................................................................................................320
A.2 Reference of toolbar functions................................................................................ 320
A.3 Predefined standards and settings......................................................................... 324
A.4 Formats for returned values: ASCII format and binary format............................. 326
A.5 Reference: ASCII file export format.........................................................................326
List of Remote Commands (Analog Modulation Analysis)............ 329
Index....................................................................................................339
8User Manual 1176.8939.02 ─ 12

R&S®VSE-K7
1.1 About this manual
About this manual
1 Preface
This R&S VSE AM/FM/PM Modulation Analysis User Manual provides all the information specific to the application. All general software functions and settings common
to all applications and operating modes are described in the R&S VSE Base Software
User Manual.
The main focus in this manual is on the measurement results and the tasks required to
obtain them. The following topics are included:
●
Welcome to the R&S VSE AM/FM/PM Modulation Analysis application Application
Introduction to and getting familiar with the application
●
Measurements and Result Displays
Details on supported measurements and their result types
●
Measurement Basics
Background information on basic terms and principles in the context of the measurement
●
Configuration + Analysis
A concise description of all functions and settings available to configure measurements and analyze results with their corresponding remote control command
●
How to Perform Measurements in the R&S VSE AM/FM/PM Modulation Analysis application Application
The basic procedure to perform each measurement and step-by-step instructions
for more complex tasks or alternative methods
●
Measurement Examples
Detailed measurement examples to guide you through typical measurement scenarios and allow you to try out the application immediately
●
Optimizing and Troubleshooting the Measurement
Hints and tips on how to handle errors and optimize the measurement configuration
●
Remote Commands for R&S VSE AM/FM/PM Modulation Analysis application
Measurements
Remote commands required to configure and perform R&S VSE AM/FM/PM Modulation Analysis application measurements in a remote environment, sorted by tasks
(Commands required to set up the environment or to perform common tasks in the
software are provided in the R&S VSE Base Software User Manual)
Programming examples demonstrate the use of many commands and can usually
be executed directly for test purposes
●
List of remote commands
Alphabetical list of all remote commands described in the manual
●
Index
Preface
9User Manual 1176.8939.02 ─ 12

R&S®VSE-K7
1.2 Typographical conventions
Preface
Typographical conventions
The following text markers are used throughout this documentation:
Convention Description
"Graphical user interface elements"
[Keys] Key and knob names are enclosed by square brackets.
Filenames, commands,
program code
Input Input to be entered by the user is displayed in italics.
Links Links that you can click are displayed in blue font.
"References" References to other parts of the documentation are enclosed by quota-
All names of graphical user interface elements on the screen, such as
dialog boxes, menus, options, buttons, and softkeys are enclosed by
quotation marks.
Filenames, commands, coding samples and screen output are distinguished by their font.
tion marks.
10User Manual 1176.8939.02 ─ 12

R&S®VSE-K7
Welcome to the R&S VSE AM/FM/PM Modulation Analysis application
Starting the R&S VSE AM/FM/PM Modulation Analysis application
2 Welcome to the R&S VSE AM/FM/PM Mod-
ulation Analysis application
The (optional) R&S VSE AM/FM/PM Modulation Analysis application converts the
R&S VSE into an analog modulation analyzer for amplitude-, frequency- or phasemodulated signals. It measures not only characteristics of the useful modulation, but
also factors such as residual FM or synchronous modulation.
The digital signal processing in the R&S VSE is also ideally suited for demodulating
AM, FM, or PM signals. The R&S VSE AM/FM/PM Modulation Analysis application
provides the necessary measurement functions. This application is optional and
requires an additional license.
The R&S VSE AM/FM/PM Modulation Analysis application features:
●
AM, FM, and PM demodulation, with various result displays:
– Modulation signal versus time
– Spectrum of the modulation signal (FFT)
– RF signal power versus time
– Spectrum of the RF signal
●
Determining maximum, minimum and average or current values in parallel over a
selected number of measurements
●
Error-free AM to FM conversion and vice versa, without deviation errors, frequency
response or frequency drift at DC coupling
●
Relative demodulation, in relation to a user-defined or measured reference value
This user manual contains a description of the functionality that the application provides, including remote control operation.
All functions not discussed in this manual are the same as in the base unit and are
described in the R&S VSE User Manual.
2.1 Starting the R&S VSE AM/FM/PM Modulation Analysis application
The R&S VSE AM/FM/PM Modulation Analysis application is a separate application on
the R&S VSE. It is activated by creating a new measurement channel in "Analog
Demod" mode.
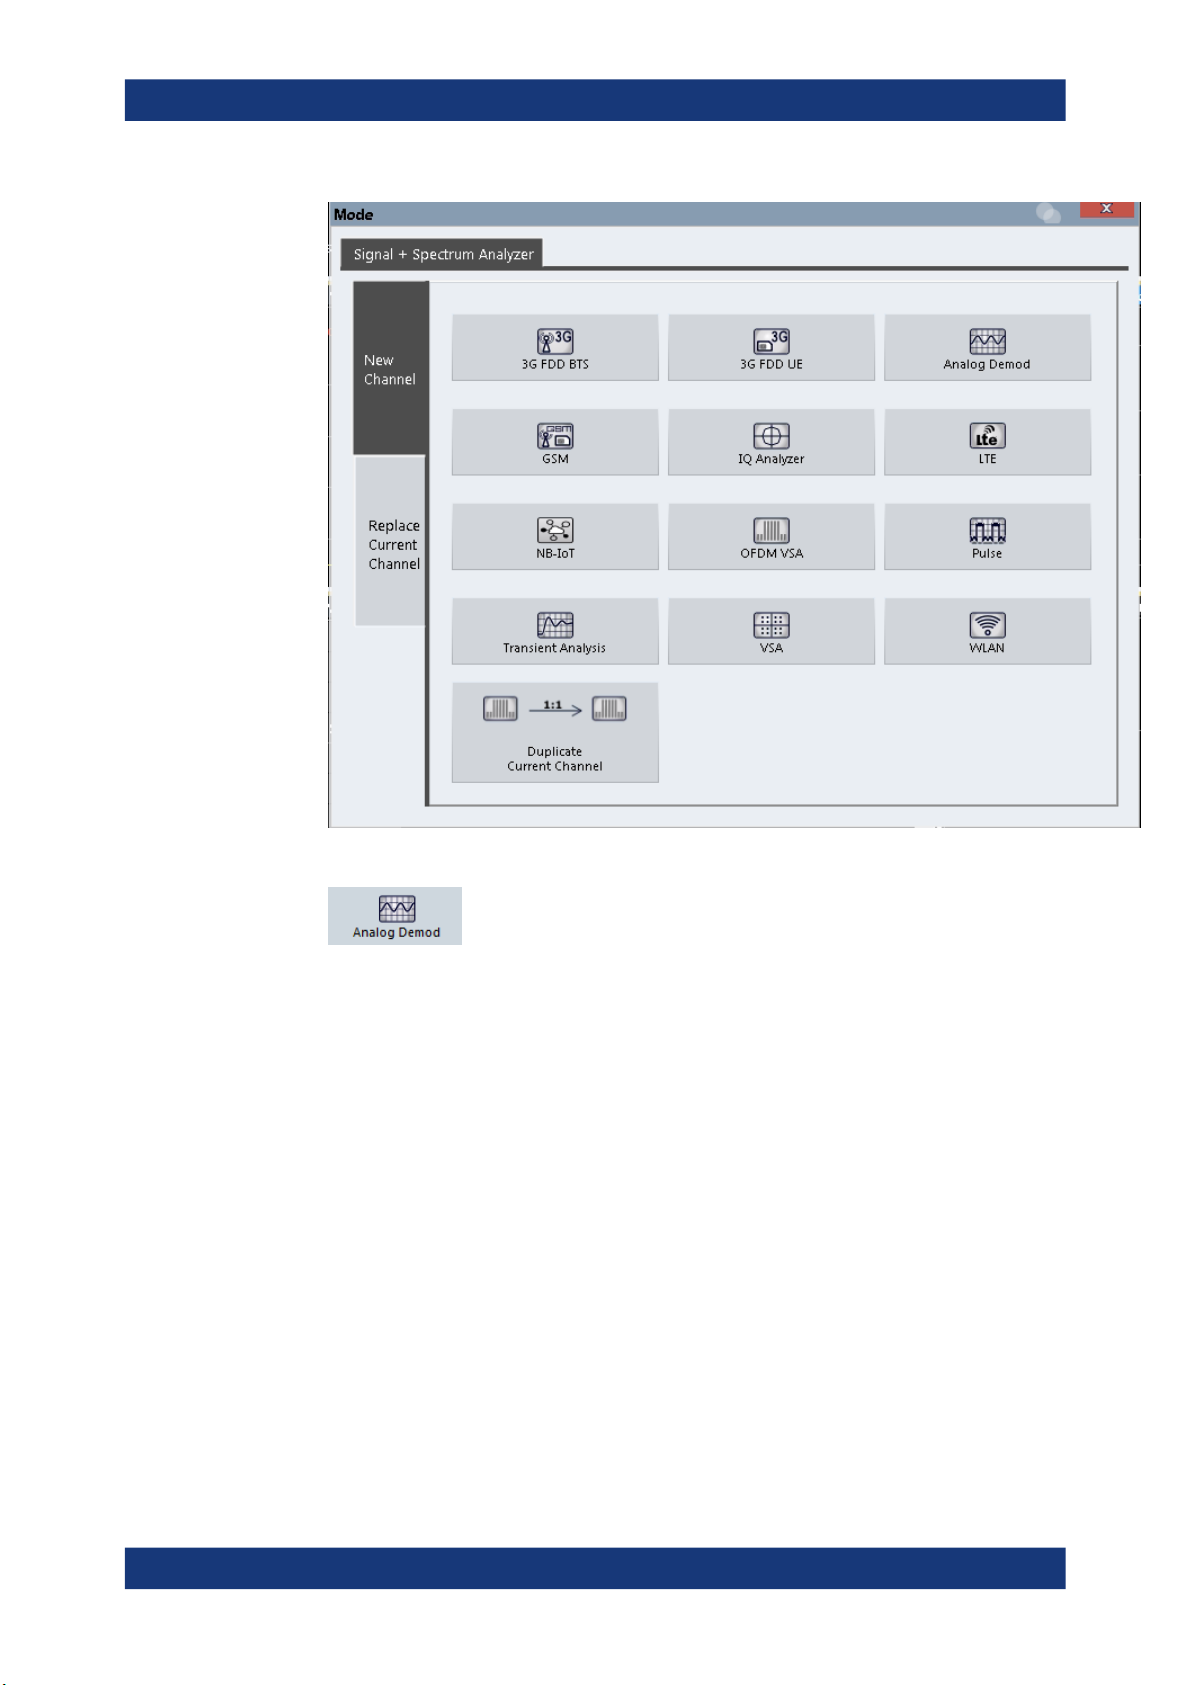
To activate the R&S VSE AM/FM/PM Modulation Analysis application
1.
Select the "Add Channel" function in the Sequence tool window.
A dialog box opens that contains all operating modes and applications currently
available in your R&S VSE.
11User Manual 1176.8939.02 ─ 12
R&S®VSE-K7
Welcome to the R&S VSE AM/FM/PM Modulation Analysis application
Understanding the display information
2. Select the "Analog Demodulation" item.
The R&S VSE opens a new measurement channel for the R&S VSE AM/FM/PM
Modulation Analysis application.
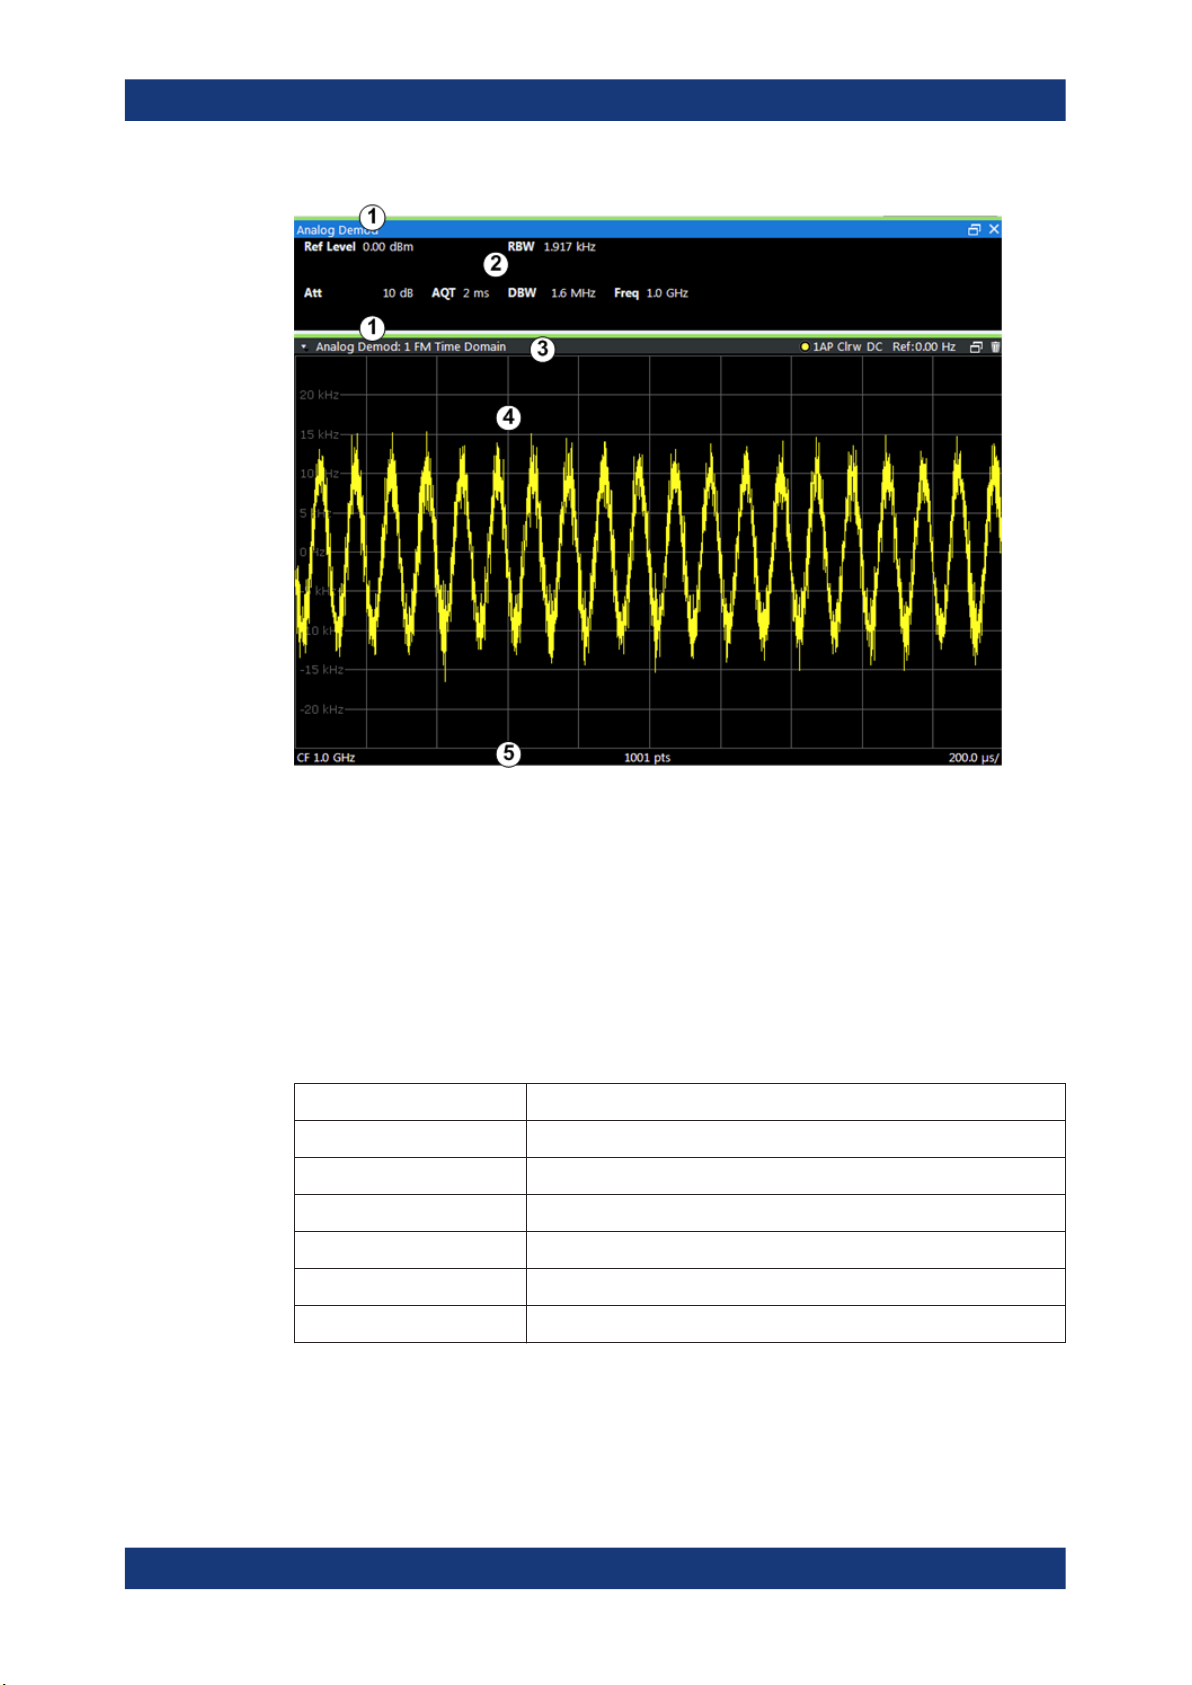
2.2 Understanding the display information
The following figure shows a measurement diagram during Analog Modulation Analysis . All different information areas are labeled. They are explained in more detail in the
following sections.
12User Manual 1176.8939.02 ─ 12
R&S®VSE-K7
Welcome to the R&S VSE AM/FM/PM Modulation Analysis application
Understanding the display information
1 = Color coding for windows of same channel
2 = Channel bar with measurement settings
3 = Window title bar with diagram-specific (trace) information
4 = Diagram area
5 = Diagram footer with diagram-specific information, depending on result display
Channel bar information
In the R&S VSE AM/FM/PM Modulation Analysis application, the R&S VSE shows the
following settings:
Table 2-1: Information displayed in the channel bar in the R&S VSE AM/FM/PM Modulation Analysis
Ref Level Reference level
m.+el.Att Mechanical and electronic RF attenuation
Offset Reference level offset
AQT Measurement time for data acquisition.
RBW Resolution bandwidth
DBW Demodulation bandwidth
Freq Center frequency for the RF signal
application
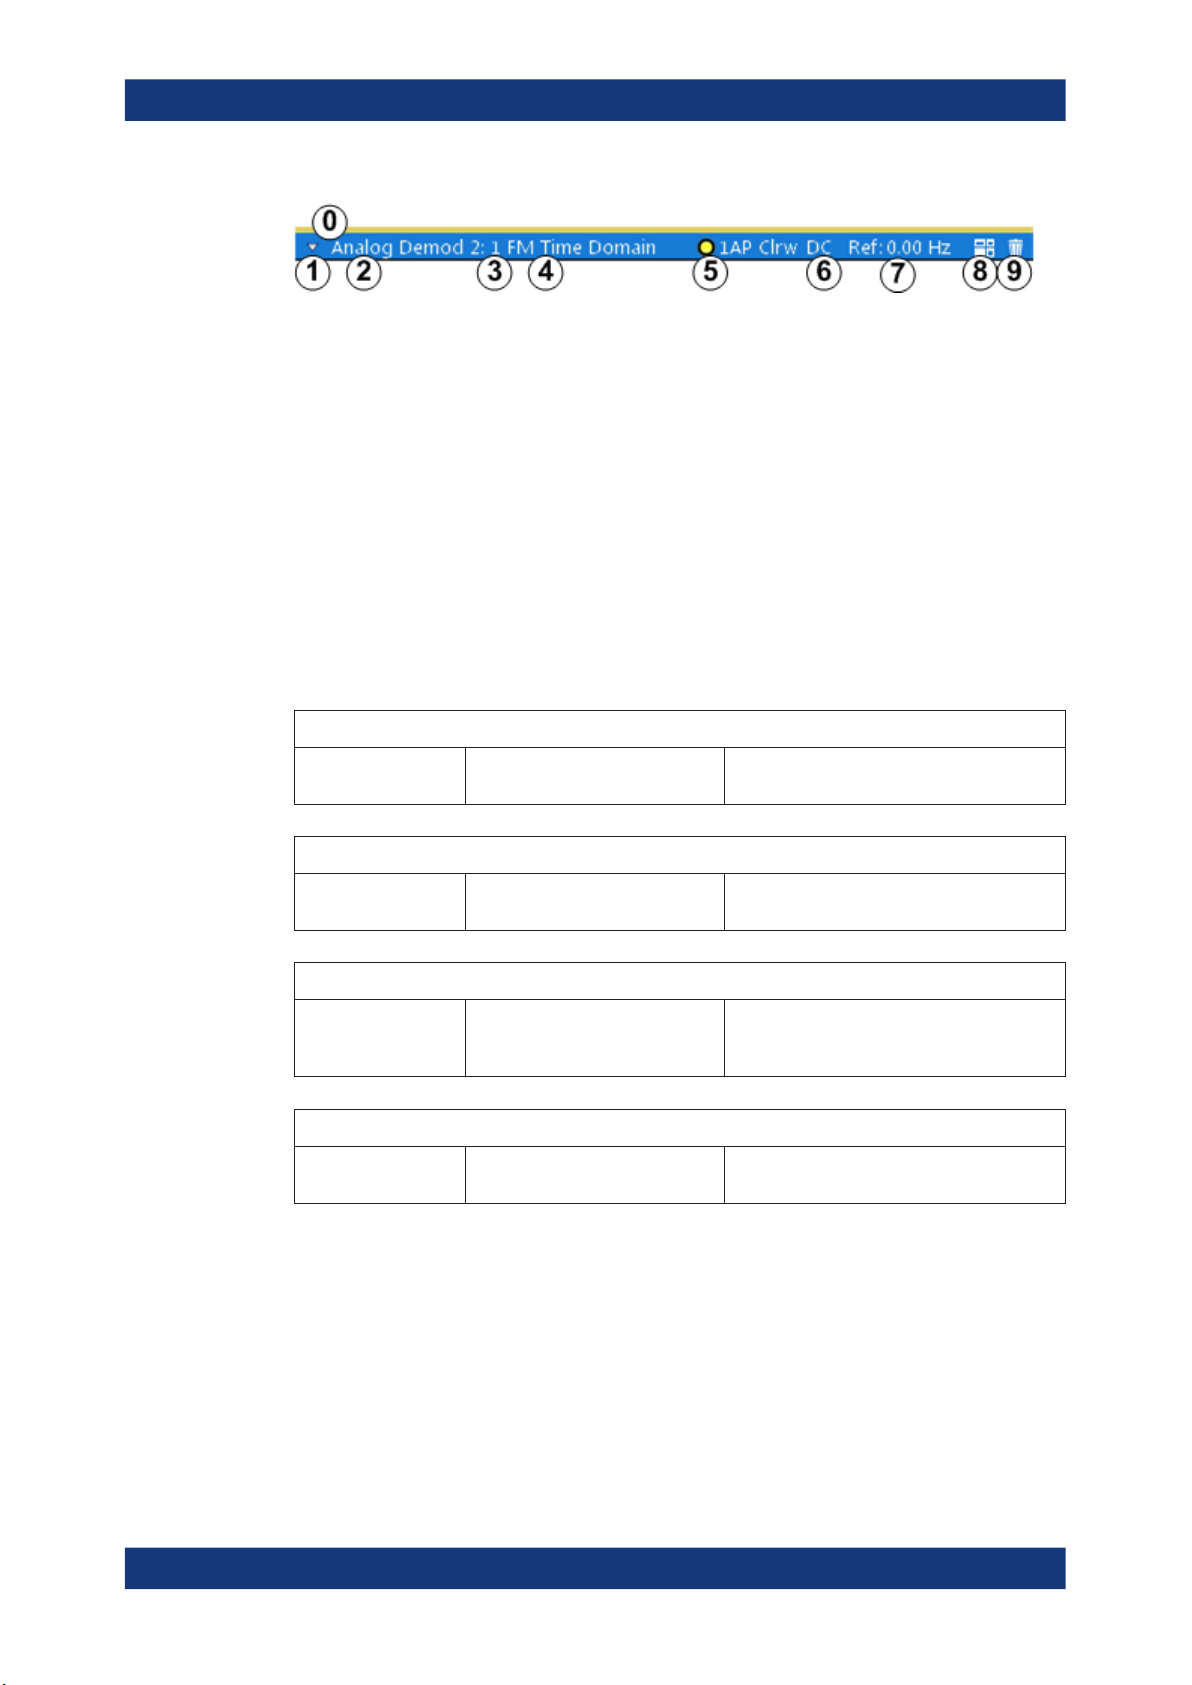
Window title bar information
For each diagram, the header provides the following information:
13User Manual 1176.8939.02 ─ 12
R&S®VSE-K7
Welcome to the R&S VSE AM/FM/PM Modulation Analysis application
Understanding the display information
Figure 2-1: Window title bar information in the R&S VSE AM/FM/PM Modulation Analysis application
0 = Color coding for windows of same channel
1 = Edit result display function
2 = Channel name
3 = Window number
4 = Window type
5 = Trace color, trace number, detector type, trade mode
6 = AF coupling (AC/DC), only in AF time domains, if applicable
7 = Reference value (at the defined reference position)
8 = Dock/undock window function
9 = Close window function
Diagram footer information
The diagram footer (beneath the diagram) contains the following information, depending on the evaluation:
RF Spectrum
CF: Center frequency
of input signal
RF Time domain
CF: Center frequency
of input signal
AF Spectrum
AF CF: center frequency of demodulated signal
AF Time domain
CF: Center frequency
of input signal
Sweep points Span: measured span
Sweep points Time per division
Sweep points AF Span: evaluated span
Sweep points Time per division
For most modes, the number of sweep points shown in the display are indicated in the
diagram footer. In zoom mode, the (rounded) number of currently displayed points are
indicated.
14User Manual 1176.8939.02 ─ 12
R&S®VSE-K7
Measurements and result displays
3 Measurements and result displays
Access: "Overview" > "Display Config"
Or: [MEAS] > "Display Config"
The data that was measured by the R&S VSE can be evaluated using various different
methods. In the Analog Modulation Analysis application, up to six evaluation methods
can be displayed simultaneously in separate windows. The results can be displayed as
absolute deviations or relative to a reference value or level.
The abbreviation "AF" (for Audio Frequency) refers to the demodulated AM, FM or PM
signal.
Result display windows
For each measurement, a separate channel is activated. Each channel can provide
multiple result displays, which are displayed in individual windows. The measurement
windows can be rearranged and configured in the R&S VSE to meet your requirements. All windows that belong to the same measurement (including the channel bar)
are indicated by a colored line at the top of the window title bar.
► To add further result displays for the AM/FM/PM Modulation Analysis channel,
select the
Window" menu item.
For details on working with channels and windows, see the "Operating Basics"
chapter in the R&S VSE Base Software User Manual.
Basis for evaluation
All evaluations are based on the I/Q data set acquired during the measurement. The
spectrum of the modulated signal to be evaluated is determined by the demodulation
bandwidth. However, it can be restricted to a limited span ("AF Span") if only part of the
signal is of interest. Furthermore, the time base for evaluations in the time domain can
be restricted to analyze a smaller extract in more detail, see Chapter 4.5, "Time
domain zoom", on page 28.
Spectrograms
Spectrograms are not configured as separate result displays, but as a subwindow of
any existing graphical result display window. They are activated and deactivated in the
"Spectrogram" tab of the "Traces" settings (see Chapter 6.3, "Spectrogram settings",
on page 90).
AM Time Domain...........................................................................................................16
FM Time Domain...........................................................................................................16
PM Time Domain...........................................................................................................17
AM Spectrum................................................................................................................ 17
FM Spectrum.................................................................................................................18
PM Spectrum................................................................................................................ 19
"Add Window" icon from the toolbar, or select the "Window" > "New
15User Manual 1176.8939.02 ─ 12
R&S®VSE-K7
Measurements and result displays
RF Time Domain...........................................................................................................20
RF Spectrum.................................................................................................................21
Result Summary............................................................................................................22
Marker Table................................................................................................................. 23
Marker Peak List........................................................................................................... 24
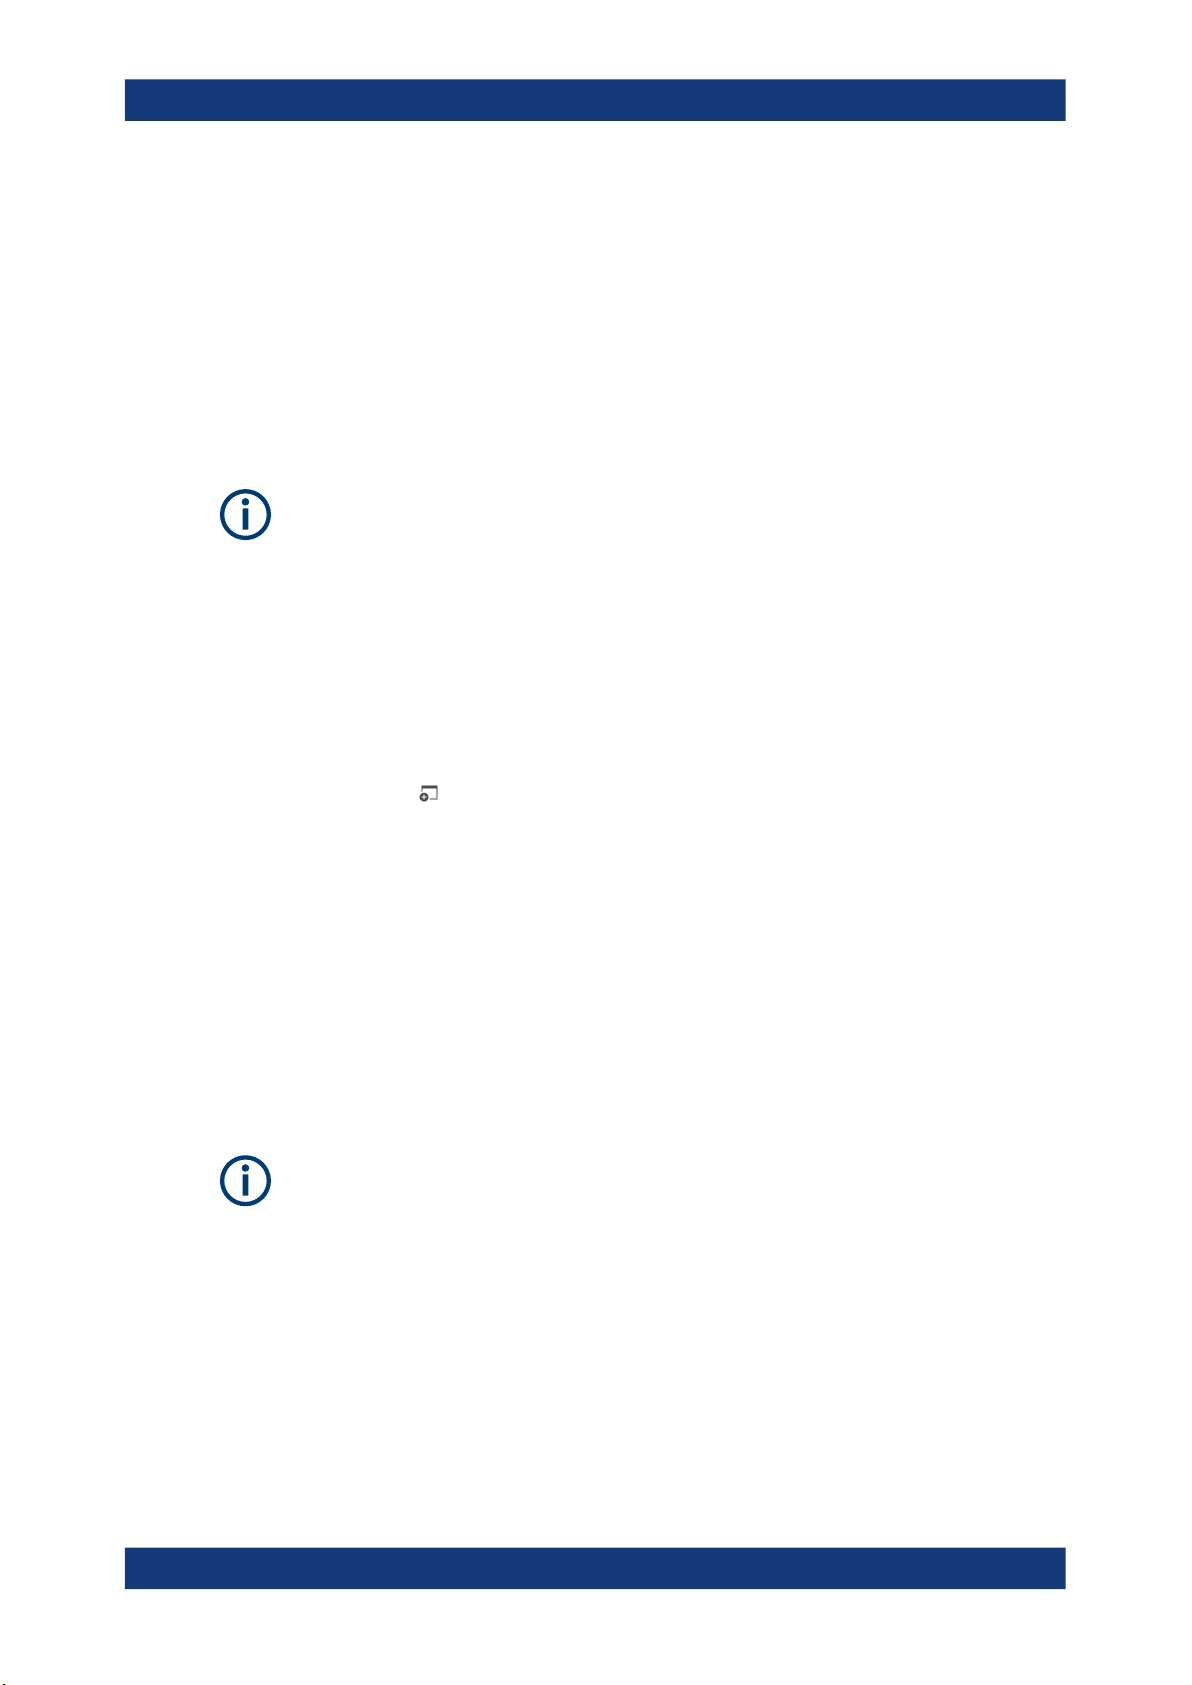
AM Time Domain
Displays the modulation depth of the demodulated AM signal (in %) versus time.
Optionally, the settling time can be evaluated and displayed, see Chapter 5.6.7, "Set-
tling time", on page 79.
Remote command:
LAY:ADD? '1',RIGH,'XTIM:AM:REL'
(See LAYout:ADD[:WINDow]? on page 242)
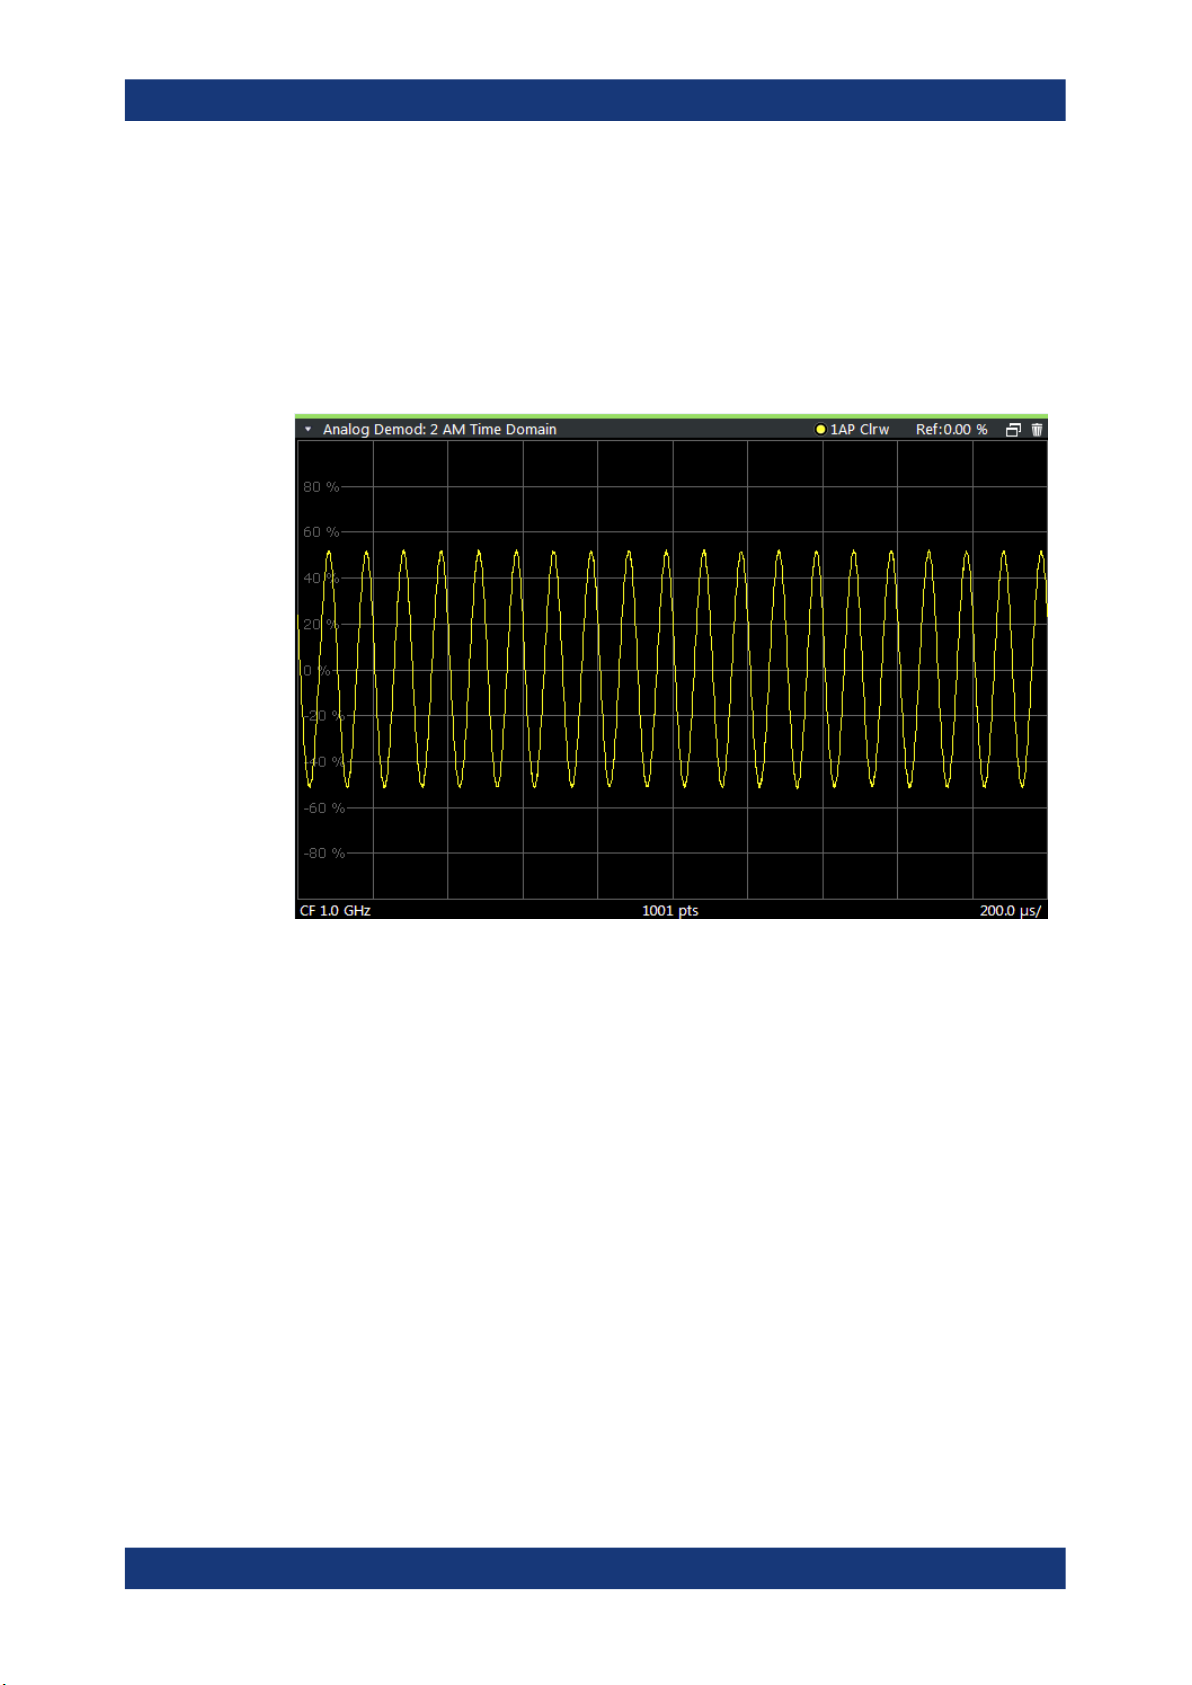
FM Time Domain
Displays the frequency spectrum of the demodulated FM signal versus time.
16User Manual 1176.8939.02 ─ 12
R&S®VSE-K7
Measurements and result displays
Optionally, the settling time can be evaluated and displayed, see Chapter 5.6.7, "Set-
tling time", on page 79.
Remote command:
LAY:ADD? '1',RIGH,'XTIM:FM'
(See LAYout:ADD[:WINDow]? on page 242)
PM Time Domain
Displays the phase deviations of the demodulated PM signal (in rad or °) versus time.
Optionally, the settling time can be evaluated and displayed, see Chapter 5.6.7, "Set-
tling time", on page 79.
Remote command:
LAY:ADD? '1',RIGH,'XTIM:PM'
(See LAYout:ADD[:WINDow]? on page 242)
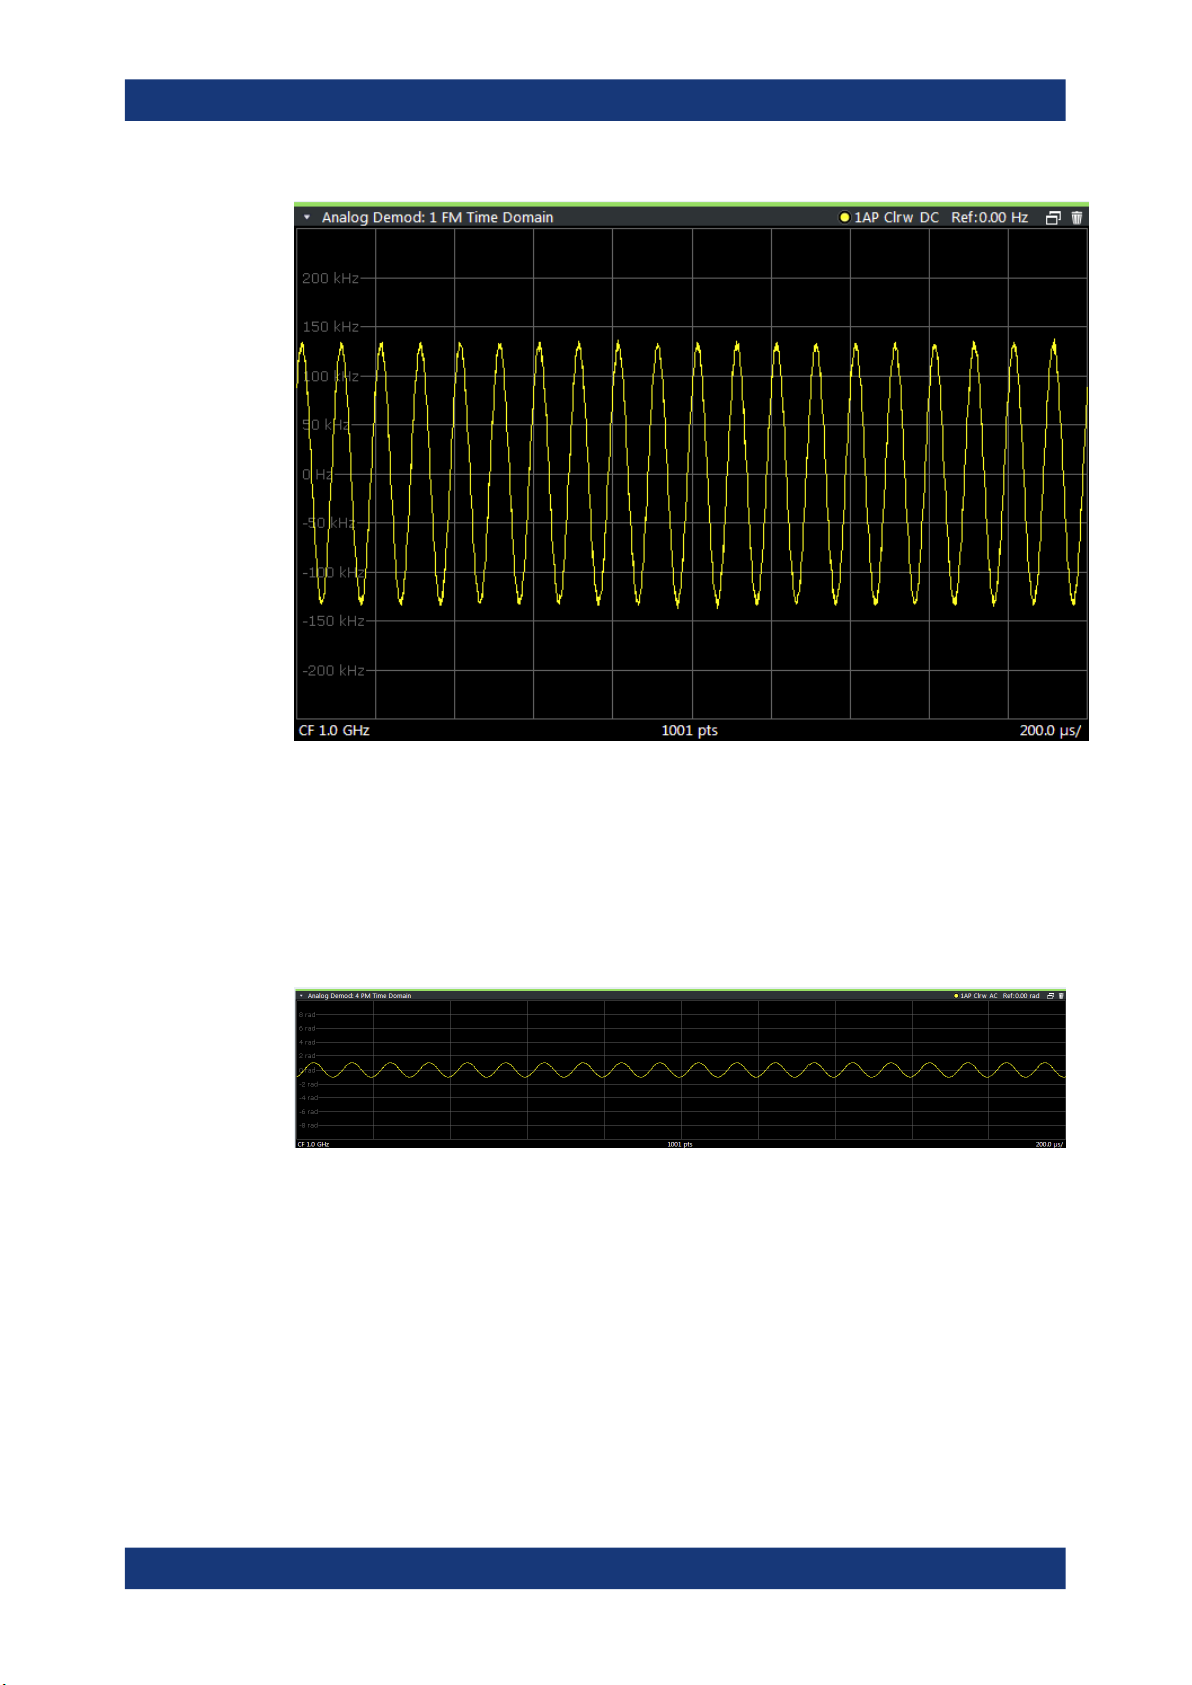
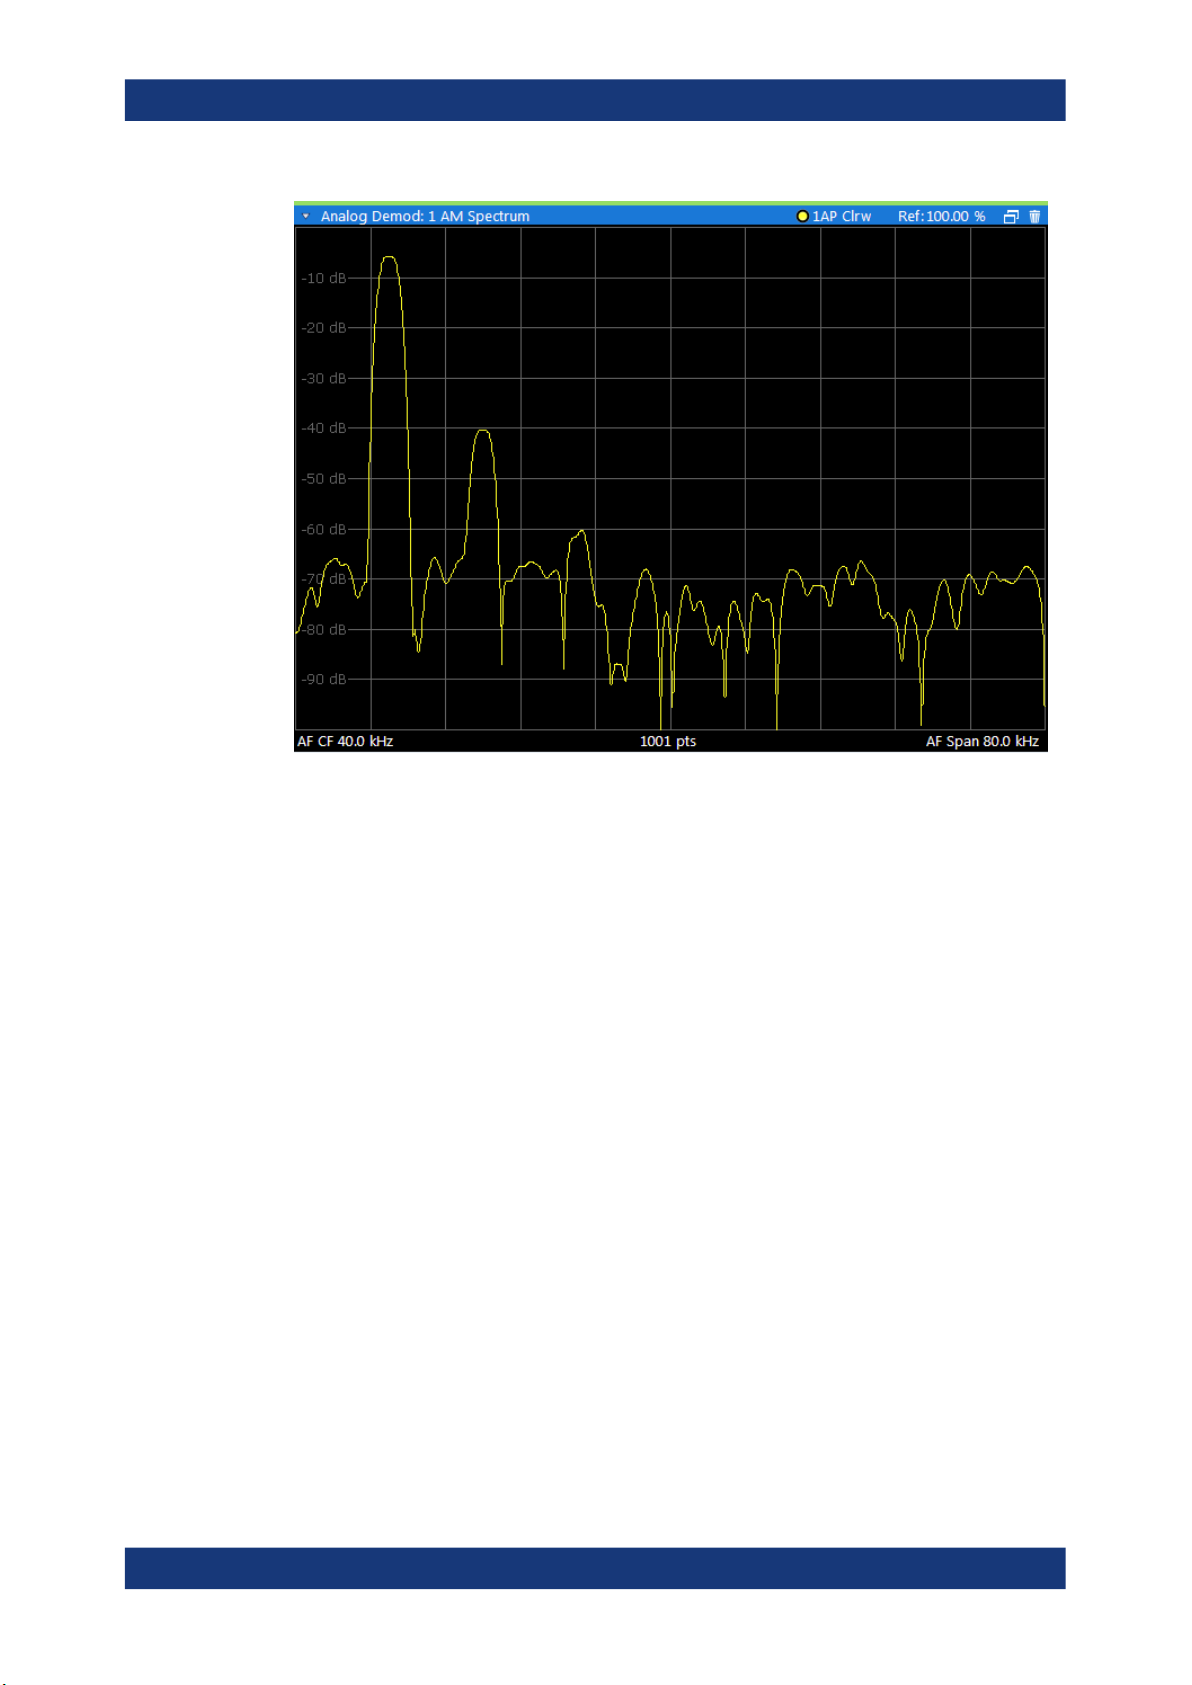
AM Spectrum
Displays the modulation depth of the demodulated AM signal (in % or dB) versus AF
span. The spectrum is calculated from the demodulated AM signal in the time domain
via FFT.
17User Manual 1176.8939.02 ─ 12
R&S®VSE-K7
Measurements and result displays
Note: If a high pass or low pass AF filter is defined, the filter is indicated by a vertical
red line in the spectrum display.
Remote command:
LAY:ADD? '1',RIGH,'XTIMe:AM:REL:AFSPectrum1'
(see LAYout:ADD[:WINDow]? on page 242)
FM Spectrum
Displays the frequency deviations of the demodulated FM signal (in Hz or dB) versus
AF span. The spectrum is calculated from the demodulated AM signal in the time
domain via FFT.
18User Manual 1176.8939.02 ─ 12

R&S®VSE-K7
Measurements and result displays
Note: If a high pass or low pass AF filter is defined, the filter is indicated by a vertical
red line in the spectrum display.
Remote command:
LAY:ADD? '1',RIGH,'XTIMe:FM:AFSPectrum1'
(see LAYout:ADD[:WINDow]? on page 242)
PM Spectrum
Displays the phase deviations of the demodulated PM signal (in rad, ° or dB) versus
AF span. The spectrum is calculated from the demodulated AM signal in the time
domain via FFT.
Note: If a high pass or low pass AF filter is defined, the filter is indicated by a vertical
red line in the spectrum display.
19User Manual 1176.8939.02 ─ 12
R&S®VSE-K7
Measurements and result displays
Remote command:
LAY:ADD? '1',RIGH,'XTIMe:PM:AFSPectrum1'
(see LAYout:ADD[:WINDow]? on page 242)
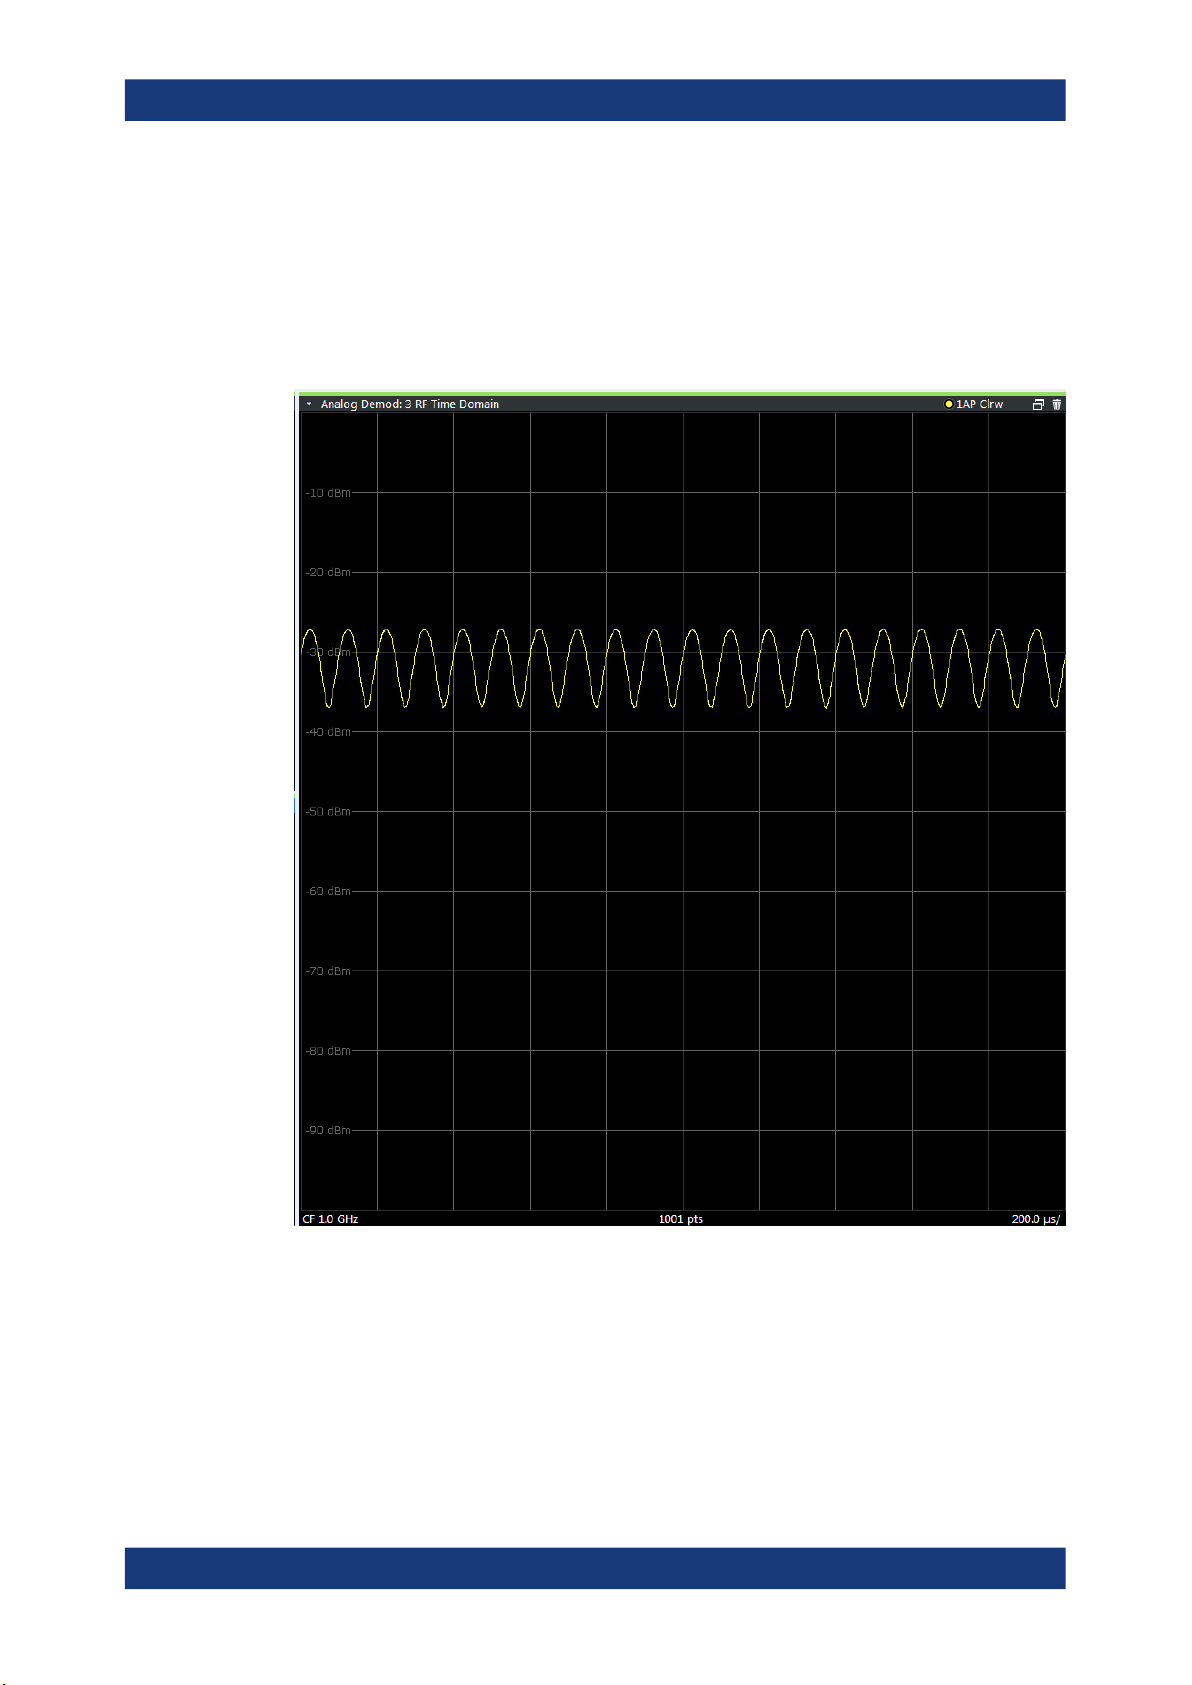
RF Time Domain
Displays the RF power of the input signal versus time. The level values represent the
magnitude of the I/Q data set.
Optionally, the settling time can be evaluated and displayed, see Chapter 5.6.7, "Set-
tling time", on page 79.
Remote command:
LAY:ADD? '1',RIGH,'XTIM:AM'
(see LAYout:ADD[:WINDow]? on page 242)
20User Manual 1176.8939.02 ─ 12
R&S®VSE-K7
Measurements and result displays
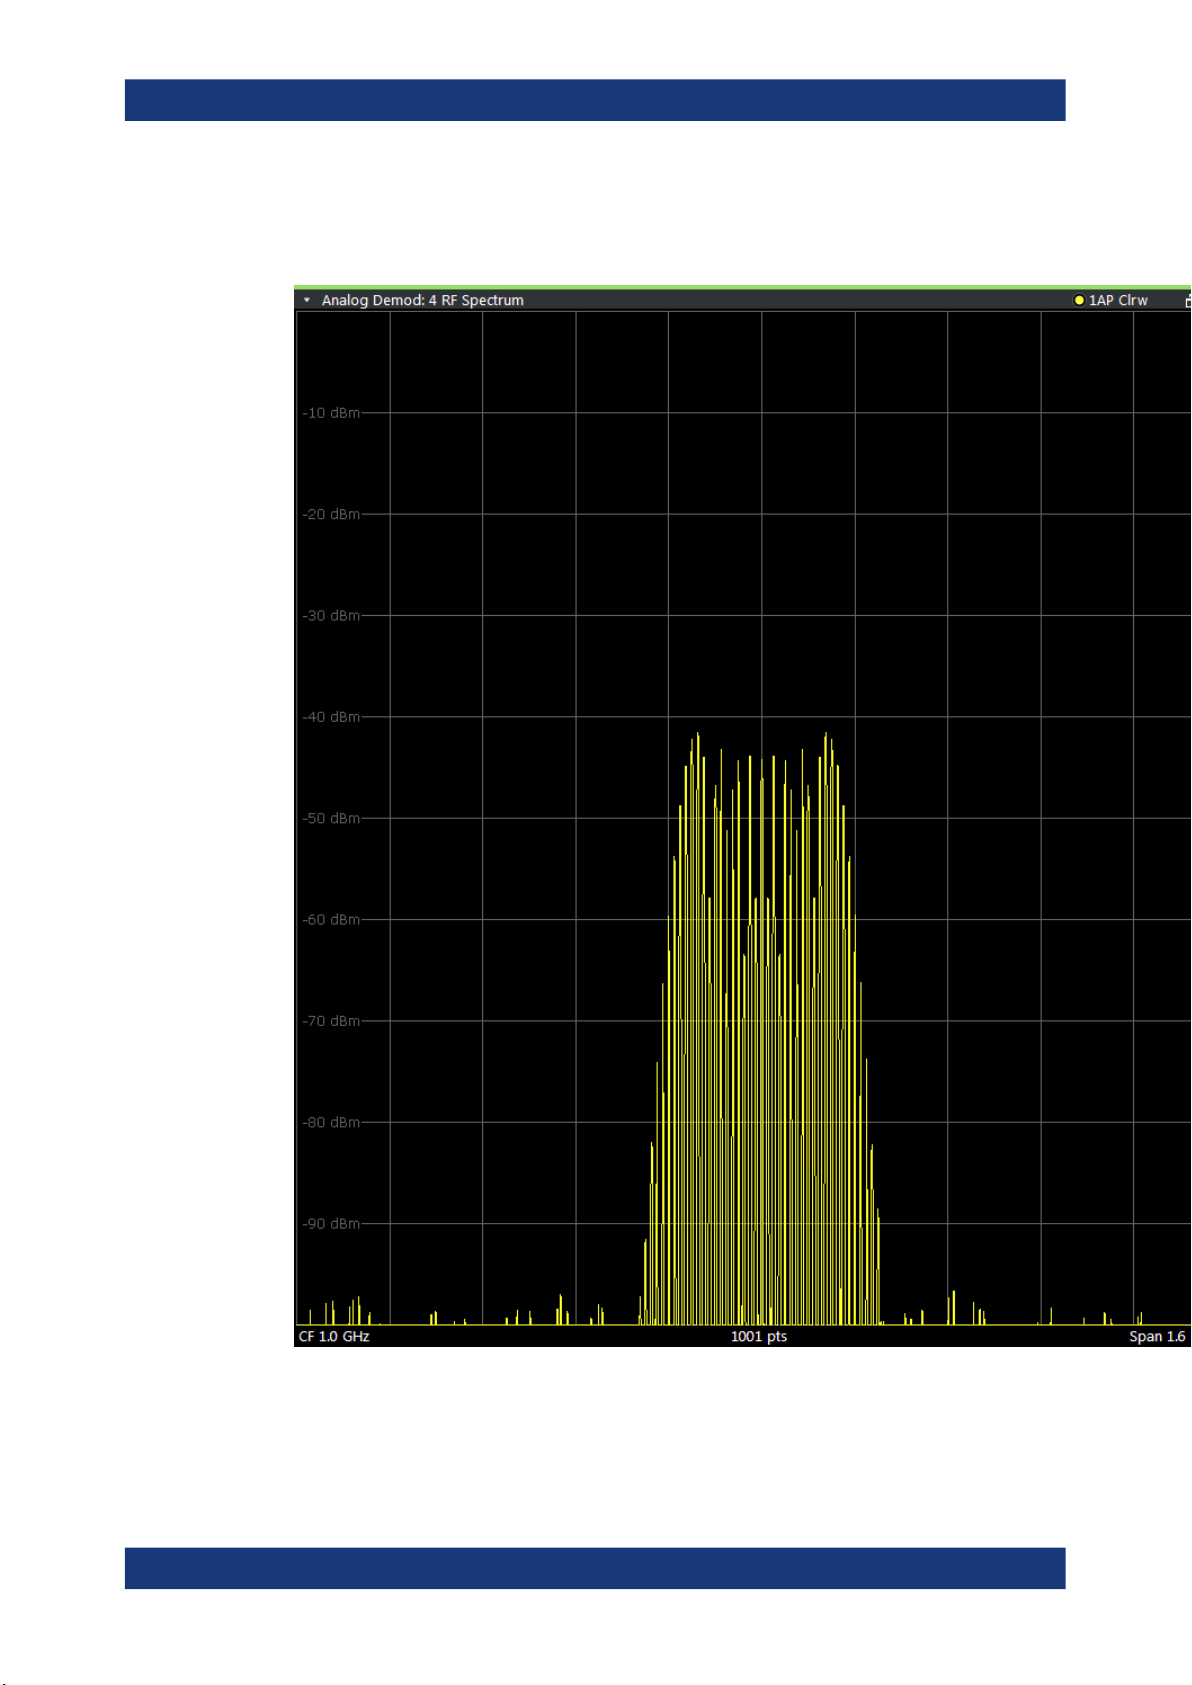
RF Spectrum
Displays the spectrum of the input signal. In contrast to the Spectrum application, the
frequency values are determined using FFT from the recorded I/Q data set.
Remote command:
LAY:ADD? '1',RIGH,'XTIM:SPECTRUM'
(see LAYout:ADD[:WINDow]? on page 242)
21User Manual 1176.8939.02 ─ 12
R&S®VSE-K7
Measurements and result displays
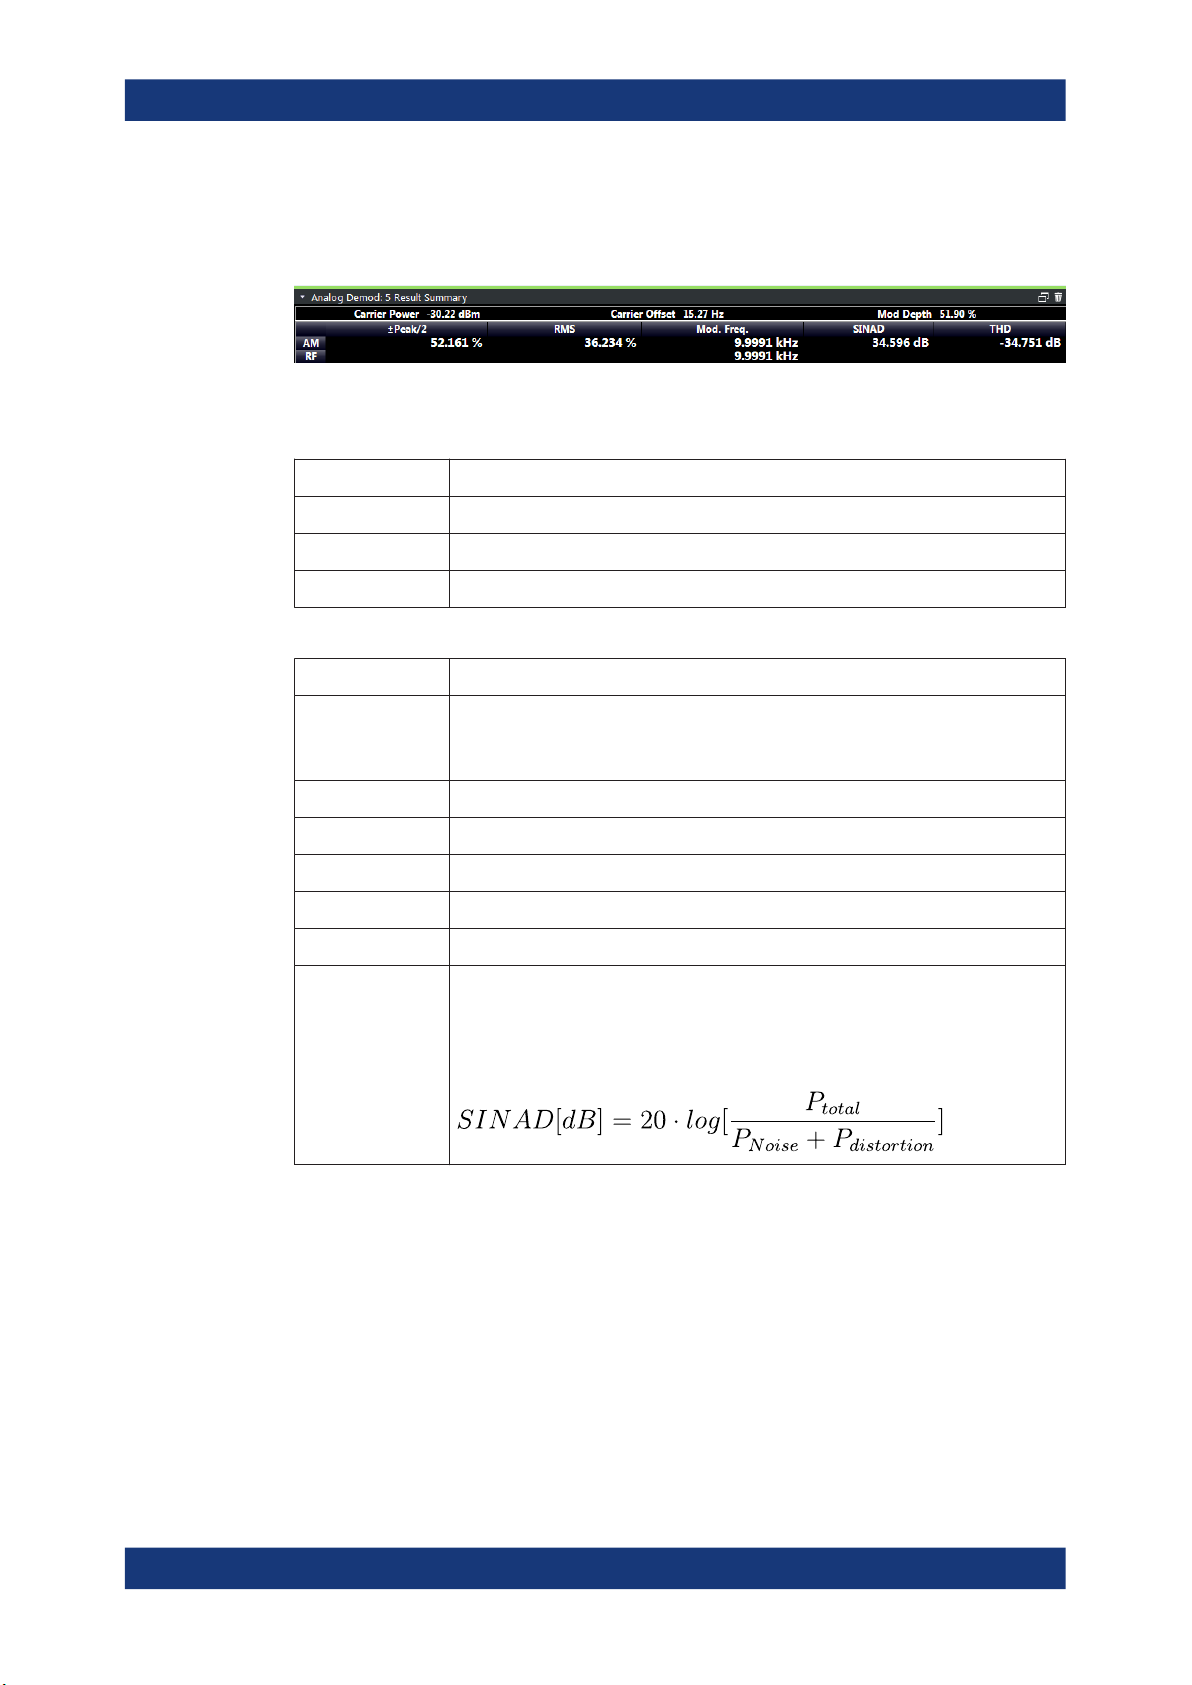
Result Summary
The "result summary" displays the results of the demodulation functions for all windows
in a table.
The following general results are provided:
For each demodulation, the following results are provided:
Label Description
"Carr Power" Measured carrier power
"Carr Offset" Carrier offset to nominal center frequency
"Mod. Depth" Modulation depth
Table 3-1: Result summary description
Label Description
"Settling Time" Time after which signal remains in a specified value range.
Only evaluated and displayed if enabled, see Chapter 5.6.7, "Settling time",
on page 79.
"+Peak" Positive peak (maximum)
"-Peak" Negative peak (minimum)
"+/-Peak/2" Average of positive and negative peaks
"RMS" Root Mean Square value
"Mod Freq" Modulation frequency
"SINAD" Signal-to-noise-and-distortion
(Calculated only if AF Spectrum is displayed)
Measures the ratio of the total power to the power of noise and harmonic distortions.
The noise and harmonic power is calculated inside the AF spectrum span. The DC
offset is removed before the calculation.
22User Manual 1176.8939.02 ─ 12
R&S®VSE-K7
Measurements and result displays
Label Description
"DISTORT" Modulation distortion in %
(Calculated only if "SINAD" is also calculated)
Measures the distortion of the modulation in relation to the total power of the signal
inside the AF spectrum span. Indicates the quality of the modulation.
"THD" Total harmonic distortion
The ratio of the harmonics to the fundamental and harmonics. All harmonics inside
the AF spectrum span are considered up to the tenth harmonic.
(Calculated only if AF Spectrum is displayed)
Note: Relative demodulation results. Optionally, the demodulation results in relation to
user-defined or measured reference values are determined. See Chapter 5.6.6, "Result
table settings", on page 77.
In addition, the following general information for the input signal is provided:
●
"Carrier Power": the power of the carrier without modulation
●
"Carrier Offset": the deviation of the calculated carrier frequency to the ideal carrier
frequency
●
"Modulation Depth" (AM or "RF Time Domain" only): the difference in amplitude the
carrier signal is modulated with
Remote command:
LAY:ADD? '1',RIGH,RSUM, see LAYout:ADD[:WINDow]? on page 242
Results:
Chapter 9.6.3, "Retrieving result summary values", on page 254
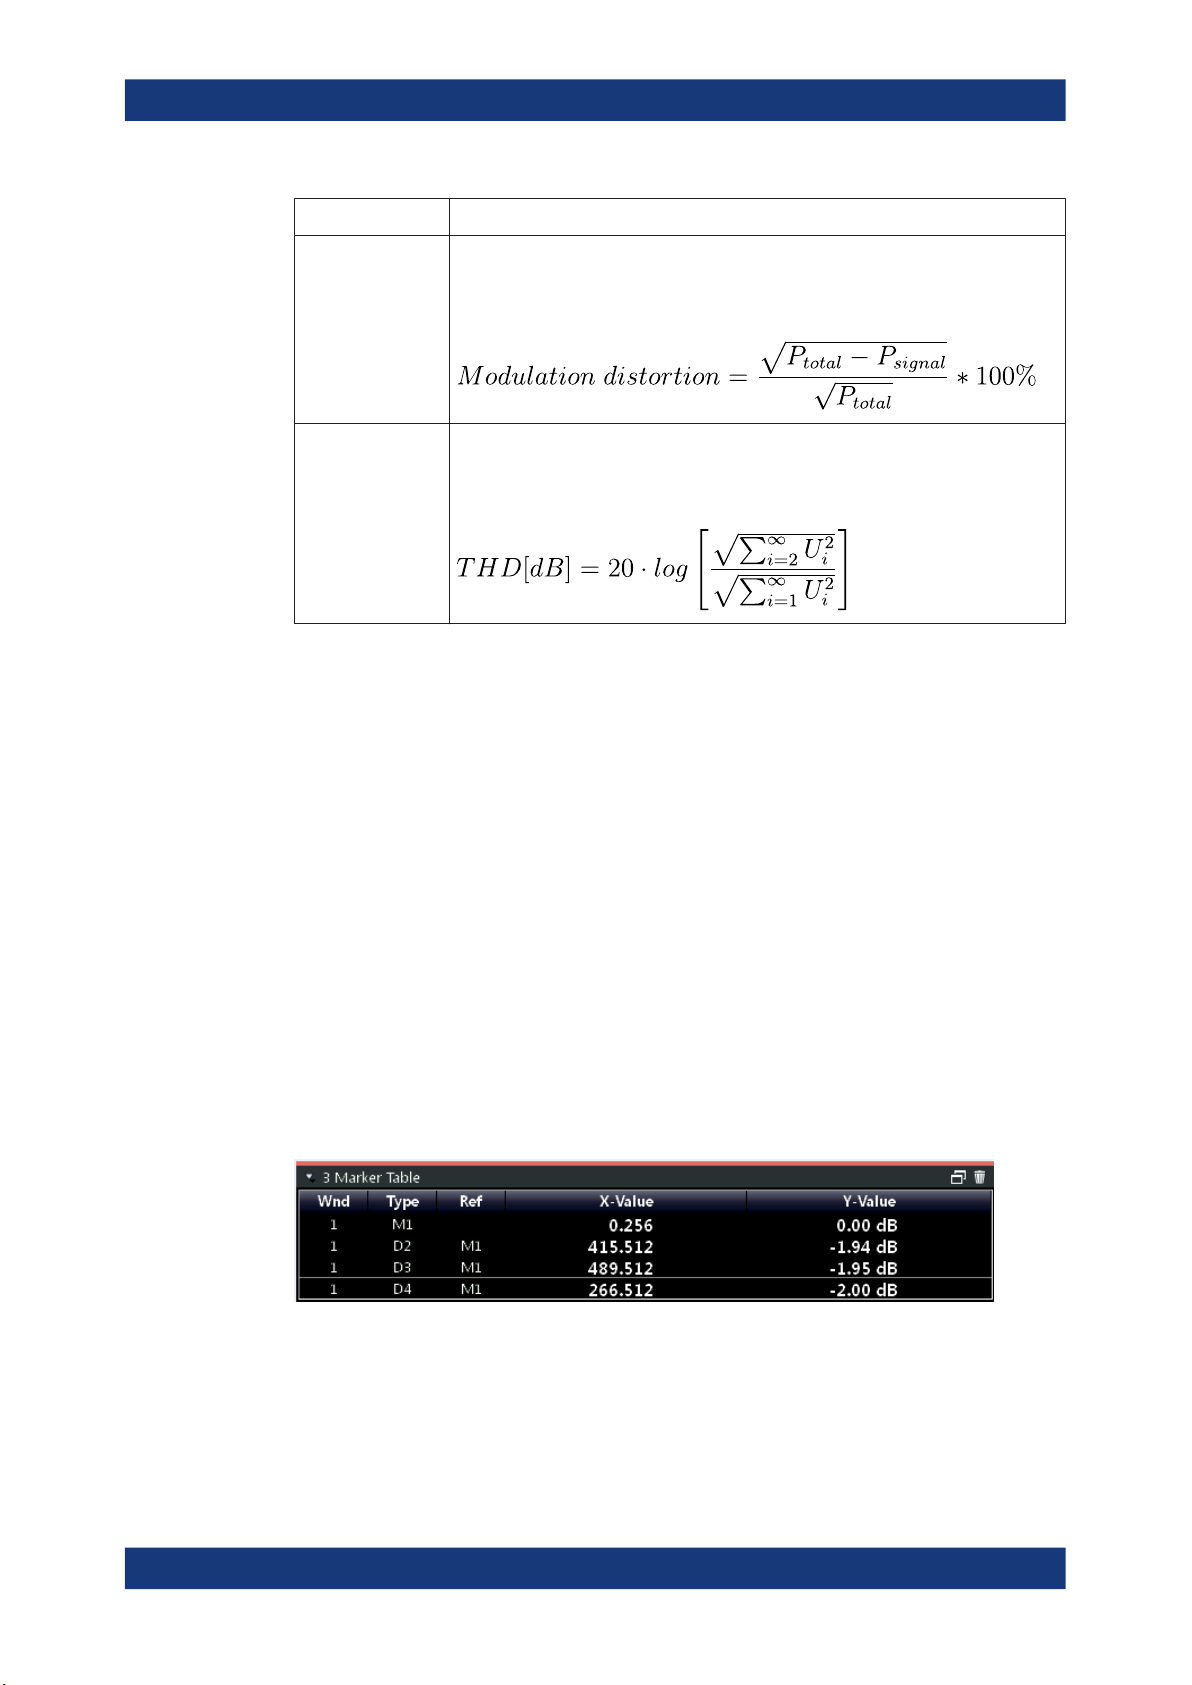
Marker Table
Displays a table with the current marker values for the active markers.
This table is displayed automatically if configured accordingly.
(See "Marker Table Display" on page 99).
Remote command:
LAY:ADD? '1',RIGH, MTAB, see LAYout:ADD[:WINDow]? on page 242
Results:
CALCulate<n>:MARKer<m>:X on page 261
CALCulate<n>:MARKer<m>:Y? on page 261
23User Manual 1176.8939.02 ─ 12
R&S®VSE-K7
Measurements and result displays
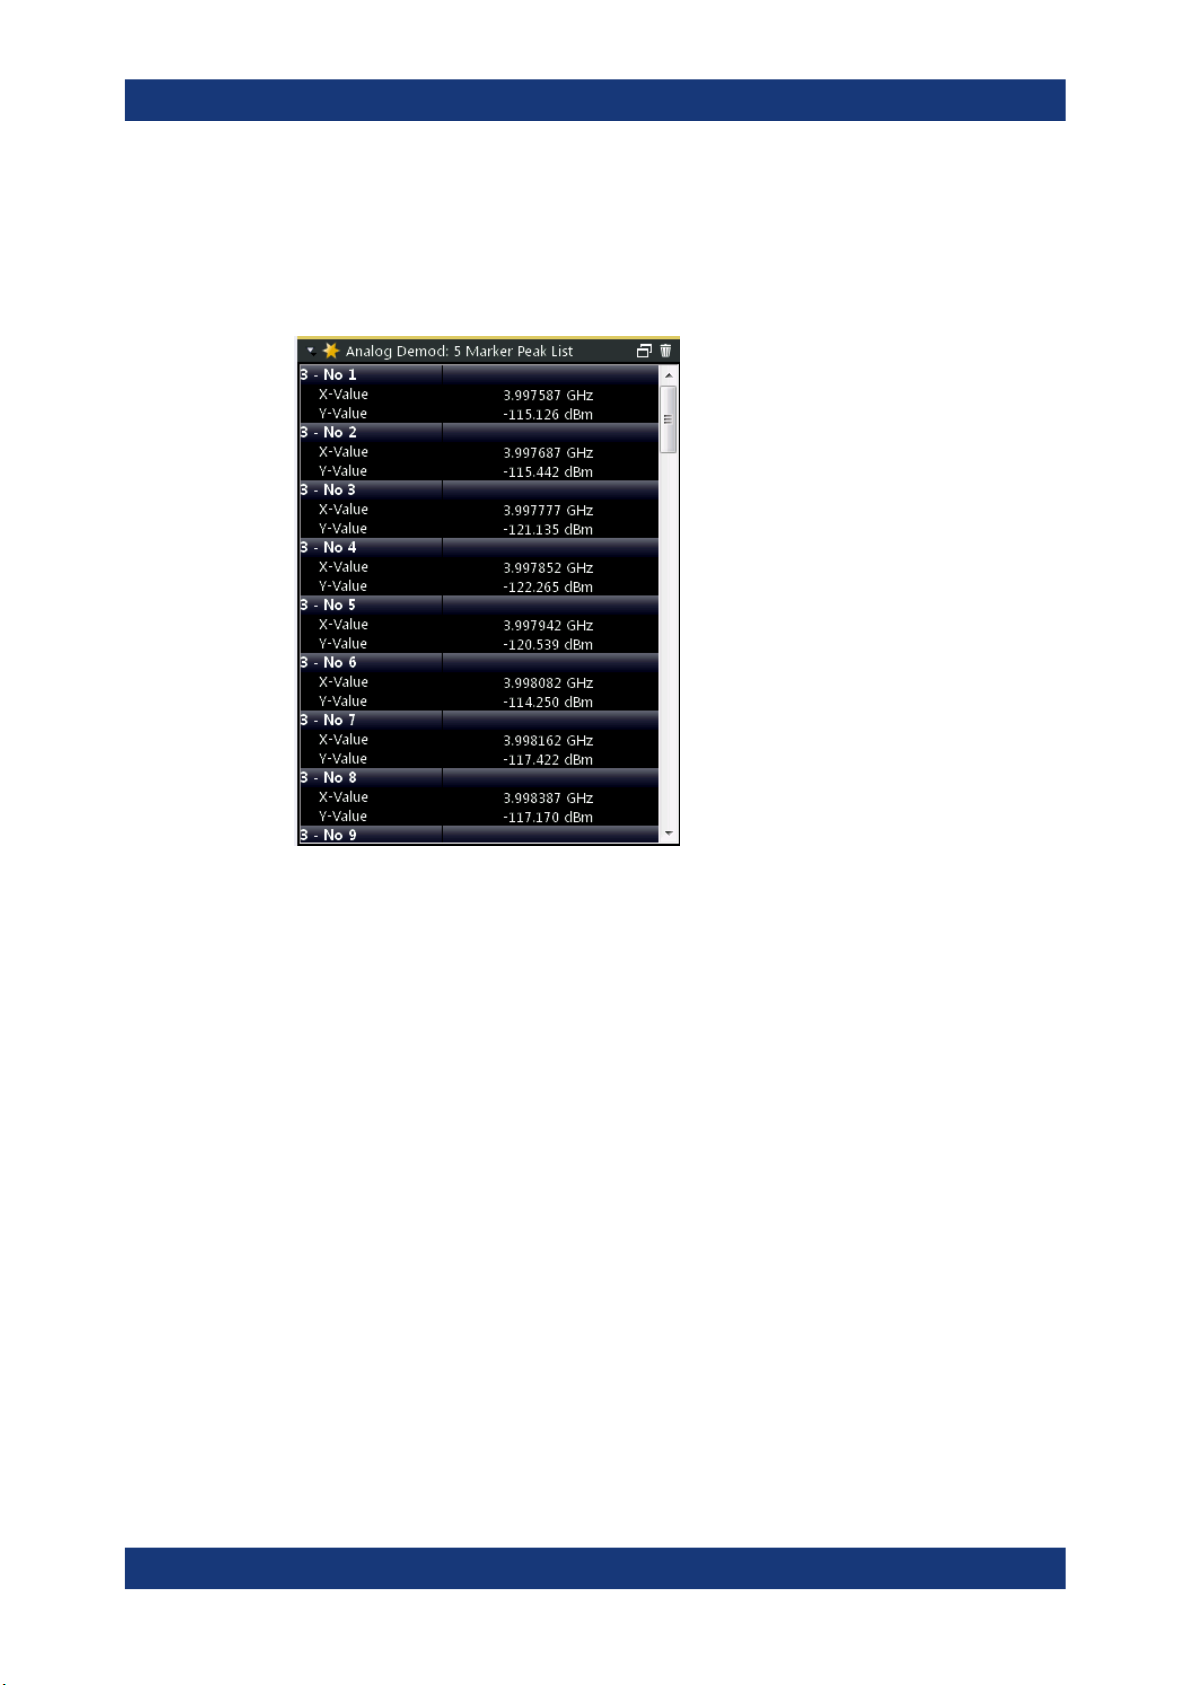
Marker Peak List
The marker peak list determines the frequencies and levels of peaks in the spectrum or
time domain. How many peaks are displayed can be defined, as well as the sort order.
In addition, the detected peaks can be indicated in the diagram. The peak list can also
be exported to a file for analysis in an external application.
Remote command:
LAY:ADD? '1',RIGH, PEAK, see LAYout:ADD[:WINDow]? on page 242
Results:
CALCulate<n>:MARKer<m>:X on page 261
CALCulate<n>:MARKer<m>:Y? on page 261
24User Manual 1176.8939.02 ─ 12

R&S®VSE-K7
4.1 Demodulation process
Measurement basics
Demodulation process
4 Measurement basics
Some background knowledge on basic terms and principles used in Analog Modulation
Analysis measurements is provided here for a better understanding of the required
configuration settings.
● Demodulation process............................................................................................ 25
● Demodulation bandwidth.........................................................................................27
● Sample rate and demodulation bandwidth..............................................................27
● AF filters..................................................................................................................28
● Time domain zoom..................................................................................................28
● Working with spectrograms.....................................................................................30
The demodulation process is shown in Figure 4-1. All calculations are performed simultaneously with the same I/Q data set. Magnitude (= amplitude) and phase of the complex I/Q pairs are determined. The frequency result is obtained from the differential
phase.
For details on general I/Q data processing in the R&S VSE, refer to the reference part
of the I/Q Analysis remote control description in the R&S VSE User Manual.
25User Manual 1176.8939.02 ─ 12

R&S®VSE-K7
Measurement basics
Demodulation process
Figure 4-1: Block diagram of software demodulator
26User Manual 1176.8939.02 ─ 12

R&S®VSE-K7
Measurement basics
Sample rate and demodulation bandwidth
The AM DC, FM DC and PM DC raw data of the demodulators is fed into the "Trace
Arithmetic" block that combines consecutive data sets. Possible trace modes are:
Clear Write, Max Hold, Min Hold and Average. The output data of the "Trace Arithmetic" block can be read via remote control ([SENS:]ADEM:<evaluation>:RES?,
see [SENSe:]ADEMod:AM[:ABSolute][:TDOMain]:RESult? on page 249.
The collected measured values are evaluated by the selected detector. The result is
displayed on the screen and can be read out via remote control.
In addition, important parameters are calculated:
●
A counter determines the modulation frequency for AM, FM, and PM.
●
average power = carrier power (RF power)
●
average frequency = carrier frequency offset (FM)
●
The modulation depth or the frequency or phase deviation; the deviations are
determined from the trace data
AC coupling is possible with FM and PM display.
4.2 Demodulation bandwidth
The demodulation bandwidth determines the span of the signal that is demodulated. It
is not the 3-dB bandwidth of the filter, but the useful bandwidth which is distortion-free
regarding phase and amplitude.
Therefore the following formulas apply:
●
AM: demodulation bandwidth ≥ 2 x modulation frequency
●
FM: demodulation bandwidth ≥ 2 x (frequency deviation + modulation frequency)
●
PM: demodulation bandwidth ≥ 2 x modulation frequency x (1 + phase deviation)
If the center frequency of the analyzer is not set exactly to the signal frequency, the
demodulation bandwidth must be increased by the carrier offset, in addition to the
requirement described above. The bandwidth must also be increased if FM or PM AC
coupling is selected.
In general, select the demodulation bandwidth as narrow as possible to improve the
S/N ratio. The residual FM caused by noise floor and phase noise increases dramatically with the bandwidth, especially with FM.
For help on determining the adequate demodulation bandwidth, see "Determining the
demodulation bandwidth" on page 128.
4.3 Sample rate and demodulation bandwidth
The maximum demodulation bandwidths that can be obtained during the measurement, depending on the sample rate, are listed in the tables below for different demod-
27User Manual 1176.8939.02 ─ 12
R&S®VSE-K7
Measurement basics
Time domain zoom
ulation filter types. The allowed value range of the measurement time and trigger offset
depends on the selected demodulation bandwidth and demodulation filter. If the AF filter or the AF trigger are not active, the measurement time increases by 20 %.
A maximum of 24 million samples can be captured, assuming sufficient memory is
available; thus the maximum measurement time can be determined according to the
following formula:
Meas.time
The minimum trigger offset is (-Meas.time
Large numbers of samples
Principally, the R&S VSE can handle up to 24 million samples. However, when 480001
samples are exceeded, all traces that are not currently being displayed in a window are
deactivated to improve performance. The traces can only be activated again when the
samples are reduced.
Effects of measurement time on the stability of measurement results
Despite amplitude and frequency modulation, the display of carrier power and carrier
frequency offset is stable.
Stability is achieved by a digital filter which sufficiently suppresses the modulation. As
a prerequisite, the measurement time must be ≥ 3 x 1 / modulation frequency, i.e. at
least three periods of the AF signal are recorded.
The mean carrier power for calculating the AM is also calculated with a digital filter.
The filter returns stable results after a measurement time of ≥ 3 x 1 / modulation frequency, i.e. at least three cycles of the AF signal must be recorded before a stable AM
can be shown.
= Sample count
max
/ sample rate
max
max
)
4.4 AF filters
Additional filters applied after demodulation help filter out unwanted signals, or correct
pre-emphasized input signals. A CCITT filter allows you to evaluate the signal by simulating the characteristics of human hearing.
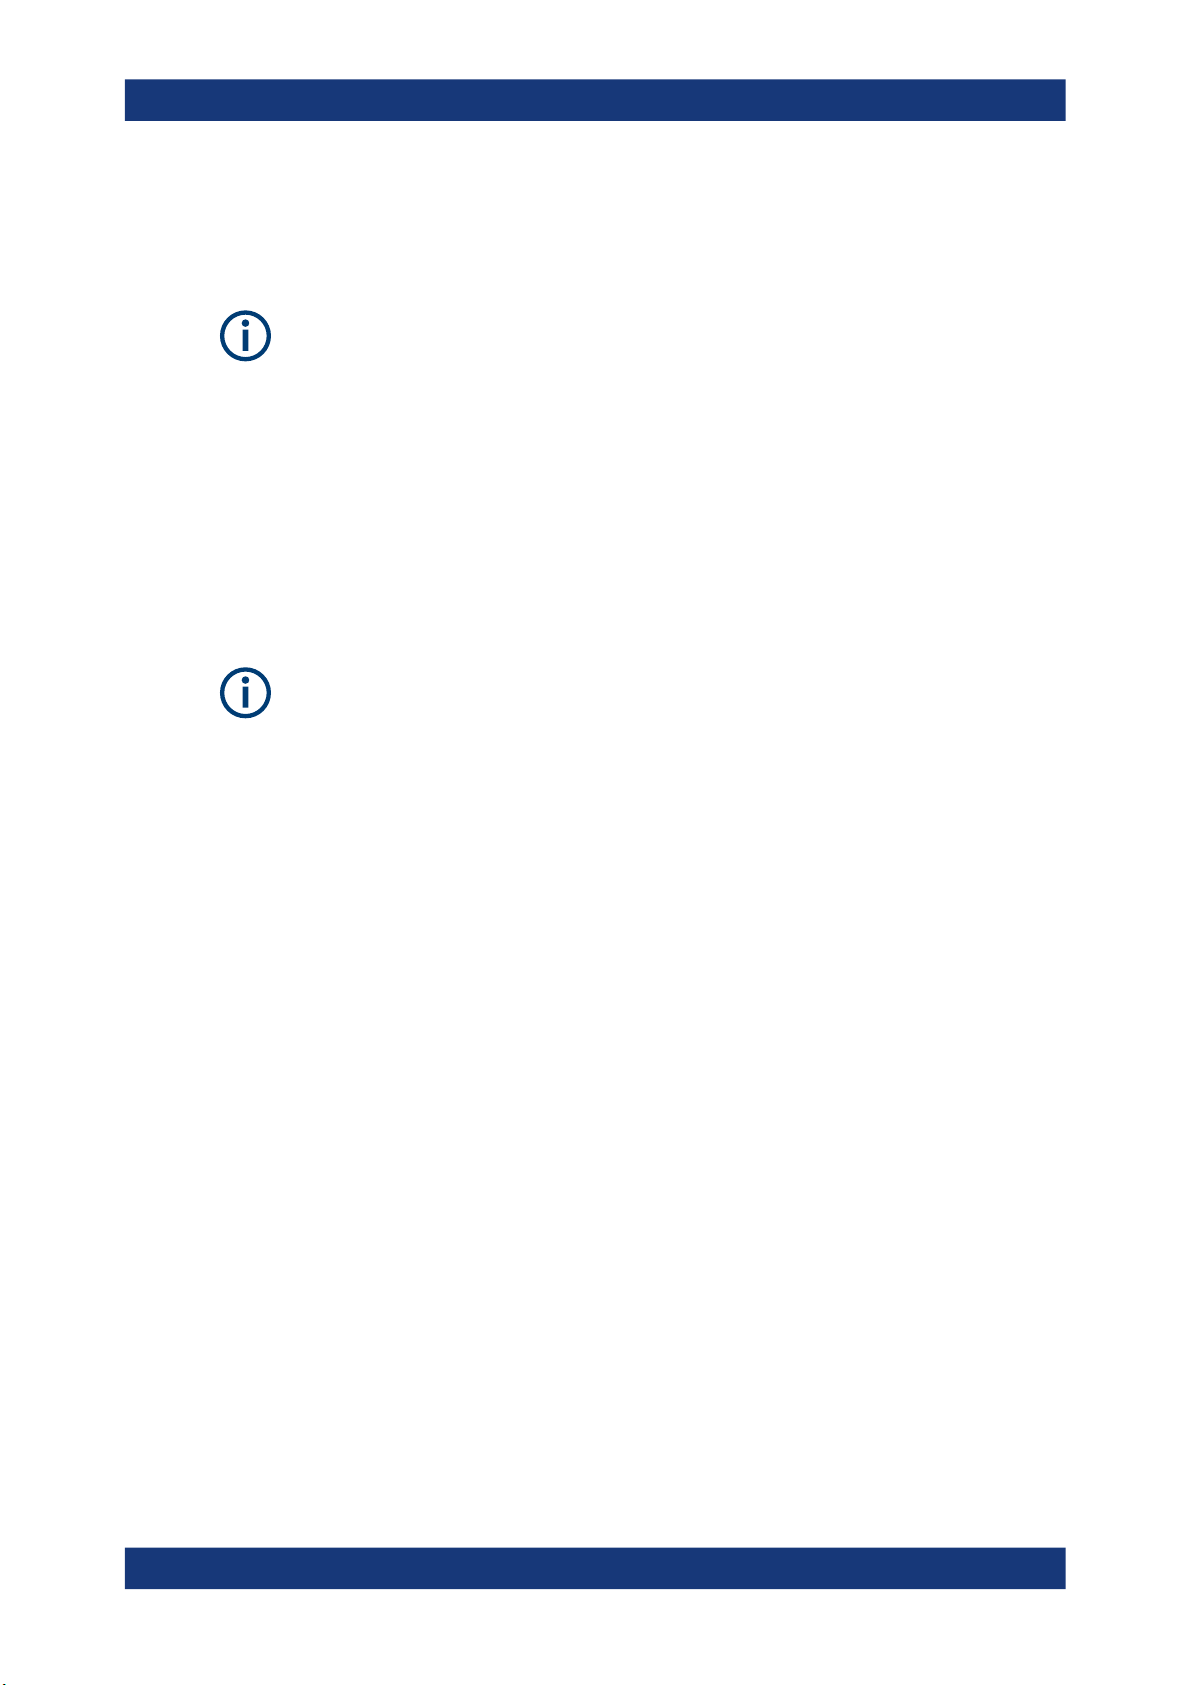
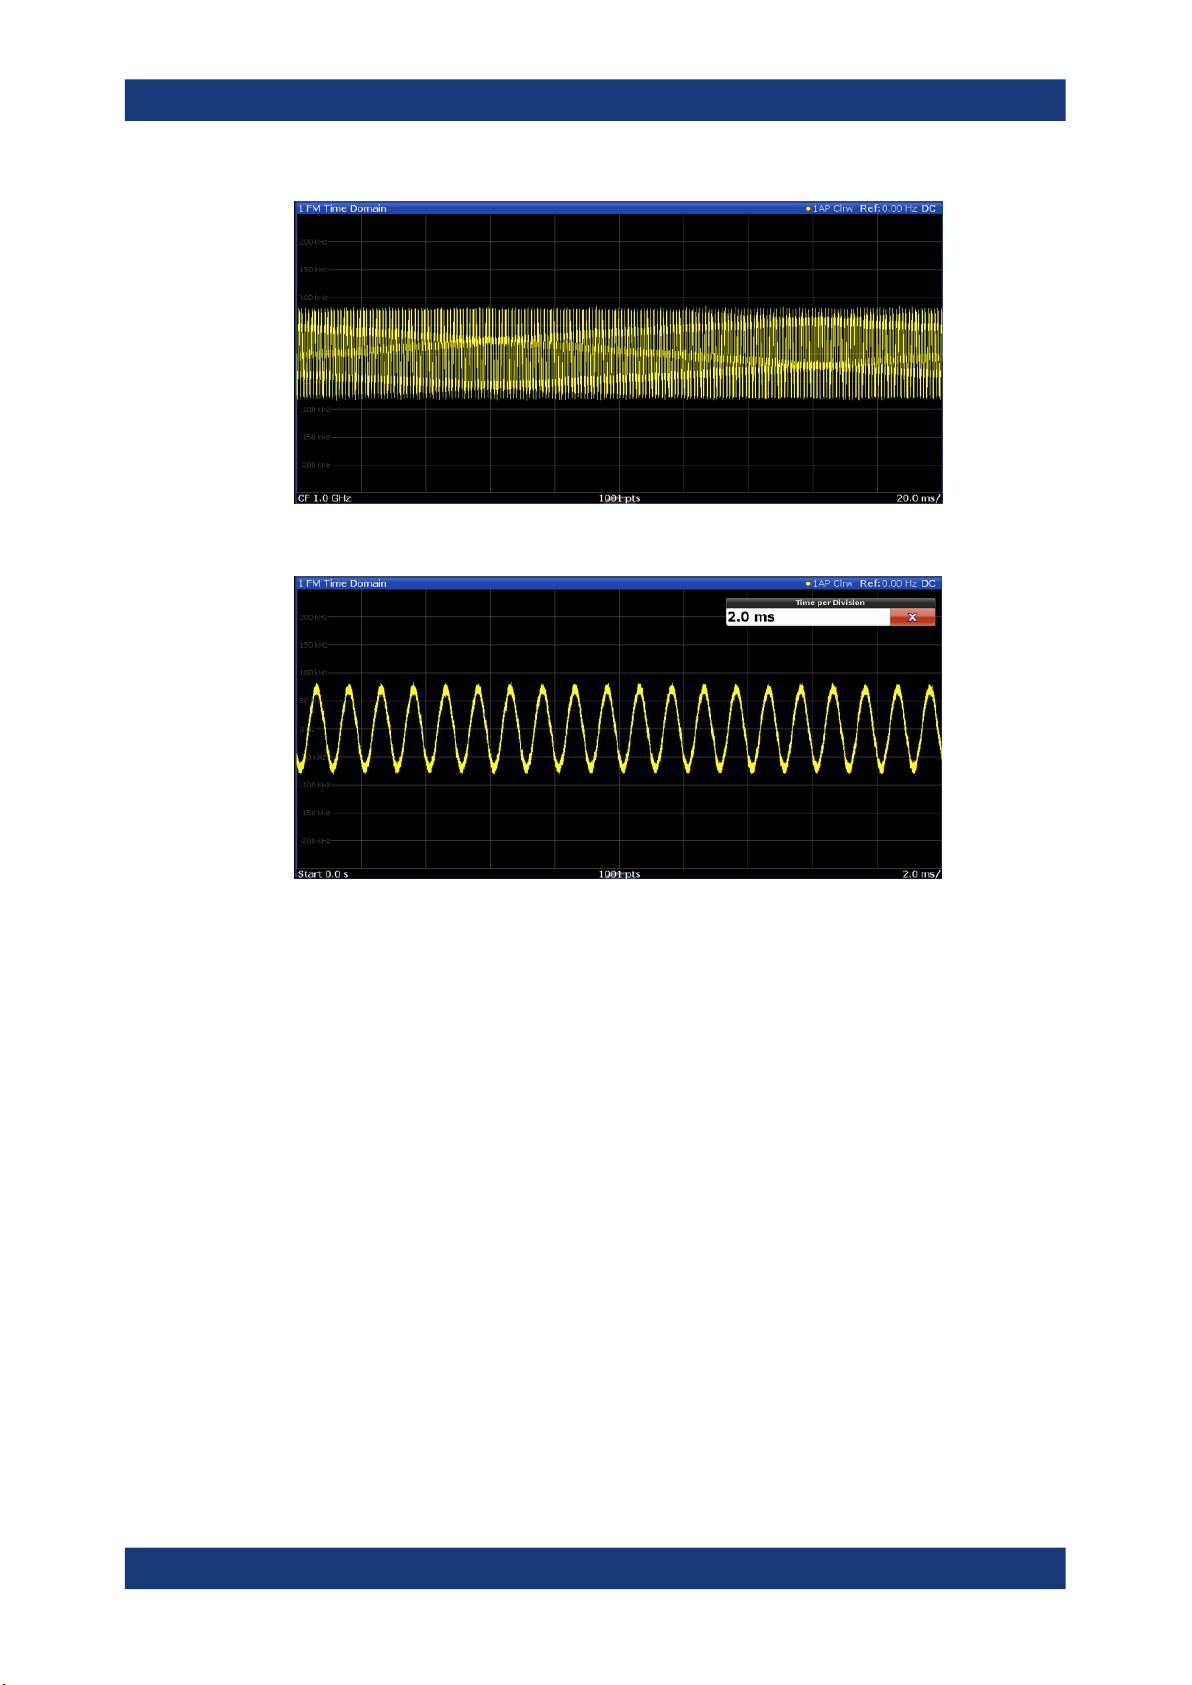
4.5 Time domain zoom
For evaluations in the time domain, the demodulated data for a particular time span
can be extracted and displayed in more detail using the "Time Domain Zoom" function.
Zooming is useful if the measurement time is very large and thus each sweep point
represents a large time span. The time domain zoom function distributes the available
sweep points only among the time span defined by the zoom area length. The time
span displayed per division of the diagram is decreased. Thus, the display of the
extracted time span becomes more precise.
28User Manual 1176.8939.02 ─ 12
R&S®VSE-K7
Measurement basics
Time domain zoom
Figure 4-2: FM time domain measurement with a very long measurement time (200 ms)
Figure 4-3: FM time domain measurement with time domain zoom (2.0 ms per division)
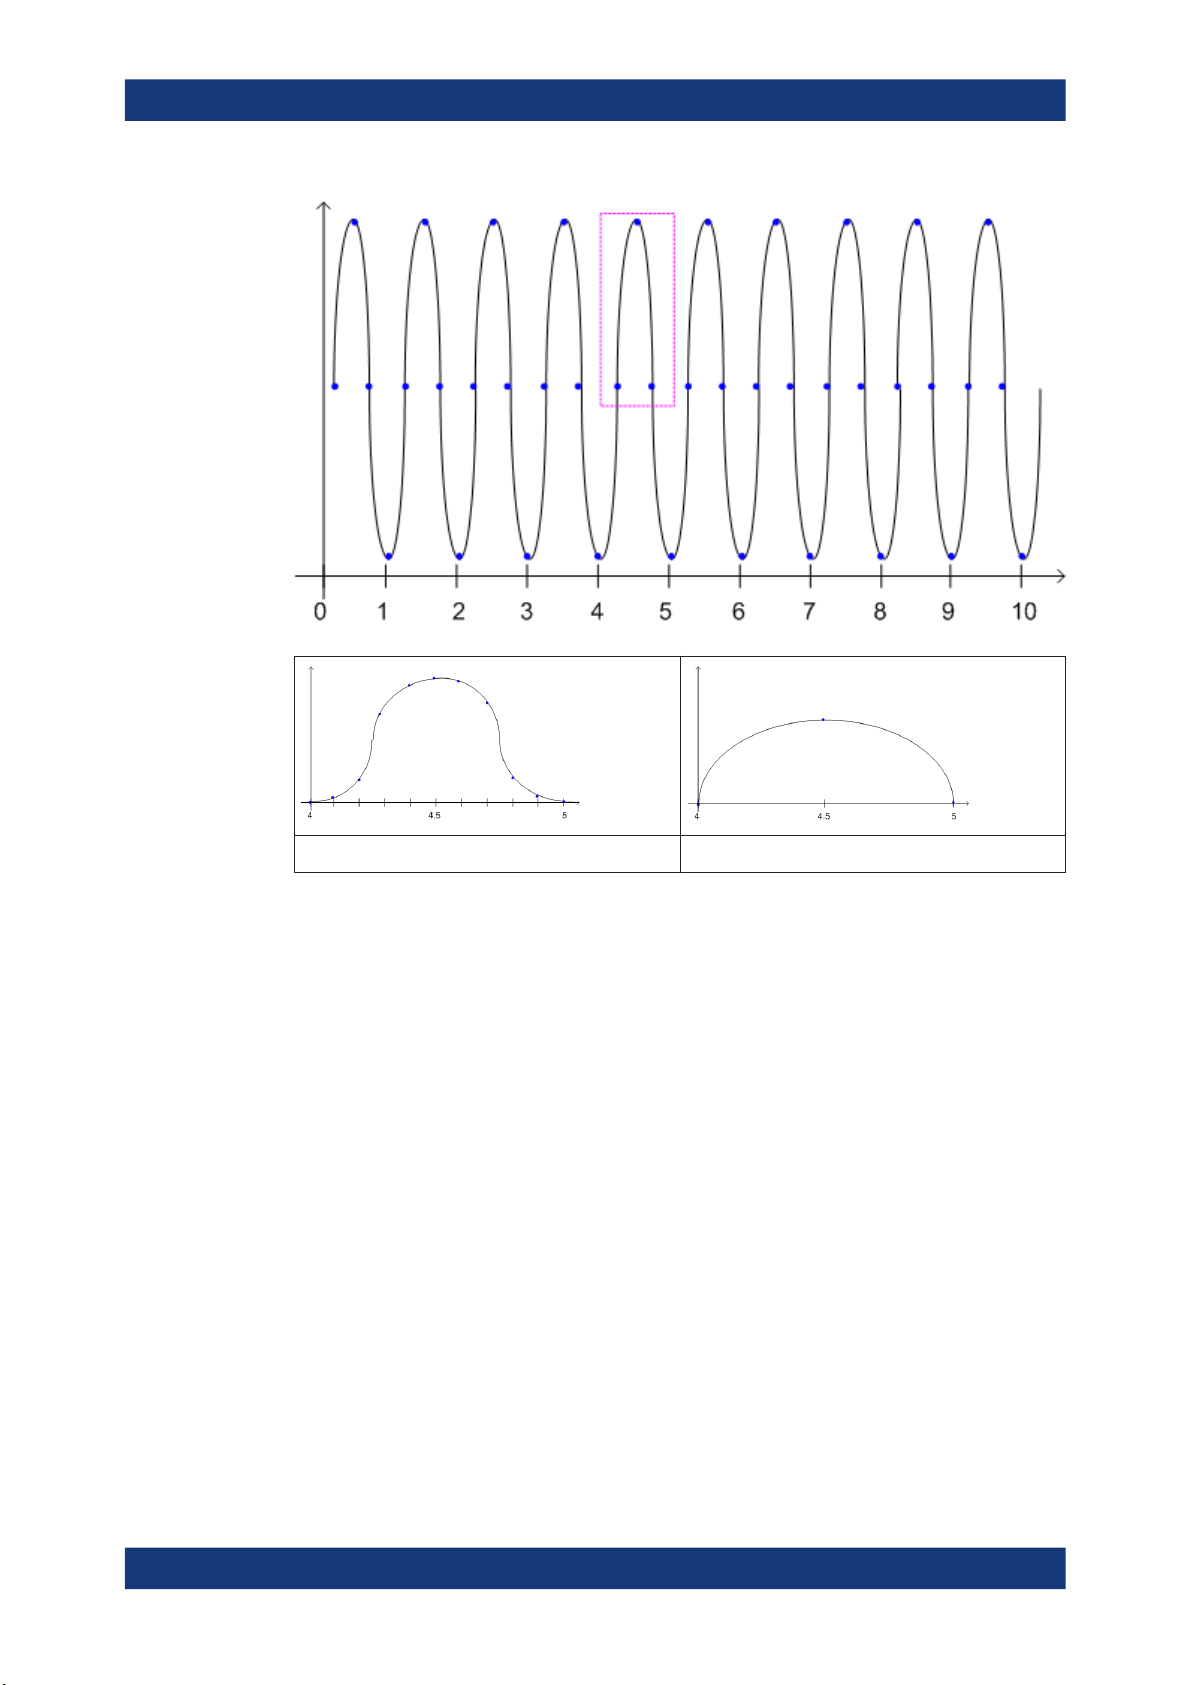
The time domain zoom area affects not only the diagram display, but the entire evaluation for the current window.
In contrast to the time domain zoom, the graphical zoom is available for all diagram
evaluations. However, the graphical zoom is useful only if more measured values than
trace points are available. The (time) span represented by each measurement point
remains the same.
29User Manual 1176.8939.02 ─ 12
R&S®VSE-K7
Measurement basics
Working with spectrograms
Time domain zoom Graphical zoom
4.6 Working with spectrograms
In addition to the standard "level versus frequency" or "level versus time" traces, the
R&S VSE AM/FM/PM Modulation Analysis application also provides a spectrogram
display of the measured data. A special feature of the R&S VSE software is that it provides spectrograms for applications based on I/Q data, such as the I/Q Analyzer and
the Analog Modulation Analysis application.
A spectrogram shows how the spectral density of a signal varies over time. The x-axis
shows the frequency, the y-axis shows the time. A third dimension, the power level, is
indicated by different colors. Thus you can see how the strength of the signal varies
over time for different frequencies.
30User Manual 1176.8939.02 ─ 12
 Loading...