


R&S®FSWP-K50
Spurious Measurement
User Manual
(;ÜÔÙ2)
1178707502
Version 04

This manual describes the following R&S®FSWP models with firmware version 2.00 or higher:
●
R&S®FSWP8 (1322.8003K08)
●
R&S®FSWP26 (1322.8003K26)
●
R&S®FSWP50 (1322.8003K50)
The following firmware options are described:
●
R&S FSWP-K50 (1338.3358.02)
© 2021 Rohde & Schwarz GmbH & Co. KG
Mühldorfstr. 15, 81671 München, Germany
Phone: +49 89 41 29 - 0
Email: info@rohde-schwarz.com
Internet: www.rohde-schwarz.com
Subject to change – data without tolerance limits is not binding.
R&S® is a registered trademark of Rohde & Schwarz GmbH & Co. KG.
Trade names are trademarks of the owners.
1178.7075.02 | Version 04 | R&S®FSWP-K50
The following abbreviations are used throughout this manual: R&S®FSWP is abbreviated as R&S FSWP.

R&S®FSWP-K50
1 Preface.................................................................................................... 5
1.1 About this Manual......................................................................................................... 5
1.2 Documentation Overview............................................................................................. 6
1.3 Conventions Used in the Documentation...................................................................7
2 Welcome to the R&S FSWP Spurious measurements application....9
2.1 Starting the R&S FSWP Spurious measurements application................................. 9
2.2 Understanding the Display Information....................................................................10
3 Measurement Basics........................................................................... 13
3.1 Spurious Emissions....................................................................................................13
3.2 Frequency Plan and Spur Identification................................................................... 13
Contents
Contents
3.3 Measurement Process................................................................................................ 14
4 Measurement Types and Results....................................................... 16
4.1 Evaluation Methods.................................................................................................... 16
5 Configuration........................................................................................22
5.1 Configuration Overview..............................................................................................22
5.2 Input / Output Settings................................................................................................24
5.3 Trigger Settings...........................................................................................................28
5.4 Measurement Settings................................................................................................33
5.5 Carrier Reference Settings.........................................................................................36
5.6 Wide Search Measurement Settings......................................................................... 39
5.7 Identification Settings - DUT Frequency Plan.......................................................... 45
5.8 Transferring Settings Between Measurements........................................................49
5.9 Directed Search Measurement Settings................................................................... 51
5.10 Display Configuration.................................................................................................58
5.11 Result Configuration...................................................................................................58
5.12 Sweep Settings............................................................................................................61
5.13 Adjusting Settings Automatically..............................................................................61
6 Analysis................................................................................................ 63
6.1 Y-Scaling......................................................................................................................63
6.2 Trace Settings..............................................................................................................65
3User Manual 1178.7075.02 ─ 04

R&S®FSWP-K50
6.3 Trace / Table Export Configuration............................................................................65
6.4 Markers........................................................................................................................ 67
6.5 Display Line Settings..................................................................................................75
7 How to Perform Spurious Measurements..........................................76
7.1 How to Perform a Wide Search Measurement..........................................................76
7.2 How to Perform a Directed Search Measurement....................................................77
7.3 How to Perform a Combined Wide Search Measurement and Directed Search
7.4 How to Perform a Spurious Search Measurement with a DUT Frequency Plan... 79
8 Remote Commands to Perform Spurious Measurements............... 81
8.1 Introduction................................................................................................................. 82
8.2 Activating Spurious Measurements.......................................................................... 87
Contents
Measurement............................................................................................................... 78
8.3 Configuring Spurious Measurements....................................................................... 90
8.4 Performing Measurements.......................................................................................154
8.5 Analyzing Spurious Measurements........................................................................ 156
8.6 Retrieving Results.....................................................................................................176
8.7 Status Reporting System......................................................................................... 183
8.8 Programming Examples: Spurious Emissions Measurements............................ 183
Annex.................................................................................................. 190
A Reference: ASCII File Export Format............................................... 190
List of Remote Commands (Spurious).............................................192
Index....................................................................................................197
4User Manual 1178.7075.02 ─ 04

R&S®FSWP-K50
1 Preface
1.1 About this Manual
Preface
About this Manual
This Spurious Measurements User Manual provides all the information specific to the
application. All general instrument functions and settings common to all applications
and operating modes are described in the main R&S FSWP User Manual.
The main focus in this manual is on the measurement results and the tasks required to
obtain them. The following topics are included:
●
Welcome to the R&S FSWP Spurious measurements application
Introduction to and getting familiar with the application
●
About the measurement
General concept of the Spurious measurement and typical applications
●
Measurements and Result Displays
Details on supported measurements and their result types
●
Measurement Basics
Background information on basic terms and principles in the context of the measurement
●
Configuration + Analysis
A concise description of all functions and settings available to configure measurements and analyze results with their corresponding remote control command
●
How to Perform Measurements in the R&S FSWP Spurious measurements
application
Step-by-step instructions to perform a basic Spurious measurement
●
Measurement Examples
Detailed measurement examples to guide you through typical measurement scenarios and allow you to try out the application immediately
●
Optimizing and Troubleshooting the Measurement
Hints and tips on how to handle errors and optimize the test setup
●
Remote Commands for Spurious Measurements
Remote commands required to configure and perform Spurious measurements in a
remote environment, sorted by tasks
(Commands required to set up the environment or to perform common tasks on the
instrument are provided in the main R&S FSWP User Manual)
Programming examples demonstrate the use of many commands and can usually
be executed directly for test purposes
●
Annex
Reference material
●
List of remote commands
Alphabetical list of all remote commands described in the manual
●
Index
5User Manual 1178.7075.02 ─ 04

R&S®FSWP-K50
1.2 Documentation Overview
1.2.1 Getting Started Manual
1.2.2 User Manuals and Help
Preface
Documentation Overview
This section provides an overview of the R&S FSWP user documentation. Unless
specified otherwise, you find the documents on the R&S FSWP product page at:
www.rohde-schwarz.com/manual/FSWP
Introduces the R&S FSWP and describes how to set up and start working with the
product. Includes basic operations, typical measurement examples, and general information, e.g. safety instructions, etc.
A printed version is delivered with the instrument. A PDF version is available for download on the Internet.
The user manual contains the description of all instrument modes and functions. It also
provides an introduction to remote control, a complete description of the remote control
commands with programming examples, and information on maintenance, instrument
interfaces and error messages. Includes the contents of the getting started manual.
The contents of the user manual are available as help in the R&S FSWP. The help
offers quick, context-sensitive access to the complete information for the instrument
and its firmware.
The user manual is also available for download or for immediate display on the Internet.
1.2.3 Service Manual
Describes the performance test for checking the rated specifications, module replacement and repair, firmware update, troubleshooting and fault elimination, and contains
mechanical drawings and spare part lists.
The service manual is available for registered users on the global Rohde & Schwarz
information system (GLORIS):
https://gloris.rohde-schwarz.com
1.2.4 Instrument Security Procedures
Deals with security issues when working with the R&S FSWP in secure areas. It is
available for download on the Internet.
6User Manual 1178.7075.02 ─ 04

R&S®FSWP-K50
1.2.5 Printed Safety Instructions
1.2.6 Data Sheets and Brochures
1.2.7 Release Notes and Open Source Acknowledgment (OSA)
Preface
Conventions Used in the Documentation
Provides safety information in many languages. The printed document is delivered with
the product.
The data sheet contains the technical specifications of the R&S FSWP. It also lists the
firmware applications and their order numbers, and optional accessories.
The brochure provides an overview of the instrument and deals with the specific characteristics.
See www.rohde-schwarz.com/brochure-datasheet/FSWP
The release notes list new features, improvements and known issues of the current
firmware version, and describe the firmware installation.
The open-source acknowledgment document provides verbatim license texts of the
used open source software.
See www.rohde-schwarz.com/firmware/FSWP
1.2.8 Application Notes, Application Cards, White Papers, etc.
These documents deal with special applications or background information on particular topics.
See www.rohde-schwarz.com/application/FSWP
1.3 Conventions Used in the Documentation
1.3.1 Typographical Conventions
The following text markers are used throughout this documentation:
Convention Description
"Graphical user interface elements"
[Keys] Key and knob names are enclosed by square brackets.
All names of graphical user interface elements on the screen, such as
dialog boxes, menus, options, buttons, and softkeys are enclosed by
quotation marks.
7User Manual 1178.7075.02 ─ 04

R&S®FSWP-K50
Preface
Conventions Used in the Documentation
Convention Description
Filenames, commands,
program code
Input Input to be entered by the user is displayed in italics.
Links Links that you can click are displayed in blue font.
"References" References to other parts of the documentation are enclosed by quota-
Filenames, commands, coding samples and screen output are distinguished by their font.
tion marks.
1.3.2 Conventions for Procedure Descriptions
When operating the instrument, several alternative methods may be available to perform the same task. In this case, the procedure using the touchscreen is described.
Any elements that can be activated by touching can also be clicked using an additionally connected mouse. The alternative procedure using the keys on the instrument or
the on-screen keyboard is only described if it deviates from the standard operating procedures.
The term "select" may refer to any of the described methods, i.e. using a finger on the
touchscreen, a mouse pointer in the display, or a key on the instrument or on a keyboard.
1.3.3 Notes on Screenshots
When describing the functions of the product, we use sample screenshots. These
screenshots are meant to illustrate as many as possible of the provided functions and
possible interdependencies between parameters. The shown values may not represent
realistic usage scenarios.
The screenshots usually show a fully equipped product, that is: with all options installed. Thus, some functions shown in the screenshots may not be available in your particular product configuration.
8User Manual 1178.7075.02 ─ 04

R&S®FSWP-K50
Welcome to the R&S FSWP Spurious measurements application
Starting the R&S
FSWP Spurious measurements application
2 Welcome to the R&S FSWP Spurious mea-
surements application
The R&S FSWP-K50 is a firmware application that allows you to perform Spurious
measurements on the R&S FSWP very quickly and easily.
As an addition to the basic Spurious measurements available in the R&S FSWP base
unit, the R&S FSWP Spurious measurements application features:
●
Very quick spurious measurements on predefined measurement ranges using optimized RBWs
●
Simple configuration of spurious measurements
●
Storage of user-defined measurement configurations
●
Measurement of both the power and the frequency of detected spurs
●
Analysis methods to determine spurs generated internally by the spectrum analyzer itself, and to eliminate these effects
Availability of the Spurious measurement application
Using the Spurious measurement application requires the optional Spectrum Analyzer
hardware (R&S FSWP-B1).
This user manual contains a description of the functionality that the application provides, including remote control operation.
All functions not discussed in this manual are the same as in the base unit and are
described in the R&S FSWP User Manual. The latest version is available for download
at the product homepage.
Installation
You can find detailed installation instructions in the "R&S FSWP Getting Started" manual or in the release notes.
2.1 Starting the R&S FSWP Spurious measurements
application
The R&S FSWP Spurious measurements application adds a new application to the
R&S FSWP.
To activate the R&S FSWP Spurious measurements application
1. Press the [MODE] key on the front panel of the R&S FSWP.
A dialog box opens that contains all operating modes and applications currently
available on your R&S FSWP.
9User Manual 1178.7075.02 ─ 04

R&S®FSWP-K50
Welcome to the R&S FSWP Spurious measurements application
Understanding the Display Information
2. Select the "Fast Spur Search" item.
The R&S FSWP opens a new measurement channel for the R&S FSWP Spurious
measurements application.
The measurement is started immediately with the default settings. It can be configured
in the Spurious "Overview" dialog box, which is displayed when you select the "Overview" softkey from any menu (see Chapter 5.1, "Configuration Overview",
on page 22).
Multiple Measurement Channels and Sequencer Function
When you activate an application, a new measurement channel is created which determines the measurement settings for that application. The same application can be activated with different measurement settings by creating several channels for the same
application.
The number of channels that can be configured at the same time depends on the available memory on the instrument.
Only one measurement can be performed at any time, namely the one in the currently
active channel. However, a Sequencer function is provided that allows you to perform
the configured measurements consecutively.
If activated, the measurements configured in the currently active channels are performed one after the other in the order of the tabs. The currently active measurement is
indicated by a
are updated in the tabs (including the "MultiView") as the measurements are performed. Sequential operation itself is independent of the currently displayed tab.
For details on the Sequencer function, see the R&S FSWP User Manual.
symbol in the tab label. The result displays of the individual channels
2.2 Understanding the Display Information
The following figure shows a measurement diagram during analyzer operation. All different information areas are labeled. They are explained in more detail in the following
sections.
10User Manual 1178.7075.02 ─ 04

R&S®FSWP-K50
Welcome to the R&S FSWP Spurious measurements application
Understanding the Display Information
1
6
5
1 = Channel bar for firmware and measurement settings
2+3 = Window title bar with diagram-specific (trace) information
4 = Diagram area with spur detection threshold and limit offset lines
5 = Diagram footer with diagram-specific information, depending on measurement application
6 = Instrument status bar with error messages, progress bar and date/time display
4
Channel bar information
In the R&S FSWP Spurious measurements application, the R&S FSWP shows the following settings:
2
3
Table 2-1: Information displayed in the channel bar in the R&S
cation
"Ref Level" Reference level
"Spur Search" Measurement type ("Wide", "Direct")
"RBW" Currently used RBW during measurement
"Freq" Currently processed center frequency during measurement
"SGL" The measurement is set to single mode
"Meas Time" A minimum estimate for the required measurement time; available after
Spectral Overview is finished
Note that the estimate includes a spurious detection sweep and spot
search, assuming 10 spur candidates are found in the spurious detection
sweep. If the signal to be measured does not meet the assumptions, the
estimated measurement time may be too low.
FSWP Spurious measurements appli-
The channel bar also displays information on instrument settings that affect the measurement results even though this is not immediately apparent from the display of the
measured values (e.g. transducer or trigger settings). This information is displayed only
11User Manual 1178.7075.02 ─ 04
R&S®FSWP-K50
Welcome to the R&S FSWP Spurious measurements application
Understanding the Display Information
when applicable for the current measurement. For details, see the R&S FSWP Getting
Started manual.
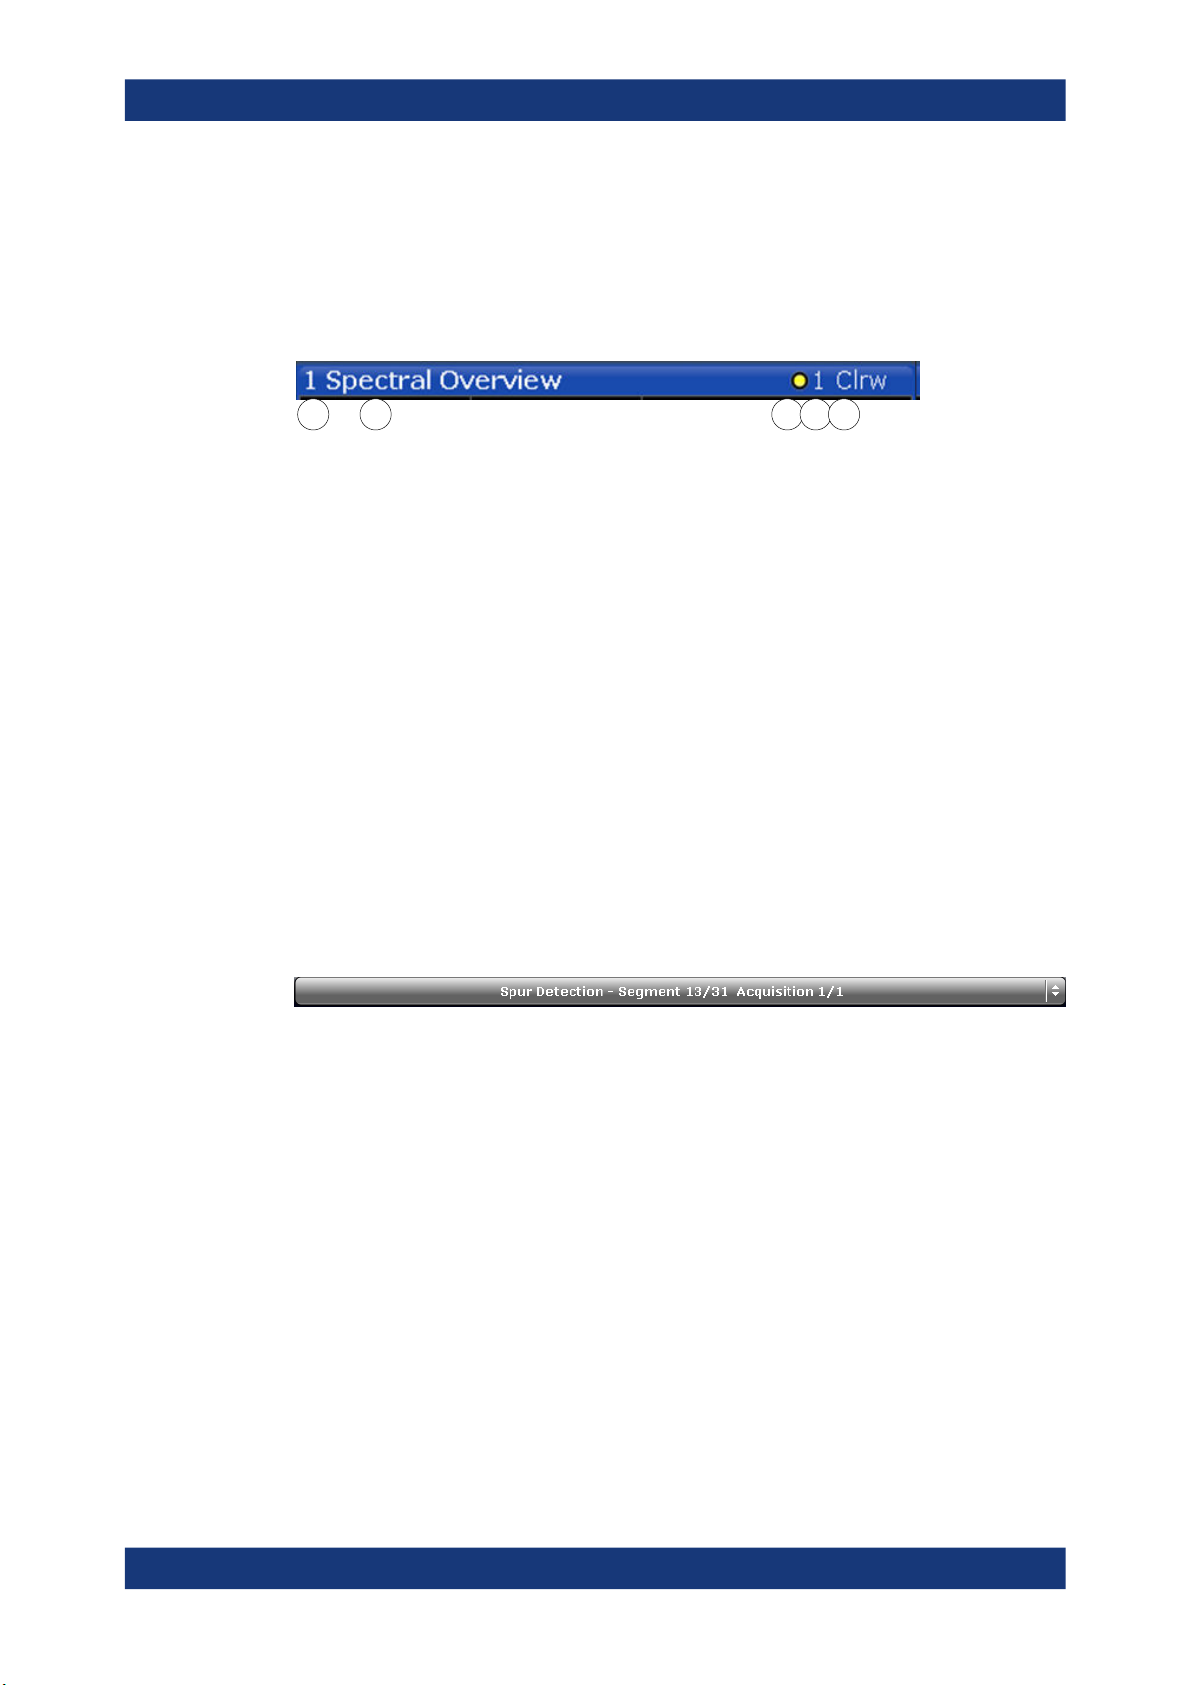
Window title bar information
For each diagram, the header provides the following information:
1 2 3 4 5
Figure 2-1: Window title bar information in the R&S FSWP Spurious measurements application
1 = Window number
2 = Window type
3 = Trace color
4 = Trace number
5 = Trace mode
Diagram footer information
The diagram footer (beneath the diagram) contains the following information:
●
Start and stop frequency
●
Number of trace points
●
Range per division (x-axis)
Status bar information
Global instrument settings, the instrument status and any irregularities are indicated in
the status bar beneath the diagram. Furthermore, the progress of the current measurement is displayed in the status bar. For details on the measurement process, see
Chapter 3.3, "Measurement Process", on page 14.
Depending on the currently running measurement (step), the following information is
indicated in the status bar:
●
Which measurement step is being performed
●
The total number of segments required to meet the user specification and the segment currently being processed
●
The total number of data acquisitions required to meet the user specification and
the acquisition currently being processed
12User Manual 1178.7075.02 ─ 04

R&S®FSWP-K50
3 Measurement Basics
3.1 Spurious Emissions
Measurement Basics
Frequency Plan and Spur Identification
Some background knowledge on basic terms and principles used in Spurious measurements is provided here for a better understanding of the required configuration settings.
● Spurious Emissions.................................................................................................13
● Frequency Plan and Spur Identification.................................................................. 13
● Measurement Process............................................................................................ 14
Spurious emissions can be generated by a variety of processes, including:
●
Instability, parasitic oscillations and resonances
●
Harmonics
●
Interference: RF leakage, EMI ingress from digital clocks
●
Modulation: Intermodulation (IM) and cross-modulation (CM) effects
●
Spurs internally generated by the test equipment (spectrum analyzer)
These spurious emissions can cause problems for the equipment manufacturer including:
●
Interference with radio transmissions in adjacent bands
●
Interference with other modules contained within the equipment
●
Violation of regulatory limits
●
Power inefficiencies due to the transmissions of non-usable frequencies
Thus, the R&S FSWP Spurious measurements application allows you to detect, measure and identify spurious signals, based on common spectrum analyzer functionality.
Residuals
Residuals are spurs that are created by the analyzer itself. These spurs are identified
by the R&S FSWP Spurious measurements application automatically, and can be displayed or removed from the measured results.
3.2 Frequency Plan and Spur Identification
You can define the main components in the signal chain of your DUT with the corresponding frequencies in a frequency plan. Then the R&S FSWP Spurious measurements application can calculate the frequencies for possible spurs at those frequencies
and the frequencies of mixer products up to a maximum number of harmonics. After a
measurement, the R&S FSWP Spurious measurements application compares the
detected spurious results to the predicted frequencies. Spurs that occur at one of the
predicted frequencies are identified. Thus, you get an idea of the possible source of the
spurs.
13User Manual 1178.7075.02 ─ 04

R&S®FSWP-K50
3.3 Measurement Process
Measurement Basics
Measurement Process
Note that if several combinations of components, input frequencies and harmonics lead
to the same predicted spur frequency, the spur identification with the lowest harmonic
is indicated. If the frequency is still not unique, the identification with the shortest string
length is indicated.
If you transfer the predicted frequencies from a frequency plan to a directed search
measurement, the measurement is only performed at the frequencies specified in the
plan.
For details on how to perform a measurement using a frequency plan, see Chapter 7.4,
"How to Perform a Spurious Search Measurement with a DUT Frequency Plan",
on page 79.
The R&S FSWP Spurious measurements application provides two different measurement types (see also Chapter 4, "Measurement Types and Results", on page 16):
●
A measurement on a wide frequency range (wide search measurement), intended
for unknown spurious scenarios.
●
A detailed measurement (directed search measurement) at specific frequencies
with a small span around each frequency.
Although the two measurement types use different measurement settings, the individual measurement steps are the same for both types.
The basic measurement process consists of the following steps:
1. Spectral overview: An initial sweep from the beginning of the first defined range to
the end of the last defined range (for directed search measurement: from the first
to the last span), using a large RBW and short sweep time to obtain an overview of
the input signal quickly.
The spectral overview allows the R&S FSWP Spurious measurements application
to estimate the noise floor for the current user settings for the complete frequency
span defined by the ranges or directed search measurements.
Note: If the signal contains a guard interval, you can restrict the spur search to
ignore a certain span around the carrier. In this case, the spectral overview contains gaps at the specified spans.
2. Noise floor estimation: Estimation of the noise floor from the beginning of the first
defined range to the end of the last defined range (for directed search measurement: from the first to the last span), determined from the spectral overview sweep.
The noise floor estimate is required to set the RBW optimally for subsequent measurement steps: Due to noise variations across the frequencies, the RBW required
to achieve the user-defined spur detection threshold varies. Each range is thus
split into smaller segments that use a constant RBW setting for the complete segment span. The frequency span of the segments depends on the signal and noise
conditions and on the settings. As a result, a segment table is created. This table
14User Manual 1178.7075.02 ─ 04

R&S®FSWP-K50
Measurement Basics
Measurement Process
can be analyzed and used for repeated measurements with the same settings (see
Chapter 5.8, "Transferring Settings Between Measurements", on page 49).
3. Spurious detection: A second sweep performed in the predefined ranges/
segments/spans according to the wide search measurement/directed search measurement configuration. The RBW determined by the noise floor estimate or, for
manual RBW configuration, the user-defined RBW is used. Depending on the size
of the range/span and the required RBW, multiple data acquisitions (or more precisely: FFTs) may be required.
Within the defined and swept ranges/spans, the noise floor is displayed below the
user-defined spur detection threshold. Outside the ranges/spans, no trace is available.
Measured power values that exceed the detection threshold are possible spurs and
are entered in the "Spurious Detection Table".
4. Spot Search: A final sweep on each of the possible spurs in the "Spurious Detection Table" to determine whether the peak is a real spur, an artifact of noise, or generated internally. The RBW for these spot searches may be reduced further compared to the spurious detection sweep: It is set such that the final spur has at least
the user-defined minimum SNR (see "Minimum Spur SNR" on page 57).
The lower RBW leads to a lower noise floor for this scan region compared to the
surrounding regions. Thus, a message indicating the possibility of lower noise
floors is displayed during the spot search (see "Show Messages" on page 60).
Spurs that are found to be artifacts of noise or residuals during the spot search are
removed from the "Spurious Detection Table". (Alternatively, residuals can be
marked instead of removed).
After the spot search, the "Spurious Detection Table" contains all peaks that still
exceed the detection threshold, and are considered a spur. All spurs that exceed
the limit line are marked red (see "Limit Offset to Detection Threshold"
on page 53). The spur frequency and level are updated with more accurate values during the spot search.
15User Manual 1178.7075.02 ─ 04

R&S®FSWP-K50
4 Measurement Types and Results
Measurement Types and Results
Evaluation Methods
Access: "Overview" > "Measurement Control"
Or: [MEAS CONFIG] > "Measurement Control"
There are two different Spurious measurement types for common measurement scenarios, which require different settings.
Wide Search Measurement
A wide search measurement is a measurement with a large span to detect any possible spurs in the entire frequency span of an input signal. This measurement is useful if
you have little or no knowledge of the current input signal or where to expect spurs,
and require an overview.
Directed Search Measurement
A directed search measurement is a measurement performed at predefined discrete
frequencies with settings optimized for the current signal and noise levels at those frequencies. This measurement is targeted at determining the precise level and exact frequency of spurs that are basically known or expected.
The results of both measurements on the same signal are basically the same; however, the directed search measurement can save measurement time if the frequencies
for possible spurs are known in advance. Furthermore, the directed search measurement can provide more precise results, using a larger SNR for a smaller span.
Combined Wide Search Measurement and Directed Search Measurement
Both types of measurement can be combined, if only some of the spurs found during
the wide search measurement are to be analyzed further:
1. Perform a wide search measurement to obtain an overview and detect the spurs in
a large frequency span.
2. Transfer the frequencies of interest to the directed search measurement configuration.
3. Perform a directed search measurement at the frequencies of interest only in a
second measurement.
4.1 Evaluation Methods
Access: "Overview" > "Display Config"
Or: [MEAS]
16User Manual 1178.7075.02 ─ 04

R&S®FSWP-K50
Measurement Types and Results
Evaluation Methods
The data that was measured by the R&S FSWP Spurious measurements application
can be evaluated using various different methods. All evaluation methods available for
the Spurious measurements are displayed in the selection bar in SmartGrid mode.
For details on working with the SmartGrid, see the R&S FSWP Getting Started manual.
By default, the following result displays are provided for Spurious measurements:
●
"Spectral Overview" on page 17
●
"Spurious Detection Spectrum" on page 18
●
"Spurious Detection Table" on page 19
Spectral Overview.........................................................................................................17
Spurious Detection Spectrum....................................................................................... 18
Spurious Detection Table.............................................................................................. 19
Noise Floor Estimate.....................................................................................................20
Marker Table ................................................................................................................ 20
Spectral Overview
Displays a spectrum diagram of the "Spectral Overview" (see Chapter 3.3, "Measure-
ment Process", on page 14), meant to obtain an overview of the input signal and the
required measurement settings. A continuous trace is shown for the entire measurement span.
The specified detection threshold for each range/span is indicated by a blue line in the
diagram (only if it is within the displayed power region, see "Detection Threshold"
on page 57).
Note: If the signal contains a guard interval, you can restrict the spur search to ignore
a certain span around the carrier. In this case, the spectral overview contains gaps at
the specified spans.
17User Manual 1178.7075.02 ─ 04

R&S®FSWP-K50
Measurement Types and Results
Evaluation Methods
Remote command:
LAY:ADD? '1',RIGH,SOVerview, see LAYout:ADD[:WINDow]? on page 147
Storing results:
MMEMory:STORe<n>:TRACe on page 181
Spurious Detection Spectrum
Displays the results of the spurious detection sweep (see Chapter 3.3, "Measurement
Process", on page 14) as a spectrum diagram for the (discrete) swept ranges. For
ranges that include gaps and for directed search measurements, the diagram shows
several separate trace parts, one for each measured frequency range or span.
The specified detection threshold for each range/span is indicated by a blue line in the
diagram (see "Detection Threshold" on page 57).
The limit line defined as an offset to the detection threshold is indicated by a red line in
the diagram (see "Limit Offset to Detection Threshold" on page 53).
Colored bars beneath the diagram indicate the specified measurement ranges (see
Chapter 3.3, "Measurement Process", on page 14).
(Both lines and the colored bars can be hidden, see Chapter 5.11.2, "Results Settings",
on page 59.)
The result of the overall limit check for the entire measurement is indicated at the top of
the diagram. If any spurs exceed the defined limit line for the corresponding range or
span, the limit check is failed.
Remote command:
LAY:ADD? '1',RIGH,SDETection, see LAYout:ADD[:WINDow]? on page 147
Storing results:
MMEMory:STORe<n>:TRACe on page 181
18User Manual 1178.7075.02 ─ 04

R&S®FSWP-K50
Measurement Types and Results
Evaluation Methods
Spurious Detection Table
Displays the numerical results of the detected spurs. Optionally, residual spurs are indicated in light gray (see "Mark Residual Spurs" on page 35). Spurs that exceed the
defined limit are indicated in red (see "Limit Offset to Detection Threshold"
on page 53).
During the measurement process (see Chapter 3.3, "Measurement Process",
on page 14), the values are updated and refined. The spurs are listed in the order they
are detected, that is: in ascending order of frequency. Each spur ID is indicated in the
same color as the range it was found in (see also "Spurious Detection Spectrum"
on page 18).
If identification according to the DUT's frequency plan is activated and possible, the
detected spurs' identification is also displayed. Note that if several combinations of
components, input frequencies and harmonics lead to the same predicted spur frequency, the spur identification with the lowest harmonic is indicated. If the frequency is
still not unique, the identification with the shortest value is indicated.
Note: You can configure which results to display in the table in order to use the available display space optimally or reduce the time to store the results (see Chapter 5.11.1,
"Spurious Detection Table Configuration", on page 58).
Table 4-1: Spurious Detection Table Results
Column Description
"Frequency" The frequency of the spur
"Power" The power level measured at the spur
"Delta to Limit" The difference between the measured power and the defined limit value
"RBW" The RBW that was used in that range
"Segment
Start" / "Segment Stop"
"Spur ID" Consecutive number of spur in the order it was found; indicated in same color as the
"Identification" Identified spur from the frequency plan, if available
The start and stop frequency of the segment in which the spur was found;
(For measurements without optimization, the values correspond to the range frequen-
cies.)
range it was found in
Remote command:
LAY:ADD? '1',RIGH,SDTable, see LAYout:ADD[:WINDow]? on page 147
Storing results:
MMEMory:STORe<n>:TABLe on page 181
19User Manual 1178.7075.02 ─ 04

R&S®FSWP-K50
Measurement Types and Results
Evaluation Methods
Noise Floor Estimate
Displays the noise floor estimated during the "Spectral Overview". This information
helps you understand the RBWs used for the individual segments by the R&S FSWP
Spurious measurements application.
Remote command:
LAY:ADD? '1',RIGH,NESTimate, see LAYout:ADD[:WINDow]? on page 147
Storing results:
MMEMory:STORe<n>:TRACe on page 181
Marker Table
Displays a table with the current marker values for the active markers.
This table is displayed automatically if configured accordingly.
Type Shows the marker type and number ("M" for a nor-
mal marker, "D" for a delta marker).
Ref Shows the reference marker that a delta marker
refers to.
Trace Shows the trace that the marker is positioned on.
X- / Y-Value Shows the marker coordinates (usually frequency
and level).
Tip: To navigate within long marker tables, simply scroll through the entries with your
finger on the touchscreen.
Remote command:
LAY:ADD? '1',RIGH, MTAB, see LAYout:ADD[:WINDow]? on page 147
Results:
20User Manual 1178.7075.02 ─ 04

R&S®FSWP-K50
Measurement Types and Results
Evaluation Methods
CALCulate<n>:MARKer<m>:X on page 164
CALCulate<n>:MARKer<m>:Y? on page 183
21User Manual 1178.7075.02 ─ 04

R&S®FSWP-K50
5 Configuration
Configuration
Configuration Overview
Access: [MODE] > "Spurious"
Spurious measurements require a special application on the R&S FSWP.
When you switch a measurement channel to the R&S FSWP Spurious measurements
application the first time, a set of parameters is passed on from the currently active
application. After initial setup, the parameters for the measurement channel are stored
upon exiting and restored upon re-entering the channel. Thus, you can switch between
applications quickly and easily.
When you activate a measurement channel in the R&S FSWP Spurious measurements application, the "Spurious" menu is displayed and provides access to the most
important configuration functions.
● Configuration Overview...........................................................................................22
● Input / Output Settings............................................................................................ 24
● Trigger Settings.......................................................................................................28
● Measurement Settings............................................................................................ 33
● Carrier Reference Settings......................................................................................36
● Wide Search Measurement Settings.......................................................................39
● Identification Settings - DUT Frequency Plan......................................................... 45
● Transferring Settings Between Measurements.......................................................49
● Directed Search Measurement Settings................................................................. 51
● Display Configuration..............................................................................................58
● Result Configuration................................................................................................58
● Sweep Settings....................................................................................................... 61
● Adjusting Settings Automatically.............................................................................61
5.1 Configuration Overview
Access: all menus
Throughout the measurement channel configuration, an overview of the most important
currently defined settings is provided in the "Overview".
22User Manual 1178.7075.02 ─ 04

R&S®FSWP-K50
Configuration
Configuration Overview
In addition to the main measurement settings, the "Overview" provides quick access to
the main settings dialog boxes. The individual configuration steps are displayed in the
order of the data flow. Thus, you can easily configure an entire measurement channel
from input over processing to output by stepping through the dialog boxes as indicated
in the "Overview".
Depending on the measurement currently selected in the Measurement Settings settings, the required steps in the overview differ slightly.
In particular, the "Overview" provides quick access to the following configuration dialog
boxes:
1. Input/ Output/Trigger
See Chapter 5.2, "Input / Output Settings", on page 24
2. Carrier Reference Settings
See Chapter 5.5, "Carrier Reference Settings", on page 36
3. Measurement Settings
See Chapter 5.4, "Measurement Settings", on page 33
4. Wide Search Settings
See Chapter 5.6, "Wide Search Measurement Settings", on page 39
5. Frequency Plan
See Chapter 5.7, "Identification Settings - DUT Frequency Plan", on page 45
6. Transfer
See Chapter 5.8.2, "Spur Table", on page 50/ Chapter 5.8.1, "Segment Table",
on page 49
7. Directed Search Settings
See Chapter 5.9, "Directed Search Measurement Settings", on page 51
8. Display Configuration
23User Manual 1178.7075.02 ─ 04

R&S®FSWP-K50
Configuration
Input / Output Settings
See Chapter 5.10, "Display Configuration", on page 58
To configure settings
► Select any button to open the corresponding dialog box. To configure a particular
setting displayed in the "Overview", simply select the setting on the touch screen.
The corresponding dialog box is opened with the focus on the selected setting.
For step-by-step instructions on configuring Spurious measurements, see Chapter 7,
"How to Perform Spurious Measurements", on page 76.
Preset Channel
Select the "Preset Channel" button in the lower left-hand corner of the "Overview" to
restore all measurement settings in the current channel to their default values.
Do not confuse the "Preset Channel" button with the [Preset] key, which restores the
entire instrument to its default values and thus closes all channels on the R&S FSWP
(except for the default channel)!
Remote command:
SYSTem:PRESet:CHANnel[:EXEC] on page 90
5.2 Input / Output Settings
Access: "Overview" > "Input/Output/Trigger"
The R&S FSWP can evaluate signals from different input sources.
● RF Input.................................................................................................................. 24
● Power Sensors........................................................................................................27
● Probes.....................................................................................................................27
● External Mixers....................................................................................................... 27
● General Output........................................................................................................28
● DC Power Output....................................................................................................28
● Signal Source Output..............................................................................................28
5.2.1 RF Input
Access: "Overview" > "Input/Output/Trigger" > "Input Source" > "Radio Frequency"
24User Manual 1178.7075.02 ─ 04

R&S®FSWP-K50
Configuration
Input / Output Settings
The remote commands required to configure the RF input are described in Chap-
ter 8.3.1, "Configuring the Data Input", on page 90.
Radio Frequency State ................................................................................................ 25
Input Coupling ..............................................................................................................25
Impedance ................................................................................................................... 26
Direct Path ................................................................................................................... 26
High Pass Filter 1 to 3 GHz ..........................................................................................26
YIG-Preselector ............................................................................................................26
Input Connector ............................................................................................................27
Radio Frequency State
Activates input from the "RF Input" connector.
Remote command:
INPut<ip>:SELect on page 94
Input Coupling
The RF input of the R&S FSWP can be coupled by alternating current (AC) or direct
current (DC).
AC coupling blocks any DC voltage from the input signal. This is the default setting to
prevent damage to the instrument. Very low frequencies in the input signal may be distorted.
However, some specifications require DC coupling. In this case, you must protect the
instrument from damaging DC input voltages manually. For details, refer to the data
sheet.
Remote command:
INPut<ip>:COUPling on page 91
25User Manual 1178.7075.02 ─ 04

R&S®FSWP-K50
Configuration
Input / Output Settings
Impedance
For some measurements, the reference impedance for the measured levels of the
R&S FSWP can be set to 50 Ω or 75 Ω.
Select 75 Ω if the 50 Ω input impedance is transformed to a higher impedance using a
75 Ω adapter of the RAZ type. (That corresponds to 25Ω in series to the input impedance of the instrument.) The correction value in this case is 1.76 dB = 10 log (75Ω/
50Ω).
This value also affects the unit conversion.
Remote command:
INPut<ip>:IMPedance on page 93
Direct Path
Enables or disables the use of the direct path for small frequencies.
In spectrum analyzers, passive analog mixers are used for the first conversion of the
input signal. In such mixers, the LO signal is coupled into the IF path due to its limited
isolation. The coupled LO signal becomes visible at the RF frequency 0 Hz. This effect
is referred to as LO feedthrough.
To avoid the LO feedthrough the spectrum analyzer provides an alternative signal path
to the A/D converter, referred to as the direct path. By default, the direct path is
selected automatically for RF frequencies close to zero. However, this behavior can be
disabled. If "Direct Path" is set to "Off" , the spectrum analyzer always uses the analog
mixer path.
"Auto"
"Off"
Remote command:
INPut<ip>:DPATh on page 92
(Default) The direct path is used automatically for frequencies close
to zero.
The analog mixer path is always used.
High Pass Filter 1 to 3 GHz
Activates an additional internal high-pass filter for RF input signals from 1 GHz to
3 GHz. This filter is used to remove the harmonics of the analyzer to measure the harmonics for a DUT, for example.
This function requires an additional hardware option.
(Note: for RF input signals outside the specified range, the high-pass filter has no
effect. For signals with a frequency of approximately 4 GHz upwards, the harmonics
are suppressed sufficiently by the YIG-preselector, if available.)
Remote command:
INPut<ip>:FILTer:HPASs[:STATe] on page 92
YIG-Preselector
Enables or disables the YIG-preselector, if available on the R&S FSWP.
The R&S FSWP Spurious measurements application requires the YIG-preselector at
the input of the R&S FSWP to ensure that image frequencies are rejected. However,
this is only possible for a restricted bandwidth.
26User Manual 1178.7075.02 ─ 04

R&S®FSWP-K50
5.2.2 Power Sensors
Configuration
Input / Output Settings
Note that the YIG-preselector is active only on frequencies greater than 8 GHz. Therefore, switching the YIG-preselector on or off has no effect if the frequency is below that
value.
Remote command:
INPut<ip>:FILTer:YIG[:STATe] on page 93
Input Connector
Determines which connector the input data for the measurement is taken from.
"RF"
"RF Probe"
Remote command:
INPut<ip>:CONNector on page 91
(Default:) the RF INPUT connector
The RF INPUT connector with an adapter for a modular probe
This setting is only available if a probe is connected to the RF INPUT
connector.
Access: "Overview" > "Input/Output/Trigger" > "Power Sensors"
The functionality to use power sensors is the same as in the optional spectrum application.
For a comprehensive description, refer to the user manual of the optional R&S FSWP
spectrum application.
5.2.3 Probes
Access: "Overview" > "Input/Output/Trigger" > "Probes"
The functionality to use probes (via the RF input) is the same as in the optional spectrum application.
For a comprehensive description, refer to the user manual of the optional R&S FSWP
spectrum application.
5.2.4 External Mixers
Access: "Overview" > "Input/Output/Trigger" > "Input Source" > "External Mixer"
Input through external mixers is available with the optional external mixer control hardware.
The features are the same as in the phase noise application. For a comprehensive
description, refer to the R&S FSWP user manual.
27User Manual 1178.7075.02 ─ 04
R&S®FSWP-K50
5.2.5 General Output
5.2.6 DC Power Output
5.2.7 Signal Source Output
Configuration
Trigger Settings
Access: [INPUT/OUTPUT] > "Output Config"
The R&S FSWP Spurious measurements application is able to provide a trigger output
signal. The configuration of the trigger output is described in "Trigger 1/2" on page 32.
Access: [INPUT/OUTPUT] > "Output Config" > "DC Config"
The configuration of the DC power supply is the same as in the phase noise application.
For a comprehensive description, refer to the R&S FSWP user manual.
Access: [INPUT/OUTPUT] > "Output Config" > "Signal Source"
The configuration of the optional signal source is the same as in the phase noise application.
For a comprehensive description, refer to the R&S FSWP user manual.
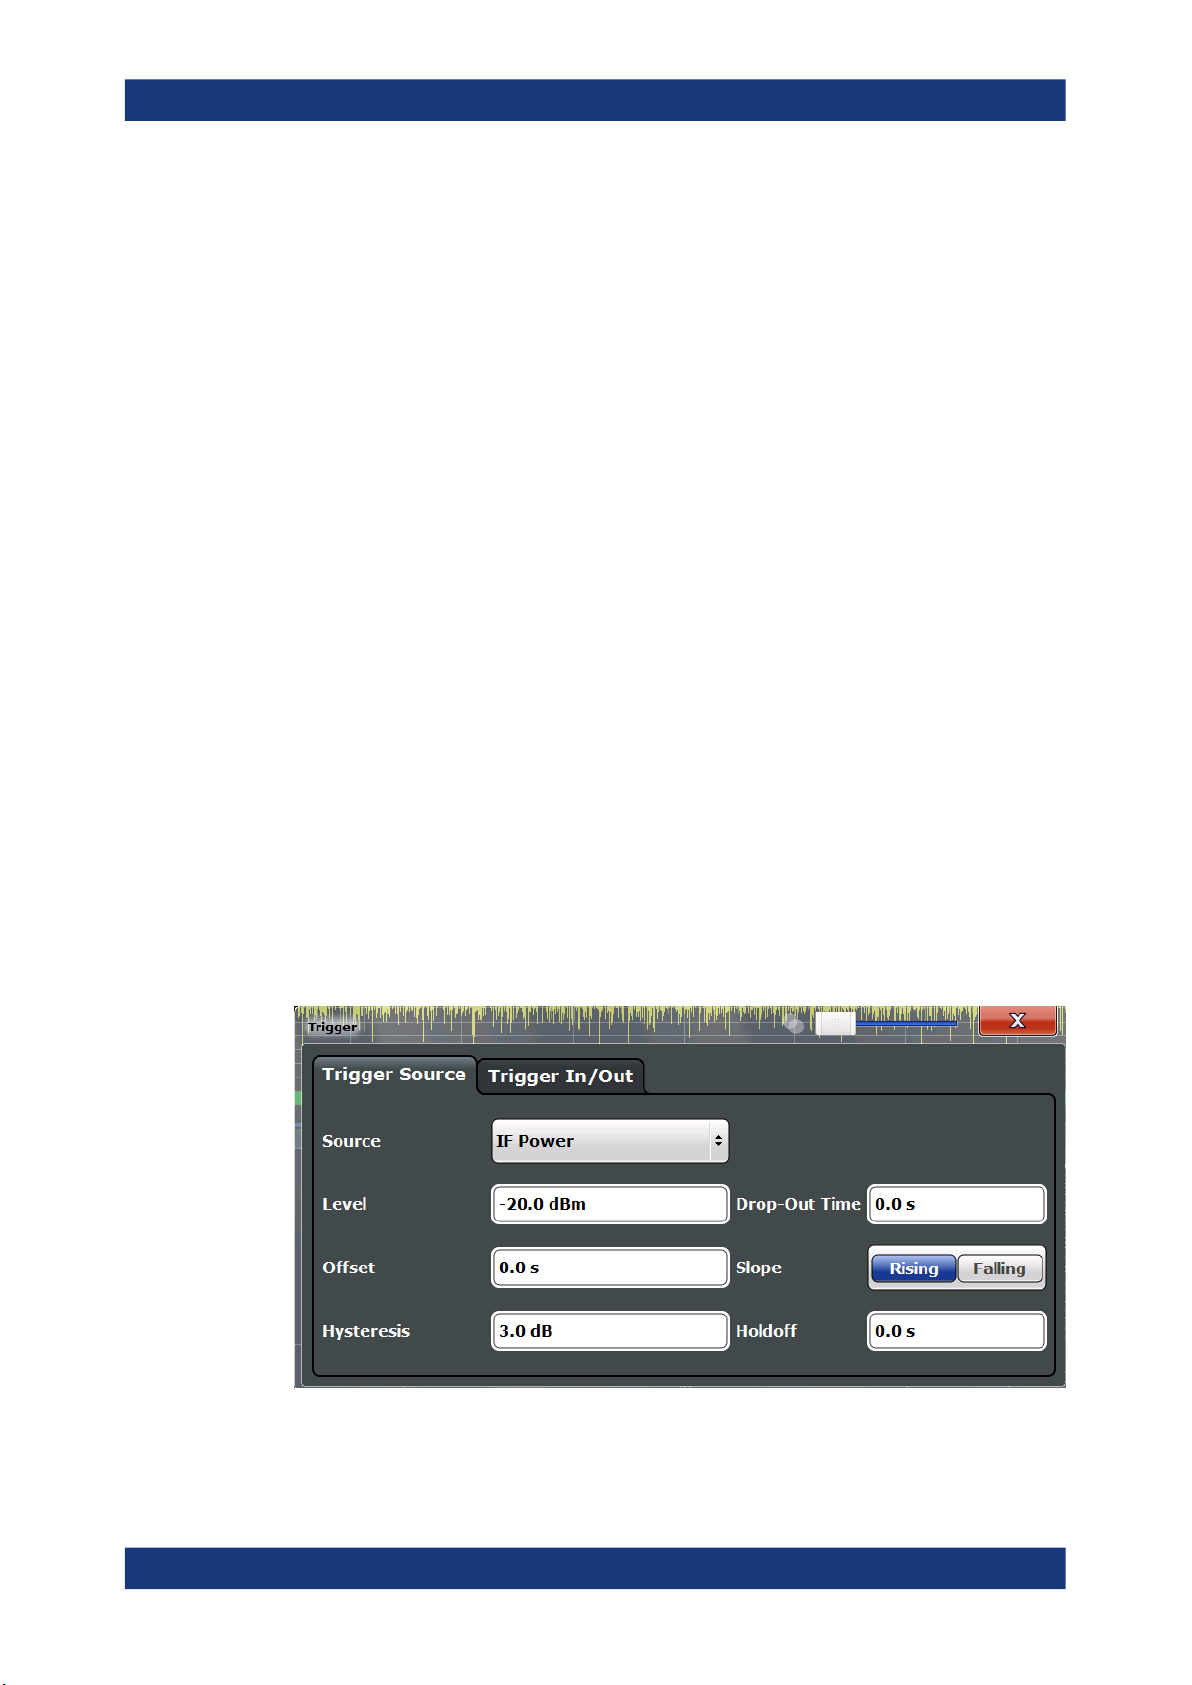
5.3 Trigger Settings
Access: "Overview" > "Input/Output/Trigger" > "Trigger" tab
Trigger settings determine when the input signal is measured.
External triggers from one of the [TRIGGER INPUT/OUTPUT] connectors on the
R&S FSWP are configured in a separate tab of the dialog box.
28User Manual 1178.7075.02 ─ 04

R&S®FSWP-K50
Configuration
Trigger Settings
For step-by-step instructions on configuring triggered measurements, see the main
R&S FSWP User Manual.
Trigger Source...............................................................................................................29
└ Trigger Source................................................................................................ 29
└ Free Run ..............................................................................................29
└ Ext. Trigger 1/2..................................................................................... 30
└ IF Power .............................................................................................. 30
└ RF Power .............................................................................................30
└ Trigger Level ..................................................................................................31
└ Drop-Out Time ............................................................................................... 31
└ Trigger Offset .................................................................................................31
└ Hysteresis ...................................................................................................... 31
└ Trigger Holdoff ............................................................................................... 31
└ Slope ..............................................................................................................32
Trigger 1/2.....................................................................................................................32
└ Output Type ................................................................................................... 32
└ Level .................................................................................................... 33
└ Pulse Length ........................................................................................33
└ Send Trigger ........................................................................................33
Trigger Source
The trigger settings define the beginning of a measurement.
Trigger Source ← Trigger Source
Defines the trigger source. If a trigger source other than "Free Run" is set, "TRG" is
displayed in the channel bar and the trigger source is indicated.
Remote command:
TRIGger[:SEQuence]:SOURce on page 120
Free Run ← Trigger Source ← Trigger Source
No trigger source is considered. Data acquisition is started manually or automatically
and continues until stopped explicitly.
29User Manual 1178.7075.02 ─ 04

R&S®FSWP-K50
Configuration
Trigger Settings
In its default state, the R&S FSWP performs free run measurements.
Remote command:
TRIG:SOUR IMM, see TRIGger[:SEQuence]:SOURce on page 120
Ext. Trigger 1/2 ← Trigger Source ← Trigger Source
Data acquisition starts when the TTL signal fed into the specified input connector
meets or exceeds the specified trigger level.
Note: The "External Trigger 1" softkey automatically selects the trigger signal from the
Trigger Input / Output connector on the front panel.
For details, see the "Instrument Tour" chapter in the R&S FSWP Getting Started manual.
"External Trigger 1"
Trigger signal from the Trigger Input / Output connector.
(front panel)
"External Trigger 2"
Trigger signal from the Sync Trigger Input / Output connector.
(rear panel)
Remote command:
TRIG:SOUR EXT, TRIG:SOUR EXT2
See TRIGger[:SEQuence]:SOURce on page 120
IF Power ← Trigger Source ← Trigger Source
The R&S FSWP starts capturing data as soon as the trigger level is exceeded around
the third intermediate frequency.
For frequency sweeps, the third IF represents the start frequency. The trigger threshold
depends on the defined trigger level, as well as on the RF attenuation and preamplification. A reference level offset, if defined, is also considered. The trigger bandwidth at
the intermediate frequency depends on the RBW and sweep type. For details on available trigger levels and trigger bandwidths see the data sheet.
For measurements on a fixed frequency (e.g. zero span or I/Q measurements), the
third IF represents the center frequency.
This trigger source is only available for RF input.
The available trigger levels depend on the RF attenuation and preamplification. A refer-
ence level offset, if defined, is also considered.
For details on available trigger levels and trigger bandwidths, see the data sheet.
Remote command:
TRIG:SOUR IFP, see TRIGger[:SEQuence]:SOURce on page 120
RF Power ← Trigger Source ← Trigger Source
Defines triggering of the measurement via signals which are outside the displayed
measurement range.
For this purpose, the instrument uses a level detector at the first intermediate frequency.
The input signal must be in the frequency range between 500 MHz and 8 GHz.
30User Manual 1178.7075.02 ─ 04
 Loading...