


R&S® FSV-K30
Firmware Option Noise Figure
Measurements
Operating Manual
(;ÚÙÌ2)
1176.7562.02 ─ 03.1
Operating Manual
Test & Measurement

This manual describes the following options:
●
R&S FSV-K30 (1310.8355.02)
The contents of this manual correspond to the following R&S®FSVR models with firmware version 2.23 or
higher:
●
R&S®FSVR7 (1311.0006K7)
●
R&S®FSVR13 (1311.0006K13)
●
R&S®FSVR30 (1311.0006K30)
●
R&S®FSVR40 (1311.0006K40)
The software contained in this product makes use of several valuable open source software packages. For information, see the
"Open Source Acknowledgement" on the user documentation CD-ROM (included in delivery).
Rohde & Schwarz would like to thank the open source community for their valuable contribution to embedded computing.
© 2015 Rohde & Schwarz GmbH & Co. KG
Mühldorfstr. 15, 81671 München, Germany
Phone: +49 89 41 29 - 0
Fax: +49 89 41 29 12 164
Email: info@rohde-schwarz.com
Internet: www.rohde-schwarz.com
Subject to change – Data without tolerance limits is not binding.
R&S® is a registered trademark of Rohde & Schwarz GmbH & Co. KG.
Trade names are trademarks of the owners.
The following abbreviations are used throughout this manual: R&S®FSV is abbreviated as R&S FSV. R&S®FSVR is abbreviated as
R&S FSVR.

R&S® FSV-K30
1 Preface.................................................................................................... 5
1.1 Documentation Overview............................................................................................. 5
1.2 Conventions Used in the Documentation...................................................................7
1.3 How to Use the Help System........................................................................................8
2 Introduction.......................................................................................... 10
3 Measurement Basics........................................................................... 11
3.1 Measurement Types....................................................................................................11
3.2 Measurement Modes of the Noise Figure Measurement.........................................13
3.3 Measurement Settings Overview...............................................................................14
3.4 Result Displays........................................................................................................... 15
Contents
Contents
3.5 Status Bar Information............................................................................................... 18
3.6 Calibration................................................................................................................... 18
3.7 Selecting the Appropriate Filter Type....................................................................... 18
3.8 List of Available RRC and Channel Filters............................................................... 19
3.9 ASCII File Export Format............................................................................................21
4 Measurement Examples (R&S FSV-K30)........................................... 23
4.1 Direct Measurements..................................................................................................23
4.2 Frequency-Converting Measurements......................................................................26
5 Instrument Functions of Noise Figure Measurements (R&S FSV-
K30)....................................................................................................... 31
5.1 Editing Tables..............................................................................................................31
5.2 Working With Limit Lines........................................................................................... 31
6 Menu and Softkey Description (R&S FSV-K30).................................33
6.1 Softkeys and Settings of the Noise Menu (R&S FSV-K30)......................................33
6.2 Softkeys of the Frequency Menu (R&S FSV-K30).................................................... 49
6.3 Softkeys of the Span Menu (R&S FSV-K30)............................................................. 50
6.4 AMPT key..................................................................................................................... 51
6.5 BW key......................................................................................................................... 51
6.6 Softkeys of the Sweep Menu (R&S FSV-K30)...........................................................51
6.7 Softkeys of the Trace Menu (R&S FSV-K30).............................................................52
3Operating Manual 1176.7562.02 ─ 03.1

R&S® FSV-K30
6.8 Softkeys of the Marker Menu (R&S FSV-K30).......................................................... 53
6.9 Softkeys of the Marker To Menu (R&S FSV-K30)..................................................... 54
6.10 Softkeys of the Lines Menu (R&S FSV-K30).............................................................55
6.11 Softkeys of the Input/Output Menu (R&S FSV-K30).................................................57
7 Status Reporting System (R&S FSV-K30)..........................................59
7.1 STATus:OPERation Register..................................................................................... 59
7.2 STATus:QUEStionable Register................................................................................ 59
7.3 STATus:QUEStionable:CORRection Register..........................................................60
8 Remote Control Commands................................................................61
8.1 Notation........................................................................................................................61
8.2 CALCulate Subsystem (Noise Figure, R&S FSV-K30)............................................. 64
8.3 CONFigure Subsystem (Noise Figure, R&S FSV-K30)............................................ 74
Contents
8.4 DISPlay Subsystem (Noise Figure, K30)...................................................................77
8.5 FETCh Subsystem (Noise Figure, K30).....................................................................85
8.6 FORMat Subsystem.................................................................................................... 86
8.7 INPut Subsystem.........................................................................................................87
8.8 INITiate Subsystem..................................................................................................... 89
8.9 INSTrument Subsystem (Noise Figure, R&S FSV-K30)........................................... 90
8.10 SENSe Subsystem (Noise Figure, R&S FSV-K30)....................................................90
8.11 STATus Subsystem (Noise Figure, R&S FSV-K30)................................................102
8.12 SYSTem Subsystem (Noise Figure, R&S FSV-K30)...............................................103
9 Error Reporting and Error Messages............................................... 105
List of Commands..............................................................................106
Index....................................................................................................108
4Operating Manual 1176.7562.02 ─ 03.1

R&S® FSV-K30
1 Preface
Preface
Documentation Overview
1.1 Documentation Overview
The user documentation for the R&S FSVR is divided as follows:
●
Quick Start Guide
●
Operating Manuals for base unit and options
●
Service Manual
●
Online Help
●
Release Notes
Quick Start Guide
This manual is delivered with the instrument in printed form and in PDF format on the
CD. It provides the information needed to set up and start working with the instrument.
Basic operations and basic measurements are described. Also a brief introduction to
remote control is given. The manual includes general information (e.g. Safety Instructions) and the following chapters:
Chapter 1 Introduction, General information
Chapter 2 Front and Rear Panel
Chapter 3 Preparing for Use
Chapter 4 Firmware Update and Installation of Firmware Options
Chapter 5 Basic Operations
Chapter 6 Basic Measurement Examples
Chapter 7 Brief Introduction to Remote Control
Appendix Printer Interface
Appendix LAN Interface
Operating Manuals
The Operating Manuals are a supplement to the Quick Start Guide. Operating Manuals
are provided for the base unit and each additional (software) option.
The Operating Manual for the base unit provides basic information on operating the
R&S FSVR in general, and the "Spectrum" mode in particular. Furthermore, the software options that enhance the basic functionality for various measurement modes are
described here. The set of measurement examples in the Quick Start Guide is expanded by more advanced measurement examples. In addition to the brief introduction to
remote control in the Quick Start Guide, a description of the basic analyzer commands
and programming examples is given. Information on maintenance, instrument interfaces and error messages is also provided.
5Operating Manual 1176.7562.02 ─ 03.1

R&S® FSV-K30
Preface
Documentation Overview
In the individual option manuals, the specific instrument functions of the option are
described in detail. For additional information on default settings and parameters, refer
to the data sheets. Basic information on operating the R&S FSVR is not included in the
option manuals.
The following Operating Manuals are available for the R&S FSVR:
●
R&S FSVR base unit; in addition:
– R&S FSV-K7S Stereo FM Measurements
– R&S FSV-K9 Power Sensor Support
– R&S FSV-K14 Spectrogram Measurement
●
R&S FSV-K10 GSM/EDGE Measurement
●
R&S FSV-K30 Noise Figure Measurement
●
R&S FSV-K40 Phase Noise Measurement
●
R&S FSV-K70 Vector Signal Analysis Operating Manual
R&S FSV-K70 Vector Signal Analysis Getting Started (First measurements)
●
R&S FSV-K72 3GPP FDD BTS Analysis
●
R&S FSV-K73 3GPP FDD UE Analysis
●
R&S FSV-K76/77 3GPP TD-SCDMA BTS/UE Measurement
●
R&S FSV-K82/83 CDMA2000 BTS/MS Analysis
●
R&S FSV-K84/85 1xEV-DO BTS/MS Analysis
●
R&S FSV-K91 WLAN IEEE 802.11
●
R&S FSV-K93 WiMAX IEEE 802.16 OFDM/OFDMA Analysis
●
R&S FSV-K100/K104 EUTRA / LTE Downlink Measurement Application
●
R&S FSV-K101/K105 EUTRA / LTE Uplink Measurement Application
These manuals are available in PDF format on the CD delivered with the instrument.
Service Manual
This manual is available in PDF format on the CD delivered with the instrument. It
describes how to check compliance with rated specifications, instrument function,
repair, troubleshooting and fault elimination. It contains all information required for
repairing the R&S FSVR by replacing modules. The manual includes the following
chapters:
Chapter 1 Performance Test
Chapter 2 Adjustment
Chapter 3 Repair
Chapter 4 Software Update / Installing Options
Chapter 5 Documents
Online Help
The online help contains context-specific help on operating the R&S FSVR and all
available options. It describes both manual and remote operation. The online help is
6Operating Manual 1176.7562.02 ─ 03.1

R&S® FSV-K30
Preface
Conventions Used in the Documentation
installed on the R&S FSVR by default, and is also available as an executable .chm file
on the CD delivered with the instrument.
Release Notes
The release notes describe the installation of the firmware, new and modified functions, eliminated problems, and last minute changes to the documentation. The corresponding firmware version is indicated on the title page of the release notes. The current release notes are provided in the Internet.
1.2 Conventions Used in the Documentation
1.2.1 Typographical Conventions
The following text markers are used throughout this documentation:
Convention Description
"Graphical user interface elements"
KEYS Key names are written in capital letters.
File names, commands,
program code
Input Input to be entered by the user is displayed in italics.
Links Links that you can click are displayed in blue font.
"References" References to other parts of the documentation are enclosed by quota-
All names of graphical user interface elements on the screen, such as
dialog boxes, menus, options, buttons, and softkeys are enclosed by
quotation marks.
File names, commands, coding samples and screen output are distinguished by their font.
tion marks.
1.2.2 Conventions for Procedure Descriptions
When describing how to operate the instrument, several alternative methods may be
available to perform the same task. In this case, the procedure using the touchscreen
is described. Any elements that can be activated by touching can also be clicked using
an additionally connected mouse. The alternative procedure using the keys on the
instrument or the on-screen keyboard is only described if it deviates from the standard
operating procedures.
The term "select" may refer to any of the described methods, i.e. using a finger on the
touchscreen, a mouse pointer in the display, or a key on the instrument or on a keyboard.
7Operating Manual 1176.7562.02 ─ 03.1

R&S® FSV-K30
Preface
How to Use the Help System
1.2.3 Notes on Screenshots
When describing the functions of the product, we use sample screenshots. These
screenshots are meant to illustrate as much as possible of the provided functions and
possible interdependencies between parameters.
The screenshots usually show a fully equipped product, that is: with all options installed. Thus, some functions shown in the screenshots may not be available in your particular product configuration.
1.3 How to Use the Help System
Calling context-sensitive and general help
► To display the general help dialog box, press the HELP key on the front panel.
The help dialog box "View" tab is displayed. A topic containing information about
the current menu or the currently opened dialog box and its function is displayed.
For standard Windows dialog boxes (e.g. File Properties, Print dialog etc.), no contextsensitive help is available.
► If the help is already displayed, press the softkey for which you want to display
help.
A topic containing information about the softkey and its function is displayed.
If a softkey opens a submenu and you press the softkey a second time, the submenu
of the softkey is displayed.
Contents of the help dialog box
The help dialog box contains four tabs:
●
"Contents" - contains a table of help contents
●
"View" - contains a specific help topic
●
"Index" - contains index entries to search for help topics
●
"Zoom" - contains zoom functions for the help display
To change between these tabs, press the tab on the touchscreen.
Navigating in the table of contents
●
To move through the displayed contents entries, use the UP ARROW and DOWN
ARROW keys. Entries that contain further entries are marked with a plus sign.
●
To display a help topic, press the ENTER key. The "View" tab with the corresponding help topic is displayed.
8Operating Manual 1176.7562.02 ─ 03.1

R&S® FSV-K30
Preface
How to Use the Help System
●
To change to the next tab, press the tab on the touchscreen.
Navigating in the help topics
●
To scroll through a page, use the rotary knob or the UP ARROW and DOWN
ARROW keys.
●
To jump to the linked topic, press the link text on the touchscreen.
Searching for a topic
1. Change to the "Index" tab.
2. Enter the first characters of the topic you are interested in. The entries starting with
these characters are displayed.
3. Change the focus by pressing the ENTER key.
4. Select the suitable keyword by using the UP ARROW or DOWN ARROW keys or
the rotary knob.
5. Press the ENTER key to display the help topic.
The "View" tab with the corresponding help topic is displayed.
Changing the zoom
1. Change to the "Zoom" tab.
2. Set the zoom using the rotary knob. Four settings are available: 1-4. The smallest
size is selected by number 1, the largest size is selected by number 4.
Closing the help window
► Press the ESC key or a function key on the front panel.
9Operating Manual 1176.7562.02 ─ 03.1

R&S® FSV-K30
2 Introduction
Introduction
Introduction to R&S FSV-K30 & Noise Measurements
The use of an R&S FSV spectrum analyzer with its high sensitivity and level accuracy
enables the accurate and reproducible measurement of the noise figure of a Device
Under Test; for example, of low-noise FET amplifier circuits with noise figures of less
than 1 dB. Compared with specialist noise-measurement instruments, the properties of
the analyzer are ideal for noise measurements:
●
Different configurations of the sweep number and sweep time for the level measurement also allows the noise figure (and even the gain) of the DUT to be determined even at low frequencies.
●
The high dynamic range of the analyzer enables measurements on highly amplifying DUTs.
●
The frequency range of the analyzer can be fully utilised as a measurement range.
R&S FSV-K30 makes full use of the features and accuracy of the spectrum analyzer to
provide accurate and flexible noise measurements that are very easy to use.
Overview of Firmware Option R&S FSV-K30
This section contains all information required for operation of an R&S FSVR equipped
with Application Firmware R&S FSV-K30. It covers operation via menus and the
remote control commands for accurate and flexible noise measurement functions.
This section consists of the following chapters:
●
Measurement Basics
Provides basic knowledge on performing noise measurements
●
Measurement Examples (R&S FSV-K30)
Explains some basic noise figure measurement examples.
●
Instrument Functions of Noise Figure Measurements (R&S FSV-K30)
Describes the instrument functions of noise figure measurements and provides further information.
●
Remote Control Commands
Describes all remote control commands defined noise figure measurements.
●
Error Reporting and Error Messages
Contains device-specific error messages for R&S FSV-K30.
This part of the documentation includes only functions of the Application Firmware
R&S FSV-K30. For all other descriptions, please refer to the description of the base
unit at the beginning of the documentation.
10Operating Manual 1176.7562.02 ─ 03.1

R&S® FSV-K30
3 Measurement Basics
3.1 Measurement Types....................................................................................................11
3.2 Measurement Modes of the Noise Figure Measurement.........................................13
3.3 Measurement Settings Overview...............................................................................14
3.4 Result Displays........................................................................................................... 15
3.5 Status Bar Information............................................................................................... 18
3.6 Calibration................................................................................................................... 18
3.7 Selecting the Appropriate Filter Type....................................................................... 18
3.8 List of Available RRC and Channel Filters............................................................... 19
3.9 ASCII File Export Format............................................................................................21
Measurement Basics
Measurement Types
This section provides background information on measurements and displayed information.
3.1 Measurement Types
Three types of measurements are possible:
●
Frequency list measurement
●
Fixed frequency measurement
●
Single frequency measurement
Frequency list measurement
A measurement is performed at each of the frequencies listed in the frequency list. The
noise figure of the DUT across a user-specified range of frequencies is measured. In
single sweep mode, each frequency point is measured once until the measurement is
complete. In continuous sweep mode, one frequency point after the other is measured
in turn until the measurement is aborted.
The frequency list is defined in the "Frequency Table" in the "Frequency Settings" dialog box (see "Frequency Settings" on page 36). Two methods are possible:
●
The list is generated according to the start, stop and step frequencies. The first
value in the list is the "Start Freq". For each subsequent value, the "Step Freq" is
added until the "Stop Freq" is reached. If the "Stop Freq" is lower than the "Start
Freq", the "Step Freq" is subtracted from the "Start Freq" for each subsequent
value. A maximum of 100 list entries is generated. If further entries would be
required to reach the "Stop Freq", an error message is displayed. If the step frequency is larger than the difference between the start frequency and the stop frequency, the "Frequency Table" and the "Frequency List Results" (result display)
just contain the start and stop frequency.
●
The list is generated according to the center frequency, span, and number of
sweep points. The number of "Sweep points" defines the number of entries in the
11Operating Manual 1176.7562.02 ─ 03.1

R&S® FSV-K30
Measurement Basics
Measurement Types
frequency table. The start frequency is "Center Freq" - "Span"/2, the stop frequency is "Center Freq" + "Span"/2. The values inbetween are distributed evenly.
For Digital IQ mode, only this method can be used to define the frequency list.
The results are displayed in a table ( "Frequency List Results") or graphically, depending on the display configuration.
Remote commands:
To configure the frequency list:
[SENSe:]FREQuency:STARt on page 100
[SENSe:]FREQuency:STOP on page 100
[SENSe:]FREQuency:STEP on page 100
or
[SENSe:]FREQuency:CENTer on page 98
[SENSe:]FREQuency:SPAN on page 99
[SENSe:]SWEep:POINts on page 101
To start the measurement:
CONFigure:LIST:CONTinuous on page 76 or
CONFigure:LIST:SINGle on page 76
INIT
To query the results:
FETCh:ARRay:NOISE:FIGure? on page 85
FETCh:ARRay:NOISE:GAIN? on page 85
FETCh:ARRay:NOISE:TEMPerature? on page 85
Fixed frequency measurement
A continuous measurement is performed at the single frequency currently selected in
the "Frequency List Results" (see also Fix Freq softkey in the "Sweep" menu). This
measurement can only be performed after an initial frequency list or single frequency
measurement.
The results are displayed beneath the original "Frequency List Results" in the "Fixed
Frequency (Meter)" area.
Remote commands:
To configure the fixed frequency:
[SENSe:]FREQuency[:CW|:FIXed] on page 98
To start the measurement:
CONFigure:SINGle on page 77
INIT
12Operating Manual 1176.7562.02 ─ 03.1

R&S® FSV-K30
Measurement Basics
Measurement Modes of the Noise Figure Measurement
To query the results:
FETCh:SCALar:NOISE:FIGure? on page 86
FETCh:SCALar:NOISE:GAIN? on page 86
FETCh:SCALar:NOISE:TEMPerature? on page 86
Single frequency measurement
A measurement is performed at a specified single frequency, either once or continuously. Thus, the individual frequency can be investigated in more detail, for example to
see the effect of dynamic changes to the noise figure of the DUT at a particular frequency. An initial list measurement is not necessary.
The frequency is defined by activating the "Single Freq" option and entering the frequency in the "Start Freq" field in the "Frequency Settings" dialog box (see "Frequency
Settings" on page 37). The "Frequency Table" is reduced to a single entry. In effect,
the single frequency measurement is a list measurement reduced to a single list entry.
The result of a fixed frequency measurement is displayed in the result table only, not
graphically.
Remote commands:
To configure the single frequency:
[SENSe:]FREQuency:STARt on page 100
To start the measurement:
CONFigure:FREQ:CONTinuous on page 75 or
CONFigure:FREQ:SINGle on page 75
INIT
To query the results:
FETCh:ARRay:NOISE:FIGure? on page 85
FETCh:ARRay:NOISE:GAIN? on page 85
FETCh:ARRay:NOISE:TEMPerature? on page 85
3.2 Measurement Modes of the Noise Figure Measurement
Noise measurements are performed on many different types of device under test
(DUT). The type of DUT to be measured determines the test setup and also how the
frequency list is to be generated. To support these different types of DUT, the following
different noise figure measurement modes are available:
●
Direct measurement
●
Frequency-converting measurement
– Fixed LO Upconverter, IF = RF + LO
13Operating Manual 1176.7562.02 ─ 03.1

R&S® FSV-K30
Measurement Basics
Measurement Settings Overview
– Fixed LO Downconverter, IF = abs(RF - LO)
●
Digital IQ; for digital baseband input using the optional R&S FSV-B17 interface;
Using the Digital Baseband interface for input, the digital baseband signal from the
digital interface is used for measurement, rather than the digitalized IF signal.
In this mode, RF attenuation, a Preamplifier and calibration are not available. The
frequency list is defined by a center frequency, a span and a number of sweep
points (see "Frequency Settings" on page 36).
For details see the Digital Baseband Interface (R&S FSV-B17) description of the
base unit.
The setup for the different measurement types is described by the "Schematic Overview" softkey. The measurement mode is set in the "Frequency Settings" dialog box,
"Mode" field (see "Mode" on page 38).
For details on the measurement types see also chapter 4, "Measurement Examples
(R&S FSV-K30)", on page 23.
3.3 Measurement Settings Overview
The overall measurement settings used to obtain the current measurement results are
displayed in the diagram header at the top of the display (see figure 3-1). The following
settings are listed:
Setting Defined in dialog
box
Auto Level Measurement Set-
tings
Ref Level Measurement Set-
tings
Full Scale Lvl. Measurement Set-
tings
Sample Rate Measurement Set-
tings
Att Measurement Set-
tings
Preamplifier Measurement Set-
tings
RBW Measurement Set-
tings
Description
Enable/Disable automatic reference level
Set reference level
Level that corresponds to an IQ sample with the magnitude "1"
(for digital input only)
Input sample rate from the IQ signal source (for digital input
only)
Set RF attenuation
Enable/disable preamplifier
Set RBW
SWT Measurement Set-
tings
AVG Measurement Set-
tings
Noise Source ENR Settings Set constant ENR or ENR table
Serial Nr. ENR Settings Reserved for serial number of the noise source (currently not
Set sweep time
Set number of measurement sweeps over which the average is
taken
available)
14Operating Manual 1176.7562.02 ─ 03.1

R&S® FSV-K30
Measurement Basics
Result Displays
Setting Defined in dialog
box
ENR (Const) ENR Settings Set ENR value (dB), refers to the receive frequency (RF)
2nd Stage Corr Measurement Set-
tings
Mode Frequency Settings Set measurement mode
Image Rej Frequency Settings Set suppression applied to the second sideband (Image Rej)
Fixed LO Frequency Settings Set Local oscillator frequency (Hz), only for frequency-convert-
Fixed IF Frequency Settings Set IF frequency for Fixed IF measurements
LO Source Frequency Settings Reserved for external LO control (currently not available)
Fig. 3-1: Measurement settings for the noise figure measurements (example)
Description
Enable/disable 2nd Stage Correction
ing measurements
3.4 Result Displays
The measurement results are represented according to the measurement type (see
chapter 3.1, "Measurement Types", on page 11).
Frequency list results
The measurement results for all frequencies defined in the "Frequency Table" are displayed as a graph or a table, depending on the currently selected result display (see
"Display Graph/List" on page 52 softkey).
(See figure 3-3 and figure 3-2.)
The measurement results are updated as the measurement is in progress. Under "Current Value", the details of the currently selected frequency in the "Frequency List
Results" are displayed.
15Operating Manual 1176.7562.02 ─ 03.1

R&S® FSV-K30
Measurement Basics
Result Displays
Fig. 3-2: Graphical result display (example)
Fig. 3-3: Result display table (example)
The following information is displayed in the table:
16Operating Manual 1176.7562.02 ─ 03.1

R&S® FSV-K30
Measurement Basics
Result Displays
Column Description
Used settings
RF Receive frequency at the DUT at which the values in this row of the table were mea-
sured (Hz).
LO Local oscillator frequency (Hz) - not displayed for direct or Digital IQ measurements
IF Intermediate frequency (Hz) - not displayed for direct or Digital IQ measurements
Results
NF Noise figure measured (dB)
Noise Temp Noise temperature (K) derived from measured noise figure
Gain Gain measured (dB); not available when using the Digital Baseband Interface
(R&S FSV-B17)
Fixed frequency results
Under "Fixed Frequency (Meter)", the measurement results for the fixed frequency
measurement are displayed and continuously updated (see also chapter 3.1, "Mea-
surement Types", on page 11). The "Frequency List Results" do not change - these are
the results of the last frequency list measurement.
During a running measurement, the "Fixed Frequency (Meter)" area displays the current measurement value.
17Operating Manual 1176.7562.02 ─ 03.1

R&S® FSV-K30
Measurement Basics
Status Bar Information
3.5 Status Bar Information
The status bar displays the following information:
Parameter values If a parameter in a settings dialog box is selected, the minimum
Measurement status During the measurement, the current measurement status
Error messages red background
Warning messages yellow background
3.6 Calibration
The calibration measures the noise introduced to a signal by the spectrum analyzer
itself to compensate it in measurements on a device under test. This compensation is
called 2nd stage correction, because the spectrum analyzer is the second stage of the
test setup, the DUT being the first stage.
and maximum values for the selected parameter are displayed.
If a Boolean or an enumarated parameter in a dialog box is
selected, the minimum and maximum values are displayed as
N/A for not applicable.
along with detailed information about the progress is displayed.
If the second stage correction is activated (see "2nd Stage Correction" on page 42),
a separate calibration measurement is performed before the main measurement (for
details on the measurement setup refer to the base unit Operating Manual on CDROM, chapter "Advanced Measurement Examples"). The data measured in the calibration measurement are used for compensation in the main measurement.
It is strongly recommended that you perform calibration before running measurements
(see "Cal" on page 49). You can run measurements in an uncalibrated status, but the
measurement results will not be corrected for any noise introduced by the spectrum
analyzer itself.
If the list of receive frequencies (RF) is changed, at which the measurements are performed, calibration is necessary again to ensure that calibration data is available for
every measurement step. For details on frequency settings refer to "Frequency Set-
tings" on page 36.
Calibration data can be saved and recalled at any time via the SAVE/RCL key (for
details refer to the base unit description).
It is also included if "All Traces" are stored.
3.7 Selecting the Appropriate Filter Type
All resolution bandwidths are realized with digital filters.
18Operating Manual 1176.7562.02 ─ 03.1

R&S® FSV-K30
Measurement Basics
List of Available RRC and Channel Filters
The video filters are responsible for smoothing the displayed trace. Using video bandwidths that are small compared to the resolution bandwidth, only the signal average is
displayed and noise peaks and pulsed signals are repressed. If pulsed signals are to
be measured, it is advisable to use a video bandwidth that is large compared to the
resolution bandwidth (VBW * 10 x RBW) for the amplitudes of pulses to be measured
correctly.
The following filter types are available:
●
Normal (3dB) (Gaussian) filters
The Gaussian filters are set by default. The available bandwidths are specified in
the data sheet.
●
CISPR (6 dB) filters
●
MIL Std (6 dB) filters
Note that the 6 dB bandwidths are available only with option R&S FSV-K54.
●
Channel filters
For details see chapter 3.8, "List of Available RRC and Channel Filters",
on page 19 .
Channel filters do not support FFT mode.
●
RRC filters
For details see chapter 3.8, "List of Available RRC and Channel Filters",
on page 19 .
RRC filters do not support FFT mode.
●
5-Pole filters
The available bandwidths are specified in the data sheet.
5-Pole filters do not support FFT mode.
3.8 List of Available RRC and Channel Filters
For power measurement a number of especially steep-edged channel filters are available (see the following table). The indicated filter bandwidth is the 3 dB bandwidth. For
RRC filters, the fixed roll-off factor (a) is also indicated.
Table 3-1: Filter types
Filter Bandwidth Filter Type Application
100 Hz CFILter
200 Hz CFILter A0
300 Hz CFILter
500 Hz CFILter
1 kHz CFILter
1.5 kHz CFILter
2 kHz CFILter
2.4 kHz CFILter SSB
19Operating Manual 1176.7562.02 ─ 03.1

R&S® FSV-K30
Measurement Basics
List of Available RRC and Channel Filters
Filter Bandwidth Filter Type Application
2.7 kHz CFILter
3 kHz CFILter
3.4 kHz CFILter
4 kHz CFILter DAB, Satellite
4.5 kHz CFILter
5 kHz CFILter
6 kHz CFILter
6 kHz, a=0.2 RRC APCO
8.5 kHz CFILter ETS300 113 (12.5 kHz channels)
9 kHz CFILter AM Radio
10 kHz CFILter
12.5 kHz CFILter CDMAone
14 kHz CFILter ETS300 113 (20 kHz channels)
15 kHz CFILter
16 kHz CFILter ETS300 113 (25 kHz channels)
18 kHz, a=0.35 RRC TETRA
20 kHz CFILter
21 kHz CFILter PDC
24.3 kHz, a=0.35 RRC IS 136
25 kHz CFILter
30 kHz CFILter CDPD, CDMAone
50 kHz CFILter
100 kHz CFILter
150 kHz CFILter FM Radio
192 kHz CFILter PHS
200 kHz CFILter
300 kHz CFILter
500 kHz CFILter J.83 (8-VSB DVB, USA)
1 MHz CFILter CDMAone
1.228 MHz CFILter CDMAone
20Operating Manual 1176.7562.02 ─ 03.1

R&S® FSV-K30
Measurement Basics
ASCII File Export Format
Filter Bandwidth Filter Type Application
1.28 MHz, a=0.22 RRC
1.5 MHz CFILter DAB
2 MHz CFILter
3 MHz CFILter
3.75 MHz CFILter
3.84 MHz, a=0.22 RRC W-CDMA 3GPP
4.096 MHz, a=0.22 RRC W-CDMA NTT DOCoMo
5 MHz CFILter
20 MHz CFILter
28 MHz CFILter
40 MHz CFILter
3.9 ASCII File Export Format
The data of the file header consist of three columns, each separated by a semicolon:
parameter name; numeric value; basic unit. The data section starts with the keyword
"Trace <n>" (<n> = number of stored trace), followed by the measured data in one or
several columns (depending on measurement) which are also separated by a semicolon.
File contents: header and data section Description
Type;FSVR;
Version;1.45;
Date;01.Apr 2010; Date of data set storage
Screen;A; Instrument mode
Points per Symbol;4; Points per symbol
x Axis Start;-13;sym; Start value of the x axis
x Axis Stop;135;sym; Stop value of the x axis
Ref value y axis;-10.00;dBm; Y axis reference value
Ref value position;100;%; Y axis reference position
Trace;1; Trace number
Meas;Result; Result type
Meas Signal;Magnitude; Result display
Demodulator;Offset QPSK; Demodulation type
ResultMode;Trace; Result mode
21Operating Manual 1176.7562.02 ─ 03.1

R&S® FSV-K30
Measurement Basics
ASCII File Export Format
File contents: header and data section Description
x unit;sym; Unit of the x axis
y unit;dBm; Unit of the y axis
Trace Mode;Clear Write; Trace mode
Values;592; Number of results
<values> List of results
22Operating Manual 1176.7562.02 ─ 03.1

R&S® FSV-K30
4 Measurement Examples (R&S FSV-K30)
4.1 Direct Measurements..................................................................................................23
4.1.1 Basic Measurement Example....................................................................................... 23
4.1.2 DUTs with very Large Gain...........................................................................................26
4.2 Frequency-Converting Measurements......................................................................26
4.2.1 Fixed LO Measurements...............................................................................................27
4.2.2 Image-Frequency Rejection (SSB, DSB)...................................................................... 27
Measurement Examples (R&S FSV-K30)
Direct Measurements
This section describes measurement examples for the Noise Figure Measurements
option (K30). For further information on measurement examples refer to the Quick
Start Guide, chapter "Basic Measurement Examples", or the Operating Manual on CD.
This chapter provides the following measurement examples:
4.1 Direct Measurements
Direct measurements are designed for DUTs without frequency-conversion, e.g. amplifiers.
●
chapter 4.1.1, "Basic Measurement Example", on page 23
●
chapter 4.1.2, "DUTs with very Large Gain", on page 26
4.1.1 Basic Measurement Example
This section provides step-by-step instructions for working through an ordinary noise
figure measurement. The following steps are described:
●
"Setting up the measurement" on page 23
●
"Performing the calibration" on page 25
●
"Performing the main measurement" on page 25
The gain and noise figure of an amplifier are to be determined in the range from 220
MHz to 320 MHz.
Setting up the measurement
1. Activate the "Noise" mode by pressing the MODE key and selecting "Noise".
2. Press the "Freq Settings" softkey to open the "Frequency Settings" dialog box.
23Operating Manual 1176.7562.02 ─ 03.1

R&S® FSV-K30
Measurement Examples (R&S FSV-K30)
Direct Measurements
3. In the "Start Freq" field, enter 550 MHz.
4. In the "Stop Freq" field, enter 560 MHz.
5. In the "Step Freq" field, enter 2 MHz.
A measurement at 6 frequency points is performed: 550 MHz, 552 MHz, 554 MHz,
…, 560 MHz.
6. Press the "ENR Settings" softkey to open the "ENR" dialog box.
7. In the "ENR Constant" field, enter the average ENR value of the used noise source
for the frequency range of interest, for example 15 dB.
8. Press the "Meas Settings" softkey to open the "Measurement Settings" dialog box.
24Operating Manual 1176.7562.02 ─ 03.1

R&S® FSV-K30
Measurement Examples (R&S FSV-K30)
Direct Measurements
9. If it is not yet active, activate the "2nd Stage Correction" option to perform the mea-
surement as accurately as possible.
Performing the calibration
1. Connect the noise source to the RF input of the R&S FSVR (see figure 4-1).
2. Provide the voltage supply for the noise source by connecting it to the +28 V con-
nector of the R&S FSVR (labeled "NOISE SOURCE CONTROL" on the front panel
of the instrument) via a coax cable.
Fig. 4-1: Preparation for calibration
3. Start the calibration for the "Noise Figure Measurements" option.
a) Press the SWEEP key.
b) Press the "Cal" softkey.
The progress bar indicates the progress of the calibration measurement.
Performing the main measurement
1. Insert the DUT (in this example, the amplifier) into the test setup between the noise
source and RF input of the R&S FSVR (see figure 4-2).
Fig. 4-2: Test setup for the main measurement
2. To select the sweep mode, press the SWEEP key.
3. Press the RUN SINGLE key to start a single measurement.
25Operating Manual 1176.7562.02 ─ 03.1

R&S® FSV-K30
Measurement Examples (R&S FSV-K30)
Frequency-Converting Measurements
Measurement results are updated as the measurement is in progress. The results
are displayed in graphical form. There are two traces, one for noise figure/temperature and one for the gain of the DUT.
4. To change the display from the graphical form to a tabular list of measurement
points, press the "Display List/Graph" softkey in the "Trace" menu.
Note:
If a measurement is started while another measurement is still in progress, the first
measurement is aborted and the new measurement started immediately.
4.1.2 DUTs with very Large Gain
If the gain of the DUT exceeds 60 dB, the total gain must be reduced by an external
attenuator. The total gain of the DUT together with the external attenuator should lie
within the range from 10 dB to 60 dB. A total gain of 20 dB to 30 dB is recommended.
For a DUT with a gain of e.g. 64 dB, it is recommended to use an external 40 dBattenuator.
If an external attenuator is used, in the "Measurement Settings" dialog box, the entry in
the "Range" field should be modified according to the total gain (= Gain DUT – external attenuator).
The attenuation values of the external attenuator are entered in the "Loss Settings"
dialog box under "Loss Output Settings".
Inaccuracies when entering this attenuation mainly influence the measured gain. The
noise figure remains to a large extent unaffected.
Fig. 4-3: Calibration and measurement on DUTs with a high gain
4.2 Frequency-Converting Measurements
The frequency-converting measurement is used for DUTs with an output frequency
that differs from the input frequency, e.g. mixers and frequency converters. The fre-
26Operating Manual 1176.7562.02 ─ 03.1

R&S® FSV-K30
Measurement Examples (R&S FSV-K30)
Frequency-Converting Measurements
quency-converting measurement allows many variations, which differ from each other
in two criteria:
●
chapter 4.2.1, "Fixed LO Measurements", on page 27
●
chapter 4.2.2, "Image-Frequency Rejection (SSB, DSB)", on page 27
4.2.1 Fixed LO Measurements
In the "Frequency Settings" dialog box, select one of the following settings for the
"Mode" parameter:
●
Fixed LO, Up Conv, for up-converting devices with IF=RF+LO
●
Fixed LO, Down Conv, for down converters with IF=abs(RF-LO) or image measurements
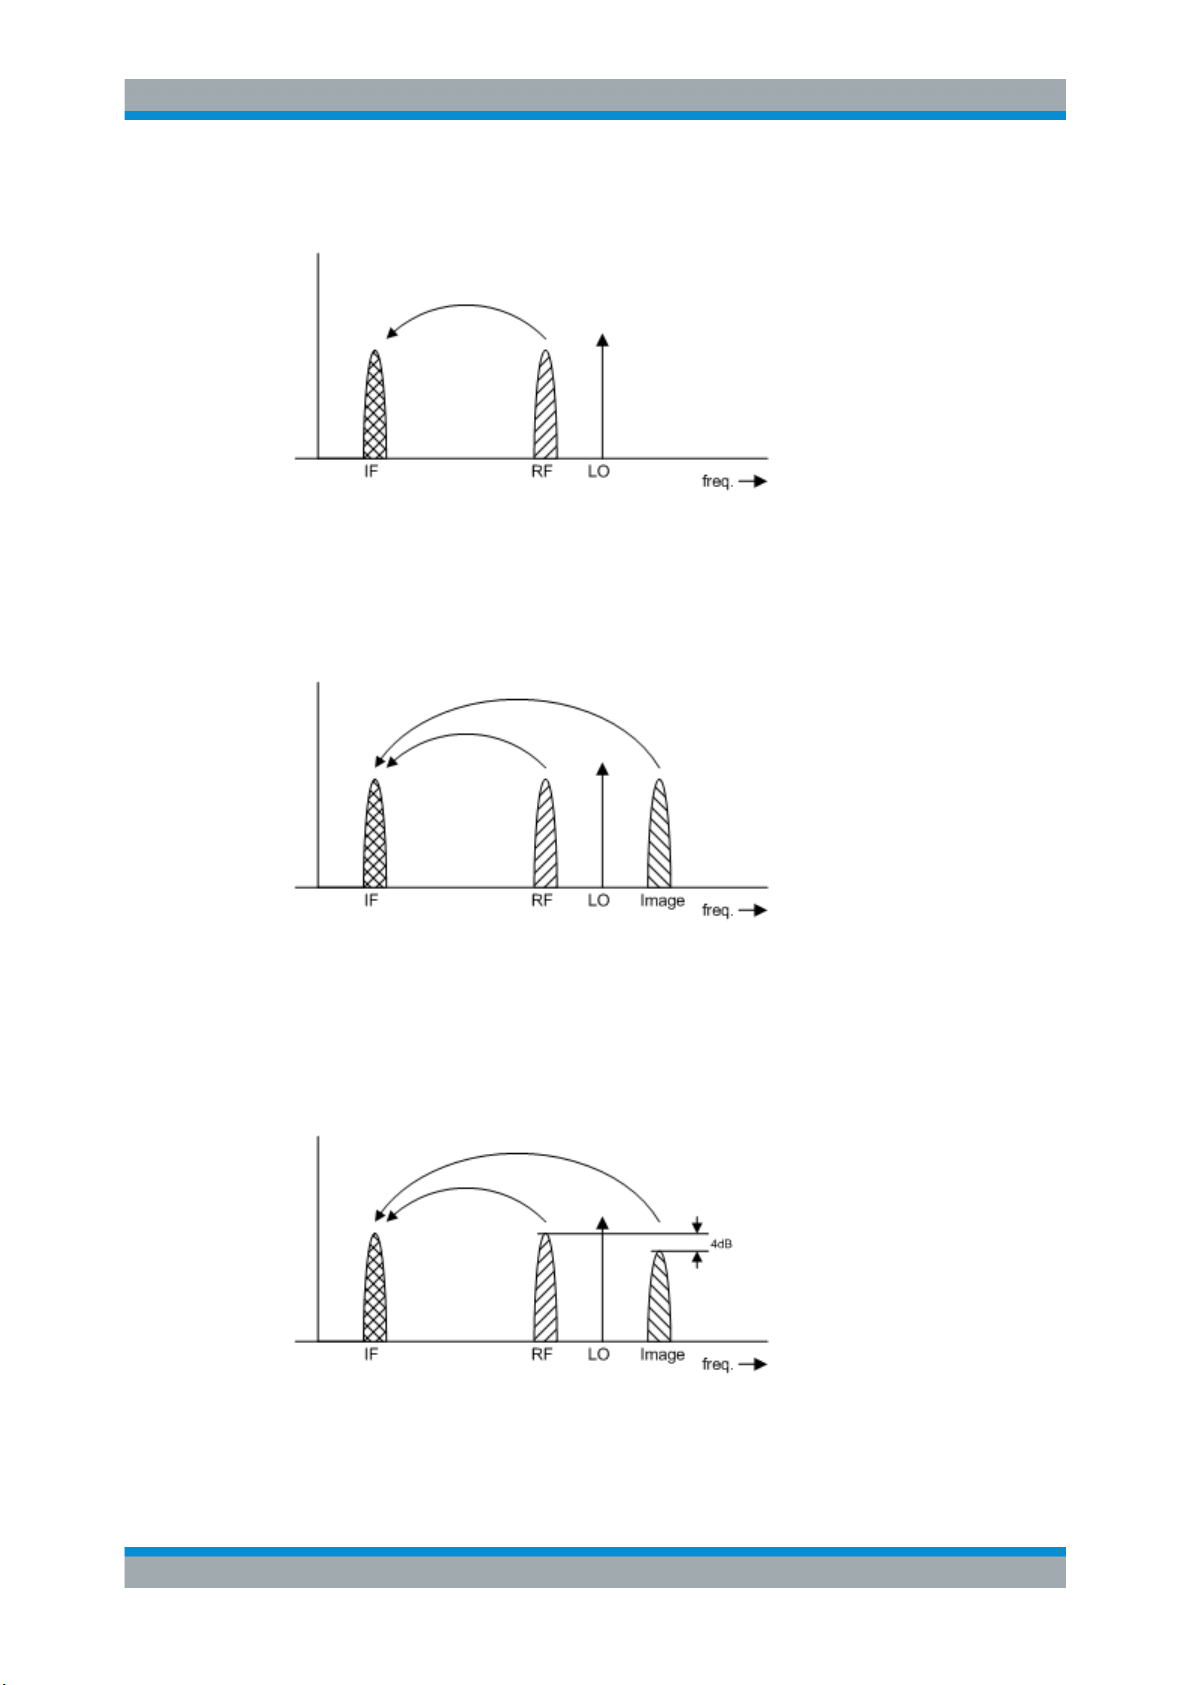
4.2.2 Image-Frequency Rejection (SSB, DSB)
Test Setup
► Set the following parameters:
a) "IF" (intermediate frequency): 100 MHz
b) "RF" (input frequency): 400 MHz
c) "LO" (local oscillator frequency): 500 MHz
d) "image" (image frequency): 600 MHz
If a DUT, which equally converts the useful signal and the image to the IF frequency, is
measured using the conventional y factor method or with the 2nd stage correction
switched on, a measuring error of 3 dB is produced. The noise figure is displayed 3 dB
lower and the gain 3 dB higher. The following examples help to configure the test setup
in order to measure the actual values.
27Operating Manual 1176.7562.02 ─ 03.1
R&S® FSV-K30
Measurement Examples (R&S FSV-K30)
Frequency-Converting Measurements
4.2.2.1 Measurement on a single-sideband mixer
In general, a single-sideband mixer with a very high image rejection causes very few
problems. The measurement is analogous to an amplifier. In this case, set the image
rejection in the "Frequency Settings" dialog box to a large value (e.g. 999.99 dB).
4.2.2.2 Measurement on a mixer without sideband suppression
If the input and image frequencies are converted with the same application, an error of
3 dB occurs in the measurement results if the image rejection is not taken into account.
In this case, set the image rejection in the "Frequency Settings" dialog box to a small
value (e.g. 0.0 dB).
4.2.2.3 Measurement on a mixer with an average sideband suppression
For measurements on a mixer with a low image-frequency rejection, a measuring error
of 0 to 3 dB is obtained if the image-frequency rejection is not taken into account. In
28Operating Manual 1176.7562.02 ─ 03.1

R&S® FSV-K30
Measurement Examples (R&S FSV-K30)
Frequency-Converting Measurements
this case, set the image rejection in the "Frequency Settings" dialog box to the correct
image rejection value to produce the correct results.
4.2.2.4 Measurement on a mixer with unknown sideband suppression
If the image rejection is not known, accurate noise results can still be produced. However, the gain of the DUT must be known and an additional filter is required.
Test setup
Fig. 4-4: Preparation for calibration
Fig. 4-5: Test setup for the main measurement
In this test setup, a low pass filter prevents noise from the noise source from being fed
in at the image frequency. Depending on the position of the frequency bands, a highpass or bandpass filter may also be necessary for the RF frequency instead of the lowpass filter. The important point is that noise from the noise source is not converted by a
further receive path of the mixer. The noise of the noise source at the receive frequency must not be reduced. The insertion loss must be considered, if applicable.
With this test setup, the measurement on a mixer without sideband suppression corresponds to the measurement on a single-sideband mixer. As in that case, set the image
rejection in the "Frequency Settings" dialog box to a large value (e.g. 999.99 dB) to
produce accurate results.
To take the characteristics of the filter into account, in the "Loss Settings" dialog box,
enter the insertion loss of the filter at the RF frequency. To consider the actual filter
suppression at the image frequency, do not enter 999 dB but the actual attenuation for
the image rejection.
29Operating Manual 1176.7562.02 ─ 03.1

R&S® FSV-K30
Measurement Examples (R&S FSV-K30)
Frequency-Converting Measurements
4.2.2.5 Measurement on a harmonics mixer
For a harmonics mixer, the input signals are not only converted to the IF by the wanted
harmonic, but also by the harmonic of the LO signal produced in the mixer. In many
cases, the mixer even features a lower conversion loss in the case of unwanted harmonics. For measurements on this type of mixer, a bandpass filter must be used to
make sure that that there is only noise at the desired input frequency at the input of the
DUT. This measurement is similar to measurements on a mixer with an average sideband suppression.
30Operating Manual 1176.7562.02 ─ 03.1
 Loading...