

Rohde&Schwarz R&S®FSMR3-K7 Analog Modulation Analysis for AM/FM/φM User Manual

R&S®FSMR3-K7
AM/FM/PM Modulation Analysis
User Manual
(;ÝÁ_2)
1179514702
Version 02

This document describes the following R&S®FSMR3000 models:
●
R&S®FSMR3008 (1345.4004K08)
●
R&S®FSMR3026 (1345.4004K26)
●
R&S®FSMR3050 (1345.4004K50)
The contents of this manual correspond to firmware version 1.10 and higher.
The following firmware options are described:
●
R&S FSMR3-K7 (1345.3389.02)
© 2022 Rohde & Schwarz GmbH & Co. KG
Muehldorfstr. 15, 81671 Muenchen, Germany
Phone: +49 89 41 29 - 0
Email: info@rohde-schwarz.com
Internet: www.rohde-schwarz.com
Subject to change – data without tolerance limits is not binding.
R&S® is a registered trademark of Rohde & Schwarz GmbH & Co. KG.
Trade names are trademarks of the owners.
1179.5147.02 | Version 02 | R&S®FSMR3-K7
Throughout this manual, products from Rohde & Schwarz are indicated without the ® symbol, e.g. R&S®FSMR3 is indicated as
R&S FSMR3.

R&S®FSMR3-K7
1 Documentation overview.......................................................................9
1.1 Getting started manual................................................................................................. 9
1.2 User manuals and help.................................................................................................9
1.3 Service manual..............................................................................................................9
1.4 Instrument security procedures................................................................................ 10
1.5 Printed safety instructions.........................................................................................10
1.6 Data sheets and brochures........................................................................................ 10
1.7 Release notes and open-source acknowledgment (OSA).......................................10
1.8 Application notes, application cards, white papers, etc......................................... 10
2 Welcome to the R&S FSMR3000 Analog Demodulation application
Contents
Contents
............................................................................................................... 11
2.1 Starting Analog Demodulation...................................................................................11
2.2 Understanding the display information.................................................................... 12
3 Measurements and result displays.................................................... 15
4 Measurement basics............................................................................26
4.1 Demodulation process............................................................................................... 26
4.2 Demodulation bandwidth........................................................................................... 28
4.3 Sample rate and demodulation bandwidth...............................................................28
4.4 AF filters.......................................................................................................................29
4.5 Time domain zoom......................................................................................................29
5 Configuration........................................................................................32
5.1 Configuration overview.............................................................................................. 32
5.2 Configuration according to standards......................................................................34
5.3 Input and frontend settings........................................................................................36
5.3.1 Settings for input from I/Q data files..............................................................................36
5.3.2 Amplitude settings.........................................................................................................37
5.3.3 Frequency..................................................................................................................... 40
5.4 Trigger configuration..................................................................................................41
5.4.1 Trigger source settings..................................................................................................41
5.5 Data acquisition.......................................................................................................... 43
3User Manual 1179.5147.02 ─ 02

R&S®FSMR3-K7
5.5.1 Bandwidth settings........................................................................................................ 43
5.5.2 Sweep settings..............................................................................................................45
5.6 Demodulation display.................................................................................................48
5.7 Demodulation.............................................................................................................. 48
5.7.1 Basic demodulation measurement parameters (Demod)..............................................48
5.7.2 Demodulation spectrum................................................................................................ 51
5.7.2.1 AF evaluation................................................................................................................ 52
5.7.2.2 RF evaluation................................................................................................................ 53
5.7.3 AF filter..........................................................................................................................54
5.7.4 Scaling.......................................................................................................................... 57
5.7.4.1 AF evaluation................................................................................................................ 58
5.7.4.2 RF evaluation................................................................................................................ 60
5.7.5 Units.............................................................................................................................. 61
Contents
5.7.6 Result table settings......................................................................................................62
5.7.7 Settling time.................................................................................................................. 64
5.8 Adjusting settings automatically...............................................................................66
6 Analysis................................................................................................ 69
6.1 Trace settings..............................................................................................................69
6.2 Spectrogram settings................................................................................................. 72
6.2.1 General spectrogram settings....................................................................................... 73
6.2.2 Color map settings........................................................................................................ 75
6.3 Trace / data export configuration.............................................................................. 76
6.4 Working with markers in the R&S FSMR3000 Analog Demodulation application
...................................................................................................................................... 79
6.4.1 Marker settings..............................................................................................................79
6.4.1.1 Individual marker setup................................................................................................. 80
6.4.1.2 General marker settings................................................................................................82
6.4.2 Marker search settings and positioning functions......................................................... 85
6.4.2.1 Marker search settings..................................................................................................85
6.4.2.2 Positioning functions..................................................................................................... 86
6.4.3 Marker search settings for spectrograms......................................................................87
6.4.4 Marker function configuration........................................................................................90
6.4.4.1 Measuring characteristic bandwidths (n db down marker)............................................91
4User Manual 1179.5147.02 ─ 02

R&S®FSMR3-K7
6.4.4.2 Phase noise measurement marker............................................................................... 92
6.4.4.3 Marker peak list.............................................................................................................95
6.4.4.4 Deactivating all marker functions.................................................................................. 99
7 I/Q data import and export................................................................ 100
8 How to perform measurements in the R&S FSMR3000 Analog
8.1 How to export trace data and numerical results.................................................... 102
9 Measurement example: demodulating an FM signal...................... 103
10 Optimizing and troubleshooting the measurement........................ 108
11 Remote commands for Analog Demodulation................................109
11.1 Introduction............................................................................................................... 110
Contents
Demodulation application................................................................. 101
11.1.1 Conventions used in descriptions................................................................................110
11.1.2 Long and short form.....................................................................................................111
11.1.3 Numeric suffixes.......................................................................................................... 111
11.1.4 Optional keywords.......................................................................................................112
11.1.5 Alternative keywords................................................................................................... 112
11.1.6 SCPI parameters.........................................................................................................112
11.1.6.1 Numeric values............................................................................................................113
11.1.6.2 Boolean....................................................................................................................... 113
11.1.6.3 Character data.............................................................................................................114
11.1.6.4 Character strings......................................................................................................... 114
11.1.6.5 Block data....................................................................................................................114
11.2 Common suffixes...................................................................................................... 115
11.3 Activating analog modulation analysis...................................................................115
11.4 Configuring the measurement................................................................................. 118
11.4.1 Managing standard settings........................................................................................ 119
11.4.2 Configuring the input................................................................................................... 120
11.4.2.1 RF input.......................................................................................................................120
11.4.2.2 Configuring file input................................................................................................... 123
11.4.2.3 External generator control...........................................................................................124
Measurement configuration.........................................................................................124
Interface configuration.................................................................................................127
5User Manual 1179.5147.02 ─ 02

R&S®FSMR3-K7
11.4.3 Configuring the output.................................................................................................131
11.4.4 Frequency settings......................................................................................................134
11.4.5 Configuring the vertical axis (amplitude, scaling)........................................................136
11.4.5.1 Amplitude settings.......................................................................................................136
11.4.5.2 Configuring the attenuation......................................................................................... 137
11.4.5.3 Configuring a preamplifier........................................................................................... 139
11.4.5.4 Scaling the Y-axis........................................................................................................140
11.4.6 Configuring data acquisition........................................................................................143
11.4.7 Triggering.................................................................................................................... 147
11.4.7.1 Configuring the triggering conditions...........................................................................147
11.4.7.2 Configuring the trigger output......................................................................................152
11.4.8 Configuring demodulation........................................................................................... 154
Contents
Source calibration....................................................................................................... 129
11.4.8.1 Basic demodulation settings....................................................................................... 155
11.4.8.2 Time domain zoom settings........................................................................................ 157
11.4.8.3 Configuring the demodulation spectrum..................................................................... 159
AF evaluation.............................................................................................................. 159
RF evaluation.............................................................................................................. 161
11.4.8.4 (Post-processing) AF filters.........................................................................................162
11.4.8.5 Defining the scaling and units..................................................................................... 167
11.4.8.6 Scaling for AF evaluation............................................................................................ 167
11.4.8.7 Scaling for RF evaluation............................................................................................ 168
11.4.8.8 Units............................................................................................................................ 168
11.4.8.9 Relative demodulation results..................................................................................... 169
11.4.8.10 Settling time................................................................................................................ 172
11.4.9 Adjusting settings automatically.................................................................................. 174
11.5 Capturing data and performing sweeps................................................................. 178
11.6 Configuring the result display................................................................................. 182
11.6.1 General window commands........................................................................................183
11.6.2 Working with windows in the display...........................................................................183
11.7 Retrieving results......................................................................................................190
11.7.1 Retrieving trace results............................................................................................... 191
11.7.2 Exporting trace results................................................................................................ 194
6User Manual 1179.5147.02 ─ 02

R&S®FSMR3-K7
11.7.3 Retrieving result summary values............................................................................... 196
11.7.4 Formats for returned values: ASCII format and binary format.................................... 201
11.7.5 Reference: ASCII file export format............................................................................ 201
11.8 Analyzing results...................................................................................................... 202
11.8.1 Configuring spectrograms........................................................................................... 202
11.8.1.1 Configuring a spectrogram measurement...................................................................202
11.8.1.2 Configuring the color map........................................................................................... 207
11.8.2 Configuring standard traces........................................................................................ 209
11.8.3 Working with markers remotely...................................................................................215
11.8.3.1 Setting up individual markers...................................................................................... 216
11.8.3.2 General marker settings..............................................................................................222
11.8.3.3 Marker search (spectrograms).................................................................................... 224
Contents
Using markers............................................................................................................. 225
Using delta markers.................................................................................................... 229
11.8.3.4 Marker search settings................................................................................................234
11.8.3.5 Positioning the marker................................................................................................ 234
Positioning normal markers.........................................................................................235
Positioning delta markers............................................................................................237
11.8.3.6 Configuring special marker functions.......................................................................... 239
Fixed reference marker settings..................................................................................239
Marker peak lists......................................................................................................... 241
N db down marker.......................................................................................................246
Phase noise measurement marker............................................................................. 249
11.8.4 Marker search (spectrograms).................................................................................... 250
11.8.4.1 Using markers............................................................................................................. 250
11.8.4.2 Using delta markers.................................................................................................... 255
11.8.5 Defining limit checks................................................................................................... 259
11.8.5.1 Configuring limit lines.................................................................................................. 260
11.8.5.2 Managing limit lines.....................................................................................................268
11.8.5.3 Checking the results of a limit check...........................................................................271
11.8.5.4 Programming example: using limit lines......................................................................272
Example: configuring limit lines...................................................................................272
Example: performing a limit check.............................................................................. 273
7User Manual 1179.5147.02 ─ 02

R&S®FSMR3-K7
11.9 Importing and exporting I/Q data and results........................................................ 275
11.10 Deprecated commands.............................................................................................276
11.11 Programming example............................................................................................. 277
A Predefined standards and settings.................................................. 280
Contents
Annex.................................................................................................. 280
List of Commands (Analog Modulation Analysis).......................... 282
Index....................................................................................................292
8User Manual 1179.5147.02 ─ 02

R&S®FSMR3-K7
1 Documentation overview
1.1 Getting started manual
Documentation overview
Service manual
This section provides an overview of the R&S FSMR3 user documentation. Unless
specified otherwise, you find the documents on the R&S FSMR3 product page at:
www.rohde-schwarz.com/product/FSMR3000.html/
Introduces the R&S FSMR3 and describes how to set up and start working with the
product. Includes basic operations, typical measurement examples, and general information, e.g. safety instructions, etc.
A printed version is delivered with the instrument. A PDF version is available for download on the Internet.
1.2 User manuals and help
Separate user manuals are provided for the base unit and the firmware applications:
●
Base unit manual
Contains the description of all instrument modes and functions. It also provides an
introduction to remote control, a complete description of the remote control commands with programming examples, and information on maintenance, instrument
interfaces and error messages.
●
Firmware application manual
Contains the description of the specific functions of a firmware application, including remote control commands. Basic information on operating the R&S FSMR3 is
not included.
The contents of the user manuals are available as help in the R&S FSMR3. The help
offers quick, context-sensitive access to the complete information for the base unit and
the firmware applications.
All user manuals are also available for download or for immediate display on the Internet.
1.3 Service manual
Describes the performance test for checking the rated specifications, module replacement and repair, firmware update, troubleshooting and fault elimination, and contains
mechanical drawings and spare part lists.
The service manual is available for registered users on the global Rohde & Schwarz
information system (GLORIS):
9User Manual 1179.5147.02 ─ 02

R&S®FSMR3-K7
1.4 Instrument security procedures
1.5 Printed safety instructions
1.6 Data sheets and brochures
Documentation overview
Application notes, application cards, white papers, etc.
Deals with security issues when working with the R&S FSMR3 in secure areas. It is
available for download on the Internet.
Provides safety information in many languages. The printed document is delivered with
the product.
The data sheet contains the technical specifications of the R&S FSMR3. It also lists the
firmware applications and their order numbers, and optional accessories.
The brochure provides an overview of the instrument and deals with the specific characteristics.
See www.rohde-schwarz.com/brochure-datasheet/FSMR3000/
1.7 Release notes and open-source acknowledgment (OSA)
The release notes list new features, improvements and known issues of the current
firmware version, and describe the firmware installation.
The open-source acknowledgment document provides verbatim license texts of the
used open source software.
See www.rohde-schwarz.com/firmware/FSMR3000/
1.8 Application notes, application cards, white papers, etc.
These documents deal with special applications or background information on particular topics.
See www.rohde-schwarz.com/application/FSMR3000/
10User Manual 1179.5147.02 ─ 02

R&S®FSMR3-K7
2 Welcome to the R&S FSMR3000 Analog
Welcome to the R&S FSMR3000 Analog Demodulation application
Starting Analog Demodulation
Demodulation application
The R&S FSMR3000 Analog Demodulation application features:
●
AM, FM, and PM demodulation, with various result displays:
– Modulation signal versus time
– Spectrum of the modulation signal (FFT)
– RF signal power versus time
– Spectrum of the RF signal
●
Determining maximum, minimum and average or current values in parallel over a
selected number of measurements
●
Maximum accuracy and temperature stability due to sampling (digitization) already
at the IF and digital down-conversion to the baseband (I/Q)
●
Error-free AM to FM conversion and vice versa, without deviation errors, frequency
response or frequency drift at DC coupling
This user manual contains a description of the functionality that the application provides, including remote control operation.
2.1 Starting Analog Demodulation
Analog Demodulation is a separate application on the R&S FSMR3.
To activate Analog Demodulation
1. Select the [MODE] key.
A dialog box opens that contains all operating modes and applications currently
available on your R&S FSMR3.
2. Select the "AM FM PM Analog Demod" item.
The R&S FSMR3 opens a new channel for the application for analog modulation
analysis.
Multiple Channels and Sequencer Function
When you activate an application, a new channel is created which determines the
measurement settings for that application ("Channel"). The same application can be
activated with different measurement settings by creating several "Channel"s for the
same application.
11User Manual 1179.5147.02 ─ 02

R&S®FSMR3-K7
2.2 Understanding the display information
Welcome to the R&S FSMR3000 Analog Demodulation application
Understanding the display information
The number of channels that can be configured at the same time depends on the available memory on the instrument.
Only one measurement can be performed at any time, namely the one in the currently
active channel. However, to perform the configured measurements consecutively, a
Sequencer function is provided.
If activated, the measurements configured in the currently defined "Channel"s are performed one after the other in the order of the tabs. The currently active measurement is
indicated by a
symbol in the tab label.
The result displays of the individual channels are updated in the tabs (as well as the
"MultiView") as the measurements are performed. Sequential operation itself is independent of the currently displayed tab.
For details on the Sequencer function, see the R&S FSMR3 User Manual.
The following figure shows a measurement diagram during analog modulation analysis. All different information areas are labeled. They are explained in more detail in the
following sections.
1
2
3
4
5
= Channel bar for firmware and measurement settings
1
2 = Diagram area
3 = Window title bar with diagram-specific (trace) information
4 = Instrument status bar with error messages and date/time display
5 = Diagram footer with diagram-specific information, depending on result display
12User Manual 1179.5147.02 ─ 02

R&S®FSMR3-K7
Welcome to the R&S FSMR3000 Analog Demodulation application
Understanding the display information
Channel bar information
In the Analog Modulation Analysis application, the R&S FSMR3 shows the following
settings:
Table 2-1: Information displayed in the channel bar in the application for analog modulation analysis
Ref Level Reference level
m.+el.Att Mechanical and electronic RF attenuation
Offset Reference level offset
AQT Measurement time for data acquisition.
RBW Resolution bandwidth
DBW Demodulation bandwidth
Freq Center frequency for the RF signal
Window title bar information
For each diagram, the header provides the following information:
1 2 345 6 7 8 9
Figure 2-1: Window title bar information in the application for analog modulation analysis
1 = Window number
2 = Window type
3 = Trace color
4 = Trace number
5 = Detector
6 = Trace mode
7 = Reference value (at the defined reference position)
8 = AF coupling (AC/DC), only in AF time domains, if applicable
9 = Results are selected for demodulation output
Diagram footer information
The diagram footer (beneath the diagram) contains the following information, depending on the evaluation:
"RF Spectrum"
CF: Center frequency
of input signal
Sweep points Span: measured span
RF Time domain
CF: Center frequency
of input signal
Sweep points Time per division
13User Manual 1179.5147.02 ─ 02

R&S®FSMR3-K7
Welcome to the R&S FSMR3000 Analog Demodulation application
Understanding the display information
AF Spectrum
AF CF: center frequency of demodulated signal
AF Time domain
CF: Center frequency
of input signal
Sweep points AF Span: evaluated span
Sweep points Time per division
For most modes, the number of sweep points shown in the display are indicated in the
diagram footer. In zoom mode, the (rounded) number of currently displayed points are
indicated.
Status bar information
Global instrument settings, the instrument status and any irregularities are indicated in
the status bar beneath the diagram.
Furthermore, the progress of the current operation is displayed in the status bar.
14User Manual 1179.5147.02 ─ 02

R&S®FSMR3-K7
3 Measurements and result displays
Measurements and result displays
Access: "Overview" > "Display Config"
Or: [MEAS] > "Display Config"
The data that was measured by the R&S FSMR3 can be evaluated using various different methods. In the Analog Modulation Analysis application, up to six evaluation
methods can be displayed simultaneously in separate windows. The results can be displayed as absolute deviations or relative to a reference value or level.
The abbreviation "AF" (for Audio Frequency) refers to the demodulated AM, FM or PM
signal.
Basis for evaluation
All evaluations are based on the I/Q data set acquired during the measurement. The
spectrum of the modulated signal to be evaluated is determined by the demodulation
bandwidth. However, it can be restricted to a limited span ("AF Span") if only part of the
signal is of interest. Furthermore, the time base for evaluations in the time domain can
be restricted to analyze a smaller extract in more detail, see Chapter 4.5, "Time
domain zoom", on page 29.
AM Time Domain...........................................................................................................15
FM Time Domain...........................................................................................................16
PM Time Domain...........................................................................................................17
AM Spectrum................................................................................................................ 18
FM Spectrum.................................................................................................................19
PM Spectrum................................................................................................................ 20
RF Time Domain...........................................................................................................21
RF Spectrum.................................................................................................................22
Result Summary............................................................................................................23
Marker Table................................................................................................................. 25
Marker Peak List........................................................................................................... 25
AM Time Domain
Displays the modulation depth of the demodulated AM signal (in %) versus time.
15User Manual 1179.5147.02 ─ 02

R&S®FSMR3-K7
Measurements and result displays
Remote command:
LAY:ADD? '1',RIGH,'XTIM:AM:REL'
(See LAYout:ADD[:WINDow]? on page 184)
FM Time Domain
Displays the frequency spectrum of the demodulated FM signal versus time.
16User Manual 1179.5147.02 ─ 02

R&S®FSMR3-K7
Measurements and result displays
Remote command:
LAY:ADD? '1',RIGH,'XTIM:FM'
(See LAYout:ADD[:WINDow]? on page 184)
PM Time Domain
Displays the phase deviations of the demodulated PM signal (in rad or °) versus time.
17User Manual 1179.5147.02 ─ 02

R&S®FSMR3-K7
Measurements and result displays
Remote command:
LAY:ADD? '1',RIGH,'XTIM:PM'
(See LAYout:ADD[:WINDow]? on page 184)
AM Spectrum
Displays the modulation depth of the demodulated AM signal (in % or dB) versus AF
span. The spectrum is calculated from the demodulated AM signal in the time domain
via FFT.
18User Manual 1179.5147.02 ─ 02

R&S®FSMR3-K7
Measurements and result displays
Remote command:
LAY:ADD? '1',RIGH,'XTIMe:AM:REL:AFSPectrum1'
(see LAYout:ADD[:WINDow]? on page 184)
FM Spectrum
Displays the frequency deviations of the demodulated FM signal (in Hz or dB) versus
AF span. The spectrum is calculated from the demodulated AM signal in the time
domain via FFT.
19User Manual 1179.5147.02 ─ 02

R&S®FSMR3-K7
Measurements and result displays
Remote command:
LAY:ADD? '1',RIGH,'XTIMe:FM:AFSPectrum1'
(see LAYout:ADD[:WINDow]? on page 184)
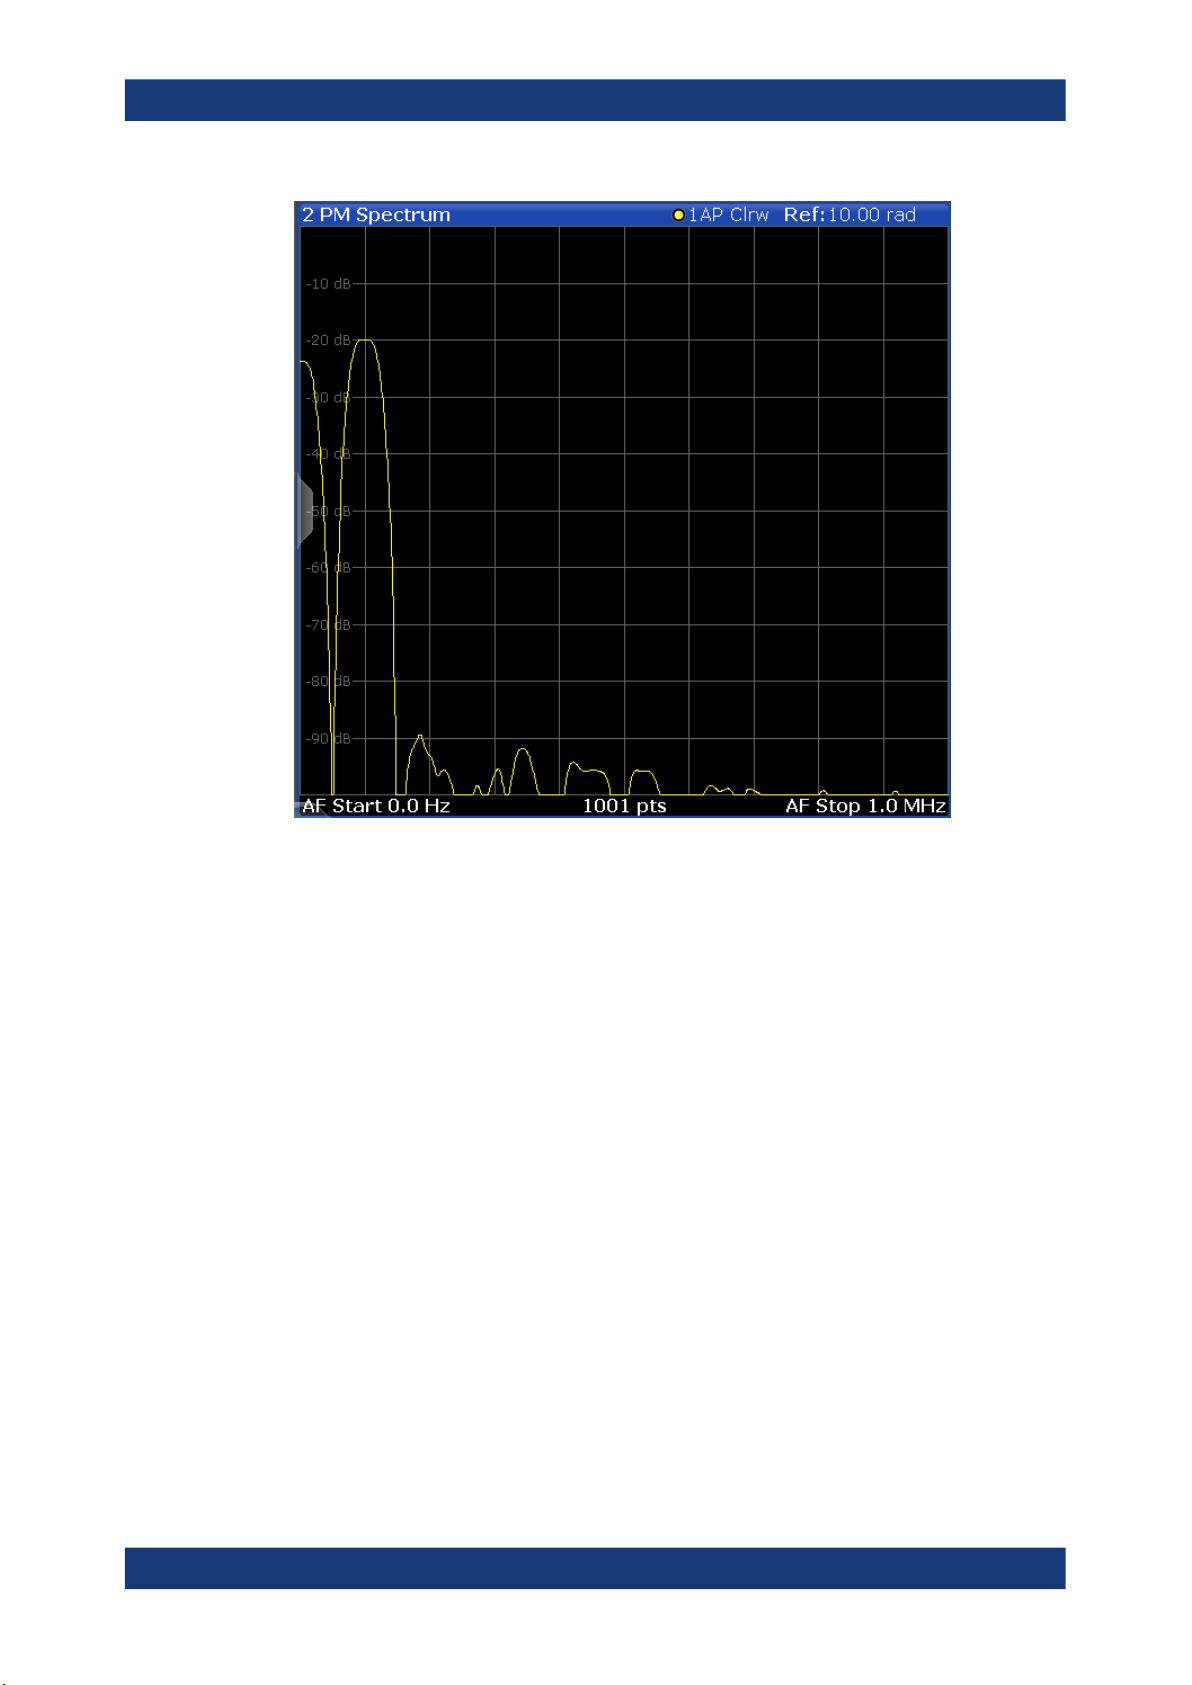
PM Spectrum
Displays the phase deviations of the demodulated PM signal (in rad, ° or dB) versus
AF span. The spectrum is calculated from the demodulated AM signal in the time
domain via FFT.
20User Manual 1179.5147.02 ─ 02
R&S®FSMR3-K7
Measurements and result displays
Remote command:
LAY:ADD? '1',RIGH,'XTIMe:PM:AFSPectrum1'
(see LAYout:ADD[:WINDow]? on page 184)
RF Time Domain
Displays the RF power of the input signal versus time. The level values represent the
magnitude of the I/Q data set.
21User Manual 1179.5147.02 ─ 02

R&S®FSMR3-K7
Measurements and result displays
Remote command:
LAY:ADD? '1',RIGH,'XTIM:AM'
(see LAYout:ADD[:WINDow]? on page 184)
RF Spectrum
Displays the spectrum of the input signal. In contrast to the Spectrum application, the
frequency values are determined using FFT from the recorded I/Q data set.
22User Manual 1179.5147.02 ─ 02

R&S®FSMR3-K7
Measurements and result displays
Remote command:
LAY:ADD? '1',RIGH,'XTIM:SPECTRUM'
(see LAYout:ADD[:WINDow]? on page 184)
Result Summary
The "result summary" displays the results of the demodulation functions for all windows
in a table.
The following general results are provided:
For each demodulation, the following results are provided:
Label Description
"Carr Power" Measured carrier power
"Carr Offset" Carrier offset to nominal center frequency
"Mod. Depth" Modulation depth
23User Manual 1179.5147.02 ─ 02

R&S®FSMR3-K7
Measurements and result displays
Table 3-1: Result summary description
Label Description
"+Peak" Positive peak (maximum)
"-Peak" Negative peak (minimum)
"+/-Peak/2" Average of positive and negative peaks
"RMS" Root Mean Square value
"Mod Freq" Modulation frequency
"SINAD" Signal-to-noise-and-distortion
(Calculated only if AF Spectrum is displayed)
Measures the ratio of the total power to the power of noise and harmonic distortions.
The noise and harmonic power is calculated inside the AF spectrum span. The DC
offset is removed before the calculation.
"DISTORT" Modulation distortion in %
(Calculated only if "SINAD" is also calculated)
Measures the distortion of the modulation in relation to the total power of the signal
inside the AF spectrum span. Indicates the quality of the modulation.
"THD" Total harmonic distortion
The ratio of the harmonics to the fundamental and harmonics. All harmonics inside
the AF spectrum span are considered up to the tenth harmonic.
(Calculated only if AF Spectrum is displayed)
Note: Relative demodulation results. Optionally, the demodulation results in relation to
user-defined or measured reference values are determined. See Chapter 5.7.6, "Result
table settings", on page 62.
In addition, the following general information for the input signal is provided:
●
"Carrier Power": the power of the carrier without modulation
●
"Carrier Offset": the deviation of the calculated carrier frequency to the ideal carrier
frequency
●
"Modulation Depth" (AM or "RF Time Domain" only): the difference in amplitude the
carrier signal is modulated with
Remote command:
LAY:ADD? '1',RIGH,RSUM, see LAYout:ADD[:WINDow]? on page 184
Results:
Chapter 11.7.3, "Retrieving result summary values", on page 196
24User Manual 1179.5147.02 ─ 02

R&S®FSMR3-K7
Measurements and result displays
Marker Table
Displays a table with the current marker values for the active markers.
This table is displayed automatically if configured accordingly.
Tip: To navigate within long marker tables, simply scroll through the entries with your
finger on the touchscreen.
Remote command:
LAY:ADD? '1',RIGH, MTAB, see LAYout:ADD[:WINDow]? on page 184
Results:
CALCulate<n>:MARKer<m>:X on page 218
CALCulate<n>:MARKer<m>:Y? on page 218
Marker Peak List
The marker peak list determines the frequencies and levels of peaks in the spectrum or
time domain. How many peaks are displayed can be defined, as well as the sort order.
In addition, the detected peaks can be indicated in the diagram. The peak list can also
be exported to a file for analysis in an external application.
Remote command:
LAY:ADD? '1',RIGH, PEAK, see LAYout:ADD[:WINDow]? on page 184
Results:
CALCulate<n>:MARKer<m>:X on page 218
CALCulate<n>:MARKer<m>:Y? on page 218
25User Manual 1179.5147.02 ─ 02

R&S®FSMR3-K7
4 Measurement basics
4.1 Demodulation process
Measurement basics
Demodulation process
Some background knowledge on basic terms and principles used in Analog Modulation
Analysis measurements is provided here for a better understanding of the required
configuration settings.
● Demodulation process............................................................................................ 26
● Demodulation bandwidth.........................................................................................28
● Sample rate and demodulation bandwidth..............................................................28
● AF filters..................................................................................................................29
● Time domain zoom..................................................................................................29
The demodulation process is shown in Figure 4-1. All calculations are performed simultaneously with the same I/Q data set. Magnitude (= amplitude) and phase of the complex I/Q pairs are determined. The frequency result is obtained from the differential
phase.
For details on general I/Q data processing in the R&S FSMR3, refer to the reference
part of the I/Q Analysis remote control description in the R&S FSMR3 User Manual.
26User Manual 1179.5147.02 ─ 02

R&S®FSMR3-K7
Measurement basics
Demodulation process
Figure 4-1: Block diagram of software demodulator
27User Manual 1179.5147.02 ─ 02

R&S®FSMR3-K7
4.2 Demodulation bandwidth
Measurement basics
Sample rate and demodulation bandwidth
The collected measured values are evaluated by the selected detector. The result is
displayed on the screen and can be read out via remote control.
In addition, important parameters are calculated:
●
A counter determines the modulation frequency for AM, FM, and PM.
●
average power = carrier power (RF power)
●
average frequency = carrier frequency offset (FM)
●
The modulation depth or the frequency or phase deviation; the deviations are
determined from the trace data
AC coupling is possible with FM and PM display.
The demodulation bandwidth determines the span of the signal that is demodulated. It
is not the 3-dB bandwidth of the filter, but the useful bandwidth which is distortion-free
regarding phase and amplitude.
Therefore the following formulas apply:
●
AM: demodulation bandwidth ≥ 2 x modulation frequency
●
FM: demodulation bandwidth ≥ 2 x (frequency deviation + modulation frequency)
●
PM: demodulation bandwidth ≥ 2 x modulation frequency x (1 + phase deviation)
If the center frequency of the analyzer is not set exactly to the signal frequency, the
demodulation bandwidth must be increased by the carrier offset, in addition to the
requirement described above. The bandwidth must also be increased if FM or PM AC
coupling is selected.
In general, select the demodulation bandwidth as narrow as possible to improve the
S/N ratio. The residual FM caused by noise floor and phase noise increases dramatically with the bandwidth, especially with FM.
For help on determining the adequate demodulation bandwidth, see "Determining the
demodulation bandwidth" on page 108.
4.3 Sample rate and demodulation bandwidth
The maximum demodulation bandwidths that can be obtained during the measurement, depending on the sample rate, are listed in the tables below for different demodulation filter types. The allowed value range of the measurement time and trigger offset
depends on the selected demodulation bandwidth and demodulation filter. If the AF filter or the AF trigger are not active, the measurement time increases by 20 %.
28User Manual 1179.5147.02 ─ 02

R&S®FSMR3-K7
Measurement basics
Time domain zoom
A maximum of 24 million samples can be captured, assuming sufficient memory is
available; thus the maximum measurement time can be determined according to the
following formula:
Meas.time
The minimum trigger offset is (-Meas.time
Large numbers of samples
Principally, the R&S FSMR3 can handle up to 24 million samples. However, when
480001 samples are exceeded, all traces that are not currently being displayed in a
window are deactivated to improve performance. The traces can only be activated
again when the samples are reduced.
Effects of measurement time on the stability of measurement results
Despite amplitude and frequency modulation, the display of carrier power and carrier
frequency offset is stable.
Stability is achieved by a digital filter which sufficiently suppresses the modulation. As
a prerequisite, the measurement time must be ≥ 3 x 1 / modulation frequency, i.e. at
least three periods of the AF signal are recorded.
The mean carrier power for calculating the AM is also calculated with a digital filter.
The filter returns stable results after a measurement time of ≥ 3 x 1 / modulation frequency, i.e. at least three cycles of the AF signal must be recorded before a stable AM
can be shown.
= Sample count
max
/ sample rate
max
max
)
4.4 AF filters
Additional filters applied after demodulation help filter out unwanted signals, or correct
pre-emphasized input signals. A CCITT filter allows you to evaluate the signal by simulating the characteristics of human hearing.
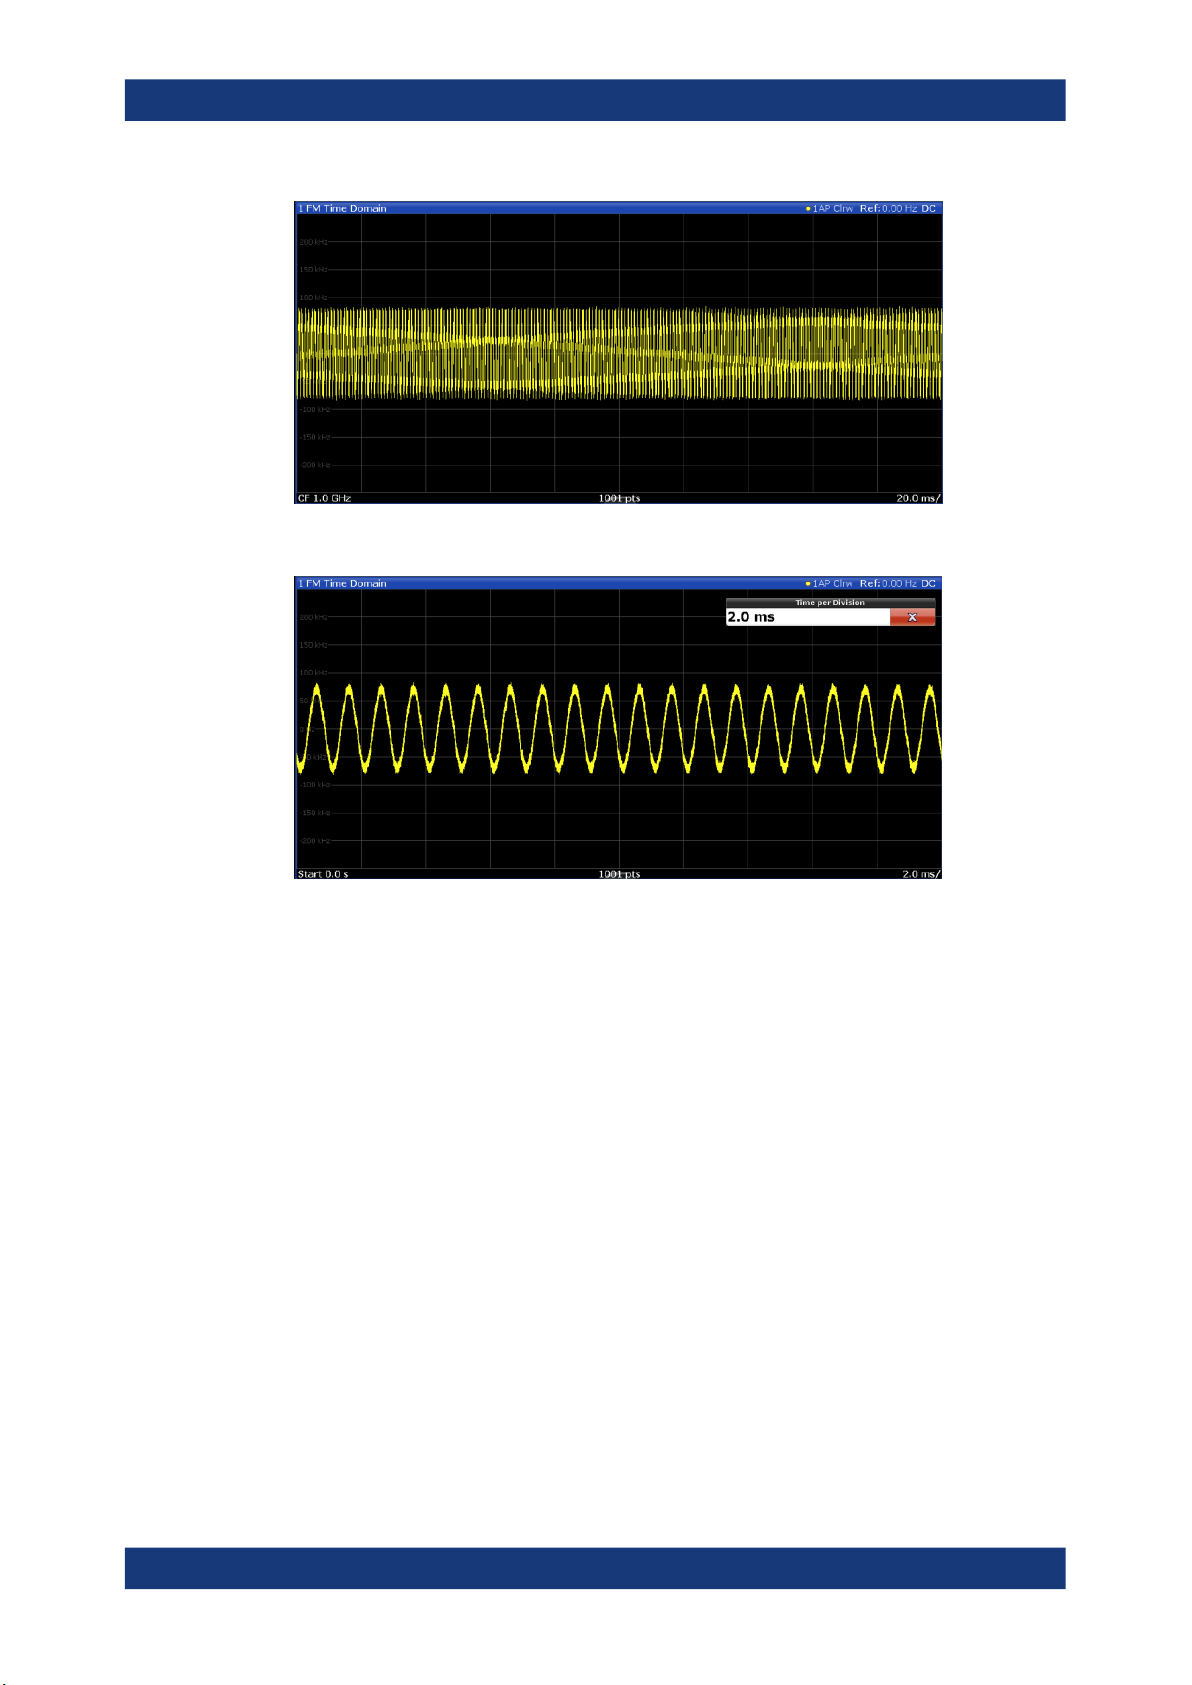
4.5 Time domain zoom
For evaluations in the time domain, the demodulated data for a particular time span
can be extracted and displayed in more detail using the "Time Domain Zoom" function.
Zooming is useful if the measurement time is very large and thus each sweep point
represents a large time span. The time domain zoom function distributes the available
sweep points only among the time span defined by the zoom area length. The time
span displayed per division of the diagram is decreased. Thus, the display of the
extracted time span becomes more precise.
29User Manual 1179.5147.02 ─ 02
R&S®FSMR3-K7
Measurement basics
Time domain zoom
Figure 4-2: FM time domain measurement with a very long measurement time (200 ms)
Figure 4-3: FM time domain measurement with time domain zoom (2.0 ms per division)
The time domain zoom area affects not only the diagram display, but the entire evaluation for the current window.
In contrast to the time domain zoom, the graphical zoom is available for all diagram
evaluations. However, the graphical zoom is useful only if more measured values than
trace points are available. The (time) span represented by each measurement point
remains the same.
30User Manual 1179.5147.02 ─ 02
 Loading...