


R&S®FPS-K14x
3GPP 5G NR Downlink Measurement
Application
User Manual
(;Ý<62)
1179120602
Version 02

This manual applies to the following R&S®FPS models with firmware version 1.70 and higher:
●
R&S®FPS4 (1319.2008K04)
●
R&S®FPS7 (1319.2008K07)
●
R&S®FPS13 (1319.2008K13)
●
R&S®FPS30 (1319.2008K30)
●
R&S®FPS40 (1319.2008K40)
The following firmware options are described:
●
R&S®FPS-K144 (5G NR DL) (1321.4979.02)
●
R&S®FPS-K148 (5G NR R16 Extension for downlink)
© 2021 Rohde & Schwarz GmbH & Co. KG
Mühldorfstr. 15, 81671 München, Germany
Phone: +49 89 41 29 - 0
Email: info@rohde-schwarz.com
Internet: www.rohde-schwarz.com
Subject to change – data without tolerance limits is not binding.
R&S® is a registered trademark of Rohde & Schwarz GmbH & Co. KG.
Trade names are trademarks of the owners.
1179.1206.02 | Version 02 | R&S®FPS-K14x
Throughout this manual, products from Rohde & Schwarz are indicated without the ® symbol , e.g. R&S®FPS is indicated as
R&S FPS.

R&S®FPS-K14x
1 Preface.................................................................................................... 7
1.1 Typographical Conventions......................................................................................... 7
2 Welcome to the 5G NR Measurement Application..............................8
2.1 Installation..................................................................................................................... 8
2.2 5G NR Measurement Application Selection............................................................... 8
2.3 Display Information.......................................................................................................9
3 Measurements and Result Displays...................................................12
3.1 Selecting Measurements............................................................................................ 12
3.2 Selecting Result Displays.......................................................................................... 13
3.3 Performing Measurements.........................................................................................14
Contents
Contents
3.4 Selecting the Operating Mode................................................................................... 14
3.5 Result Summary..........................................................................................................15
3.6 I/Q Measurements....................................................................................................... 21
3.7 Time Alignment Error..................................................................................................37
3.8 Frequency Sweep Measurements............................................................................. 39
3.9 Reference: Custom Limits..........................................................................................48
3.10 Reference: 3GPP Test Scenarios...............................................................................49
4 Configuration........................................................................................51
4.1 I/Q Measurement......................................................................................................... 51
4.1.1 Configuration Overview.................................................................................................52
4.1.2 Automatic Measurement Configuration.........................................................................53
4.1.3 Physical Signal Description...........................................................................................57
4.1.4 Component Carrier Configuration................................................................................. 61
4.1.5 Radio Frame Configuration........................................................................................... 65
4.1.6 Synchronization Signal Configuration........................................................................... 69
4.1.7 Bandwidth Part Configuration....................................................................................... 75
4.1.8 Slot Configuration..........................................................................................................80
4.1.9 PDSCH and PDCCH Configuration.............................................................................. 91
4.1.10 Antenna Port Configuration......................................................................................... 111
4.1.11 Advanced Settings.......................................................................................................112
3User Manual 1179.1206.02 ─ 02

R&S®FPS-K14x
4.1.12 Generator Control........................................................................................................118
4.1.13 Input Source Configuration......................................................................................... 122
4.1.14 Frequency Configuration.............................................................................................122
4.1.15 Amplitude Configuration..............................................................................................123
4.1.16 Data Capture...............................................................................................................126
4.1.17 Trigger Configuration...................................................................................................130
4.1.18 Tracking.......................................................................................................................131
4.1.19 Demodulation.............................................................................................................. 134
4.2 Time Alignment Error Configuration.......................................................................137
4.3 Frequency Sweep Measurement Configuration.....................................................137
4.4 Microservice Export..................................................................................................141
4.5 Reference: Structure of .allocation Files................................................................ 141
4.6 Basics on Input from I/Q Data Files.........................................................................148
Contents
5 Analysis.............................................................................................. 150
5.1 General Analysis Tools.............................................................................................150
5.1.1 Data Export................................................................................................................. 150
5.1.2 Diagram Scale.............................................................................................................151
5.1.3 Zoom........................................................................................................................... 152
5.1.4 Markers....................................................................................................................... 152
5.2 Analysis Tools for I/Q Measurements..................................................................... 153
5.2.1 Layout of Numerical Results....................................................................................... 153
5.2.2 Result Settings............................................................................................................ 154
5.2.3 Table Configuration..................................................................................................... 156
5.2.4 Result Views................................................................................................................157
5.2.5 Evaluation Range........................................................................................................158
5.2.6 Beamforming Selection............................................................................................... 161
5.3 Analysis Tools for Frequency Sweep Measurements............................................161
6 Remote Control.................................................................................. 162
6.1 Common Suffixes......................................................................................................162
6.2 Introduction............................................................................................................... 163
6.2.1 Conventions used in Descriptions...............................................................................164
6.2.2 Long and Short Form.................................................................................................. 164
6.2.3 Numeric Suffixes......................................................................................................... 165
4User Manual 1179.1206.02 ─ 02

R&S®FPS-K14x
6.2.4 Optional Keywords...................................................................................................... 165
6.2.5 Alternative Keywords.................................................................................................. 165
6.2.6 SCPI Parameters........................................................................................................ 166
6.3 5G NR Application Selection....................................................................................168
6.4 Screen Layout........................................................................................................... 171
6.4.1 General Layout............................................................................................................171
6.4.2 Layout of a Single Channel......................................................................................... 173
6.5 Measurement Control............................................................................................... 181
6.5.1 Measurements............................................................................................................ 181
6.5.2 Measurement Sequences........................................................................................... 183
6.6 Remote Commands to Retrieve Numeric Results................................................. 184
6.6.1 Result Summary..........................................................................................................185
6.6.2 Time Alignment Error.................................................................................................. 195
Contents
6.6.3 Marker Table............................................................................................................... 195
6.6.4 CCDF Table.................................................................................................................199
6.7 Limit Check Results..................................................................................................200
6.7.1 EVM Limits.................................................................................................................. 200
6.7.2 Transmit Power On / Off Limits................................................................................... 203
6.7.3 Frequency Sweep Limits.............................................................................................204
6.8 Retrieve Trace Data...................................................................................................212
6.8.1 Using the TRACe[:DATA] Command...........................................................................212
6.8.2 Read Measurement Results........................................................................................228
6.9 Configuration.............................................................................................................232
6.9.1 General Configuration................................................................................................. 232
6.9.2 Automatic Configuration..............................................................................................235
6.9.3 Physical Settings.........................................................................................................239
6.9.4 Component Carrier Configuration............................................................................... 243
6.9.5 General Radio Frame Configuration........................................................................... 247
6.9.6 Synchronization Signal Configuration......................................................................... 248
6.9.7 Bandwidth Part Configuration..................................................................................... 255
6.9.8 Slot Configuration........................................................................................................258
6.9.9 CSI Reference Signal Configuration........................................................................... 265
6.9.10 Positioning Reference Signal...................................................................................... 274
5User Manual 1179.1206.02 ─ 02

R&S®FPS-K14x
6.9.11 CORESET Allocation Configuration............................................................................278
6.9.12 PDSCH Allocation Configuration.................................................................................285
6.9.13 Enhanced CORESET Allocation Configuration...........................................................292
6.9.14 Enhanced PDSCH Settings: DMRS............................................................................308
6.9.15 Enhanced PDSCH Settings: PTRS.............................................................................317
6.9.16 Enhanced PDSCH Settings: Scrambling / Coding...................................................... 320
6.9.17 Antenna Port Configuration.........................................................................................324
6.9.18 Advanced Settings: Global..........................................................................................325
6.9.19 Advanced Settings: Reference Point A....................................................................... 329
6.9.20 Advanced Settings: LTE-CRS Coexistence................................................................ 331
6.9.21 Generator Control....................................................................................................... 334
6.9.22 Input Configuration......................................................................................................340
6.9.23 Frequency Configuration.............................................................................................341
Contents
6.9.24 Amplitude Configuration..............................................................................................343
6.9.25 Data Capture...............................................................................................................347
6.9.26 Trigger.........................................................................................................................350
6.9.27 Tracking.......................................................................................................................355
6.9.28 Demodulation.............................................................................................................. 357
6.9.29 Time Alignment Measurement.................................................................................... 360
6.9.30 Frequency Sweep Measurements.............................................................................. 360
6.10 Analysis..................................................................................................................... 364
6.10.1 General Analysis Tools................................................................................................364
6.10.2 Analysis Tools for I/Q Measurements..........................................................................376
List of Commands (5G NR Downlink).............................................. 386
Index....................................................................................................396
6User Manual 1179.1206.02 ─ 02

R&S®FPS-K14x
1 Preface
1.1 Typographical Conventions
Preface
Typographical Conventions
The following text markers are used throughout this documentation:
Convention Description
"Graphical user interface elements"
[Keys] Key and knob names are enclosed by square brackets.
Filenames, commands,
program code
Input Input to be entered by the user is displayed in italics.
Links Links that you can click are displayed in blue font.
"References" References to other parts of the documentation are enclosed by quota-
All names of graphical user interface elements on the screen, such as
dialog boxes, menus, options, buttons, and softkeys are enclosed by
quotation marks.
Filenames, commands, coding samples and screen output are distinguished by their font.
tion marks.
7User Manual 1179.1206.02 ─ 02

R&S®FPS-K14x
2 Welcome to the 5G NR Measurement Appli-
Welcome to the 5G NR Measurement Application
5G NR Measurement Application Selection
cation
The R&S FPS-K144 is a firmware application that adds functionality to measure signals according to the 3GPP 5G NR (new radio) standard on the downlink to the
R&S FPS.
Bandwidth of 5G NR signals
5G NR signals have a bandwidth between 5 MHz and 400 MHz.
Measuring signals greater than 10 MHz requires an R&S FPS with one of the optional
bandwidth extensions (28 MHz or more).
The R&S FPS has the following additional restrictions.
●
The largest bandwidth extension is 160 MHz. Measuring signals whose channel
bandwidth is larger than 100 MHz is therefore not possible.
This user manual contains a description of the functionality that the application provides, including remote control operation. Functions that are not discussed in this manual are the same as in the spectrum application and are described in the R&S FPS
user manual. The latest versions of the manuals are available for download at the
product homepage.
https://www.rohde-schwarz.com/manual/fps
● Installation.................................................................................................................8
● 5G NR Measurement Application Selection..............................................................8
● Display Information................................................................................................... 9
2.1 Installation
Find detailed installation instructions in the getting started or the release notes of the
R&S FPS.
2.2 5G NR Measurement Application Selection
The 5G NR measurement application adds a new application to the R&S FPS.
Starting the application
1. Press the [MODE] key on the front panel of the R&S FPS.
A dialog box opens that contains all operating modes and applications currently
available on your R&S FPS.
2. Select the "5G NR" item.
8User Manual 1179.1206.02 ─ 02

R&S®FPS-K14x
2.3 Display Information
Welcome to the 5G NR Measurement Application
Display Information
The R&S FPS opens a new measurement channel for the 5G NR measurement
application.
The measurement is started immediately with the default settings. It can be configured
in the "Overview" dialog box, which is displayed when you select the "Overview" softkey from any menu.
The following figure shows a measurement diagram during analyzer operation. All different information areas are labeled. They are explained in more detail in the following
sections.
1 2 3 7 8
1
= Toolbar
2 = Channel bar
3 = Diagram header
4 = Result display
5 = Subwindows (Views)
6 = Subwindow header
7 = Status bar
8 = Softkeys
4 5 6
9User Manual 1179.1206.02 ─ 02

R&S®FPS-K14x
Welcome to the 5G NR Measurement Application
Display Information
MSRA operating mode
In MSRA operating mode, additional tabs and elements are available. A colored background of the screen behind the measurement channel tabs indicates that you are in
MSRA operating mode. Frequency sweep measurements are not available in MSRA
operating mode.
For details on the MSRA operating mode, see the R&S FPS MSRA user manual.
Channel bar information
In the 5G NR measurement application, the R&S FPS shows the following settings:
Table 2-1: Information displayed in the channel bar in the 5G NR measurement application
Ref Level Reference level.
Att Mechanical and electronic RF attenuation.
Inp: File Freq Frequency for I/Q file input.
Freq Frequency for other input sources (RF etc.).
Mode* 5G NR mode (link direction and channel bandwidth).
Frame Count* The first number represents the number of frames that have already been
captured.
The second number represents the total number of frames that will be
captured.
The third number in brackets represents the number of frames currently in
the capture buffer.
Capture Time Signal length that has been captured.
Frame Selected frame number.
BWP/SS* Shows the signal part for which results are displayed (evaluation range).
SS = synchronization signal
BWP = bandwidth part
View<x> Information about the contents of View 1 and View 2.
Select the button for access to the dialog box for view configuration.
*If you capture more than one data stream (for example several component carriers), the R&S FPS shows
two values separated by a slash. The first number corresponds to the first analyzed data stream, the second number to the second analyzed data stream.
The channel bar also displays information on instrument settings that affect the measurement results even though this is not immediately apparent from the display of the
measured values (for example transducer or trigger settings). This information is displayed only when applicable for the current measurement. For details, see the
R&S FPS getting started manual.
Diagram header
The information in the diagram header depends on the result display.
●
All diagrams show the window number and type of result display.
●
Most diagrams contain trace information.
10User Manual 1179.1206.02 ─ 02

R&S®FPS-K14x
Welcome to the 5G NR Measurement Application
Display Information
●
Some diagrams contain controls to customize the diagram contents. The diagram
header of the "Allocation Summary", for example, contains a control to select which
columns are displayed.
●
If you analyze multiple component carriers or frames, the diagram header shows
which CC or frame is analyzed.
Status bar information
Global instrument settings, the instrument status and any irregularities are indicated in
the status bar beneath the diagram. Furthermore, the progress of the current operation
is displayed in the status bar.
Regarding the synchronization state, the application shows the following labels.
●
"Sync OK"
The synchronization was successful. The status bar is green.
●
"Sync Failed"
The synchronization was not successful. The status bar is red.
If you are measuring several component carriers, the message also indicates
which component carrier could not be synchronized.
11User Manual 1179.1206.02 ─ 02

R&S®FPS-K14x
3 Measurements and Result Displays
Measurements and Result Displays
Selecting Measurements
The 5G NR measurement application measures and analyzes various aspects of a 5G
NR signal.
The application provides several measurements and result displays.
●
Measurements capture and analyze the signal in a different way.
●
Result displays are different representations of the measurement results. They are
either diagrams that show the results as a graph or tables that show the results as
numbers.
Remote command:
Measurement selection: CONFigure[:NR5G]:MEASurement on page 233
Result display selection: LAYout:ADD[:WINDow]? on page 174
● Selecting Measurements.........................................................................................12
● Selecting Result Displays........................................................................................13
● Performing Measurements......................................................................................14
● Selecting the Operating Mode.................................................................................14
● Result Summary......................................................................................................15
● I/Q Measurements...................................................................................................21
● Time Alignment Error.............................................................................................. 37
● Frequency Sweep Measurements.......................................................................... 39
● Reference: Custom Limits.......................................................................................48
● Reference: 3GPP Test Scenarios........................................................................... 49
3.1 Selecting Measurements
Access: "Overview" > "Select Measurement"
The "Select Measurement" dialog box contains several buttons. Each button represents a measurement. A measurement in turn is a set of result displays that thematically belong together and that have a particular display configuration. If these predefined display configurations do not suit your requirements, you can add or remove
result displays as you like. For more information about selecting result displays, see
Chapter 3.2, "Selecting Result Displays", on page 13.
Depending on the measurement, the R&S FPS changes the way it captures and processes the raw signal data.
EVM
EVM measurements record, process and demodulate the signal's I/Q data. The result
displays available for EVM measurements show various aspects of the 5G NR signal
quality.
For EVM measurements, you can combine the result displays in any way.
For more information on the result displays, see Chapter 3.6, "I/Q Measurements",
on page 21.
12User Manual 1179.1206.02 ─ 02

R&S®FPS-K14x
Measurements and Result Displays
Selecting Result Displays
Remote command:
CONFigure[:NR5G]:MEASurement on page 233
Time alignment error
Time alignment error (TAE) measurements record, process and demodulate the signal's I/Q data. The result displays available for TAE measurements indicate how well
the antennas in a multi-antenna system are aligned.
For TAE measurements, you can combine the result displays in any way.
For more information on the result displays, see Chapter 3.7, "Time Alignment Error",
on page 37.
Remote command:
CONFigure[:NR5G]:MEASurement on page 233
Channel power ACLR
(inludes multi carrier ACLR and cumulative ACLR measurements)
ACLR measurements sweep the frequency spectrum instead of processing I/Q data.
The ACLR measurements evaluates the leakage ratio of neighboring channels and
evaluates if the signal is within the defined limits. The measurement provides several
result displays. You can combine the result displays in any way.
For more information on the result displays, see Chapter 3.8, "Frequency Sweep Mea-
surements", on page 39.
Remote command:
CONFigure[:NR5G]:MEASurement on page 233
SEM
(inlcudes multi carrier SEM measurements)
SEM measurements sweep the frequency spectrum instead of processing I/Q data.
The SEM measurements tests the signal against a spectrum emission mask and eval-
uates if the signal is within the defined limits. The measurement provides several result
displays. You can combine the result displays in any way.
For more information on the result displays, see Chapter 3.8, "Frequency Sweep Mea-
surements", on page 39.
Remote command:
CONFigure[:NR5G]:MEASurement on page 233
3.2 Selecting Result Displays
Access:
The R&S FPS opens a menu (the SmartGrid) to select result displays. For more information on the SmartGrid functionality, see the R&S FPS Getting Started.
In the default state of the application, it shows several conventional result displays.
●
Capture Buffer
●
EVM vs Carrier
13User Manual 1179.1206.02 ─ 02

R&S®FPS-K14x
3.3 Performing Measurements
Measurements and Result Displays
Selecting the Operating Mode
●
Power Spectrum
●
Result Summary
●
Alloc ID vs Symbol x Carrier
●
Constellation Diagram
From that predefined state, add and remove result displays as you like from the SmartGrid menu.
Remote command: LAYout:ADD[:WINDow]? on page 174
By default, the application measures the signal continuously. In "Continuous Sweep"
mode, the R&S FPS captures and analyzes the data again and again.
●
For I/Q measurements, the amount of captured data depends on the capture time.
●
For frequency sweep measurement, the amount of captured data depends on the
sweep time.
In "Single Sweep" mode, the R&S FPS stops measuring after it has captured the data
once. The amount of data again depends on the capture time.
Refreshing captured data
You can also repeat a measurement based on the data that has already been captured
with the "Refresh" function. Repeating a measurement with the same data can be useful, for example, if you want to apply different modulation settings to the same I/Q data.
For more information, see the documentation of the R&S FPS.
3.4 Selecting the Operating Mode
Access: [MODE] > "Multi-Standard Radio Analyzer Tab"
The 5G NR application is supported by the Multi Standard Radio Analyzer (MSRA).
In MSRA operating mode, only the MSRA master actually captures data. The application receives an extract of the captured data for analysis, referred to as the application
data. The application data range is defined by the same settings used to define the
signal capture in "Signal and Spectrum Analyzer" mode. In addition, a capture offset
can be defined, i.e. an offset from the start of the captured data to the start of the
analysis interval.
If a signal contains multiple data channels for multiple standards, separate applications
are used to analyze each data channel. Thus, it is of interest to know which application
is analyzing which data channel. The MSRA master display indicates the data covered
by each application by vertical blue lines labeled with the application name. The blue
lines correspond to the channel bandwidth.
14User Manual 1179.1206.02 ─ 02

R&S®FPS-K14x
Measurements and Result Displays
Result Summary
However, the individual result displays of the application need not analyze the complete data range. The data range that is actually analyzed by the individual result display is referred to as the analysis interval.
The analysis interval is automatically determined according to the Capture Time you
have defined. The analysis interval cannot be edited directly in the 5G NR application,
but is changed automatically when you change the evaluation range. The currently
used analysis interval (in seconds, related to capture buffer start) is indicated in the
window header for each result display.
A frequent question when analyzing multi-standard signals is how each data channel is
correlated (in time) to others. Thus, an analysis line has been introduced. The analysis
line is a common time marker for all MSRA client applications. It can be positioned in
any MSRA client application or the MSRA Master and is then adjusted in all other client
applications. Thus, you can easily analyze the results at a specific time in the measurement in all client applications and determine correlations.
If the marked point in time is contained in the analysis interval of the client application,
the line is indicated in all time-based result displays, such as time, symbol, slot or bit
diagrams. By default, the analysis line is displayed, however, it can be hidden from
view manually. In all result displays, the "AL" label in the window title bar indicates
whether the analysis line lies within the analysis interval or not:
●
orange "AL": the line lies within the interval
●
white "AL": the line lies within the interval, but is not displayed (hidden)
●
no "AL": the line lies outside the interval
For details on the MSRA operating mode, see the R&S FPS MSRA documentation.
3.5 Result Summary
In addition to various graphical results, the R&S FPS provides a numerical result summary for I/Q measurements. The result summary shows a multitude of results that indicate the signal quality, combined in one table.
The result summary is split into several parts.
●
Frame statistics, which evaluate the metrics of the resource elements in a complete
frame.
Results are averaged over frames.
●
Slot and subframe statistics, which evaluate metrics of the resource elements in a
single slot or subframe.
Results are averaged over slots / subframes.
If you are using different numerologies, the R&S FPS first averages all slots with the
same numerology, before calculating the overall mean value.
Each row in the table corresponds to a certain metric or result parameter. You can add
or remove results you want to display as necessary.
15User Manual 1179.1206.02 ─ 02

R&S®FPS-K14x
Measurements and Result Displays
Result Summary
By default, the R&S FPS evaluates the results over all captured frames, bandwidth
parts, subframes and slots. For most results, the result summary therefore contains a
mean (average), maximum and minimum value.
Limit check
The R&S FPS also tests several results against limits, if 3GPP has defined limits for a
result. Limits are only evaluated if the signal complies to the 3GPP specification
regarding the number of analyzed frames and the results are averaged over all frames.
Depending on the limit test, the results are highlighted.
●
If one of the results passes the limit, the value is highlighted green.
●
If one of the results violates the limit, the value is highlighted red.
●
Results that are not evaluated are not highlighted in a color.
For some results you can define custom limits. For more information, see Chapter 3.9,
"Reference: Custom Limits", on page 48.
You can check if a result supports limit evaluation in the result descriptions below. The
result descriptions also indicate special behavior of the limit check.
Evaluation range and multiple frame analysis
The evaluation range selects the way the results are evaluated and which values are
displayed.
For the frame statistics, the evaluation range is irrelevant. However, you can select a
specific frame that you want to analyze.
●
Select "Frame Averaged" in the result summary header to display the average
result over all analyzed frames. The average results relate to all frames, not just
those in the capture buffer.
The table also shows the minimum and maximum values over the analyzed
frames.
●
Select "Selected Frame" in the result summary header to display the results for a
single frame.
If you analyze a single frame, the mean, minimum and maximum values are the
same.
16User Manual 1179.1206.02 ─ 02

R&S®FPS-K14x
Measurements and Result Displays
Result Summary
For the slot statistics and subframe statistics, the effects of the evaluation range are
as follows.
●
Select "Frame Averaged" in the result summary header to display the average
results over all analyzed slots in all analyzed frames. The average results relate to
all frames, not just those in the capture buffer. The table also shows the minimum
and maximum values found in the analyzed frames.
When you select a specific BWP, subframe or slot while in "Frame Averaged"
mode, the R&S FPS automatically selects "Selected Frame" mode.
●
Select "Selected Frame" in the result summary header to display the results over
all analyzed slots in a single frame. The analyzed frame depends on the frame you
have selected. In this case, you can filter the evaluation range as you like.
Examples:
– If you select a specific BWP: the R&S FPS takes the average over all slots in
the selected BWP.
– If you select a specific subframe: the R&S FPS takes the average over all slots
in the selected subframe.
– If you select a specific slot: the R&S FPS shows the result for that slot.
Note that selecting a specific slot for the subframe results (frequency and sampling error) will not make a difference, because those results are always calculated over a complete subframe.
The current evaluation range is indicated in the header row of the slot statistics.
Multiple carrier analysis
For measurements on multiple carriers, the contents of the result summary depend on
your configuration, especially the CC result setting.
●
Select "CC Result" = "All" to display information about all component carriers,
regardless of the number of component carriers.
– The "All" tab shows the average results for all component carriers. Each col-
umn in the table corresponds to one component carrier.
– The "View <x>" tabs show the detailed results for the component carriers
assigned to the two views.
●
Select "CC Result" = "Viewed" to display information about the component carriers
assigned to the two views.
– The "All" tab shows the average results for the two selected component carri-
ers. Depending on your selection in the result summary header, the results are
either averaged over all frames, or relate to a single frame.
– The "View <x>" tabs show the detailed results for the component carriers
assigned to the two views. Depending on your selection in the result summary
header, the results are either averaged over all frames, or relate to a single,
selected frame.
If you analyze only one frame, the results are the same in both cases.
Note that analyzing all component carriers is slower compared analyzing the viewed
component carriers, because of the post-processing that occurs during the analysis.
17User Manual 1179.1206.02 ─ 02

R&S®FPS-K14x
Measurements and Result Displays
Result Summary
Thus, if time is an issue, you can select two component carriers to analyze, and, if you
are later interested in the characteristics of another component carrier, analyze that
component carrier later (the data of the other carriers is available, just not analyzed).
Units
Most of the units of the results are fixed.
The unit of the EVM results depends on the selected EVM unit.
EVM PDSCH.................................................................................................................18
Frame Start Offset.........................................................................................................19
EVM All......................................................................................................................... 19
EVM Peak..................................................................................................................... 19
EVM Phys Channel.......................................................................................................19
EVM Phys Signal.......................................................................................................... 19
Frequency Error............................................................................................................ 19
Sampling Error.............................................................................................................. 20
Power............................................................................................................................20
I/Q Offset.......................................................................................................................20
I/Q Gain Imbalance....................................................................................................... 20
I/Q Quadrature Error..................................................................................................... 20
Crest Factor.................................................................................................................. 20
OSTP............................................................................................................................ 21
RSTP.............................................................................................................................21
RSRP............................................................................................................................ 21
EVM PDSCH
Shows the EVM for all PDSCH resource elements with a certain modulation in the analyzed frame (QPSK, 16QAM, 64QAM, 256QAM).
Limit evaluation supported.
Remote command:
QPSK: FETCh[:CC<cc>][:ISRC<ant>][:FRAMe<fr>]:SUMMary:EVM:DSQP[:
AVERage]? on page 187
16QAM: FETCh[:CC<cc>][:ISRC<ant>][:FRAMe<fr>]:SUMMary:EVM:DSST[:
AVERage]? on page 188
64QAM: FETCh[:CC<cc>][:ISRC<ant>][:FRAMe<fr>]:SUMMary:EVM:DSSF[:
AVERage]? on page 187
256QAM: FETCh[:CC<cc>][:ISRC<ant>][:FRAMe<fr>]:SUMMary:EVM:
DSTS[:AVERage]? on page 188
Limit check QPSK: CALCulate<n>:LIMit<li>[:CC<cc>][:ISRC<ant>][:
FRAMe<fr>]:SUMMary:EVM:DSQP[:AVERage]:RESult? on page 200
Limit check 16QAM: CALCulate<n>:LIMit<li>[:CC<cc>][:ISRC<ant>][:
FRAMe<fr>]:SUMMary:EVM:DSST[:AVERage]:RESult? on page 202
Limit check 64QAM: CALCulate<n>:LIMit<li>[:CC<cc>][:ISRC<ant>][:
FRAMe<fr>]:SUMMary:EVM:DSSF[:AVERage]:RESult? on page 201
Limit check 256QAM: CALCulate<n>:LIMit<li>[:CC<cc>][:ISRC<ant>][:
FRAMe<fr>]:SUMMary:EVM:DSTS[:AVERage]:RESult? on page 202
18User Manual 1179.1206.02 ─ 02

R&S®FPS-K14x
Measurements and Result Displays
Result Summary
Frame Start Offset
Shows the start of the frame relative to the start of the capture buffer.
Unavailable for "Frame Averaged" results, otherwise refers to the selected frame.
Remote command:
FETCh[:CC<cc>][:ISRC<ant>]:SUMMary:TFRame? on page 194
EVM All
Shows the EVM for all resource elements in the selected evaluation range.
Remote command:
FETCh[:CC<cc>][:ISRC<ant>][:FRAMe<fr>]:SUMMary:EVM[:ALL][:
AVERage]? on page 186
EVM Peak
Shows the EVM of the resource element with the highest EVM value in the selected
evaluation range.
Remote command:
FETCh[:CC<cc>][:ISRC<ant>][:FRAMe<fr>]:SUMMary:EVM:PEAK[:
AVERage]? on page 189
EVM Phys Channel
Shows the EVM for all physical channel resource elements in the selected evaluation
range.
A physical channel corresponds to a set of resource elements carrying information
from higher layers. PDSCH, PUSCH, PBCH or PDCCH, for example, are physical
channels.
Remote command:
FETCh[:CC<cc>][:ISRC<ant>][:FRAMe<fr>]:SUMMary:EVM:PCHannel[:
AVERage]? on page 189
EVM Phys Signal
Shows the EVM for all physical signal resource elements in the selected evaluation
range.
The reference signal is a physical signal, for example.
Frequency Error
Shows the difference in the measured center frequency and the reference center frequency.
The frequency error is calculated over a subframe.
Limit evaluation supported. Limits are evaluated if you turn on the limit check.
The R&S FPS checks the measured frequency error against the limits defined by
3GPP. The values are highlighted green (pass) or red (fail) respectively. The color of
the mean value indicates the overall limit check passes or fails. Note that if you evaluate a single subframe only, the minimum, maximum and mean values are the same.
The limit values depend on the base station category.
19User Manual 1179.1206.02 ─ 02

R&S®FPS-K14x
Measurements and Result Displays
Result Summary
Remote command:
Result: FETCh[:CC<cc>][:ISRC<ant>][:FRAMe<fr>]:SUMMary:FERRor[:
AVERage]? on page 190
Limit check: CALCulate<n>:LIMit<li>[:CC<cc>][:ISRC<ant>][:
FRAMe<fr>]:SUMMary:EVM:FERRor[:AVERage]:RESult? on page 203
Sampling Error
Shows the difference in measured symbol clock and reference symbol clock relative to
the system sampling rate.
The sampling error is calculated over a subframe.
Remote command:
FETCh[:CC<cc>][:ISRC<ant>][:FRAMe<fr>]:SUMMary:SERRor[:AVERage]?
on page 194
Power
Shows the average time domain power for all resource elements in the selected evaluation range.
Remote command:
FETCh[:CC<cc>][:ISRC<ant>][:FRAMe<fr>]:SUMMary:POWer[:AVERage]?
on page 192
I/Q Offset
Shows the power at spectral line 0 normalized to the total transmitted power.
Not available for multiple BWPs.
Remote command:
FETCh[:CC<cc>][:ISRC<ant>][:FRAMe<fr>]:SUMMary:IQOFfset[:
AVERage]? on page 191
I/Q Gain Imbalance
Shows the logarithm of the gain ratio between the Q-channel and the I-channel.
Not available for multiple BWPs and only calculated if you turn on the calculation.
Remote command:
FETCh[:CC<cc>][:ISRC<ant>][:FRAMe<fr>]:SUMMary:GIMBalance[:
AVERage]? on page 191
I/Q Quadrature Error
Shows the measure of the phase angle between Q-channel and I-channel deviating
from the ideal 90 degrees.
Not available for multiple BWPs and only calculated if you turn on the calculation.
Crest Factor
Shows the peak-to-average power ratio of the captured signal.
Remote command:
FETCh[:CC<cc>][:ISRC<ant>]:SUMMary:CRESt[:AVERage]? on page 186
20User Manual 1179.1206.02 ─ 02

R&S®FPS-K14x
Measurements and Result Displays
I/Q Measurements
OSTP
Shows the OFDM symbol transmit power.
The result is the average power of all OFDM symbols that carry PDSCH and not con-
taining PDCCH, RS or SSB within a slot.
Not available for multiple BWPs.
Remote command:
FETCh[:CC<cc>][:ISRC<ant>][:FRAMe<fr>]:SUMMary:OSTP[:AVERage]?
on page 192
RSTP
Shows the reference signal transmit power.
The result is an average over all PDSCH DMRS within a frame. For the calculation, the
R&S FPS first averages all DMRS in each slot, and then averages this value over all
slots in a frame.
Remote command:
FETCh[:CC<cc>][:ISRC<ant>][:FRAMe<fr>]:SUMMary:RSTP[:AVERage]?
on page 194
RSRP
Shows the reference signal receive power for the CSI reference signal (CSI-RSRP)
and the second synchonization reference signal (SS-RSRP) as defined in 3GPP
38.215.
It is an average power over all resource elements that carry the CSI or SS reference
signal.
Remote command:
CSI-RSRP: FETCh[:CC<cc>][:ISRC<ant>][:FRAMe<fr>]:SUMMary:RSRP:
CSI[:AVERage]? on page 193
SS-RSRP: FETCh[:CC<cc>][:ISRC<ant>][:FRAMe<fr>]:SUMMary:RSRP:
SS[:AVERage]? on page 193
3.6 I/Q Measurements
Access: [MEAS] > "EVM/Frequency Err/Power"
For I/Q measurements, the R&S FPS captures and then analyzes the demodulated I/Q
data. I/Q measurements provide various result displays that show different aspects and
characteristics of the captured signal.
You can select the result displays from the evaluation bar and arrange them as you like
with the SmartGrid functionality.
Remote command:
Measurement selection: CONFigure[:NR5G]:MEASurement on page 233
Result display selection: LAYout:ADD[:WINDow]? on page 174
21User Manual 1179.1206.02 ─ 02

R&S®FPS-K14x
Measurements and Result Displays
I/Q Measurements
Capture Buffer...............................................................................................................22
EVM vs Carrier..............................................................................................................23
EVM vs Symbol.............................................................................................................24
EVM vs RB....................................................................................................................24
Frequency Error vs Symbol...........................................................................................25
Frequency Error vs Subframe.......................................................................................26
Power Spectrum............................................................................................................27
Flatness.........................................................................................................................27
CCDF............................................................................................................................ 28
Constellation Diagram...................................................................................................29
Allocation Summary...................................................................................................... 29
Channel Decoder Results............................................................................................. 30
Bitstream.......................................................................................................................31
EVM vs Symbol x Carrier..............................................................................................32
Power vs Symbol x Carrier............................................................................................33
Allocation ID vs Symbol x Carrier..................................................................................33
RS Magnitude............................................................................................................... 33
RS Phase......................................................................................................................34
RS Phase Difference.....................................................................................................35
Beamforming Summary................................................................................................ 36
Marker Table ................................................................................................................ 36
Capture Buffer
The "Capture Buffer" shows the complete range of captured data for the last data capture.
The x-axis represents time. The maximum value of the x-axis is equal to the Capture
Time.
The y-axis represents the amplitude of the captured I/Q data in dBm (for RF input).
Figure 3-1: Capture buffer without zoom
A green bar at the bottom of the diagram represents the frame that is currently analyzed.
A green vertical line at the beginning of the green bar in the capture buffer represents
the frame start. The diagram also contains the "Start Offset" value. This value is the
time difference between the frame start and capture buffer start.
The header of the "Capture Buffer" result display contains an "I/Q Export" button that
allows you to export I/Q data easily.
22User Manual 1179.1206.02 ─ 02

R&S®FPS-K14x
Measurements and Result Displays
I/Q Measurements
Remote command:
Selection: LAY:ADD ? '1',LEFT,CBUF
Query (y-axis): TRACe:DATA?
Query (x-axis): TRACe<n>[:DATA]:X? on page 231
Frame start offset: FETCh[:CC<cc>][:ISRC<ant>]:SUMMary:TFRame?
on page 194
EVM vs Carrier
The "EVM vs Carrier" result display shows the error vector magnitude (EVM) of the
subcarriers. With the help of a marker, you can use it as a debugging technique to
identify any subcarriers whose EVM is too high.
The results are based on an average EVM that is calculated over the resource elements for each subcarrier. This average subcarrier EVM is determined for each analyzed slot in the capture buffer.
The contents of the result display depend on the evaluation range.
●
If you analyze all synchronization signals (SS) and bandwidth parts (BWP), the
result display contains one trace for the synchronization signal and a variable number of traces that represent the bandwidth parts. The traces show the average
EVM of the corresponding signal part. The diagram header contains a legend that
shows the information that each trace carries.
●
If you analyze only the synchronization signal, one specific bandwidth part, or a
single subframe, the diagram contains three traces. The traces show the following
information.
– The average subcarrier EVM over all slots in the selected signal part.
– The lowest subcarrier EVM over all slots in the selected signal part.
– The highest subcarrier EVM over all slots in the selected signal part.
●
If you analyze only a single slot, the diagram contains one trace. That trace shows
the subcarrier EVM for that slot only. Average, minimum and maximum values in
that case are the same.
The x-axis represents the center frequencies of the subcarriers. The y-axis shows the
EVM in % or in dB, depending on the EVM Unit.
Remote command:
Selection LAY:ADD ? '1',LEFT,EVCA
Query (y-axis): TRACe:DATA?
Query (x-axis): TRACe<n>[:DATA]:X? on page 231
23User Manual 1179.1206.02 ─ 02

R&S®FPS-K14x
Measurements and Result Displays
I/Q Measurements
EVM vs Symbol
The "EVM vs Symbol" result display shows the error vector magnitude (EVM) of the
OFDM symbols. You can use it as a debugging technique to identify any symbols
whose EVM is too high.
The results are based on an average EVM that is calculated over the resource elements for each subcarrier. This average subcarrier EVM is determined for each analyzed slot in the capture buffer.
The contents of the result display depend on the evaluation range.
●
If you analyze all synchronization signals (SS) and bandwidth parts (BWP), the
result display contains one trace for the synchronization signal and a variable number of traces that represent the bandwidth parts. The diagram header contains a
legend that shows the information that each trace carries.
●
If you analyze only the synchronization signal, one specific bandwidth part, a single
subframe or a single slot, the diagram contains one trace. That trace shows the
average EVM of the symbols in the selected signal part.
The x-axis represents the OFDM symbols, with each symbol represented by a dot on
the line. Any missing connections from one dot to another mean that the R&S FPS
could not determine the EVM for that symbol.
On the y-axis, the EVM is plotted either in % or in dB, depending on the EVM Unit.
Remote command:
Selection: LAY:ADD ? '1',LEFT,EVSY
Query (y-axis): TRACe:DATA?
Query (x-axis): TRACe<n>[:DATA]:X? on page 231
EVM vs RB
The "EVM vs RB" result display shows the Error Vector Magnitude (EVM) for all
resource blocks that can be occupied by the PDSCH.
The contents of the result display depend on the evaluation range.
●
If you analyze all synchronization signals (SS) and bandwidth parts (BWP), the
result display contains one trace for the synchronization signal and a variable number of traces that represent the bandwidth parts. The traces show the average
EVM of the corresponding signal part. The diagram header contains a legend that
shows the information that each trace carries.
●
If you analyze only the synchronization signal, one specific bandwidth part, or a
single subframe, the diagram contains three traces. The traces show the following
information.
– The average subcarrier EVM over all slots in the selected signal part.
– The lowest subcarrier EVM over all slots in the selected signal part.
24User Manual 1179.1206.02 ─ 02

R&S®FPS-K14x
Measurements and Result Displays
I/Q Measurements
– The highest subcarrier EVM over all slots in the selected signal part.
●
If you analyze only a single slot, the diagram contains one trace. That trace shows
the subcarrier EVM for that slot only. Average, minimum and maximum values in
that case are the same.
If you select and analyze one subframe only, the result display contains one trace that
shows the resource block EVM for that subframe only. Average, minimum and maximum values in that case are the same. For more information, see "Subframe Selec-
tion" on page 159.
The x-axis represents the PDSCH resource blocks. On the y-axis, the EVM is plotted
either in % or in dB, depending on the EVM Unit.
Remote command:
Selection: LAY:ADD ? '1',LEFT,EVRP
Query (y-axis): TRACe:DATA?
Query (x-axis): TRACe<n>[:DATA]:X? on page 231
Frequency Error vs Symbol
Th e "Frequency Error vs Symbol" result display shows the frequency error of each
symbol. You can use it as a debugging technique to identify any frequency errors within
symbols.
The result is an average over all subcarriers in the symbol.
The contents of the result display depend on the evaluation range.
●
If you analyze all synchronization signals (SS) and bandwidth parts (BWP), the
result display contains one trace for the synchronization signal and a variable number of traces that represent the bandwidth parts. The diagram header contains a
legend that shows the information that each trace carries.
●
If you analyze only the synchronization signal, one specific bandwidth part, a single
subframe or a single slot, the diagram contains one trace. That trace shows the
average frequency error of the symbols in the selected signal part.
The x-axis represents the OFDM symbols, with each symbol represented by a dot on
the line. The number of displayed symbols depends on the subframe selection. Any
missing connections from one dot to another mean that the R&S FPS could not determine the frequency error for that symbol.
On the y-axis, the frequency error is plotted in Hz.
Note that the variance of the measurement results in this result display can be much
higher compared to the frequency error display in the numerical result summary,
depending on the PDSCH and control channel configuration. The potential difference is
caused by the number of available resource elements for the measurement on symbol
level.
25User Manual 1179.1206.02 ─ 02

R&S®FPS-K14x
Measurements and Result Displays
I/Q Measurements
Remote command:
Selection: LAY:ADD ? '1',LEFT,FEVS
Query (y-axis): TRACe:DATA?
Query (x-axis): TRACe<n>[:DATA]:X? on page 231
Frequency Error vs Subframe
The "Frequency Error vs Subframe" result display shows the frequency error of each
subframe. You can use it as a debugging technique to identify any frequency errors
among subframes.
The result is an average over all subcarriers and symbols of each subframe.
The contents of the result display depend on the evaluation range.
●
If you analyze all synchronization signals (SS) and bandwidth parts (BWP), the
result display contains one trace for the synchronization signal and a variable number of traces that represent the bandwidth parts. The diagram header contains a
legend that shows the information that each trace carries.
●
If you analyze only the synchronization signal or one specific bandwidth part, the
diagram contains one trace. That trace shows the average frequency error of the
subframes in the selected signal part. Selecting a specific subframe or slot from the
evaluation range has no effects on the contents of the diagram.
The x-axis represents the subframes, with each of the nine subframes represented by
a dot on the line.
On the y-axis, the frequency error is plotted in Hz.
Remote command:
Selection: LAY:ADD ? '1',LEFT,FEVS
Query (y-axis): TRACe:DATA?
Query (x-axis): TRACe<n>[:DATA]:X? on page 231
26User Manual 1179.1206.02 ─ 02

R&S®FPS-K14x
Measurements and Result Displays
I/Q Measurements
Power Spectrum
The "Power Spectrum" shows the power density of the complete capture buffer in
dBm/Hz.
The displayed bandwidth depends on the channel bandwidth.
The x-axis represents the frequency. On the y-axis, the power level is plotted.
Remote command:
Selection: LAY:ADD ? '1',LEFT,PSPE
Query (y-axis): TRACe:DATA?
Query (x-axis): TRACe<n>[:DATA]:X? on page 231
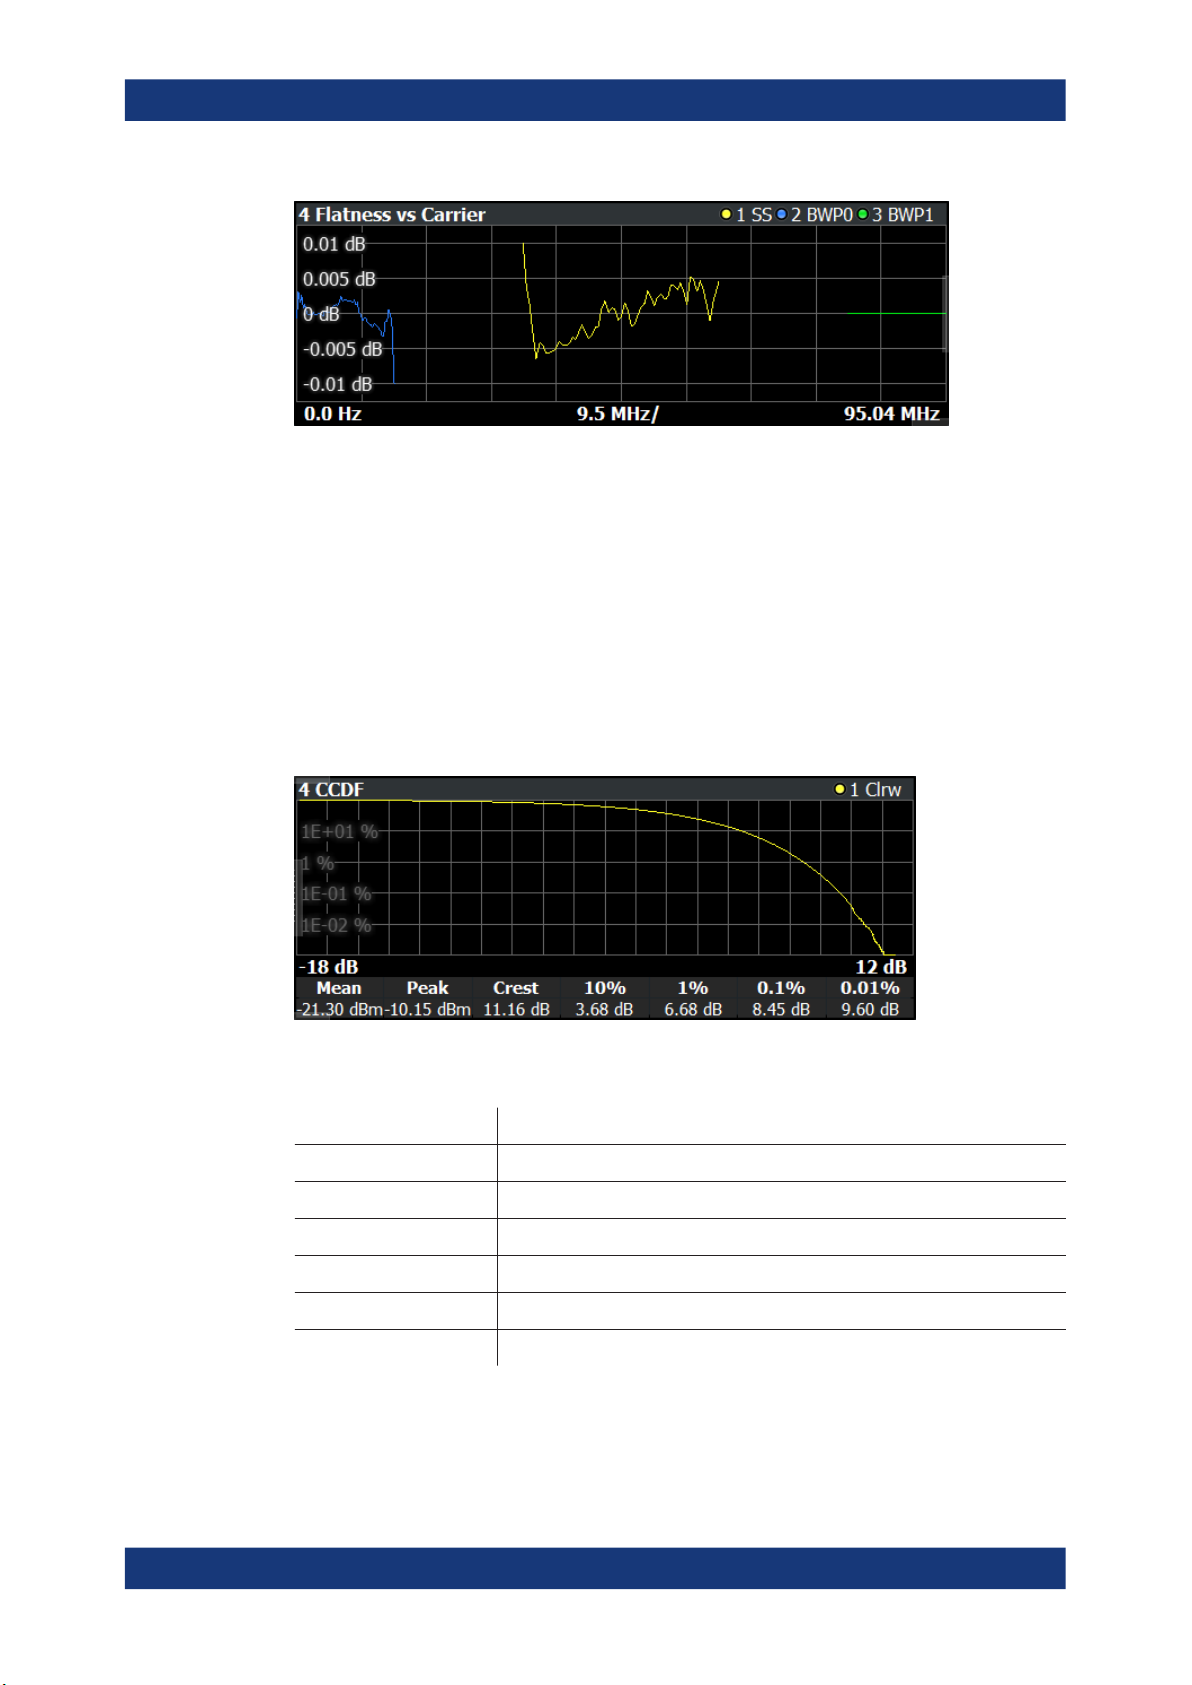
Flatness
The "Channel Flatness" result shows the relative power offset caused by the transmit
channel for each subcarrier.
The contents of the result display depend on the evaluation range.
●
If you analyze all synchronization signals (SS) and bandwidth parts (BWP), the
result display contains one trace for the synchronization signal and a variable number of traces that represent the bandwidth parts. The traces show the average flatness of the corresponding signal part. The diagram header contains a legend that
shows the information that each trace carries.
●
If you analyze only the synchronization signal, one specific bandwidth part, a specific frame or a single subframe, the diagram contains three traces. The traces
show the following information.
– The average subcarrier flatness over all slots in the selected signal part.
– The lowest subcarrier flatness over all slots in the selected signal part.
– The highest subcarrier flatness over all slots in the selected signal part.
●
If you analyze only a single slot, the diagram contains one trace. That trace shows
the subcarrier flatness for that slot only. Average, minimum and maximum values in
that case are the same.
The x-axis represents the frequency. On the y-axis, the channel flatness is plotted in
dB.
27User Manual 1179.1206.02 ─ 02
R&S®FPS-K14x
Measurements and Result Displays
I/Q Measurements
Remote command:
Selecting the result display: LAY:ADD ? '1',LEFT,FLAT
Querying results:
TRACe:DATA?
TRACe<n>[:DATA]:X? on page 231
CCDF
The "Complementary Cumulative Distribution Function (CCDF)" shows the probability
of an amplitude exceeding the mean power. For the measurement, the complete capture buffer is used.
The x-axis represents the power relative to the measured mean power. On the y-axis,
the probability is plotted in %.
In addition to the diagram, the results for the CCDF measurement are summarized in
the CCDF table.
Mean Mean power
Peak Peak power
Crest Crest factor (peak power – mean power)
10 % 10 % probability that the level exceeds mean power + [x] dB
1 % 1 % probability that the level exceeds mean power + [x] dB
0.1 % 0.1 % probability that the level exceeds mean power + [x] dB
0.01 % 0.01 % probability that the level exceeds mean power + [x] dB
Remote command:
Selection: LAY:ADD ? '1',LEFT,CCDF
Query (y-axis): TRACe:DATA?
28User Manual 1179.1206.02 ─ 02

R&S®FPS-K14x
Measurements and Result Displays
I/Q Measurements
Numerical results: CALCulate<n>:STATistics:CCDF:X<t>? on page 199
Numerical results: CALCulate<n>:STATistics:RESult<res>? on page 199
Constellation Diagram
The "Constellation Diagram" shows the in-phase and quadrature phase results and is
an indicator of the quality of the modulation of the signal.
In the default state, the result display evaluates the full range of the measured input
data.
Each color represents a modulation type.
●
●
●
●
●
You can filter the results by changing the evaluation range.
: RBPSK
: QPSK
: 16QAM
: 64QAM
: 256QAM
The constellation diagram shows the number of points that are displayed in the diagram.
Remote command:
Selection: LAY:ADD ? '1',LEFT,CONS
Query: TRACe:DATA?
Allocation Summary
The "Allocation Summary" shows various parameters of the measured allocations in a
table.
Each row in the allocation table corresponds to an allocation. A set of several allocations make up a slot. A horizontal line indicates the beginning of a new slot. Special
allocations summarize the characteristics of all allocations in a bandwidth part ("BWP
ALL") and the radio frame ("TOTAL ALL").
29User Manual 1179.1206.02 ─ 02

R&S®FPS-K14x
Measurements and Result Displays
I/Q Measurements
The columns of the table show the following properties for each allocation.
●
The location of the allocation (slot, subframe, bandwidth part number).
●
The ID of the allocation (channel type).
●
Number of resource blocks used by the allocation.
●
The relative power of the allocation in dB.
●
The modulation of the allocation.
●
The power of each resource element in the allocation in dBm.
●
The EVM of the allocation.
The unit depends on the EVM unit
Select "TableConfig" to open a dialog box that allows you to add and remove columns.
Remote command:
Selection: LAY:ADD ? '1',LEFT,ASUM
Query: TRACe:DATA?
Channel Decoder Results
The "Channel Decoder" result display shows the characteristics of various channels in
a specific subframe.
The size of the table thus depends on the number of subframes and the number of
channels that were decoded.
The R&S FPS can decode the following channels, if they are present.
●
Protocol information of the PBCH.
For each channel type, the table contains a different set of values.
●
PBCH
Information as defined in 3GPP 38.331, for example:
– The half frame index
– The system frame number
30User Manual 1179.1206.02 ─ 02
 Loading...