

Rohde&Schwarz R&S®ESW-K58 Multi CISPR APD User Manual

R&S®ESW-K58
Multi CISPR APD
User Manual
(;Ý8Þ2)
1179088002
Version 03

This manual describes the following R&S®ESW models:
●
R&S®ESW8 (1328.4100K08)
●
R&S®ESW8 (1328.4100K09)
●
R&S®ESW26 (1328.4100K26)
●
R&S®ESW26 (1328.4100K27)
●
R&S®ESW44 (1328.4100K44)
●
R&S®ESW44 (1328.4100K45)
The contents of this manual correspond to firmware version 2.20 and higher.
© 2022 Rohde & Schwarz GmbH & Co. KG
Muehldorfstr. 15, 81671 Muenchen, Germany
Phone: +49 89 41 29 - 0
Email: info@rohde-schwarz.com
Internet: www.rohde-schwarz.com
Subject to change – data without tolerance limits is not binding.
R&S® is a registered trademark of Rohde & Schwarz GmbH & Co. KG.
Trade names are trademarks of the owners.
1179.0880.02 | Version 03 | R&S®ESW-K58
Throughout this manual, products from Rohde & Schwarz are indicated without the ® symbol , e.g. R&S®ESW is indicated as
R&S ESW.

R&S®ESW-K58
1 Preface.................................................................................................... 5
1.1 About this manual.........................................................................................................5
1.2 Documentation overview..............................................................................................5
1.3 Conventions used in the documentation....................................................................7
2 Welcome to the Multi CISPR APD application.....................................9
2.1 Starting multi CISPR APD measurements.................................................................. 9
2.2 Understanding the display information.................................................................... 10
3 Measurements and result displays.................................................... 13
4 Measurement basics............................................................................16
Contents
Contents
5 Configuration........................................................................................17
5.1 Configuration overview.............................................................................................. 17
5.2 Data input and output................................................................................................. 18
5.3 Amplitude.....................................................................................................................23
5.4 Frequency.................................................................................................................... 29
5.5 Trigger..........................................................................................................................31
5.6 Measurement settings................................................................................................ 33
5.7 Evaluation table...........................................................................................................36
5.8 Display configuration................................................................................................. 37
5.9 Sweep settings............................................................................................................ 37
5.10 Transducer...................................................................................................................38
6 Analysis................................................................................................ 39
6.1 Trace / data export configuration.............................................................................. 39
6.2 Marker settings............................................................................................................40
6.3 APD display configuration......................................................................................... 41
6.4 Scaling......................................................................................................................... 41
6.5 Test reports..................................................................................................................43
7 How to run a Multi CISPR APD measurement................................... 44
8 Remote commands for Multi CISPR APD measurements................46
8.1 Introduction................................................................................................................. 46
3User Manual 1179.0880.02 ─ 03

R&S®ESW-K58
8.2 Common suffixes........................................................................................................ 51
8.3 Application selection.................................................................................................. 51
8.4 Result display configuration......................................................................................55
8.5 Configuration...............................................................................................................70
8.6 Analysis....................................................................................................................... 89
Contents
List of commands................................................................................ 98
Index....................................................................................................101
4User Manual 1179.0880.02 ─ 03

R&S®ESW-K58
1 Preface
1.1 About this manual
Preface
Documentation overview
This Multi CISPR APD User Manual provides all the information specific to the appli-
cation. All general instrument functions and settings common to all applications and
operating modes are described in the main R&S ESW User Manual.
The main focus in this manual is on the measurement results and the tasks required to
obtain them. The following topics are included:
●
Welcome to the Multi CISPR APD Application
Introduction to and getting familiar with the application
●
Measurements and Result Displays
Details on supported measurements and their result types
●
Measurement Basics
Background information on basic terms and principles in the context of the measurement
●
Configuration + Analysis
A concise description of all functions and settings available to configure measurements and analyze results with their corresponding remote control command
●
Measurement Examples
Detailed measurement examples to guide you through typical measurement scenarios and allow you to try out the application immediately
●
Remote Commands for Multi CISPR APD Measurements
Remote commands required to configure and perform Multi CISPR APD measurements in a remote environment, sorted by tasks
(Commands required to set up the environment or to perform common tasks on the
instrument are provided in the main R&S ESW User Manual)
Programming examples demonstrate the use of many commands and can usually
be executed directly for test purposes
●
List of remote commands
Alphabetical list of all remote commands described in the manual
●
Index
1.2 Documentation overview
This section provides an overview of the R&S ESW user documentation. You find it on
the product page at:
www.rohde-schwarz.com/manual/esw
5User Manual 1179.0880.02 ─ 03

R&S®ESW-K58
1.2.1 Getting started manual
1.2.2 User manuals and help
Preface
Documentation overview
Introduces the R&S ESW and describes how to set up and start working with the product. Includes basic operations, typical measurement examples, and general information, e.g. safety instructions, etc.
A printed version is delivered with the instrument. A PDF version is available for download on the Internet.
Separate user manuals are provided for the base unit and the firmware applications:
●
Base unit manual
Contains the description of all instrument modes and functions. It also provides an
introduction to remote control, a complete description of the remote control commands with programming examples, and information on maintenance, instrument
interfaces and error messages. Includes the contents of the getting started manual.
●
Manuals for (optional) firmware applications
Contains the description of the specific functions of a firmware application, including remote control commands. Basic information on operating the R&S ESW is not
included.
The contents of the user manuals are available as help in the R&S ESW. The help
offers quick, context-sensitive access to the complete information for the base unit and
the firmware applications.
All user manuals are also available for download or for immediate display on the Internet.
1.2.3 Service manual
Describes the performance test for checking the rated specifications, module replacement and repair, firmware update, troubleshooting and fault elimination, and contains
mechanical drawings and spare part lists.
The service manual is available for download for registered users on the global
Rohde & Schwarz information system (GLORIS):
https://gloris.rohde-schwarz.com
1.2.4 Instrument security procedures
Deals with security issues when working with the R&S ESW in secure areas. It is available for download on the Internet.
6User Manual 1179.0880.02 ─ 03

R&S®ESW-K58
1.2.5 Basic safety instructions
1.2.6 Data sheets and brochures
1.2.7 Release notes and open source acknowledgment (OSA)
Preface
Conventions used in the documentation
Contains safety instructions, operating conditions and further important information.
The printed document is delivered with the instrument.
The data sheet contains the technical specifications of the R&S ESW. It also lists the
options and their order numbers, and optional accessories.
The brochure provides an overview of the instrument and deals with the specific characteristics.
See www.rohde-schwarz.com/brochure-datasheet/esw
The release notes list new features, improvements and known issues of the current
firmware version, and describe the firmware installation.
The open source acknowledgment document provides verbatim license texts of the
used open source software.
See www.rohde-schwarz.com/firmware/esw
1.2.8 Application notes, application cards, white papers, etc.
These documents deal with special applications or background information on particular topics.
See www.rohde-schwarz.com/application/esw
1.3 Conventions used in the documentation
1.3.1 Typographical conventions
The following text markers are used throughout this documentation:
Convention Description
"Graphical user interface elements"
[Keys] Key and knob names are enclosed by square brackets.
All names of graphical user interface elements on the screen, such as
dialog boxes, menus, options, buttons, and softkeys are enclosed by
quotation marks.
7User Manual 1179.0880.02 ─ 03

R&S®ESW-K58
Preface
Conventions used in the documentation
Convention Description
Filenames, commands,
program code
Input Input to be entered by the user is displayed in italics.
Links Links that you can click are displayed in blue font.
"References" References to other parts of the documentation are enclosed by quota-
Filenames, commands, coding samples and screen output are distinguished by their font.
tion marks.
1.3.2 Conventions for procedure descriptions
When operating the instrument, several alternative methods may be available to perform the same task. In this case, the procedure using the touchscreen is described.
Any elements that can be activated by touching can also be clicked using an additionally connected mouse. The alternative procedure using the keys on the instrument or
the on-screen keyboard is only described if it deviates from the standard operating procedures.
The term "select" may refer to any of the described methods, i.e. using a finger on the
touchscreen, a mouse pointer in the display, or a key on the instrument or on a keyboard.
1.3.3 Notes on screenshots
When describing the functions of the product, we use sample screenshots. These
screenshots are meant to illustrate as many as possible of the provided functions and
possible interdependencies between parameters. The shown values may not represent
realistic usage scenarios.
The screenshots usually show a fully equipped product, that is: with all options installed. Thus, some functions shown in the screenshots may not be available in your particular product configuration.
8User Manual 1179.0880.02 ─ 03

R&S®ESW-K58
2 Welcome to the Multi CISPR APD applica-
Welcome to the Multi CISPR APD application
Starting multi CISPR APD measurements
tion
The R&S ESW-K58 Multi CISPR APD application provides functionality to perform
CISPR APD measurements on multiple frequencies in parallel with the R&S ESW.
The application allows fast interference signal analysis at up to 67 frequencies simultaneously. It meets all requirements of CISPR 16-1-1 for measuring receivers with amplitude probability distribution (APD) measurement function.
The Multi CISPR APD application covers the complete frequency range of CISPR 11
Ed.6.2. All frequencies that are specified in CISPR 11 Ed.6.2 can be measured in parallel in just one sweep.
The application features Multi CISPR APD measurements with various result displays:
●
CISPR APD at Tuned Frequency
●
Multi APD
●
Result Summary
This user manual contains a description of the functionality that the application provides, including remote control operation.
All functions not discussed in this manual are the same as in the base unit and are
described in the R&S ESW user manual. The latest version is available for download at
the product homepage http://www.rohde-schwarz.com/product/esw.
Installation
You can find detailed installation instructions in the R&S ESW getting started manual or
in the release notes.
2.1 Starting multi CISPR APD measurements
Multi CISPR APD measurements is a separate application on the R&S ESW.
To activate Multi CISPR APD measurements
1. Select the [MODE] key.
A dialog box opens that contains all operating modes and applications currently
available on your R&S ESW.
2. Select the "Multi CISPR APD" item.
The R&S ESW opens a new channel for the application.
9User Manual 1179.0880.02 ─ 03

R&S®ESW-K58
Welcome to the Multi CISPR APD application
Understanding the display information
The measurement is started immediately with the default settings. It can be configured
in the Multi CISPR APD Configuration overview dialog box, which is displayed when
you select the "Overview" softkey from any menu.
Multiple Channels and Sequencer Function
When you activate an application, a new channel is created which determines the
measurement settings for that application ("Channel"). The same application can be
activated with different measurement settings by creating several "Channel"s for the
same application.
The number of channels that can be configured at the same time depends on the available memory on the instrument.
Only one measurement can be performed at any time, namely the one in the currently
active channel. However, in order to perform the configured measurements consecutively, a Sequencer function is provided.
If activated, the measurements configured in the currently defined "Channel"s are performed one after the other in the order of the tabs. The currently active measurement is
indicated by a
symbol in the tab label.
The result displays of the individual channels are updated in the tabs (as well as the
"MultiView") as the measurements are performed. Sequential operation itself is independent of the currently displayed tab.
For details on the Sequencer function see the R&S ESW user manual.
2.2 Understanding the display information
The following figure shows a measurement diagram during Multi CISPR APD measurements. All different information areas are labeled. They are explained in more detail in
the following sections.
10User Manual 1179.0880.02 ─ 03

R&S®ESW-K58
Welcome to the Multi CISPR APD application
Understanding the display information
1 = Channel bar for firmware and measurement settings
2+3 = Window title bar with diagram-specific (trace) information
4 = Diagram area
5 = Diagram footer with diagram-specific information, depending on result display
6 = Instrument status bar with error messages and date/time display
Channel bar information
In the Multi CISPR APD application, the R&S ESW shows the following settings:
Table 2-1: Information displayed in the channel bar in the application for Multi CISPR APD measure-
Ref Level Reference level
Att RF attenuation applied to input
Input Input toggle state
ABW Analysis bandwidth
AQT Measurement time for data acquisition.
PS Current state of the preselector.
Tuned Frequency Frequency of the current measurement results
Limits PASS or FAIL of defined limits.
SGL Indicates the progress of single measurements.
ments
The first number is the current measurement. The second number is the
total number of measurements.
Only displayed for single measurements and if the scan count is greater
than 1.
Frequency Receiver Frequency
11User Manual 1179.0880.02 ─ 03

R&S®ESW-K58
Welcome to the Multi CISPR APD application
Understanding the display information
Window Title Bar
Each channel in the R&S ESW display can contain several windows. Each window can
display either a graph or a table as a result of the channel measurement. The window's
title bar indicates which type of evaluation is displayed.
Information on the displayed traces is indicated in the window title bar.
Trace number
Trace color
Trace mode
Detector
For further information on the Window Title Bar, see R&S ESW User Manual.
Status bar information
Global instrument settings, the instrument status and any irregularities are indicated in
the status bar beneath the diagram.
Furthermore, the progress of the current operation is displayed in the status bar.
12User Manual 1179.0880.02 ─ 03

R&S®ESW-K58
3 Measurements and result displays
Measurements and result displays
Access: "Overview" > "Display Config"
Or: [MEAS] > "Display Config"
The data that was measured by the R&S ESW can be evaluated using various different
methods. In the Multi CISPR APD application, multiple result displays can be used
simultaneously.
CISPR APD at Tuned Frequency..................................................................................13
Fast Access...................................................................................................................13
Marker Table................................................................................................................. 13
Multi APD...................................................................................................................... 13
Notes.............................................................................................................................14
Result Summary............................................................................................................14
CISPR APD at Tuned Frequency
Displays the likelihood that a disturbance is above a specified level at a particular frequency.
Remote command:
LAY:ADD? '1',RIGH,CAPD
(See LAYout:ADD[:WINDow]? on page 56)
Fast Access
By default, the Fast Access panel provides functionality to control the Reference Level
and the Tuned Frequency. For more information on how to change the functionality and
how to work with the Fast Access panel, refer to the R&S ESW user manual.
Remote command:
LAY:ADD? '1',RIGH,FACC
(See LAYout:ADD[:WINDow]? on page 56)
Marker Table
Provides functionality to display information for all active markers. For more information
on how to work with the Marker Table, refer to the R&S ESW user manual.
Remote command:
LAY:ADD? '1',RIGH,MTAB
(See LAYout:ADD[:WINDow]? on page 56)
Multi APD
Displays the results of the CISPR APD measurement for all frequencies within the current span.
13User Manual 1179.0880.02 ─ 03
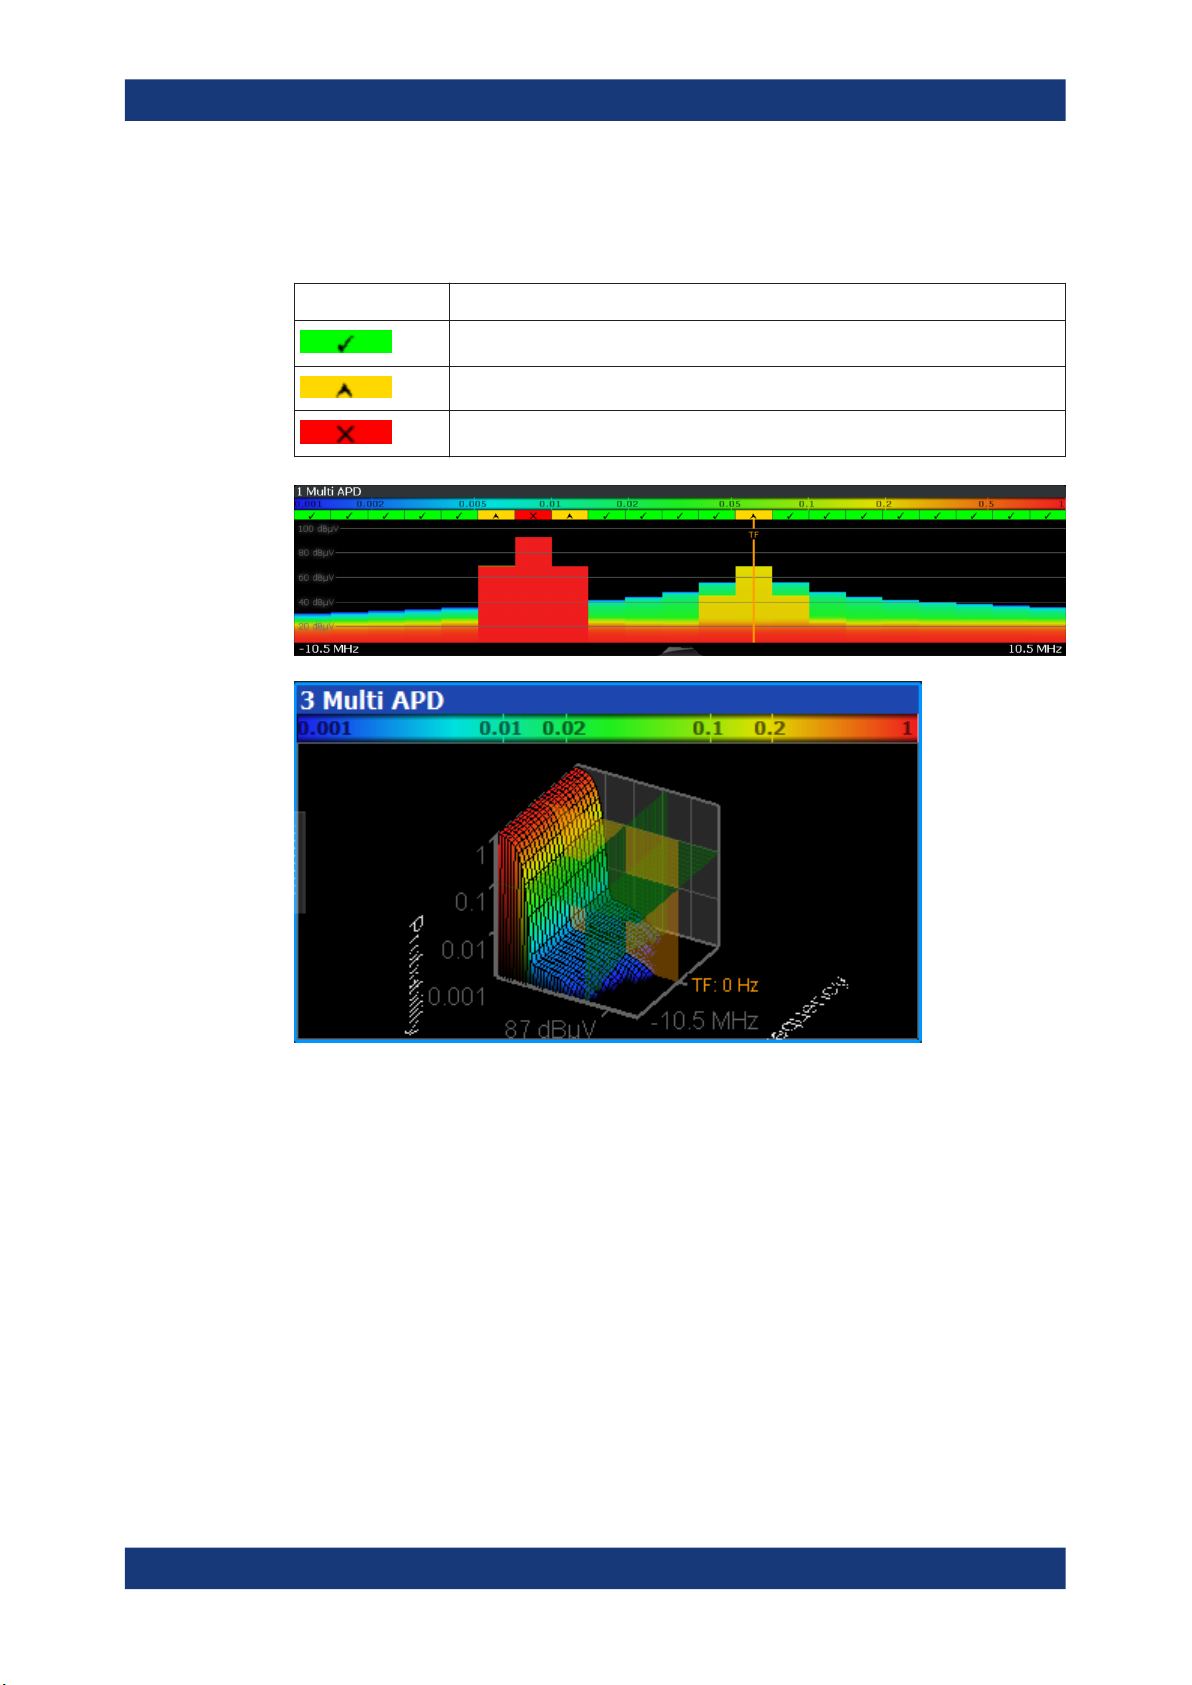
R&S®ESW-K58
Measurements and result displays
A view selection between Flat (2D) and 3D view of the Multi APD result display is possible.
Table 3-1: Multi APD Label Description
Label Description
Pass
Margin
Fail
Remote command:
LAY:ADD? '1',RIGH,MAPD
(See LAYout:ADD[:WINDow]? on page 56)
Notes
Provides functionality to add comments or explanations to the current measurement.
For more information on how to work with the Notes panel, refer to the R&S ESW user
manual.
Remote command:
LAY:ADD? '1',RIGH,NOT
(See LAYout:ADD[:WINDow]? on page 56)
Result Summary
The Result Summary table contains the following values:
14User Manual 1179.0880.02 ─ 03

R&S®ESW-K58
Measurements and result displays
Table 3-2: Result summary description
Label Description
Frequency Channel frequency
p Limit Limit for the probability
E Limit Limit for the power
∆ to p Limit Distance to the p limit for the channel
∆ to E Limit Distance to the E limit for the channel
Average Average amplitude for the channel
Peak Peak amplitude for the channel
For calculating the deltas, the minimum distance to the limits is used in case of a Pass
or Margin and the maximum distance is used in case of a Fail.
Remote command:
LAY:ADD? '1',RIGH,RSUM, see LAYout:ADD[:WINDow]? on page 56
TRACe<n>[:DATA]? on page 64
CALCulate<n>:STATistics:RESult<res>? on page 64
FETCh:SUMMary<n>[:ALL]? on page 65
FETCh:SUMMary<n>:AVERage? on page 65
FETCh:SUMMary<n>:AVERage:ALL? on page 65
FETCh:SUMMary<n>:DELimit? on page 66
FETCh:SUMMary<n>:DELimit:ALL? on page 66
FETCh:SUMMary<n>:DPLimit? on page 66
FETCh:SUMMary<n>:DPLimit:ALL? on page 66
FETCh:SUMMary<n>:ELIMit? on page 67
FETCh:SUMMary<n>:ELIMit:ALL? on page 67
FETCh:SUMMary<n>:FREQuency? on page 67
FETCh:SUMMary<n>:FREQuency:ALL? on page 68
FETCh:SUMMary<n>:LIMit? on page 68
FETCh:SUMMary<n>:LIMit:ALL? on page 68
FETCh:SUMMary<n>:PEAK? on page 68
FETCh:SUMMary<n>:PEAK:ALL? on page 69
FETCh:SUMMary<n>:PLIMit? on page 69
FETCh:SUMMary<n>:PLIMit:ALL? on page 69
15User Manual 1179.0880.02 ─ 03

R&S®ESW-K58
4 Measurement basics
Measurement basics
Some background knowledge on basic terms and principles used in Multi CISPR APD
measurements is provided here for a better understanding of the required configuration
settings.
The Amplitude Probability Distribution (APD) is a statistical measurement that shows
the "cumulative distribution of the probability of time that the amplitude of disturbance
exceeds a specified level" (CISPR 16-1-1, Amendment 1:2005). So, basically, the measurement determines the likelihood that a disturbance is above a specified level at a
particular frequency (the measurement is usually performed on a fixed frequency).
The amplitude of the disturbance is expressed in terms of the corresponding field
strength or voltage at the receiver input.
The APD is measured at the output of the envelope detector. Therefore, the APD
yields the probability information over the entire disturbance envelope within the measurement bandwidth and a particular period of time.
The APD function has the following advantages:
●
It provides an alternative way to present peak and average measurements (for
example for microwave ovens in accordance with CISPR 11).
●
It is able to calculate true average values.
●
It shows high sensitivity and allows you to measure, for example, a single impulse.
●
It allows you to measure unsteady levels.
The Multi CISPR APD application allows you to measure up to 20 channels at 1 MHz
bandwidth and up to 67 channels at 120 kHz bandwidth in parallel, thus saving a significant amount of measurement time. Traditional measurement methods only allowed to
measure the APD at one frequency at a time.
16User Manual 1179.0880.02 ─ 03

R&S®ESW-K58
5 Configuration
Configuration
Configuration overview
Access: [MODE] > "Multi CISPR APD"
When you activate the Multi CISPR APD application, a Multi CISPR APD measurement for the input signal is started automatically with the default configuration. It can be
configured in the Multi CISPR APD "Overview" dialog box, which is displayed when
you select the "Overview" softkey from any menu.
● Configuration overview............................................................................................17
● Data input and output..............................................................................................18
● Amplitude................................................................................................................ 23
● Frequency............................................................................................................... 29
● Trigger.....................................................................................................................31
● Measurement settings.............................................................................................33
● Evaluation table.......................................................................................................36
● Display configuration...............................................................................................37
● Sweep settings........................................................................................................37
● Transducer..............................................................................................................38
5.1 Configuration overview
Throughout the measurement configuration, an overview of the most important currently defined settings is provided in the "Overview". The "Overview" is displayed when
you select the "Overview" icon, which is available at the bottom of all softkey menus.
In addition to the main measurement settings, the "Overview" provides quick access to
the main settings dialog boxes. Thus, you can easily configure an entire Multi CISPR
APD measurement channel from input over processing to output and analysis by stepping through the dialog boxes as indicated in the "Overview".
Preset Channel............................................................................................................. 18
17User Manual 1179.0880.02 ─ 03

R&S®ESW-K58
5.2 Data input and output
Configuration
Data input and output
Preset Channel
Select the "Preset Channel" button in the lower left-hand corner of the "Overview" to
restore all measurement settings in the current channel to their default values.
Note: Do not confuse the "Preset Channel" button with the [Preset] key, which restores
the entire instrument to its default values and thus closes all channels on the
R&S ESW (except for the default channel)!
Remote command:
SYSTem:PRESet:CHANnel[:EXEC] on page 54
Access: "Overview" > "Input"
Access: "Overview" > "Output"
The R&S ESW can analyze signals from different input sources and provide various
types of output (such as video or trigger signals).
I/Q data import and export
You can also analyze I/Q data that you have previously recorded.
For a comprehensive description about I/Q data import and export, refer to the user
manual of the R&S ESW.
● Configuring the RF input......................................................................................... 18
● Configuring external mixers.................................................................................... 20
● Configuring the preselector.....................................................................................20
● Configuring output...................................................................................................20
● Configuring line impedance stabilization networks (LISN)......................................22
● Configuring additional outputs.................................................................................22
5.2.1 Configuring the RF input
Access: "Overview" > "Input / Frontend" > "Input Source" > "Radio Frequency"
The R&S ESW supports various signal input sources. The default input source is the
RF input.
18User Manual 1179.0880.02 ─ 03

R&S®ESW-K58
Configuration
Data input and output
Functions in the "Input" dialog box described elsewhere:
●
"Input Selection" on page 19
The remote commands required to configure the RF input are described in Chap-
ter 8.5.1.1, "RF input", on page 70.
Input Selection.............................................................................................................. 19
Input Coupling...............................................................................................................19
Impedance.................................................................................................................... 20
Pulse Limiter................................................................................................................. 20
Input Selection
Selects the RF input connector you would like to use for a measurement.
Note that you cannot use both RF inputs simultaneously.
Remote command:
Global: INPut<ip>:TYPE on page 71
Input Coupling
The RF input of the R&S ESW can be coupled by alternating current (AC) or direct current (DC).
Note that the "Input Coupling" feature is only available for input 2 when the pulse lim-
iter is turned off. When the pulse limiter is on, the input is always DC coupled.
AC coupling blocks any DC voltage from the input signal. AC coupling is activated by
default to prevent damage to the instrument. Very low frequencies in the input signal
can be distorted.
However, some specifications require DC coupling. In this case, you must protect the
instrument from damaging DC input voltages manually. For details, refer to the data
sheet.
19User Manual 1179.0880.02 ─ 03

R&S®ESW-K58
Configuration
Data input and output
Remote command:
INPut<ip>:COUPling on page 70
Impedance
For some measurements, the reference impedance for the measured levels of the
R&S ESW can be set to 50 Ω or 75 Ω.
Select 75 Ω if the 50 Ω input impedance is transformed to a higher impedance using a
75 Ω adapter of the RAZ type. (That corresponds to 25Ω in series to the input impedance of the instrument.) The correction value in this case is 1.76 dB = 10 log (75Ω/
50Ω).
This value also affects the unit conversion.
Remote command:
INPut<ip>:IMPedance on page 70
Pulse Limiter
The pulse limiter, available for the second RF input, is a protection mechanism against
high level pulses or signals (which can damage the input mixer).
When you turn on the pulse limiter, the attenuation is always at least 10 dB. Attenuation smaller than 10 dB is only available when you turn off the pulse limiter.
Remote command:
INPut<ip>:ATTenuation:LIMiter[:STATe] on page 71
5.2.2 Configuring external mixers
Access: "Overview" > "Input / Frontend" > "Input Source" > "External Mixer"
Controlling external mixer is available with the optional External Mixer support.
The functionality is the same as in the spectrum application.
For more information about configuring external mixers, refer to the user manual of the
spectrum application.
5.2.3 Configuring the preselector
Access: "Overview" > "Input / Frontend" > "Preselector"
The preselector works similar to the preselector in the Receiver application. Notch filters are not supported in the Multi CISPR APD application.
For more information refer to the user manual of the R&S ESW.
5.2.4 Configuring output
Access: "Overview" > "Output" > "Output Config"
The R&S ESW provides functionality to configure the volume of the phone output as
required.
20User Manual 1179.0880.02 ─ 03

R&S®ESW-K58
Configuration
Data input and output
For details on the connectors refer to the R&S ESW Getting Started manual, chapter
"Instrument Tour".
The remote commands required to configure the outputs are described in Chap-
ter 8.5.2, "Output configuration", on page 72.
Output Coupling............................................................................................................ 21
Controlling the volume.................................................................................................. 21
Output Coupling
Selects the scope of the output settings.
"Global"
"Channel Spe-
cific"
Remote command:
OUTPut<ou>:LINK on page 72
Controlling the volume
CAUTION! Risk of hearing damage. To protect your hearing, make sure that the vol-
ume setting is not too high before putting on the headphones.
When you output an audio signal and listen to it with headphones, for example, you
can control the volume of the output.
One way to control the volume is to use the volume control knob on the front panel of
the R&S ESW.
The output settings apply to all measurement channels / applications.
The output settings apply to the current measurement channel / appli-
cation only. You can configure each channel separately.
A similar functionality is available in the "Phones" tab of the "Output Config" dialog box.
The volume control slider has the same effect as the volume control knob. For the
slider, the volume is a percentage from 0 % to 100 % with 100 % being the loudest.
21User Manual 1179.0880.02 ─ 03

R&S®ESW-K58
5.2.5 Configuring line impedance stabilization networks (LISN)
Configuration
Data input and output
In addition to simply changing the volume, you can also define a maximum volume
level. The maximum volume level limits the audio output to a certain level. The volume
control knob and slider will not go further than this level.
Remote command:
Volume: SYSTem:SPEaker:VOLume on page 73
Maximum volume: SYSTem:SPEaker:MAXVolume on page 72
Mute: SYSTem:SPEaker:MUTE on page 73
Access: "Overview" > "Output" > "LISN"
The R&S ESW supports several LISN models and provides functionality to control
these devices. The functionality is the same as in the Receiver application.
For more information refer to the user manual of the R&S ESW.
5.2.6 Configuring additional outputs
Access: "Overview" > "Output" > "Additional Outputs"
The R&S ESW provides additional outputs that you can use for various tasks.
The remote commands required to configure the outputs are described in Chap-
ter 8.5.2, "Output configuration", on page 72.
The trigger output settings are described in Chapter 5.5.2, "Trigger input and output
settings", on page 33.
Probe Power Supply..................................................................................................... 22
Probe Power Supply
Selects the probe connector that is supplied with power.
The probe power supply is a global setting - when you change it in one measurement
channel, it is also changed in the others.
"Probe 1"
"Probe 2"
"Off"
Remote command:
OUTPut<ou>:PROBe<pb>[:POWer] on page 73
Supplies the 3-pin probe connector with power.
Supplies the 5-pin probe connector with power.
Turns off the power supply for the probe connectors.
22User Manual 1179.0880.02 ─ 03

R&S®ESW-K58
5.3 Amplitude
5.3.1 Amplitude configuration
Configuration
Amplitude
Access: "Overview" > "Input / Frontend" > "Amplitude"
The amplitude is configured in the "Amplitude" tab of the "Input" dialog box.
For background information on amplitude settings see the R&S ESW User Manual.
The remote commands required to define these settings are described in Chap-
ter 8.5.3, "Amplitude configuration", on page 74.
Functions to configure level characteristics described elsewhere:
●
"Input Coupling" on page 19
●
"Impedance" on page 20
Reference Level............................................................................................................23
└ Shifting the Display (Offset)............................................................................ 24
Attenuation....................................................................................................................24
10 dB Minimum Attenuation..........................................................................................25
Preamplifier...................................................................................................................25
Reference Level
Defines the expected maximum reference level. Signal levels above this value are possibly not measured correctly. Signals above the reference level are indicated by an "IF
Overload" or "OVLD" status display.
23User Manual 1179.0880.02 ─ 03

R&S®ESW-K58
Configuration
Amplitude
The reference level can also be used to scale power diagrams; the reference level is
then used for the calculation of the maximum on the y-axis.
Since the hardware of the R&S ESW is adapted according to this value, it is recommended that you set the reference level close above the expected maximum signal
level. Thus you ensure an optimum measurement (no compression, good signal-tonoise ratio).
Note: Note that for input from the External Mixer (R&S ESW-B21) the maximum refer-
ence level also depends on the conversion loss; see the R&S ESW base unit user
manual for details.
Remote command:
DISPlay[:WINDow<n>][:SUBWindow<w>]:TRACe<t>:Y[:SCALe]:RLEVel
on page 74
Shifting the Display (Offset) ← Reference Level
Defines an arithmetic level offset. This offset is added to the measured level. In some
result displays, the scaling of the y-axis is changed accordingly.
Define an offset if the signal is attenuated or amplified before it is fed into the
R&S ESW so the application shows correct power results. All displayed power level
results are shifted by this value.
The setting range is ±200 dB in 0.01 dB steps.
Note, however, that the internal reference level (used to adjust the hardware settings to
the expected signal) ignores any "Reference Level Offset". Thus, it is important to keep
in mind the actual power level the R&S ESW must handle. Do not rely on the displayed
reference level (internal reference level = displayed reference level - offset).
Remote command:
DISPlay[:WINDow<n>][:SUBWindow<w>]:TRACe<t>:Y[:SCALe]:RLEVel:
OFFSet on page 75
Attenuation
Defines the attenuation of the signal.
You can attenuate the signal in 1 dB steps. The range is specified in the datasheet.
Attenuation of less than 10 dB is only possible if you turn off 10 dB Minimum Attenua-
tion.
If you are using the preamplifier in frequency ranges above 8 GHz, the available
attenuation can be reduced.
For more information, see the Preamplifier description in the R&S ESW base unit user
manual.
The auto ranging feature in the receiver remains active even if you change the attenuation and preamplifier properties in other measurement channels and then return to the
receiver application.
The R&S ESW also allows you to determine the best attenuation automatically.
●
In the receiver application, turn on the "Auto Ranging" feature.
●
In the other applications, select attenuation "Mode" ➙ "Auto"
24User Manual 1179.0880.02 ─ 03

R&S®ESW-K58
Configuration
Amplitude
Remote command:
Global: INPut<ip>:ATTenuation[:VALue] on page 76
Attenuation mode: INPut<ip>:ATTenuation:AUTO on page 75
10 dB Minimum Attenuation
Turns the availability of attenuation levels of less than 10 dB on and off.
When you turn on this feature, the attenuation is always at least 10 dB. This minimum
attenuation protects the input mixer and avoids accidental setting of 0 dB, especially if
you measure EUTs with high RFI voltage.
When you turn it off, you can also select attenuation levels of less than 10 dB.
The setting applies to a manual selection of the attenuation as well as the automatic
selection of the attenuation.
Remote command:
INPut<ip>:ATTenuation:PROTection[:STATe] on page 76
Preamplifier
Configures the preamplifier.
In addition to the standard preamplifier, a low noise amplifier is available as an optional
hardware component.
●
"Off"
Turns off the preamplifier.
●
"LN Amplifier"
Turns on the optional low noise amplifier.
Note that if you want to use the standard preamplifier, you have to route the signal
through the preselector.
More information.
Remote command:
Preamplifier:
State (global): INPut<ip>:GAIN:STATe on page 77
Low noise preamplifier:
State (global): INPut<ip>:GAIN:LNA:STATe on page 77
5.3.2 Increasing measurement sensitivity (or avoiding an input mixer overload)
Measurements often confront you with unknown or unintentional signals with unknown
signal levels (and often with pulse characteristics). Such signals can either have very
weak signal levels, in which case you might miss them during the measurement. Or
they can have very strong signal levels, in which case they can damage the input
mixer.
25User Manual 1179.0880.02 ─ 03

R&S®ESW-K58
Configuration
Amplitude
Risk of damage to the input mixer
Do not overload the input mixer.
Overloading the input mixer can damage it. The following topics contain advice on how
to avoid an overload of the input mixer. Read them carefully before applying a signal.
Protecting the input mixer
Always consider how to protect the input mixer from damage when setting up a measurement.
The input mixer of the R&S ESW is equipped with an overload protection mechanism.
If you apply a signal whose power exceeds the specified limit (see datasheet), the connection between the RF input and the input mixer is cut off. The R&S ESW displays a
corresponding message in the status display.
Note that pulses have different level characteristics. Refer to the data sheet for more
information on the allowed maximum pulse energy.
The signal level at the input mixer is calculated as follows.
Mixer Level = Input Level - attenuation + gain
RF input protection
The R&S ESW is equipped with an overload protection mechanism. This mechanism
becomes active as soon as the signal level at the input mixer exceeds the specified
limit. It ensures that the connection between RF input and input mixer is cut off.
In this case, you must decrease the level at the RF input connector and then close the
message box. Then measurements are possible again.
● Using the RF attenuator..........................................................................................26
● Using the preamplifier............................................................................................. 27
● Using the preselector.............................................................................................. 28
5.3.2.1 Using the RF attenuator
The first tool provided by the R&S ESW to control measurement sensitivity is the RF
attenuator.
The RF attenuator is available in all hardware configurations of the R&S ESW.
Attenuation has the following effects on the measurement:
●
High attenuation protects the input mixer: the main purpose of the attenuator is to
protect the input mixer.
●
High attenuation makes sure that the measurement results are reliable (signals
that are stronger than allowed can distort the results)
●
High attenuation helps you to avoid intermodulation
26User Manual 1179.0880.02 ─ 03

R&S®ESW-K58
Configuration
Amplitude
●
High attenuation increases inherent noise (i.e. the noise floor) and thus decreases
measurement sensitivity: if you increase attenuation by 10 dB, the sensitivity is
reduced by 10 dB (in other words: the displayed noise increases by 10 dB)
Depending on the required test setup, a compromise must be found between a high
sensitivity, low intermodulation and input mixer protection. Optimally, let the R&S ESW
determine the ideal attenuation automatically.
You can determine the attenuation automatically with the auto ranging feature in the
receiver application and the auto attenuation feature in the other applications. Determining the attenuation automatically might not necessarily utilize the maximum
dynamic range, but still yields valid and reliable results.
When you select the attenuation manually and are measuring unknown signals, especially DUTs with a high RFI voltage, always select the highest possible attenuation
level before you apply the signal.
If you need a better sensitivity or signal-to-noise ratio, make sure that the applied signal does not exceed the specified limits, before you lower the attenuation.
For further protection of the input mixer, the R&S ESW does not allow you to select
attenuation levels of less than 10 dB unless you explicitly turn on this feature ("10 dB
Minimum Attenuation").
Risk of damage to the input mixer
●
Do not apply a 0 dB attenuation when you measure unknown signals or RFI voltage in combination with an artificial network (LISN).
During phase switching, such test setups generate very strong pulses which can
damage the input mixer.
●
When you allow attenuation of less than 10 dB in combination with auto ranging,
make sure that the signal level at the RF input does not exceed the allowed limits.
Exceeding the limits can damage the input mixer.
5.3.2.2 Using the preamplifier
The second tool that allows you to control measurement sensitivity is the preamplifier.
In addition to the standard preamplifier available in every R&S ESW, an additional low
noise amplifier is available as an optional component (R&S ESW-B24).
Signal gain has the following effects on the measurement:
●
The preamplifier allows you to detect even weak signals.
●
The preamplifier reduces the noise figure of the R&S ESW and thus increases its
sensitivity. Thus, it is recommended to use the preamplifier for measurements that
require maximum sensitivity.
●
The preamplifier reduces the dynamic range. To perform a measurement using the
maximum dynamic range, turn off the preamplifier.
27User Manual 1179.0880.02 ─ 03

R&S®ESW-K58
5.3.2.3 Using the preselector
Configuration
Amplitude
●
The preamplifier is located after the preselection filters, reducing the risk of overloading the input mixer by strong out-of-band signals.
●
The optional low noise amplifier is located in front of the preselection filters which
increases the measurement sensitivity.
The gain of the preamplifier is automatically considered in the level display. The disadvantage of a lower large-signal immunity (intermodulation) is reduced by the "preselector".
The "preselector" is another tool to control measurement sensitivity.
Preselection has the following effects on the measurement:
●
Preselection rejects most of the spectral energy which helps to protect the input
mixer and thus makes sure that the measurement results are valid and reliable.
●
Preselection filters out signals that you do not want to be displayed (selectivity) and
thus allows you to analyze only the frequency range you are interested in.
The "preselector" of the R&S ESW consists of several filters which are automatically
applied during measurements. The filter that is used depends on the frequency that is
currently measured. You can see the list of filters and the progress in the "Preselector"
result display. The currently applied filter is indicated by a green LED, filters that are
outside the scan range are ignored.
Figure 5-1: Preselector result display. The green LED indicates the currently applied filter.
In the frequency range from 150 kHz to 30 MHz, you can preselect in a single stage
(150 kHz to 30 MHz). Or, you can split the preselection into two stages, each of which
applies a separate filter: one from 150 kHz to 2 MHz, and another from 2 MHz to
30 MHz.
In addition, the R&S ESW provides several notch filters to suppress certain frequency
ranges completely.
Using the "preselector"
Switching the filters is a mechanical process. Avoid excessive filters switches, because
the hardware can wear out.
28User Manual 1179.0880.02 ─ 03

R&S®ESW-K58
5.4 Frequency
Configuration
Frequency
Note that results in a frequency band are only displayed if there is at least one valid
measurement point in the corresponding range. If a particular measurement point is
captured by more than one filter, the R&S ESW displays the combined results.
Notch filter
The R&S ESW provides additional notch filters that suppress signals in the frequency
bands from 2.4 GHz to 2.5 GHz and 5.725 GHz to 5.875 GHz.
Access: "Overview" > "Frequency"
Frequency settings for the input signal can be configured via the "Frequency" dialog
box, which is displayed when you do one of the following:
The remote commands required to configure the frequency are described in Chap-
ter 8.5.4, "Frequency configuration", on page 78.
Center Frequency......................................................................................................... 29
Center Frequency Stepsize...........................................................................................30
Frequency Offset...........................................................................................................30
Tuned Frequency..........................................................................................................30
Center Frequency
Defines the center frequency of the signal in Hertz.
The allowed range of values for the center frequency depends on the frequency span.
span > 0: span
f
and span
max
/2 ≤ f
min
depend on the instrument and are specified in the data sheet.
min
center
≤ f
max
– span
min
/2
If the center frequency is within an undefined CISPR frequency region, it has to be set
according to the following table to be inside a valid band again:
29User Manual 1179.0880.02 ─ 03

R&S®ESW-K58
Configuration
Frequency
Table 5-1: Center frequency bands
2.4 GHz < f < 2.45 GHz (no CISPR band) set f to 2.4 GHz - Span / 2 (next valid band below
the gap)
2.45 GHz <= f < 2.5 GHz (no CISPR band) set f to 2.5 GHz + Span / 2 (next valid band above
the gap)
5.725 GHz < f < 5.8 GHz (no CISPR band) set f to 5.725 GHz - Span / 2 (next valid band below
the gap)
5.8 GHz <= f < 5.875 GHz (no CISPR band) set f to 5.875 GHz + Span / 2 (next valid band
above the gap)
Remote command:
[SENSe:]FREQuency:CENTer on page 78
Center Frequency Stepsize
Defines the step size by which the center frequency is increased or decreased using
the arrow keys.
When you use the rotary knob the center frequency changes in steps of only 1/10 of
the span.
The step size can be coupled to another value or it can be manually set to a fixed
value.
"Manual"
Defines a fixed step size for the center frequency. Enter the step size
in the "Value" field.
Remote command:
[SENSe:]FREQuency:CENTer:STEP on page 78
Frequency Offset
Shifts the displayed frequency range along the x-axis by the defined offset.
This parameter has no effect on the instrument's hardware, on the captured data, or on
data processing. It is simply a manipulation of the final results in which absolute frequency values are displayed. Thus, the x-axis of a spectrum display is shifted by a
constant offset if it shows absolute frequencies. However, if it shows frequencies relative to the signal's center frequency, it is not shifted.
A frequency offset can be used to correct the display of a signal that is slightly distorted
by the measurement setup, for example.
The allowed values range from -1 THz to 1 THz. The default setting is 0 Hz.
Remote command:
[SENSe:]FREQuency:OFFSet on page 78
Tuned Frequency
Defines the currently selected measurement frequency as a positive or negative deviation from the selected center frequency. The Tuned Frequency line can also be moved
by drag and drop. By default, the Tuned Frequency is equal to the Center Frequency
when the Multi CISPR APD application is started.
Remote command:
[SENSe:]FREQuency:TUNed on page 79
30User Manual 1179.0880.02 ─ 03
 Loading...