

Rohde&Schwarz R&S®ESW I/Q Analyzer User Manual
R&S®ESW
I/Q Analyzer
User Manual
(;ÛÍA2)
1177631702
Version 08

This manual describes the following R&S®ESW models:
●
R&S®ESW8 (1328.4100K08)
●
R&S®ESW8 (1328.4100K09)
●
R&S®ESW26 (1328.4100K26)
●
R&S®ESW26 (1328.4100K27)
●
R&S®ESW44 (1328.4100K44)
●
R&S®ESW44 (1328.4100K45)
The contents of this manual correspond to firmware version 2.20 and higher.
The I/Q Analyzer application is integral part of the R&S®ESW.
© 2022 Rohde & Schwarz GmbH & Co. KG
Muehldorfstr. 15, 81671 Muenchen, Germany
Phone: +49 89 41 29 - 0
Email: info@rohde-schwarz.com
Internet: www.rohde-schwarz.com
Subject to change – data without tolerance limits is not binding.
R&S® is a registered trademark of Rohde & Schwarz GmbH & Co. KG.
Trade names are trademarks of the owners.
1177.6317.02 | Version 08 | R&S®ESW
Throughout this manual, products from Rohde & Schwarz are indicated without the ® symbol , e.g. R&S®ESW is indicated as
R&S ESW.

R&S®ESW
Contents
Contents
1 Preface.................................................................................................... 5
1.1 About this manual.........................................................................................................5
1.2 Documentation overview..............................................................................................6
1.3 Conventions used in the documentation....................................................................7
2 Welcome to the I/Q Analyzer application.............................................9
2.1 Starting the I/Q Analyzer application.......................................................................... 9
2.2 Understanding the display information.................................................................... 10
3 Measurement and result displays...................................................... 13
4 Basics on I/Q data acquisition and processing................................ 17
4.1 Increasing measurement sensitivity (or avoiding an input mixer overload).........17
4.2 Processing analog I/Q data from RF input............................................................... 21
4.3 Basics on input from I/Q data files............................................................................ 23
4.4 Receiving and providing trigger signals...................................................................24
4.5 Basics on FFT..............................................................................................................25
5 Configuration........................................................................................32
5.1 Configuration overview.............................................................................................. 32
5.2 I/Q data import and export......................................................................................... 34
5.3 Configuring data input and output............................................................................ 47
5.4 Configuring the amplitude..........................................................................................52
5.5 Configuring frequency characteristics..................................................................... 58
5.6 Configuring triggered measurements.......................................................................59
5.7 Data acquisition.......................................................................................................... 63
5.8 Sweep settings............................................................................................................ 67
5.9 Display configuration................................................................................................. 69
5.10 Adjusting settings automatically...............................................................................69
6 Analysis................................................................................................ 73
6.1 Trace configuration.....................................................................................................73
6.2 Marker settings............................................................................................................74
7 How to work with I/Q data................................................................... 75
3User Manual 1177.6317.02 ─ 08

R&S®ESW
Contents
7.1 How to perform measurements in the I/Q Analyzer application.............................75
7.2 How to export and import I/Q data............................................................................ 76
8 Remote commands in the I/Q analyzer.............................................. 79
8.1 Introduction................................................................................................................. 79
8.2 Common suffixes........................................................................................................ 84
8.3 Application selection.................................................................................................. 84
8.4 Measurements control................................................................................................89
8.5 Result retrieval............................................................................................................ 97
8.6 Measurement configuration..................................................................................... 107
8.7 Analysis..................................................................................................................... 143
8.8 I/Q data import and export....................................................................................... 144
8.9 Querying the status registers.................................................................................. 145
8.10 Programming examples........................................................................................... 146
Annex.................................................................................................. 149
A Annex: reference................................................................................149
A.1 Formats for returned values: ASCII format and binary format............................. 149
A.2 Reference: format description for I/Q data files.....................................................150
A.3 I/Q data file format (iq-tar)........................................................................................ 151
List of Remote Commands (I/Q Analyzer)....................................... 160
Index....................................................................................................163
4User Manual 1177.6317.02 ─ 08

R&S®ESW
1 Preface
1.1 About this manual
This R&S ESW I/Q Analyzer User Manual provides all the information specific to the
application and processing I/Q data. All general instrument functions and settings
common to all applications are described in the main R&S ESW User Manual.
The main focus in this manual is on the measurement results and the tasks required to
obtain them. The following topics are included:
●
Welcome to the I/Q Analyzer application
Introduction to and getting familiar with the application
●
Typical Applications for the I/Q Analyzer and optional input interfaces
Example measurement scenarios for I/Q data import and analysis
●
Measurements and Result Displays
Details on supported measurements and their result types
●
Basics on I/Q Data Acquisition
Background information on basic terms and principles in the context of the I/Q Analyzer application as well as processing I/Q data in general
●
Configuration and Analysis
A concise description of all functions and settings available to import, capture and
analyze I/Q data in the I/Q Analyzer, with or without optional interfaces, with their
corresponding remote control command
●
How to Work with I/Q Data
The basic procedure to perform an I/Q Analyzer measurement or capture data via
the R&S Digital Baseband Interface with step-by-step instructions
●
Optimizing and Troubleshooting the Measurement
Hints and tips on how to handle errors and optimize the test setup
●
Remote Commands to perform Measurements with I/Q Data
Remote commands required to configure and perform I/Q Analyzer measurements
or process digital I/Q data in a remote environment, sorted by tasks;
(Commands required to set up the environment or to perform common tasks on the
instrument are provided in the main R&S ESW User Manual.)
Programming examples demonstrate the use of many commands and can usually
be executed directly for test purposes.
●
Annex
Reference material, e.g. I/Q file formats and a detailed description of the LVDS
connector
●
List of remote commands
Alphabetical list of all remote commands described in the manual
●
Index
Preface
About this manual
5User Manual 1177.6317.02 ─ 08

R&S®ESW
Preface
Documentation overview
1.2 Documentation overview
This section provides an overview of the R&S ESW user documentation. You find it on
the product page at:
www.rohde-schwarz.com/manual/esw
1.2.1 Getting started manual
Introduces the R&S ESW and describes how to set up and start working with the product. Includes basic operations, typical measurement examples, and general information, e.g. safety instructions, etc.
A printed version is delivered with the instrument. A PDF version is available for download on the Internet.
1.2.2 User manuals and help
Separate user manuals are provided for the base unit and the firmware applications:
●
Base unit manual
Contains the description of all instrument modes and functions. It also provides an
introduction to remote control, a complete description of the remote control commands with programming examples, and information on maintenance, instrument
interfaces and error messages. Includes the contents of the getting started manual.
●
Manuals for (optional) firmware applications
Contains the description of the specific functions of a firmware application, including remote control commands. Basic information on operating the R&S ESW is not
included.
The contents of the user manuals are available as help in the R&S ESW. The help
offers quick, context-sensitive access to the complete information for the base unit and
the firmware applications.
All user manuals are also available for download or for immediate display on the Internet.
1.2.3 Service manual
Describes the performance test for checking the rated specifications, module replacement and repair, firmware update, troubleshooting and fault elimination, and contains
mechanical drawings and spare part lists.
The service manual is available for download for registered users on the global
Rohde & Schwarz information system (GLORIS):
https://gloris.rohde-schwarz.com
6User Manual 1177.6317.02 ─ 08

R&S®ESW
Preface
Conventions used in the documentation
1.2.4 Instrument security procedures
Deals with security issues when working with the R&S ESW in secure areas. It is available for download on the Internet.
1.2.5 Basic safety instructions
Contains safety instructions, operating conditions and further important information.
The printed document is delivered with the instrument.
1.2.6 Data sheets and brochures
The data sheet contains the technical specifications of the R&S ESW. It also lists the
options and their order numbers, and optional accessories.
The brochure provides an overview of the instrument and deals with the specific characteristics.
See www.rohde-schwarz.com/brochure-datasheet/esw
1.2.7 Release notes and open source acknowledgment (OSA)
The release notes list new features, improvements and known issues of the current
firmware version, and describe the firmware installation.
The open source acknowledgment document provides verbatim license texts of the
used open source software.
See www.rohde-schwarz.com/firmware/esw
1.2.8 Application notes, application cards, white papers, etc.
These documents deal with special applications or background information on particular topics.
See www.rohde-schwarz.com/application/esw
1.3 Conventions used in the documentation
1.3.1 Typographical conventions
The following text markers are used throughout this documentation:
7User Manual 1177.6317.02 ─ 08

R&S®ESW
Preface
Conventions used in the documentation
Convention Description
"Graphical user interface elements"
[Keys] Key and knob names are enclosed by square brackets.
Filenames, commands,
program code
Input Input to be entered by the user is displayed in italics.
Links Links that you can click are displayed in blue font.
"References" References to other parts of the documentation are enclosed by quota-
All names of graphical user interface elements on the screen, such as
dialog boxes, menus, options, buttons, and softkeys are enclosed by
quotation marks.
Filenames, commands, coding samples and screen output are distinguished by their font.
tion marks.
1.3.2 Conventions for procedure descriptions
When operating the instrument, several alternative methods may be available to perform the same task. In this case, the procedure using the touchscreen is described.
Any elements that can be activated by touching can also be clicked using an additionally connected mouse. The alternative procedure using the keys on the instrument or
the on-screen keyboard is only described if it deviates from the standard operating procedures.
The term "select" may refer to any of the described methods, i.e. using a finger on the
touchscreen, a mouse pointer in the display, or a key on the instrument or on a keyboard.
1.3.3 Notes on screenshots
When describing the functions of the product, we use sample screenshots. These
screenshots are meant to illustrate as many as possible of the provided functions and
possible interdependencies between parameters. The shown values may not represent
realistic usage scenarios.
The screenshots usually show a fully equipped product, that is: with all options installed. Thus, some functions shown in the screenshots may not be available in your particular product configuration.
8User Manual 1177.6317.02 ─ 08

R&S®ESW
Welcome to the I/Q Analyzer application
Starting the I/Q Analyzer application
2 Welcome to the I/Q Analyzer application
The R&S ESW I/Q Analyzer is a firmware application that adds functionality to perform
I/Q data acquisition and analysis to the R&S ESW.
The R&S ESW I/Q Analyzer features:
●
Acquisition of analog I/Q data
●
Import of stored I/Q data from other applications
●
Spectrum, magnitude, I/Q vector and separate I and Q component analysis of any
I/Q data on the instrument
●
Export of I/Q data to other applications
This user manual contains a description of the functionality that the application provides, including remote control operation.
All functions not discussed in this manual are the same as in the base unit and are
described in the R&S ESW User Manual. The latest version is available for download
at the product homepage http://www.rohde-schwarz.com/product/esw.
Additional information
Several application notes discussing I/Q analysis are available from the Rohde &
Schwarz website:
1EF85: Converting R&S I/Q data files
1EF92: Wideband Signal Analysis
1MA257: Wideband mm-Wave Signal Generation and Analysis
1EF84: Differential measurements with Spectrum Analyzers and Probes
Installation
The R&S ESW I/Q Analyzer application is part of the standard base unit and requires
no further installation.
2.1 Starting the I/Q Analyzer application
The I/Q Analyzer is an application on the R&S ESW.
To activate the I/Q Analyzer application
1. Select the [MODE] key.
A dialog box opens that contains all applications currently available on your
R&S ESW.
2. Select the "I/Q Analyzer" item.
9User Manual 1177.6317.02 ─ 08

R&S®ESW
Welcome to the I/Q Analyzer application
Understanding the display information
The R&S ESW opens a new channel for the I/Q Analyzer application.
The measurement is started immediately with the default settings.
It can be configured in the I/Q Analyzer "Overview" dialog box, which is displayed
when you select the "Overview" softkey from any menu (see Chapter 5, "Configura-
tion", on page 32).
Multiple Channels and Sequencer Function
When you activate an application, a new channel is created which determines the
measurement settings for that application (channel). The same application can be activated with different measurement settings by creating several channels for the same
application.
The number of channels that can be configured at the same time depends on the available memory on the instrument.
Only one measurement can be performed at any time, namely the one in the currently
active channel. However, in order to perform the configured measurements consecutively, a Sequencer function is provided.
If activated, the measurements configured in the currently defined channels are performed one after the other in the order of the tabs. The currently active measurement is
indicated by a
The result displays of the individual channels are updated in the tabs (as well as the
"MultiView") as the measurements are performed. Sequential operation itself is independent of the currently displayed tab.
For details on the Sequencer function see the R&S ESW User Manual.
symbol in the tab label.
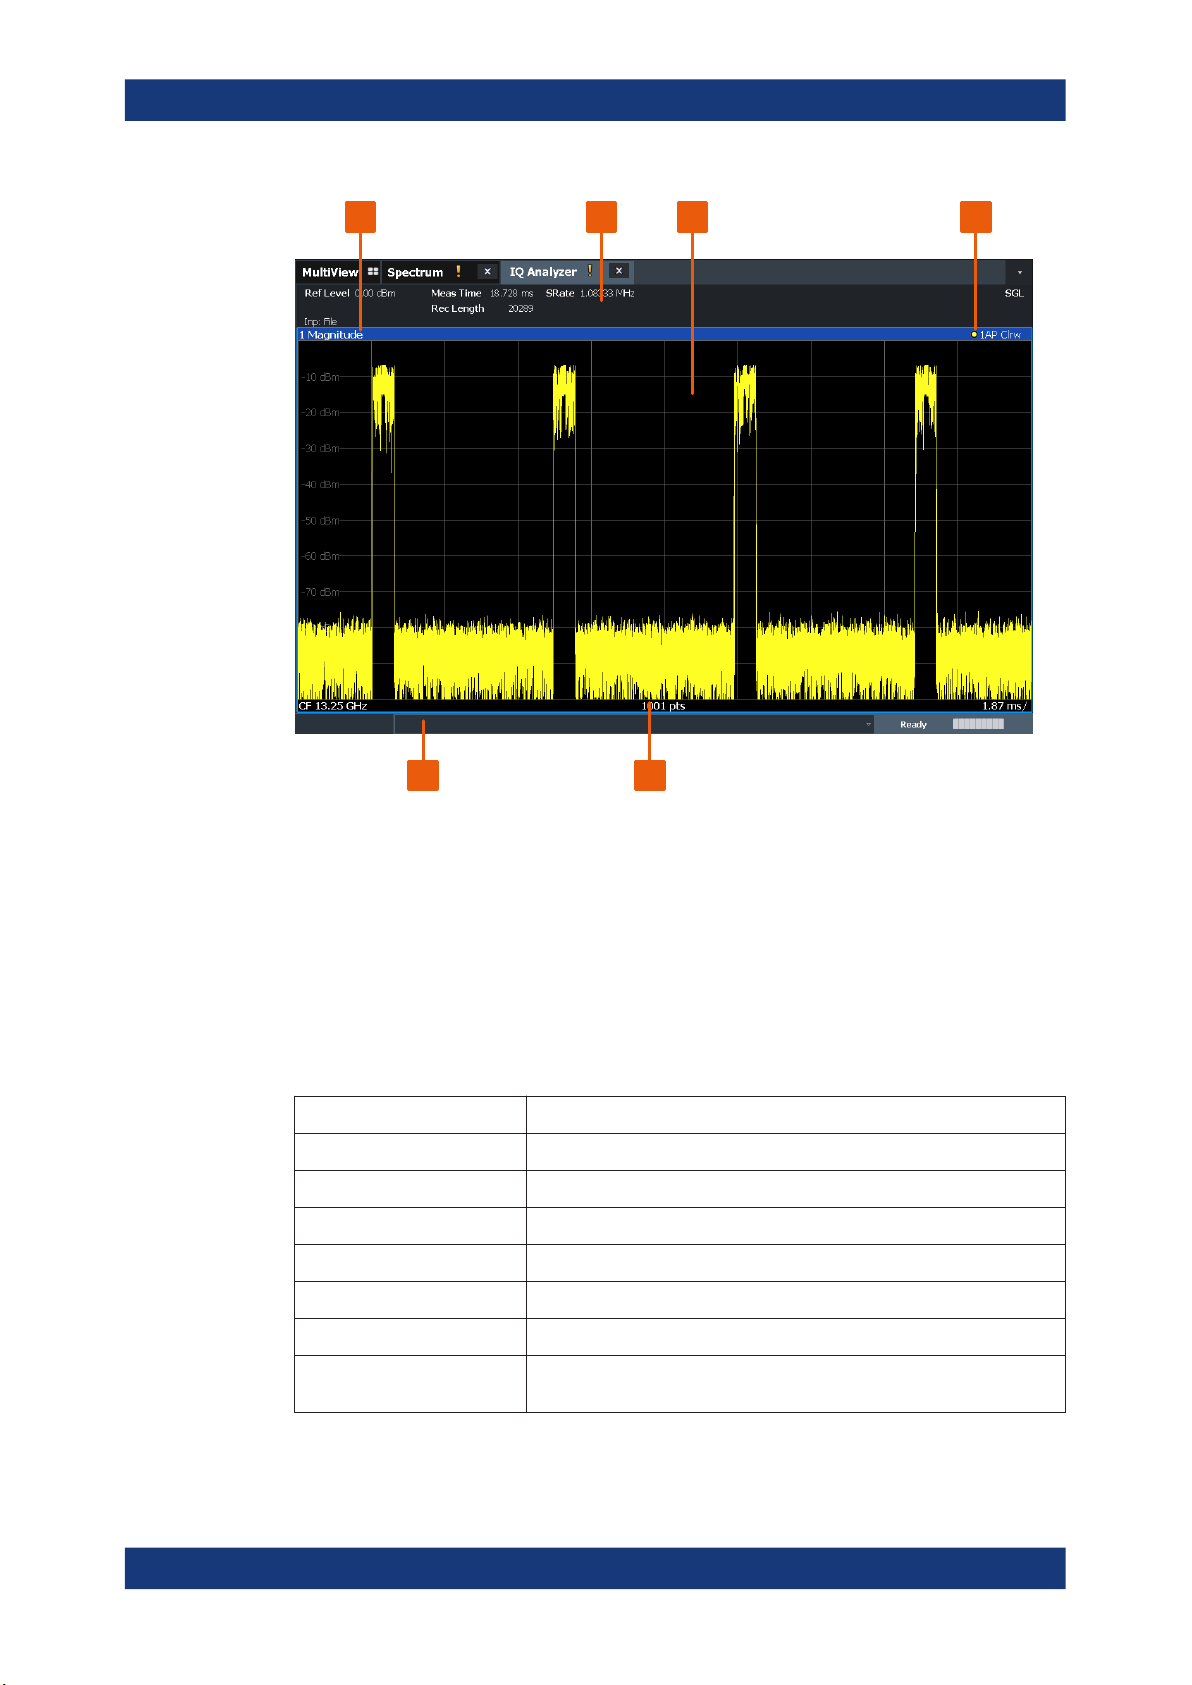
2.2 Understanding the display information
The following figure shows a measurement diagram during I/Q Analyzer operation. All
different information areas are labeled. They are explained in more detail in the following sections.
10User Manual 1177.6317.02 ─ 08
R&S®ESW
Welcome to the I/Q Analyzer application
Understanding the display information
1 2 3 4
56
Figure 2-1: Screen elements in the I/Q Analyzer application
1+4 = Window title bar with diagram-specific (trace) information
2 = Channel bar for firmware and measurement settings
3 = Diagram area
5 = Diagram footer with diagram-specific information, depending on result display
6 = Instrument status bar with error messages and date/time display
Channel bar information
In the I/Q Analyzer application, the R&S ESW shows the following settings:
Table 2-1: Information displayed in the channel bar for the I/Q Analyzer application
Ref Level Reference level
Att RF attenuation
Ref Offset Reference level offset
Freq Center frequency
Meas Time Measurement time
Rec Length Defined record length (number of samples to capture)
SRate Defined sample rate for data acquisition
RBW (Spectrum evaluation only) Resolution bandwidth calculated from the
sample rate and record length
11User Manual 1177.6317.02 ─ 08
R&S®ESW
Welcome to the I/Q Analyzer application
Understanding the display information
In addition, the channel bar also displays information on instrument settings that affect
the measurement results even though this is not immediately apparent from the display
of the measured values (e.g. transducer or trigger settings). This information is displayed only when applicable for the current measurement.
For details see the R&S ESW Getting Started manual.
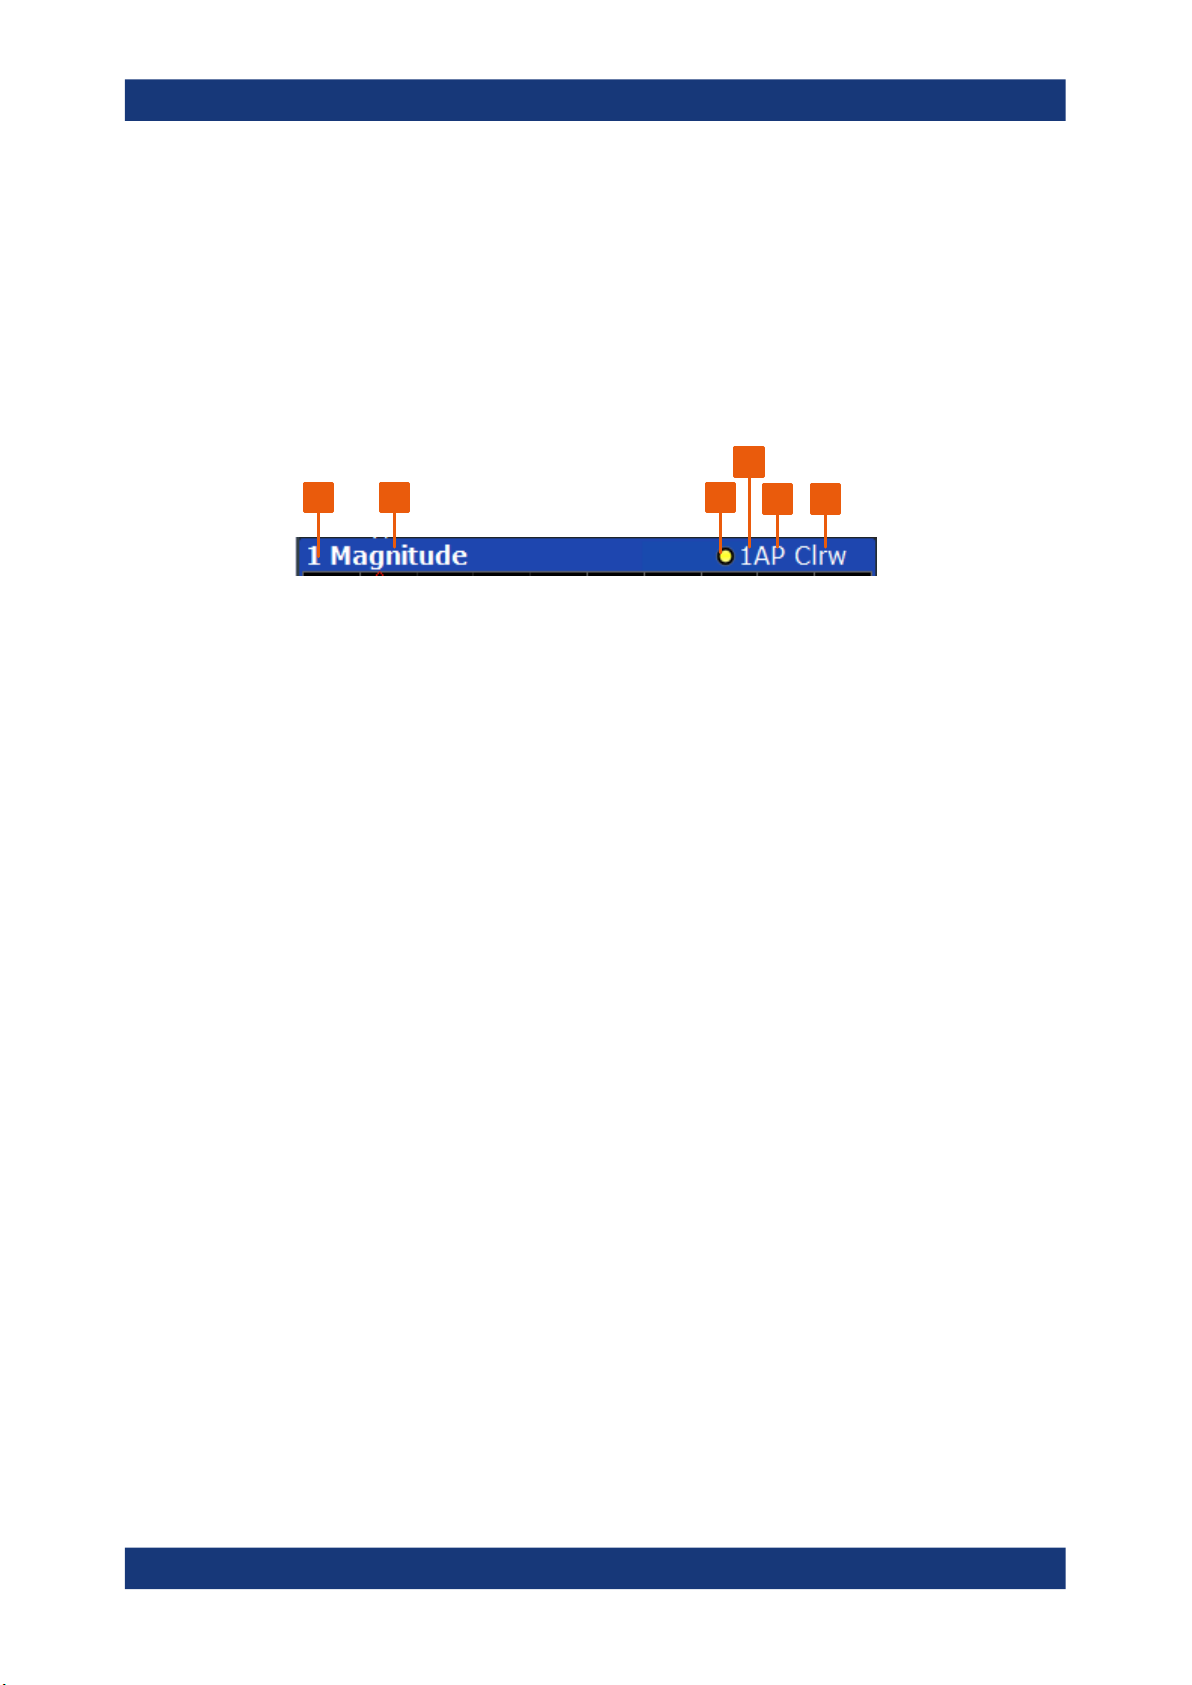
Window title bar information
For each diagram, the header provides the following information:
4
1 2 3
Figure 2-2: Window title bar information in the I/Q Analyzer application
1 = Window number
2 = Window type
3 = Trace color
4 = Trace number
5 = Detector
6 = Trace mode
5 6
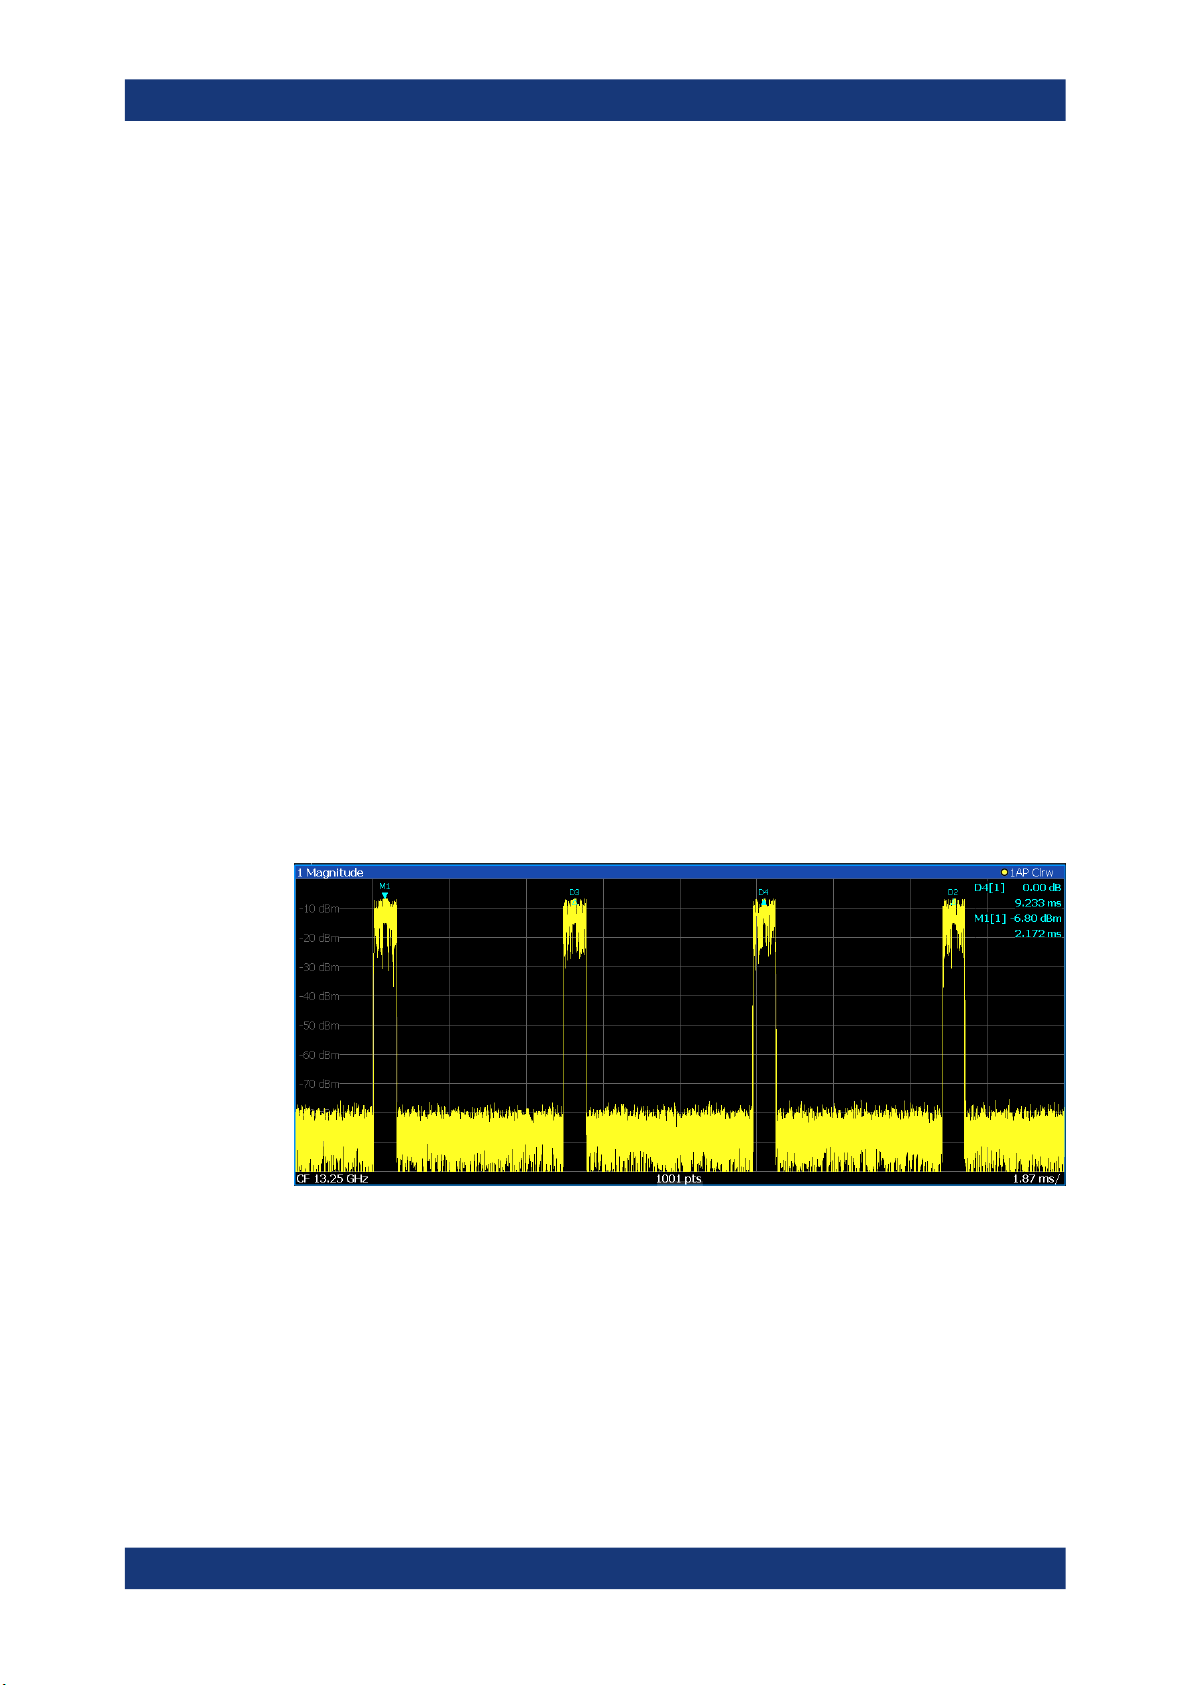
Diagram footer information
The information in the diagram footer (beneath the diagram) depends on the evaluation:
●
Center frequency
●
Number of sweep points
●
Range per division (x-axis)
●
Span (Spectrum)
Status bar information
Global instrument settings, the instrument status and any irregularities are indicated in
the status bar beneath the diagram.
Furthermore, the progress of the current operation is displayed in the status bar.
12User Manual 1177.6317.02 ─ 08
R&S®ESW
Measurement and result displays
3 Measurement and result displays
Access: "Overview" > "Display Config"
Or: [MEAS] > "Display Config"
The I/Q Analyzer can capture I/Q data. The I/Q data that was captured by or imported
to the R&S ESW can then be evaluated in various different result displays. Select the
result displays using the SmartGrid functions.
Up to 6 evaluations can be displayed in the I/Q Analyzer at any time, including several
graphical diagrams, marker tables or peak lists.
For details on working with the SmartGrid see the R&S ESW Getting Started manual.
Result displays for I/Q data:
Magnitude..................................................................................................................... 13
Spectrum.......................................................................................................................13
I/Q-Vector......................................................................................................................14
Real/Imag (I/Q)..............................................................................................................15
Phase vs. Time..............................................................................................................15
Marker Table................................................................................................................. 16
Marker Peak List........................................................................................................... 16
Magnitude
Shows the level values in time domain.
Remote command:
LAY:ADD:WIND? '1',RIGH,MAGN, see LAYout:ADD[:WINDow]? on page 137
Results:
TRACe<n>[:DATA]? on page 101
Spectrum
Displays the frequency spectrum of the captured I/Q samples.
13User Manual 1177.6317.02 ─ 08

R&S®ESW
Measurement and result displays
Remote command:
LAY:ADD:WIND? '1',RIGH,FREQ, see LAYout:ADD[:WINDow]? on page 137
Results:
TRACe<n>[:DATA]? on page 101
I/Q-Vector
Displays the captured samples in an I/Q-plot. The samples are connected by a line.
Note: For the I/Q vector result display, the number of I/Q samples to record ("Record
Length") must be identical to the number of trace points to be displayed ("Sweep
Points"; for I/Q Analyzer: 10001). For record lengths outside the valid range of sweep
points the diagram does not show valid results.
Remote command:
LAY:ADD:WIND? '1',RIGH,VECT, see LAYout:ADD[:WINDow]? on page 137
Results:
TRACe<n>[:DATA]? on page 101
14User Manual 1177.6317.02 ─ 08
R&S®ESW
Measurement and result displays
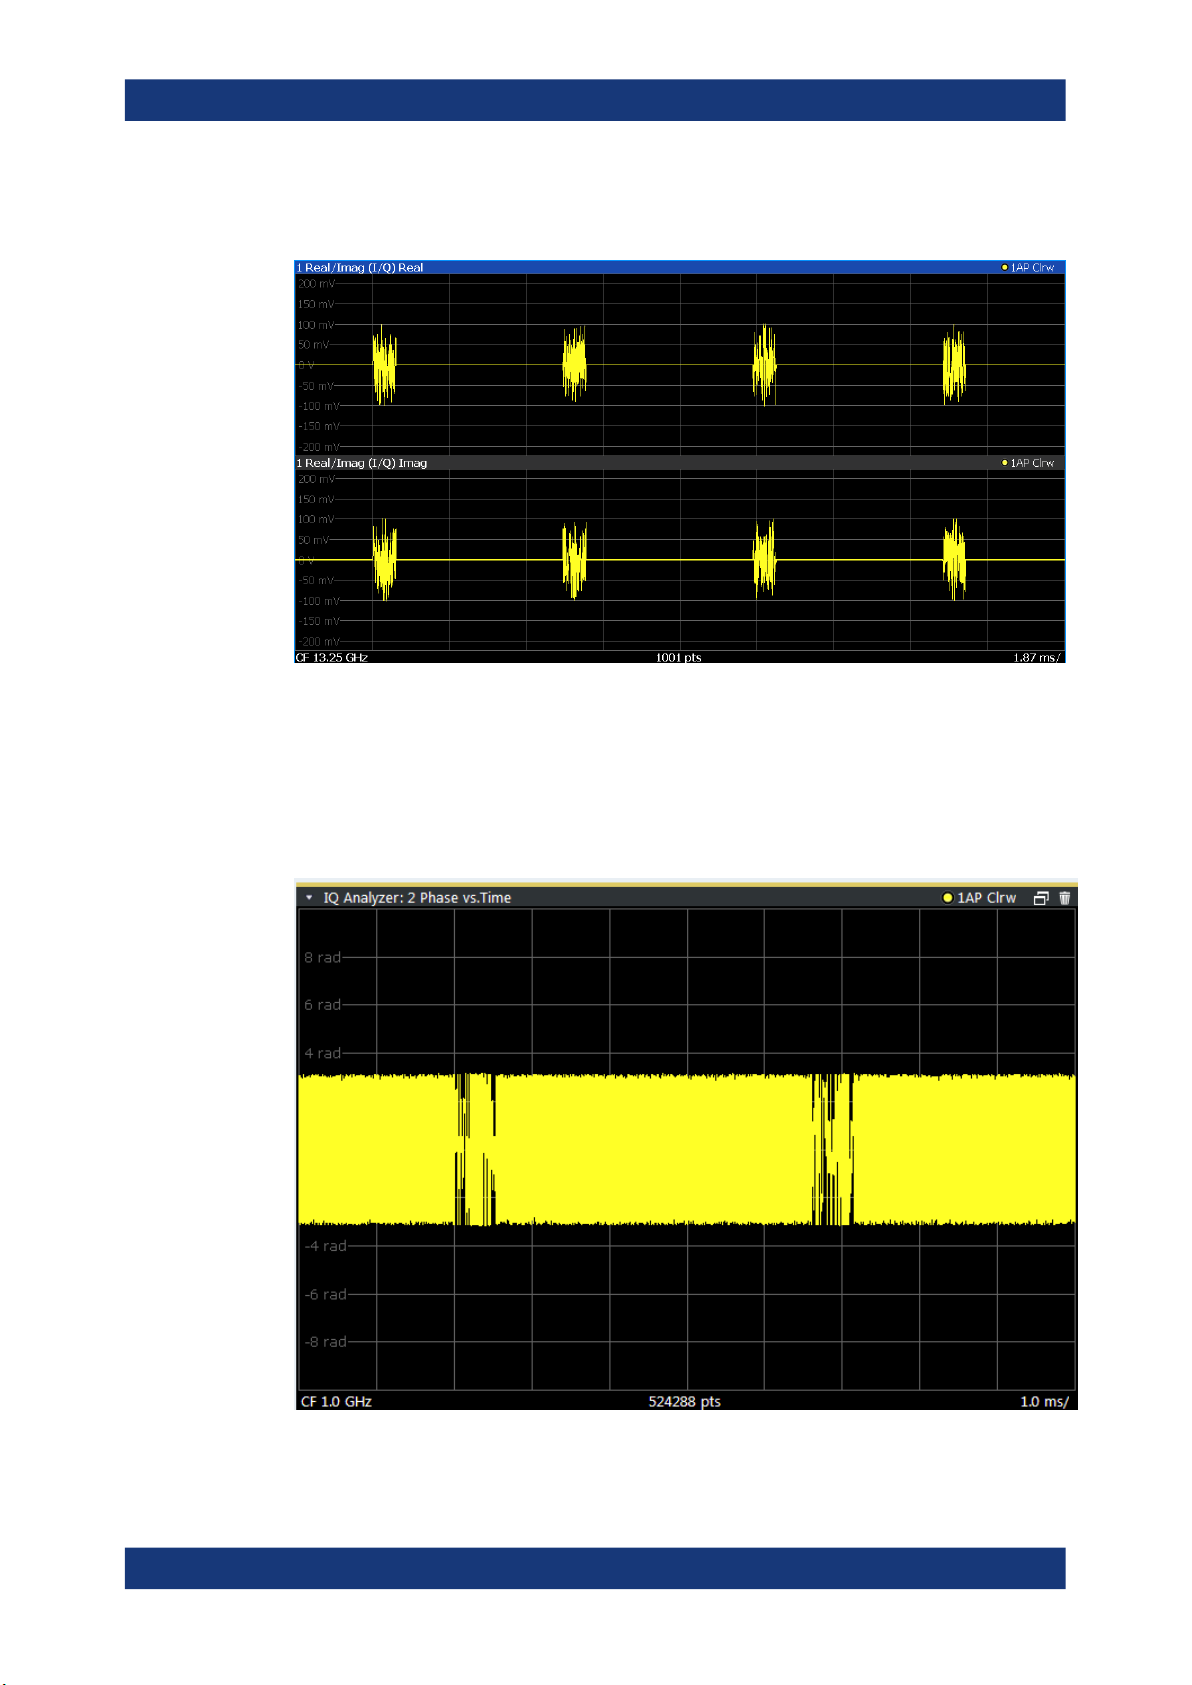
Real/Imag (I/Q)
Displays the I and Q values in separate diagrams.
Remote command:
LAY:ADD:WIND? '1',RIGH,RIM, see LAYout:ADD[:WINDow]? on page 137
Results:
TRACe<n>[:DATA]? on page 101
Phase vs. Time
Shows the phase values in the time domain.
Remote command:
LAY:ADD? '1',RIGH, POLar, see LAYout:ADD[:WINDow]? on page 137
15User Manual 1177.6317.02 ─ 08
R&S®ESW
Measurement and result displays
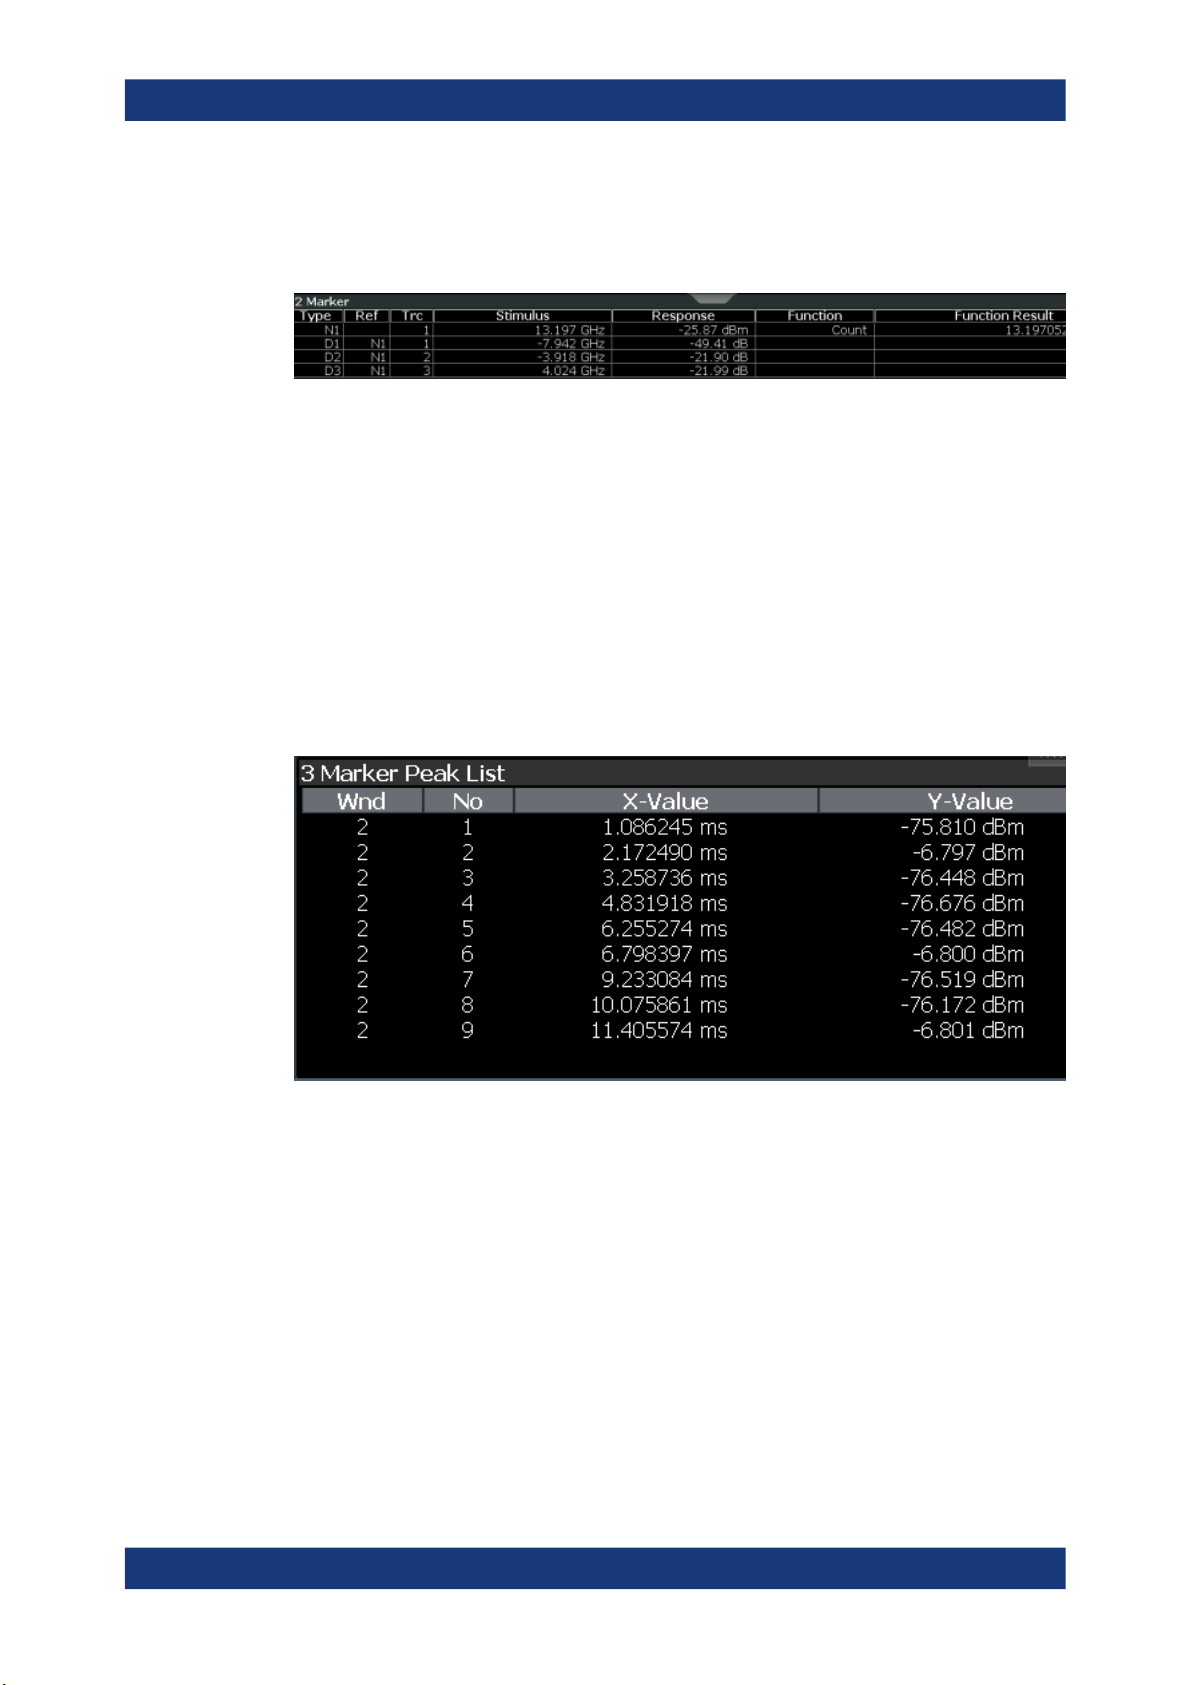
Marker Table
Displays a table with the current marker values for the active markers.
This table is displayed automatically if configured accordingly.
Tip: To navigate within long marker tables, simply scroll through the entries with your
finger on the touchscreen.
Remote command:
LAY:ADD? '1',RIGH, MTAB, see LAYout:ADD[:WINDow]? on page 137
Results:
CALCulate<n>:MARKer<m>:X on page 105
CALCulate<n>:MARKer<m>:Y? on page 106
Marker Peak List
The marker peak list determines the frequencies and levels of peaks in the spectrum or
time domain. How many peaks are displayed can be defined, as well as the sort order.
In addition, the detected peaks can be indicated in the diagram. The peak list can also
be exported to a file for analysis in an external application.
Tip: To navigate within long marker peak lists, simply scroll through the entries with
your finger on the touchscreen.
Remote command:
LAY:ADD? '1',RIGH, PEAK, see LAYout:ADD[:WINDow]? on page 137
Results:
CALCulate<n>:MARKer<m>:X on page 105
CALCulate<n>:MARKer<m>:Y? on page 106
16User Manual 1177.6317.02 ─ 08

R&S®ESW
Basics on I/Q data acquisition and processing
Increasing measurement sensitivity (or avoiding an input mixer overload)
4 Basics on I/Q data acquisition and process-
ing
Some background knowledge on basic terms and principles used when describing I/Q
data acquisition on the R&S ESW in general, and in the I/Q Analyzer application in particular, is provided here for a better understanding of the required configuration settings.
The I/Q Analyzer provides various possibilities to acquire the I/Q data to be analyzed:
●
Capturing analog I/Q data from the "RF Input" connector
●
Capturing digital I/Q data from the optional Digital Baseband Interface
●
Importing I/Q data from a file
Background information for all these scenarios and more is provided in the following
sections.
● Increasing measurement sensitivity (or avoiding an input mixer overload).............17
● Processing analog I/Q data from RF input..............................................................21
● Basics on input from I/Q data files.......................................................................... 23
● Receiving and providing trigger signals.................................................................. 24
● Basics on FFT.........................................................................................................25
4.1 Increasing measurement sensitivity (or avoiding an input mixer overload)
Measurements often confront you with unknown or unintentional signals with unknown
signal levels (and often with pulse characteristics). Such signals can either have very
weak signal levels, in which case you might miss them during the measurement. Or
they can have very strong signal levels, in which case they can damage the input
mixer.
Risk of damage to the input mixer
Do not overload the input mixer.
Overloading the input mixer can damage it. The following topics contain advice on how
to avoid an overload of the input mixer. Read them carefully before applying a signal.
Protecting the input mixer
Always consider how to protect the input mixer from damage when setting up a measurement.
The input mixer of the R&S ESW is equipped with an overload protection mechanism.
If you apply a signal whose power exceeds the specified limit (see datasheet), the con-
17User Manual 1177.6317.02 ─ 08

R&S®ESW
Basics on I/Q data acquisition and processing
Increasing measurement sensitivity (or avoiding an input mixer overload)
nection between the RF input and the input mixer is cut off. The R&S ESW displays a
corresponding message in the status display.
Note that pulses have different level characteristics. Refer to the data sheet for more
information on the allowed maximum pulse energy.
The signal level at the input mixer is calculated as follows.
Mixer Level = Input Level - attenuation + gain
RF input protection
The R&S ESW is equipped with an overload protection mechanism. This mechanism
becomes active as soon as the signal level at the input mixer exceeds the specified
limit. It ensures that the connection between RF input and input mixer is cut off.
In this case, you must decrease the level at the RF input connector and then close the
message box. Then measurements are possible again.
● Using the RF attenuator..........................................................................................18
● Using the preamplifier............................................................................................. 19
● Using the preselector.............................................................................................. 19
4.1.1 Using the RF attenuator
The first tool provided by the R&S ESW to control measurement sensitivity is the RF
attenuator.
The RF attenuator is available in all hardware configurations of the R&S ESW.
Attenuation has the following effects on the measurement:
●
High attenuation protects the input mixer: the main purpose of the attenuator is to
protect the input mixer.
●
High attenuation makes sure that the measurement results are reliable (signals
that are stronger than allowed can distort the results)
●
High attenuation helps you to avoid intermodulation
●
High attenuation increases inherent noise (i.e. the noise floor) and thus decreases
measurement sensitivity: if you increase attenuation by 10 dB, the sensitivity is
reduced by 10 dB (in other words: the displayed noise increases by 10 dB)
Depending on the required test setup, a compromise must be found between a high
sensitivity, low intermodulation and input mixer protection. Optimally, let the R&S ESW
determine the ideal attenuation automatically.
You can determine the attenuation automatically with the auto ranging feature in the
receiver application and the auto attenuation feature in the other applications. Determining the attenuation automatically might not necessarily utilize the maximum
dynamic range, but still yields valid and reliable results.
When you select the attenuation manually and are measuring unknown signals, especially DUTs with a high RFI voltage, always select the highest possible attenuation
level before you apply the signal.
18User Manual 1177.6317.02 ─ 08

R&S®ESW
Basics on I/Q data acquisition and processing
Increasing measurement sensitivity (or avoiding an input mixer overload)
If you need a better sensitivity or signal-to-noise ratio, make sure that the applied signal does not exceed the specified limits, before you lower the attenuation.
For further protection of the input mixer, the R&S ESW does not allow you to select
attenuation levels of less than 10 dB unless you explicitly turn on this feature ("10 dB
Minimum Attenuation").
Risk of damage to the input mixer
●
Do not apply a 0 dB attenuation when you measure unknown signals or RFI voltage in combination with an artificial network (LISN).
During phase switching, such test setups generate very strong pulses which can
damage the input mixer.
●
When you allow attenuation of less than 10 dB in combination with auto ranging,
make sure that the signal level at the RF input does not exceed the allowed limits.
Exceeding the limits can damage the input mixer.
4.1.2 Using the preamplifier
The second tool that allows you to control measurement sensitivity is the preamplifier.
In addition to the standard preamplifier available in every R&S ESW, an additional low
noise amplifier is available as an optional component (R&S ESW-B24).
Signal gain has the following effects on the measurement:
●
The preamplifier allows you to detect even weak signals.
●
The preamplifier reduces the noise figure of the R&S ESW and thus increases its
sensitivity. Thus, it is recommended to use the preamplifier for measurements that
require maximum sensitivity.
●
The preamplifier reduces the dynamic range. To perform a measurement using the
maximum dynamic range, turn off the preamplifier.
●
The preamplifier is located after the preselection filters, reducing the risk of overloading the input mixer by strong out-of-band signals.
●
The optional low noise amplifier is located in front of the preselection filters which
increases the measurement sensitivity.
The gain of the preamplifier is automatically considered in the level display. The disadvantage of a lower large-signal immunity (intermodulation) is reduced by the "preselector".
4.1.3 Using the preselector
The "preselector" is another tool to control measurement sensitivity.
19User Manual 1177.6317.02 ─ 08
R&S®ESW
Basics on I/Q data acquisition and processing
Increasing measurement sensitivity (or avoiding an input mixer overload)
Preselection has the following effects on the measurement:
●
Preselection rejects most of the spectral energy which helps to protect the input
mixer and thus makes sure that the measurement results are valid and reliable.
●
Preselection filters out signals that you do not want to be displayed (selectivity) and
thus allows you to analyze only the frequency range you are interested in.
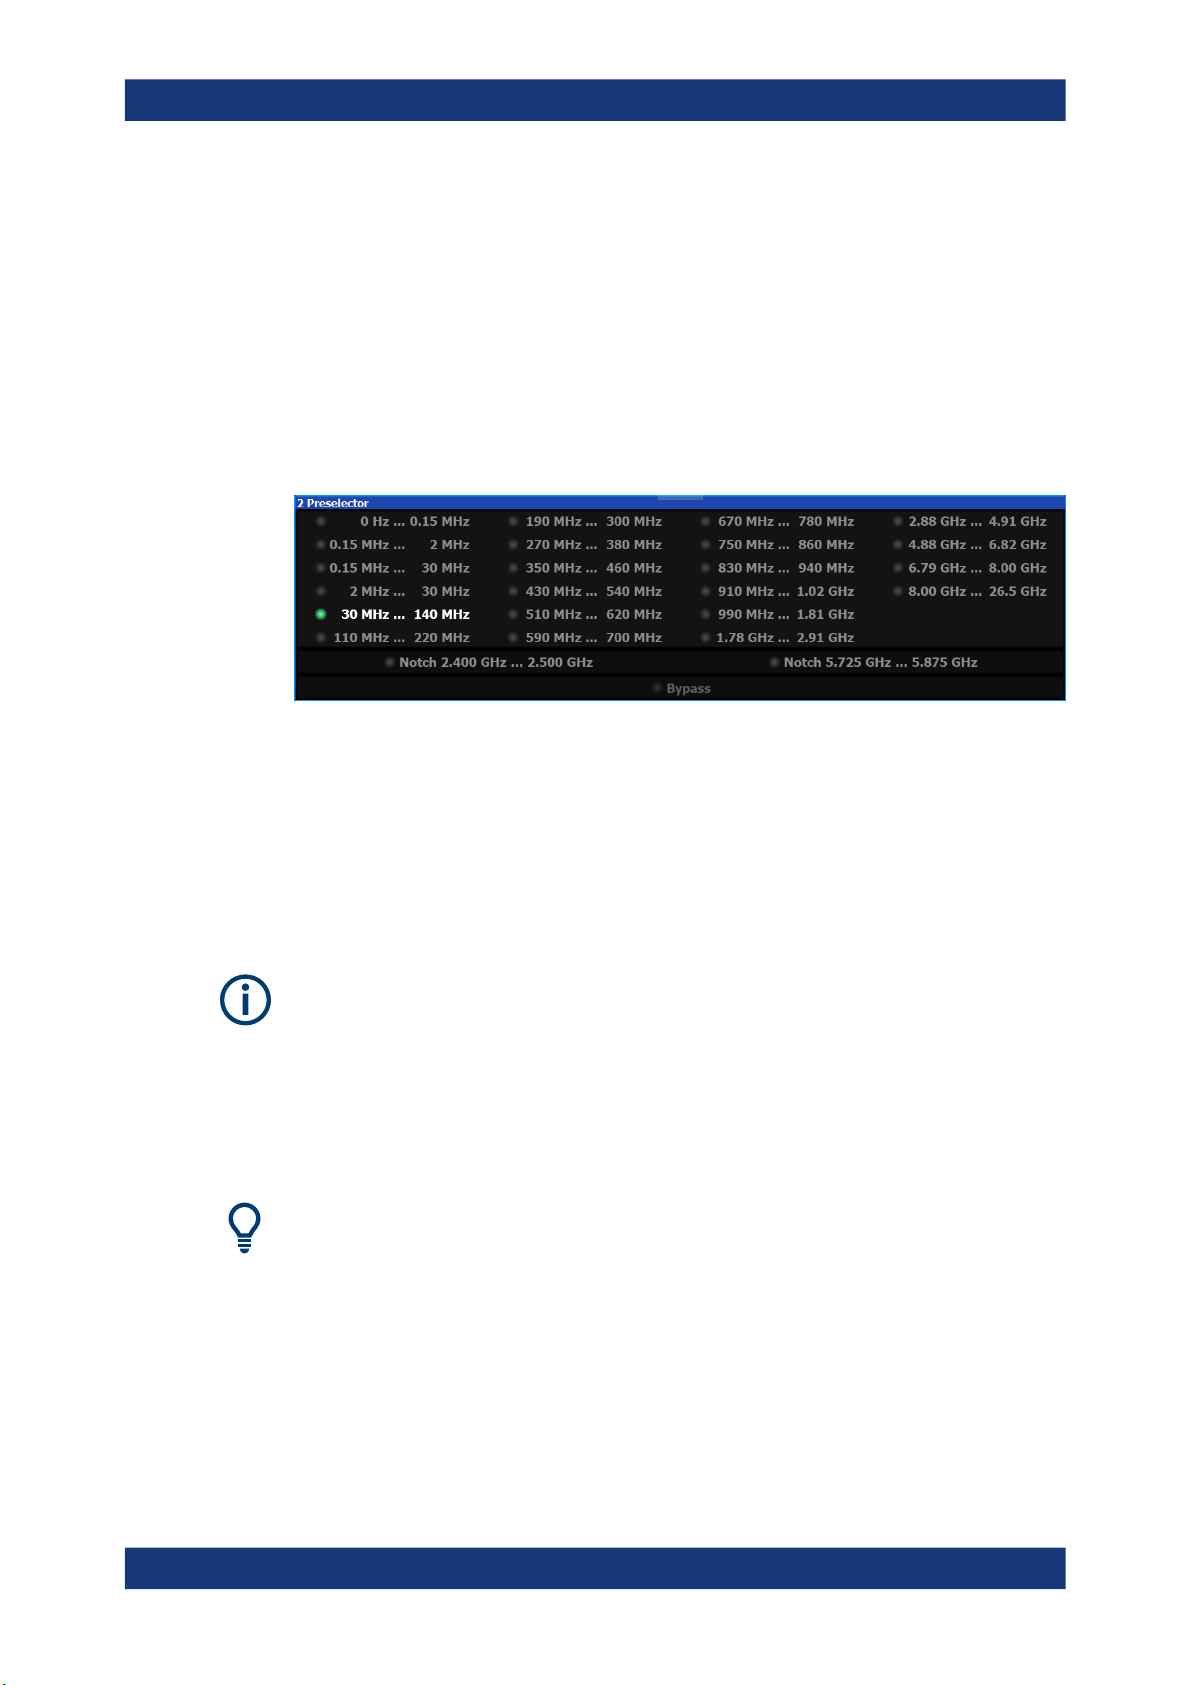
The "preselector" of the R&S ESW consists of several filters which are automatically
applied during measurements. The filter that is used depends on the frequency that is
currently measured. You can see the list of filters and the progress in the "Preselector"
result display. The currently applied filter is indicated by a green LED, filters that are
outside the scan range are ignored.
Figure 4-1: Preselector result display. The green LED indicates the currently applied filter.
In the frequency range from 150
kHz to 30 MHz, you can preselect in a single stage
(150 kHz to 30 MHz). Or, you can split the preselection into two stages, each of which
applies a separate filter: one from 150 kHz to 2 MHz, and another from 2 MHz to
30 MHz.
In addition, the R&S ESW provides several notch filters to suppress certain frequency
ranges completely.
Using the "preselector"
Switching the filters is a mechanical process. Avoid excessive filters switches, because
the hardware can wear out.
Note that results in a frequency band are only displayed if there is at least one valid
measurement point in the corresponding range. If a particular measurement point is
captured by more than one filter, the R&S ESW displays the combined results.
Notch filter
The R&S ESW provides additional notch filters that suppress signals in the frequency
bands from 2.4 GHz to 2.5 GHz and 5.725 GHz to 5.875 GHz.
20User Manual 1177.6317.02 ─ 08

R&S®ESW
Basics on I/Q data acquisition and processing
Processing analog I/Q data from RF input
4.2 Processing analog I/Q data from RF input
Complex baseband data
In the telephone systems of the past, baseband data was transmitted unchanged as an
analog signal. In modern phone systems and in radio communication, however, the
baseband data is modulated on a carrier frequency, which is then transmitted. The
receiver must demodulate the data based on the carrier frequency. When using modern modulation methods (e.g. QPSK, QAM etc.), the baseband signal becomes complex. Complex data (or: I/Q data) consists of an imaginary (I) and a real (Q) component.
Sweep vs sampling
The standard Spectrum application on the R&S ESW performs frequency sweeps on
the input signal and measurements in the frequency and time domain. Other applications on the R&S ESW, such as the I/Q Analyzer, sample and process the individual I
and Q components of the complex signal.
I/Q Analyzer - processing complex data from RF input
The I/Q Analyzer is a standard application used to capture and analyze I/Q data on the
R&S ESW. By default, it assumes the I/Q data is modulated on a carrier frequency and
input via the "RF Input" connector on the R&S ESW.
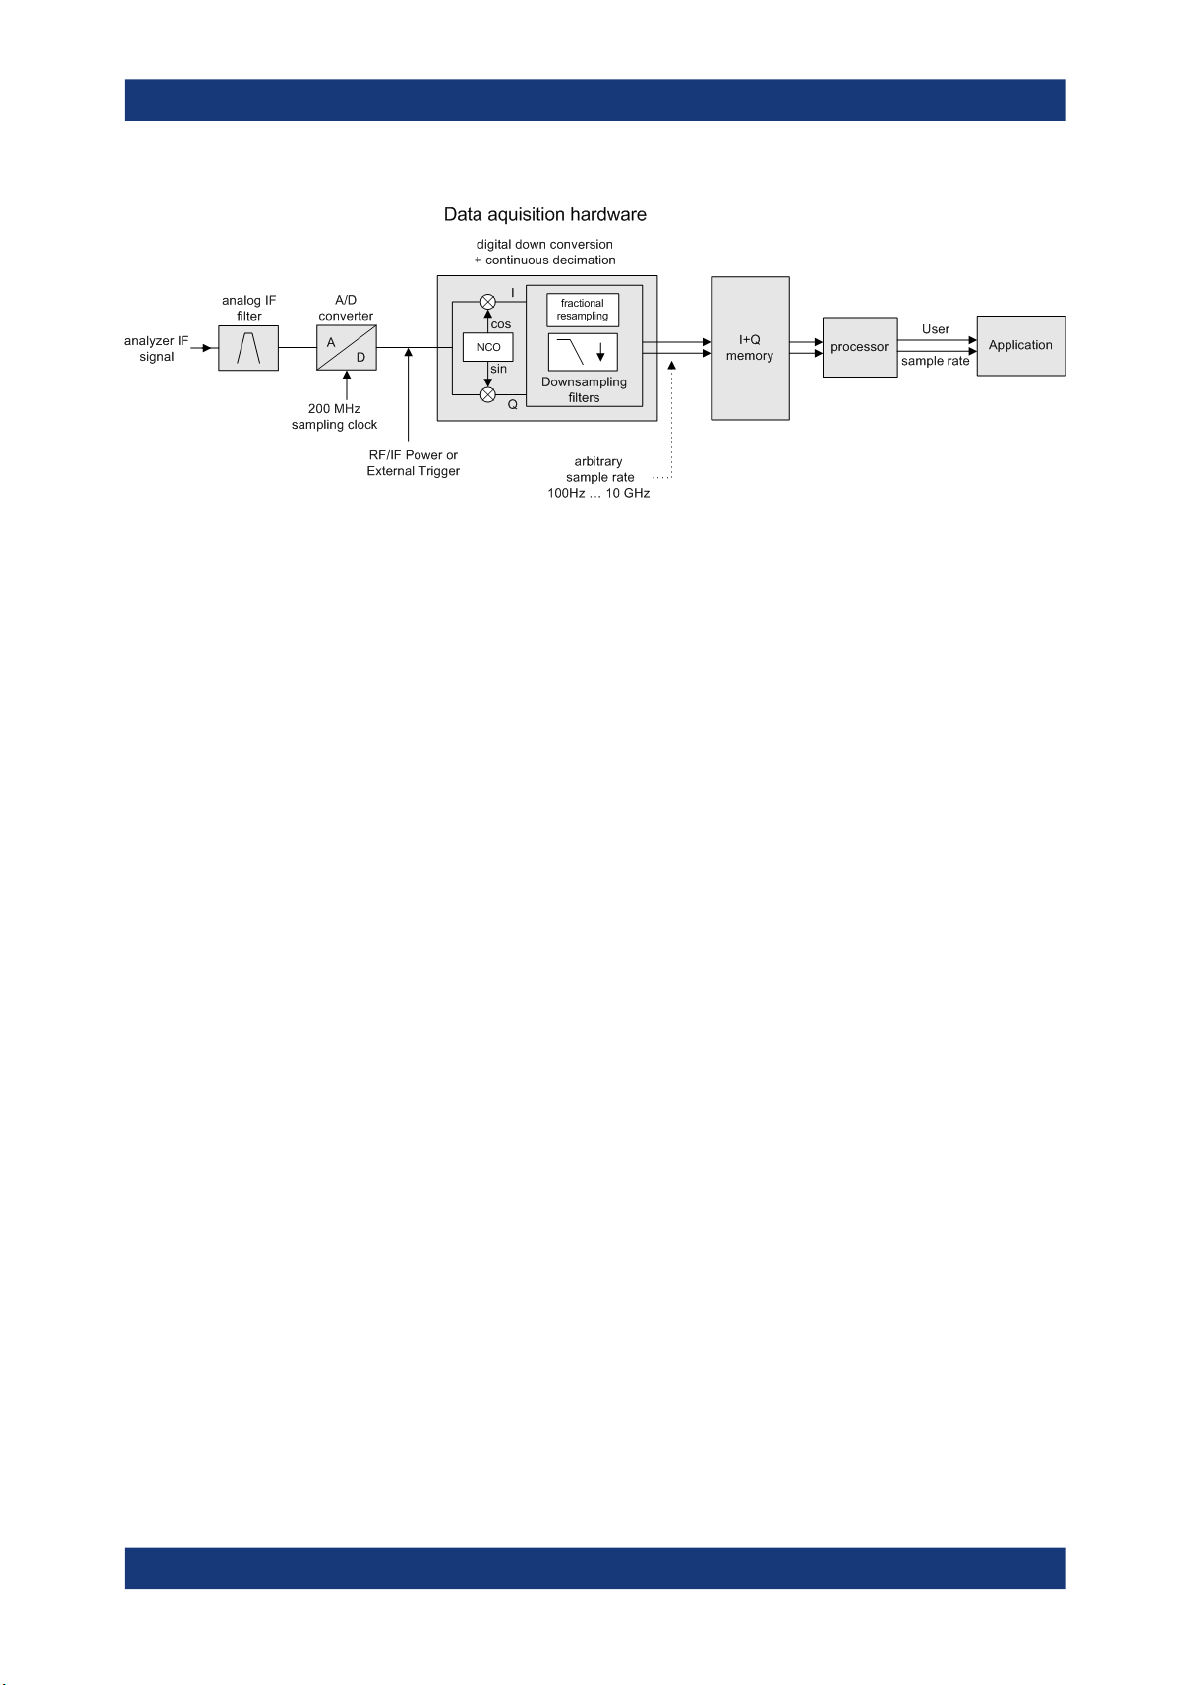
The A/D converter samples the IF signal at a rate of 200 MHz. The digital signal is
down-converted to the complex baseband, lowpass-filtered, and the sample rate is
reduced. The analog filter stages in the analyzer cause a frequency response which
adds to the modulation errors. An equalizer filter before the resampler compensates
for this frequency response. The continuously adjustable sample rates are realized
using an optimal decimation filter and subsequent resampling on the set sample rate.
A dedicated memory (capture buffer) is available in the R&S ESW for a maximum of
400 Msamples (400*1000*1000) of complex samples (pairs of I and Q data). The number of complex samples to be captured can be defined (for restrictions refer to Chap-
ter 4.2.1, "Sample rate and maximum usable I/Q bandwidth for RF input",
on page 22).
The block diagram in Figure 4-2 shows the analyzer hardware from the IF section to
the processor.
21User Manual 1177.6317.02 ─ 08
R&S®ESW
Basics on I/Q data acquisition and processing
Processing analog I/Q data from RF input
Figure 4-2: Block diagram illustrating the R&S ESW signal processing for analog I/Q data
4.2.1 Sample rate and maximum usable I/Q bandwidth for RF input
Definitions
●
Input sample rate (ISR): the sample rate of the useful data provided by the device
connected to the input of the R&S ESW
●
(User, Output) Sample rate (SR): the user-defined sample rate (e.g. in the "Data
Acquisition" dialog box in the "I/Q Analyzer" application) which is used as the basis
for analysis or output
●
Usable I/Q (analysis) bandwidth: the bandwidth range in which the signal
remains undistorted in regard to amplitude characteristic and group delay; this
range can be used for accurate analysis by the R&S ESW
●
Record length: the number of I/Q samples to capture during the specified measurement time; calculated as the measurement time multiplied by the sample rate
For the I/Q data acquisition, digital decimation filters are used internally in the
R&S ESW. The passband of these digital filters determines the maximum usable I/Q
bandwidth. In consequence, signals within the usable I/Q bandwidth (passband)
remain unchanged, while signals outside the usable I/Q bandwidth (passband) are
suppressed. Usually, the suppressed signals are noise, artifacts, and the second IF
sideband. If frequencies of interest to you are also suppressed, try to increase the output sample rate, which increases the maximum usable I/Q bandwidth.
As a rule, the usable I/Q bandwidth is proportional to the output sample rate. Yet, when
the I/Q bandwidth reaches the bandwidth of the analog IF filter (at very high output
sample rates), the curve breaks.
● Relationship between sample rate, record length and usable I/Q bandwidth......... 22
4.2.1.1 Relationship between sample rate, record length and usable I/Q bandwidth
Up to the maximum bandwidth, the following rule applies:
Usable I/Q bandwidth = 0.8 * Output sample rate
22User Manual 1177.6317.02 ─ 08
R&S®ESW
Basics on I/Q data acquisition and processing
Basics on input from I/Q data files
Regarding the record length, the following rule applies:
Record length = Measurement time * sample rate
Maximum record length for RF input
The maximum record length, that is, the maximum number of samples that can be captured, depends on the sample rate.
Table 4-1: Maximum record length
Sample rate Maximum record length
100 Hz to 200 MHz 440 Msamples
200 MHz to 20 GHz
(upsampling)
Usable I/Q
bandwidth [MHz]
90
80
70
60
50
40
30
20
10
20 40 60 80 100 120 140
Figure 4-3: Relationship between maximum usable I/Q bandwidth and output sample rate
220 Msamples
RF input:
BW = 0.80*f
80 MHz bandwidth
out
[…] 10000
Output sample
rate f
[MHz]
out
4.3 Basics on input from I/Q data files
The I/Q data to be evaluated in a particular R&S ESW application can not only be captured by the application itself, it can also be loaded from a file, provided it has the correct format. The file is then used as the input source for the application.
For example, you can capture I/Q data using the I/Q Analyzer application, store it to a
file, and then analyze the signal parameters for that data later using the Pulse application (if available).
The I/Q data must be stored in a format with the file extension .iq.tar. For a detailed
description see Chapter 5.2.3, "I/Q data file format (iq-tar)", on page 39.
23User Manual 1177.6317.02 ─ 08

R&S®ESW
Basics on I/Q data acquisition and processing
Receiving and providing trigger signals
An application note on converting Rohde & Schwarz I/Q data files is available from the
Rohde & Schwarz website:
1EF85: Converting R&S I/Q data files
As opposed to importing data from an I/Q data file using the import functions provided
by some R&S ESW applications, the data is not only stored temporarily in the capture
buffer, where it overwrites the current measurement data and is in turn overwritten by a
new measurement. Instead, the stored I/Q data remains available as input for any
number of subsequent measurements. Furthermore, the (temporary) data import
requires the current measurement settings in the current application to match the settings that were applied when the measurement results were stored (possibly in a different application). When the data is used as an input source, however, the data acquisition settings in the current application (attenuation, center frequency, measurement
bandwidth, sample rate) can be ignored. As a result, these settings cannot be changed
in the current application. Only the measurement time can be decreased, in order to
perform measurements on an extract of the available data (from the beginning of the
file) only.
When using input from an I/Q data file, the [RUN SINGLE] function starts a single measurement (i.e. analysis) of the stored I/Q data, while the [RUN CONT] function repeatedly analyzes the same data from the file.
Pre-trigger and post-trigger samples
In applications that use pre-triggers or post-triggers, if no pre-trigger or post-trigger
samples are specified in the I/Q data file, or too few trigger samples are provided to
satisfy the requirements of the application, the missing pre- or post-trigger values are
filled up with zeros. Superfluous samples in the file are dropped, if necessary. For pretrigger samples, values are filled up or omitted at the beginning of the capture buffer,
for post-trigger samples, values are filled up or omitted at the end of the capture buffer.
4.4 Receiving and providing trigger signals
Using one of the "trigger" connectors of the R&S ESW, the R&S ESW can use a signal
from an external device as a trigger to capture data. Alternatively, the internal trigger
signal used by the R&S ESW can be output for use by other connected devices. Using
the same trigger on several devices is useful to synchronize the transmitted and
received signals within a measurement.
For details on the connectors see the R&S ESW "Getting Started" manual.
External trigger as input
If the trigger signal for the R&S ESW is provided by an external device, the trigger signal source must be connected to the R&S ESW and the trigger source must be defined
as "External" in the R&S ESW.
24User Manual 1177.6317.02 ─ 08
R&S®ESW
Basics on I/Q data acquisition and processing
Basics on FFT
Trigger output
The R&S ESW can provide output to another device either to pass on the internal trigger signal, or to indicate that the R&S ESW itself is ready to trigger.
The trigger signal can be output by the R&S ESW automatically, or manually by the
user. If it is provided automatically, a high signal is output when the R&S ESW has triggered due to a sweep start ("Device Triggered"), or when the R&S ESW is ready to
receive a trigger signal after a sweep start ("Trigger Armed").
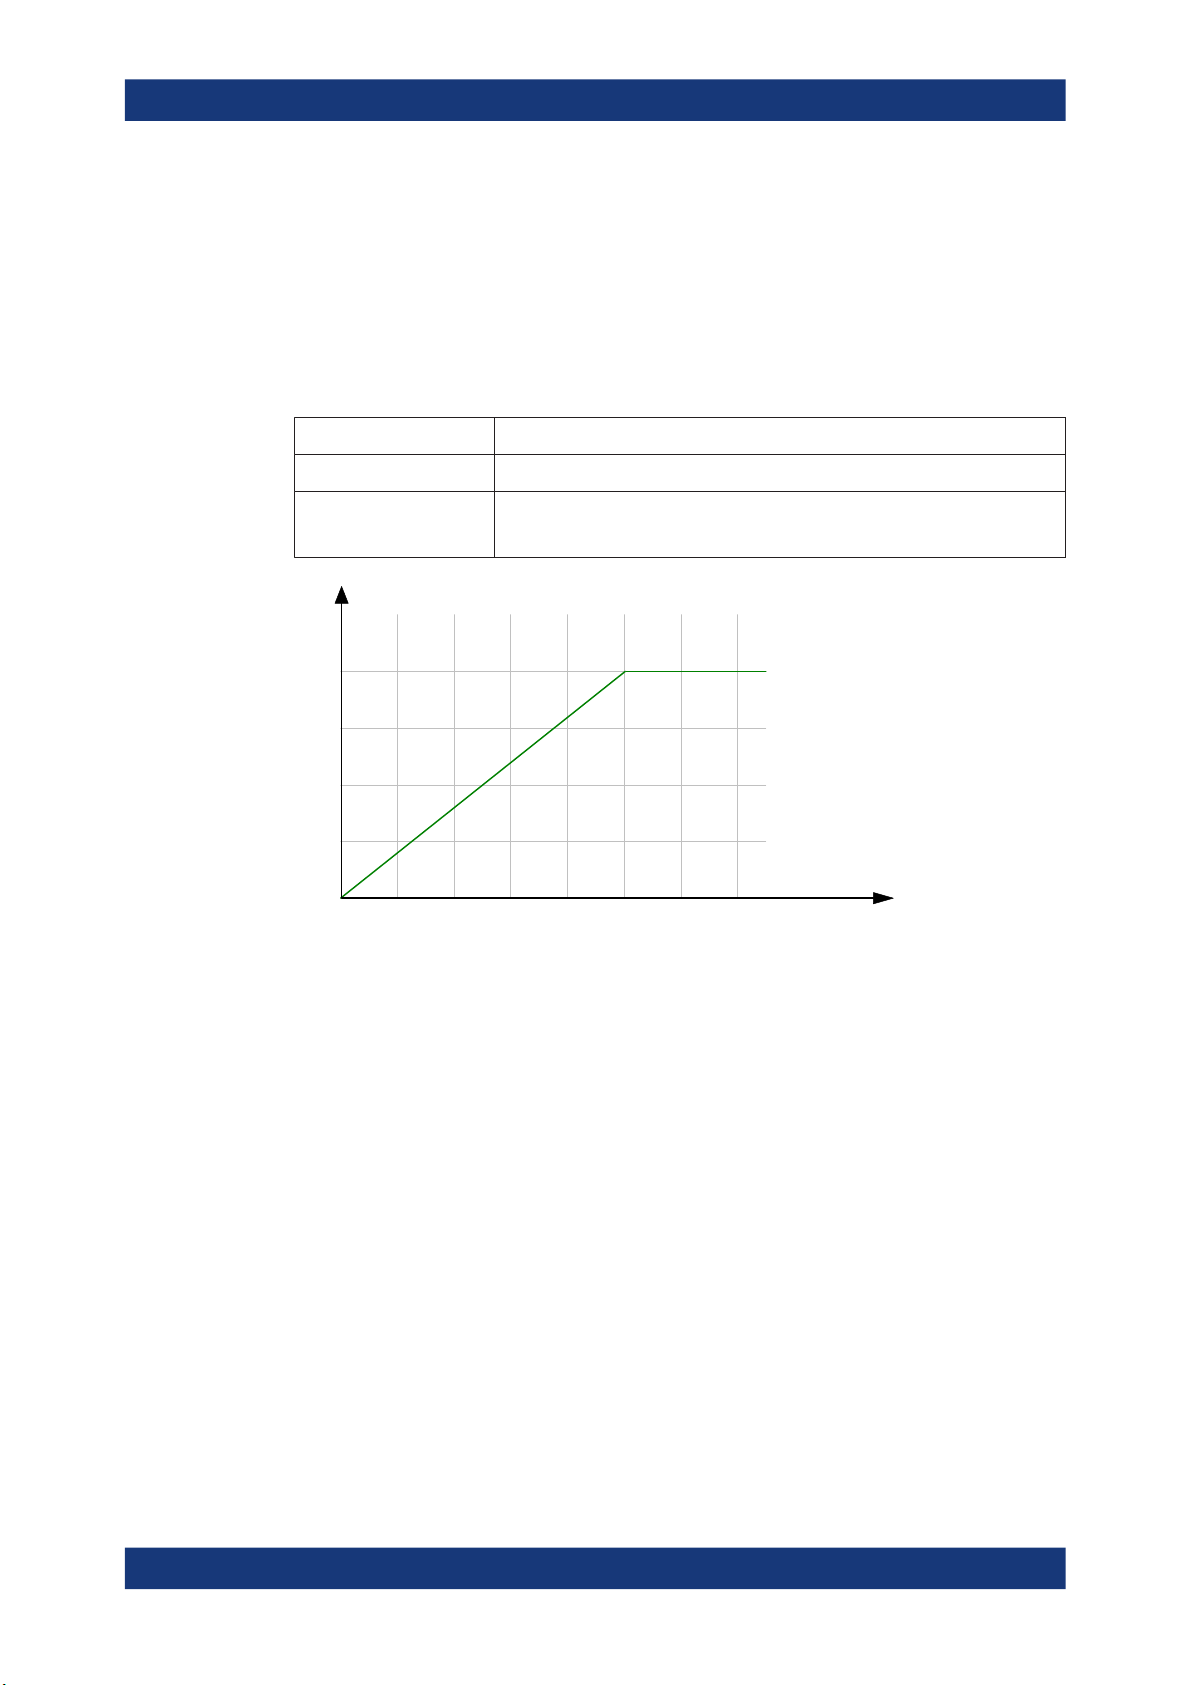
Manual triggering
If the trigger output signal is initiated manually, the length and level (high/low) of the
trigger pulse is also user-definable. Note, however, that the trigger pulse level is always
opposite to the constant signal level defined by the output "Level" setting, e.g. for
"Level" = "High", a constant high signal is output to the connector until the "Send Trigger" button is selected. Then, a low pulse is provided.
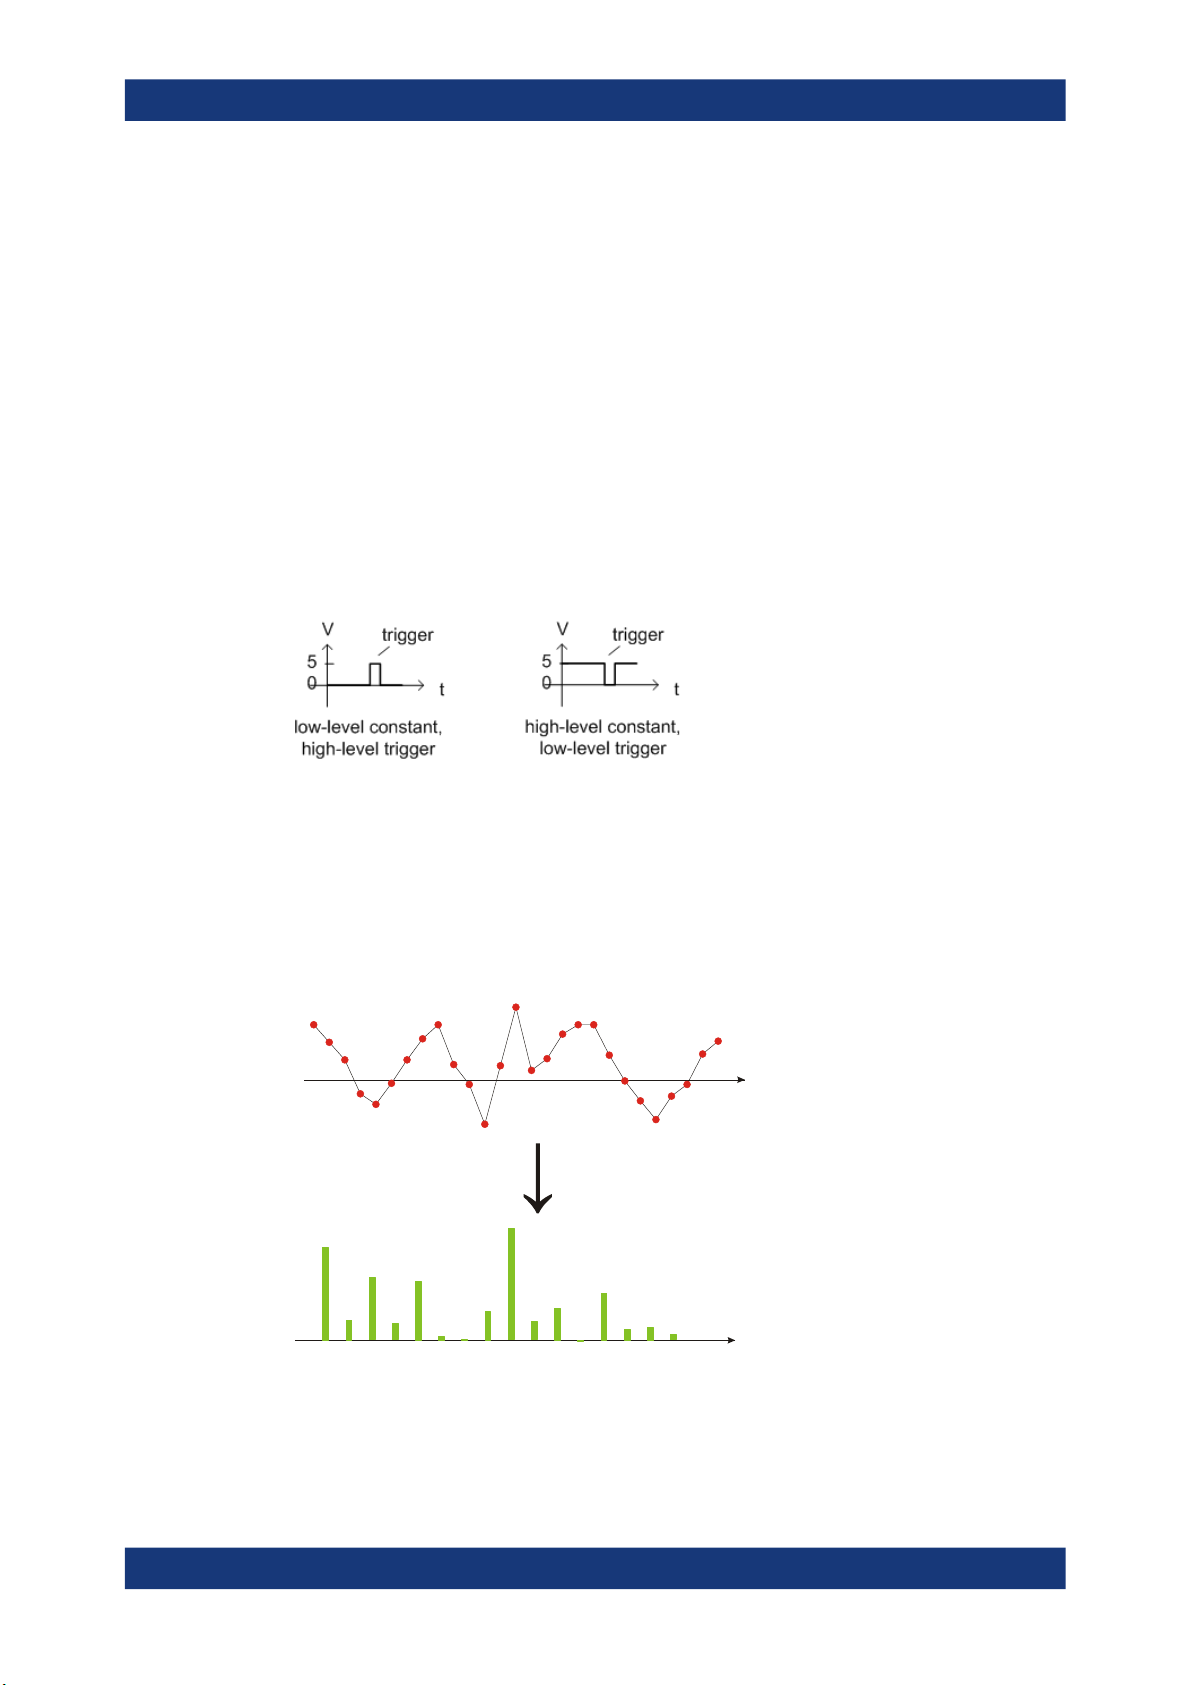
4.5 Basics on FFT
The I/Q Analyzer measures the power of the signal input over time. To convert the time
domain signal to a frequency spectrum, an FFT (Fast Fourier Transformation) is performed which converts a vector of input values into a discrete spectrum of frequencies.
t[s]
FFT
f[Hz]
25User Manual 1177.6317.02 ─ 08

R&S®ESW
Basics on I/Q data acquisition and processing
Basics on FFT
4.5.1 Window functions
The Fourier transformation is not performed on the entire captured data in one step.
Only a limited number of samples is used to calculate an individual result. This process
is called windowing.
After sampling in the time domain, each window is multiplied with a specific window
function. Windowing helps minimize the discontinuities at the end of the measured signal interval and thus reduces the effect of spectral leakage, increasing the frequency
resolution.
Various different window functions are provided in the R&S ESW to suit different input
signals. Each of the window functions has specific characteristics, including some
advantages and some trade-offs. Consider these characteristics to find the optimum
solution for the measurement task.
Ignoring the window function - rectangular window
The rectangular window function is in effect not a function at all, it maintains the original sampled data. This may be useful to minimize the required bandwidth. However, be
aware that if the window does not contain exactly one period of your signal, heavy
sidelobes may occur, which do not exist in the original signal.
Table 4-2: Characteristics of typical FFT window functions
Window type Frequency
Rectangular Best Worst Worst No function applied.
Blackman-Harris
(default)
Gauss (Alpha
= 0.4)
Flattop Worst Best Good Accurate single tone measurements
5-Term Good Good Best Measurements with very high
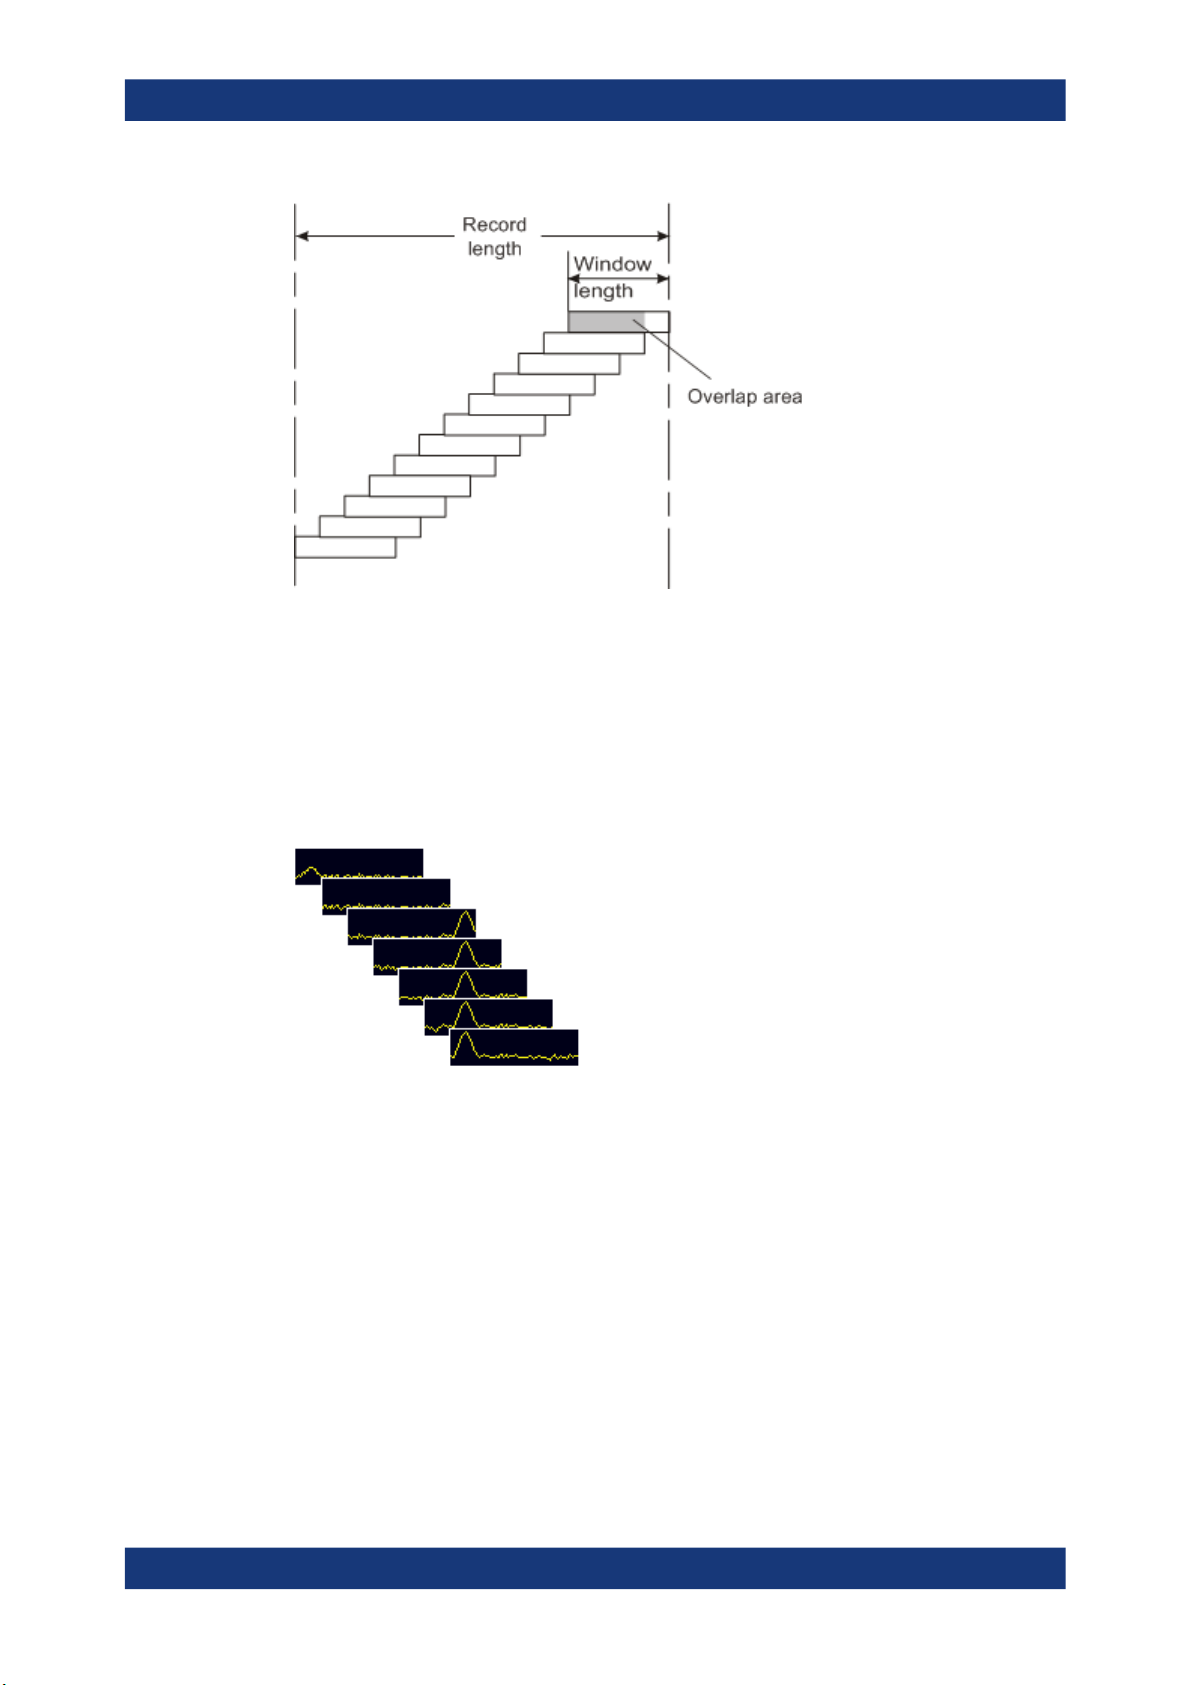
4.5.2 Overlapping
The I/Q Analyzer calculates multiple FFTs per measurement by dividing one captured
record into several windows. Furthermore, the I/Q Analyzer allows consecutive windows to overlap. Overlapping "reuses" samples that were already used to calculate the
preceding FFT result.
Magnitude
resolution
Good Good Good Harmonic detection and spurious
Good Good Good Weak signals and short duration
resolution
Sidelobe suppression
Measurement recommendation
Separation of two tones with almost
equal amplitudes and a small frequency distance
emission detection
dynamic range
26User Manual 1177.6317.02 ─ 08
R&S®ESW
Basics on I/Q data acquisition and processing
Basics on FFT
In advanced FFT mode with averaging, the overlapping factor can be set freely. The
higher the overlap factor, the more windows are used. This leads to more individual
results and improves detection of transient signal effects. However, it also extends the
duration of the calculation. The size of the window can be defined manually according
to the record length, the overlap factor, and the FFT length.
An FFT overlap of 67%, for example, means the second FFT calculation uses the last
67% of the data of the first FFT. It uses only 33% new data. The third FFT still covers
33% of the first FFT and 67% of the second FFT, and so on.
Figure 4-4: Overlapping FFTs
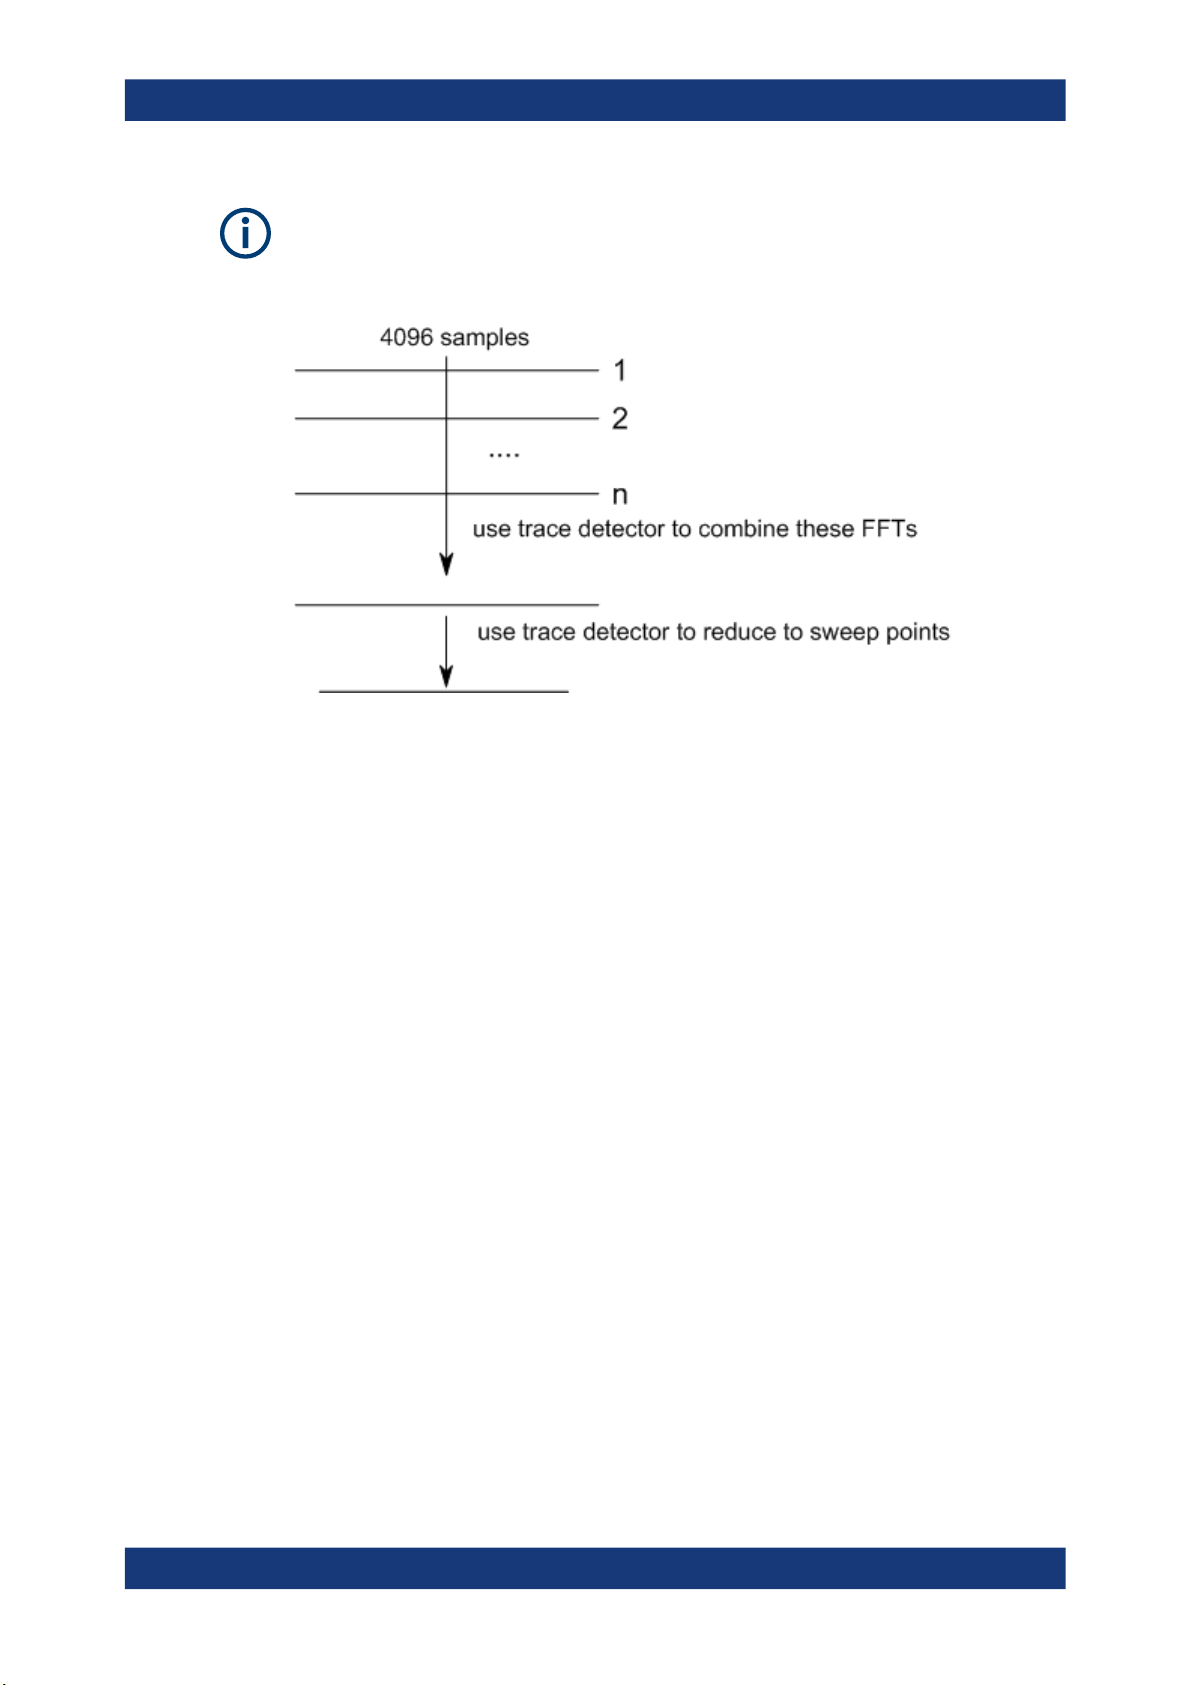
In "Manual" or "Auto" FFT mode, an FFT length of 4096 and a window length of 4096
(or the record length, if shorter) is used to calculate the spectrum.
Combining results - trace detector
If the record length permits, multiple overlapping windows are calculated and combined
to create the final spectrum using the selected trace detector. If necessary, the trace
detector is also used to reduce the number of calculated frequency points (defined by
the FFT length) to the defined number of sweep points. By default, the Autopeak trace
detector is used.
27User Manual 1177.6317.02 ─ 08
R&S®ESW
Basics on I/Q data acquisition and processing
Basics on FFT
Since the frequency points are reduced to the number of sweep points, using a detector other than "Auto Peak" and fewer than 4096 sweep points can lead to false level
results.
4.5.3 Dependencies between FFT parameters
FFT analysis in the R&S ESW is highly configurable. Several parameters, including the
resolution bandwidth, record length, and FFT length, are user-definable. Note, however, that several parameters are correlated and not all can be configured independently of the others.
Record Length
Defines the number of I/Q samples to capture. By default, the number of sweep points
is used. The record length is calculated as the measurement time multiplied by the
sample rate.
If you change the record length, the Meas Time is automatically changed, as well.
For FFTs using only a single window ("Single" mode), the record length (which is then
identical to the FFT length) must not exceed 512k.
FFT Length
Defines the number of frequency points determined by each FFT calculation. The more
points are used, the higher the resolution in the spectrum becomes, but the longer the
calculation takes.
In "Auto" or "Manual" mode, an FFT length of 4096 is used.
If the FFT length is longer than the Window Length the sample data is filled up with
zeros up to the FFT length. The FFT is then performed using interpolated frequency
points.
For an FFT length that is not a power of 2, a DFT (discrete Fourier transform) is performed, which requires more time for calculation, but avoids the effects of interpolation.
28User Manual 1177.6317.02 ─ 08

R&S®ESW
LengthWindow
RateSample
BandwidthNormalizedRBW
3
RateSample*BandwidthNormalized
RBW
max
LengthcordRe,4096min
RateSampleBandwidth*Normalized
RBW
min
Basics on I/Q data acquisition and processing
Basics on FFT
To display all calculated frequency points (defined by the FFT length), the number of
sweep points is set to the FFT length automatically in advanced FFT mode.
Window Length
Defines the number of samples to be included in a single window in averaging mode.
(In single mode, the window length corresponds to the "Record Length" on page 65.)
Values from 3 to 4096 are available in "Manual" mode; in "Advanced" FFT mode, values from 3 to 524288 are available. However, the window length must not be longer
than the FFT Length.
If the window length is shorter than the FFT Length, the sample data is filled up with
zeros up to the FFT length.
If the window length is longer than the Record Length (that is, not enough samples are
available), a window length the size of the Record Length is used for calculation.
The window length and the Window Overlap determine how many FFT calculations
must be performed for each record in averaging mode (see "Transformation Algorithm"
on page 66).
4.5.4 Frequency resolution of FFT results - RBW
The resolution bandwidth defines the minimum frequency separation at which the
individual components of a spectrum can be distinguished. Small values result in high
precision, as the distance between two distinguishable frequencies is small. Higher values decrease the precision, but increase measurement speed.
The RBW is determined by the following equation:
Equation 4-1: Definition of RBW
(Note: The normalized bandwidth is a fixed value that takes the noise bandwidth of the
window function into consideration.)
The maximum RBW is restricted by the Analysis Bandwidth, or by the following equation, whichever is higher:
If a higher spectral resolution is required, the number of samples must be increased by
using a higher sample rate or longer record length.
The minimum achievable RBW depends on the sample rate and record length, according to the following equation:
29User Manual 1177.6317.02 ─ 08

R&S®ESW
Basics on I/Q data acquisition and processing
Basics on FFT
To simplify operation, some parameters are coupled and automatically calculated, such
as record length and RBW.
RBW mode
Depending on the selected RBW mode, the resolution bandwidth is either determined
automatically or can be defined manually.
Auto mode:
This is the default mode in the I/Q Analyzer. The RBW is determined automatically
depending on the Sample Rate and Window Length, where the window length corresponds to the Record Length, or a maximum of 4096.
If the record length is larger than the window length, multiple windows are combined;
the FFT length is 4096.
A Flatop window function is used.
Manual mode:
The RBW is user-definable.
The Window Length is adapted to comply with Equation 4-1. Since only window
lengths with integer values can be employed, the Sample Rate is adapted, if necessary, to obtain an integer window length value.
If the record length is larger than the window length, multiple windows are combined;
the FFT length is 4096.
A Flatop window function is used.
Advanced FFT mode
The RBW is determined by the advanced FFT parameters, depending on the selected
FFT calculation methods method.
4.5.5 FFT calculation methods
FFT calculation can be performed using different methods.
Single
In single mode, one FFT is calculated for the entire record length, that means the window length is identical to the record length.
If the defined FFT Length is larger than the record length, zeros are appended to the
captured data to reach the FFT length.
30User Manual 1177.6317.02 ─ 08
 Loading...