

Page 1

R&S®FSMR3-K7
AM/FM/PM Modulation Analysis
User Manual
(;ÝÁ_2)
1179514702
Version 02
Page 2

This document describes the following R&S®FSMR3000 models:
●
R&S®FSMR3008 (1345.4004K08)
●
R&S®FSMR3026 (1345.4004K26)
●
R&S®FSMR3050 (1345.4004K50)
The contents of this manual correspond to firmware version 1.10 and higher.
The following firmware options are described:
●
R&S FSMR3-K7 (1345.3389.02)
© 2022 Rohde & Schwarz GmbH & Co. KG
Muehldorfstr. 15, 81671 Muenchen, Germany
Phone: +49 89 41 29 - 0
Email: info@rohde-schwarz.com
Internet: www.rohde-schwarz.com
Subject to change – data without tolerance limits is not binding.
R&S® is a registered trademark of Rohde & Schwarz GmbH & Co. KG.
Trade names are trademarks of the owners.
1179.5147.02 | Version 02 | R&S®FSMR3-K7
Throughout this manual, products from Rohde & Schwarz are indicated without the ® symbol, e.g. R&S®FSMR3 is indicated as
R&S FSMR3.
Page 3

R&S®FSMR3-K7
1 Documentation overview.......................................................................9
1.1 Getting started manual................................................................................................. 9
1.2 User manuals and help.................................................................................................9
1.3 Service manual..............................................................................................................9
1.4 Instrument security procedures................................................................................ 10
1.5 Printed safety instructions.........................................................................................10
1.6 Data sheets and brochures........................................................................................ 10
1.7 Release notes and open-source acknowledgment (OSA).......................................10
1.8 Application notes, application cards, white papers, etc......................................... 10
2 Welcome to the R&S FSMR3000 Analog Demodulation application
Contents
Contents
............................................................................................................... 11
2.1 Starting Analog Demodulation...................................................................................11
2.2 Understanding the display information.................................................................... 12
3 Measurements and result displays.................................................... 15
4 Measurement basics............................................................................26
4.1 Demodulation process............................................................................................... 26
4.2 Demodulation bandwidth........................................................................................... 28
4.3 Sample rate and demodulation bandwidth...............................................................28
4.4 AF filters.......................................................................................................................29
4.5 Time domain zoom......................................................................................................29
5 Configuration........................................................................................32
5.1 Configuration overview.............................................................................................. 32
5.2 Configuration according to standards......................................................................34
5.3 Input and frontend settings........................................................................................36
5.3.1 Settings for input from I/Q data files..............................................................................36
5.3.2 Amplitude settings.........................................................................................................37
5.3.3 Frequency..................................................................................................................... 40
5.4 Trigger configuration..................................................................................................41
5.4.1 Trigger source settings..................................................................................................41
5.5 Data acquisition.......................................................................................................... 43
3User Manual 1179.5147.02 ─ 02
Page 4

R&S®FSMR3-K7
5.5.1 Bandwidth settings........................................................................................................ 43
5.5.2 Sweep settings..............................................................................................................45
5.6 Demodulation display.................................................................................................48
5.7 Demodulation.............................................................................................................. 48
5.7.1 Basic demodulation measurement parameters (Demod)..............................................48
5.7.2 Demodulation spectrum................................................................................................ 51
5.7.2.1 AF evaluation................................................................................................................ 52
5.7.2.2 RF evaluation................................................................................................................ 53
5.7.3 AF filter..........................................................................................................................54
5.7.4 Scaling.......................................................................................................................... 57
5.7.4.1 AF evaluation................................................................................................................ 58
5.7.4.2 RF evaluation................................................................................................................ 60
5.7.5 Units.............................................................................................................................. 61
Contents
5.7.6 Result table settings......................................................................................................62
5.7.7 Settling time.................................................................................................................. 64
5.8 Adjusting settings automatically...............................................................................66
6 Analysis................................................................................................ 69
6.1 Trace settings..............................................................................................................69
6.2 Spectrogram settings................................................................................................. 72
6.2.1 General spectrogram settings....................................................................................... 73
6.2.2 Color map settings........................................................................................................ 75
6.3 Trace / data export configuration.............................................................................. 76
6.4 Working with markers in the R&S FSMR3000 Analog Demodulation application
...................................................................................................................................... 79
6.4.1 Marker settings..............................................................................................................79
6.4.1.1 Individual marker setup................................................................................................. 80
6.4.1.2 General marker settings................................................................................................82
6.4.2 Marker search settings and positioning functions......................................................... 85
6.4.2.1 Marker search settings..................................................................................................85
6.4.2.2 Positioning functions..................................................................................................... 86
6.4.3 Marker search settings for spectrograms......................................................................87
6.4.4 Marker function configuration........................................................................................90
6.4.4.1 Measuring characteristic bandwidths (n db down marker)............................................91
4User Manual 1179.5147.02 ─ 02
Page 5

R&S®FSMR3-K7
6.4.4.2 Phase noise measurement marker............................................................................... 92
6.4.4.3 Marker peak list.............................................................................................................95
6.4.4.4 Deactivating all marker functions.................................................................................. 99
7 I/Q data import and export................................................................ 100
8 How to perform measurements in the R&S FSMR3000 Analog
8.1 How to export trace data and numerical results.................................................... 102
9 Measurement example: demodulating an FM signal...................... 103
10 Optimizing and troubleshooting the measurement........................ 108
11 Remote commands for Analog Demodulation................................109
11.1 Introduction............................................................................................................... 110
Contents
Demodulation application................................................................. 101
11.1.1 Conventions used in descriptions................................................................................110
11.1.2 Long and short form.....................................................................................................111
11.1.3 Numeric suffixes.......................................................................................................... 111
11.1.4 Optional keywords.......................................................................................................112
11.1.5 Alternative keywords................................................................................................... 112
11.1.6 SCPI parameters.........................................................................................................112
11.1.6.1 Numeric values............................................................................................................113
11.1.6.2 Boolean....................................................................................................................... 113
11.1.6.3 Character data.............................................................................................................114
11.1.6.4 Character strings......................................................................................................... 114
11.1.6.5 Block data....................................................................................................................114
11.2 Common suffixes...................................................................................................... 115
11.3 Activating analog modulation analysis...................................................................115
11.4 Configuring the measurement................................................................................. 118
11.4.1 Managing standard settings........................................................................................ 119
11.4.2 Configuring the input................................................................................................... 120
11.4.2.1 RF input.......................................................................................................................120
11.4.2.2 Configuring file input................................................................................................... 123
11.4.2.3 External generator control...........................................................................................124
Measurement configuration.........................................................................................124
Interface configuration.................................................................................................127
5User Manual 1179.5147.02 ─ 02
Page 6

R&S®FSMR3-K7
11.4.3 Configuring the output.................................................................................................131
11.4.4 Frequency settings......................................................................................................134
11.4.5 Configuring the vertical axis (amplitude, scaling)........................................................136
11.4.5.1 Amplitude settings.......................................................................................................136
11.4.5.2 Configuring the attenuation......................................................................................... 137
11.4.5.3 Configuring a preamplifier........................................................................................... 139
11.4.5.4 Scaling the Y-axis........................................................................................................140
11.4.6 Configuring data acquisition........................................................................................143
11.4.7 Triggering.................................................................................................................... 147
11.4.7.1 Configuring the triggering conditions...........................................................................147
11.4.7.2 Configuring the trigger output......................................................................................152
11.4.8 Configuring demodulation........................................................................................... 154
Contents
Source calibration....................................................................................................... 129
11.4.8.1 Basic demodulation settings....................................................................................... 155
11.4.8.2 Time domain zoom settings........................................................................................ 157
11.4.8.3 Configuring the demodulation spectrum..................................................................... 159
AF evaluation.............................................................................................................. 159
RF evaluation.............................................................................................................. 161
11.4.8.4 (Post-processing) AF filters.........................................................................................162
11.4.8.5 Defining the scaling and units..................................................................................... 167
11.4.8.6 Scaling for AF evaluation............................................................................................ 167
11.4.8.7 Scaling for RF evaluation............................................................................................ 168
11.4.8.8 Units............................................................................................................................ 168
11.4.8.9 Relative demodulation results..................................................................................... 169
11.4.8.10 Settling time................................................................................................................ 172
11.4.9 Adjusting settings automatically.................................................................................. 174
11.5 Capturing data and performing sweeps................................................................. 178
11.6 Configuring the result display................................................................................. 182
11.6.1 General window commands........................................................................................183
11.6.2 Working with windows in the display...........................................................................183
11.7 Retrieving results......................................................................................................190
11.7.1 Retrieving trace results............................................................................................... 191
11.7.2 Exporting trace results................................................................................................ 194
6User Manual 1179.5147.02 ─ 02
Page 7

R&S®FSMR3-K7
11.7.3 Retrieving result summary values............................................................................... 196
11.7.4 Formats for returned values: ASCII format and binary format.................................... 201
11.7.5 Reference: ASCII file export format............................................................................ 201
11.8 Analyzing results...................................................................................................... 202
11.8.1 Configuring spectrograms........................................................................................... 202
11.8.1.1 Configuring a spectrogram measurement...................................................................202
11.8.1.2 Configuring the color map........................................................................................... 207
11.8.2 Configuring standard traces........................................................................................ 209
11.8.3 Working with markers remotely...................................................................................215
11.8.3.1 Setting up individual markers...................................................................................... 216
11.8.3.2 General marker settings..............................................................................................222
11.8.3.3 Marker search (spectrograms).................................................................................... 224
Contents
Using markers............................................................................................................. 225
Using delta markers.................................................................................................... 229
11.8.3.4 Marker search settings................................................................................................234
11.8.3.5 Positioning the marker................................................................................................ 234
Positioning normal markers.........................................................................................235
Positioning delta markers............................................................................................237
11.8.3.6 Configuring special marker functions.......................................................................... 239
Fixed reference marker settings..................................................................................239
Marker peak lists......................................................................................................... 241
N db down marker.......................................................................................................246
Phase noise measurement marker............................................................................. 249
11.8.4 Marker search (spectrograms).................................................................................... 250
11.8.4.1 Using markers............................................................................................................. 250
11.8.4.2 Using delta markers.................................................................................................... 255
11.8.5 Defining limit checks................................................................................................... 259
11.8.5.1 Configuring limit lines.................................................................................................. 260
11.8.5.2 Managing limit lines.....................................................................................................268
11.8.5.3 Checking the results of a limit check...........................................................................271
11.8.5.4 Programming example: using limit lines......................................................................272
Example: configuring limit lines...................................................................................272
Example: performing a limit check.............................................................................. 273
7User Manual 1179.5147.02 ─ 02
Page 8

R&S®FSMR3-K7
11.9 Importing and exporting I/Q data and results........................................................ 275
11.10 Deprecated commands.............................................................................................276
11.11 Programming example............................................................................................. 277
A Predefined standards and settings.................................................. 280
Contents
Annex.................................................................................................. 280
List of Commands (Analog Modulation Analysis).......................... 282
Index....................................................................................................292
8User Manual 1179.5147.02 ─ 02
Page 9

R&S®FSMR3-K7
1 Documentation overview
1.1 Getting started manual
Documentation overview
Service manual
This section provides an overview of the R&S FSMR3 user documentation. Unless
specified otherwise, you find the documents on the R&S FSMR3 product page at:
www.rohde-schwarz.com/product/FSMR3000.html/
Introduces the R&S FSMR3 and describes how to set up and start working with the
product. Includes basic operations, typical measurement examples, and general information, e.g. safety instructions, etc.
A printed version is delivered with the instrument. A PDF version is available for download on the Internet.
1.2 User manuals and help
Separate user manuals are provided for the base unit and the firmware applications:
●
Base unit manual
Contains the description of all instrument modes and functions. It also provides an
introduction to remote control, a complete description of the remote control commands with programming examples, and information on maintenance, instrument
interfaces and error messages.
●
Firmware application manual
Contains the description of the specific functions of a firmware application, including remote control commands. Basic information on operating the R&S FSMR3 is
not included.
The contents of the user manuals are available as help in the R&S FSMR3. The help
offers quick, context-sensitive access to the complete information for the base unit and
the firmware applications.
All user manuals are also available for download or for immediate display on the Internet.
1.3 Service manual
Describes the performance test for checking the rated specifications, module replacement and repair, firmware update, troubleshooting and fault elimination, and contains
mechanical drawings and spare part lists.
The service manual is available for registered users on the global Rohde & Schwarz
information system (GLORIS):
9User Manual 1179.5147.02 ─ 02
Page 10

R&S®FSMR3-K7
1.4 Instrument security procedures
1.5 Printed safety instructions
1.6 Data sheets and brochures
Documentation overview
Application notes, application cards, white papers, etc.
Deals with security issues when working with the R&S FSMR3 in secure areas. It is
available for download on the Internet.
Provides safety information in many languages. The printed document is delivered with
the product.
The data sheet contains the technical specifications of the R&S FSMR3. It also lists the
firmware applications and their order numbers, and optional accessories.
The brochure provides an overview of the instrument and deals with the specific characteristics.
See www.rohde-schwarz.com/brochure-datasheet/FSMR3000/
1.7 Release notes and open-source acknowledgment (OSA)
The release notes list new features, improvements and known issues of the current
firmware version, and describe the firmware installation.
The open-source acknowledgment document provides verbatim license texts of the
used open source software.
See www.rohde-schwarz.com/firmware/FSMR3000/
1.8 Application notes, application cards, white papers, etc.
These documents deal with special applications or background information on particular topics.
See www.rohde-schwarz.com/application/FSMR3000/
10User Manual 1179.5147.02 ─ 02
Page 11

R&S®FSMR3-K7
2 Welcome to the R&S FSMR3000 Analog
Welcome to the R&S FSMR3000 Analog Demodulation application
Starting Analog Demodulation
Demodulation application
The R&S FSMR3000 Analog Demodulation application features:
●
AM, FM, and PM demodulation, with various result displays:
– Modulation signal versus time
– Spectrum of the modulation signal (FFT)
– RF signal power versus time
– Spectrum of the RF signal
●
Determining maximum, minimum and average or current values in parallel over a
selected number of measurements
●
Maximum accuracy and temperature stability due to sampling (digitization) already
at the IF and digital down-conversion to the baseband (I/Q)
●
Error-free AM to FM conversion and vice versa, without deviation errors, frequency
response or frequency drift at DC coupling
This user manual contains a description of the functionality that the application provides, including remote control operation.
2.1 Starting Analog Demodulation
Analog Demodulation is a separate application on the R&S FSMR3.
To activate Analog Demodulation
1. Select the [MODE] key.
A dialog box opens that contains all operating modes and applications currently
available on your R&S FSMR3.
2. Select the "AM FM PM Analog Demod" item.
The R&S FSMR3 opens a new channel for the application for analog modulation
analysis.
Multiple Channels and Sequencer Function
When you activate an application, a new channel is created which determines the
measurement settings for that application ("Channel"). The same application can be
activated with different measurement settings by creating several "Channel"s for the
same application.
11User Manual 1179.5147.02 ─ 02
Page 12

R&S®FSMR3-K7
2.2 Understanding the display information
Welcome to the R&S FSMR3000 Analog Demodulation application
Understanding the display information
The number of channels that can be configured at the same time depends on the available memory on the instrument.
Only one measurement can be performed at any time, namely the one in the currently
active channel. However, to perform the configured measurements consecutively, a
Sequencer function is provided.
If activated, the measurements configured in the currently defined "Channel"s are performed one after the other in the order of the tabs. The currently active measurement is
indicated by a
symbol in the tab label.
The result displays of the individual channels are updated in the tabs (as well as the
"MultiView") as the measurements are performed. Sequential operation itself is independent of the currently displayed tab.
For details on the Sequencer function, see the R&S FSMR3 User Manual.
The following figure shows a measurement diagram during analog modulation analysis. All different information areas are labeled. They are explained in more detail in the
following sections.
1
2
3
4
5
= Channel bar for firmware and measurement settings
1
2 = Diagram area
3 = Window title bar with diagram-specific (trace) information
4 = Instrument status bar with error messages and date/time display
5 = Diagram footer with diagram-specific information, depending on result display
12User Manual 1179.5147.02 ─ 02
Page 13

R&S®FSMR3-K7
Welcome to the R&S FSMR3000 Analog Demodulation application
Understanding the display information
Channel bar information
In the Analog Modulation Analysis application, the R&S FSMR3 shows the following
settings:
Table 2-1: Information displayed in the channel bar in the application for analog modulation analysis
Ref Level Reference level
m.+el.Att Mechanical and electronic RF attenuation
Offset Reference level offset
AQT Measurement time for data acquisition.
RBW Resolution bandwidth
DBW Demodulation bandwidth
Freq Center frequency for the RF signal
Window title bar information
For each diagram, the header provides the following information:
1 2 345 6 7 8 9
Figure 2-1: Window title bar information in the application for analog modulation analysis
1 = Window number
2 = Window type
3 = Trace color
4 = Trace number
5 = Detector
6 = Trace mode
7 = Reference value (at the defined reference position)
8 = AF coupling (AC/DC), only in AF time domains, if applicable
9 = Results are selected for demodulation output
Diagram footer information
The diagram footer (beneath the diagram) contains the following information, depending on the evaluation:
"RF Spectrum"
CF: Center frequency
of input signal
Sweep points Span: measured span
RF Time domain
CF: Center frequency
of input signal
Sweep points Time per division
13User Manual 1179.5147.02 ─ 02
Page 14

R&S®FSMR3-K7
Welcome to the R&S FSMR3000 Analog Demodulation application
Understanding the display information
AF Spectrum
AF CF: center frequency of demodulated signal
AF Time domain
CF: Center frequency
of input signal
Sweep points AF Span: evaluated span
Sweep points Time per division
For most modes, the number of sweep points shown in the display are indicated in the
diagram footer. In zoom mode, the (rounded) number of currently displayed points are
indicated.
Status bar information
Global instrument settings, the instrument status and any irregularities are indicated in
the status bar beneath the diagram.
Furthermore, the progress of the current operation is displayed in the status bar.
14User Manual 1179.5147.02 ─ 02
Page 15

R&S®FSMR3-K7
3 Measurements and result displays
Measurements and result displays
Access: "Overview" > "Display Config"
Or: [MEAS] > "Display Config"
The data that was measured by the R&S FSMR3 can be evaluated using various different methods. In the Analog Modulation Analysis application, up to six evaluation
methods can be displayed simultaneously in separate windows. The results can be displayed as absolute deviations or relative to a reference value or level.
The abbreviation "AF" (for Audio Frequency) refers to the demodulated AM, FM or PM
signal.
Basis for evaluation
All evaluations are based on the I/Q data set acquired during the measurement. The
spectrum of the modulated signal to be evaluated is determined by the demodulation
bandwidth. However, it can be restricted to a limited span ("AF Span") if only part of the
signal is of interest. Furthermore, the time base for evaluations in the time domain can
be restricted to analyze a smaller extract in more detail, see Chapter 4.5, "Time
domain zoom", on page 29.
AM Time Domain...........................................................................................................15
FM Time Domain...........................................................................................................16
PM Time Domain...........................................................................................................17
AM Spectrum................................................................................................................ 18
FM Spectrum.................................................................................................................19
PM Spectrum................................................................................................................ 20
RF Time Domain...........................................................................................................21
RF Spectrum.................................................................................................................22
Result Summary............................................................................................................23
Marker Table................................................................................................................. 25
Marker Peak List........................................................................................................... 25
AM Time Domain
Displays the modulation depth of the demodulated AM signal (in %) versus time.
15User Manual 1179.5147.02 ─ 02
Page 16

R&S®FSMR3-K7
Measurements and result displays
Remote command:
LAY:ADD? '1',RIGH,'XTIM:AM:REL'
(See LAYout:ADD[:WINDow]? on page 184)
FM Time Domain
Displays the frequency spectrum of the demodulated FM signal versus time.
16User Manual 1179.5147.02 ─ 02
Page 17

R&S®FSMR3-K7
Measurements and result displays
Remote command:
LAY:ADD? '1',RIGH,'XTIM:FM'
(See LAYout:ADD[:WINDow]? on page 184)
PM Time Domain
Displays the phase deviations of the demodulated PM signal (in rad or °) versus time.
17User Manual 1179.5147.02 ─ 02
Page 18

R&S®FSMR3-K7
Measurements and result displays
Remote command:
LAY:ADD? '1',RIGH,'XTIM:PM'
(See LAYout:ADD[:WINDow]? on page 184)
AM Spectrum
Displays the modulation depth of the demodulated AM signal (in % or dB) versus AF
span. The spectrum is calculated from the demodulated AM signal in the time domain
via FFT.
18User Manual 1179.5147.02 ─ 02
Page 19

R&S®FSMR3-K7
Measurements and result displays
Remote command:
LAY:ADD? '1',RIGH,'XTIMe:AM:REL:AFSPectrum1'
(see LAYout:ADD[:WINDow]? on page 184)
FM Spectrum
Displays the frequency deviations of the demodulated FM signal (in Hz or dB) versus
AF span. The spectrum is calculated from the demodulated AM signal in the time
domain via FFT.
19User Manual 1179.5147.02 ─ 02
Page 20

R&S®FSMR3-K7
Measurements and result displays
Remote command:
LAY:ADD? '1',RIGH,'XTIMe:FM:AFSPectrum1'
(see LAYout:ADD[:WINDow]? on page 184)
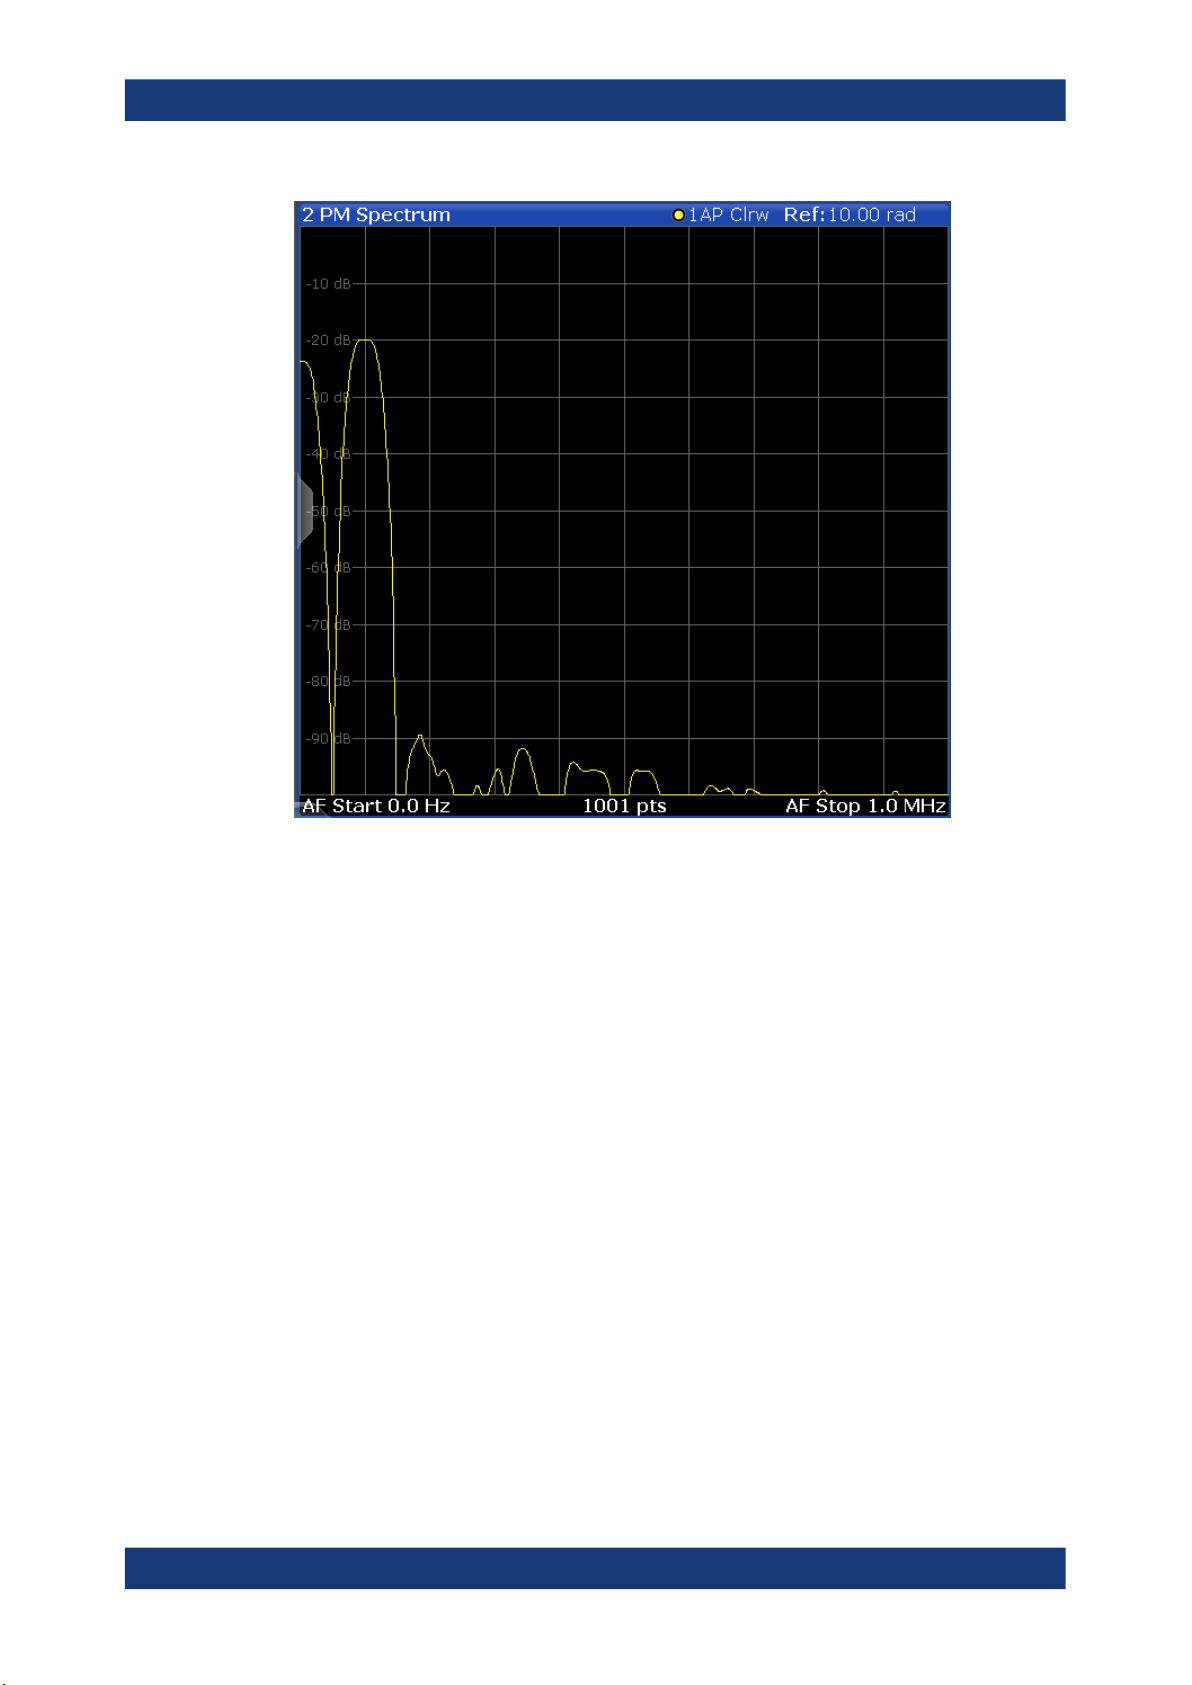
PM Spectrum
Displays the phase deviations of the demodulated PM signal (in rad, ° or dB) versus
AF span. The spectrum is calculated from the demodulated AM signal in the time
domain via FFT.
20User Manual 1179.5147.02 ─ 02
Page 21
R&S®FSMR3-K7
Measurements and result displays
Remote command:
LAY:ADD? '1',RIGH,'XTIMe:PM:AFSPectrum1'
(see LAYout:ADD[:WINDow]? on page 184)
RF Time Domain
Displays the RF power of the input signal versus time. The level values represent the
magnitude of the I/Q data set.
21User Manual 1179.5147.02 ─ 02
Page 22

R&S®FSMR3-K7
Measurements and result displays
Remote command:
LAY:ADD? '1',RIGH,'XTIM:AM'
(see LAYout:ADD[:WINDow]? on page 184)
RF Spectrum
Displays the spectrum of the input signal. In contrast to the Spectrum application, the
frequency values are determined using FFT from the recorded I/Q data set.
22User Manual 1179.5147.02 ─ 02
Page 23

R&S®FSMR3-K7
Measurements and result displays
Remote command:
LAY:ADD? '1',RIGH,'XTIM:SPECTRUM'
(see LAYout:ADD[:WINDow]? on page 184)
Result Summary
The "result summary" displays the results of the demodulation functions for all windows
in a table.
The following general results are provided:
For each demodulation, the following results are provided:
Label Description
"Carr Power" Measured carrier power
"Carr Offset" Carrier offset to nominal center frequency
"Mod. Depth" Modulation depth
23User Manual 1179.5147.02 ─ 02
Page 24

R&S®FSMR3-K7
Measurements and result displays
Table 3-1: Result summary description
Label Description
"+Peak" Positive peak (maximum)
"-Peak" Negative peak (minimum)
"+/-Peak/2" Average of positive and negative peaks
"RMS" Root Mean Square value
"Mod Freq" Modulation frequency
"SINAD" Signal-to-noise-and-distortion
(Calculated only if AF Spectrum is displayed)
Measures the ratio of the total power to the power of noise and harmonic distortions.
The noise and harmonic power is calculated inside the AF spectrum span. The DC
offset is removed before the calculation.
"DISTORT" Modulation distortion in %
(Calculated only if "SINAD" is also calculated)
Measures the distortion of the modulation in relation to the total power of the signal
inside the AF spectrum span. Indicates the quality of the modulation.
"THD" Total harmonic distortion
The ratio of the harmonics to the fundamental and harmonics. All harmonics inside
the AF spectrum span are considered up to the tenth harmonic.
(Calculated only if AF Spectrum is displayed)
Note: Relative demodulation results. Optionally, the demodulation results in relation to
user-defined or measured reference values are determined. See Chapter 5.7.6, "Result
table settings", on page 62.
In addition, the following general information for the input signal is provided:
●
"Carrier Power": the power of the carrier without modulation
●
"Carrier Offset": the deviation of the calculated carrier frequency to the ideal carrier
frequency
●
"Modulation Depth" (AM or "RF Time Domain" only): the difference in amplitude the
carrier signal is modulated with
Remote command:
LAY:ADD? '1',RIGH,RSUM, see LAYout:ADD[:WINDow]? on page 184
Results:
Chapter 11.7.3, "Retrieving result summary values", on page 196
24User Manual 1179.5147.02 ─ 02
Page 25

R&S®FSMR3-K7
Measurements and result displays
Marker Table
Displays a table with the current marker values for the active markers.
This table is displayed automatically if configured accordingly.
Tip: To navigate within long marker tables, simply scroll through the entries with your
finger on the touchscreen.
Remote command:
LAY:ADD? '1',RIGH, MTAB, see LAYout:ADD[:WINDow]? on page 184
Results:
CALCulate<n>:MARKer<m>:X on page 218
CALCulate<n>:MARKer<m>:Y? on page 218
Marker Peak List
The marker peak list determines the frequencies and levels of peaks in the spectrum or
time domain. How many peaks are displayed can be defined, as well as the sort order.
In addition, the detected peaks can be indicated in the diagram. The peak list can also
be exported to a file for analysis in an external application.
Remote command:
LAY:ADD? '1',RIGH, PEAK, see LAYout:ADD[:WINDow]? on page 184
Results:
CALCulate<n>:MARKer<m>:X on page 218
CALCulate<n>:MARKer<m>:Y? on page 218
25User Manual 1179.5147.02 ─ 02
Page 26

R&S®FSMR3-K7
4 Measurement basics
4.1 Demodulation process
Measurement basics
Demodulation process
Some background knowledge on basic terms and principles used in Analog Modulation
Analysis measurements is provided here for a better understanding of the required
configuration settings.
● Demodulation process............................................................................................ 26
● Demodulation bandwidth.........................................................................................28
● Sample rate and demodulation bandwidth..............................................................28
● AF filters..................................................................................................................29
● Time domain zoom..................................................................................................29
The demodulation process is shown in Figure 4-1. All calculations are performed simultaneously with the same I/Q data set. Magnitude (= amplitude) and phase of the complex I/Q pairs are determined. The frequency result is obtained from the differential
phase.
For details on general I/Q data processing in the R&S FSMR3, refer to the reference
part of the I/Q Analysis remote control description in the R&S FSMR3 User Manual.
26User Manual 1179.5147.02 ─ 02
Page 27

R&S®FSMR3-K7
Measurement basics
Demodulation process
Figure 4-1: Block diagram of software demodulator
27User Manual 1179.5147.02 ─ 02
Page 28

R&S®FSMR3-K7
4.2 Demodulation bandwidth
Measurement basics
Sample rate and demodulation bandwidth
The collected measured values are evaluated by the selected detector. The result is
displayed on the screen and can be read out via remote control.
In addition, important parameters are calculated:
●
A counter determines the modulation frequency for AM, FM, and PM.
●
average power = carrier power (RF power)
●
average frequency = carrier frequency offset (FM)
●
The modulation depth or the frequency or phase deviation; the deviations are
determined from the trace data
AC coupling is possible with FM and PM display.
The demodulation bandwidth determines the span of the signal that is demodulated. It
is not the 3-dB bandwidth of the filter, but the useful bandwidth which is distortion-free
regarding phase and amplitude.
Therefore the following formulas apply:
●
AM: demodulation bandwidth ≥ 2 x modulation frequency
●
FM: demodulation bandwidth ≥ 2 x (frequency deviation + modulation frequency)
●
PM: demodulation bandwidth ≥ 2 x modulation frequency x (1 + phase deviation)
If the center frequency of the analyzer is not set exactly to the signal frequency, the
demodulation bandwidth must be increased by the carrier offset, in addition to the
requirement described above. The bandwidth must also be increased if FM or PM AC
coupling is selected.
In general, select the demodulation bandwidth as narrow as possible to improve the
S/N ratio. The residual FM caused by noise floor and phase noise increases dramatically with the bandwidth, especially with FM.
For help on determining the adequate demodulation bandwidth, see "Determining the
demodulation bandwidth" on page 108.
4.3 Sample rate and demodulation bandwidth
The maximum demodulation bandwidths that can be obtained during the measurement, depending on the sample rate, are listed in the tables below for different demodulation filter types. The allowed value range of the measurement time and trigger offset
depends on the selected demodulation bandwidth and demodulation filter. If the AF filter or the AF trigger are not active, the measurement time increases by 20 %.
28User Manual 1179.5147.02 ─ 02
Page 29

R&S®FSMR3-K7
Measurement basics
Time domain zoom
A maximum of 24 million samples can be captured, assuming sufficient memory is
available; thus the maximum measurement time can be determined according to the
following formula:
Meas.time
The minimum trigger offset is (-Meas.time
Large numbers of samples
Principally, the R&S FSMR3 can handle up to 24 million samples. However, when
480001 samples are exceeded, all traces that are not currently being displayed in a
window are deactivated to improve performance. The traces can only be activated
again when the samples are reduced.
Effects of measurement time on the stability of measurement results
Despite amplitude and frequency modulation, the display of carrier power and carrier
frequency offset is stable.
Stability is achieved by a digital filter which sufficiently suppresses the modulation. As
a prerequisite, the measurement time must be ≥ 3 x 1 / modulation frequency, i.e. at
least three periods of the AF signal are recorded.
The mean carrier power for calculating the AM is also calculated with a digital filter.
The filter returns stable results after a measurement time of ≥ 3 x 1 / modulation frequency, i.e. at least three cycles of the AF signal must be recorded before a stable AM
can be shown.
= Sample count
max
/ sample rate
max
max
)
4.4 AF filters
Additional filters applied after demodulation help filter out unwanted signals, or correct
pre-emphasized input signals. A CCITT filter allows you to evaluate the signal by simulating the characteristics of human hearing.
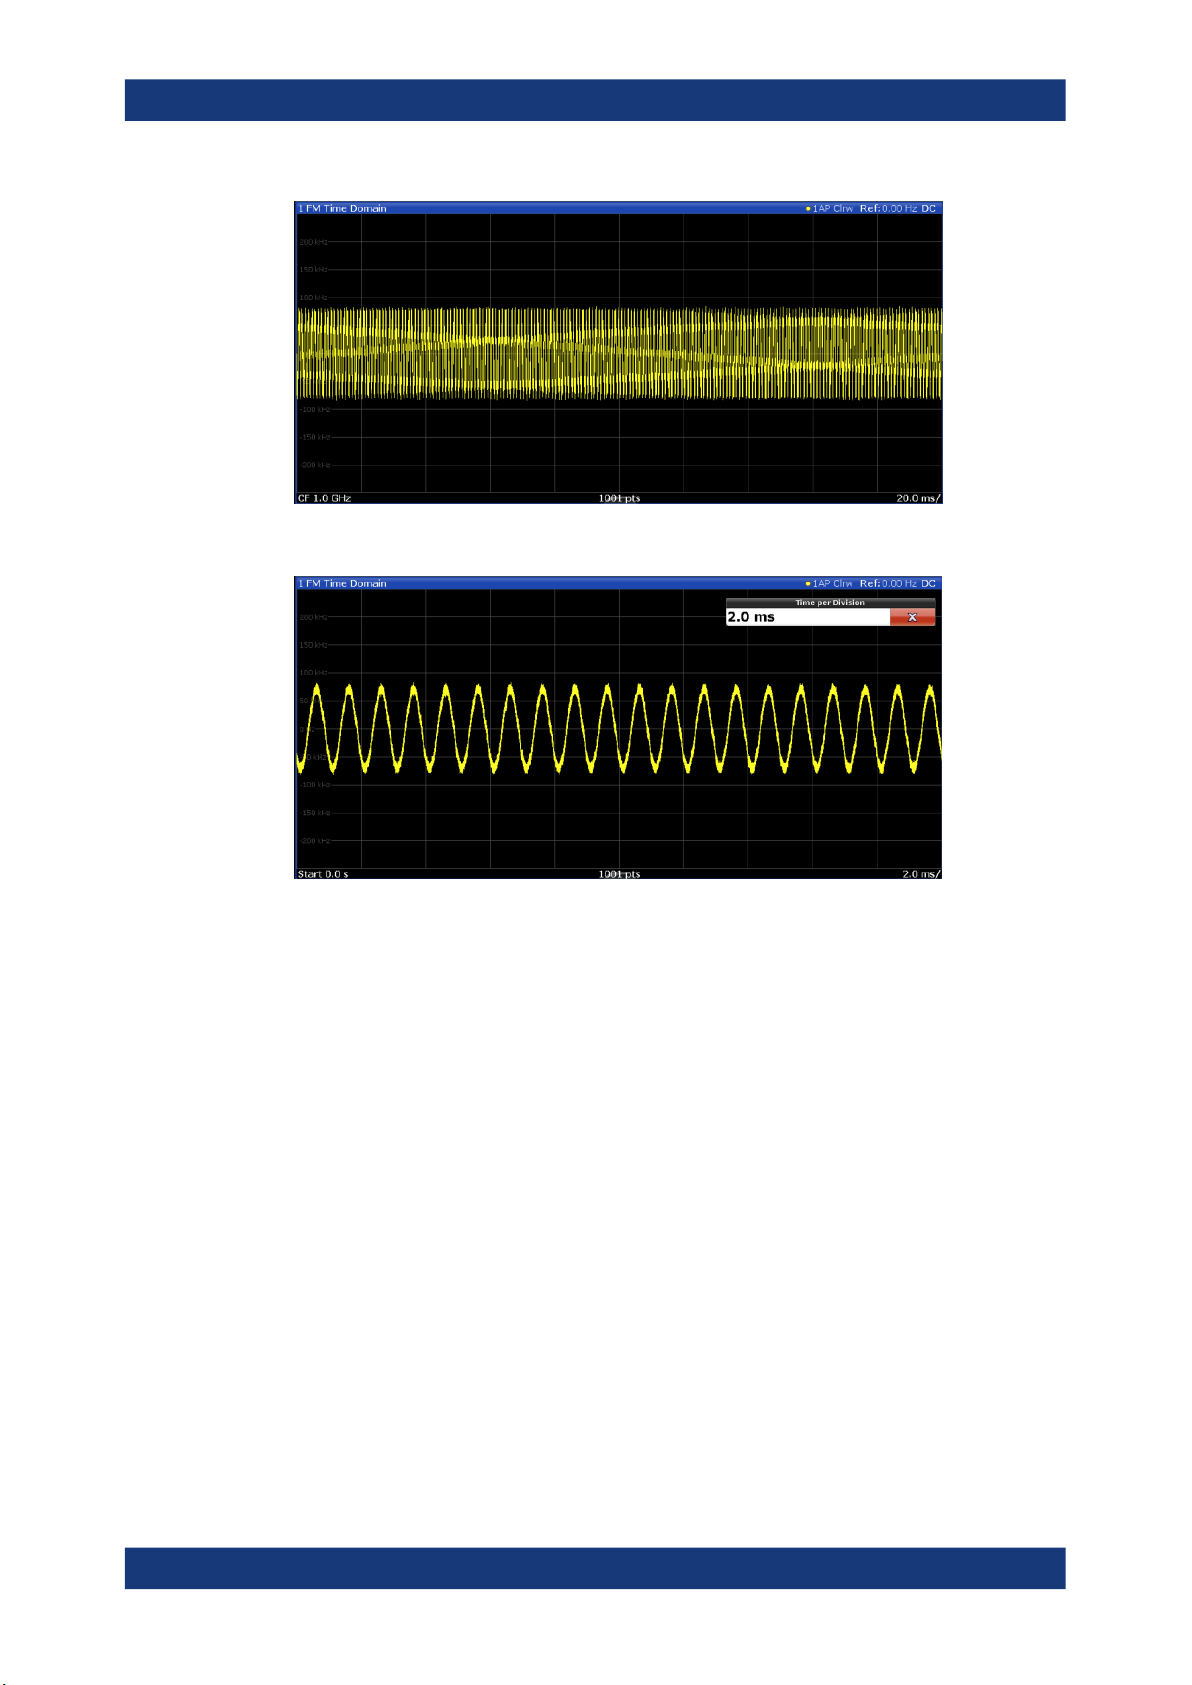
4.5 Time domain zoom
For evaluations in the time domain, the demodulated data for a particular time span
can be extracted and displayed in more detail using the "Time Domain Zoom" function.
Zooming is useful if the measurement time is very large and thus each sweep point
represents a large time span. The time domain zoom function distributes the available
sweep points only among the time span defined by the zoom area length. The time
span displayed per division of the diagram is decreased. Thus, the display of the
extracted time span becomes more precise.
29User Manual 1179.5147.02 ─ 02
Page 30
R&S®FSMR3-K7
Measurement basics
Time domain zoom
Figure 4-2: FM time domain measurement with a very long measurement time (200 ms)
Figure 4-3: FM time domain measurement with time domain zoom (2.0 ms per division)
The time domain zoom area affects not only the diagram display, but the entire evaluation for the current window.
In contrast to the time domain zoom, the graphical zoom is available for all diagram
evaluations. However, the graphical zoom is useful only if more measured values than
trace points are available. The (time) span represented by each measurement point
remains the same.
30User Manual 1179.5147.02 ─ 02
Page 31

R&S®FSMR3-K7
Measurement basics
Time domain zoom
Time domain zoom Graphical zoom
31User Manual 1179.5147.02 ─ 02
Page 32

R&S®FSMR3-K7
5 Configuration
Configuration
Configuration overview
Access: [MODE] > "AM FM PM Analog Demod"
Analog Modulation Analysis requires a special application on the R&S FSMR3.
When you activate an R&S FSMR3000 Analog Demodulation application the first time,
a set of parameters is passed on from the currently active application. After initial
setup, the parameters for the channel are stored upon exiting and restored upon reentering the channel. Thus, you can switch between applications quickly and easily.
When you activate the R&S FSMR3000 Analog Demodulation application, Analog
Modulation Analysis for the input signal is started automatically with the default configuration. The "AM FM PM Analog Demod" menu is displayed and provides access to
the most important configuration functions.
The remote commands required to perform these tasks are described in Chapter 11,
"Remote commands for Analog Demodulation", on page 109.
Predefined settings
For commonly performed measurements, standard setup files are provided for quick
and easy configuration. Simply load an existing standard settings file and, if necessary,
adapt the measurement settings to your specific requirements.
For an overview of predefined standards and settings see Chapter A, "Predefined
standards and settings", on page 280.
● Configuration overview............................................................................................32
● Configuration according to standards..................................................................... 34
● Input and frontend settings......................................................................................36
● Trigger configuration............................................................................................... 41
● Data acquisition.......................................................................................................43
● Demodulation display..............................................................................................48
● Demodulation..........................................................................................................48
● Adjusting settings automatically..............................................................................66
5.1 Configuration overview
Using the R&S FSMR3000 Analog Demodulation application you can perform Analog
Modulation Analysis using predefined standard setting files, or independently of standards using user-defined measurement settings. Such settings can be stored for recurrent use.
Thus, configuring Analog Demodulation measurements requires one of the following
tasks:
●
Selecting an existing standard settings file and, if necessary, adapting the measurement settings to your specific requirements.
●
Configuring the measurement settings and, if necessary, storing the settings in a
file.
32User Manual 1179.5147.02 ─ 02
Page 33

R&S®FSMR3-K7
Configuration
Configuration overview
"Overview" window
Throughout the channel configuration, an overview of the most important currently
defined settings is provided in the "Overview".
In addition to the main measurement settings, the "Overview" provides quick access to
the main settings dialog boxes. The individual configuration steps are displayed in the
order of the data flow. In particular, the "Overview" provides quick access to the following configuration dialog boxes (listed in the recommended order of processing):
1. Input/Frontend
See Chapter 5.3, "Input and frontend settings", on page 36
2. Trigger
See Chapter 5.4, "Trigger configuration", on page 41
3. Data Acquisition
See Chapter 5.5, "Data acquisition", on page 43
4. Demod/Display
See Chapter 5.6, "Demodulation display", on page 48
5. Demodulation Settings
See Chapter 5.7, "Demodulation", on page 48
6. Analysis
See Chapter 6, "Analysis", on page 69
7. (Optionally:) Outputs
To configure settings
► Select any button in the "Overview" to open the corresponding dialog box.
Select a setting in the channel bar (at the top of the channel tab) to change a specific setting.
33User Manual 1179.5147.02 ─ 02
Page 34

R&S®FSMR3-K7
Configuration
Configuration according to standards
Preset Channel
Select the "Preset Channel" button in the lower left-hand corner of the "Overview" to
restore all measurement settings in the current channel to their default values.
Note: Do not confuse the "Preset Channel" button with the [Preset] key, which restores
the entire instrument to its default values and thus closes all channels on the
R&S FSMR3 (except for the default channel)!
Remote command:
SYSTem:PRESet:CHANnel[:EXEC] on page 118
Setup Standard
Opens a file selection dialog box to select a predefined setup file. See "Setup Stan-
dard" on page 34.
Specific Settings for
The channel can contain several windows for different results. Thus, the settings indicated in the "Overview" and configured in the dialog boxes vary depending on the
selected window.
Select an active window from the "Specific Settings for" selection list that is displayed
in the "Overview" and in all window-specific configuration dialog boxes.
The "Overview" and dialog boxes are updated to indicate the settings for the selected
window.
5.2 Configuration according to standards
Access: "Overview" > "Setup Standard"
Various predefined settings files for common standards are provided for use with the
R&S FSMR3000 Analog Demodulation application. In addition, you can create your
own settings files for user-specific measurements.
For details on which settings are defined and an overview of predefined standards see
Chapter A, "Predefined standards and settings", on page 280.
Setup Standard............................................................................................................. 34
└ Selecting Storage Location - Drive/ Path/ Files.............................................. 34
└ File Name........................................................................................................35
└ Load Standard................................................................................................ 35
└ Save Standard................................................................................................ 35
└ Delete Standard..............................................................................................35
└ Restore Standard Files................................................................................... 35
Setup Standard
Opens a file selection dialog box to select a predefined setup file. The predefined settings are configured in the R&S FSMR3000 Analog Demodulation application, which
allows for quick and easy configuration for commonly performed measurements.
Selecting Storage Location - Drive/ Path/ Files ← Setup Standard
Select the storage location of the file on the instrument or an external drive.
34User Manual 1179.5147.02 ─ 02
Page 35

R&S®FSMR3-K7
Configuration
Configuration according to standards
The default storage location for the settings files is:
C:\R_S\INSTR\USER\predefined\AdemodPredefined.
Note: Saving instrument settings in secure user mode.
In secure user mode, settings that are stored on the instrument are stored to volatile
memory, which is restricted to 256 MB. Thus, a "memory limit reached" error can occur
although the hard disk indicates that storage space is still available.
To store data permanently, select an external storage location such as a USB memory
device.
For details, see "Protecting Data Using the Secure User Mode" in the "Data Management" section of the R&S FSMR3000 base unit user manual.
File Name ← Setup Standard
Contains the name of the data file without the path or extension.
File names must be compatible with the Windows conventions for file names. In partic-
ular, they must not contain special characters such as ":", "*", "?".
For details on the filename and location, see the "Data Management" topic in the
R&S FSMR3 User Manual.
Load Standard ← Setup Standard
Loads the selected measurement settings file.
Remote command:
[SENSe:]ADEMod:PRESet[:STANdard] on page 119
Save Standard ← Setup Standard
Saves the current measurement settings for a specific standard as a file with the
defined name.
Remote command:
[SENSe:]ADEMod:PRESet:STORe on page 119
Delete Standard ← Setup Standard
Deletes the selected standard. Standards predefined by Rohde & Schwarz can also be
deleted. A confirmation query is displayed to avoid unintentional deletion of the standard.
Note: Restoring predefined standard files. The standards predefined by Rohde &
Schwarz available at the time of delivery can be restored using the "Restore Standard
Files" function (see "Restore Standard Files" on page 35).
Restore Standard Files ← Setup Standard
Restores the standards predefined by Rohde & Schwarz available at the time of delivery.
Note that this function overwrites customized standards that have the same name as
predefined standards.
Remote command:
[SENSe:]ADEMod:PRESet:RESTore on page 119
35User Manual 1179.5147.02 ─ 02
Page 36

R&S®FSMR3-K7
5.3 Input and frontend settings
5.3.1 Settings for input from I/Q data files
Configuration
Input and frontend settings
Access: "Overview" > "Input/Frontend"
The source and characteristics of the input signal to be demodulated are configured in
the "Input/Frontend Settings" dialog box.
● Settings for input from I/Q data files........................................................................36
● Amplitude settings...................................................................................................37
● Frequency............................................................................................................... 40
Access: "Overview" > "Input/Frontend" > "Input Source" > "I/Q File"
Or: [INPUT/OUTPUT] > "Input Source Config" > "Input Source" > "I/Q File"
I/Q Input File State........................................................................................................ 36
Select I/Q data file.........................................................................................................36
I/Q Input File State
Enables input from the selected I/Q input file.
If enabled, the application performs measurements on the data from this file. Thus,
most measurement settings related to data acquisition (attenuation, center frequency,
measurement bandwidth, sample rate) cannot be changed. The measurement time
can only be decreased to perform measurements on an extract of the available data
only.
Note: Even when the file input is disabled, the input file remains selected and can be
enabled again quickly by changing the state.
Remote command:
INPut<ip>:SELect on page 122
Select I/Q data file
Opens a file selection dialog box to select an input file that contains I/Q data.
The I/Q data must have a specific format (.iq.tar) as described in R&S FSMR3 I/Q
Analyzer and I/Q Input user manual.
The default storage location for I/Q data files is C:\R_S\INSTR\USER.
36User Manual 1179.5147.02 ─ 02
Page 37

R&S®FSMR3-K7
5.3.2 Amplitude settings
Configuration
Input and frontend settings
Remote command:
INPut<ip>:FILE:PATH on page 123
Access: "Overview" > "Input/Frontend" > "Amplitude"
Amplitude settings determine how the R&S FSMR3000 must process or display the
expected input power levels.
Reference Level............................................................................................................37
└ Shifting the Display (Offset)............................................................................ 38
└ Unit..................................................................................................................38
└ Setting the Reference Level Automatically (Auto Level).................................38
RF Attenuation.............................................................................................................. 39
└ Attenuation Mode / Value................................................................................39
Input Settings................................................................................................................ 39
└ Preamplifier.....................................................................................................39
Reference Level
Defines the expected maximum reference level. Signal levels above this value are possibly not measured correctly. Signals above the reference level are indicated by an "IF
Overload" status display.
The reference level can also be used to scale power diagrams; the reference level is
then used for the calculation of the maximum on the y-axis.
37User Manual 1179.5147.02 ─ 02
Page 38

R&S®FSMR3-K7
Configuration
Input and frontend settings
Since the hardware of the R&S FSMR3000 is adapted according to this value, it is recommended that you set the reference level close above the expected maximum signal
level. Thus you ensure an optimum measurement (no compression, good signal-tonoise ratio).
Remote command:
DISPlay[:WINDow<n>][:SUBWindow<w>]:TRACe<t>:Y[:SCALe]:RLEVel
on page 137
Shifting the Display (Offset) ← Reference Level
Defines an arithmetic level offset. This offset is added to the measured level. In some
result displays, the scaling of the y-axis is changed accordingly.
Define an offset if the signal is attenuated or amplified before it is fed into the
R&S FSMR3 so the application shows correct power results. All displayed power level
results are shifted by this value.
The setting range is ±200 dB in 0.01 dB steps.
Note, however, that the internal reference level (used to adjust the hardware settings to
the expected signal) ignores any "Reference Level Offset". Thus, it is important to keep
in mind the actual power level the R&S FSMR3 must handle. Do not rely on the displayed reference level (internal reference level = displayed reference level - offset).
Remote command:
DISPlay[:WINDow<n>][:SUBWindow<w>]:TRACe<t>:Y[:SCALe]:RLEVel:
OFFSet on page 137
Unit ← Reference Level
The R&S FSMR3000 measures the signal voltage at the RF input.
The following units are available and directly convertible:
●
dBm
●
dBmV
●
dBμV
●
dBμA
●
dBpW
●
Volt
●
Ampere
●
Watt
Remote command:
INPut<ip>:IMPedance on page 122
CALCulate<n>:UNIT:POWer on page 136
Setting the Reference Level Automatically (Auto Level) ← Reference Level
Automatically determines a reference level which ensures that no overload occurs at
the R&S FSMR3000 for the current input data. At the same time, the internal attenuators are adjusted. As a result, the signal-to-noise ratio is optimized, while signal compression and clipping are minimized.
To determine the required reference level, a level measurement is performed on the
R&S FSMR3000.
38User Manual 1179.5147.02 ─ 02
Page 39

R&S®FSMR3-K7
Configuration
Input and frontend settings
If necessary, you can optimize the reference level further. Decrease the attenuation
level manually to the lowest possible value before an overload occurs, then decrease
the reference level in the same way.
You can change the measurement time for the level measurement if necessary (see
"Changing the Automatic Measurement Time (Meastime Manual)" on page 67).
Remote command:
[SENSe:]ADJust:LEVel on page 177
RF Attenuation
Defines the attenuation applied to the RF input of the R&S FSMR3.
Attenuation Mode / Value ← RF Attenuation
The RF attenuation can be set automatically as a function of the selected reference
level (Auto mode). Automatic attenuation ensures that no overload occurs at the RF
Input connector for the current reference level. It is the default setting.
In "Manual" mode, you can set the RF attenuation in 1 dB steps (down to 0 dB). Other
entries are rounded to the next integer value. The range is specified in the data sheet.
If the defined reference level cannot be set for the defined RF attenuation, the reference level is adjusted accordingly and the warning "limit reached" is displayed.
NOTICE! Risk of hardware damage due to high power levels. When decreasing the
attenuation manually, ensure that the power level does not exceed the maximum level
allowed at the RF input, as an overload can lead to hardware damage.
Remote command:
INPut<ip>:ATTenuation on page 138
INPut<ip>:ATTenuation:AUTO on page 138
Input Settings
Some input settings affect the measured amplitude of the signal, as well.
The parameters "Input Coupling" and "Impedance" are identical to those in the "Input"
settings.
Preamplifier ← Input Settings
If the (optional) internal preamplifier hardware is installed, a preamplifier can be activated for the RF input signal.
You can use a preamplifier to analyze signals from DUTs with low output power.
"Off"
"15 dB"
"30 dB"
For FSMR3050, the input signal is amplified by 30 dB if the preamplifier is activated.
Remote command:
INPut<ip>:GAIN:STATe on page 139
INPut<ip>:GAIN[:VALue] on page 139
Deactivates the preamplifier.
The RF input signal is amplified by about 15 dB.
The RF input signal is amplified by about 30 dB.
39User Manual 1179.5147.02 ─ 02
Page 40

R&S®FSMR3-K7
5.3.3 Frequency
Configuration
Input and frontend settings
Access: "Overview" > "Input/Frontend" > "Frequency" tab
Center Frequency......................................................................................................... 40
Center Frequency Stepsize...........................................................................................40
Center Frequency
Defines the center frequency of the signal in Hertz.
The allowed range of values for the center frequency depends on the frequency span.
span > 0: span
f
and span
max
/2 ≤ f
min
depend on the instrument and are specified in the data sheet.
min
center
≤ f
max
– span
min
/2
Remote command:
[SENSe:]FREQuency:CENTer on page 134
Center Frequency Stepsize
Defines the step size of the center frequency. The step size can be coupled to the
demodulation bandwidth, or you can set it to a fixed value manually.
"0.1 * Demod
BW"
"0.5 * Demod
BW"
"X * Demod
BW"
(default:) Sets the step size for the center frequency to 10 % of the
demodulation bandwidth.
Sets the step size for the center frequency to 50 % of the demodulation bandwidth.
Sets the step size for the center frequency to a manually defined factor of the demodulation bandwidth. The "X-Factor" defines the percentage of the demodulation bandwidth.
Values between 1 % and 100 % in steps of 1 % are allowed. The
default setting is 10 %.
"= Center"
Sets the step size to the value of the center frequency and removes
the coupling of the step size to the demodulation bandwidth. The
used value is indicated in the "Value" field.
"Manual"
Defines a fixed step size for the center frequency. Enter the step size
in the "Value" field.
40User Manual 1179.5147.02 ─ 02
Page 41

R&S®FSMR3-K7
5.4 Trigger configuration
Configuration
Trigger configuration
Remote command:
[SENSe:]FREQuency:CENTer:STEP:LINK on page 135
[SENSe:]FREQuency:CENTer:STEP:LINK:FACTor on page 135
[SENSe:]FREQuency:CENTer:STEP on page 134
Access: "Overview" > "Trigger"
Triggering means to capture the interesting part of the signal. Choosing the right trigger
type and configuring all trigger settings correctly allows you to detect various incidents
in your demodulated signals.
Optionally, the trigger signal used by the R&S FSMR3 can be output to a connected
device, and an external trigger signal from a connected device can be used by the
R&S FSMR3.
Trigger settings are identical to the base unit, except for the available trigger sources.
Gating is not available for Analog Modulation Analysis.
● Trigger source settings............................................................................................41
5.4.1 Trigger source settings
Access: "Overview" > "Trigger" > "Trigger Source" tab
Trigger Source...............................................................................................................42
└ Free Run.........................................................................................................42
└ FM (Offline) / AM (Offline) / PM (Offline) / RF (Offline)................................... 42
Trigger Level................................................................................................................. 42
Trigger Offset................................................................................................................ 42
Hysteresis..................................................................................................................... 43
41User Manual 1179.5147.02 ─ 02
Page 42

R&S®FSMR3-K7
Configuration
Trigger configuration
Drop-Out Time...............................................................................................................43
Slope.............................................................................................................................43
Trigger Holdoff...............................................................................................................43
Trigger Source
In the R&S FSMR3000 Analog Demodulation application, the next measurement can
be triggered if the selected input signal exceeds the threshold specified using the "Trigger Level" setting (see "Trigger Level" on page 42). Thus, a periodic signal modulated
onto the carrier frequency can be displayed. It is recommended that the measurement
time covers at least five periods of the audio signal.
Remote command:
TRIGger[:SEQuence]:SOURce on page 152
Free Run ← Trigger Source
No trigger source is considered. Data acquisition is started manually or automatically
and continues until stopped explicitly.
Remote command:
TRIG:SOUR IMM, see TRIGger[:SEQuence]:SOURce on page 152
FM (Offline) / AM (Offline) / PM (Offline) / RF (Offline) ← Trigger Source
Triggers when the demodulated input signal exceeds the trigger level.
Remote command:
TRIGger[:SEQuence]:SOURce on page 152
Trigger Level
Defines the trigger level for the specified trigger source.
For details on supported trigger levels, see the instrument data sheet.
Remote command:
TRIGger[:SEQuence]:LEVel:IFPower on page 149
TRIGger[:SEQuence]:LEVel:IQPower on page 149
TRIGger[:SEQuence]:LEVel[:EXTernal<port>] on page 148
TRIGger[:SEQuence]:LEVel:RFPower on page 150
TRIGger[:SEQuence]:LEVel:AM:RELative on page 150
TRIGger[:SEQuence]:LEVel:AM[:ABSolute] on page 150
TRIGger[:SEQuence]:LEVel:FM on page 151
TRIGger[:SEQuence]:LEVel:PM on page 151
Trigger Offset
Defines the time offset between the trigger event and the start of the sweep.
Offset > 0: Start of the sweep is delayed
Offset < 0: Sweep starts earlier (pretrigger)
For the "Time" trigger source, this function is not available.
Remote command:
TRIGger[:SEQuence]:HOLDoff[:TIME] on page 147
42User Manual 1179.5147.02 ─ 02
Page 43

R&S®FSMR3-K7
Configuration
Data acquisition
Hysteresis
Defines the distance in dB to the trigger level that the trigger source must exceed
before a trigger event occurs. Setting a hysteresis avoids unwanted trigger events
caused by noise oscillation around the trigger level.
This setting is only available for "IF Power" trigger sources. The range of the value is
between 3 dB and 50 dB with a step width of 1 dB.
Remote command:
TRIGger[:SEQuence]:IFPower:HYSTeresis on page 148
Drop-Out Time
Defines the time that the input signal must stay below the trigger level before triggering
again.
Remote command:
TRIGger[:SEQuence]:DTIMe on page 147
Slope
For all trigger sources except time, you can define whether triggering occurs when the
signal rises to the trigger level or falls down to it.
Remote command:
TRIGger[:SEQuence]:SLOPe on page 151
Trigger Holdoff
Defines the minimum time (in seconds) that must pass between two trigger events.
Trigger events that occur during the holdoff time are ignored.
Remote command:
TRIGger[:SEQuence]:IFPower:HOLDoff on page 148
5.5 Data acquisition
Access: "Overview" > "Data Acquisition"
You configure how data is acquired and then demodulated in the "Data Acquisition"
dialog box.
● Bandwidth settings..................................................................................................43
● Sweep settings........................................................................................................45
5.5.1 Bandwidth settings
Access: "Overview" > "Data Acquisition" > "Bandwidth" tab
The bandwidth settings define which parts of the input signal are acquired and then
demodulated.
43User Manual 1179.5147.02 ─ 02
Page 44

R&S®FSMR3-K7
Configuration
Data acquisition
Demodulation Bandwidth.............................................................................................. 44
Demodulation Filter.......................................................................................................44
Measurement Time (AQT).............................................................................................44
Resolution Bandwidth................................................................................................... 44
Demodulation Bandwidth
Defines the demodulation bandwidth of the measurement. The demodulation bandwidth determines the sample rate with which the input signal is captured and analyzed.
For recommendations on finding the correct demodulation bandwidth, see Chapter 4.2,
"Demodulation bandwidth", on page 28.
Remote command:
[SENSe:]BWIDth:DEMod on page 145
Demodulation Filter
Defines the filter to be used for demodulation.
For details on sample rates, measurement times and trigger offsets for various demod-
ulation bandwidths when using a Gaussian filter, see Chapter 4.3, "Sample rate and
demodulation bandwidth", on page 28.
"Flat"
"Gauss"
Remote command:
[SENSe:]BWIDth:DEMod:TYPE on page 145
Measurement Time (AQT)
Defines how long data is acquired for demodulation.
Remote command:
[SENSe:]ADEMod:MTIMe on page 143
Default
Optimizes the settling behavior of the filter
Resolution Bandwidth
Defines the resolution bandwidth for data acquisition. The available range is specified
in the data sheet.
Remote command:
[SENSe:]BANDwidth[:RESolution] on page 145
44User Manual 1179.5147.02 ─ 02
Page 45

R&S®FSMR3-K7
5.5.2 Sweep settings
Configuration
Data acquisition
Access: "Overview" > "Data Acquisition" > "Sweep" tab
The sweep settings define how often data from the input signal is acquired and then
demodulated.
Continuous Sweep / Run Cont......................................................................................45
Single Sweep / Run Single............................................................................................46
Continue Single Sweep.................................................................................................46
Measurement Time (AQT).............................................................................................46
Sweep Points................................................................................................................ 46
Sweep/Average Count.................................................................................................. 47
Select Frame.................................................................................................................47
Continue Frame............................................................................................................ 47
Frame Count................................................................................................................. 47
Clear Spectrogram........................................................................................................48
Continuous Sweep / Run Cont
After triggering, starts the sweep and repeats it continuously until stopped. This is the
default setting.
While the measurement is running, the "Continuous Sweep" softkey and the [RUN
CONT] key are highlighted. The running measurement can be aborted by selecting the
highlighted softkey or key again. The results are not deleted until a new measurement
is started.
45User Manual 1179.5147.02 ─ 02
Page 46

R&S®FSMR3-K7
Configuration
Data acquisition
Note: Sequencer. If the Sequencer is active, the "Continuous Sweep" softkey only controls the sweep mode for the currently selected channel. However, the sweep mode
only takes effect the next time the Sequencer activates that channel, and only for a
channel-defined sequence. In this case, a channel in continuous sweep mode is swept
repeatedly.
Furthermore, the [RUN CONT] key controls the Sequencer, not individual sweeps.
[RUN CONT] starts the Sequencer in continuous mode.
For details on the Sequencer, see the R&S FSMR3 User Manual.
Remote command:
INITiate<n>:CONTinuous on page 179
Single Sweep / Run Single
After triggering, starts the number of sweeps set in "Sweep Count". The measurement
stops after the defined number of sweeps has been performed.
While the measurement is running, the "Single Sweep" softkey and the [RUN SINGLE]
key are highlighted. The running measurement can be aborted by selecting the highlighted softkey or key again.
Note: Sequencer. If the Sequencer is active, the "Single Sweep" softkey only controls
the sweep mode for the currently selected channel. However, the sweep mode only
takes effect the next time the Sequencer activates that channel, and only for a channel-defined sequence. In this case, the Sequencer sweeps a channel in single sweep
mode only once.
Furthermore, the [RUN SINGLE] key controls the Sequencer, not individual sweeps.
[RUN SINGLE] starts the Sequencer in single mode.
If the Sequencer is off, only the evaluation for the currently displayed channel is updated.
For details on the Sequencer, see the R&S FSMR3 User Manual.
Remote command:
INITiate<n>[:IMMediate] on page 180
Continue Single Sweep
After triggering, repeats the number of sweeps set in "Sweep Count", without deleting
the trace of the last measurement.
While the measurement is running, the "Continue Single Sweep" softkey and the [RUN
SINGLE] key are highlighted. The running measurement can be aborted by selecting
the highlighted softkey or key again.
Remote command:
INITiate<n>:CONMeas on page 179
Measurement Time (AQT)
Defines how long data is acquired for demodulation.
Remote command:
[SENSe:]ADEMod:MTIMe on page 143
Sweep Points
Defines the number of measured values to be collected during one sweep.
46User Manual 1179.5147.02 ─ 02
Page 47

R&S®FSMR3-K7
Configuration
Data acquisition
All values from 101 to 100001 can be set. The default value is 1001 sweep points.
Remote command:
[SENSe:]SWEep[:WINDow<n>]:POINts on page 146
Sweep/Average Count
Defines the number of sweeps to be performed in the single sweep mode. Values from
0 to 200000 are allowed. If the values 0 or 1 are set, one sweep is performed.
The sweep count is applied to all the traces in all diagrams.
If the trace modes "Average", "Max Hold" or "Min Hold" are set, this value also deter-
mines the number of averaging or maximum search procedures.
In continuous sweep mode, if "Sweep Count" = 0 (default), averaging is performed
over 10 sweeps. For "Sweep Count" =1, no averaging, maxhold or minhold operations
are performed.
Remote command:
[SENSe:]SWEep:COUNt on page 146
Select Frame
Selects a specific frame, loads the corresponding trace from the memory, and displays
it in the Spectrum window.
Note that activating a marker or changing the position of the active marker automatically selects the frame that belongs to that marker.
This function is only available in single sweep mode or if the sweep is stopped, and
only if a spectrogram is selected.
The most recent frame is number 0, all previous frames have a negative number.
For more details, see the R&S FSMR3 User Manual.
Remote command:
CALCulate<n>:SPECtrogram:FRAMe:SELect on page 204
Continue Frame
Determines whether the results of the previous sweeps are included in the analysis of
the next sweeps for trace modes "Max Hold", "Min Hold", and "Average".
This function is available in single sweep mode only.
●
On
When the average or peak values are determined for the new sweep, the results of
the previous sweeps in the spectrogram are also considered.
●
Off
The average or peak values are determined from the results of the newly swept
frames only.
Remote command:
CALCulate<n>:SPECtrogram:CONTinuous on page 203
Frame Count
Determines how many frames are plotted during a single sweep (as opposed to a continuous sweep). The maximum number of possible frames depends on the history
depth (see "History Depth" on page 73).
47User Manual 1179.5147.02 ─ 02
Page 48

R&S®FSMR3-K7
5.6 Demodulation display
Configuration
Demodulation
Remote command:
CALCulate<n>:SPECtrogram:FRAMe:COUNt on page 204
Clear Spectrogram
Resets the spectrogram result display and clears the history buffer.
This function is only available if a spectrogram is selected.
Remote command:
CALCulate<n>:SPECtrogram:CLEar[:IMMediate] on page 203
Access: "Overview" > "Demod/Display"
The demodulated signal can be displayed using various evaluation methods. All evaluation methods available for the Analog Modulation Analysis application are displayed in
the evaluation bar in SmartGrid mode when you do one of the following:
Up to six evaluation methods can be displayed simultaneously in separate windows.
The Analog Modulation Analysis evaluation methods are described in Chapter 3, "Mea-
surements and result displays", on page 15.
For details on working with the SmartGrid, see the R&S FSMR3 Getting Started manual.
5.7 Demodulation
Access: "Overview" > "Demod Settings"
Or: "Meas Setup" > "Demod"
● Basic demodulation measurement parameters (Demod)........................................48
● Demodulation spectrum.......................................................................................... 51
● AF filter....................................................................................................................54
● Scaling.................................................................................................................... 57
● Units........................................................................................................................61
● Result table settings................................................................................................62
● Settling time............................................................................................................ 64
5.7.1 Basic demodulation measurement parameters (Demod)
Access: "Overview" > "Demod Settings" > "Demod"
Or: "Meas Setup" > "Demod" > "Demod" tab
The basic demodulation measurement parameters define how the measurement is
performed.
48User Manual 1179.5147.02 ─ 02
Page 49

R&S®FSMR3-K7
Configuration
Demodulation
Squelch State................................................................................................................49
Squelch Level................................................................................................................49
AF Coupling.................................................................................................................. 49
Selected Trace..............................................................................................................50
Time Domain Zoom.......................................................................................................50
└ State................................................................................................................50
└ Start................................................................................................................ 50
└ Length.............................................................................................................51
└ Time per Division............................................................................................ 51
Zero Phase Reference Position (PM Time Domain only)..............................................51
Phase Wrap On/Off (PM Time Domain only)................................................................ 51
Squelch State
Activates the squelch function, that is: if the signal falls below a defined threshold, the
demodulated data is automatically set to 0. This is useful, for example, to avoid
demodulation noise during transmission breaks.
This function is only available for FM demodulation.
Remote command:
[SENSe:]ADEMod:SQUelch[:STATe] on page 156
Squelch Level
Defines the level threshold below which the demodulated data is set to 0 if squelching
is enabled. The squelch level is an absolute value.
Remote command:
[SENSe:]ADEMod:SQUelch:LEVel on page 157
AF Coupling
Controls the automatic correction of the frequency offset and phase offset of the input
signal:
49User Manual 1179.5147.02 ─ 02
Page 50

R&S®FSMR3-K7
Configuration
Demodulation
This function is only available for FM or PM time domain evaluations.
●
FM time evaluation
If DC is selected, the absolute frequency is displayed. That means, an input signal
with an offset relative to the center frequency is not displayed symmetrically to the
zero line.
If AC is selected, the frequency offset is automatically corrected, i.e. the trace is
always symmetric to the zero line.
●
PM time evaluation
If DC is selected, the phase runs according to the existing frequency offset. In addition, the DC signal contains a phase offset of ± π.
If AC is selected, the frequency offset and phase offset are automatically corrected,
i.e. the trace is always symmetric to the zero line.
Remote command:
[SENSe:]ADEMod<n>:AF:COUPling on page 155
Selected Trace
Defines the trace used to determine the results in the "Result Summary".
Time Domain Zoom
Using the time domain zoom, the demodulated data for a particular time span is extracted and displayed in more detail. Time domain zoom is useful if the measurement time
is very large and thus each sweep point represents a large time span. The time domain
zoom function distributes the available sweep points only among the time span defined
by the zoom area length. The time span displayed per division of the diagram is
decreased. Thus, the display of the extracted time span becomes more precise. Note
that the time domain zoom area affects not only the diagram display, but the entire
evaluation for the current window.
This function is only available for evaluations in the time domain.
Tip: In addition to the Time Domain Zoom, a graphical zoom is available for all diagram
evaluations. However, the graphical zoom is useful only if more measured values than
trace points are available. The (time) span represented by each measurement point
remains the same.
State ← Time Domain Zoom
Activates or deactivates the time domain zoom mode.
"On"
"Off"
Remote command:
[SENSe:]ADEMod<n>:ZOOM[:STATe] on page 159
Activates the time domain zoom.
Deactivates the time domain zoom and restores the original display. If
more measured values than measurement points are available, several measured values are combined in one measurement point
according to the method of the selected trace detector.
Start ← Time Domain Zoom
Defines the start time for the time domain zoom area. For spectrum evaluations, the
start time is always 0.
50User Manual 1179.5147.02 ─ 02
Page 51

R&S®FSMR3-K7
Configuration
Demodulation
Remote command:
[SENSe:]ADEMod<n>:ZOOM:STARt on page 158
Length ← Time Domain Zoom
Defines the length of the time domain zoom area. Enter the length as a time value
manually, or use the "Auto" setting to set the length to the current number of sweep
points automatically.
Remote command:
[SENSe:]ADEMod<n>:ZOOM:LENGth on page 158
[SENSe:]ADEMod<n>:ZOOM:LENGth:MODE on page 158
Time per Division ← Time Domain Zoom
Enables the "Time Domain Zoom" function and defines the zoom area length in one
step. The width of the zoom display is divided into 10 divisions; thus, by entering the
time that is displayed in each division, you indirectly define the zoom area length
("Time per Division" * 10). The starting point of the zoom area is determined automatically. To specify the starting point manually, use the Start setting.
The "Time per Division" softkey is available from the main "AM FM PM Analog Demod"
menu.
Zero Phase Reference Position (PM Time Domain only)
Defines the position in time at which the phase of the PM-demodulated signal is set to
0 rad. In the default setting, the time of the first measured value is set to 0 rad. You can
define a different position manually, or select the time of the last measured value as the
reference position. The time of the last measured value corresponds to the acquisition
time, considering the trigger event and trigger offset, if applicable. If the acquisition
time or the trigger values are changed, the reference position is automatically adapted.
This setting is only available for PM time domain displays with DC coupling.
Remote command:
[SENSe:]ADEMod:PM:RPOint[:X] on page 155
[SENSe:]ADEMod:PM:RPOint[:X]:MODE on page 156
Phase Wrap On/Off (PM Time Domain only)
Activates/deactivates the phase wrap.
On The phase is displayed in the range ±180° (± Π). For example, if the phase exceeds +180°,
360° is subtracted from the phase value, with the display thus showing >-180°.
Off The phase is not wrapped.
This setting is only available for PM time domain displays with DC coupling.
Remote command:
CALC:FORM PHAS/CALC:FORM UPH, see CALCulate<n>:FORMat on page 157
5.7.2 Demodulation spectrum
Access: "Overview" > "Demod Settings" > "Spectrum"
51User Manual 1179.5147.02 ─ 02
Page 52

R&S®FSMR3-K7
5.7.2.1 AF evaluation
Configuration
Demodulation
Or: "Meas Setup" > "Demod" > "Spectrum" tab
The demodulation spectrum defines which span of the demodulated data is evaluated.
Depending on the evaluation (AF or RF display), the settings vary.
● AF evaluation.......................................................................................................... 52
● RF evaluation..........................................................................................................53
Access: "Overview" > "Demod Settings" > "Spectrum"
Or: "Meas Setup" > "Demod" > "Spectrum" tab
These settings are only available for AF Spectrum evaluations, not in the time domain.
AF Center......................................................................................................................52
AF Start.........................................................................................................................52
AF Stop......................................................................................................................... 53
AF Span........................................................................................................................ 53
AF Full Span................................................................................................................. 53
AF Center
Defines the center frequency of the demodulated data to evaluate.
Remote command:
[SENSe:]ADEMod:AF:CENTer on page 160
AF Start
Defines the start frequency of the demodulated data to evaluate.
Remote command:
[SENSe:]ADEMod:AF:STARt on page 160
52User Manual 1179.5147.02 ─ 02
Page 53

R&S®FSMR3-K7
Configuration
Demodulation
AF Stop
Defines the stop frequency of the demodulated data to evaluate.
The maximum AF stop frequency corresponds to half the demodulation bandwidth.
Remote command:
[SENSe:]ADEMod:AF:STOP on page 161
AF Span
Defines the span (around the center frequency) of the demodulated data to evaluate.
The maximum span is DBW/2.
Remote command:
[SENSe:]ADEMod:AF:SPAN on page 160
AF Full Span
Sets the span (around the center frequency) of the demodulated data to the maximum
of DBW/2.
Remote command:
[SENSe:]ADEMod:AF:SPAN:FULL on page 160
5.7.2.2 RF evaluation
Access: "Overview" > "Demod Settings" > "Spectrum"
Or: "Meas Setup" > "Demod" > "Spectrum" tab
These settings are only available for RF evaluation, both in time and frequency
domain. Note that for RF data the center frequency and demodulation bandwidth correspond to the settings defined in the "Input" and "Data Acquisition" configuration.
53User Manual 1179.5147.02 ─ 02
Page 54

R&S®FSMR3-K7
Configuration
Demodulation
Center Frequency......................................................................................................... 54
Span..............................................................................................................................54
Demodulation Bandwidth.............................................................................................. 54
RF Full Span................................................................................................................. 54
Center Frequency
Defines the center frequency of the signal in Hertz.
The allowed range of values for the center frequency depends on the frequency span.
span > 0: span
f
and span
max
/2 ≤ f
min
depend on the instrument and are specified in the data sheet.
min
center
≤ f
max
– span
min
/2
Remote command:
[SENSe:]FREQuency:CENTer on page 134
Span
Defines the frequency span. The center frequency is kept constant. The following
range is allowed:
span = 0: 0 Hz
span >0:
span
and f
f
min
max
and span
max
≤ f
span
=DBW/2
min
≤ f
max
are specified in the data sheet.
Remote command:
[SENSe:]ADEMod:SPECtrum:SPAN[:MAXimum] on page 162
[SENSe:]ADEMod:SPECtrum:SPAN:ZOOM on page 161
Demodulation Bandwidth
Defines the demodulation bandwidth of the measurement. The demodulation bandwidth determines the sample rate with which the input signal is captured and analyzed.
For recommendations on finding the correct demodulation bandwidth, see Chapter 4.2,
"Demodulation bandwidth", on page 28.
Remote command:
[SENSe:]BWIDth:DEMod on page 145
RF Full Span
Sets the span (around the center frequency) of the RF data to be evaluated to the
demodulation bandwidth.
Remote command:
[SENSe:]ADEMod:SPECtrum:SPAN[:MAXimum] on page 162
5.7.3 AF filter
Access: "Overview" > "Demod Settings" > "AF Filter"
Or: "Meas Setup" > "Demod" > "AF Filter" tab
54User Manual 1179.5147.02 ─ 02
Page 55

R&S®FSMR3-K7
Configuration
Demodulation
The AF filter reduces the evaluated bandwidth of the demodulated signal and can
define a weighting function.
AF filters are only available for AF evaluations, not for RF evaluation.
High Pass......................................................................................................................55
Low Pass.......................................................................................................................56
Weighting...................................................................................................................... 56
Deemphasis.................................................................................................................. 57
Deactivating all AF Filters............................................................................................. 57
High Pass
Defines a high pass filter with the given limit to separate the DC component. The filters
are indicated by the 3 dB cutoff frequency. The 50 Hz and 300 Hz filters are designed
as 2nd-order Butterworth filter (12 dB/octave). The 20 Hz filter is designed as 3rd-order
Butterworth filter (18 dB/octave).
The high pass filters are active in the following demodulation bandwidth range:
None No AF Filter used (default)
20 Hz 100 Hz ≤ demodulation bandwidth ≤ 1.6 MHz
50 Hz: 200 Hz ≤ demodulation bandwidth ≤ 3 MHz
300 Hz: 800 Hz ≤ demodulation bandwidth ≤ 8 MHz
Manual: A high pass filter with the manually defined frequency is used.
55User Manual 1179.5147.02 ─ 02
Page 56

R&S®FSMR3-K7
Configuration
Demodulation
Remote command:
[SENSe:]FILTer<n>:HPASs[:STATe] on page 165
[SENSe:]FILTer<n>:HPASs:FREQuency[:ABSolute] on page 165
[SENSe:]FILTer<n>:HPASs:FREQuency:MANual on page 165
Low Pass
Defines a low pass filter type. Relative and absolute low pass filter are available.
●
Absolute low pass filters:
Absolute filters are indicated by the 3 dB cutoff frequency. The 3 kHz, 15 kHz and
23 kHz filters are designed as 5th-order Butterworth filters (30 dB/octave). The 150
kHz filter is designed as 8th-order Butterworth filter (48 dB/octave).
The absolute low pass filters are active in the following demodulation bandwidth
range:
Filter type Demodulation bandwidth
3 kHz: 6.4 kHz ≤ demodulation bandwidth ≤ 3 MHz
15 kHz: 50 kHz ≤ demodulation bandwidth ≤ 8 MHz
23 kHz 50 kHz ≤ demodulation bandwidth ≤ 18 MHz
150 kHz: 400 kHz ≤ demodulation bandwidth ≤ 8 MHz
Manual: A low pass filter with the manually defined frequency is used.
●
Relative low pass filters:
Relative filters (3 dB) can be selected in % of the demodulation bandwidth. The filters are designed as 5th-order Butterworth filter (30 dB/octave) and active for all
demodulation bandwidths.
●
"NONE" deactivates the AF low pass filter (default).
Remote command:
[SENSe:]FILTer<n>:LPASs[:STATe] on page 167
[SENSe:]FILTer<n>:LPASs:FREQuency[:ABSolute] on page 166
[SENSe:]FILTer<n>:LPASs:FREQuency:RELative on page 166
[SENSe:]FILTer<n>:LPASs:FREQuency:MANual on page 166
Weighting
Selects a weighting AF filter. By default, no weighting filter is active.
"A weighted"
Switches on the A weighted filter. The weighting filter is active in the
following demodulation bandwidth range:
100 kHz ≤ demodulation bandwidth ≤ 800 kHz
"CCITT"
Switches on a CCITT P.53 weighting filter. The weighting filter is
active in the following demodulation bandwidth range:
20 kHz ≤ demodulation bandwidth ≤ 3 MHz
"CCIR weighted"
Switches on the CCIR weighted filter. The weighting filter is active in
the following demodulation bandwidth range:
100 kHz ≤ demodulation bandwidth ≤ 3.0 MHz
56User Manual 1179.5147.02 ─ 02
Page 57

R&S®FSMR3-K7
Configuration
Demodulation
"CCIR
unweighted"
Switches on the CCIR unweighted filter, which is the combination of
the 20 Hz highpass and 23 kHz low pass filter. The weighting filter is
active in the following demodulation bandwidth range:
50 kHz ≤ demodulation bandwidth ≤ 1.6 MHz
Remote command:
[SENSe:]FILTer<n>:CCITt[:STATe] on page 164
[SENSe:]FILTer<n>:CCIR[:UNWeighted][:STATe] on page 163
[SENSe:]FILTer<n>:CCIR:WEIGhted[:STATe] on page 163
[SENSe:]FILTer<n>:AWEighted[:STATe] on page 162
Deemphasis
Activates a deemphasis filter with the given time constant.
Sometimes a modulated signal is extorted by a pre-emphasis filter before transmission,
for example to eliminate frequencies that are more prone to interferences. In this case,
the emphasis function must be reversed after demodulation, which is done by the
deemphasis filter.
The deemphasis filter is active in the following demodulation bandwidth range:
25 µs: 25 kHz ≤ demodulation bandwidth ≤ 40 MHz
50 µs: 6.4 kHz ≤ demodulation bandwidth ≤ 18 MHz
75 µs: 6.4 kHz ≤ demodulation bandwidth ≤ 18 MHz
750 µs: 800 Hz ≤ demodulation bandwidth ≤ 3 MHz
Depending on the deemphasis filter, a minimum demodulation bandwidth is required
for an error less than 0.5 dB, up to a maximum AF frequency. The following table
shows the dependencies.
Deemphasis [us] 25 µs 50 µs 75 µs 750 µs
Max. AF frequency 25 kHz 12 kHz 8 kHz 800 Hz
Required demodulation bandwidth ≥ 200 kHz ≥ 100 kHz ≥ 50 kHz ≥ 6.4 kHz
For higher AF frequencies, the demodulation bandwidth must be increased.
Remote command:
[SENSe:]FILTer<n>:DEMPhasis[:STATe] on page 164
[SENSe:]FILTer<n>:DEMPhasis:TCONstant on page 164
Deactivating all AF Filters
The "All Filter Off" button deactivates all AF filters for the selected evaluation.
Remote command:
[SENSe:]FILTer<n>:AOFF on page 163
5.7.4 Scaling
Access: "Overview" > "Demod Settings" > "Scaling"
57User Manual 1179.5147.02 ─ 02
Page 58

R&S®FSMR3-K7
5.7.4.1 AF evaluation
Configuration
Demodulation
Or: "Meas Setup" > "Demod" > "Scaling" tab
The scaling parameters define the range of the demodulated data to be displayed.
● AF evaluation.......................................................................................................... 58
● RF evaluation..........................................................................................................60
Access: "Overview" > "Demod Settings" > "Scaling"
Or: "Meas Setup" > "Demod" > "Scaling" tab
These settings are only available for AF evaluations.
Dev per Division/ dB per Division..................................................................................58
Reference Value Position..............................................................................................58
Reference Value............................................................................................................59
AF Coupling.................................................................................................................. 59
Deviation....................................................................................................................... 59
AF Auto Scale............................................................................................................... 60
Dev per Division/ dB per Division
Defines the modulation depth or the phase deviation or frequency deviation per division (logarithmic: 0.1 dB to 20 dB):
AM display: 0.0001 % to 1000 %
FM display: 1 Hz/div to 100 MHz/div
PM display: 0.0001 rad/div to 1000 rad/div
Note: The value defined per division refers to the default display of 10 divisions on the
y-axis. If fewer divisions are displayed (e.g. because the window is reduced in height),
the range per division is increased. Thus, the same result range is displayed in the
smaller window. In this case, the per division value does not correspond to the actual
display.
Remote command:
DISPlay[:WINDow<n>][:SUBWindow<w>]:TRACe<t>:Y[:SCALe]:PDIVision
on page 141
Reference Value Position
Determines the position of the reference value for the modulation depth or the phase
deviation or frequency deviation on the y-axis of the diagram.
The position is entered as a percentage of the diagram height with 100 % corresponding to the upper diagram border. The default setting is 50 % (diagram center) for the
AF time evaluations and 100 % (upper diagram border) for the AF spectrum evaluations.
Remote command:
DISPlay[:WINDow<n>][:SUBWindow<w>]:TRACe<t>:Y[:SCALe]:RPOSition
on page 142
58User Manual 1179.5147.02 ─ 02
Page 59

R&S®FSMR3-K7
Configuration
Demodulation
Reference Value
Determines the modulation depth or the phase deviation or the frequency deviation at
the reference line of the y-axis. The reference value can be set specifically for each
evaluation.
●
AF time display
The trace display takes individual frequency/phase offsets into account (in contrast,
the AF Coupling setting permits automatic correction by the average frequency/
phase offset of the signal, and therefore cannot be activated simultaneously).
●
AF spectrum display
In the default setting, the reference value defines the modulation depth or the
FM/PM deviation at the upper diagram border.
Possible values:
●
AM: 0 and ± 10000 %
●
FM: 0 and ± 10 MHz
●
PM: 0 and ± 10000 rad
Note: The reference value for the AF range in the window title bar is displayed with
respect to the defined reference position. The position can vary for different windows.
For time domain and frequency domain windows, for example, a different reference
value can be displayed, although the same reference is actually used (but the positions
vary).
Remote command:
DISPlay[:WINDow<n>][:SUBWindow<w>]:TRACe<t>:Y[:SCALe]:RVALue
on page 168
AF Coupling
Controls the automatic correction of the frequency offset and phase offset of the input
signal:
This function is only available for FM or PM time domain evaluations.
●
FM time evaluation
If DC is selected, the absolute frequency is displayed. That means, an input signal
with an offset relative to the center frequency is not displayed symmetrically to the
zero line.
If AC is selected, the frequency offset is automatically corrected, i.e. the trace is
always symmetric to the zero line.
●
PM time evaluation
If DC is selected, the phase runs according to the existing frequency offset. In addition, the DC signal contains a phase offset of ± π.
If AC is selected, the frequency offset and phase offset are automatically corrected,
i.e. the trace is always symmetric to the zero line.
Remote command:
[SENSe:]ADEMod<n>:AF:COUPling on page 155
Deviation
Switches between logarithmic and linear display of the modulation depth or the phase
deviation or the frequency deviation.
Remote command:
DISPlay[:WINDow<n>][:SUBWindow<w>]:TRACe<t>:Y:SPACing on page 142
59User Manual 1179.5147.02 ─ 02
Page 60

R&S®FSMR3-K7
5.7.4.2 RF evaluation
Configuration
Demodulation
AF Auto Scale
Activates automatic scaling of the y-axis for AF measurements. RF power and RF
spectrum measurements are not affected by the auto-scaling.
Remote command:
[SENSe:]ADJust:SCALe[:Y]:AUTO[:CONTinuous] on page 177
Access: "Overview" > "Demod Settings" > "Scaling"
Or: "Meas Setup" > "Demod" > "Scaling" tab
These settings are only available for RF evaluations and the "result summary".
Range............................................................................................................................60
Ref Level Position......................................................................................................... 60
Auto Scale Once........................................................................................................... 61
Scaling.......................................................................................................................... 61
Range
Defines the displayed y-axis range in dB.
The default value is 100 dB.
For Analog Modulation Analysis measurements, time domain scaling is defined in Hz
(default: 500 kHz).
Remote command:
DISPlay[:WINDow<n>][:SUBWindow<w>]:TRACe<t>:Y[:SCALe] on page 140
Ref Level Position
Defines the reference level position, i.e. the position of the maximum AD converter
value on the level axis in %.
0 % corresponds to the lower and 100 % to the upper limit of the diagram.
60User Manual 1179.5147.02 ─ 02
Page 61

R&S®FSMR3-K7
Configuration
Demodulation
Values from -120 % to +600 % are available. Larger values are useful for small scales,
such as a power range of 10 dB or 20 dB, and low signal levels, for example 60 dB
below the reference level. In this case, large reference level position values allow you
to see the trace again.
Only available for RF measurements.
Remote command:
DISPlay[:WINDow<n>][:SUBWindow<w>]:TRACe<t>:Y[:SCALe]:RPOSition
on page 142
Auto Scale Once
Automatically determines the optimal range and reference level position to be displayed for the current measurement settings.
The display is only set once; it is not adapted further if the measurement settings are
changed again.
Remote command:
DISPlay[:WINDow<n>][:SUBWindow<w>]:TRACe<t>:Y[:SCALe]:AUTO ONCE
on page 140
Scaling
Defines the scaling method for the y-axis.
"Logarithmic"
"Linear with
Unit"
"Linear Percent"
"Absolute"
"Relative"
Remote command:
DISPlay[:WINDow<n>][:SUBWindow<w>]:TRACe<t>:Y:SPACing on page 142
DISPlay[:WINDow<n>][:SUBWindow<w>]:TRACe<t>:Y[:SCALe]:MODE
on page 141
5.7.5 Units
Logarithmic scaling (only available for logarithmic units - dB..., and A,
V, Watt)
Linear scaling in the unit of the measured signal
Linear scaling in percentages from 0 to 100
The labeling of the level lines refers to the absolute value of the reference level (not available for "Linear Percent")
The scaling is in dB, relative to the reference level (only available for
logarithmic units - dB...). The upper line of the grid (reference level) is
always at 0 dB.
Access: "Overview" > "Demod Settings" > "Unit"
Or: "Meas Setup" > "Demod" > "Unit" tab
The units define how the demodulated data is displayed.
Phase Unit (Rad/Deg)...................................................................................................62
THD Unit (%/ DB)..........................................................................................................62
Relative Unit..................................................................................................................62
61User Manual 1179.5147.02 ─ 02
Page 62

R&S®FSMR3-K7
5.7.6 Result table settings
Configuration
Demodulation
Phase Unit (Rad/Deg)
Sets the phase unit to rad or deg for displaying PM signals.
Remote command:
UNIT<n>:ANGLe on page 169
THD Unit (%/ DB)
Sets the unit to percent or DB for the calculation of the THD (in the "Result Summary").
Remote command:
UNIT<n>:THD on page 169
Relative Unit
Defines the unit for relative demodulation results (see Chapter 5.7.6, "Result table set-
tings", on page 62).
Remote command:
CONFigure:ADEMod:RESults:UNIT on page 172
Access: "Overview" > "Demod Settings" > "Result Table"
Or: "Meas Setup" > "Demod" > "Result Table" tab
The demodulation results are displayed in the "Result Summary" table (see also
"Result Summary" on page 23). The detectors used to determine the results can be
configured.
In addition to common absolute demodulation, the R&S FSMR3000 Analog Demodulation application also provides demodulation results relative to user-defined or measured reference values in the "Result Summary".
The settings for the "Result Summary" can be defined individually for the different modulation types (FM, AM, PM). For each modulation, a separate tab is provided in the dialog box.
Detector.........................................................................................................................62
Mode............................................................................................................................. 63
State..............................................................................................................................63
Reference Value............................................................................................................63
Meas -> Reference........................................................................................................63
Detector
Detector type for demodulation results
"+ Peak"
"- Peak"
"+/- Peak"
"RMS"
Remote command:
The detector is specified by the DETector<det> suffix in
CONFigure:RELative:AM|FM|PM:DETector<det>... commands.
Positive peak
Negative peak
Autopeak
Root mean square
62User Manual 1179.5147.02 ─ 02
Page 63

R&S®FSMR3-K7
Configuration
Demodulation
Mode
Defines the mode with which the demodulation result is determined.
"Clear Write"
"Max Hold"
"Average"
Remote command:
CONFigure:ADEMod:RESults:AM:DETector<det>:MODE on page 171
CONFigure:ADEMod:RESults:FM:DETector<det>:MODE on page 171
CONFigure:ADEMod:RESults:PM:DETector<det>:MODE on page 171
State
Activates relative demodulation for the selected detector. If activated, the demodulated
result is set in relation to the Reference Value.
Remote command:
CONFigure:ADEMod:RESults:AM:DETector<det>:STATe on page 170
CONFigure:ADEMod:RESults:FM:DETector<det>:STATe on page 170
CONFigure:ADEMod:RESults:PM:DETector<det>:STATe on page 170
Overwrite mode: the detector value is overwritten by each sweep.
This is the default setting.
The maximum value is determined over several sweeps and displayed. The R&S FSMR3 saves each result only if the new value is
greater than the previous one.
The average result is determined over all sweeps.
Reference Value
Defines the reference value to be used for relative demodulation results and recalculates the results. If necessary, the detector is activated.
Note: A reference value 0 would provide infinite results and is thus automatically cor-
rected to 0.1.
Remote command:
CONFigure:ADEMod:RESults:AM:DETector<det>:REFerence on page 170
CONFigure:ADEMod:RESults:FM:DETector<det>:REFerence on page 170
CONFigure:ADEMod:RESults:PM:DETector<det>:REFerence on page 170
Meas -> Reference
Sets the Reference Value to be used for relative demodulation results to the currently
measured value for all relative detectors.
Note: A reference value 0 would provide infinite results and is thus automatically cor-
rected to 0.1.
If necessary, the detectors are activated.
Remote command:
CONFigure:ADEMod:RESults:AM:DETector<det>:REFerence:MEAStoref<t>
on page 171
CONFigure:ADEMod:RESults:FM:DETector<det>:REFerence:MEAStoref<t>
on page 171
CONFigure:ADEMod:RESults:PM:DETector<det>:REFerence:MEAStoref<t>
on page 171
63User Manual 1179.5147.02 ─ 02
Page 64

R&S®FSMR3-K7
5.7.7 Settling time
Configuration
Demodulation
Access: "Overview" > "Demod Settings" > "Settling Time"
Or: "Meas Setup" > "Demod" > "Settling Time" tab
The settling time defines when the signal remains within a specified target corridor. The
corridor is defined by the upper and lower settling limit. The function is available for all
time domain displays.
If enabled, the time is determined by evaluating the signal values from the end of the
measurement. The last position at which the signal exceeds the corridor is the settling
time. The settling time is defined with reference to the start of the data acquisition or
the trigger event. A possible trigger offset is not considered.
The settling time is indicated by a temporary marker in the time domain diagram. The
result is also indicated in the "result summary". The settling time is evaluated for each
time domain window for the selected trace (see "Selected Trace" on page 50).
64User Manual 1179.5147.02 ─ 02
Page 65

R&S®FSMR3-K7
Configuration
Demodulation
State..............................................................................................................................65
Upper Settling Limit.......................................................................................................65
Lower Settling Limit.......................................................................................................65
State
Enables or disables the calculation and display of the settling time.
Remote command:
[SENSe:]ADEMod:SETTling:TIME:STATe on page 173
Result: [SENSe:]ADEMod:SETTling:TIME:RESult<t>? on page 200
Upper Settling Limit
Defines the upper limit of the settling time corridor. The value is defined with reference
to the reference value, see also "Reference Value" on page 59 and "Zero Phase Refer-
ence Position (PM Time Domain only)" on page 51.
Remote command:
[SENSe:]ADEMod:SETTling:TIME:LIMit:UPPer on page 173
Lower Settling Limit
Defines the lower limit of the settling time corridor. The value is defined with reference
to the reference value, see also "Reference Value" on page 59 and "Zero Phase Refer-
ence Position (PM Time Domain only)" on page 51.
Remote command:
[SENSe:]ADEMod:SETTling:TIME:LIMit:LOWer on page 172
65User Manual 1179.5147.02 ─ 02
Page 66

R&S®FSMR3-K7
5.8 Adjusting settings automatically
Configuration
Adjusting settings automatically
Access: [AUTO SET]
Some settings can be adjusted by the R&S FSMR3 automatically according to the current measurement settings. To do so, a measurement is performed. You can configure
this measurement.
Adjusting settings automatically during triggered measurements
When you select an auto adjust function, a measurement is performed to determine
the optimal settings. If you select an auto adjust function for a triggered measurement,
you are asked how you want the R&S FSMR3 to behave:
●
(default:) The measurement for adjustment waits for the next trigger
●
The measurement for adjustment is performed without waiting for a trigger.
The trigger source is temporarily set to "Free Run". After the measurement is completed, the original trigger source is restored. The trigger level is adjusted as follows:
– For IF Power and RF Power triggers:
Trigger Level = Reference Level - 15 dB
– For Video trigger:
Trigger Level = 85 %
Remote command:
[SENSe:]ADJust:CONFigure:TRIGger on page 177
Adjusting all Determinable Settings Automatically (Auto All)........................................ 66
Adjusting the Center Frequency Automatically (Auto Frequency)................................ 66
AF Auto Scale............................................................................................................... 67
Setting the Reference Level Automatically (Auto Level)...............................................67
Resetting the Automatic Measurement Time (Meastime Auto).....................................67
Changing the Automatic Measurement Time (Meastime Manual)................................ 67
Upper Level Hysteresis.................................................................................................68
Lower Level Hysteresis.................................................................................................68
Adjusting all Determinable Settings Automatically (Auto All)
Activates all automatic adjustment functions for the current measurement settings,
including:
●
Auto Frequency
●
Auto Level
●
"AF Auto Scale" on page 60
Remote command:
[SENSe:]ADJust:ALL on page 174
Adjusting the Center Frequency Automatically (Auto Frequency)
The R&S FSMR3000 adjusts the center frequency automatically.
66User Manual 1179.5147.02 ─ 02
Page 67

R&S®FSMR3-K7
Configuration
Adjusting settings automatically
The optimum center frequency is the frequency with the highest S/N ratio in the frequency span. As this function uses the signal counter, it is intended for use with sinusoidal signals.
Remote command:
[SENSe:]ADJust:FREQuency on page 177
AF Auto Scale
Activates automatic scaling of the y-axis for AF measurements. RF power and RF
spectrum measurements are not affected by the auto-scaling.
Remote command:
[SENSe:]ADJust:SCALe[:Y]:AUTO[:CONTinuous] on page 177
Setting the Reference Level Automatically (Auto Level)
Automatically determines a reference level which ensures that no overload occurs at
the R&S FSMR3000 for the current input data. At the same time, the internal attenuators are adjusted. As a result, the signal-to-noise ratio is optimized, while signal compression and clipping are minimized.
To determine the required reference level, a level measurement is performed on the
R&S FSMR3000.
If necessary, you can optimize the reference level further. Decrease the attenuation
level manually to the lowest possible value before an overload occurs, then decrease
the reference level in the same way.
You can change the measurement time for the level measurement if necessary (see
"Changing the Automatic Measurement Time (Meastime Manual)" on page 67).
Remote command:
[SENSe:]ADJust:LEVel on page 177
Resetting the Automatic Measurement Time (Meastime Auto)
Resets the measurement duration for automatic settings to the default value.
Remote command:
[SENSe:]ADJust:CONFigure:LEVel:DURation:MODE on page 175
Changing the Automatic Measurement Time (Meastime Manual)
This function allows you to change the measurement duration for automatic setting
adjustments. Enter the value in seconds.
Note: The maximum measurement duration depends on the currently selected measurement and the installed (optional) hardware. Thus, the measurement duration
actually used to determine the automatic settings can be shorter than the value you
define here.
Remote command:
[SENSe:]ADJust:CONFigure:LEVel:DURation:MODE on page 175
[SENSe:]ADJust:CONFigure:LEVel:DURation on page 175
67User Manual 1179.5147.02 ─ 02
Page 68

R&S®FSMR3-K7
Configuration
Adjusting settings automatically
Upper Level Hysteresis
When the reference level is adjusted automatically using the Auto Level function, the
internal attenuators and the preamplifier are also adjusted. To avoid frequent adaptation due to small changes in the input signal, you can define a hysteresis. This setting
defines an upper threshold the signal must exceed (compared to the last measurement) before the reference level is adapted automatically.
Remote command:
[SENSe:]ADJust:CONFigure:HYSTeresis:UPPer on page 176
Lower Level Hysteresis
When the reference level is adjusted automatically using the Auto Level function, the
internal attenuators and the preamplifier are also adjusted. To avoid frequent adaptation due to small changes in the input signal, you can define a hysteresis. This setting
defines a lower threshold the signal must fall below (compared to the last measurement) before the reference level is adapted automatically.
Remote command:
[SENSe:]ADJust:CONFigure:HYSTeresis:LOWer on page 176
68User Manual 1179.5147.02 ─ 02
Page 69

R&S®FSMR3-K7
6 Analysis
6.1 Trace settings
Analysis
Trace settings
Access: "Overview" > "Analysis"
General result analysis settings concerning the trace, markers, lines etc. are identical
to the analysis functions in the base unit except for the special marker functions.
For a description of the lines functionality, see the R&S FSMR3 User Manual.
The remote commands required to perform these tasks are described in Chapter 11,
"Remote commands for Analog Demodulation", on page 109.
● Trace settings..........................................................................................................69
● Spectrogram settings.............................................................................................. 72
● Trace / data export configuration............................................................................ 76
● Working with markers in the R&S FSMR3000 Analog Demodulation application...79
Access: "Overview" > "Analysis" > "Traces"
You can configure the settings for up to 6 individual traces in the same result display.
Each trace is displayed in a different color, indicated in the window title bar and the
trace settings.
In the R&S FSMR3000 Analog Demodulation application, when you configure the
traces for a window with a specific evaluation (e.g. AM time domain), the traces in all
windows with the same evaluation are configured identically.
Trace data can also be exported to an ASCII file for further analysis. For details see
Chapter 6.3, "Trace / data export configuration", on page 76.
69User Manual 1179.5147.02 ─ 02
Page 70

R&S®FSMR3-K7
Analysis
Trace settings
Trace 1/Trace 2/Trace 3/Trace 4/Trace 5/Trace 6.........................................................70
Trace Mode...................................................................................................................70
Detector.........................................................................................................................71
Hold...............................................................................................................................71
Average Mode...............................................................................................................71
Average Count.............................................................................................................. 72
Predefined Trace Settings - Quick Config.....................................................................72
Trace 1/Trace 2/Trace 3/Trace 4/Trace 5/Trace 6
Selects the corresponding trace for configuration. The currently selected trace is highlighted.
Remote command:
Selected via numeric suffix of:TRACe<1...6> commands
DISPlay[:WINDow<n>][:SUBWindow<w>]:TRACe<t>[:STATe] on page 211
Trace Mode
Defines the update mode for subsequent traces.
"Clear/ Write"
"Max Hold"
"Min Hold"
"Average"
"View"
"Blank"
Overwrite mode (default): the trace is overwritten by each sweep.
The maximum value is determined over several sweeps and dis-
played. The R&S FSMR3 saves each trace point in the trace memory
only if the new value is greater than the previous one.
The minimum value is determined from several measurements and
displayed. The R&S FSMR3 saves each trace point in the trace memory only if the new value is lower than the previous one.
The average is formed over several sweeps.
The current contents of the trace memory are frozen and displayed.
Removes the selected trace from the display.
70User Manual 1179.5147.02 ─ 02
Page 71

R&S®FSMR3-K7
Analysis
Trace settings
Remote command:
DISPlay[:WINDow<n>][:SUBWindow<w>]:TRACe<t>:MODE on page 209
Detector
Defines the trace detector to be used for trace analysis.
"Auto"
"Type"
Remote command:
[SENSe:][WINDow<n>:]DETector<t>[:FUNCtion] on page 215
[SENSe:][WINDow<n>:]DETector<t>[:FUNCtion]:AUTO on page 215
Hold
If activated, traces in "Min Hold", "Max Hold" and "Average" mode are not reset after
specific parameter changes have been made.
Normally, the measurement is started again after parameter changes, before the measurement results are analyzed (e.g. using a marker). In all cases that require a new
measurement after parameter changes, the trace is reset automatically to avoid false
results (e.g. with span changes). For applications that require no reset after parameter
changes, the automatic reset can be switched off.
The default setting is off.
Remote command:
DISPlay[:WINDow<n>][:SUBWindow<w>]:TRACe<t>:MODE:HCONtinuous
on page 211
(default:) Selects the optimum detector for the selected trace and filter mode
Defines the selected detector type.
Average Mode
Defines the mode with which the trace is averaged over several sweeps.
This setting is generally applicable if trace mode "Average" is selected.
For FFT sweeps, the setting also affects the VBW (regardless of whether the trace is
averaged).
(See the chapter on ACLR power measurements in the R&S FSMR3 User Manual.)
How many sweeps are averaged is defined by the "Average Count" on page 72.
"Linear"
"Logarithmic"
"Power"
The power level values are converted into linear units before averaging. After the averaging, the data is converted back into its original
unit.
For logarithmic scaling, the values are averaged in dBm. For linear
scaling, the behavior is the same as with linear averaging.
Activates linear power averaging.
The power level values are converted into unit Watt before averaging.
After the averaging, the data is converted back into its original unit.
Use this mode to average power values in Volts or Amperes correctly.
In particular, for small VBW values (smaller than the RBW), use
power averaging mode for correct power measurements in FFT
sweep mode.
71User Manual 1179.5147.02 ─ 02
Page 72

R&S®FSMR3-K7
Analysis
Spectrogram settings
Remote command:
[SENSe:]AVERage<n>:TYPE on page 214
Average Count
Determines the number of averaging or maximum search procedures If the trace
modes "Average", "Max Hold" or "Min Hold" are set.
In continuous sweep mode, if sweep count = 0 (default), averaging is performed over
10 sweeps. For sweep count =1, no averaging, Max Hold or Min Hold operations are
performed.
Remote command:
[SENSe:]AVERage<n>:COUNt on page 214
Predefined Trace Settings - Quick Config
Commonly required trace settings have been predefined and can be applied very
quickly by selecting the appropriate button.
Function Trace Settings
Preset All Traces Trace 1: Clear Write
Traces 2-6: Blank
Set Trace Mode
Max | Avg | Min
Set Trace Mode
Max | ClrWrite | Min
Trace 1: Max Hold
Trace 2: Average
Trace 3: Min Hold
Traces 4-6: Blank
Trace 1: Max Hold
Trace 2: Clear Write
Trace 3: Min Hold
Traces 4-6: Blank
6.2 Spectrogram settings
Access: [TRACE] > "Spectrogram Config"
The individual settings available for spectrogram display are described here. For settings on color mapping, see Chapter 6.2.2, "Color map settings", on page 75.
Settings concerning the frames and how they are handled during a sweep are provided
as additional sweep settings for spectrogram display.
See Chapter 5.5, "Data acquisition", on page 43.
● General spectrogram settings.................................................................................73
● Color map settings.................................................................................................. 75
72User Manual 1179.5147.02 ─ 02
Page 73

R&S®FSMR3-K7
6.2.1 General spectrogram settings
Analysis
Spectrogram settings
Access: [TRACE] > "Spectrogram Config"
This section describes general settings for spectrogram display.
State..............................................................................................................................73
Select Frame.................................................................................................................73
History Depth................................................................................................................ 73
Time Stamp...................................................................................................................74
Color Mapping...............................................................................................................74
Continuous Sweep / Run Cont......................................................................................74
Single Sweep / Run Single............................................................................................74
Clear Spectrogram........................................................................................................75
State
Activates and deactivates a Spectrogram subwindow.
"Split"
"Full"
"Off"
Remote command:
CALCulate<n>:SPECtrogram:LAYout on page 205
Displays the Spectrogram as a subwindow in the original result display.
Displays the Spectrogram in a subwindow in the full size of the original result display.
Closes the Spectrogram subwindow.
Select Frame
Selects a specific frame, loads the corresponding trace from the memory, and displays
it in the Spectrum window.
Note that activating a marker or changing the position of the active marker automatically selects the frame that belongs to that marker.
This function is only available in single sweep mode or if the sweep is stopped, and
only if a spectrogram is selected.
The most recent frame is number 0, all previous frames have a negative number.
For more details, see the R&S FSMR3 User Manual.
Remote command:
CALCulate<n>:SPECtrogram:FRAMe:SELect on page 204
History Depth
Sets the number of frames that the R&S FSMR3 stores in its memory.
The maximum number of frames depends on the Sweep Points.
For an overview of the maximum number of frames depending on the number of
sweep points, see the R&S FSMR3 User Manual.
If the memory is full, the R&S FSMR3 deletes the oldest frames stored in the memory
and replaces them with the new data.
Remote command:
CALCulate<n>:SPECtrogram:HDEPth on page 204
73User Manual 1179.5147.02 ─ 02
Page 74

R&S®FSMR3-K7
Analysis
Spectrogram settings
Time Stamp
Activates and deactivates the timestamp. The timestamp shows the system time while
the measurement is running. In single sweep mode or if the sweep is stopped, the
timestamp shows the time and date of the end of the sweep.
When active, the timestamp replaces the display of the frame number.
Remote command:
CALCulate<n>:SPECtrogram:TSTamp[:STATe] on page 206
CALCulate<n>:SPECtrogram:TSTamp:DATA? on page 206
Color Mapping
Opens the "Color Mapping" dialog.
For details see the R&S FSMR3 User Manual.
Continuous Sweep / Run Cont
After triggering, starts the sweep and repeats it continuously until stopped. This is the
default setting.
While the measurement is running, the "Continuous Sweep" softkey and the [RUN
CONT] key are highlighted. The running measurement can be aborted by selecting the
highlighted softkey or key again. The results are not deleted until a new measurement
is started.
Note: Sequencer. If the Sequencer is active, the "Continuous Sweep" softkey only controls the sweep mode for the currently selected channel. However, the sweep mode
only takes effect the next time the Sequencer activates that channel, and only for a
channel-defined sequence. In this case, a channel in continuous sweep mode is swept
repeatedly.
Furthermore, the [RUN CONT] key controls the Sequencer, not individual sweeps.
[RUN CONT] starts the Sequencer in continuous mode.
For details on the Sequencer, see the R&S FSMR3 User Manual.
Remote command:
INITiate<n>:CONTinuous on page 179
Single Sweep / Run Single
After triggering, starts the number of sweeps set in "Sweep Count". The measurement
stops after the defined number of sweeps has been performed.
While the measurement is running, the "Single Sweep" softkey and the [RUN SINGLE]
key are highlighted. The running measurement can be aborted by selecting the highlighted softkey or key again.
Note: Sequencer. If the Sequencer is active, the "Single Sweep" softkey only controls
the sweep mode for the currently selected channel. However, the sweep mode only
takes effect the next time the Sequencer activates that channel, and only for a channel-defined sequence. In this case, the Sequencer sweeps a channel in single sweep
mode only once.
Furthermore, the [RUN SINGLE] key controls the Sequencer, not individual sweeps.
[RUN SINGLE] starts the Sequencer in single mode.
If the Sequencer is off, only the evaluation for the currently displayed channel is updated.
74User Manual 1179.5147.02 ─ 02
Page 75

R&S®FSMR3-K7
6.2.2 Color map settings
Analysis
Spectrogram settings
For details on the Sequencer, see the R&S FSMR3 User Manual.
Remote command:
INITiate<n>[:IMMediate] on page 180
Clear Spectrogram
Resets the spectrogram result display and clears the history buffer.
This function is only available if a spectrogram is selected.
Remote command:
CALCulate<n>:SPECtrogram:CLEar[:IMMediate] on page 203
Access: "Overview" > "Analysis" > "Traces" > "Spectrogram" > "Color Mapping"
or: [TRACE] > "Spectrogram Config" > "Color Mapping"
In addition to the available color settings, the dialog box displays the current color map
and provides a preview of the display with the current settings.
Figure 6-1: Color Mapping dialog box
1 = Color map: shows the current color distribution
2 = Preview pane: shows a preview of the spectrogram with any changes that you make to the color
scheme
3 = Color curve pane: graphical representation of all settings available to customize the color scheme
4/5 = Color range start and stop sliders: define the range of the color map or amplitudes for the spectrogram
6 = Color curve slider: adjusts the focus of the color curve
7 = Histogram: shows the distribution of measured values
8 = Scale of the horizontal axis (value range)
75User Manual 1179.5147.02 ─ 02
Page 76

R&S®FSMR3-K7
Analysis
Trace / data export configuration
Start / Stop.................................................................................................................... 76
Shape............................................................................................................................76
Hot/Cold/Radar/Grayscale............................................................................................ 76
Auto...............................................................................................................................76
Set to Default................................................................................................................ 76
Close.............................................................................................................................76
Start / Stop
Defines the lower and upper boundaries of the value range of the spectrogram.
Remote command:
DISPlay[:WINDow<n>]:SPECtrogram:COLor:LOWer on page 207
DISPlay[:WINDow<n>]:SPECtrogram:COLor:UPPer on page 208
Shape
Defines the shape and focus of the color curve for the spectrogram result display.
"-1 to <0"
"0"
">0 to 1"
Remote command:
DISPlay[:WINDow<n>]:SPECtrogram:COLor:SHAPe on page 208
More colors are distributed among the lower values
Colors are distributed linearly among the values
More colors are distributed among the higher values
Hot/Cold/Radar/Grayscale
Sets the color scheme for the spectrogram.
Remote command:
DISPlay[:WINDow<n>]:SPECtrogram:COLor[:STYLe] on page 208
Auto
Defines the color range automatically according to the existing measured values for
optimized display.
Set to Default
Sets the color mapping to the default settings.
Remote command:
DISPlay[:WINDow<n>]:SPECtrogram:COLor:DEFault on page 207
Close
Saves the changes and closes the dialog box.
6.3 Trace / data export configuration
Access: "Save" > "Export" > "Trace Export Configuration"
Or: [TRACE] > "Trace Config" > "Trace / Data Export"
76User Manual 1179.5147.02 ─ 02
Page 77

R&S®FSMR3-K7
Analysis
Trace / data export configuration
The standard data management functions (e.g. saving or loading instrument settings)
that are available for all R&S FSMR3 applications are not described here.
See the R&S FSMR3000 base unit user manual for a description of the standard functions.
Export all Traces and all Table Results.........................................................................77
Include Instrument & Measurement Settings................................................................ 77
Trace to Export..............................................................................................................78
Decimal Separator........................................................................................................ 78
Export Trace to ASCII File.............................................................................................78
└ File Type......................................................................................................... 79
└ Decimal Separator.......................................................................................... 79
└ File Explorer....................................................................................................79
Export all Traces and all Table Results
Selects all displayed traces and result tables (e.g. "Result Summary", marker table
etc.) in the current application for export to an ASCII file.
Alternatively, you can select one specific trace only for export (see Trace to Export).
The results are output in the same order as they are displayed on the screen: window
by window, trace by trace, and table row by table row.
Remote command:
FORMat:DEXPort:TRACes on page 196
Include Instrument & Measurement Settings
Includes additional instrument and measurement settings in the header of the export
file for result data.
See the R&S FSMR3000 base unit user manual for details.
Remote command:
FORMat:DEXPort:HEADer on page 195
77User Manual 1179.5147.02 ─ 02
Page 78

R&S®FSMR3-K7
Analysis
Trace / data export configuration
Trace to Export
Defines an individual trace to be exported to a file.
This setting is not available if Export all Traces and all Table Results is selected.
Decimal Separator
Defines the decimal separator for floating-point numerals for the data export/import
files. Evaluation programs require different separators in different languages.
Remote command:
FORMat:DEXPort:DSEParator on page 195
Export Trace to ASCII File
Saves the selected trace or all traces in the currently active result display to the specified file and directory in the selected ASCII format.
"File Explorer": Instead of using the file manager of the R&S FSMR3 firmware, you can
also use the Microsoft Windows File Explorer to manage files.
Note: Secure user mode.
In secure user mode, settings that are stored on the instrument are stored to volatile
memory, which is restricted to 256 MB. Thus, a "memory limit reached" error can occur
although the hard disk indicates that storage space is still available.
78User Manual 1179.5147.02 ─ 02
Page 79

R&S®FSMR3-K7
Analysis
Working with markers in the R&S FSMR3000 Analog Demodulation application
To store data permanently, select an external storage location such as a USB memory
device.
For details, see "Protecting Data Using the Secure User Mode" in the "Data Management" section of the R&S FSMR3000 base unit user manual.
Remote command:
MMEMory:STORe<n>:TRACe on page 194
File Type ← Export Trace to ASCII File
Determines the format of the ASCII file to be imported or exported.
Depending on the external program in which the data file was created or is evaluated,
a comma-separated list (CSV) or a plain data format (DAT) file is required.
Remote command:
FORMat:DEXPort:FORMat on page 193
Decimal Separator ← Export Trace to ASCII File
Defines the decimal separator for floating-point numerals for the data export/import
files. Evaluation programs require different separators in different languages.
Remote command:
FORMat:DEXPort:DSEParator on page 195
File Explorer ← Export Trace to ASCII File
Opens the Microsoft Windows File Explorer.
Remote command:
not supported
6.4 Working with markers in the R&S FSMR3000 Analog Demodulation application
Access: "Overview" > "Analysis"
Basically, markers in the R&S FSMR3000 Analog Demodulation application are very
similar to those in the Spectrum application. However, some additional functions are
available.
● Marker settings........................................................................................................79
● Marker search settings and positioning functions................................................... 85
● Marker search settings for spectrograms................................................................87
● Marker function configuration..................................................................................90
6.4.1 Marker settings
Access: "Overview" > "Analysis" > "Marker" > "Markers"
79User Manual 1179.5147.02 ─ 02
Page 80

R&S®FSMR3-K7
6.4.1.1 Individual marker setup
Analysis
Working with markers in the R&S FSMR3000 Analog Demodulation application
Or: "Marker" > "Markers"
● Individual marker setup...........................................................................................80
● General marker settings..........................................................................................82
Access: "Overview" > "Analysis" > "Marker" > "Markers"
Or: "Marker" > "Markers" tab
In the R&S FSMR3000 Analog Demodulation application, up to 17 markers or delta
markers can be activated for each window simultaneously.
The markers are distributed among 3 tabs for a better overview. By default, the first
marker is defined as a normal marker, whereas all others are defined as delta markers
with reference to the first marker. All markers are assigned to trace 1, but only the first
marker is active.
Selected Marker............................................................................................................81
Marker State..................................................................................................................81
Marker Position X-value................................................................................................81
Marker Type..................................................................................................................81
Reference Marker......................................................................................................... 81
Linking to Another Marker.............................................................................................82
Assigning the Marker to a Trace................................................................................... 82
All Markers Off...............................................................................................................82
80User Manual 1179.5147.02 ─ 02
Page 81

R&S®FSMR3-K7
Analysis
Working with markers in the R&S FSMR3000 Analog Demodulation application
Selected Marker
Marker name. The marker which is currently selected for editing is highlighted orange.
Remote command:
Marker selected via suffix <m> in remote commands.
Marker State
Activates or deactivates the marker in the diagram.
Remote command:
CALCulate<n>:MARKer<m>[:STATe] on page 217
CALCulate<n>:DELTamarker<m>[:STATe] on page 220
Marker Position X-value
Defines the position (x-value) of the marker in the diagram. For normal markers, the
absolute position is indicated. For delta markers, the position relative to the reference
marker is provided.
Remote command:
CALCulate<n>:MARKer<m>:X on page 218
CALCulate<n>:DELTamarker<m>:X on page 221
Marker Type
Toggles the marker type.
The type for marker 1 is always "Normal", the type for delta marker 1 is always "Delta".
These types cannot be changed.
Note: If normal marker 1 is the active marker, switching the "Mkr Type" activates an
additional delta marker 1. For any other marker, switching the marker type does not
activate an additional marker, it only switches the type of the selected marker.
"Normal"
"Delta"
Remote command:
CALCulate<n>:MARKer<m>[:STATe] on page 217
CALCulate<n>:DELTamarker<m>[:STATe] on page 220
Reference Marker
Defines a marker as the reference marker which is used to determine relative analysis
results (delta marker values).
If the reference marker is deactivated, the delta marker referring to it is also deactivated.
If a fixed reference point is configured (see "Defining a Fixed Reference" on page 84),
the reference point ("FXD") can also be selected instead of another marker.
Remote command:
CALCulate<n>:DELTamarker<m>:MREFerence on page 220
A normal marker indicates the absolute value at the defined position
in the diagram.
A delta marker defines the value of the marker relative to the specified reference marker (marker 1 by default).
81User Manual 1179.5147.02 ─ 02
Page 82

R&S®FSMR3-K7
Analysis
Working with markers in the R&S FSMR3000 Analog Demodulation application
Linking to Another Marker
Links the current marker to the marker selected from the list of active markers. If the xaxis value of the initial marker is changed, the linked marker follows to the same position on the x-axis. Linking is off by default.
Using this function you can set two markers on different traces to measure the difference (e.g. between a max hold trace and a min hold trace or between a measurement
and a reference trace).
Remote command:
CALCulate<n>:MARKer<ms>:LINK:TO:MARKer<md> on page 216
CALCulate<n>:DELTamarker<ms>:LINK:TO:MARKer<md> on page 219
CALCulate<n>:DELTamarker<m>:LINK on page 219
Assigning the Marker to a Trace
The "Trace" setting assigns the selected marker to an active trace. The trace determines which value the marker shows at the marker position. If the marker was previously assigned to a different trace, the marker remains on the previous frequency or
time, but indicates the value of the new trace.
If a trace is turned off, the assigned markers and marker functions are also deactivated.
Remote command:
CALCulate<n>:MARKer<m>:TRACe on page 217
All Markers Off
Deactivates all markers in one step.
Remote command:
CALCulate<n>:MARKer<m>:AOFF on page 216
6.4.1.2 General marker settings
Access: "Overview" > "Analysis" > "Marker" > "Marker Settings"
Or: "Marker" > "Marker Settings" tab
Some general marker settings allow you to influence the marker behavior for all markers.
82User Manual 1179.5147.02 ─ 02
Page 83

R&S®FSMR3-K7
Analysis
Working with markers in the R&S FSMR3000 Analog Demodulation application
Marker Table Display.....................................................................................................83
Marker Info....................................................................................................................83
Marker Stepsize............................................................................................................ 84
Defining a Fixed Reference...........................................................................................84
Link Time Marker...........................................................................................................85
Link AF Spectrum Marker............................................................................................. 85
Marker Table Display
Defines how the marker information is displayed.
"On"
"Off"
"Auto"
Remote command:
DISPlay[:WINDow<n>]:MTABle on page 224
Marker Info
Turns the marker information displayed in the diagram on and off.
Displays the marker information in a table in a separate area beneath
the diagram.
No separate marker table is displayed.
If Marker Info is active, the marker information is displayed within the
diagram area.
(Default) If more than two markers are active, the marker table is displayed automatically.
If Marker Info is active, the marker information for up to two markers
is displayed in the diagram area.
83User Manual 1179.5147.02 ─ 02
Page 84

R&S®FSMR3-K7
Analysis
Working with markers in the R&S FSMR3000 Analog Demodulation application
Remote command:
DISPlay[:WINDow<n>]:MINFo[:STATe] on page 224
Marker Stepsize
Defines the size of the steps that the marker position is moved using the rotary knob.
"Standard"
"Sweep
Points"
Remote command:
CALCulate<n>:MARKer<m>:X:SSIZe on page 223
The marker position is moved in steps of (Span/1000), which corresponds approximately to the number of pixels for the default display
of 1001 sweep points. This setting is most suitable to move the
marker over a larger distance.
The marker position is moved from one sweep point to the next. This
setting is required for a very precise positioning if more sweep points
are collected than the number of pixels that can be displayed on the
screen. It is the default mode.
Defining a Fixed Reference
Instead of using a reference marker whose position can vary depending on the measurement results, you can define a fixed reference marker for trace analysis.
Note that this function is not available in all result displays.
For "State" = "On", a vertical and a horizontal red display line are displayed, marked as
"FXD". The normal marker 1 is activated and set to the peak value of the trace
assigned to marker 1, and a delta marker to the next peak. The fixed reference marker
is set to the position of marker 1 at the peak value. The delta marker refers to the fixed
reference marker.
The "Level" and "Frequency" or "Time" settings define the position and value of the reference marker. To move the fixed reference, move the red display lines marked "FXD"
in the diagram, or change the position settings in the "Marker Settings" tab of the
"Marker" dialog box.
Peak Search sets the fixed reference marker to the current maximum value of the
trace assigned to marker 1.
If activated, the fixed reference marker ("FXD") can also be selected as a Reference
Marker instead of another marker.
Remote command:
CALCulate<n>:DELTamarker<m>:FUNCtion:FIXed[:STATe] on page 241
CALCulate<n>:DELTamarker<m>:FUNCtion:FIXed:RPOint:Y on page 240
84User Manual 1179.5147.02 ─ 02
Page 85

R&S®FSMR3-K7
6.4.2 Marker search settings and positioning functions
Analysis
Working with markers in the R&S FSMR3000 Analog Demodulation application
CALCulate<n>:DELTamarker<m>:FUNCtion:FIXed:RPOint:X on page 239
CALCulate<n>:DELTamarker<m>:FUNCtion:FIXed:RPOint:MAXimum[:PEAK]
on page 239
Link Time Marker
Links the markers in all time domain diagrams.
Remote command:
CALCulate<n>:MARKer<m>:LINK on page 223
Link AF Spectrum Marker
Links the markers in all AF spectrum displays.
Remote command:
CALCulate<n>:MARKer<m>:LINK on page 223
Access: "Overview" > "Analysis" > "Marker" > "Search"
or: "Marker" > "Search"
Several functions are available to set the marker to a specific position very quickly and
easily, or to use the current marker position to define another characteristic value. To
determine the required marker position, searches are performed. You can influence the
search results using special settings.
The remote commands required to define these settings are described in Chap-
ter 11.8.3, "Working with markers remotely", on page 215.
● Marker search settings............................................................................................85
● Positioning functions............................................................................................... 86
6.4.2.1 Marker search settings
Access: "Overview" > "Analysis" > "Marker" > "Search"
or: "Marker" > "Search"
Markers are commonly used to determine peak values, i.e. maximum or minimum values, in the measured signal. Configuration settings allow you to influence the peak
search results.
Peak Excursion............................................................................................................. 85
Peak Excursion
Defines the minimum level value by which a signal must rise or fall so that it is identified as a maximum or a minimum by the search functions.
Entries from 0 dB to 80 dB are allowed; the resolution is 0.1 dB. The default setting for
the peak excursion is 6 dB.
For Analog Modulation Analysis, the unit and value range depend on the selected
result display type.
85User Manual 1179.5147.02 ─ 02
Page 86

R&S®FSMR3-K7
6.4.2.2 Positioning functions
Analysis
Working with markers in the R&S FSMR3000 Analog Demodulation application
Remote command:
CALCulate<n>:MARKer<m>:PEXCursion on page 234
The following functions set the currently selected marker to the result of a peak search
or set other characteristic values to the current marker value.
Select Marker................................................................................................................86
Peak Search..................................................................................................................86
Search Next Peak......................................................................................................... 86
Search Minimum........................................................................................................... 87
Search Next Minimum...................................................................................................87
Select Marker
The "Select Marker" function opens a dialog box to select and activate or deactivate
one or more markers quickly.
Remote command:
CALCulate<n>:MARKer<m>[:STATe] on page 217
CALCulate<n>:DELTamarker<m>[:STATe] on page 220
Peak Search
Sets the selected marker/delta marker to the maximum of the trace. If no marker is
active, marker 1 is activated.
Remote command:
CALCulate<n>:MARKer<m>:MAXimum[:PEAK] on page 235
CALCulate<n>:DELTamarker<m>:MAXimum[:PEAK] on page 237
Search Next Peak
Sets the selected marker/delta marker to the next (lower) maximum of the assigned
trace. If no marker is active, marker 1 is activated.
86User Manual 1179.5147.02 ─ 02
Page 87

R&S®FSMR3-K7
Analysis
Working with markers in the R&S FSMR3000 Analog Demodulation application
Remote command:
CALCulate<n>:MARKer<m>:MAXimum:NEXT on page 235
CALCulate<n>:MARKer<m>:MAXimum:RIGHt on page 235
CALCulate<n>:MARKer<m>:MAXimum:LEFT on page 235
CALCulate<n>:DELTamarker<m>:MAXimum:NEXT on page 237
CALCulate<n>:DELTamarker<m>:MAXimum:RIGHt on page 238
CALCulate<n>:DELTamarker<m>:MAXimum:LEFT on page 237
Search Minimum
Sets the selected marker/delta marker to the minimum of the trace. If no marker is
active, marker 1 is activated.
Remote command:
CALCulate<n>:MARKer<m>:MINimum[:PEAK] on page 236
CALCulate<n>:DELTamarker<m>:MINimum[:PEAK] on page 238
Search Next Minimum
Sets the selected marker/delta marker to the next (higher) minimum of the selected
trace. If no marker is active, marker 1 is activated.
Remote command:
CALCulate<n>:MARKer<m>:MINimum:NEXT on page 236
CALCulate<n>:MARKer<m>:MINimum:LEFT on page 236
CALCulate<n>:MARKer<m>:MINimum:RIGHt on page 236
CALCulate<n>:DELTamarker<m>:MINimum:NEXT on page 238
CALCulate<n>:DELTamarker<m>:MINimum:LEFT on page 238
CALCulate<n>:DELTamarker<m>:MINimum:RIGHt on page 239
6.4.3 Marker search settings for spectrograms
Access: "Overview" > "Analysis" > "Markers" > "Search"
Spectrograms show not only the current sweep results, but also the sweep history.
Thus, when searching for peaks, you must define the search settings within a single
time frame (x-direction) and within several time frames (y-direction).
These settings are only available for spectrogram displays.
87User Manual 1179.5147.02 ─ 02
Page 88

R&S®FSMR3-K7
Analysis
Working with markers in the R&S FSMR3000 Analog Demodulation application
Search Mode for Next Peak in X-Direction................................................................... 88
Search Mode for Next Peak in Y-Direction....................................................................88
Marker Search Type......................................................................................................89
Marker Search Area......................................................................................................89
Peak Excursion............................................................................................................. 89
Search Mode for Next Peak in X-Direction
Selects the search mode for the next peak search within the currently selected frame.
"Left"
"Absolute"
"Right"
Remote command:
Chapter 11.8.3.5, "Positioning the marker", on page 234
Search Mode for Next Peak in Y-Direction
Selects the search mode for the next peak search within all frames at the current
marker position.
"Up"
"Absolute"
"Down"
Determines the next maximum/minimum to the left of the current
peak.
Determines the next maximum/minimum to either side of the current
peak.
Determines the next maximum/minimum to the right of the current
peak.
Determines the next maximum/minimum above the current peak (in
more recent frames).
Determines the next maximum/minimum above or below the current
peak (in all frames).
Determines the next maximum/minimum below the current peak (in
older frames).
88User Manual 1179.5147.02 ─ 02
Page 89

R&S®FSMR3-K7
Analysis
Working with markers in the R&S FSMR3000 Analog Demodulation application
Remote command:
CALCulate<n>:MARKer<m>:SPECtrogram:Y:MAXimum:ABOVe on page 227
CALCulate<n>:DELTamarker<m>:SPECtrogram:Y:MAXimum:ABOVe
on page 231
CALCulate<n>:MARKer<m>:SPECtrogram:Y:MAXimum:BELow on page 227
CALCulate<n>:DELTamarker<m>:SPECtrogram:Y:MAXimum:BELow
on page 232
CALCulate<n>:MARKer<m>:SPECtrogram:Y:MAXimum:NEXT on page 227
CALCulate<n>:DELTamarker<m>:SPECtrogram:Y:MAXimum:NEXT on page 232
CALCulate<n>:MARKer<m>:SPECtrogram:Y:MINimum:ABOVe on page 228
CALCulate<n>:DELTamarker<m>:SPECtrogram:Y:MINimum:ABOVe
on page 232
CALCulate<n>:MARKer<m>:SPECtrogram:Y:MINimum:BELow on page 228
CALCulate<n>:DELTamarker<m>:SPECtrogram:Y:MINimum:BELow
on page 233
CALCulate<n>:MARKer<m>:SPECtrogram:Y:MINimum:NEXT on page 228
CALCulate<n>:DELTamarker<m>:SPECtrogram:Y:MINimum:NEXT on page 233
Marker Search Type
Defines the type of search to be performed in the spectrogram.
"X-Search"
"Y-Search"
"XY-Search"
Remote command:
Defined by the search function, see Chapter 11.8.3.3, "Marker search (spectrograms)",
on page 224
Marker Search Area
Defines which frames the search is performed in.
"Visible"
"Memory"
Remote command:
CALCulate<n>:MARKer<m>:SPECtrogram:SARea on page 226
CALCulate<n>:DELTamarker<m>:SPECtrogram:SARea on page 230
Peak Excursion
Defines the minimum level value by which a signal must rise or fall so that it is identified as a maximum or a minimum by the search functions.
Entries from 0 dB to 80 dB are allowed; the resolution is 0.1 dB. The default setting for
the peak excursion is 6 dB.
Searches only within the currently selected frame.
Searches within all frames but only at the current frequency position.
Searches in all frames at all positions.
Only the visible frames are searched.
All frames stored in the memory are searched.
For Analog Modulation Analysis, the unit and value range depend on the selected
result display type.
Remote command:
CALCulate<n>:MARKer<m>:PEXCursion on page 234
89User Manual 1179.5147.02 ─ 02
Page 90

R&S®FSMR3-K7
6.4.4 Marker function configuration
Analysis
Working with markers in the R&S FSMR3000 Analog Demodulation application
Access: "Overview" > "Analysis" > "Marker Functions" > "Phase Noise"
Special marker functions can be selected via the "Marker Function" dialog box.
The fixed reference marker is described under "Defining a Fixed Reference"
on page 84.
Not all marker functions are available for all evaluations. The following table indicates
which functions are available for which evaluations.
Evaluation n dB
down
AM/FM/PM time - - X X
AF/FM/PM spectrum X X X X
RF time X - X X
RF spectrum X X X X
Phase
Noise
Reference
Fixed
"Marker
Peak
List"
The remote commands required to define these settings are described in Chap-
ter 11.8.3.6, "Configuring special marker functions", on page 239.
The Fixed Reference Marker settings are described in "Defining a Fixed Reference"
on page 84.
● Measuring characteristic bandwidths (n db down marker)......................................91
● Phase noise measurement marker......................................................................... 92
● Marker peak list.......................................................................................................95
● Deactivating all marker functions............................................................................ 99
90User Manual 1179.5147.02 ─ 02
Page 91

R&S®FSMR3-K7
6.4.4.1 Measuring characteristic bandwidths (n db down marker)
Analysis
Working with markers in the R&S FSMR3000 Analog Demodulation application
Access: "Overview" > "Analysis" > "Marker Functions" > "n dB down" > "n dB Down
Config"
Or: [MKR FUNC] > "Select Marker Function" > "n dB down" > "n dB Down Config"
When characterizing the shape of a signal, the bandwidth at a specified offset from its
peak level is often of interest. The offset is specified as a relative decrease in amplitude of n dB. To measure this bandwidth, you could use several markers and delta
markers and determine the bandwidth manually. However, using the n dB down marker
function makes the task very simple and quick.
The n dB down marker function uses the current value of marker 1 as the reference
point. It activates two temporary markers T1 and T2 located on the signal, whose level
is n dB below the level of the reference point. Marker T1 is placed to the left and
marker T2 to the right of the reference marker. The default setting for n is 3 dB, but it
can be changed.
If a positive offset is entered, the markers T1 and T2 are placed below the active reference point. If a negative value is entered (for example for notch filter measurements),
the markers T1 and T2 are placed above the active reference point.
Figure 6-2: n dB down marker function
The following marker function results are displayed:
Table 6-1: n dB down marker function results
Label Description
M1 Current position and level of marker 1
ndB Offset value (n dB down)
91User Manual 1179.5147.02 ─ 02
Page 92

R&S®FSMR3-K7
Analysis
Working with markers in the R&S FSMR3000 Analog Demodulation application
Label Description
ndB down Bw /
PWid
Q-factor Center frequency / n-dB-down-bandwidth
T1, T2 Current position and level of the temporary markers
Determined bandwidth or pulse width (zero span) at the offset
Quality factor of the determined bandwidth (characteristic of damping or resonance)
If the required position for the temporary markers cannot be determined uniquely, for
example due to noise, dashes are displayed as a result.
Remote commands:
CALCulate<n>:MARKer<m>:FUNCtion:NDBDown:STATe on page 248
CALCulate<n>:MARKer<m>:FUNCtion:NDBDown:RESult? on page 247
n dB down Marker State................................................................................................92
n dB down Value........................................................................................................... 92
n dB down Marker State
Activates or deactivates the special n dB down marker function.
Remote command:
CALCulate<n>:MARKer<m>:FUNCtion:NDBDown:STATe on page 248
CALCulate<n>:MARKer<m>:FUNCtion:NDBDown:RESult? on page 247
n dB down Value
Defines the delta level from the reference marker 1 used to determine the bandwidth or
time span.
Remote command:
CALCulate<n>:MARKer<m>:FUNCtion:NDBDown:FREQuency? on page 246
CALCulate<n>:MARKer<m>:FUNCtion:NDBDown:TIME? on page 248
6.4.4.2 Phase noise measurement marker
Access: "Overview" > "Analysis" > "Marker Functions" > "Phase Noise" > "Phase
Noise Config"
Or: [MKR FUNC] > "Select Marker Function" > "Phase Noise" > "Phase Noise Config"
For each of the 16 markers, you can activate a phase noise measurement.
92User Manual 1179.5147.02 ─ 02
Page 93

R&S®FSMR3-K7
Analysis
Working with markers in the R&S FSMR3000 Analog Demodulation application
Note that phase noise markers are available:
●
for spectrum results
●
for normal markers
●
not for time domain results
Phase noise is unintentional modulation of a carrier; it creates frequencies next to the
carrier frequency. A phase noise measurement consists of noise density measurements at defined offsets from the carrier; the results are given in relation to the carrier
level (dBc). The phase noise marker function measures the noise power at the delta
markers referred to 1 Hz bandwidth. Marker 1 is used as the reference for the phase
noise measurement. By default, the current frequency and level of marker 1 are used
as the fixed reference marker. However, you can start a peak search to use the current
signal peak as the reference point, or you can define a reference point manually.
The reference point for the phase noise measurement is fixed. After phase noise measurement is started, you can set the reference level or the center frequency so that the
carrier is outside the displayed frequency range. You can also activate a notch filter to
suppress the carrier.
Alternatively, the reference point can be determined automatically by a peak search
after each sweep. Use this function to track a drifting source during a phase noise
measurement. The delta marker 2, which shows the phase noise measurement result,
keeps the delta frequency value. Thus, the phase noise measurement leads to reliable
results in a certain offset although the source is drifting. Only if the marker 2 reaches
the border of the span, the delta marker value is adjusted to be within the span. In
these cases, select a larger span.
The result of the phase noise measurement is the difference in level between the reference point and the noise power density. It is indicated as the function result of the
phase noise marker in the "marker table".
The sample detector is automatically used and the video bandwidth set to 0.1 times the
resolution bandwidth (RBW). The two settings are considered in the correction values
used for the noise power measurement. To obtain stable results, two pixels on the right
and the left of the delta marker position are taken for the measurement.
The individual marker settings correspond to those defined in the "Marker" dialog box.
Any settings to the marker state or type changed in the "Marker Function" dialog box
are also changed in the "Marker" dialog box and vice versa.
93User Manual 1179.5147.02 ─ 02
Page 94

R&S®FSMR3-K7
Analysis
Working with markers in the R&S FSMR3000 Analog Demodulation application
Remote commands:
CALCulate<n>:MARKer<m>:FUNCtion:PNOise[:STATe] on page 249
CALCulate<n>:MARKer<m>:FUNCtion:PNOise:RESult? on page 250
Phase Noise Measurement State................................................................................. 94
Switching All Phase Noise Measurements Off..............................................................95
Phase Noise Measurement State
Activates or deactivates phase noise measurement at the marker position in the diagram.
In the R&S FSMR3000 Analog Demodulation application, this function is only available
for normal markers.
94User Manual 1179.5147.02 ─ 02
Page 95

R&S®FSMR3-K7
6.4.4.3 Marker peak list
Analysis
Working with markers in the R&S FSMR3000 Analog Demodulation application
If activated, the normal markers display the phase noise measured at their current
position in the "marker table".
For details see Chapter 6.4.4.2, "Phase noise measurement marker", on page 92.
Remote command:
CALCulate<n>:MARKer<m>:FUNCtion:PNOise[:STATe] on page 249
CALCulate<n>:MARKer<m>:FUNCtion:PNOise:RESult? on page 250
Switching All Phase Noise Measurements Off
Deactivates phase noise measurement for all markers.
Remote command:
CALCulate<n>:MARKer<m>:FUNCtion:PNOise[:STATe] on page 249
Access: "Overview" > "Analysis" > "Marker Functions" > "Marker Peak List"
Or: [MKR FUNC] > "Marker Peak List"
A common measurement task is to determine peak values, i.e. maximum or minimum
signal levels. The R&S FSMR3 provides various peak search functions and applications:
●
Setting a marker to a peak value once (Peak Search)
●
Searching for a peak value within a restricted search area (Search Limits)
●
Creating a "marker table" with all or a defined number of peak values for one
sweep ("Marker Peak List")
●
Updating the marker position to the current peak value automatically after each
sweep (Auto Peak Search)
●
Creating a fixed reference marker at the current peak value of a trace (Fixed Reference)
Peak search limits
The peak search can be restricted to a search area. The search area is defined by limit
lines which are also indicated in the diagram. In addition, a minimum value (threshold)
can be defined as a further search condition.
When is a peak a peak? - Peak excursion
During a peak search, noise values are detected as a peak if the signal is very flat or
does not contain many peaks. Therefore, you can define a relative threshold ("Peak
Excursion"). The signal level must increase by the threshold value before falling again
before a peak is detected. To avoid identifying noise peaks as maxima or minima, enter
a peak excursion value that is higher than the difference between the highest and the
lowest value measured for the displayed inherent noise.
Effect of peak excursion settings (example)
The following figure shows a trace to be analyzed.
95User Manual 1179.5147.02 ─ 02
Page 96

R&S®FSMR3-K7
Analysis
Working with markers in the R&S FSMR3000 Analog Demodulation application
Figure 6-3: Trace example
The following table lists the peaks as indicated by the marker numbers in the diagram
above, as well as the minimum decrease in amplitude to either side of the peak:
Marker # Min. amplitude decrease to either side of the signal
1 80 dB
2 80 dB
3 55 dB
4 39 dB
5 32 dB
To eliminate the smaller peaks M3, M4 and M5 in the example above, a peak excursion of at least 60 dB is required. In this case, the amplitude must rise at least 60 dB
before falling again before a peak is detected.
Marker peak list
The marker peak list determines the frequencies and levels of peaks in the spectrum. It
is updated automatically after each sweep. How many peaks are displayed can be
defined, as well as the sort order. In addition, the detected peaks can be indicated in
the diagram. The peak list can also be exported to a file for analysis in an external
application.
Automatic peak search
A peak search can be repeated automatically after each sweep to keep the maximum
value as the reference point for a phase noise measurement. Automatic peak search is
useful to track a drifting source. The delta marker 2, which shows the phase noise
96User Manual 1179.5147.02 ─ 02
Page 97

R&S®FSMR3-K7
Analysis
Working with markers in the R&S FSMR3000 Analog Demodulation application
measurement result, keeps the delta frequency value. Therefore, the phase noise
measurement leads to reliable results in a certain offset although the source is drifting.
Using a peak as a fixed reference marker
Some results are analyzed in relation to a peak value, for example a carrier frequency
level. In this case, the maximum level can be determined by an initial peak search and
then be used as a reference point for further measurement results.
In the R&S FSMR3000 Analog Demodulation application, the search limits are not
available.
Remote commands:
CALCulate<n>:MARKer<m>:FUNCtion:FPEaks:STATe on page 244
TRAC? LIST,
Peak List State..............................................................................................................98
Sort Mode......................................................................................................................98
Maximum Number of Peaks..........................................................................................98
Peak Excursion............................................................................................................. 98
Display Marker Numbers...............................................................................................98
Export Peak List............................................................................................................98
97User Manual 1179.5147.02 ─ 02
Page 98

R&S®FSMR3-K7
Analysis
Working with markers in the R&S FSMR3000 Analog Demodulation application
Peak List State
Activates/deactivates the marker peak list. If activated, the peak list is displayed and
the peaks are indicated in the trace display.
For each listed peak, the frequency/time ("X-value") and level ("Y-Value") values are
given.
Remote command:
CALCulate<n>:MARKer<m>:FUNCtion:FPEaks:STATe on page 244
Sort Mode
Defines whether the peak list is sorted according to the x-values or y-values. In either
case, the values are sorted in ascending order.
Remote command:
CALCulate<n>:MARKer<m>:FUNCtion:FPEaks:SORT on page 243
Maximum Number of Peaks
Defines the maximum number of peaks to be determined and displayed.
Remote command:
CALCulate<n>:MARKer<m>:FUNCtion:FPEaks:LIST:SIZE on page 243
Peak Excursion
Defines the minimum level value by which a signal must rise or fall so that it is identified as a maximum or a minimum by the search functions.
Entries from 0 dB to 80 dB are allowed; the resolution is 0.1 dB. The default setting for
the peak excursion is 6 dB.
For Analog Modulation Analysis, the unit and value range depend on the selected
result display type.
Remote command:
CALCulate<n>:MARKer<m>:PEXCursion on page 234
Display Marker Numbers
By default, the marker numbers are indicated in the diagram so you can find the peaks
from the list. However, for large numbers of peaks, the marker numbers can decrease
readability; in this case, deactivate the marker number display.
Remote command:
CALCulate<n>:MARKer<m>:FUNCtion:FPEaks:ANNotation:LABel[:STATe]
on page 242
Export Peak List
The peak list can be exported to an ASCII file (.DAT) for analysis in an external application.
Remote command:
MMEMory:STORe<n>:PEAK on page 245
FORMat:DEXPort:DSEParator on page 195
98User Manual 1179.5147.02 ─ 02
Page 99

R&S®FSMR3-K7
6.4.4.4 Deactivating all marker functions
Analysis
Working with markers in the R&S FSMR3000 Analog Demodulation application
Access: "Overview" > "Analysis" > "Marker Functions" > "All Functions Off"
Or: [MKR FUNC] > "All Functions Off"
All special marker functions can be deactivated in one step.
Remote command:
99User Manual 1179.5147.02 ─ 02
Page 100

R&S®FSMR3-K7
7 I/Q data import and export
I/Q data import and export
Baseband signals mostly occur as so-called complex baseband signals, i.e. a signal
representation that consists of two channels; the inphase (I) and the quadrature (Q)
channel. Such signals are referred to as I/Q signals. The complete modulation information and even distortion that originates from the RF, IF or baseband domains can be
analyzed in the I/Q baseband.
Importing and exporting I/Q signals is useful for various applications:
●
Generating and saving I/Q signals in an RF or baseband signal generator or in
external software tools to analyze them with the R&S FSMR3 later.
●
Capturing and saving I/Q signals with the R&S FSMR3 to analyze them with the
R&S FSMR3 or an external software tool later
As opposed to storing trace data, which can be averaged or restricted to peak values, I/Q data is stored as it was captured, without further processing. Multi-channel
data is not supported.
The data is stored as complex values in 32-bit floating-point format. The I/Q data is
stored in a format with the file extension .iq.tar.
For a detailed description, see the R&S FSMR3 I/Q Analyzer and I/Q Input User
Manual.
For example, you can capture I/Q data using the I/Q Analyzer application, if available,
and then analyze that data later using the R&S FSMR3000 Analog Demodulation
application.
An application note on converting Rohde & Schwarz I/Q data files is available from the
Rohde & Schwarz website:
1EF85: Converting R&S I/Q data files
100User Manual 1179.5147.02 ─ 02
 Loading...