

Page 1

R&S®FSMR3-B1
I/Q Analyzer
User Manual
(;Ý1W2)
1179013902
Version 02
Page 2

This document describes the following R&S®FSMR3000 models:
●
R&S®FSMR3008 (1345.4004K08)
●
R&S®FSMR3026 (1345.4004K26)
●
R&S®FSMR3050 (1345.4004K50)
The contents of this manual correspond to firmware version 1.10 and higher.
The following firmware options are described:
●
R&S®FSMR3-B1 (1345.3050.08)
●
R&S®FSMR3-B1 (1345.3050.26)
●
R&S®FSMR3-B1 (1345.3050.50)
© 2022 Rohde & Schwarz GmbH & Co. KG
Mühldorfstr. 15, 81671 München, Germany
Phone: +49 89 41 29 - 0
Fax: +49 89 41 29 12 164
Email: info@rohde-schwarz.com
Internet: www.rohde-schwarz.com
Subject to change – Data without tolerance limits is not binding.
R&S® is a registered trademark of Rohde & Schwarz GmbH & Co. KG.
Trade names are trademarks of their owners.
1179.0139.02 | Version 02 | R&S®FSMR3-B1
Throughout this manual, products from Rohde & Schwarz are indicated without the ® symbol , e.g. R&S®FSMR3000 is indicated as
R&S FSMR3000.
Page 3

R&S®FSMR3-B1
1 Preface.................................................................................................... 7
1.1 About this manual.........................................................................................................7
1.2 Documentation overview..............................................................................................8
1.2.1 Getting started manual....................................................................................................8
1.2.2 User manuals and help................................................................................................... 8
1.2.3 Service manual............................................................................................................... 8
1.2.4 Instrument security procedures.......................................................................................9
1.2.5 Printed safety instructions............................................................................................... 9
1.2.6 Data sheets and brochures............................................................................................. 9
1.2.7 Release notes and open-source acknowledgment (OSA).............................................. 9
1.2.8 Application notes, application cards, white papers, etc...................................................9
Contents
Contents
1.3 Conventions used in the documentation....................................................................9
1.3.1 Typographical conventions..............................................................................................9
1.3.2 Conventions for procedure descriptions........................................................................10
1.3.3 Notes on screenshots................................................................................................... 10
2 Welcome to the I/Q analyzer application............................................11
2.1 Starting the I/Q analyzer application......................................................................... 11
2.2 Understanding the display information.................................................................... 12
3 Measurement and result displays...................................................... 15
4 Basics on I/Q data acquisition and processing................................ 20
4.1 Processing analog I/Q data from RF input............................................................... 20
4.1.1 Sample rate and maximum usable I/Q bandwidth for RF input.....................................21
4.1.1.1 Relationship between sample rate, record length and usable I/Q bandwidth............... 22
4.2 Basics on input from I/Q data files............................................................................ 23
4.3 Receiving and providing trigger signals...................................................................24
4.4 I/Q data import and export......................................................................................... 25
4.5 Basics on FFT..............................................................................................................25
4.5.1 Window functions.......................................................................................................... 26
4.5.2 Overlapping...................................................................................................................27
4.5.3 Dependencies between FFT parameters......................................................................28
3User Manual 1179.0139.02 ─ 02
Page 4

R&S®FSMR3-B1
4.5.4 Frequency resolution of FFT results - RBW..................................................................30
4.5.5 FFT calculation methods...............................................................................................31
5 Configuration........................................................................................32
5.1 Configuration overview.............................................................................................. 32
5.2 Import/export functions..............................................................................................34
5.3 Configuring data inputs and outputs........................................................................ 38
5.3.1 Inputs............................................................................................................................ 38
5.3.1.1 RF input.........................................................................................................................38
5.3.1.2 Power sensors.............................................................................................................. 40
5.3.1.3 External generators.......................................................................................................40
5.3.1.4 Probes...........................................................................................................................40
5.3.1.5 Settings for input from I/Q data files..............................................................................40
Contents
5.3.2 Outputs..........................................................................................................................41
5.4 Configuring the amplitude..........................................................................................44
5.4.1 Configuring level characteristics................................................................................... 44
5.4.2 Scaling the level axis.....................................................................................................48
5.5 Configuring frequency characteristics..................................................................... 49
5.6 Configuring triggered measurements.......................................................................51
5.7 Data acquisition and bandwidth settings................................................................. 55
5.7.1 Data acquisition.............................................................................................................55
5.7.2 Sweep settings..............................................................................................................60
5.8 Display configuration................................................................................................. 62
5.9 Adjusting settings automatically...............................................................................62
6 Analysis................................................................................................ 66
6.1 Trace configuration.....................................................................................................66
6.2 Marker settings............................................................................................................67
6.3 Display lines and limit lines....................................................................................... 67
7 How to work with I/Q data................................................................... 69
7.1 How to perform measurements in the I/Q Analyzer application.............................69
7.1.1 How to capture baseband (I/Q) data as RF input..........................................................69
7.1.2 How to analyze data in the I/Q Analyzer....................................................................... 70
7.2 How to export and import I/Q data............................................................................ 70
4User Manual 1179.0139.02 ─ 02
Page 5

R&S®FSMR3-B1
8 Remote commands for the I/Q analyzer.............................................73
8.1 Introduction................................................................................................................. 73
8.1.1 Conventions used in descriptions................................................................................. 73
8.1.2 Long and short form...................................................................................................... 74
8.1.3 Numeric suffixes............................................................................................................74
8.1.4 Optional keywords.........................................................................................................75
8.1.5 Alternative keywords..................................................................................................... 75
8.1.6 SCPI parameters...........................................................................................................75
8.1.6.1 Numeric values............................................................................................................. 76
8.1.6.2 Boolean......................................................................................................................... 77
8.1.6.3 Character data.............................................................................................................. 77
8.1.6.4 Character strings...........................................................................................................77
8.1.6.5 Block data..................................................................................................................... 77
Contents
8.2 Common suffixes........................................................................................................ 78
8.3 Activating I/Q analyzer measurements..................................................................... 78
8.4 Performing measurements.........................................................................................83
8.5 Retrieving results........................................................................................................90
8.5.1 Retrieving captured I/Q data......................................................................................... 90
8.5.2 Retrieving I/Q trace data............................................................................................... 94
8.5.3 Retrieving marker and peak search results...................................................................98
8.6 Configuring I/Q analyzer measurements................................................................ 101
8.6.1 Configuring input sources........................................................................................... 102
8.6.2 Configuring outputs..................................................................................................... 106
8.6.3 Configuring level characteristics................................................................................. 107
8.6.4 Configuring the attenuator...........................................................................................109
8.6.5 Configuring the preamplifier........................................................................................ 110
8.6.6 Scaling the Y-Axis........................................................................................................112
8.6.7 Configuring the frequency........................................................................................... 114
8.6.8 Configuring trigger.......................................................................................................116
8.6.9 Configuring trigger output............................................................................................121
8.6.10 Configuring gated measurements............................................................................... 123
8.6.11 Configuring data acquisition........................................................................................125
8.6.12 Automatic configuration...............................................................................................132
5User Manual 1179.0139.02 ─ 02
Page 6

R&S®FSMR3-B1
8.6.13 Configuring the result display......................................................................................135
8.7 Analyzing results...................................................................................................... 142
8.8 Importing and exporting I/Q data.............................................................................143
8.9 Querying the status registers.................................................................................. 145
8.10 Programming examples........................................................................................... 145
8.10.1 I/Q analysis with graphical evaluation......................................................................... 145
8.10.2 Basic I/Q analysis with improved performance........................................................... 146
A Annex: reference................................................................................148
A.1 Formats for returned values: ASCII format and binary format............................. 148
A.2 Reference: format description for I/Q data files.....................................................149
A.3 I/Q data file format (iq-tar)........................................................................................ 150
Contents
Annex.................................................................................................. 148
A.3.1 I/Q parameter XML file specification........................................................................... 151
A.3.1.1 Minimum data elements.............................................................................................. 152
A.3.1.2 Example...................................................................................................................... 153
A.3.2 I/Q data binary file....................................................................................................... 155
List of Remote Commands (I/Q Analyzer)....................................... 159
Index....................................................................................................162
6User Manual 1179.0139.02 ─ 02
Page 7

R&S®FSMR3-B1
1 Preface
1.1 About this manual
Preface
About this manual
This R&S FSMR3 I/Q Analyzer User Manual provides all the information specific to
the application and processing I/Q data. All general instrument functions and settings common to all applications are described in the main R&S FSMR3 User Manual.
The main focus in this manual is on the measurement results and the tasks required to
obtain them. The following topics are included:
●
Welcome to the I/Q Analyzer application
Introduction to and getting familiar with the application
●
Typical Applications for the I/Q Analyzer and optional input interfaces
Example measurement scenarios for I/Q data import and analysis
●
Measurements and Result Displays
Details on supported measurements and their result types
●
Basics on I/Q Data Acquisition
Background information on basic terms and principles in the context of the I/Q Analyzer application as well as processing I/Q data in general
●
Configuration and Analysis
A concise description of all functions and settings available to import, capture and
analyze I/Q data in the I/Q Analyzer, with or without optional interfaces, with their
corresponding remote control command
●
How to Work with I/Q Data
The basic procedure to perform an I/Q Analyzer measurement with step-by-step
instructions
●
Optimizing and Troubleshooting the Measurement
Hints and tips on how to handle errors and optimize the test setup
●
Remote Commands to perform Measurements with I/Q Data
Remote commands required to configure and perform I/Q Analyzer measurements
or process digital I/Q data in a remote environment, sorted by tasks;
(Commands required to set up the environment or to perform common tasks on the
instrument are provided in the main R&S FSMR3 User Manual.)
Programming examples demonstrate the use of many commands and can usually
be executed directly for test purposes.
●
Annex
Reference material, e.g. I/Q file formats and a detailed description of the LVDS
connector
●
List of remote commands
Alphabetical list of all remote commands described in the manual
●
Index
7User Manual 1179.0139.02 ─ 02
Page 8

R&S®FSMR3-B1
1.2 Documentation overview
1.2.1 Getting started manual
1.2.2 User manuals and help
Preface
Documentation overview
This section provides an overview of the R&S FSMR3 user documentation. Unless
specified otherwise, you find the documents on the R&S FSMR3 product page at:
www.rohde-schwarz.com/product/FSMR3000.html/
Introduces the R&S FSMR3 and describes how to set up and start working with the
product. Includes basic operations, typical measurement examples, and general information, e.g. safety instructions, etc.
A printed version is delivered with the instrument. A PDF version is available for download on the Internet.
Separate user manuals are provided for the base unit and the firmware applications:
●
Base unit manual
Contains the description of all instrument modes and functions. It also provides an
introduction to remote control, a complete description of the remote control commands with programming examples, and information on maintenance, instrument
interfaces and error messages.
●
Firmware application manual
Contains the description of the specific functions of a firmware application, including remote control commands. Basic information on operating the R&S FSMR3 is
not included.
The contents of the user manuals are available as help in the R&S FSMR3. The help
offers quick, context-sensitive access to the complete information for the base unit and
the firmware applications.
All user manuals are also available for download or for immediate display on the Internet.
1.2.3 Service manual
Describes the performance test for checking the rated specifications, module replacement and repair, firmware update, troubleshooting and fault elimination, and contains
mechanical drawings and spare part lists.
The service manual is available for registered users on the global Rohde & Schwarz
information system (GLORIS):
8User Manual 1179.0139.02 ─ 02
Page 9

R&S®FSMR3-B1
1.2.4 Instrument security procedures
1.2.5 Printed safety instructions
1.2.6 Data sheets and brochures
Preface
Conventions used in the documentation
Deals with security issues when working with the R&S FSMR3 in secure areas. It is
available for download on the Internet.
Provides safety information in many languages. The printed document is delivered with
the product.
The data sheet contains the technical specifications of the R&S FSMR3. It also lists the
firmware applications and their order numbers, and optional accessories.
The brochure provides an overview of the instrument and deals with the specific characteristics.
See www.rohde-schwarz.com/brochure-datasheet/FSMR3000/
1.2.7 Release notes and open-source acknowledgment (OSA)
The release notes list new features, improvements and known issues of the current
firmware version, and describe the firmware installation.
The open-source acknowledgment document provides verbatim license texts of the
used open source software.
See www.rohde-schwarz.com/firmware/FSMR3000/
1.2.8 Application notes, application cards, white papers, etc.
These documents deal with special applications or background information on particular topics.
See www.rohde-schwarz.com/application/FSMR3000/
1.3 Conventions used in the documentation
1.3.1 Typographical conventions
The following text markers are used throughout this documentation:
9User Manual 1179.0139.02 ─ 02
Page 10

R&S®FSMR3-B1
Preface
Conventions used in the documentation
Convention Description
"Graphical user interface elements"
[Keys] Key and knob names are enclosed by square brackets.
Filenames, commands,
program code
Input Input to be entered by the user is displayed in italics.
Links Links that you can click are displayed in blue font.
"References" References to other parts of the documentation are enclosed by quota-
All names of graphical user interface elements on the screen, such as
dialog boxes, menus, options, buttons, and softkeys are enclosed by
quotation marks.
Filenames, commands, coding samples and screen output are distinguished by their font.
tion marks.
1.3.2 Conventions for procedure descriptions
When operating the instrument, several alternative methods may be available to perform the same task. In this case, the procedure using the touchscreen is described.
Any elements that can be activated by touching can also be clicked using an additionally connected mouse. The alternative procedure using the keys on the instrument or
the on-screen keyboard is only described if it deviates from the standard operating procedures.
The term "select" may refer to any of the described methods, i.e. using a finger on the
touchscreen, a mouse pointer in the display, or a key on the instrument or on a keyboard.
1.3.3 Notes on screenshots
When describing the functions of the product, we use sample screenshots. These
screenshots are meant to illustrate as many as possible of the provided functions and
possible interdependencies between parameters. The shown values may not represent
realistic usage scenarios.
The screenshots usually show a fully equipped product, that is: with all options installed. Thus, some functions shown in the screenshots may not be available in your particular product configuration.
10User Manual 1179.0139.02 ─ 02
Page 11

R&S®FSMR3-B1
2 Welcome to the I/Q analyzer application
Welcome to the I/Q analyzer application
Starting the I/Q analyzer application
The R&S FSMR3 I/Q Analyzer is a firmware application that adds functionality to perform I/Q data acquisition and analysis to the R&S FSMR3.
The R&S FSMR3 I/Q Analyzer features:
●
Acquisition of analog I/Q data
●
Import of stored I/Q data from other applications
●
Spectrum, magnitude, I/Q vector and separate I and Q component analysis of any
I/Q data on the instrument
●
Export of I/Q data to other applications
This user manual contains a description of the functionality that the application provides, including remote control operation.
All functions not discussed in this manual are the same as in the base unit and are
described in the R&S FSMR3 User Manual.
Additional information
Several application notes discussing I/Q analysis are available from the Rohde &
Schwarz website:
1EF85: Converting R&S I/Q data files
1EF92: Wideband Signal Analysis
1MA257: Wideband mm-Wave Signal Generation and Analysis
1EF84: Differential measurements with Spectrum Analyzers and Probes
Installation
The R&S FSMR3 I/Q Analyzer application is part of the optional Spectrum application
and requires no further installation.
2.1 Starting the I/Q analyzer application
The I/Q Analyzer is an application on the R&S FSMR3.
To activate the I/Q Analyzer application
1. Select the [MODE] key.
A dialog box opens that contains all applications currently available on your
R&S FSMR3.
2. Select the "I/Q Analyzer" item.
11User Manual 1179.0139.02 ─ 02
Page 12

R&S®FSMR3-B1
Welcome to the I/Q analyzer application
Understanding the display information
The R&S FSMR3 opens a new channel for the I/Q Analyzer application.
The measurement is started immediately with the default settings.
It can be configured in the I/Q Analyzer "Overview" dialog box, which is displayed
when you select the "Overview" softkey from any menu (see Chapter 5, "Configura-
tion", on page 32).
Multiple Channels and Sequencer Function
When you activate an application, a new channel is created which determines the
measurement settings for that application (channel). The same application can be activated with different measurement settings by creating several channels for the same
application.
The number of channels that can be configured at the same time depends on the available memory on the instrument.
Only one measurement can be performed at any time, namely the one in the currently
active channel. However, in order to perform the configured measurements consecutively, a Sequencer function is provided.
If activated, the measurements configured in the currently defined channels are performed one after the other in the order of the tabs. The currently active measurement is
indicated by a
The result displays of the individual channels are updated in the tabs (as well as the
"MultiView") as the measurements are performed. Sequential operation itself is independent of the currently displayed tab.
For details on the Sequencer function see the R&S FSMR3 User Manual.
symbol in the tab label.
2.2 Understanding the display information
The following figure shows a measurement diagram during I/Q Analyzer operation. All
different information areas are labeled. They are explained in more detail in the following sections.
12User Manual 1179.0139.02 ─ 02
Page 13

R&S®FSMR3-B1
Welcome to the I/Q analyzer application
Understanding the display information
1 2 3 4
56
Figure 2-1: Screen elements in the I/Q Analyzer application
1+4 = Window title bar with diagram-specific (trace) information
2 = Channel bar for firmware and measurement settings
3 = Diagram area
5 = Diagram footer with diagram-specific information, depending on result display
6 = Instrument status bar with error messages and date/time display
Channel bar information
In the I/Q Analyzer application, the R&S FSMR3 shows the following settings:
Table 2-1: Information displayed in the channel bar for the I/Q Analyzer application
Ref Level Reference level
Att RF attenuation
Ref Offset Reference level offset
Freq Center frequency
Meas Time Measurement time
Rec Length Defined record length (number of samples to capture)
SRate Defined sample rate for data acquisition
RBW (Spectrum evaluation only) Resolution bandwidth calculated from the
sample rate and record length
13User Manual 1179.0139.02 ─ 02
Page 14
R&S®FSMR3-B1
Welcome to the I/Q analyzer application
Understanding the display information
In addition, the channel bar also displays information on instrument settings that affect
the measurement results even though this is not immediately apparent from the display
of the measured values (e.g. transducer or trigger settings). This information is displayed only when applicable for the current measurement.
For details see the R&S FSMR3 Getting Started manual.
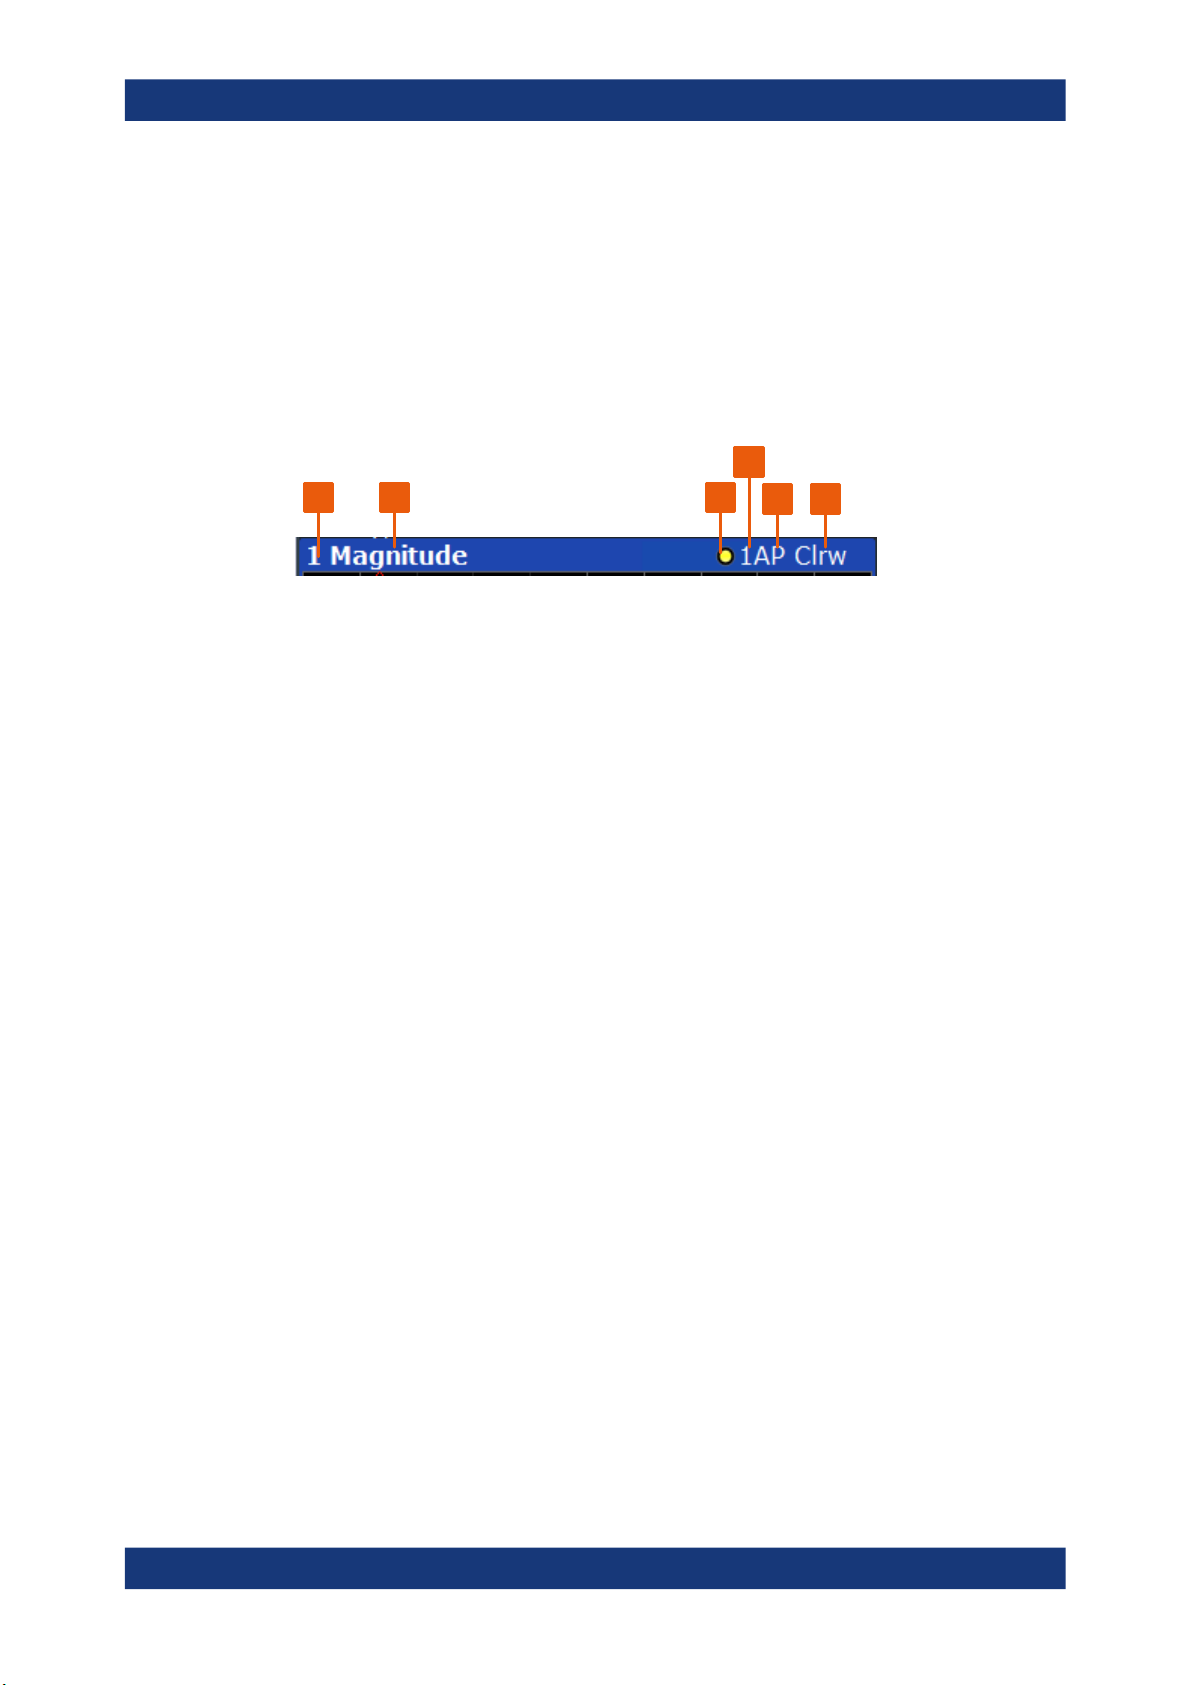
Window title bar information
For each diagram, the header provides the following information:
4
1 2 3
Figure 2-2: Window title bar information in the I/Q Analyzer application
1 = Window number
2 = Window type
3 = Trace color
4 = Trace number
5 = Detector
6 = Trace mode
5 6
Diagram footer information
The information in the diagram footer (beneath the diagram) depends on the evaluation:
●
Center frequency
●
Number of sweep points
●
Range per division (x-axis)
●
Span (Spectrum)
Status bar information
Global instrument settings, the instrument status and any irregularities are indicated in
the status bar beneath the diagram.
Furthermore, the progress of the current operation is displayed in the status bar.
14User Manual 1179.0139.02 ─ 02
Page 15

R&S®FSMR3-B1
3 Measurement and result displays
Measurement and result displays
Access: "Overview" > "Display Config"
Or: [MEAS] > "Display Config"
The I/Q Analyzer can capture I/Q data. The I/Q data that was captured by or imported
to the R&S FSMR3 can then be evaluated in various different result displays. Select
the result displays using the SmartGrid functions.
Up to 6 evaluations can be displayed in the I/Q Analyzer at any time, including several
graphical diagrams, marker tables or peak lists.
For details on working with the SmartGrid see the R&S FSMR3 Getting Started manual.
Measurements in the time and frequency domain
The time and frequency domain measurements and the available results are described
in detail in the R&S FSMR3 User Manual.
Result displays for I/Q data:
Magnitude..................................................................................................................... 15
Spectrum.......................................................................................................................16
I/Q-Vector......................................................................................................................16
Real/Imag (I/Q)..............................................................................................................17
Phase vs. Time..............................................................................................................17
Marker Table................................................................................................................. 18
Marker Peak List........................................................................................................... 18
Magnitude
Shows the level values in time domain.
Remote command:
LAY:ADD:WIND? '1',RIGH,MAGN, see LAYout:ADD[:WINDow]? on page 136
Results:
TRACe<n>[:DATA]? on page 96
15User Manual 1179.0139.02 ─ 02
Page 16

R&S®FSMR3-B1
Measurement and result displays
Spectrum
Displays the frequency spectrum of the captured I/Q samples.
Remote command:
LAY:ADD:WIND? '1',RIGH,FREQ, see LAYout:ADD[:WINDow]? on page 136
Results:
TRACe<n>[:DATA]? on page 96
I/Q-Vector
Displays the captured samples in an I/Q-plot. The samples are connected by a line.
Note: For the I/Q vector result display, the number of I/Q samples to record ("Record
Length") must be identical to the number of trace points to be displayed ("Sweep
Points"; for I/Q Analyzer: 10001). For record lengths outside the valid range of sweep
points the diagram does not show valid results.
16User Manual 1179.0139.02 ─ 02
Page 17

R&S®FSMR3-B1
Measurement and result displays
Remote command:
LAY:ADD:WIND? '1',RIGH,VECT, see LAYout:ADD[:WINDow]? on page 136
Results:
TRACe<n>[:DATA]? on page 96
Real/Imag (I/Q)
Displays the I and Q values in separate diagrams.
Remote command:
LAY:ADD:WIND? '1',RIGH,RIM, see LAYout:ADD[:WINDow]? on page 136
Results:
TRACe<n>[:DATA]? on page 96
Phase vs. Time
Shows the phase values in the time domain.
17User Manual 1179.0139.02 ─ 02
Page 18

R&S®FSMR3-B1
Measurement and result displays
Remote command:
LAY:ADD? '1',RIGH, POLar, see LAYout:ADD[:WINDow]? on page 136
Marker Table
Displays a table with the current marker values for the active markers.
This table is displayed automatically if configured accordingly.
Tip: To navigate within long marker tables, simply scroll through the entries with your
finger on the touchscreen.
Remote command:
LAY:ADD? '1',RIGH, MTAB, see LAYout:ADD[:WINDow]? on page 136
Results:
CALCulate<n>:MARKer<m>:X on page 100
CALCulate<n>:MARKer<m>:Y? on page 100
Marker Peak List
The marker peak list determines the frequencies and levels of peaks in the spectrum or
time domain. How many peaks are displayed can be defined, as well as the sort order.
In addition, the detected peaks can be indicated in the diagram. The peak list can also
be exported to a file for analysis in an external application.
18User Manual 1179.0139.02 ─ 02
Page 19

R&S®FSMR3-B1
Measurement and result displays
Remote command:
LAY:ADD? '1',RIGH, PEAK, see LAYout:ADD[:WINDow]? on page 136
Results:
CALCulate<n>:MARKer<m>:X on page 100
CALCulate<n>:MARKer<m>:Y? on page 100
19User Manual 1179.0139.02 ─ 02
Page 20

R&S®FSMR3-B1
4 Basics on I/Q data acquisition and process-
Basics on I/Q data acquisition and processing
Processing analog I/Q data from RF input
ing
Some background knowledge on basic terms and principles used when describing I/Q
data acquisition on the R&S FSMR3 in general, and in the I/Q Analyzer application in
particular, is provided here for a better understanding of the required configuration settings.
The I/Q Analyzer provides various possibilities to acquire the I/Q data to be analyzed:
●
Capturing analog I/Q data from the "RF Input" connector
●
Importing I/Q data from a file
Background information for all these scenarios and more is provided in the following
sections.
● Processing analog I/Q data from RF input..............................................................20
● Basics on input from I/Q data files.......................................................................... 23
● Receiving and providing trigger signals.................................................................. 24
● I/Q data import and export...................................................................................... 25
● Basics on FFT.........................................................................................................25
4.1 Processing analog I/Q data from RF input
Complex baseband data
In the telephone systems of the past, baseband data was transmitted unchanged as an
analog signal. In modern phone systems and in radio communication, however, the
baseband data is modulated on a carrier frequency, which is then transmitted. The
receiver must demodulate the data based on the carrier frequency. When using modern modulation methods (e.g. QPSK, QAM etc.), the baseband signal becomes complex. Complex data (or: I/Q data) consists of an imaginary (I) and a real (Q) component.
Sweep vs sampling
The standard Spectrum application on the R&S FSMR3 performs frequency sweeps on
the input signal and measurements in the frequency and time domain. Other applications on the R&S FSMR3, such as the I/Q Analyzer, sample and process the individual
I and Q components of the complex signal.
I/Q Analyzer - processing complex data from RF input
The I/Q Analyzer is a standard application used to capture and analyze I/Q data on the
R&S FSMR3. By default, it assumes the I/Q data is modulated on a carrier frequency
and input via the "RF Input" connector on the R&S FSMR3.
20User Manual 1179.0139.02 ─ 02
Page 21

R&S®FSMR3-B1
Basics on I/Q data acquisition and processing
Processing analog I/Q data from RF input
The A/D converter samples the IF signal at a rate of 200 MHz. The digital signal is
down-converted to the complex baseband, lowpass-filtered, and the sample rate is
reduced. The analog filter stages in the analyzer cause a frequency response which
adds to the modulation errors. An equalizer filter before the resampler compensates
for this frequency response. The continuously adjustable sample rates are realized
using an optimal decimation filter and subsequent resampling on the set sample rate.
A dedicated memory (capture buffer) is available in the R&S FSMR3 for a maximum
of 400 Msamples (400*1000*1000) of complex samples (pairs of I and Q data). The
number of complex samples to be captured can be defined (for restrictions refer to
Chapter 4.1.1, "Sample rate and maximum usable I/Q bandwidth for RF input",
on page 21).
The block diagram in Figure 4-1 shows the analyzer hardware from the IF section to
the processor.
Figure 4-1: Block diagram illustrating the R&S FSMR3 signal processing for analog I/Q data (without
bandwidth extension options)
4.1.1 Sample rate and maximum usable I/Q bandwidth for RF input
Definitions
●
Input sample rate (ISR): the sample rate of the useful data provided by the device
connected to the input of the R&S FSMR3000
●
(User, Output) Sample rate (SR): the user-defined sample rate (e.g. in the "Data
Acquisition" dialog box in the "I/Q Analyzer" application) which is used as the basis
for analysis or output
●
Usable I/Q (analysis) bandwidth: the bandwidth range in which the signal
remains undistorted in regard to amplitude characteristic and group delay; this
range can be used for accurate analysis by the R&S FSMR3
●
Record length: the number of I/Q samples to capture during the specified measurement time; calculated as the measurement time multiplied by the sample rate
For the I/Q data acquisition, digital decimation filters are used internally in the
R&S FSMR3000. The passband of these digital filters determines the maximum usable
I/Q bandwidth. In consequence, signals within the usable I/Q bandwidth (passband)
21User Manual 1179.0139.02 ─ 02
Page 22

R&S®FSMR3-B1
4.1.1.1 Relationship between sample rate, record length and usable I/Q bandwidth
Basics on I/Q data acquisition and processing
Processing analog I/Q data from RF input
remain unchanged, while signals outside the usable I/Q bandwidth (passband) are
suppressed. Usually, the suppressed signals are noise, artifacts, and the second IF
sideband. If frequencies of interest to you are also suppressed, try to increase the output sample rate, which increases the maximum usable I/Q bandwidth.
As a rule, the usable I/Q bandwidth is proportional to the output sample rate. Yet, when
the I/Q bandwidth reaches the bandwidth of the analog IF filter (at very high output
sample rates), the curve breaks.
● Relationship between sample rate, record length and usable I/Q bandwidth......... 22
Up to the maximum bandwidth, the following rule applies:
Usable I/Q bandwidth = 0.8 * Output sample rate
Regarding the record length, the following rule applies:
Record length = Measurement time * sample rate
Maximum record length for RF input
The maximum record length, that is, the maximum number of samples that can be captured, depends on the sample rate.
Table 4-1: Maximum record length
Sample rate Maximum record length
100 Hz to 200 MHz 440 Msamples
200 MHz to 20 GHz
(upsampling)
Usable I/Q
bandwidth [MHz]
90
80
70
60
50
40
30
20
10
220 Msamples
RF input:
BW = 0.80*f
80 MHz bandwidth
out
20 40 60 80 100 120 140
Figure 4-2: Relationship between maximum usable I/Q bandwidth and output sample rate
[…] 10000
Output sample
rate f
[MHz]
out
22User Manual 1179.0139.02 ─ 02
Page 23

R&S®FSMR3-B1
4.2 Basics on input from I/Q data files
Basics on I/Q data acquisition and processing
Basics on input from I/Q data files
The I/Q data to be evaluated in a particular R&S FSMR3 application cannot only be
captured by the application itself, it can also be loaded from a file, provided it has the
correct format. The file is then used as the input source for the application.
For example, you can capture I/Q data using the I/Q Analyzer application, store it to a
file, and then analyze the signal parameters for that data later using the Pulse application (if available).
The I/Q data must be stored in a format with the file extension .iq.tar. For a detailed
description, see Chapter A.3, "I/Q data file format (iq-tar)", on page 150.
An application note on converting Rohde & Schwarz I/Q data files is available from the
Rohde & Schwarz website:
1EF85: Converting R&S I/Q data files
When importing data from an I/Q data file using the import functions provided by some
R&S FSMR3 applications, the data is only stored temporarily in the capture buffer. It
overwrites the current measurement data and is in turn overwritten by a new measurement. If you use an I/Q data file as input, the stored I/Q data remains available for any
number of subsequent measurements. Furthermore, the (temporary) data import
requires the current measurement settings in the current application to match the settings that were applied when the measurement results were stored (possibly in a different application). When the data is used as an input source, however, the data acquisition settings in the current application (attenuation, center frequency, measurement
bandwidth, sample rate) can be ignored. As a result, these settings cannot be changed
in the current application. Only the measurement time can be decreased, to perform
measurements on an extract of the available data (from the beginning of the file) only.
When using input from an I/Q data file, the [RUN SINGLE] function starts a single measurement (i.e. analysis) of the stored I/Q data, while the [RUN CONT] function repeatedly analyzes the same data from the file.
Sample iq.tar files
If you have the optional R&S FSMR3 VSA application (R&S FSMR3-K70), some sample iq.tar files are provided in the C:/R_S/Instr/user/vsa/DemoSignals
directory on the R&S FSMR3.
Furthermore, you can create your own iq.tar files in the I/Q Analyzer, see Chap-
ter 7.2, "How to export and import I/Q data", on page 70.
Pre-trigger and post-trigger samples
In applications that use pre-triggers or post-triggers, if no pre-trigger or post-trigger
samples are specified in the I/Q data file, or too few trigger samples are provided to
satisfy the requirements of the application, the missing pre- or post-trigger values are
filled up with zeros. Superfluous samples in the file are dropped, if necessary. For pretrigger samples, values are filled up or omitted at the beginning of the capture buffer.
23User Manual 1179.0139.02 ─ 02
Page 24

R&S®FSMR3-B1
4.3 Receiving and providing trigger signals
Basics on I/Q data acquisition and processing
Receiving and providing trigger signals
For post-trigger samples, values are filled up or omitted at the end of the capture buffer.
Using one of the "TRIGGER INPUT / OUTPUT" connectors of the R&S FSMR3000,
the R&S FSMR3 can use a signal from an external device as a trigger to capture data.
Alternatively, the internal trigger signal used by the R&S FSMR3000 can be output for
use by other connected devices. Using the same trigger on several devices is useful to
synchronize the transmitted and received signals within a measurement.
For details on the connectors see the R&S FSMR3 "Getting Started" manual.
External trigger as input
If the trigger signal for the R&S FSMR3 is provided by an external device, the trigger
signal source must be connected to the R&S FSMR3000 and the trigger source must
be defined as "External" in the R&S FSMR3.
Trigger output
The R&S FSMR3000 can provide output to another device either to pass on the internal trigger signal, or to indicate that the R&S FSMR3000 itself is ready to trigger.
The trigger signal can be output by the R&S FSMR3000 automatically, or manually by
the user. If it is provided automatically, a high signal is output when the
R&S FSMR3000 has triggered due to a sweep start ("Device Triggered"), or when the
R&S FSMR3000 is ready to receive a trigger signal after a sweep start ("Trigger
Armed").
Manual triggering
If the trigger output signal is initiated manually, the length and level (high/low) of the
trigger pulse is also user-definable. Note, however, that the trigger pulse level is always
opposite to the constant signal level defined by the output "Level" setting, e.g. for
"Level" = "High", a constant high signal is output to the connector until the "Send Trigger" button is selected. Then, a low pulse is provided.
24User Manual 1179.0139.02 ─ 02
Page 25

R&S®FSMR3-B1
4.4 I/Q data import and export
Basics on I/Q data acquisition and processing
Basics on FFT
Baseband signals mostly occur as so-called complex baseband signals, i.e. a signal
representation that consists of two channels; the inphase (I) and the quadrature (Q)
channel. Such signals are referred to as I/Q signals. The complete modulation information and even distortion that originates from the RF, IF or baseband domains can be
analyzed in the I/Q baseband.
Importing and exporting I/Q signals is useful for various applications:
●
Generating and saving I/Q signals in an RF or baseband signal generator or in
external software tools to analyze them with the R&S FSMR3 later.
●
Capturing and saving I/Q signals with the R&S FSMR3 to analyze them with the
R&S FSMR3 or an external software tool later
As opposed to storing trace data, which can be averaged or restricted to peak values, I/Q data is stored as it was captured, without further processing. Multi-channel
data is not supported.
The data is stored as complex values in 32-bit floating-point format. The I/Q data is
stored in a format with the file extension .iq.tar.
For example, you can capture I/Q data using the I/Q Analyzer application and then perform analog demodulation on that data using the R&S FSMR3 Analog Demodulation
application, if available.
An application note on converting Rohde & Schwarz I/Q data files is available from the
Rohde & Schwarz website:
1EF85: Converting R&S I/Q data files
The import and export functions are available in the "Save/Recall" menu which is displayed when you select the "Save" or "Open" icon in the toolbar (see Chapter 5.2,
"Import/export functions", on page 34).
4.5 Basics on FFT
The I/Q Analyzer measures the power of the signal input over time. To convert the time
domain signal to a frequency spectrum, an FFT (Fast Fourier Transformation) is performed which converts a vector of input values into a discrete spectrum of frequencies.
25User Manual 1179.0139.02 ─ 02
Page 26

R&S®FSMR3-B1
4.5.1 Window functions
Basics on I/Q data acquisition and processing
Basics on FFT
t[s]
FFT
f[Hz]
The Fourier transformation is not performed on the entire captured data in one step.
Only a limited number of samples is used to calculate an individual result. This process
is called windowing.
After sampling in the time domain, each window is multiplied with a specific window
function. Windowing helps minimize the discontinuities at the end of the measured signal interval and thus reduces the effect of spectral leakage, increasing the frequency
resolution.
Various different window functions are provided in the R&S FSMR3 to suit different
input signals. Each of the window functions has specific characteristics, including some
advantages and some trade-offs. Consider these characteristics to find the optimum
solution for the measurement task.
Ignoring the window function - rectangular window
The rectangular window function is in effect not a function at all, it maintains the original sampled data. This may be useful to minimize the required bandwidth. However, be
aware that if the window does not contain exactly one period of your signal, heavy
sidelobes may occur, which do not exist in the original signal.
Table 4-2: Characteristics of typical FFT window functions
Window type Frequency
resolution
Magnitude
resolution
Sidelobe suppression
Measurement recommendation
Rectangular Best Worst Worst No function applied.
Separation of two tones with almost
equal amplitudes and a small frequency distance
Blackman-Harris
(default)
Good Good Good Harmonic detection and spurious
emission detection
26User Manual 1179.0139.02 ─ 02
Page 27

R&S®FSMR3-B1
Basics on I/Q data acquisition and processing
Basics on FFT
Window type Frequency
Gauss (Alpha
= 0.4)
Flattop Worst Best Good Accurate single tone measurements
5-Term Good Good Best Measurements with very high
4.5.2 Overlapping
The I/Q Analyzer calculates multiple FFTs per measurement by dividing one captured
record into several windows. Furthermore, the I/Q Analyzer allows consecutive windows to overlap. Overlapping "reuses" samples that were already used to calculate the
preceding FFT result.
Magnitude
resolution
Good Good Good Weak signals and short duration
resolution
Sidelobe suppression
Measurement recommendation
dynamic range
In advanced FFT mode with averaging, the overlapping factor can be set freely. The
higher the overlap factor, the more windows are used. This leads to more individual
results and improves detection of transient signal effects. However, it also extends the
duration of the calculation. The size of the window can be defined manually according
to the record length, the overlap factor, and the FFT length.
An FFT overlap of 67%, for example, means the second FFT calculation uses the last
67% of the data of the first FFT. It uses only 33% new data. The third FFT still covers
33% of the first FFT and 67% of the second FFT, and so on.
27User Manual 1179.0139.02 ─ 02
Page 28

R&S®FSMR3-B1
Basics on I/Q data acquisition and processing
Basics on FFT
Figure 4-3: Overlapping FFTs
In "Manual" or "Auto" FFT mode, an FFT length of 4096 and a window length of 4096
(or the record length, if shorter) is used to calculate the spectrum.
Combining results - trace detector
If the record length permits, multiple overlapping windows are calculated and combined
to create the final spectrum using the selected trace detector. If necessary, the trace
detector is also used to reduce the number of calculated frequency points (defined by
the FFT length) to the defined number of sweep points. By default, the Autopeak trace
detector is used.
Since the frequency points are reduced to the number of sweep points, using a detector other than "Auto Peak" and fewer than 4096 sweep points can lead to false level
results.
4.5.3 Dependencies between FFT parameters
FFT analysis in the R&S FSMR3 is highly configurable. Several parameters, including
the resolution bandwidth, record length, and FFT length, are user-definable. Note,
however, that several parameters are correlated and not all can be configured independently of the others.
28User Manual 1179.0139.02 ─ 02
Page 29

R&S®FSMR3-B1
Basics on I/Q data acquisition and processing
Basics on FFT
Record Length
Defines the number of I/Q samples to capture. By default, the number of sweep points
is used. The record length is calculated as the measurement time multiplied by the
sample rate.
If you change the record length, the Meas Time is automatically changed, as well.
For FFTs using only a single window ("Single" mode), the record length (which is then
identical to the FFT length) must not exceed 512k.
FFT Length
Defines the number of frequency points determined by each FFT calculation. The more
points are used, the higher the resolution in the spectrum becomes, but the longer the
calculation takes.
In "Auto" or "Manual" mode, an FFT length of 4096 is used.
In advanced FFT mode, the FFT length is user-definable. If you use the arrow keys or
the rotary knob to change the FFT length, the value is incremented or decremented by
powers of 2. If you enter the value manually, any integer value from 3 to 524288 is
available.
If the FFT length is longer than the Window Length the sample data is filled up with
zeros up to the FFT length. The FFT is then performed using interpolated frequency
points.
For an FFT length that is not a power of 2, a DFT (discrete Fourier transform) is performed, which requires more time for calculation, but avoids the effects of interpolation.
To display all calculated frequency points (defined by the FFT length), the number of
sweep points is set to the FFT length automatically in advanced FFT mode.
Window Length
Defines the number of samples to be included in a single window in averaging mode.
(In single mode, the window length corresponds to the "Record Length" on page 57.)
Values from 3 to 4096 are available in "Manual" mode; in "Advanced" FFT mode, values from 3 to 524288 are available. However, the window length must not be longer
than the FFT Length.
If the window length is shorter than the FFT Length, the sample data is filled up with
zeros up to the FFT length.
If the window length is longer than the Record Length (that is, not enough samples are
available), a window length the size of the Record Length is used for calculation.
The window length and the Window Overlap determine how many FFT calculations
must be performed for each record in averaging mode (see "Transformation Algorithm"
on page 59).
29User Manual 1179.0139.02 ─ 02
Page 30

R&S®FSMR3-B1
LengthWindow
RateSample
BandwidthNormalizedRBW
3
RateSample*BandwidthNormalized
RBW
max
LengthcordRe,4096min
RateSampleBandwidth*Normalized
RBW
min
4.5.4 Frequency resolution of FFT results - RBW
Basics on I/Q data acquisition and processing
Basics on FFT
The resolution bandwidth defines the minimum frequency separation at which the
individual components of a spectrum can be distinguished. Small values result in high
precision, as the distance between two distinguishable frequencies is small. Higher values decrease the precision, but increase measurement speed.
The RBW is determined by the following equation:
Equation 4-1: Definition of RBW
(Note: The normalized bandwidth is a fixed value that takes the noise bandwidth of the
window function into consideration.)
The maximum RBW is restricted by the Analysis Bandwidth, or by the following equation, whichever is higher:
If a higher spectral resolution is required, the number of samples must be increased by
using a higher sample rate or longer record length.
The minimum achievable RBW depends on the sample rate and record length, according to the following equation:
To simplify operation, some parameters are coupled and automatically calculated, such
as record length and RBW.
RBW mode
Depending on the selected RBW mode, the resolution bandwidth is either determined
automatically or can be defined manually.
Auto mode:
This is the default mode in the I/Q Analyzer. The RBW is determined automatically
depending on the Sample Rate and Window Length, where the window length corresponds to the Record Length, or a maximum of 4096.
If the record length is larger than the window length, multiple windows are combined;
the FFT length is 4096.
A Flatop window function is used.
Manual mode:
The RBW is user-definable.
30User Manual 1179.0139.02 ─ 02
Page 31

R&S®FSMR3-B1
4.5.5 FFT calculation methods
Basics on I/Q data acquisition and processing
Basics on FFT
The Window Length is adapted to comply with Equation 4-1. Since only window
lengths with integer values can be employed, the Sample Rate is adapted, if necessary, to obtain an integer window length value.
If the record length is larger than the window length, multiple windows are combined;
the FFT length is 4096.
A Flatop window function is used.
Advanced FFT mode
The RBW is determined by the advanced FFT parameters, depending on the selected
FFT calculation methods method.
FFT calculation can be performed using different methods.
Single
In single mode, one FFT is calculated for the entire record length, that means the window length is identical to the record length.
If the defined FFT Length is larger than the record length, zeros are appended to the
captured data to reach the FFT length.
Figure 4-4: FFT parameters for single FFT calculation
Averaging
In averaging mode, several overlapping FFTs are calculated for each record; the
results are combined to determine the final FFT result for the record.
The number of FFTs to be combined is determined by the Window Overlap and the
Window Length.
Figure 4-5: FFT parameters for averaged FFT calculation
31User Manual 1179.0139.02 ─ 02
Page 32

R&S®FSMR3-B1
5 Configuration
Configuration
Configuration overview
The I/Q Analyzer is a special application on the R&S FSMR3, which you activate using
the [MODE] key on the front panel.
When you switch to an I/Q Analyzer measurement channel the first time, a set of
parameters is passed on from the currently active application. After initial setup, the
parameters for the measurement channel are stored upon exiting and restored upon
re-entering the channel. Thus, you can switch between applications quickly and easily.
When you activate a measurement channel for the I/Q Analyzer application, data
acquisition from the input signal is started automatically with the default configuration.
It can be configured in the I/Q Analyzer "Overview" dialog box, which is displayed
when you select the "Overview" softkey from any menu.
The main configuration settings and dialog boxes are also available via the "I/Q Analyzer" menu which is displayed when you press the [MEAS CONFIG] key.
The remote commands required to perform these tasks are described in Chapter 8.6,
"Configuring I/Q analyzer measurements", on page 101.
Importing and Exporting I/Q Data
The I/Q data to be evaluated in the I/Q Analyzer application can not only be captured
by the I/Q Analyzer itself, it can also be imported to the R&S FSMR3, provided it has
the correct format. Furthermore, the captured I/Q data from the I/Q Analyzer can be
exported for further analysis in external applications.
For details see Chapter 4.4, "I/Q data import and export", on page 25.
● Configuration overview............................................................................................32
● Import/export functions............................................................................................34
● Configuring data inputs and outputs....................................................................... 38
● Configuring the amplitude....................................................................................... 44
● Configuring frequency characteristics.....................................................................49
● Configuring triggered measurements......................................................................51
● Data acquisition and bandwidth settings.................................................................55
● Display configuration...............................................................................................62
● Adjusting settings automatically..............................................................................62
5.1 Configuration overview
Throughout the measurement channel configuration, an overview of the most important
currently defined settings is provided in the "Overview". The "Overview" is displayed
when you select the "Overview" icon, which is available at the bottom of all softkey
menus.
32User Manual 1179.0139.02 ─ 02
Page 33

R&S®FSMR3-B1
Configuration
Configuration overview
In addition to the main measurement settings, the "Overview" provides quick access to
the main settings dialog boxes. The individual configuration steps are displayed in the
order of the data flow. Thus, you can easily configure an entire measurement channel
from input over processing to output and analysis by stepping through the dialog boxes
as indicated in the "Overview".
The Overview varies depending on the application; for detailed descriptions see the
corresponding application User Manual.
The "Overview" for the I/Q Analyzer provides quick access to the following configuration dialog boxes (listed in the recommended order of processing):
1. Configuring the input
See Chapter 5.3.1, "Inputs", on page 38
2. Configuring level characteristics
See Chapter 5.4, "Configuring the amplitude", on page 44
3. Configuring Frequency Characteristics
See Chapter 5.5, "Configuring frequency characteristics", on page 49
4. Configuring triggered and gated measurements
See Chapter 5.6, "Configuring triggered measurements", on page 51
5. Configuring the output
See Chapter 5.3.2, "Outputs", on page 41
6. Configuring the bandwidth
See Chapter 5.7, "Data acquisition and bandwidth settings", on page 55
7. Analyzing results
See the User Manual of the R&S FSMR3
8. Configuring the display
See Chapter 5.8, "Display configuration", on page 62
33User Manual 1179.0139.02 ─ 02
Page 34

R&S®FSMR3-B1
Configuration
Import/export functions
To configure settings
► Select any button in the "Overview" to open the corresponding dialog box.
Select a setting in the channel bar (at the top of the measurement channel tab) to
change a specific setting.
For step-by-step instructions on configuring I/Q Analyzer measurements, see Chap-
ter 7.1, "How to perform measurements in the I/Q Analyzer application", on page 69.
Preset Channel............................................................................................................. 34
Specific Settings for...................................................................................................... 34
Preset Channel
Select the "Preset Channel" button in the lower left-hand corner of the "Overview" to
restore all measurement settings in the current channel to their default values.
Note: Do not confuse the "Preset Channel" button with the [Preset] key, which restores
the entire instrument to its default values and thus closes all channels on the
R&S FSMR3 (except for the default channel)!
Remote command:
SYSTem:PRESet:CHANnel[:EXEC] on page 82
Specific Settings for
The channel can contain several windows for different results. Thus, the settings indicated in the "Overview" and configured in the dialog boxes vary depending on the
selected window.
Select an active window from the "Specific Settings for" selection list that is displayed
in the "Overview" and in all window-specific configuration dialog boxes.
The "Overview" and dialog boxes are updated to indicate the settings for the selected
window.
5.2 Import/export functions
Access: "Save"/ "Open" icon in the toolbar > "Import" / "Export"
The R&S FSMR3 provides various evaluation methods for the results of the performed
measurements. However, you may want to evaluate the data with further, external
applications. In this case, you can export the measurement data to a standard format
file (ASCII or XML). Some of the data stored in these formats can also be re-imported
to the R&S FSMR3 for further evaluation later, for example in other applications.
The following data types can be exported (depending on the application):
●
Trace data
●
Table results, such as result summaries, marker peak lists etc.
●
I/Q data (in applications that process I/Q data)
The following data types can be imported (depending on the application):
●
I/Q data (in applications that process I/Q data)
34User Manual 1179.0139.02 ─ 02
Page 35

R&S®FSMR3-B1
Configuration
Import/export functions
I/Q data can only be imported and exported in applications that process I/Q data, such
as the I/Q analyzer or other optional applications.
See the corresponding user manuals for those applications for details.
These functions are only available if no measurement is running.
In particular, if Continuous Sweep / Run Cont is active, the import/export functions are
not available.
Import............................................................................................................................35
└ I/Q Import........................................................................................................35
└ File Explorer..........................................................................................35
Export............................................................................................................................35
└ Export Trace to ASCII File.............................................................................. 35
└ File Type...............................................................................................36
└ Decimal Separator................................................................................37
└ File Explorer..........................................................................................37
└ Trace Export Configuration.............................................................................37
└ I/Q Export........................................................................................................37
└ File Explorer..........................................................................................37
Import
Access: "Save/Recall" > Import
Provides functions to import data.
I/Q Import ← Import
Opens a file selection dialog box to select an import file that contains I/Q data. This
function is only available in single sweep mode and only in applications that process
I/Q data, such as the I/Q Analyzer or optional applications.
Input from I/Q data files is imported as it was stored, including any correction factors,
for example from transducers or SnP files. Any currently configured correction factors
at the time of import, however, are not applied.
Remote command:
MMEMory:LOAD:IQ:STATe on page 144
File Explorer ← I/Q Import ← Import
Opens the Microsoft Windows File Explorer.
Remote command:
not supported
Export
Access: "Save/Recall" > Export
Opens a submenu to configure data export.
Export Trace to ASCII File ← Export
Saves the selected trace or all traces in the currently active result display to the specified file and directory in the selected ASCII format.
35User Manual 1179.0139.02 ─ 02
Page 36

R&S®FSMR3-B1
Configuration
Import/export functions
"File Explorer": Instead of using the file manager of the R&S FSMR3 firmware, you can
also use the Microsoft Windows File Explorer to manage files.
Note: Secure user mode.
In secure user mode, settings that are stored on the instrument are stored to volatile
memory, which is restricted to 256 MB. Thus, a "memory limit reached" error can occur
although the hard disk indicates that storage space is still available.
To store data permanently, select an external storage location such as a USB memory
device.
For details, see "Protecting Data Using the Secure User Mode" in the "Data Management" section of the R&S FSMR3 User Manual.
For details, see "Protecting Data Using the Secure User Mode" in the "Data Management" section of the R&S FSMR3000 base unit user manual.
Remote command:
MMEMory:STORe<n>:TRACe on page 95
File Type ← Export Trace to ASCII File ← Export
Determines the format of the ASCII file to be imported or exported.
36User Manual 1179.0139.02 ─ 02
Page 37

R&S®FSMR3-B1
Configuration
Import/export functions
Depending on the external program in which the data file was created or is evaluated,
a comma-separated list (CSV) or a plain data format (DAT) file is required.
Remote command:
FORMat:DEXPort:FORMat on page 95
Decimal Separator ← Export Trace to ASCII File ← Export
Defines the decimal separator for floating-point numerals for the data export/import
files. Evaluation programs require different separators in different languages.
Remote command:
FORMat:DEXPort:DSEParator on page 95
File Explorer ← Export Trace to ASCII File ← Export
Opens the Microsoft Windows File Explorer.
Remote command:
not supported
Trace Export Configuration ← Export
Opens the "Traces" dialog box to configure the trace and data export settings.
I/Q Export ← Export
Opens a file selection dialog box to define an export file name to which the I/Q data is
stored. This function is only available in single sweep mode.
It is not available in the Spectrum application, only in applications that process I/Q
data, such as the I/Q Analyzer or optional applications.
For details, see the description in the R&S FSMR3 I/Q Analyzer User Manual ("Importing and Exporting I/Q Data").
Note: Storing large amounts of I/Q data (several Gigabytes) can exceed the available
(internal) storage space on the R&S FSMR3. In this case, it can be necessary to use
an external storage medium.
Note: Secure user mode.
In secure user mode, settings that are stored on the instrument are stored to volatile
memory, which is restricted to 256 MB. Thus, a "memory limit reached" error can occur
although the hard disk indicates that storage space is still available.
To store data permanently, select an external storage location such as a USB memory
device.
For details, see "Protecting Data Using the Secure User Mode" in the "Data Management" section of the R&S FSMR3 User Manual.
For details, see "Protecting Data Using the Secure User Mode" in the "Data Management" section of the R&S FSMR3000 base unit user manual.
Remote command:
MMEMory:STORe<n>:IQ:STATe on page 144
MMEMory:STORe<n>:IQ:COMMent on page 144
File Explorer ← I/Q Export ← Export
Opens the Microsoft Windows File Explorer.
37User Manual 1179.0139.02 ─ 02
Page 38

R&S®FSMR3-B1
5.3 Configuring data inputs and outputs
5.3.1 Inputs
Configuration
Configuring data inputs and outputs
Remote command:
not supported
The R&S FSMR3 can analyze signals from different input sources and provide various
types of output (such as video or trigger signals).
● Inputs...................................................................................................................... 38
● Outputs....................................................................................................................41
The I/Q Analyzer supports several input sources.
● RF input...................................................................................................................38
● Power sensors........................................................................................................ 40
● External generators.................................................................................................40
● Probes.....................................................................................................................40
● Settings for input from I/Q data files........................................................................40
5.3.1.1 RF input
Access: "Overview" > "Input/Frontend" > "Input Source" > "Radio Frequency"
The remote commands required to configure inputs are described in Chapter 8.6.3,
"Configuring level characteristics", on page 107, Chapter 8.6.4, "Configuring the
attenuator", on page 109 and Chapter 8.6.5, "Configuring the preamplifier",
on page 110.
Radio Frequency State................................................................................................. 38
Input Coupling...............................................................................................................38
Impedance.................................................................................................................... 39
High Pass Filter 1 to 3 GHz...........................................................................................39
YIG-Preselector.............................................................................................................39
Radio Frequency State
Activates input from the "RF Input" connector.
Remote command:
INPut<ip>:SELect on page 105
Input Coupling
The RF input of the R&S FSMR3 can be coupled by alternating current (AC) or direct
current (DC).
AC coupling blocks any DC voltage from the input signal. AC coupling is activated by
default to prevent damage to the instrument. Very low frequencies in the input signal
can be distorted.
38User Manual 1179.0139.02 ─ 02
Page 39

R&S®FSMR3-B1
Configuration
Configuring data inputs and outputs
However, some specifications require DC coupling. In this case, you must protect the
instrument from damaging DC input voltages manually. For details, refer to the data
sheet.
Remote command:
INPut<ip>:COUPling on page 102
Impedance
The R&S FSMR3 has an internal impedance of 50 Ω. However, some applications use
other impedance values. To match the impedance of an external application to the
impedance of the R&S FSMR3, an impedance matching pad can be inserted at the
input. If the type and impedance value of the used matching pad is known to the
R&S FSMR3, it can convert the measured units accordingly so that the results are calculated correctly.
This function is not available for input from the optional "Digital Baseband" interface.
Not all settings are supported by all R&S FSMR3 applications.
The impedance conversion does not affect the level of the output signals (such as IF,
video, demod, digital I/Q output).
"50Ω"
(Default:) no conversion takes place
"75Ω"
"User"
Remote command:
INPut<ip>:IMPedance on page 104
INPut<ip>:IMPedance:PTYPe on page 104
High Pass Filter 1 to 3 GHz
Activates an additional internal highpass filter for RF input signals from 1 GHz to
3 GHz. This filter is used to remove the harmonics of the analyzer to measure the harmonics for a DUT, for example.
This function requires an additional hardware option.
Note: For RF input signals outside the specified range, the high-pass filter has no
effect. For signals with a frequency of approximately 4 GHz upwards, the harmonics
are suppressed sufficiently by the YIG-preselector, if available.)
Remote command:
INPut<ip>:FILTer:HPASs[:STATe] on page 103
The 50 Ω input impedance is transformed to a higher impedance
using a 75 Ω adapter of the selected "Pad Type": "Series-R" (default)
or "MLP" (Minimum Loss Pad)
The 50 Ω input impedance is transformed to a user-defined impedance value according to the selected "Pad Type": "Series-R"
(default) or "MLP" (Minimum Loss Pad)
YIG-Preselector
Enables or disables the YIG-preselector, if available on the R&S FSMR3000.
An internal YIG-preselector at the input of the R&S FSMR3000 ensures that image fre-
quencies are rejected. However, image rejection is only possible for a restricted bandwidth. To use the maximum bandwidth for signal analysis you can disable the YIG-preselector at the input of the R&S FSMR3000, which can lead to image-frequency display.
39User Manual 1179.0139.02 ─ 02
Page 40

R&S®FSMR3-B1
5.3.1.2 Power sensors
Configuration
Configuring data inputs and outputs
Note: Note that the YIG-preselector is active only on frequencies greater than 8 GHz.
Therefore, switching the YIG-preselector on or off has no effect if the frequency is
below that value.
Note:
For the following measurements, the YIG-"Preselector" is off by default (if available).
●
VSA
Remote command:
INPut<ip>:FILTer:YIG[:STATe] on page 103
Access: "Overview" > "Input" > "Power Sensors"
The functionality to use power sensors is the same as in the optional spectrum application.
For a comprehensive description, refer to the user manual of the optional R&S FSMR3
spectrum application.
5.3.1.3 External generators
Access: "Overview" > "Input" > "External Generator"
Controlling external generators is available with the optional external generator control.
The functionality is the same as in the optional spectrum application.
For a comprehensive description, refer to the user manual of the optional R&S FSMR3
spectrum application.
5.3.1.4 Probes
Access: "Overview" > "Input" > "Probes"
The functionality to use probes (via the RF input) is the same as in the optional spectrum application.
For a comprehensive description, refer to the user manual of the optional R&S FSMR3
spectrum application.
5.3.1.5 Settings for input from I/Q data files
Access: "Overview" > "Input/Frontend" > "Input Source" > "I/Q File"
Or: [INPUT/OUTPUT] > "Input Source Config" > "Input Source" > "I/Q File"
40User Manual 1179.0139.02 ─ 02
Page 41

R&S®FSMR3-B1
Configuration
Configuring data inputs and outputs
For details, see Chapter 4.2, "Basics on input from I/Q data files", on page 23.
I/Q Input File State........................................................................................................ 41
Select I/Q data file.........................................................................................................41
I/Q Input File State
Enables input from the selected I/Q input file.
If enabled, the application performs measurements on the data from this file. Thus,
most measurement settings related to data acquisition (attenuation, center frequency,
measurement bandwidth, sample rate) cannot be changed. The measurement time
can only be decreased to perform measurements on an extract of the available data
only.
Note: Even when the file input is disabled, the input file remains selected and can be
enabled again quickly by changing the state.
Remote command:
INPut<ip>:SELect on page 105
Select I/Q data file
Opens a file selection dialog box to select an input file that contains I/Q data.
The I/Q data must have a specific format (.iq.tar) as described in Chapter A.3, "I/Q
data file format (iq-tar)", on page 150.
The default storage location for I/Q data files is C:\R_S\INSTR\USER.
Remote command:
INPut<ip>:FILE:PATH on page 102
5.3.2 Outputs
Access: "Overview" > "Output"
The output supported by the I/Q Analyzer are similar to those in the Phase Noise
Spectrum applications.
For a comprehensive description on how to configure the DC Power sources and the
Signal Source, refer to the documentation of the R&S FSMR3.
Noise Source Control....................................................................................................42
Trigger 1/2.....................................................................................................................42
└ Output Type.................................................................................................... 43
41User Manual 1179.0139.02 ─ 02
Page 42

R&S®FSMR3-B1
Configuration
Configuring data inputs and outputs
└ Level..................................................................................................... 43
└ Pulse Length.........................................................................................43
└ Send Trigger.........................................................................................43
Noise Source Control
Enables or disables the 28 V voltage supply for an external noise source connected to
the "Noise source control / Power sensor") connector. By switching the supply voltage
for an external noise source on or off in the firmware, you can enable or disable the
device as required.
External noise sources are useful when you are measuring power levels that fall below
the noise floor of the R&S FSMR3000 itself, for example when measuring the noise
level of an amplifier.
In this case, you can first connect an external noise source (whose noise power level is
known in advance) to the R&S FSMR3000 and measure the total noise power. From
this value, you can determine the noise power of the R&S FSMR3000. Then when you
measure the power level of the actual DUT, you can deduct the known noise level from
the total power to obtain the power level of the DUT.
Remote command:
DIAGnostic:SERVice:NSOurce on page 106
Trigger 1/2
The trigger input and output functionality depends on how the variable "Trigger Input/
Output" connectors are used.
"Trigger 1"
"Trigger 2"
"Input"
"Trigger 1": "Trigger Input/Output" connector on the front panel
Defines the usage of the variable "Trigger Input/Output" connector on
the rear panel.
The signal at the connector is used as an external trigger source by
the R&S FSMR3000. Trigger input parameters are available in the
"Trigger" dialog box.
42User Manual 1179.0139.02 ─ 02
Page 43

R&S®FSMR3-B1
Configuration
Configuring data inputs and outputs
"Output"
Remote command:
OUTPut<up>:TRIGger<tp>:DIRection on page 121
Output Type ← Trigger 1/2
Type of signal to be sent to the output
"Device Trig-
gered"
"Trigger
Armed"
"User Defined"
Remote command:
OUTPut<up>:TRIGger<tp>:OTYPe on page 122
Level ← Output Type ← Trigger 1/2
Defines whether a high (1) or low (0) constant signal is sent to the trigger output connector (for "Output Type": "User Defined".
The trigger pulse level is always opposite to the constant signal level defined here. For
example, for "Level" = "High", a constant high signal is output to the connector until you
select the Send Trigger function. Then, a low pulse is provided.
The R&S FSMR3000 sends a trigger signal to the output connector to
be used by connected devices.
Further trigger parameters are available for the connector.
(Default) Sends a trigger when the R&S FSMR3000 triggers.
Sends a (high level) trigger when the R&S FSMR3000 is in "Ready
for trigger" state.
This state is indicated by a status bit in the STATus:OPERation register (bit 5), as well as by a low-level signal at the "AUX" port (pin 9).
Sends a trigger when you select the "Send Trigger" button.
In this case, further parameters are available for the output signal.
Remote command:
OUTPut<up>:TRIGger<tp>:LEVel on page 121
Pulse Length ← Output Type ← Trigger 1/2
Defines the duration of the pulse (pulse width) sent as a trigger to the output connector.
Remote command:
OUTPut<up>:TRIGger<tp>:PULSe:LENGth on page 122
Send Trigger ← Output Type ← Trigger 1/2
Sends a user-defined trigger to the output connector immediately.
Note that the trigger pulse level is always opposite to the constant signal level defined
by the output Level setting. For example, for "Level" = "High", a constant high signal is
output to the connector until you select the "Send Trigger" function. Then, a low pulse
is sent.
Which pulse level is sent is indicated by a graphic on the button.
43User Manual 1179.0139.02 ─ 02
Page 44

R&S®FSMR3-B1
5.4 Configuring the amplitude
5.4.1 Configuring level characteristics
Configuration
Configuring the amplitude
Remote command:
OUTPut<up>:TRIGger<tp>:PULSe:IMMediate on page 122
The amplitude is configured in the "Amplitude" dialog box. Amplitude settings are similar to those of the Spectrum application, except for a few functions
● Configuring level characteristics............................................................................. 44
● Scaling the level axis...............................................................................................48
Access: "Overview" > "Amplitude" > "Amplitude"
The electronic attenuator and its settings are not supported by the R&S FSMR3.
Functions to configure amplitude characteristics described elsewhere:
●
"Input Coupling" on page 38
●
"Impedance" on page 39
44User Manual 1179.0139.02 ─ 02
Page 45

R&S®FSMR3-B1
Configuration
Configuring the amplitude
●
Scaling settings are described in Chapter 5.4.2, "Scaling the level axis",
on page 48.
The remote commands required to configure amplitude characteristics are described in
Chapter 8.6.3, "Configuring level characteristics", on page 107, Chapter 8.6.4, "Configuring the attenuator", on page 109 and Chapter 8.6.5, "Configuring the preamplifier",
on page 110.
Reference Level............................................................................................................45
└ Shifting the Display (Offset)............................................................................ 45
└ Unit..................................................................................................................45
└ Setting the Reference Level Automatically (Auto Level).................................46
Attenuation Mode / Value.............................................................................................. 46
Optimization.................................................................................................................. 47
Preamplifier...................................................................................................................47
Noise Cancellation........................................................................................................ 47
Reference Level
Defines the expected maximum reference level. Signal levels above this value are possibly not measured correctly. Signals above the reference level are indicated by an "IF
Overload" status display.
The reference level can also be used to scale power diagrams; the reference level is
then used for the calculation of the maximum on the y-axis.
Since the hardware of the R&S FSMR3000 is adapted according to this value, it is recommended that you set the reference level close above the expected maximum signal
level. Thus you ensure an optimum measurement (no compression, good signal-tonoise ratio).
Remote command:
DISPlay[:WINDow<n>][:SUBWindow<w>]:TRACe<t>:Y[:SCALe]:RLEVel
on page 108
Shifting the Display (Offset) ← Reference Level
Defines an arithmetic level offset. This offset is added to the measured level. In some
result displays, the scaling of the y-axis is changed accordingly.
Define an offset if the signal is attenuated or amplified before it is fed into the
R&S FSMR3 so the application shows correct power results. All displayed power level
results are shifted by this value.
The setting range is ±200 dB in 0.01 dB steps.
Note, however, that the internal reference level (used to adjust the hardware settings to
the expected signal) ignores any "Reference Level Offset". Thus, it is important to keep
in mind the actual power level the R&S FSMR3 must handle. Do not rely on the displayed reference level (internal reference level = displayed reference level - offset).
Remote command:
DISPlay[:WINDow<n>][:SUBWindow<w>]:TRACe<t>:Y[:SCALe]:RLEVel:
OFFSet on page 108
Unit ← Reference Level
The R&S FSMR3000 measures the signal voltage at the RF input.
45User Manual 1179.0139.02 ─ 02
Page 46

R&S®FSMR3-B1
Configuration
Configuring the amplitude
In the default state, the level is displayed at a power level of 1 mW (= dBm). Via the
known input impedance (50 Ω or 75 Ω, see "Impedance" on page 39), conversion to
other units is possible.
The following units are available and directly convertible:
●
dBm
●
dBmV
●
dBμV
●
dBμA
●
dBpW
●
Volt
●
Ampere
●
Watt
Remote command:
INPut<ip>:IMPedance on page 104
CALCulate<n>:UNIT:POWer on page 108
Setting the Reference Level Automatically (Auto Level) ← Reference Level
Automatically determines a reference level which ensures that no overload occurs at
the R&S FSMR3000 for the current input data. At the same time, the internal attenuators are adjusted. As a result, the signal-to-noise ratio is optimized, while signal compression and clipping are minimized.
To determine the required reference level, a level measurement is performed on the
R&S FSMR3000.
If necessary, you can optimize the reference level further. Decrease the attenuation
level manually to the lowest possible value before an overload occurs, then decrease
the reference level in the same way.
You can change the measurement time for the level measurement if necessary (see
"Changing the Automatic Measurement Time (Meastime Manual)" on page 64).
Remote command:
[SENSe:]ADJust:LEVel on page 135
Attenuation Mode / Value
The RF attenuation can be set automatically as a function of the selected reference
level (Auto mode). Automatic attenuation ensures that no overload occurs at the RF
Input connector for the current reference level. It is the default setting.
In "Manual" mode, you can set the RF attenuation in 1 dB steps (down to 0 dB). Other
entries are rounded to the next integer value. The range is specified in the data sheet.
If the defined reference level cannot be set for the defined RF attenuation, the reference level is adjusted accordingly and the warning "limit reached" is displayed.
NOTICE! Risk of hardware damage due to high power levels. When decreasing the
attenuation manually, ensure that the power level does not exceed the maximum level
allowed at the RF input, as an overload can lead to hardware damage.
Remote command:
INPut<ip>:ATTenuation on page 109
INPut<ip>:ATTenuation:AUTO on page 110
46User Manual 1179.0139.02 ─ 02
Page 47

R&S®FSMR3-B1
Configuration
Configuring the amplitude
Optimization
Selects the priority for signal processing after the RF attenuation has been applied.
"Low distortion"
(Default:) Optimized for low distortion by avoiding intermodulation
"Low noise"
Remote command:
INPut<ip>:ATTenuation:AUTO:MODE on page 110
Preamplifier
If the (optional) internal preamplifier hardware is installed, a preamplifier can be activated for the RF input signal.
You can use a preamplifier to analyze signals from DUTs with low output power.
"Off"
"15 dB"
"30 dB"
For FSMR3050, the input signal is amplified by 30 dB if the preamplifier is activated.
Remote command:
INPut<ip>:GAIN:STATe on page 111
INPut<ip>:GAIN[:VALue] on page 111
Optimized for high sensitivity and low noise levels
If this setting is selected, "Low noise" is indicated in the channel information bar.
Deactivates the preamplifier.
The RF input signal is amplified by about 15 dB.
The RF input signal is amplified by about 30 dB.
Noise Cancellation
The R&S FSMR3 can correct the results by removing the inherent noise of the analyzer, which increases the dynamic range.
In this case, a reference measurement of the inherent noise of the analyzer is carried
out. The measured noise power is then subtracted from the power in the channel that
is being analyzed (first active trace only).
The inherent noise of the instrument depends on the selected center frequency, resolution bandwidth and level setting. Therefore, the correction function is disabled whenever one of these parameters is changed. A disable message is displayed on the
screen. To enable the correction function after changing one of these settings, activate
it again. A new reference measurement is carried out.
Noise cancellation is also available in zero span.
Currently, noise cancellation is only available for the following trace detectors:
●
RMS
●
Average
●
Sample
●
Positive peak
Remote command:
[SENSe:]POWer:NCORrection on page 109
47User Manual 1179.0139.02 ─ 02
Page 48

R&S®FSMR3-B1
5.4.2 Scaling the level axis
Configuration
Configuring the amplitude
Access: "Overview" > "Amplitude" > "Scale"
The remote commands required to scale the y-axis are described in Chapter 8.6.6,
"Scaling the Y-Axis", on page 112.
Range............................................................................................................................48
Ref Level Position......................................................................................................... 48
Auto Scale Once........................................................................................................... 49
Scaling.......................................................................................................................... 49
Y-Axis Max.................................................................................................................... 49
Range
Defines the displayed y-axis range in dB.
The default value is 100 dB.
Remote command:
DISPlay[:WINDow<n>][:SUBWindow<w>]:TRACe<t>:Y[:SCALe] on page 112
Ref Level Position
Defines the reference level position, i.e. the position of the maximum AD converter
value on the level axis in %.
0 % corresponds to the lower and 100 % to the upper limit of the diagram.
Values from -120 % to +600 % are available. Larger values are useful for small scales,
such as a power range of 10 dB or 20 dB, and low signal levels, for example 60 dB
below the reference level. In this case, large reference level position values allow you
to see the trace again.
Remote command:
DISPlay[:WINDow<n>][:SUBWindow<w>]:TRACe<t>:Y[:SCALe]:RPOSition
on page 113
48User Manual 1179.0139.02 ─ 02
Page 49

R&S®FSMR3-B1
Configuration
Configuring frequency characteristics
Auto Scale Once
Automatically determines the optimal range and reference level position to be displayed for the current measurement settings.
The display is only set once; it is not adapted further if the measurement settings are
changed again.
Remote command:
DISPlay[:WINDow<n>][:SUBWindow<w>]:TRACe<t>:Y[:SCALe]:AUTO ONCE
on page 112
Scaling
Defines the scaling method for the y-axis.
"Logarithmic"
"Linear with
Unit"
"Linear Percent"
"Absolute"
"Relative"
Remote command:
DISPlay[:WINDow<n>][:SUBWindow<w>]:TRACe<t>:Y:SPACing on page 113
DISPlay[:WINDow<n>][:SUBWindow<w>]:TRACe<t>:Y[:SCALe]:MODE
on page 112
Logarithmic scaling (only available for logarithmic units - dB..., and A,
V, Watt)
Linear scaling in the unit of the measured signal
Linear scaling in percentages from 0 to 100
The labeling of the level lines refers to the absolute value of the reference level (not available for "Linear Percent")
The scaling is in dB, relative to the reference level (only available for
logarithmic units - dB...). The upper line of the grid (reference level) is
always at 0 dB.
Y-Axis Max
Defines the maximum value of the y-axis in the currently selected diagram in either
direction (in Volts). Thus, the y-axis scale starts at -<Y-Axis Max> and ends at +<Y-Axis
Max>.
The maximum y-axis value depends on the current reference level. If the reference
level is changed, the "Y-Axis Max" value is automatically set to the new reference level
(in V).
This command is only available if the evaluation mode for the I/Q Analyzer is set to
"I/Q-Vector" or "Real/Imag (I/Q)".
Remote command:
DISPlay[:WINDow<n>][:SUBWindow<w>]:TRACe<t>:Y[:SCALe] on page 112
5.5 Configuring frequency characteristics
Access: "Overview" > "Frequency"
49User Manual 1179.0139.02 ─ 02
Page 50

R&S®FSMR3-B1
Configuration
Configuring frequency characteristics
The remote commands required to configure the frequency are described in Chap-
ter 8.6.7, "Configuring the frequency", on page 114.
Center Frequency......................................................................................................... 50
Center Frequency Stepsize...........................................................................................50
Frequency Offset...........................................................................................................50
Center Frequency
Defines the center frequency of the signal in Hertz.
The allowed range of values for the center frequency depends on the frequency span.
span > 0: span
f
and span
max
/2 ≤ f
min
depend on the instrument and are specified in the data sheet.
min
center
≤ f
max
– span
min
/2
Remote command:
[SENSe:]FREQuency:CENTer on page 114
Center Frequency Stepsize
Defines the step size by which the center frequency is increased or decreased using
the arrow keys.
When you use the rotary knob the center frequency changes in steps of only 1/10 of
the span.
The step size can be coupled to another value or it can be manually set to a fixed
value.
"= Center"
Sets the step size to the value of the center frequency. The used
value is indicated in the "Value" field.
"Manual"
Defines a fixed step size for the center frequency. Enter the step size
in the "Value" field.
Remote command:
[SENSe:]FREQuency:CENTer:STEP on page 115
Frequency Offset
Shifts the displayed frequency range along the x-axis by the defined offset.
50User Manual 1179.0139.02 ─ 02
Page 51

R&S®FSMR3-B1
5.6 Configuring triggered measurements
Configuration
Configuring triggered measurements
This parameter has no effect on the instrument's hardware, on the captured data, or on
data processing. It is simply a manipulation of the final results in which absolute frequency values are displayed. Thus, the x-axis of a spectrum display is shifted by a
constant offset if it shows absolute frequencies. However, if it shows frequencies relative to the signal's center frequency, it is not shifted.
A frequency offset can be used to correct the display of a signal that is slightly distorted
by the measurement setup, for example.
The allowed values range from -1 THz to 1 THz. The default setting is 0 Hz.
Remote command:
[SENSe:]FREQuency:OFFSet on page 115
Access (trigger source): "Overview" > "Trigger / Gate" > "Trigger Source"
Access (trigger connectors): "Overview" > "Trigger / Gate" > "Trigger In / Out"
Trigger settings determine when the input signal is measured.
Conventional gating as in the Spectrum application is not available for the I/Q Analyzer; however, a special gating mode is available in remote control, see Chap-
ter 8.6.10, "Configuring gated measurements", on page 123.
For step-by-step instructions on configuring triggered measurements, see the user
manual of the spectrum application.
Functions to configure trigger output described elsewhere:
●
"Trigger 1/2" on page 42
The remote commands required to configure triggered measurements are described in
Chapter 8.6.8, "Configuring trigger", on page 116.
Trigger Source...............................................................................................................52
└ Free Run.........................................................................................................52
└ External Trigger 1/2........................................................................................ 52
└ IF Power..........................................................................................................53
└ I/Q Power........................................................................................................53
51User Manual 1179.0139.02 ─ 02
Page 52

R&S®FSMR3-B1
Configuration
Configuring triggered measurements
└ RF Power........................................................................................................53
└ Power Sensor................................................................................................. 53
└ Time................................................................................................................54
Trigger Level................................................................................................................. 54
Repetition Interval......................................................................................................... 54
Trigger Offset................................................................................................................ 54
Hysteresis..................................................................................................................... 55
Drop-Out Time...............................................................................................................55
Trigger Holdoff...............................................................................................................55
Slope.............................................................................................................................55
Trigger Source
Selects the trigger source. If a trigger source other than "Free Run" is set, "TRG" is displayed in the channel bar and the trigger source is indicated.
Remote command:
TRIGger[:SEQuence]:SOURce on page 119
Free Run ← Trigger Source
No trigger source is considered. Data acquisition is started manually or automatically
and continues until stopped explicitly.
Remote command:
TRIG:SOUR IMM, see TRIGger[:SEQuence]:SOURce on page 119
External Trigger 1/2 ← Trigger Source
Data acquisition starts when the TTL signal fed into the specified input connector
meets or exceeds the specified trigger level.
(See "Trigger Level" on page 54).
Note: The "External Trigger 1" softkey automatically selects the trigger signal from the
"TRIGGER 1 INPUT / OUTPUT" connector on the front panel.
In the I/Q Analyzer application, only "External Trigger 1" is supported.
For details, see the "Instrument Tour" chapter in the R&S FSMR3 Getting Started manual.
"External Trigger 1"
Trigger signal from the "TRIGGER 1 INPUT / OUTPUT" connector.
(front panel)
"External Trigger 2"
Trigger signal from the "TRIGGER 2 INPUT / OUTPUT" connector.
(rear panel)
Note: Connector must be configured for "Input" in the "Output" configuration
(See the R&S FSMR3 user manual).
Remote command:
TRIG:SOUR EXT, TRIG:SOUR EXT2
See TRIGger[:SEQuence]:SOURce on page 119
52User Manual 1179.0139.02 ─ 02
Page 53

R&S®FSMR3-B1
Configuration
Configuring triggered measurements
IF Power ← Trigger Source
The R&S FSMR3 starts capturing data as soon as the trigger level is exceeded around
the third intermediate frequency.
For frequency sweeps, the third IF represents the start frequency. The trigger threshold
depends on the defined trigger level, as well as on the RF attenuation and preamplification. A reference level offset, if defined, is also considered. The trigger bandwidth at
the intermediate frequency depends on the RBW and sweep type. For details on available trigger levels and trigger bandwidths, see the instrument data sheet.
For measurements on a fixed frequency (e.g. zero span or I/Q measurements), the
third IF represents the center frequency.
This trigger source is only available for RF input.
The available trigger levels depend on the RF attenuation and preamplification. A refer-
ence level offset, if defined, is also considered.
For details on available trigger levels and trigger bandwidths, see the data sheet.
Remote command:
TRIG:SOUR IFP, see TRIGger[:SEQuence]:SOURce on page 119
I/Q Power ← Trigger Source
This trigger source is only available in the I/Q Analyzer application and in applications
that process I/Q data.
Triggers the measurement when the magnitude of the sampled I/Q data exceeds the
trigger threshold.
The trigger bandwidth corresponds to the bandwidth setting for I/Q data acquisition.
Remote command:
TRIG:SOUR IQP, see TRIGger[:SEQuence]:SOURce on page 119
RF Power ← Trigger Source
Defines triggering of the measurement via signals which are outside the displayed
measurement range.
For this purpose, the instrument uses a level detector at the first intermediate frequency.
The input signal must be in the frequency range between 500 MHz and 8 GHz.
The resulting trigger level at the RF input depends on the RF attenuation and preampli-
fication. For details on available trigger levels, see the instrument's data sheet.
Note: If the input signal contains frequencies outside of this range (e.g. for fullspan
measurements), the sweep can be aborted. A message indicating the allowed input
frequencies is displayed in the status bar.
A "Trigger Offset", "Trigger Polarity" and "Trigger Holdoff" (to improve the trigger stability) can be defined for the RF trigger, but no "Hysteresis".
Remote command:
TRIG:SOUR RFP, see TRIGger[:SEQuence]:SOURce on page 119
Power Sensor ← Trigger Source
Uses an external power sensor as a trigger source. This option is only available if a
power sensor is connected and configured.
53User Manual 1179.0139.02 ─ 02
Page 54

R&S®FSMR3-B1
Configuration
Configuring triggered measurements
Connect the external power sensor to the "Smart Noise Source" connector on the front
panel of the R&S FSMR3 when using the power sensor as a trigger source.
Note: For Rohde & Schwarz power sensors, the "Gate Mode" Lvl is not supported. The
signal sent by these sensors merely reflects the instant the level is first exceeded,
rather than a time period. However, only time periods can be used for gating in level
mode. Thus, the trigger impulse from the sensors is not long enough for a fully gated
measurement; the measurement cannot be completed.
Remote command:
TRIG:SOUR PSE, see TRIGger[:SEQuence]:SOURce on page 119
Time ← Trigger Source
Triggers in a specified repetition interval.
See "Repetition Interval" on page 54.
Remote command:
TRIG:SOUR TIME, see TRIGger[:SEQuence]:SOURce on page 119
Trigger Level
Defines the trigger level for the specified trigger source.
For details on supported trigger levels, see the instrument data sheet.
For time triggers, the repetition interval is defined. See "Repetition Interval"
on page 54.
Remote command:
TRIGger[:SEQuence]:LEVel:IFPower on page 118
TRIGger[:SEQuence]:LEVel:IQPower on page 118
TRIGger[:SEQuence]:LEVel[:EXTernal<port>] on page 118
TRIGger[:SEQuence]:LEVel:RFPower on page 119
Repetition Interval
Defines the repetition interval for a time trigger.
The shortest interval is 2 ms.
Set the repetition interval to the exact pulse period, burst length, frame length or other
repetitive signal characteristic. If the required interval cannot be set with the available
granularity, configure a multiple of the interval that can be set. Thus, the trigger
remains synchronized to the signal.
Remote command:
TRIGger[:SEQuence]:TIME:RINTerval on page 120
Trigger Offset
Defines the time offset between the trigger event and the start of the sweep.
Offset > 0: Start of the sweep is delayed
Offset < 0: Sweep starts earlier (pretrigger)
Only possible for zero span (e.g. I/Q Analyzer application) and gated trigger switched off
Maximum allowed range limited by the sweep time:
Pretrigger
= sweep time
max
max
54User Manual 1179.0139.02 ─ 02
Page 55

R&S®FSMR3-B1
Configuration
Data acquisition and bandwidth settings
Tip: To determine the trigger point in the sample (for "External" or "IF Power" trigger
source), use the TRACe:IQ:TPISample? command.
For the "Time" trigger source, this function is not available.
Remote command:
TRIGger[:SEQuence]:HOLDoff[:TIME] on page 116
Hysteresis
Defines the distance in dB to the trigger level that the trigger source must exceed
before a trigger event occurs. Setting a hysteresis avoids unwanted trigger events
caused by noise oscillation around the trigger level.
This setting is only available for "IF Power" trigger sources. The range of the value is
between 3 dB and 50 dB with a step width of 1 dB.
Remote command:
TRIGger[:SEQuence]:IFPower:HYSTeresis on page 117
Drop-Out Time
Defines the time that the input signal must stay below the trigger level before triggering
again.
Remote command:
TRIGger[:SEQuence]:DTIMe on page 116
Trigger Holdoff
Defines the minimum time (in seconds) that must pass between two trigger events.
Trigger events that occur during the holdoff time are ignored.
Remote command:
TRIGger[:SEQuence]:IFPower:HOLDoff on page 117
Slope
For all trigger sources except time, you can define whether triggering occurs when the
signal rises to the trigger level or falls down to it.
For gated measurements in "Edge" mode, the slope also defines whether the gate
starts on a falling or rising edge.
Remote command:
TRIGger[:SEQuence]:SLOPe on page 119
5.7 Data acquisition and bandwidth settings
Access: "Overview" > "Bandwidth"
● Data acquisition.......................................................................................................55
● Sweep settings........................................................................................................60
5.7.1 Data acquisition
Access: "Overview" > "Bandwidth" > "Data Acquisition" tab
55User Manual 1179.0139.02 ─ 02
Page 56

R&S®FSMR3-B1
Configuration
Data acquisition and bandwidth settings
The data acquisition settings define which parts of the input signal are captured for further evaluation in the applications.
Figure 5-1: Data acquisition settings with advanced FFT parameters
The remote commands required to configure the data acquisition are described in
Chapter 8.6.11, "Configuring data acquisition", on page 125.
Sample Rate................................................................................................................. 56
Analysis Bandwidth.......................................................................................................57
200 MHz Filter...............................................................................................................57
Meas Time.....................................................................................................................57
Record Length...............................................................................................................57
Swap I/Q....................................................................................................................... 58
RBW..............................................................................................................................58
Advanced FFT mode / Basic Settings...........................................................................58
└ Transformation Algorithm................................................................................59
└ FFT Length..................................................................................................... 59
└ Window Function............................................................................................ 59
└ Window Overlap..............................................................................................59
└ Window Length............................................................................................... 60
Sample Rate
Defines the I/Q data sample rate of the R&S FSMR3. This value depends on the
defined Analysis Bandwidth.
The following rule applies:
sample rate = analysis bandwidth / 0.8
For details on the dependencies see Chapter 4.1.1, "Sample rate and maximum usable
I/Q bandwidth for RF input", on page 21.
56User Manual 1179.0139.02 ─ 02
Page 57

R&S®FSMR3-B1
Configuration
Data acquisition and bandwidth settings
Remote command:
TRACe:IQ:SRATe on page 130
Analysis Bandwidth
Defines the flat, usable bandwidth of the final I/Q data. This value depends on the
defined Sample Rate.
The following rule applies:
analysis bandwidth = 0.8 * sample rate
Remote command:
TRACe:IQ:BWIDth on page 128
200 MHz Filter
Activates a 200 MHz filter before the A/D converter, thus restricting the processed
bandwidth to 200 MHz while using the wideband processing path in the
R&S FSMR3000.
This is useful for signals that have a bandwidth of approximately 200 MHz (for example
Docsis 3.1). In this case, the R&S FSMR3000 can optimize signal processing for the
relevant signal and filter out unwanted signal parts from adjacent channels, while taking advantage of a higher sample rate.
If you simply reduce the specified Analysis Bandwidth, the sample rate, which is coupled, is also reduced.
If the filter is active, "200 MHz" is indicated in the channel information bar.
Remote command:
TRACe:IQ:WFILter on page 132
Meas Time
Defines the I/Q acquisition time. By default, the measurement time is calculated as the
number of I/Q samples ("Record Length") divided by the sample rate. If you change the
measurement time, the Record Length is automatically changed, as well.
For details on the maximum number of samples see also Chapter 4.1.1, "Sample rate
and maximum usable I/Q bandwidth for RF input", on page 21.
Remote command:
[SENSe:]SWEep:TIME on page 89
Record Length
Defines the number of I/Q samples to record. By default, the number of sweep points is
used. The record length is calculated as the measurement time multiplied by the sample rate. If you change the record length, the Meas Time is automatically changed, as
well.
Note: For the I/Q vector result display, the number of I/Q samples to record ("Record
Length") must be identical to the number of trace points to be displayed ("Sweep
Points"). Thus, the sweep points are not editable for this result display. If the "Record
Length" is edited, the sweep points are adapted automatically.
For record lengths outside the valid range of sweep points, i.e. fewer than 101 points
or more than 100001 points, the diagram does not show valid results.
57User Manual 1179.0139.02 ─ 02
Page 58

R&S®FSMR3-B1
Configuration
Data acquisition and bandwidth settings
Remote command:
TRACe:IQ:RLENgth on page 129
TRACe:IQ:SET on page 129
Swap I/Q
Activates or deactivates the inverted I/Q modulation. If the I and Q parts of the signal
from the DUT are interchanged, the R&S FSMR3 can do the same to compensate for
it.
On I and Q signals are interchanged
Inverted sideband, Q+j*I
Off I and Q signals are not interchanged
Normal sideband, I+j*Q
Remote command:
[SENSe:]SWAPiq on page 128
RBW
Defines the resolution bandwidth for Spectrum results. The available RBW values
depend on the sample rate and record length.
(See Chapter 4.5.4, "Frequency resolution of FFT results - RBW", on page 30).
Depending on the selected RBW mode, the value is either determined automatically or
can be defined manually. As soon as you enter a value in the input field, the RBW
mode is changed to "Manual".
If the "Advanced Fourier Transformation Params" option is enabled, advanced FFT
mode is selected and the RBW cannot be defined directly.
Note that the RBW is correlated with the Sample Rate and Record Length (and possibly the Window Function and Window Length). Changing any one of these parameters
may cause a change to one or more of the other parameters. For more information see
Chapter 4.5, "Basics on FFT", on page 25.
"Auto mode"
(Default) The RBW is determined automatically depending on the
Sample Rate and Record Length.
"Manual mode"
The RBW can be defined by the user.
The user-defined RBW is used and the Window Length (and possibly
Sample Rate) are adapted accordingly.
"Advanced
FFT mode"
This mode is used if the "Advanced Fourier Transformation Params"
option is enabled.
The RBW is determined by the advanced FFT parameters.
Remote command:
[SENSe:]IQ:BWIDth:MODE on page 125
[SENSe:]IQ:BWIDth:RESolution on page 126
Advanced FFT mode / Basic Settings
Shows or hides the "Advanced Fourier Transformation" parameters in the "Data Acquisition" dialog box.
These parameters are only available and required for the advanced FFT mode.
58User Manual 1179.0139.02 ─ 02
Page 59

R&S®FSMR3-B1
Configuration
Data acquisition and bandwidth settings
Note that if the advanced FFT mode is used, the RBW settings are not available.
For more information see Chapter 4.5.4, "Frequency resolution of FFT results - RBW",
on page 30.
Transformation Algorithm ← Advanced FFT mode / Basic Settings
Defines the FFT calculation method.
"Single"
"Averaging"
Remote command:
[SENSe:]IQ:FFT:ALGorithm on page 126
FFT Length ← Advanced FFT mode / Basic Settings
Defines the number of frequency points determined by each FFT calculation. The more
points are used, the higher the resolution in the spectrum becomes, but the longer the
calculation takes.
In advanced FFT mode, the number of sweep points is set to the FFT length automatically.
Note: If you use the arrow keys or the rotary knob to change the FFT length, the value
is incremented or decremented by powers of 2.
If you enter the value manually, any integer value from 3 to 524288 is available.
Remote command:
[SENSe:]IQ:FFT:LENGth on page 127
One FFT is calculated for the entire record length; if the FFT Length
is larger than the record length, zeros are appended to the captured
data.
Several overlapping FFTs are calculated for each record; the results
are combined to determine the final FFT result for the record. The
number of FFTs to be averaged is determined by the Window Overlap
and the Window Length.
Window Function ← Advanced FFT mode / Basic Settings
In the I/Q analyzer you can select one of several FFT window types.
The following window types are available:
●
Blackman-Harris
●
Flattop
●
Gauss
●
Rectangular
●
5-Term
Remote command:
[SENSe:]IQ:FFT:WINDow:TYPE on page 128
Window Overlap ← Advanced FFT mode / Basic Settings
Defines the part of a single FFT window that is re-calculated by the next FFT calculation when using multiple FFT windows.
Remote command:
[SENSe:]IQ:FFT:WINDow:OVERlap on page 127
59User Manual 1179.0139.02 ─ 02
Page 60

R&S®FSMR3-B1
5.7.2 Sweep settings
Configuration
Data acquisition and bandwidth settings
Window Length ← Advanced FFT mode / Basic Settings
Defines the number of samples to be included in a single FFT window in averaging
mode. (In single mode, the window length corresponds to the "Record Length"
on page 57.)
Values from 3 to 4096 are available in "Manual" mode; in "Advanced" FFT mode, values from 3 to 524288 are available.
However, the window length may not be longer than the FFT Length.
Remote command:
[SENSe:]IQ:FFT:WINDow:LENGth on page 127
Access: "Overview" > "Bandwidth" > "Sweep" tab
For more information on the spectrogram settings that become available when you turn
on a spectrogram, refer to the R&S FSMR3 user manual.
The remote commands required to configure the sweep are described in Chap-
ter 8.6.11, "Configuring data acquisition", on page 125.
Sweep Points................................................................................................................ 60
Sweep/Average Count.................................................................................................. 61
Continuous Sweep / Run Cont......................................................................................61
Single Sweep / Run Single............................................................................................61
Continue Single Sweep.................................................................................................62
Sweep Points
In the I/Q Analyzer application, a specific frequency bandwidth is swept for a specified
measurement time. During this time, a defined number of samples (= "Record Length")
are captured. These samples are then evaluated by the applications. Therefore, in this
case the number of sweep points does not define the amount of data to be acquired,
but rather the number of trace points that are evaluated and displayed in the result diagrams.
Note: As opposed to previous versions of the I/Q Analyzer, the sweep settings are now
window-specific.
60User Manual 1179.0139.02 ─ 02
Page 61

R&S®FSMR3-B1
Configuration
Data acquisition and bandwidth settings
For some result displays, the sweep points may not be editable as they are determined
automatically, or restrictions may apply. For the I/Q vector result display, the number of
I/Q samples to record ("Record Length") must be identical to the number of trace
points to be displayed ("Sweep Points"). Thus, the sweep points are not editable for
this result display. If the "Record Length" is edited, the sweep points are adapted automatically. For record lengths outside the valid range of sweep points, i.e. less than 101
points or more than 100001 points, the diagram does not show valid results.
Using fewer than 4096 sweep points with a detector other than "Auto Peak" may lead
to wrong level results. For details see "Combining results - trace detector" on page 28.
Remote command:
[SENSe:]SWEep[:WINDow<n>]:POINts on page 89
Sweep/Average Count
Defines the number of sweeps to be performed in the single sweep mode. Values from
0 to 200000 are allowed. If the values 0 or 1 are set, one sweep is performed.
The sweep count is applied to all the traces in all diagrams.
If the trace modes "Average", "Max Hold" or "Min Hold" are set, this value also deter-
mines the number of averaging or maximum search procedures.
In continuous sweep mode, if "Sweep Count" = 0 (default), averaging is performed
over 10 sweeps. For "Sweep Count" =1, no averaging, maxhold or minhold operations
are performed.
Remote command:
[SENSe:]SWEep:COUNt on page 88
Continuous Sweep / Run Cont
After triggering, starts the sweep and repeats it continuously until stopped. This is the
default setting.
While the measurement is running, the "Continuous Sweep" softkey and the [RUN
CONT] key are highlighted. The running measurement can be aborted by selecting the
highlighted softkey or key again. The results are not deleted until a new measurement
is started.
Note: Sequencer. If the Sequencer is active, the "Continuous Sweep" softkey only controls the sweep mode for the currently selected channel. However, the sweep mode
only takes effect the next time the Sequencer activates that channel, and only for a
channel-defined sequence. In this case, a channel in continuous sweep mode is swept
repeatedly.
Furthermore, the [RUN CONT] key controls the Sequencer, not individual sweeps.
[RUN CONT] starts the Sequencer in continuous mode.
Remote command:
INITiate<n>:CONTinuous on page 85
Single Sweep / Run Single
After triggering, starts the number of sweeps set in "Sweep Count". The measurement
stops after the defined number of sweeps has been performed.
While the measurement is running, the "Single Sweep" softkey and the [RUN SINGLE]
key are highlighted. The running measurement can be aborted by selecting the highlighted softkey or key again.
61User Manual 1179.0139.02 ─ 02
Page 62

R&S®FSMR3-B1
Configuration
Adjusting settings automatically
Note: Sequencer. If the Sequencer is active, the "Single Sweep" softkey only controls
the sweep mode for the currently selected channel. However, the sweep mode only
takes effect the next time the Sequencer activates that channel, and only for a channel-defined sequence. In this case, the Sequencer sweeps a channel in single sweep
mode only once.
Furthermore, the [RUN SINGLE] key controls the Sequencer, not individual sweeps.
[RUN SINGLE] starts the Sequencer in single mode.
If the Sequencer is off, only the evaluation for the currently displayed channel is updated.
For details on the Sequencer, see the R&S FSMR3 User Manual.
Remote command:
INITiate<n>[:IMMediate] on page 86
Continue Single Sweep
After triggering, repeats the number of sweeps set in "Sweep Count", without deleting
the trace of the last measurement.
While the measurement is running, the "Continue Single Sweep" softkey and the [RUN
SINGLE] key are highlighted. The running measurement can be aborted by selecting
the highlighted softkey or key again.
Remote command:
INITiate<n>:CONMeas on page 85
5.8 Display configuration
Access: "Overview" > "Display Config"
The captured signal can be displayed using various evaluation methods. All evaluation
methods available for the current application are displayed in the evaluation bar in
SmartGrid mode.
For a description of the available evaluation methods see Chapter 3, "Measurement
and result displays", on page 15.
Up to 6 evaluations can be displayed in the I/Q Analyzer at any time, including several
graphical diagrams, marker tables or peak lists.
The selected evaluation method not only affects the result display in a window, but also
the results of the trace data query in remote control (see TRACe<n>[:DATA]?
on page 96).
5.9 Adjusting settings automatically
Access: [AUTO SET]
62User Manual 1179.0139.02 ─ 02
Page 63

R&S®FSMR3-B1
Configuration
Adjusting settings automatically
Some settings can be adjusted by the R&S FSMR3 automatically according to the current measurement settings. To do so, a measurement is performed. You can configure
this measurement.
Adjusting settings automatically during triggered measurements
When you select an auto adjust function, a measurement is performed to determine
the optimal settings. If you select an auto adjust function for a triggered measurement,
you are asked how you want the R&S FSMR3 to behave:
●
(default:) The measurement for adjustment waits for the next trigger
●
The measurement for adjustment is performed without waiting for a trigger.
The trigger source is temporarily set to "Free Run". After the measurement is completed, the original trigger source is restored. The trigger level is adjusted as follows:
– For IF Power and RF Power triggers:
Trigger Level = Reference Level - 15 dB
– For Video trigger:
Trigger Level = 85 %
Remote command:
[SENSe:]ADJust:CONFigure:TRIGger on page 134
Adjusting all Determinable Settings Automatically (Auto All)........................................ 63
Adjusting the Center Frequency Automatically (Auto Frequency)................................ 63
Setting the Reference Level Automatically (Auto Level)...............................................64
Resetting the Automatic Measurement Time (Meastime Auto).....................................64
Changing the Automatic Measurement Time (Meastime Manual)................................ 64
Upper Level Hysteresis.................................................................................................64
Lower Level Hysteresis.................................................................................................64
Adjusting all Determinable Settings Automatically (Auto All)
Activates all automatic adjustment functions for the current measurement settings,
including:
●
Auto Frequency
●
Auto Level
Remote command:
[SENSe:]ADJust:ALL on page 132
Adjusting the Center Frequency Automatically (Auto Frequency)
The R&S FSMR3000 adjusts the center frequency automatically.
The optimum center frequency is the frequency with the highest S/N ratio in the fre-
quency span. As this function uses the signal counter, it is intended for use with sinusoidal signals.
Remote command:
[SENSe:]ADJust:FREQuency on page 135
63User Manual 1179.0139.02 ─ 02
Page 64

R&S®FSMR3-B1
Configuration
Adjusting settings automatically
Setting the Reference Level Automatically (Auto Level)
Automatically determines a reference level which ensures that no overload occurs at
the R&S FSMR3000 for the current input data. At the same time, the internal attenuators are adjusted. As a result, the signal-to-noise ratio is optimized, while signal compression and clipping are minimized.
To determine the required reference level, a level measurement is performed on the
R&S FSMR3000.
If necessary, you can optimize the reference level further. Decrease the attenuation
level manually to the lowest possible value before an overload occurs, then decrease
the reference level in the same way.
You can change the measurement time for the level measurement if necessary (see
"Changing the Automatic Measurement Time (Meastime Manual)" on page 64).
Remote command:
[SENSe:]ADJust:LEVel on page 135
Resetting the Automatic Measurement Time (Meastime Auto)
Resets the measurement duration for automatic settings to the default value.
Remote command:
[SENSe:]ADJust:CONFigure:LEVel:DURation:MODE on page 133
Changing the Automatic Measurement Time (Meastime Manual)
This function allows you to change the measurement duration for automatic setting
adjustments. Enter the value in seconds.
Note: The maximum measurement duration depends on the currently selected measurement and the installed (optional) hardware. Thus, the measurement duration
actually used to determine the automatic settings can be shorter than the value you
define here.
Remote command:
[SENSe:]ADJust:CONFigure:LEVel:DURation:MODE on page 133
[SENSe:]ADJust:CONFigure:LEVel:DURation on page 133
Upper Level Hysteresis
When the reference level is adjusted automatically using the Auto Level function, the
internal attenuators and the preamplifier are also adjusted. To avoid frequent adaptation due to small changes in the input signal, you can define a hysteresis. This setting
defines an upper threshold the signal must exceed (compared to the last measurement) before the reference level is adapted automatically.
Remote command:
[SENSe:]ADJust:CONFigure:HYSTeresis:UPPer on page 134
Lower Level Hysteresis
When the reference level is adjusted automatically using the Auto Level function, the
internal attenuators and the preamplifier are also adjusted. To avoid frequent adaptation due to small changes in the input signal, you can define a hysteresis. This setting
defines a lower threshold the signal must fall below (compared to the last measurement) before the reference level is adapted automatically.
64User Manual 1179.0139.02 ─ 02
Page 65

R&S®FSMR3-B1
Configuration
Adjusting settings automatically
Remote command:
[SENSe:]ADJust:CONFigure:HYSTeresis:LOWer on page 134
65User Manual 1179.0139.02 ─ 02
Page 66

R&S®FSMR3-B1
6 Analysis
6.1 Trace configuration
Analysis
Trace configuration
General result analysis settings concerning the trace, markers, lines etc. can be configured via the "Analysis" button in the "Overview". They are similar to the analysis functions in the Spectrum application, except for the features described here.
For more information, please refer to the R&S FSMR3 User Manual.
● Trace configuration................................................................................................. 66
● Marker settings........................................................................................................67
● Display lines and limit lines..................................................................................... 67
Access
●
"Overview" > "Analysis" > "Trace"
For more information, refer to the R&S FSMR3 user manual.
Spectrograms in the I/Q analyzer
Basically, spectrograms work the same as in the spectrum application (including the
3D spectrogram).
However, in the I/Q analyzer, they have the following distinctive features.
●
Not all result displays support spectrograms.
●
Compared to the spectrum application, a spectrogram can not be added as an
independent result display. Instead, spectrograms relate to a certain measurement
window (or result display). Result diagram and spectrogram are a single entity in
that case and can not be divided.
●
You can assign a specific trace to the spectrogram.
To view results in a spectrogram, select a window (indicated by a blue frame), then
select [TRACE] > "Spectrogram Config".
Spectrograms are either displayed in "Split" mode (spectrogram is displayed below the
trace diagram), in "Full" mode (trace diagram is not displayed), or not displayed at all
("Off)".
When the "Spectrogram Config" softkey is greyed out, spectrograms are not supported
by the selected result display.
State..............................................................................................................................66
Trace.............................................................................................................................67
State
Activates and deactivates a Spectrogram subwindow.
"Split"
Displays the Spectrogram as a subwindow in the original result display.
66User Manual 1179.0139.02 ─ 02
Page 67

R&S®FSMR3-B1
Analysis
Display lines and limit lines
"Full"
"Off"
Remote command:
CALCulate<n>:SPECtrogram:LAYout on page 143
Trace
Selects the diagram trace on which the spectrogram is based.
Remote command:
CALCulate<n>:SGRam:TRACe on page 143
Displays the Spectrogram in a subwindow in the full size of the original result display.
Closes the Spectrogram subwindow.
6.2 Marker settings
Access
●
"Overview" > "Analysis" > "Marker"
●
"Overview" > "Analysis" > "Marker Function"
For more information, refer to the R&S FSMR3 user manual.
Branch for Peaksearch..................................................................................................67
Branch for Peaksearch
Defines which data is used for marker search functions in I/Q data.
This function is only available for the display configuration "Real/Imag (I/Q)" (see "Real/
Imag (I/Q)" on page 17).
Note: The search settings apply to all markers, not only the currently selected one.
"Real"
Marker search functions are performed on the real trace of the I/Q
measurement.
"Imag"
Marker search functions are performed on the imaginary trace of the
I/Q measurement.
"Magnitude"
Marker search functions are performed on the magnitude of the I and
Q data.
Remote command:
CALCulate<n>:MARKer<m>:SEARch on page 142
6.3 Display lines and limit lines
Access (limit lines): "Overview" > "Analysis" > "Lines" > "Limit Lines"
Access (display lines): "Overview" > "Analysis" > "Lines" > "Display Lines"
67User Manual 1179.0139.02 ─ 02
Page 68

R&S®FSMR3-B1
Analysis
Display lines and limit lines
For more information, refer to the R&S FSMR3 user manual.
68User Manual 1179.0139.02 ─ 02
Page 69

R&S®FSMR3-B1
7 How to work with I/Q data
7.1 How to perform measurements in the I/Q Analyzer
How to work with I/Q data
How to perform measurements in the I/Q Analyzer application
The following step-by-step procedures demonstrate in detail how to perform various
tasks when working with I/Q data.
● How to perform measurements in the I/Q Analyzer application..............................69
● How to export and import I/Q data.......................................................................... 70
application
The following step-by-step instructions demonstrate how to capture I/Q data on the
R&S FSMR3 and how to analyze data in the I/Q Analyzer application.
● How to capture baseband (I/Q) data as RF input....................................................69
● How to analyze data in the I/Q Analyzer.................................................................70
7.1.1 How to capture baseband (I/Q) data as RF input
By default, the I/Q Analyzer assumes the I/Q data is modulated on a carrier frequency
and input via the "RF Input" connector on the R&S FSMR3.
1. Select the [MODE] key and select the "I/Q Analyzer" application.
2. Select the "Overview" softkey to display the "Overview" for an I/Q Analyzer measurement.
3. Select the "Input" button to select and configure the "RF Input" signal source.
4. Select the "Amplitude" button to define the attenuation, reference level or other settings that affect the input signal's amplitude and scaling.
5. Select the "Frequency" button to define the input signal's center frequency.
6. Optionally, select the "Trigger" button and define a trigger for data acquisition, for
example an I/Q Power trigger to start capturing data only when a specific power is
exceeded.
7. Select the "Bandwidth" button and define the bandwidth parameters for data acquisition:
● "Sample Rate" or "Analysis Bandwidth" the span of the input signal to be cap-
tured for analysis, or the rate at which samples are captured (both values are
correlated)
● "Measurement Time" how long the data is to be captured
● "Record Length": the number of samples to be captured (also defined by sam-
ple rate and measurement time)
69User Manual 1179.0139.02 ─ 02
Page 70

R&S®FSMR3-B1
7.1.2 How to analyze data in the I/Q Analyzer
How to work with I/Q data
How to export and import I/Q data
8. Select the "Display Config" button and select up to six displays that are of interest
to you.
Arrange them on the display to suit your preferences.
9. Exit the SmartGrid mode.
10. Start a new sweep with the defined settings.
a)
Select the Sequencer icon (
b) Set the Sequencer state to "Off".
c) Select the [RUN SINGLE] key.
1. Select the [MODE] key and select the "I/Q Analyzer" application.
2. Select the "Overview" softkey to display the "Overview" for an I/Q Analyzer measurement.
) from the toolbar.
3. Select the "Display Config" button and select up to six displays that are of interest
to you.
Arrange them on the display to suit your preferences.
4. Exit the SmartGrid mode and select the "Overview" softkey to display the "Overview" again.
5. Select the "Analysis" button in the "Overview" to make use of the advanced analysis functions in the displays.
● Configure a trace to display the average over a series of sweeps (on the
"Trace" tab; if necessary, increase the "Average Count").
● Configure markers and delta markers to determine deviations and offsets within
the signal (on the "Marker" tab).
7.2 How to export and import I/Q data
I/Q data can only be exported in applications that process I/Q data, such as the I/Q
Analyzer or optional applications.
Capturing and exporting I/Q data
1. Press the [PRESET] key.
2. Press the [MODE] key and select the IQ Analyzer or any other application that supports I/Q data.
3. Configure the data acquisition.
70User Manual 1179.0139.02 ─ 02
Page 71

R&S®FSMR3-B1
How to work with I/Q data
How to export and import I/Q data
4. Press the [RUN SINGLE] key to perform a single sweep measurement.
5.
Select the "Save" icon in the toolbar.
6. Select the "I/Q Export" softkey.
7. In the file selection dialog box, select a storage location and enter a file name.
8. Select "Save".
The captured data is stored to a file with the extension .iq.tar.
Importing I/Q data
1. Press the [MODE] key and select the "I/Q Analyzer" or any other application that
supports I/Q data.
2. If necessary, switch to single sweep mode by pressing the [RUN SINGLE] key.
3.
Select the
4. Select the "I/Q Import" softkey.
"Open" icon in the toolbar.
5. Select the storage location and the file name with the .iq.tar file extension.
6. Select "Open".
The stored data is loaded from the file and displayed in the current application.
Previewing the I/Q data in a web browser
The iq-tar file format allows you to preview the I/Q data in a web browser.
1. Use an archive tool (e.g. WinZip® or PowerArchiver®) to unpack the iq-tar file
into a folder.
2. Locate the folder using Windows Explorer.
3. Open your web browser.
71User Manual 1179.0139.02 ─ 02
Page 72

R&S®FSMR3-B1
How to work with I/Q data
How to export and import I/Q data
4. Drag the I/Q parameter XML file, e.g. example.xml, into your web browser.
72User Manual 1179.0139.02 ─ 02
Page 73

R&S®FSMR3-B1
8 Remote commands for the I/Q analyzer
Remote commands for the I/Q analyzer
Introduction
The following commands are specific to performing measurements in the I/Q Analyzer
application in a remote environment. The R&S FSMR3 must already be set up for
remote operation in a network as described in the R&S FSMR3 user manual.
● Introduction............................................................................................................. 73
● Common suffixes.................................................................................................... 78
● Activating I/Q analyzer measurements................................................................... 78
● Performing measurements......................................................................................83
● Retrieving results.................................................................................................... 90
● Configuring I/Q analyzer measurements...............................................................101
● Analyzing results...................................................................................................142
● Importing and exporting I/Q data...........................................................................143
● Querying the status registers................................................................................ 145
● Programming examples........................................................................................ 145
8.1 Introduction
Commands are program messages that a controller (e.g. a PC) sends to the instrument or software. They operate its functions ('setting commands' or 'events') and
request information ('query commands'). Some commands can only be used in one
way, others work in two ways (setting and query). If not indicated otherwise, the commands can be used for settings and queries.
The syntax of a SCPI command consists of a header and, usually, one or more parameters. To use a command as a query, you have to append a question mark after the
last header element, even if the command contains a parameter.
A header contains one or more keywords, separated by a colon. Header and parameters are separated by a "white space" (ASCII code 0 to 9, 11 to 32 decimal, e.g. blank).
If there is more than one parameter for a command, they are separated by a comma
from one another.
Only the most important characteristics that you need to know when working with SCPI
commands are described here. For a more complete description, refer to the user
manual of the R&S FSMR3.
Remote command examples
Note that some remote command examples mentioned in this general introduction are
possibly not supported by this particular application.
8.1.1 Conventions used in descriptions
The following conventions are used in the remote command descriptions:
●
Command usage
73User Manual 1179.0139.02 ─ 02
Page 74

R&S®FSMR3-B1
Remote commands for the I/Q analyzer
Introduction
If not specified otherwise, commands can be used both for setting and for querying
parameters.
If a command can be used for setting or querying only, or if it initiates an event, the
usage is stated explicitly.
●
Parameter usage
If not specified otherwise, a parameter can be used to set a value and it is the
result of a query.
Parameters required only for setting are indicated as Setting parameters.
Parameters required only to refine a query are indicated as Query parameters.
Parameters that are only returned as the result of a query are indicated as Return
values.
●
Conformity
Commands that are taken from the SCPI standard are indicated as SCPI confirmed. All commands used by the R&S FSMR3 follow the SCPI syntax rules.
●
Asynchronous commands
A command which does not automatically finish executing before the next command starts executing (overlapping command) is indicated as an Asynchronous
command.
●
Reset values (*RST)
Default parameter values that are used directly after resetting the instrument (*RST
command) are indicated as *RST values, if available.
●
Default unit
The default unit is used for numeric values if no other unit is provided with the
parameter.
●
Manual operation
If the result of a remote command can also be achieved in manual operation, a link
to the description is inserted.
8.1.2 Long and short form
The keywords have a long and a short form. You can use either the long or the short
form, but no other abbreviations of the keywords.
The short form is emphasized in uppercase letters. Note however, that this emphasis
only serves the purpose to distinguish the short from the long form in the manual. For
the instrument, the case does not matter.
Example:
SENSe:FREQuency:CENTer is the same as SENS:FREQ:CENT.
8.1.3 Numeric suffixes
Some keywords have a numeric suffix if the command can be applied to multiple
instances of an object. In that case, the suffix selects a particular instance (e.g. a measurement window).
Numeric suffixes are indicated by angular brackets (<n>) next to the keyword.
74User Manual 1179.0139.02 ─ 02
Page 75

R&S®FSMR3-B1
8.1.4 Optional keywords
Remote commands for the I/Q analyzer
Introduction
If you do not quote a suffix for keywords that support one, a 1 is assumed.
Example:
DISPlay[:WINDow<1...4>]:ZOOM:STATe enables the zoom in a particular measurement window, selected by the suffix at WINDow.
DISPlay:WINDow4:ZOOM:STATe ON refers to window 4.
Some keywords are optional and are only part of the syntax because of SCPI compliance. You can include them in the header or not.
If an optional keyword has a numeric suffix and you need to use the suffix, you have to
include the optional keyword. Otherwise, the suffix of the missing keyword is assumed
to be the value 1.
Optional keywords are emphasized with square brackets.
Example:
Without a numeric suffix in the optional keyword:
[SENSe:]FREQuency:CENTer is the same as FREQuency:CENTer
With a numeric suffix in the optional keyword:
DISPlay[:WINDow<1...4>]:ZOOM:STATe
DISPlay:ZOOM:STATe ON enables the zoom in window 1 (no suffix).
DISPlay:WINDow4:ZOOM:STATe ON enables the zoom in window 4.
8.1.5 Alternative keywords
A vertical stroke indicates alternatives for a specific keyword. You can use both keywords to the same effect.
Example:
[SENSe:]BANDwidth|BWIDth[:RESolution]
In the short form without optional keywords, BAND 1MHZ would have the same effect
as BWID 1MHZ.
8.1.6 SCPI parameters
Many commands feature one or more parameters.
If a command supports more than one parameter, they are separated by a comma.
75User Manual 1179.0139.02 ─ 02
Page 76

R&S®FSMR3-B1
8.1.6.1 Numeric values
Remote commands for the I/Q analyzer
Introduction
Example:
LAYout:ADD:WINDow Spectrum,LEFT,MTABle
Parameters can have different forms of values.
● Numeric values....................................................................................................... 76
● Boolean...................................................................................................................77
● Character data........................................................................................................ 77
● Character strings.....................................................................................................77
● Block data............................................................................................................... 77
Numeric values can be entered in any form, i.e. with sign, decimal point or exponent.
For physical quantities, you can also add the unit. If the unit is missing, the command
uses the basic unit.
Example:
With unit: SENSe:FREQuency:CENTer 1GHZ
Without unit: SENSe:FREQuency:CENTer 1E9 would also set a frequency of 1 GHz.
Values exceeding the resolution of the instrument are rounded up or down.
If the number you have entered is not supported (e.g. for discrete steps), the command
returns an error.
Instead of a number, you can also set numeric values with a text parameter in special
cases.
●
MIN/MAX
Defines the minimum or maximum numeric value that is supported.
●
DEF
Defines the default value.
●
UP/DOWN
Increases or decreases the numeric value by one step. The step size depends on
the setting. Sometimes, you can customize the step size with a corresponding
command.
Querying numeric values
When you query numeric values, the system returns a number. For physical quantities,
it applies the basic unit (e.g. Hz for frequencies). The number of digits after the decimal
point depends on the type of numeric value.
Example:
Setting: SENSe:FREQuency:CENTer 1GHZ
Query: SENSe:FREQuency:CENTer? would return 1E9
Sometimes, numeric values are returned as text.
76User Manual 1179.0139.02 ─ 02
Page 77

R&S®FSMR3-B1
8.1.6.2 Boolean
Remote commands for the I/Q analyzer
Introduction
●
INF/NINF
Infinity or negative infinity. Represents the numeric values 9.9E37 or -9.9E37.
●
NAN
Not a number. Represents the numeric value 9.91E37. NAN is returned if errors
occur.
Boolean parameters represent two states. The "on" state (logically true) is represented
by "ON" or the numeric value 1. The "off" state (logically untrue) is represented by
"OFF" or the numeric value 0.
Querying Boolean parameters
When you query Boolean parameters, the system returns either the value 1 ("ON") or
the value 0 ("OFF").
Example:
Setting: DISPlay:WINDow:ZOOM:STATe ON
Query: DISPlay:WINDow:ZOOM:STATe? would return 1
8.1.6.3 Character data
Character data follows the syntactic rules of keywords. You can enter text using a short
or a long form. For more information, see Chapter 8.1.2, "Long and short form",
on page 74.
Querying text parameters
When you query text parameters, the system returns its short form.
Example:
Setting: SENSe:BANDwidth:RESolution:TYPE NORMal
Query: SENSe:BANDwidth:RESolution:TYPE? would return NORM
8.1.6.4 Character strings
Strings are alphanumeric characters. They have to be in straight quotation marks. You
can use a single quotation mark ( ' ) or a double quotation mark ( " ).
Example:
INSTRument:DELete 'Spectrum'
8.1.6.5 Block data
Block data is a format which is suitable for the transmission of large amounts of data.
77User Manual 1179.0139.02 ─ 02
Page 78

R&S®FSMR3-B1
8.2 Common suffixes
Remote commands for the I/Q analyzer
Activating I/Q analyzer measurements
The ASCII character # introduces the data block. The next number indicates how many
of the following digits describe the length of the data block. The data bytes follow. During the transmission of these data bytes, all end or other control signs are ignored until
all bytes are transmitted. #0 specifies a data block of indefinite length. The use of the
indefinite format requires an NL^END message to terminate the data block. This format
is useful when the length of the transmission is not known or if speed or other considerations prevent segmentation of the data into blocks of definite length.
In the IQ Analyzer, the following common suffixes are used in remote commands:
Table 8-1: Common suffixes used in remote commands in the IQ Analyzer
Suffix Value range Description
<m> 1 to 16 Marker
<n> 1 to 16 Window (in the currently selected channel)
<t> 1 to 6 Trace
<li> 1 to 8 Limit line
8.3 Activating I/Q analyzer measurements
I/Q Analyzer measurements require a special measurement channel on the
R&S FSMR3. It can be activated using the common INSTrument:CREate[:NEW] or
INSTrument:CREate:REPLace commands. In this case, some - but not all - param-
eters from the previously selected application are passed on to the I/Q Analyzer channel. In order to retain all relevant parameters from the current application for the I/Q
measurement, use the TRACe:IQ[:STATe] command to change the application of
the current channel.
A measurement is started immediately with the default settings when the channel is
activated.
Different remote modes available
In remote control, two different modes for the I/Q Analyzer measurements are available:
●
A quick mode for pure data acquisition
This mode is activated by default with the TRACe:IQ[:STATe] command. The
evaluation functions are not available; however, performance is slightly improved.
●
A more sophisticated mode for acquisition and analysis.
This mode is activated when a new channel is opened for the I/Q Analyzer application (INST:CRE:NEW/ INST:CRE:REPL) or by an additional command (see
TRACe:IQ:EVAL on page 82).
78User Manual 1179.0139.02 ─ 02
Page 79

R&S®FSMR3-B1
Remote commands for the I/Q analyzer
Activating I/Q analyzer measurements
INSTrument:CREate:DUPLicate........................................................................................ 79
INSTrument:CREate[:NEW].............................................................................................. 79
INSTrument:CREate:REPLace..........................................................................................79
INSTrument:DELete......................................................................................................... 80
INSTrument:LIST?........................................................................................................... 80
INSTrument:REName.......................................................................................................81
INSTrument[:SELect]........................................................................................................81
SYSTem:PRESet:CHANnel[:EXEC]................................................................................... 82
TRACe:IQ:EVAL.............................................................................................................. 82
TRACe:IQ[:STATe]........................................................................................................... 83
INSTrument:CREate:DUPLicate
This command duplicates the currently selected channel, i.e creates a new channel of
the same type and with the identical measurement settings. The name of the new
channel is the same as the copied channel, extended by a consecutive number (e.g.
"IQAnalyzer" -> "IQAnalyzer 2").
The channel to be duplicated must be selected first using the INST:SEL command.
Example:
INST:SEL 'Measuring Receiver'
INST:CRE:DUPL
Duplicates the channel named 'Measuring Receiver' and creates
a new channel named 'Measuring Receiver 2'.
Usage: Event
INSTrument:CREate[:NEW] <ChannelType>, <ChannelName>
This command adds a measurement channel. You can configure up to 10 measurement channels at the same time (depending on available memory).
Parameters:
<ChannelType> Channel type of the new channel.
For a list of available channel types, see INSTrument:LIST?
on page 80.
<ChannelName> String containing the name of the channel.
Note that you cannot assign an existing channel name to a new
channel. If you do, an error occurs.
Example:
INST:CRE SAN, 'Spectrum 2'
Adds a spectrum display named "Spectrum 2".
INSTrument:CREate:REPLace <ChannelName1>,<ChannelType>,<ChannelName2>
This command replaces a channel with another one.
Setting parameters:
<ChannelName1> String containing the name of the channel you want to replace.
79User Manual 1179.0139.02 ─ 02
Page 80

R&S®FSMR3-B1
Remote commands for the I/Q analyzer
Activating I/Q analyzer measurements
<ChannelType> Channel type of the new channel.
For a list of available channel types, see INSTrument:LIST?
on page 80.
<ChannelName2> String containing the name of the new channel.
Note: If the specified name for a new channel already exists, the
default name, extended by a sequential number, is used for the
new channel (see INSTrument:LIST? on page 80).
Channel names can have a maximum of 31 characters, and
must be compatible with the Windows conventions for file
names. In particular, they must not contain special characters
such as ":", "*", "?".
Example:
Usage: Setting only
INSTrument:DELete <ChannelName>
This command deletes a channel.
If you delete the last channel, the default Measuring Receiver channel is activated.
Setting parameters:
<ChannelName> String containing the name of the channel you want to delete.
Example:
Usage: Setting only
INSTrument:LIST?
INST:CRE:REPL 'Measuring Receiver
2',MREC,'Measuring Receiver 3'
Replaces the channel named "Measuring Receiver 2" by a new
channel of type "Measuring Receiver" named "Measuring
Receiver 3".
A channel must exist to delete it.
INST:DEL 'Measuring Receiver 2'
Deletes the channel with the name 'Measuring Receiver 2'.
This command queries all active channels. The query is useful to obtain the names of
the existing channels, which are required to replace or delete the channels.
Return values:
<ChannelType>,
<ChannelName>
Example:
Usage: Query only
For each channel, the command returns the channel type and
channel name (see tables below).
Tip: to change the channel name, use the INSTrument:
REName command.
INST:LIST?
Result for 2 channels:
'MREC','Measuring Receiver','MREC','Measuring
Receiver 2'
80User Manual 1179.0139.02 ─ 02
Page 81

R&S®FSMR3-B1
Remote commands for the I/Q analyzer
Activating I/Q analyzer measurements
Table 8-2: Available channel types and default channel names
Application <ChannelType> Parameter Default Channel Name*)
Measuring Receiver MRECeiver Measuring Receiver
Spectrum (R&S FSMR3B1)
I/Q Analyzer (R&S FSMR3B1)
Phase Noise
(R&S FSMR3-B60)
Pulse (R&S FSMR3-K6) PULSE Pulse
Avionics (R&S FSMR3K15)
Vector Signal Analysis
(VSA, R&S FSMR3-K70)
Note: the default channel name is also listed in the table. If the specified name for a new channel already
exists, the default name, extended by a sequential number, is used for the new channel.
SANalyzer Spectrum
IQ IQ Analyzer
PNOise Phase Noise
AVIonics Avionics
DDEM VSA
INSTrument:REName <ChannelName1>, <ChannelName2>
This command renames a channel.
Setting parameters:
<ChannelName1> String containing the name of the channel you want to rename.
<ChannelName2> String containing the new channel name.
Note that you cannot assign an existing channel name to a new
channel. If you do, an error occurs.
Channel names can have a maximum of 31 characters, and
must be compatible with the Windows conventions for file
names. In particular, they must not contain special characters
such as ":", "*", "?".
Example:
INST:REN 'Measuring Receiver 2','Measuring
Receiver 3'
Renames the channel with the name 'Measuring Receiver 2' to
'Measuring Receiver 3'.
Usage: Setting only
INSTrument[:SELect] <ChannelType> | <ChannelName>
This command activates a new channel with the defined channel type, or selects an
existing channel with the specified name.
Also see
●
INSTrument:CREate[:NEW] on page 79
81User Manual 1179.0139.02 ─ 02
Page 82

R&S®FSMR3-B1
Remote commands for the I/Q analyzer
Activating I/Q analyzer measurements
Parameters:
<ChannelType> Channel type of the new channel.
For a list of available channel types see INSTrument:LIST?
on page 80.
<ChannelName> String containing the name of the channel.
Example:
SYSTem:PRESet:CHANnel[:EXEC]
This command restores the default instrument settings in the current channel.
Use INST:SEL to select the channel.
Example:
Usage: Event
Manual operation: See "Preset Channel" on page 34
TRACe:IQ:EVAL <State>
INST IQ
Activates a channel for the I/Q Analyzer application (evaluation
mode).
INST 'MyIQSpectrum'
Selects the channel named 'MyIQSpectrum' (for example before
executing further commands for that channel).
INST:SEL 'Spectrum2'
Selects the channel for "Spectrum2".
SYST:PRES:CHAN:EXEC
Restores the factory default settings to the "Spectrum2" channel.
This command turns I/Q data analysis on and off.
Before you can use this command, you have to turn on the I/Q data acquisition using
INST:CRE:NEW IQ or INST:CRE:REPL, or using the TRACe:IQ[:STATe] command to replace the current channel while retaining the settings.
Parameters:
<State> ON | OFF | 0 | 1
OFF | 0
Switches the function off
ON | 1
Switches the function on
Example:
TRAC:IQ ON
Enables I/Q data acquisition
TRAC:IQ:EVAL ON
Enables the I/Q data analysis mode.
82User Manual 1179.0139.02 ─ 02
Page 83

R&S®FSMR3-B1
Remote commands for the I/Q analyzer
Performing measurements
TRACe:IQ[:STATe] <State>
This command activates the simple I/Q data acquisition mode (see Chapter 8.3, "Acti-
vating I/Q analyzer measurements", on page 78).
Executing this command also has the following effects:
●
The sweep, amplitude, input and trigger settings from the measurement are
retained.
●
All measurements are turned off.
●
All traces are set to "Blank" mode.
●
The I/Q data analysis mode is turned off (TRAC:IQ:EVAL OFF).
Note: To turn trace display back on or to enable the evaluation functions of the I/Q
Analyzer, execute the TRAC:IQ:EVAL ON command (see TRACe:IQ:EVAL
on page 82).
Parameters:
<State> ON | OFF | 0 | 1
OFF | 0
Switches the function off
ON | 1
Switches the function on
Example:
TRAC:IQ ON
Switches on I/Q data acquisition
8.4 Performing measurements
Different measurement procedures
Two different procedures to capture I/Q data remotely are available:
●
Measurement and result query with one command (see TRACe:IQ:DATA?
on page 91)
This method causes the least delay between measurement and output of the result
data, but it requires the control computer to wait actively for the response data.
●
Setting up the instrument, starting the measurement via INIT and querying the
result list at the end of the measurement (see TRACe:IQ:DATA:MEMory?
on page 92)
With this method, the control computer can be used for other activities during the
measurement. However, the additional time needed for synchronization via service
request must be taken into account.
ABORt............................................................................................................................ 84
INITiate<n>:CONMeas..................................................................................................... 85
INITiate<n>:CONTinuous..................................................................................................85
INITiate<n>[:IMMediate]....................................................................................................86
83User Manual 1179.0139.02 ─ 02
Page 84

R&S®FSMR3-B1
Remote commands for the I/Q analyzer
Performing measurements
INITiate:SEQuencer:ABORt.............................................................................................. 86
INITiate:SEQuencer:IMMediate......................................................................................... 86
INITiate:SEQuencer:MODE...............................................................................................87
[SENSe:]AVERage:COUNt................................................................................................87
TRACe:IQ:AVERage:COUNt............................................................................................. 87
[SENSe:]AVERage<n>[:STATe<t>].....................................................................................88
TRACe:IQ:AVERage[:STATe]............................................................................................ 88
[SENSe:]SWEep:COUNt...................................................................................................88
[SENSe:]SWEep:COUNt:CURRent?..................................................................................88
[SENSe:]SWEep[:WINDow<n>]:POINts..............................................................................89
[SENSe:]SWEep:TIME..................................................................................................... 89
SYSTem:SEQuencer........................................................................................................89
ABORt
This command aborts the measurement in the current channel and resets the trigger
system.
To prevent overlapping execution of the subsequent command before the measurement has been aborted successfully, use the *OPC? or *WAI command after ABOR and
before the next command.
For details on overlapping execution see Remote control via SCPI.
Note on blocked remote control programs:
If a sequential command cannot be completed, for example because a triggered sweep
never receives a trigger, the remote control program will never finish and the remote
channel to the R&S FSMR3000 is blocked for further commands. In this case, you
must interrupt processing on the remote channel first in order to abort the measurement.
To do so, send a "Device Clear" command from the control instrument to the
R&S FSMR3000 on a parallel channel to clear all currently active remote channels.
Depending on the used interface and protocol, send the following commands:
●
Visa: viClear()
●
GPIB: ibclr()
●
RSIB: RSDLLibclr()
Now you can send the ABORt command on the remote channel performing the measurement.
Example:
ABOR;:INIT:IMM
Aborts the current measurement and immediately starts a new
one.
Example:
ABOR;*WAI
INIT:IMM
Aborts the current measurement and starts a new one once
abortion has been completed.
Usage: Event
84User Manual 1179.0139.02 ─ 02
Page 85

R&S®FSMR3-B1
Remote commands for the I/Q analyzer
Performing measurements
INITiate<n>:CONMeas
This command restarts a (single) measurement that has been stopped (using ABORt)
or finished in single sweep mode.
The measurement is restarted at the beginning, not where the previous measurement
was stopped.
As opposed to INITiate<n>[:IMMediate], this command does not reset traces in
maxhold, minhold or average mode. Therefore it can be used to continue measurements using maxhold or averaging functions.
Suffix:
<n>
Example:
Manual operation:
INITiate<n>:CONTinuous <State>
This command controls the sweep mode for an individual channel.
Note that in single sweep mode, you can synchronize to the end of the measurement
with *OPC, *OPC? or *WAI. In continuous sweep mode, synchronization to the end of
the measurement is not possible. Thus, it is not recommended that you use continuous
sweep mode in remote control, as results like trace data or markers are only valid after
a single sweep end synchronization.
.
irrelevant
INIT:CONT OFF
Switches to single sweep mode.
DISP:WIND:TRAC:MODE AVER
Switches on trace averaging.
SWE:COUN 20
Setting the sweep counter to 20 sweeps.
INIT;*WAI
Starts the measurement and waits for the end of the 20 sweeps.
INIT:CONM;*WAI
Continues the measurement (next 20 sweeps) and waits for the
end.
Result: Averaging is performed over 40 sweeps.
See "Continue Single Sweep" on page 62
For details on synchronization see Remote control via SCPI.
Suffix:
<n>
Parameters:
<State> ON | OFF | 0 | 1
.
irrelevant
ON | 1
Continuous sweep
OFF | 0
Single sweep
*RST: 1
85User Manual 1179.0139.02 ─ 02
Page 86

R&S®FSMR3-B1
Remote commands for the I/Q analyzer
Performing measurements
Example:
Manual operation: See "Continuous Sweep / Run Cont" on page 61
INITiate<n>[:IMMediate]
This command starts a (single) new measurement.
With sweep count or average count > 0, this means a restart of the corresponding
number of measurements. With trace mode MAXHold, MINHold and AVERage, the
previous results are reset on restarting the measurement.
You can synchronize to the end of the measurement with *OPC, *OPC? or *WAI.
For details on synchronization see Remote control via SCPI.
Suffix:
<n>
Example:
INIT:CONT OFF
Switches the sweep mode to single sweep.
INIT:CONT ON
Switches the sweep mode to continuous sweep.
.
irrelevant
INIT:CONT OFF
Switches to single sweep mode.
DISP:WIND:TRAC:MODE AVER
Switches on trace averaging.
SWE:COUN 20
Sets the sweep counter to 20 sweeps.
INIT;*WAI
Starts the measurement and waits for the end of the 20 sweeps.
Manual operation: See "Single Sweep / Run Single" on page 61
INITiate:SEQuencer:ABORt
This command stops the currently active sequence of measurements.
You can start a new sequence any time using INITiate:SEQuencer:IMMediate
on page 86.
Usage:
INITiate:SEQuencer:IMMediate
This command starts a new sequence of measurements by the Sequencer.
Its effect is similar to the INITiate<n>[:IMMediate] command used for a single
measurement.
Before this command can be executed, the Sequencer must be activated (see
SYSTem:SEQuencer on page 89).
Event
86User Manual 1179.0139.02 ─ 02
Page 87

R&S®FSMR3-B1
Remote commands for the I/Q analyzer
Performing measurements
Example:
INITiate:SEQuencer:MODE <Mode>
Defines the capture mode for the entire measurement sequence and all measurement
groups and channels it contains.
Note: To synchronize to the end of a measurement sequence using *OPC, *OPC? or
*WAI, use SINGle Sequencer mode.
Parameters:
<Mode> SINGle
SYST:SEQ ON
Activates the Sequencer.
INIT:SEQ:MODE SING
Sets single sequence mode so each active measurement is performed once.
INIT:SEQ:IMM
Starts the sequential measurements.
Each measurement group is started one after the other in the
order of definition. All measurement channels in a group are
started simultaneously and performed once. After all measurements are completed, the next group is started. After the last
group, the measurement sequence is finished.
CONTinuous
Each measurement group is started one after the other in the
order of definition. All measurement channels in a group are
started simultaneously and performed once. After all measurements are completed, the next group is started. After the last
group, the measurement sequence restarts with the first one and
continues until it is stopped explicitly.
*RST:
CONTinuous
[SENSe:]AVERage:COUNt <AverageCount>
TRACe:IQ:AVERage:COUNt <NumberSets>
This command defines the number of I/Q data sets that the averaging is based on.
Parameters:
<NumberSets> Range: 0 to 32767
*RST: 0
Example:
TRAC:IQ ON
Switches on acquisition of I/Q data.
TRAC:IQ:AVER ON
Enables averaging of the I/Q measurement data
TRAC:IQ:AVER:COUN 10
Selects averaging over 10 data sets
TRAC:IQ:DATA?
Starts the measurement and reads out the averaged data.
87User Manual 1179.0139.02 ─ 02
Page 88

R&S®FSMR3-B1
Remote commands for the I/Q analyzer
Performing measurements
[SENSe:]AVERage<n>[:STATe<t>] <State>
TRACe:IQ:AVERage[:STATe] <State>
This command turns averaging of the I/Q data on and off.
Before you can use the command you have to turn the I/Q data acquisition on with
TRACe:IQ[:STATe].
If averaging is on, the maximum amount of I/Q data that can be recorded is 512kS
(524288 samples).
Parameters:
<State> ON | OFF | 0 | 1
OFF | 0
Switches the function off
ON | 1
Switches the function on
Example:
[SENSe:]SWEep:COUNt <SweepCount>
This command defines the number of sweeps that the application uses to average
traces.
In continuous sweep mode, the application calculates the moving average over the
average count.
In single sweep mode, the application stops the measurement and calculates the average after the average count has been reached.
Example:
TRAC:IQ ON
Switches on acquisition of I/Q data.
TRAC:IQ:AVER ON
Enables averaging of the I/Q measurement data.
TRAC:IQ:AVER:COUN 10
Selects averaging over 10 data sets.
TRAC:IQ:DATA?
Starts the measurement and reads out the averaged data.
SWE:COUN 64
Sets the number of sweeps to 64.
INIT:CONT OFF
Switches to single sweep mode.
INIT;*WAI
Starts a sweep and waits for its end.
Manual operation: See "Sweep/Average Count" on page 61
[SENSe:]SWEep:COUNt:CURRent?
This query returns the current number of started sweeps or measurements. This command is only available if a sweep count value is defined and the instrument is in single
sweep mode.
88User Manual 1179.0139.02 ─ 02
Page 89

R&S®FSMR3-B1
Remote commands for the I/Q analyzer
Performing measurements
Return values:
<CurrentCount>
Example:
Usage: Query only
[SENSe:]SWEep[:WINDow<n>]:POINts <SweepPoints>
This command defines the number of sweep points to analyze after a sweep.
Suffix:
<n>
Example:
Manual operation: See "Sweep Points" on page 60
[SENSe:]SWEep:TIME <Time>
SWE:COUNt 64
Sets sweep count to 64
INIT:CONT OFF
Switches to single sweep mode
INIT
Starts a sweep (without waiting for the sweep end!)
SWE:COUN:CURR?
Queries the number of started sweeps
.
SWE:POIN 251
This command defines the sweep time. It automatically decouples the time from any
other settings.
Parameters:
<Time> refer to data sheet
*RST: depends on current settings (determined automati-
cally)
Default unit: S
Manual operation: See "Meas Time" on page 57
SYSTem:SEQuencer <State>
This command turns the Sequencer on and off. The Sequencer must be active before
any other Sequencer commands (INIT:SEQ...) are executed, otherwise an error
occurs.
A detailed programming example is provided in the "Operating Modes" chapter in the
R&S FSMR3 User Manual.
Parameters:
<State> ON | OFF | 0 | 1
ON | 1
The Sequencer is activated and a sequential measurement is
started immediately.
89User Manual 1179.0139.02 ─ 02
Page 90

R&S®FSMR3-B1
Remote commands for the I/Q analyzer
Retrieving results
OFF | 0
The Sequencer is deactivated. Any running sequential measurements are stopped. Further Sequencer commands
(INIT:SEQ...) are not available.
*RST: 0
Example:
SYST:SEQ ON
Activates the Sequencer.
INIT:SEQ:MODE SING
Sets single Sequencer mode so each active measurement is
performed once.
INIT:SEQ:IMM
Starts the sequential measurements.
SYST:SEQ OFF
8.5 Retrieving results
The following commands can be used to retrieve the results of the I/Q Analyzer measurement.
Storing large amounts of I/Q data
When storing large amounts of I/Q data to a file, consider the following tips to improve
performance:
●
If capturing and storing the I/Q data is the main goal of the measurement and evaluation functions are not required, use the basic I/Q data acquisition mode (see
TRACe:IQ[:STATe] on page 83).
●
Use a HiSlip or raw socket connection to export the data from the R&S FSMR3 to a
PC.
●
Export the data in binary format rather than ASCII format (see Chapter A.1, "For-
mats for returned values: ASCII format and binary format", on page 148).
●
Use the "Compatible" or "IQPair" data mode (see Chapter A.2, "Reference: format
description for I/Q data files", on page 149).
●
If only an extract of the available data is relevant, use the TRACe<n>[:DATA]:
MEMory? command to store only the required section of data.
● Retrieving captured I/Q data................................................................................... 90
● Retrieving I/Q trace data......................................................................................... 94
● Retrieving marker and peak search results.............................................................98
8.5.1 Retrieving captured I/Q data
The captured I/Q data is output in the form of a list, three different formats can be
selected for this list (see TRACe:IQ:DATA:FORMat on page 91).
90User Manual 1179.0139.02 ─ 02
Page 91

R&S®FSMR3-B1
Remote commands for the I/Q analyzer
Retrieving results
For details on formats refer to Chapter A.2, "Reference: format description for I/Q data
files", on page 149.
TRACe:IQ:DATA?............................................................................................................ 91
TRACe:IQ:DATA:FORMat.................................................................................................91
TRACe:IQ:DATA:MEMory?............................................................................................... 92
TRACe:IQ:DATA?
This command initiates a measurement with the current settings and returns the captured data from I/Q measurements.
This command corresponds to:
INIT:IMM;*WAI;:TRACe:IQ:DATA:MEMory?
However, the TRACe:IQ:DATA? command is quicker in comparison.
Note: Using the command with the *RST values for the TRACe:IQ:SET command, the
following minimum buffer sizes for the response data are recommended: ASCII format
10 kBytes, binary format: 2 kBytes
Return values:
<Results> Measured voltage for I and Q component for each sample that
has been captured during the measurement.
The number of samples depends on TRACe:IQ:SET. In ASCII
format, the number of results is 2* the number of samples.
The data format depends on TRACe:IQ:DATA:FORMat
on page 91.
Default unit: V
Example:
TRAC:IQ:STAT ON
Enables acquisition of I/Q data
TRAC:IQ:SET NORM,10MHz,32MHz,EXT,POS,0,4096
Measurement configuration:
Sample Rate = 32 MHz
Trigger Source = External
Trigger Slope = Positive
Pretrigger Samples = 0
Number of Samples = 4096
FORMat REAL,32
Selects format of response data
TRAC:IQ:DATA?
Starts measurement and reads results
Usage:
Query only
TRACe:IQ:DATA:FORMat <Format>
This command selects the order of the I/Q data.
91User Manual 1179.0139.02 ─ 02
Page 92

R&S®FSMR3-B1
Remote commands for the I/Q analyzer
Retrieving results
For details see Chapter A.2, "Reference: format description for I/Q data files",
on page 149.
Parameters:
<Format> COMPatible | IQBLock | IQPair
COMPatible
I and Q values are separated and collected in blocks: A block
(512k) of I values is followed by a block (512k) of Q values, followed by a block of I values, followed by a block of Q values etc.
(I,I,I,I,Q,Q,Q,Q,I,I,I,I,Q,Q,Q,Q...)
IQBLock
First all I-values are listed, then the Q-values
(I,I,I,I,I,I,...Q,Q,Q,Q,Q,Q)
IQPair
One pair of I/Q values after the other is listed
(I,Q,I,Q,I,Q...).
*RST:
IQBL
TRACe:IQ:DATA:MEMory? [<OffsetSamples>,<NoOfSamples>]
This command queries the I/Q data currently stored in the capture buffer of the
R&S FSMR3.
By default, the command returns all I/Q data in the memory. You can, however, narrow
down the amount of data that the command returns using the optional parameters.
If no parameters are specified with the command, the entire trace data is retrieved.
In this case, the command returns the same results as TRACe:IQ:DATA?. (Note, however, that the TRAC:IQ:DATA? command initiates a new measurement before returning the captured values, rather than returning the existing data in the memory.)
The command returns a comma-separated list of the measured values in floating point
format (comma-separated values = CSV). The number of values returned is 2 * the
number of complex samples.
The total number of complex samples is displayed in the channel bar in manual operation and can be calculated as:
<SampleRate> * <CaptureTime>
(See TRACe:IQ:SET, TRACe:IQ:SRATe on page 130 and [SENSe:]SWEep:TIME
on page 89)
Query parameters:
<OffsetSamples> Selects an offset at which the output of data should start in rela-
tion to the first data. If omitted, all captured samples are output,
starting with the first sample.
Range: 0 to <# of samples> – 1, with <# of samples> being
the maximum number of captured values
*RST: 0
92User Manual 1179.0139.02 ─ 02
Page 93

R&S®FSMR3-B1
Remote commands for the I/Q analyzer
Retrieving results
<NoOfSamples> Number of samples you want to query, beginning at the offset
you have defined. If omitted, all captured samples (starting at
offset) are output.
Range: 1 to <# of samples> - <offset samples> with <# of
samples> maximum number of captured values
*RST: <# of samples>
Return values:
<IQData> Measured value pair (I,Q) for each sample that has been recor-
ded.
By default, the first half of the list contains the I values, the second half the Q values. The order can be configured using
TRACe:IQ:DATA:FORMat.
The data format of the individual values depends on FORMat[:
DATA] on page 94.
Default unit: V
Example:
TRAC:IQ:STAT ON
Enables acquisition of I/Q data
TRAC:IQ:SET NORM,10MHz,32MHz,EXT,POS,100,4096
Measurement configuration:
Sample Rate = 32 MHz
Trigger Source = External
Trigger Slope = Positive
Pretrigger Samples = 100
Number of Samples = 4096
INIT;*WAI
Starts measurement and wait for sync
FORMat REAL,32
Determines output format
To read the results:
TRAC:IQ:DATA:MEM?
Reads all 4096 I/Q data
TRAC:IQ:DATA:MEM? 0,2048
Reads 2048 I/Q data starting at the beginning of data acquisition
TRAC:IQ:DATA:MEM? 2048,1024
Reads 1024 I/Q data from half of the recorded data
TRAC:IQ:DATA:MEM? 100,512
Reads 512 I/Q data starting at the trigger point (<Pretrigger
Samples> was 100)
Example:
Usage: Query only
// Perform a single I/Q capture.
INIT;*WAI
// Determine output format (binary float32)
FORMat REAL,32
// Read 1024 I/Q samples starting at sample 2048.
TRAC:IQ:DATA:MEM? 2048,1024
93User Manual 1179.0139.02 ─ 02
Page 94

R&S®FSMR3-B1
8.5.2 Retrieving I/Q trace data
Remote commands for the I/Q analyzer
Retrieving results
FORMat[:DATA]...............................................................................................................94
FORMat:DEXPort:DSEParator.......................................................................................... 95
FORMat:DEXPort:FORMat............................................................................................... 95
MMEMory:STORe<n>:TRACe...........................................................................................95
TRACe<n>[:DATA]?......................................................................................................... 96
TRACe<n>[:DATA]:MEMory?............................................................................................ 97
TRACe<n>[:DATA]:X?...................................................................................................... 98
FORMat[:DATA] <Format>[, <BitLength>]
This command selects the data format that is used for transmission of trace data from
the R&S FSMR3 to the controlling computer.
Note that the command has no effect for data that you send to the R&S FSMR3. The
R&S FSMR3 automatically recognizes the data it receives, regardless of the format.
Parameters:
<Format> ASCii
ASCii format, separated by commas.
This format is almost always suitable, regardless of the actual
data format. However, the data is not as compact as other formats can be.
REAL
Floating-point numbers (according to IEEE 754) in the "definite
length block format".
The format setting REAL is used for the binary transmission of
trace data.
<BitLength> Length in bits for floating-point results
16
16-bit floating-point numbers.
Compared to REAL,32 format, half as many numbers are
returned.
32
32-bit floating-point numbers
For I/Q data, 8 bytes per sample are returned for this format setting.
64
64-bit floating-point numbers
Compared to REAL,32 format, twice as many numbers are
returned.
Example:
FORM REAL,32
94User Manual 1179.0139.02 ─ 02
Page 95

R&S®FSMR3-B1
Remote commands for the I/Q analyzer
Retrieving results
FORMat:DEXPort:DSEParator <Separator>
This command selects the decimal separator for data exported in ASCII format.
Parameters:
<Separator> POINt | COMMa
COMMa
Uses a comma as decimal separator, e.g. 4,05.
POINt
Uses a point as decimal separator, e.g. 4.05.
*RST: *RST has no effect on the decimal separator.
Default is POINt.
Example:
Manual operation: See "Decimal Separator" on page 37
FORMat:DEXPort:FORMat <FileFormat>
Determines the format of the ASCII file to be imported or exported. Depending on the
external program that creates the data file or evaluates it, a comma-separated list
(CSV) or a plain data format (DAT) file is required.
Parameters:
<FileFormat> CSV | DAT
Example:
Manual operation: See "File Type" on page 36
MMEMory:STORe<n>:TRACe <Trace>, <FileName>
This command exports trace data from the specified window to an ASCII file.
Secure User Mode
FORM:DEXP:DSEP POIN
Sets the decimal point as separator.
*RST: DAT
FORM:DEXP:FORM CSV
In secure user mode, settings that are stored on the instrument are stored to volatile
memory, which is restricted to 256 MB. Thus, a "memory limit reached" error can occur
although the hard disk indicates that storage space is still available.
To store data permanently, select an external storage location such as a USB memory
device.
For details, see "Protecting Data Using the Secure User Mode" in the "Data Management" section of the R&S FSMR3 User Manual.
For details, see "Protecting Data Using the Secure User Mode" in the "Data Management" section of the R&S FSMR3000 base unit user manual.
Suffix:
<n>
.
Window
95User Manual 1179.0139.02 ─ 02
Page 96

R&S®FSMR3-B1
Remote commands for the I/Q analyzer
Retrieving results
Parameters:
<Trace> Number of the trace to be stored
<FileName> String containing the path and name of the target file.
Example:
MMEM:STOR1:TRAC 1,'C:\TEST.ASC'
Stores trace 1 from window 1 in the file TEST.ASC.
Manual operation: See "Export Trace to ASCII File" on page 35
TRACe<n>[:DATA]? <ResultType>
This command queries current trace data and measurement results.
The data format depends on FORMat[:DATA] on page 94.
Suffix:
<n>
.
Window
Query parameters:
<ResultType> Selects the type of result to be returned.
See Table 8-3.
Example:
TRAC? TRACE3
Queries the data of trace 3.
Manual operation: See "Magnitude" on page 15
See "Spectrum" on page 16
See "I/Q-Vector" on page 16
See "Real/Imag (I/Q)" on page 17
Table 8-3: Return values for result type parameters
Parameter Result display /
measurement
TRACE1 | ... |
TRACE6
LIST
Returns the sweep point values as shown in the result display.
For the auto peak detector, the command returns positive peak values only. (To
retrieve negative peak values, define a second trace with a negative peak detector.)
"Magnitude"
"Spectrum"
" Real/Imag (I/Q)" First the real parts for each trace point, then the imaginary
"I/Q Vector" The I and Q values for each trace point are returned (1001
SEM measurements
Results
Magnitude of the I and Q values (I+jQ) for each sweep point
(=1001 values)
parts (I1,...,I
pairs of I and Q values).
Peak list evaluation, one peak per range is returned.
1001
, Q1,...,Q
1001
).
96User Manual 1179.0139.02 ─ 02
Page 97

R&S®FSMR3-B1
Remote commands for the I/Q analyzer
Retrieving results
Parameter Result display /
measurement
SPURious
SPECtrogram |
SGRam
Spurious emission
measurements
Peak list evaluation of Spurious Emission measurements.
For every frame in the spectrogram, the command returns the power levels that have
been measured, one for each sweep point. The number of frames depends on the
size of the history depth. The power level depends on the configured unit. Only
REAL,32 format is supported.
Results
Peak list evaluation
For each peak, the command returns 11 values in the following
order:
●
<No>: range number
●
<StartFreq>,<StopFreq>: start and stop frequency of the
range
●
<RBW>: resolution bandwidth
●
<PeakFreq>: frequency of the peak in a range
●
<PowerAbs>: absolute power of the peak in dBm
●
<PowerRel>: power of the peak in relation to the channel
power in dBc
●
<PowerDelta>: distance from the peak to the limit line in
dB, positive values indicate a failed limit check
●
<LimitCheck>: state of the limit check (0 = PASS, 1 =
FAIL)
●
<Unused1>,<Unused2>: reserved (0.0)
TRACe<n>[:DATA]:MEMory? <Trace>,<OffsSwPoint>,<NoOfSwPoints>
This command queries the previously captured trace data for the specified trace from
the memory. As an offset and number of sweep points to be retrieved can be specified,
the trace data can be retrieved in smaller portions, making the command faster than
the TRAC:DATA? command. This is useful if only specific parts of the trace data are of
interest.
If no parameters are specified with the command, the entire trace data is retrieved; in
this case, the command returns the same results as TRAC:DATA? TRACE1.
Suffix:
<n>
.
Window
Query parameters:
<Trace> TRACE1 | TRACE2 | TRACE3 | TRACE4 | TRACE5 | TRACE6
<OffsSwPoint> The offset in sweep points related to the start of the measure-
ment at which data retrieval is to start.
<NoOfSwPoints> Number of sweep points to be retrieved from the trace.
Return values:
<SweepPointValues>
Example:
TRAC:DATA:MEM? TRACE1,25,100
Retrieves 100 sweep points from trace 1, starting at sweep point
25.
Usage: Query only
97User Manual 1179.0139.02 ─ 02
Page 98

R&S®FSMR3-B1
Remote commands for the I/Q analyzer
Retrieving results
TRACe<n>[:DATA]:X? <TraceNumber>
This command queries the horizontal trace data for each sweep point in the specified
window, for example the frequency in frequency domain or the time in time domain
measurements.
This is especially useful for traces with non-equidistant x-values.
Suffix:
<n>
.
Window
Query parameters:
<TraceNumber> Trace number.
TRACE1 | TRACE2 | TRACE3 | TRACE4 | TRACE5 | TRACE6
Return values:
<X-Values>
Example:
TRAC3:X? TRACE1
Returns the x-values for trace 1 in window 3.
Usage: Query only
8.5.3 Retrieving marker and peak search results
CALCulate<n>:MARKer<m>:FUNCtion:FPEaks:SORT........................................................ 98
CALCulate<n>:MARKer<m>:FUNCtion:FPEaks:X?............................................................. 99
CALCulate<n>:MARKer<m>:FUNCtion:FPEaks:Y?............................................................. 99
CALCulate<n>:DELTamarker<m>:X...................................................................................99
CALCulate<n>:DELTamarker<m>:Y?...............................................................................100
CALCulate<n>:MARKer<m>:X........................................................................................ 100
CALCulate<n>:MARKer<m>:Y?.......................................................................................100
MMEMory:STORe<n>:LIST.............................................................................................101
CALCulate<n>:MARKer<m>:FUNCtion:FPEaks:SORT <SortMode>
This command selects the order in which the results of a peak search are returned.
Suffix:
<n>
.
Window
<m> Marker
Parameters:
<SortMode> X
Sorts the peaks according to increasing position on the x-axis.
Y
Sorts the peaks according to decreasing position on the y-axis.
*RST: X
Example:
CALC:MARK:FUNC:FPE:SORT Y
Sets the sort mode to decreasing y values
98User Manual 1179.0139.02 ─ 02
Page 99

R&S®FSMR3-B1
Remote commands for the I/Q analyzer
Retrieving results
CALCulate<n>:MARKer<m>:FUNCtion:FPEaks:X?
This command queries the position of the peaks on the x-axis.
The order depends on the sort order that has been set with CALCulate<n>:
MARKer<m>:FUNCtion:FPEaks:SORT.
Suffix:
<n>
<m> irrelevant
Return values:
<PeakPosition> Position of the peaks on the x-axis. The unit depends on the
Usage: Query only
CALCulate<n>:MARKer<m>:FUNCtion:FPEaks:Y?
This command queries the position of the peaks on the y-axis.
The order depends on the sort order that has been set with CALCulate<n>:
MARKer<m>:FUNCtion:FPEaks:SORT.
Suffix:
<n>
<m> irrelevant
Return values:
<PeakPosition> Position of the peaks on the y-axis. The unit depends on the
.
irrelevant
measurement.
.
irrelevant
measurement.
Usage: Query only
CALCulate<n>:DELTamarker<m>:X <Position>
This command moves a delta marker to a particular coordinate on the x-axis.
If necessary, the command activates the delta marker and positions a reference
marker to the peak power.
Suffix:
<n>
<m> Marker
Parameters:
<Position> Numeric value that defines the marker position on the x-axis.
Example:
.
Window
Range: The value range and unit depend on the measure-
ment and scale of the x-axis.
CALC:DELT:X?
Outputs the absolute x-value of delta marker 1.
99User Manual 1179.0139.02 ─ 02
Page 100

R&S®FSMR3-B1
Remote commands for the I/Q analyzer
Retrieving results
CALCulate<n>:DELTamarker<m>:Y?
Queries the result at the position of the specified delta marker.
Suffix:
<n>
<m> 1..n
Return values:
<Result> Result at the position of the delta marker.
Usage: Query only
CALCulate<n>:MARKer<m>:X <Position>
This command moves a marker to a specific coordinate on the x-axis.
If necessary, the command activates the marker.
If the marker has been used as a delta marker, the command turns it into a normal
marker.
Suffix:
<n>
<m> Marker
.
1..n
The unit is variable and depends on the one you have currently
set.
Default unit: DBM
.
Window
Parameters:
<Position> Numeric value that defines the marker position on the x-axis.
The unit depends on the result display.
Range: The range depends on the current x-axis range.
Default unit: Hz
Example:
Manual operation: See "Marker Table" on page 18
CALCulate<n>:MARKer<m>:Y?
Queries the result at the position of the specified marker.
Suffix:
<n>
<m> 1..n
Return values:
<Result> Default unit: DBM
Usage: Query only
CALC:MARK2:X 1.7MHz
Positions marker 2 to frequency 1.7 MHz.
See "Marker Peak List" on page 18
.
1..n
100User Manual 1179.0139.02 ─ 02
 Loading...