

Page 1

R&S
®
FSQ
-
K92/93/94
Test and Measurement
Software Manual
WiMAX IEEE 802.16-2004,
IEEE 802.16e-2005 TX Tests
Software Manual
1300.7462.42 – 10
Page 2

The Software Manual describes the following R&S®FSQ-K92/93/94 models and options:
R&S
®
FMU
®
FSG
®
SQ
F
+ R&S
+ R&S
+
This manual consists of the following volumes:
The firmware of the instrument makes use of several valuable open source software packages. the most important of them are listed
below, together with their corresponding open source license. The verbatimlicense texts are provided on the user documentation CD-
ROM (included in delivery).
Package Link License
Xitam i http://www.xitami.com
2.5b6
Rohde&Schwarz would like to thank the open source community for their valuable contribution to embedded computing.
© 2008 Rohde & Schwarz GmbH & Co. KG
81671 Munich, Germany
Printed in Germany – Subject to change – Data without tolerance limits is not binding.
®
R&S
is a registered trademark of Rohde & Schwarz GmbH & Co. KG.
Trade names are trademarks of the owners.
The following abbreviations are used throughout this manual:
®
FSQ-K92/93/94 is abbreviated as R&S FSQ-K92/93/94.
R&S
Page 3

R&S FS-K92/93/94 Table of Contents
Table of Contents
1 General Information ............................................................................ 9
1.1 Introduction to R&S FSQ-K92/K93/K94 WiMAX Measurements ...........................10
1.2 Installation ..................................................................................................................10
1.3 Starting the Application ............................................................................................12
1.4 Exiting the Application ..............................................................................................12
1.5 Quick Start Guide.......................................................................................................13
1.5.1 Setting up the Measurement ........................................................................................13
1.5.1.1 Performing Level Detection .........................................................................................15
1.5.2 Performing the main measurement .............................................................................15
1.5.3 Setting up a MIMO-OFDMA/WiBro Measurement .......................................................15
1.6 Navigation ...................................................................................................................21
1.6.1 Hotkeys ........................................................................................................................21
1.6.2 Softkeys .......................................................................................................................23
1.6.2.1 Settings Softkeys .........................................................................................................23
1.6.2.2 Other Softkeys .............................................................................................................24
1.6.3 Hardkeys ......................................................................................................................24
1.6.4 External Keyboard .......................................................................................................25
1.6.5 Mouse ..........................................................................................................................26
1.6.6 Selecting & Editing Parameters ...................................................................................26
1.6.6.1 Numeric Keypad ..........................................................................................................27
1.6.6.2 Rollkey .........................................................................................................................27
1.6.6.3 Cursor Keys .................................................................................................................28
1.6.6.4 Selection of a parameter within a settings view ...........................................................28
1.6.6.5 Entry of an enumerated value ......................................................................................32
1.6.6.6 Entry of a checkbox .....................................................................................................33
1.6.7 Status Bar & Title Bar ..................................................................................................34
1.6.7.1 Title Bar ........................................................................................................................34
1.6.7.2 Status Bar ....................................................................................................................34
1.7 Save/Recall .................................................................................................................35
1.8 Printing .......................................................................................................................36
2 Measurements & Settings ................................................................ 38
Software Manual 1300.7462.42 - 10 1
Page 4

R&S FS-K92/93/94 Table of Contents
2.1 Measurements ............................................................................................................38
2.1.1 IEEE 802.16e-2005 SISO- and MIMO-OFDMA/WiBro Measurements .......................38
2.1.1.1 Current restrictions to the IEEE802.16e-2005 OFDMA, WiBro Signal to be analyzed39
2.1.1.2 IEEE802.16e-2005 SISO-OFDM, SISO- and MIMO-OFDMA/WiBro Scalar
Measurement Results ..................................................................................................40
2.1.1.3 IEEE802.16e-2005 SISO-OFDM, SISO- and MIMO-OFDMA/WiBro Graphical
Measurement Results ..................................................................................................42
2.1.2 IQ measurements ........................................................................................................46
2.1.2.1 Power vs Time (PVT) ...................................................................................................48
2.1.2.2 EVM vs Symbol ............................................................................................................54
2.1.2.3 EVM vs Carrier .............................................................................................................57
2.1.2.4 Error vs Preamble (SISO-OFDM) / Error vs Sample (SISO-OFDMA/WiBro) ..............59
2.1.2.5 Spectrum Flatness .......................................................................................................60
2.1.2.6 SISO-OFDM and SISO-OFDMA/WiBro .......................................................................61
2.1.2.7 MIMO-OFDMA/WiBro ..................................................................................................62
2.1.2.8 Flatness Difference ......................................................................................................63
2.1.2.9 Preamble Channel Frequency Response ....................................................................67
2.1.2.10 Group Delay .................................................................................................................68
2.1.2.11 MIMO-OFDMA/WiBro ..................................................................................................69
2.1.2.12 Spectrum FFT ..............................................................................................................71
2.1.2.13 Constellation vs Symbol ..............................................................................................73
2.1.2.14 Constellation vs Carrier ...............................................................................................78
2.1.2.15 Complementary Cumulative Distribution Function (CCDF) .........................................79
2.1.2.16 Bit Stream ....................................................................................................................81
2.1.2.17 Burst Summary ............................................................................................................84
2.1.3 Frequency sweep measurements ................................................................................87
2.1.3.1 Spectrum Emission Mask ............................................................................................87
2.1.3.2 Spectrum ACP .............................................................................................................94
2.1.3.3 Noise Correction ..........................................................................................................95
2.1.3.4 No of Channels ............................................................................................................95
2.1.4 Automatic Level Detection ...........................................................................................97
2.2 Running measurements ............................................................................................97
2.3 Measurement results .................................................................................................98
2.3.1 Results Summary.......................................................................................................100
Software Manual 1300.7462.42 - 10 2
Page 5

R&S FS-K92/93/94 Table of Contents
2.4 General Settings ......................................................................................................112
2.4.1 Signal Characteristics ................................................................................................114
2.4.1.1 Standard ....................................................................................................................114
2.4.1.2 Frequency ..................................................................................................................115
2.4.1.3 Channel No (SISO-OFDM) ........................................................................................115
2.4.1.4 Frequency Band.........................................................................................................116
2.4.1.5 FFT Size N
(SISO- and MIMO-OFDMA/WiBro) ....................................................116
FFT
2.4.1.6 Channel Bandwidth ....................................................................................................116
2.4.1.7 Fs/BW acc. to Standard .............................................................................................117
2.4.1.8 Sample Rate ..............................................................................................................117
2.4.1.9 G = Tg/Tb ...................................................................................................................117
2.4.2 Level Settings ............................................................................................................118
2.4.2.1 Auto Level ..................................................................................................................118
2.4.2.2 Signal Level (RF) .......................................................................................................118
2.4.2.3 Signal Level (Baseband) ............................................................................................118
2.4.2.4 Ext Att ........................................................................................................................119
2.4.3 Data Capture Settings ...............................................................................................119
2.4.3.1 Capture Time .............................................................................................................119
2.4.3.2 Overall Burst Count (SISO-OFDM) ............................................................................119
2.4.3.3 No of Burst to Analyze (SISO-OFDM) .......................................................................120
2.4.3.4 Capture Count (SISO- and MIMO-OFDMA/WiBro) ...................................................120
2.4.3.5 No of Subframes to Analyze (SISO- and MIMO-OFDMA/WiBro) ..............................120
2.4.3.6 Sweep Time (Mask/ACPR) ........................................................................................121
2.4.3.7 Sweep Count (Mask/ACPR) ......................................................................................121
2.4.4 Trigger Settings ..........................................................................................................121
2.4.4.1 Trigger Mode ..............................................................................................................121
2.4.4.2 Trigger Offset .............................................................................................................122
2.4.4.3 External Trigger Level ................................................................................................122
2.4.4.4 Auto Power Trigger Level ..........................................................................................122
2.4.4.5 Trigger Level (RF) ......................................................................................................122
2.4.4.6 Trigger Level (Baseband) ..........................................................................................123
2.4.4.7 Ext. Trigger Lvl ...........................................................................................................123
2.4.5 STC/MIMO Configuration (MIMO-OFDMA/WiBro) ....................................................123
Software Manual 1300.7462.42 - 10 3
Page 6

R&S FS-K92/93/94 Table of Contents
2.4.5.1 DUT MIMO Configuration (MIMO-OFDMA/WiBro) ....................................................123
2.4.5.2 Auto Assignment (MIMO-OFDMA/WiBro) .................................................................124
2.4.5.3 State (MIMO-OFDMA/WiBro) ....................................................................................124
2.4.5.4 Analyzer IP Address (MIMO-OFDMA/WiBro) ............................................................124
2.4.6 IQ Settings .................................................................................................................125
2.4.6.1 Swap IQ .....................................................................................................................125
2.4.7 Input Settings .............................................................................................................125
2.4.7.1 Baseband Input ..........................................................................................................125
2.4.8 Advanced Settings .....................................................................................................125
2.4.8.1 Swap IQ .....................................................................................................................127
2.4.9 Input Settings .............................................................................................................127
2.4.9.1 Input ...........................................................................................................................127
2.4.10 Baseband Settings .....................................................................................................127
2.4.10.1 IQ Input ......................................................................................................................127
2.4.10.2 IQ Path .......................................................................................................................128
2.4.10.3 Balanced ....................................................................................................................128
2.4.10.4 Low Pass ...................................................................................................................128
2.4.10.5 Dither .........................................................................................................................129
2.4.10.6 Digital Input Data Rate ...............................................................................................129
2.4.10.7 Full Scale Level ..........................................................................................................129
2.4.10.8 Auto Level ..................................................................................................................130
2.4.10.9 Auto Track Time .........................................................................................................130
2.4.10.10 Ref Level ....................................................................................................................130
2.4.10.11 RF Att .........................................................................................................................130
2.4.10.12 El Att ..........................................................................................................................131
2.4.10.13 YIG Filter ....................................................................................................................131
2.4.10.14 High Dynamic .............................................................................................................131
2.4.10.15 RSSI, CINR avg parameter .......................................................................................132
2.4.10.16 List Results Unit (SISO-OFDM) .................................................................................132
2.4.10.17 Measure Capture Buffer to … ....................................................................................132
2.4.10.18 SMU Address (SISO- and MIMO-OFDMA/WiBro) ....................................................132
2.5 Demod Settings (SISO-OFDM) ................................................................................133
2.5.1 Burst To Analyze Settings .........................................................................................133
Software Manual 1300.7462.42 - 10 4
Page 7

R&S FS-K92/93/94 Table of Contents
2.5.1.2 Tracking Settings .......................................................................................................137
2.6 Demod Settings(SISO- and MIMO-OFDMA/WiBro) ...............................................138
2.6.1 Channel Estimation Range ........................................................................................139
2.6.2 Bursts To Analyze ......................................................................................................140
2.6.3 Tracking Settings .......................................................................................................140
2.6.4 STC/MIMO Settings ...................................................................................................142
2.6.5 Advanced ...................................................................................................................142
2.7 Frame Global (SISO- and MIMO-OFDMA/WiBro) ..................................................143
2.7.1 Frame .........................................................................................................................143
2.7.1.1 Use … for analysis .....................................................................................................143
2.7.1.2 Analyze Zone .............................................................................................................145
2.7.1.3 IDCell .........................................................................................................................145
2.7.2 Dependencies between the Use … for analysis, IDcell and Preamble Index settings146
2.7.3 DL Subframe ..............................................................................................................147
2.7.3.1 Preamble Index ..........................................................................................................147
2.7.3.2 Used Subchannel Bitmap ..........................................................................................147
2.7.4 UL Subframe ..............................................................................................................148
2.7.4.1 UL Control Region Length .........................................................................................148
2.7.4.2 Frame Number ...........................................................................................................148
2.8 Frame Config (SISO- and MIMO-OFDMA/WiBro) ..................................................148
2.8.1 Zone/Segment List (SISO- and MIMO-OFDMA/WiBro) ............................................150
2.8.1.1 Zone/Segment List Down Link (MIMO-OFDMA/WiBro) ............................................151
2.8.1.2 Zone/Segment List Up Link (MIMO-OFDMA/WiBro) .................................................152
2.8.2 Burst List (SISO- and MIMO-OFDMA/WiBro) ............................................................153
2.8.2.1 Burst List DL (Down Link) ..........................................................................................153
2.8.2.2 Burst List DL (MIMO-OFDMA/WiBro) ........................................................................155
2.8.2.3 Burst List Up Link (UL) ...............................................................................................156
2.8.2.4 Burst List UL (MIMO-OFDMA/WiBro) ........................................................................158
2.8.3 Zone/Segment Map ...................................................................................................159
2.8.4 Burst Map ...................................................................................................................159
2.8.5 Frame Config Softkeys ..............................................................................................160
2.9 File Manager .............................................................................................................161
2.9.1 File Type ...................................................................................................................161
Software Manual 1300.7462.42 - 10 5
Page 8

R&S FS-K92/93/94 Table of Contents
2.9.1. Loading settings from a file on the local instrument ..................................................162
2.9.3 Transfer settings between R&S FSQ and R&S SMU ................................................162
2.9.3.1 Download from R&S FSQ to R&S SMU ....................................................................162
2.9.3.2 Upload from R&S SMU to R&S FSQ .........................................................................163
2.10 Gate Settings ............................................................................................................163
2.10.1 Gate Settings .............................................................................................................165
2.10.1.1 Delay ..........................................................................................................................165
2.10.1.2 Length ........................................................................................................................166
2.10.1.3 Link Gate and Marker ................................................................................................166
2.11 Import/Export of IQ Data .........................................................................................166
2.12 Markers .....................................................................................................................169
2.12.1 Adjusting Markers ......................................................................................................169
2.12.2 Marker Zoom ..............................................................................................................169
2.12.3 Toggle Marker Display ...............................................................................................170
2.12.4 Assigning Marker to Traces .......................................................................................171
2.12.5 Frame Start Marker ....................................................................................................171
2.12.5.1 Subframe ...................................................................................................................172
2.12.5.2 Ref. Power SISO- and MIMO-OFDMA/WiBro only! ..................................................172
2.12.5.3 Ref. Pwr. Offset SISO- and MIMO-OFDMA/WiBro only! ..........................................173
2.12.5.4 Averaging SISO- and MIMO-OFDMA/WiBro only! ....................................................173
2.13 Display Settings .......................................................................................................174
3 Measurements in Detail .................................................................. 175
3.1 Signal Processing of the IEEE802.16-2004 OFDM Measurement Application ..175
3.1.1 Abbreviations .............................................................................................................175
3.2 Analysis Steps .........................................................................................................179
3.3 Subchannelization ...................................................................................................180
3.3.1 Synchronization .........................................................................................................180
3.3.2 Results influenced by Subchannelization ..................................................................180
3.3.2.1 Channel Results .........................................................................................................180
3.3.2.2 Frequency and Clock Offset ......................................................................................181
3.3.2.3 EVM ...........................................................................................................................182
3.3.2.4 IQ Impairments ..........................................................................................................182
3.4 RSSI Measurements ................................................................................................183
Software Manual 1300.7462.42 - 10 6
Page 9

R&S FS-K92/93/94 Table of Contents
3.5 CINR Measurements ................................................................................................183
3.5.1 Literature ....................................................................................................................184
3.6 Signal Processing of the IEEE802.16-2005 SISO- and MIMO-OFDMA / WiBro
Measurement Application .......................................................................................184
3.6.1 Symbols and Abbreviations .......................................................................................184
3.6.2 Introduction ................................................................................................................186
3.6.3 Data Capturing ...........................................................................................................186
3.6.4 OFDMA Measurement Application ............................................................................187
3.6.4.1 Synchronization .........................................................................................................187
3.6.4.2 Channel Estimation / Equalization .............................................................................189
3.6.4.3 Analysis ......................................................................................................................190
3.6.5 References .................................................................................................................192
4 Remote Control ............................................................................... 193
4.1 Description of commands .......................................................................................193
4.1.1 Notation ......................................................................................................................193
4.2 SCPI Command Examples ......................................................................................196
4.2.1 Setup 1TX/1RX SISO measurement .........................................................................196
4.2.2 Setup 2TX/2RX MIMO measurement ........................................................................197
4.3 ABORt Subsystem ...................................................................................................198
4.4 CALCulate Subsystem ............................................................................................198
4.4.1 CALCulate:BURSt Subsystem ...................................................................................198
4.5 CALCulate:LIMit Subsystem ...................................................................................199
4.5.2 CALCulate:MARKer Subsystem ................................................................................214
4.5.3 CALCulate:MARKer:FUNCtion Subsystem ...............................................................219
4.6 CONFigure Subsystem ............................................................................................224
4.7 DIAGnostic Subsystem ...........................................................................................259
4.8 DISPlay Subsystem .................................................................................................260
4.9 FETCh Subsystem ...................................................................................................265
4.10 FORMat Subsystem .................................................................................................284
4.11 INITiate Subsystem ..................................................................................................284
4.12 INPut Subsystem .....................................................................................................285
4.13 INSTrument Subsystem ..........................................................................................291
4.14 MMEMory Subsystem ..............................................................................................292
Software Manual 1300.7462.42 - 10 7
Page 10

R&S FS-K92/93/94 Table of Contents
4.15 SENSe Subsystem ...................................................................................................294
4.16 STATus Subsystem .................................................................................................312
4.17 SYSTEM Subsystem ................................................................................................317
4.18 TRACe Subsystem ...................................................................................................318
4.19 TRIGger Subsystem ................................................................................................327
4.20 UNIT Subsystem ......................................................................................................329
4.21 Status Reporting Registers ....................................................................................330
4.21.1 Description of the Status Registers ...........................................................................332
4.22 Error Reporting ........................................................................................................335
5 Remote Control - Programming Examples ................................... 336
5.1.1 Synchronization Entry of Option ................................................................................336
5.1.2 Selecting Measurements ...........................................................................................336
6 List of Warnings & Error Messages .............................................. 338
Index ................................................................................................ 339
Software Manual 1300.7462.42 - 10 8
Page 11

R&S FS-K92/93/94 Table of Contents
Introduction to R&S FSQ-K92/K93/K94 WiMAX Measurements
1 General Information
The Rohde & Schwarz FSQ-K92/K93/K94 application extends the functionality of the
R&S FSQ spectrum analyzer to enable WiMAX and WiBro TX-measurements
according to the standards
● IEEE 802.16-2004/Cor 1-2005 SISO-OFDM physical layer mode (R&S FSQK92/K93/K94).
The short form ‘SISO-OFDM’ is used in this document, to reference this operation
mode.
● IEEE 802.16-2004/Cor 1-2005, IEEE 802.16e-2005,
P802.16Rev2/D3 (February 2008)
SISO-OFDMA physical layer mode (R&S FSQ-K93/K94 only). The short form
‘SISO-OFDMA’ is used in this document, to reference this operation mode.
MIMO-OFDMA physical layer mode (R&S FSQ-K94 only). The short form ‘MIMOOFDMA’ is used in this document, to reference this operation mode.
● IEEE 802.16-2004/Cor 1-2005, IEEE 802.16e-2005 based WiBro,
P802.16Rev2/D3 (February 2008) based WiBro
SISO-WiBro physical layer mode (R&S FSQ-K93/K94 only). The short form ‘SISOWiBro’ is used in this document, to reference this operation mode.
MIMO-WiBro physical layer mode (R&S FSQ-K94 only). The short form ‘MIMOWiBro’ is used in this document, to reference this operation mode.
The standard is selected in the General Settings Panel, Standard field.
This manual supports the user in working with R&S FSQ-K92/K93/K94. It aids the
preparation, execution and evaluation of a measurement and gives many helpful hints
and examples.
For the user wanting to make a quick start to using R&S FSQ-K92/K93/K94, the Quick
Start Guide section below works step-by-step through an ordinary measurement. The
remainder of this section describes all of the basic information about how the R&S
FSQ-K92/K93/K94 application works, without covering measurements in detail. A
detailed description of all measurement modes, settings and results can be found in
section 2. Section 4 covers remote control operation of R&S FSQ-K92/K93/K94.
This section covers the following subjects:
Introduction to R&S FSQ-K92/K93/K94 measurements
● Installation
● Starting the application
● Exiting the application
● Quick start guide – allows the user to get up-and-running in minimum time
● Navigation
● Save/recall – saving & recalling user settings & measurement results
● Printing
Software Manual 1300.7462.42 - 10 9
Page 12

R&S FS-K92/93/94 Table of Contents
Introduction to R&S FSQ-K92/K93/K94 WiMAX Measurements
1.1 Introduction to R&S FSQ-K92/K93/K94 WiMAX Measurements
The use of an R&S FSQ spectrum analyzer with its high sensitivity enables the
accurate and reproducible TX-measurement of a WiMAX Device Under Test (DUT)
according to the standards specified for the device:
● Modulation formats:
- IEEE 802.16-2004
- BPSK (SISO-OFDM)
- QPSK
- 16QAM
- 64QAM
● Modulation measurements:
- Constellation diagram
- Constellation diagram per OFDM carrier
- I/Q offset and I/Q imbalance
- Quadrature error
- Carrier and symbol frequency errors
- Modulation error (EVM) per OFDM carrier or symbol
- Amplitude response and group-delay distortion (spectral flatness)
● Amplitude statistics (CCDF) and crest factor
● Transmit spectrum mask
● Adjacent Channel Power (Absolute and Relative)
● FFT, also over a selected part of the signal, e.g. preamble
● Payload bit information
● Burst Summary provides information about the analyzed bursts
● Capture time selectable up to 50 ms, multiple sweeps possible for large number of
bursts
1.2 Installation
From the analyzer select firmware update.
► Press the SETUP hardkey followed by NEXT, FIRMWARE UPDATE and finally the
FIRMWARE UPDATE softkey. Following the instructions displayed.
Once the installation has completed the analyzer will reboot.
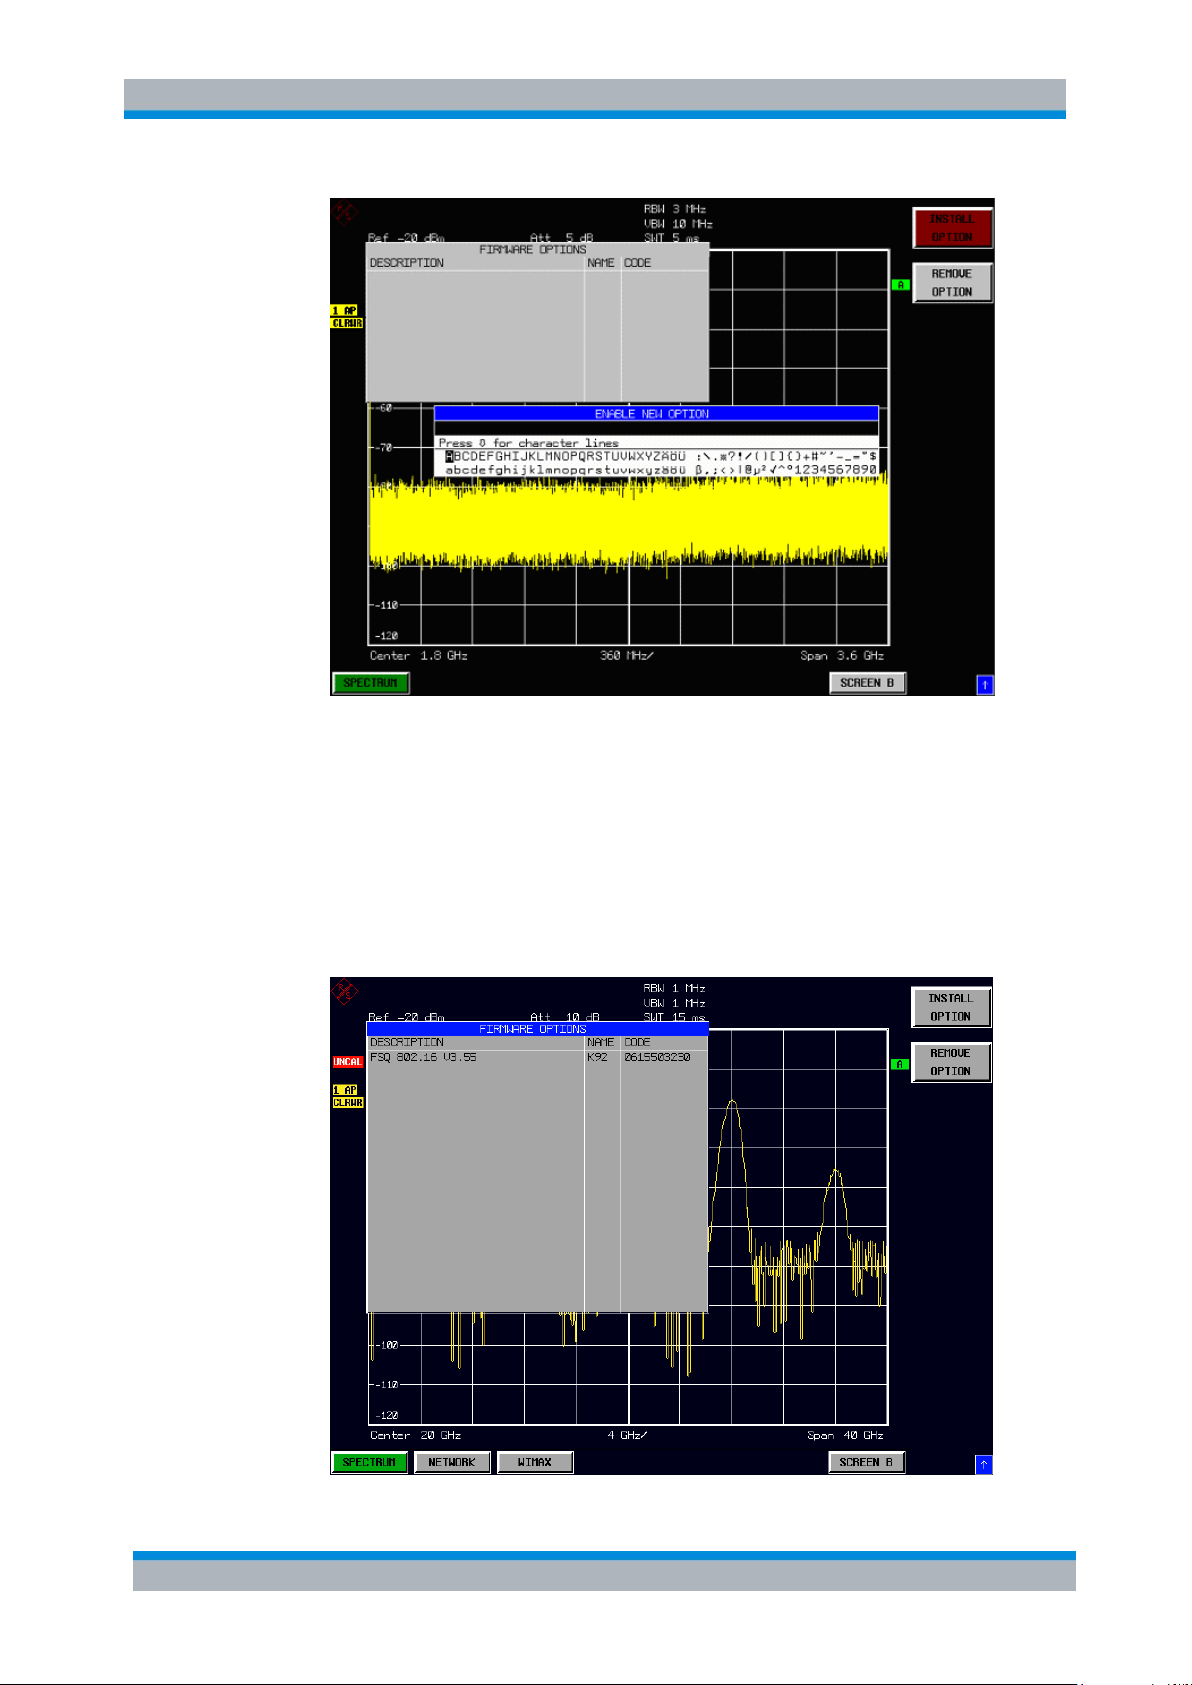
Once the option has been installed it needs to be activated:
1. Start up the analyzer.
2. Press the SETUP hardkey, followed by the GENERAL SETUP softkey and then
the OPTIONS softkey.
A list of the options currently activated is displayed.
3. Press the INSTALL OPTION softkey. A Dialog is displayed allowing the option key
to be entered.
Software Manual 1300.7462.42 - 10 10
Page 13
R&S FS-K92/93/94 Table of Contents
Installation
4. Enter the option key supplied with the R&S FSQ-K92/K93/K94 software. If
upgrading from R&S FSQ-K92 to R&S FSQ-K93, the upgrade key needs to be
entered in addition to the original R&S FSQ-K92 option key.
5. When a valid option key has been supplied a dialog will be displayed explaining
that a reboot is required to complete this operation. Select OK in this dialog and
the instrument will be rebooted.
6. When the analyzer starts after the reboot a new hotkey will be displayed at the
bottom of the display labelled WIMAX. In addition an entry for the R&S FSQK92/K93/K94 option will be displayed in the FIRMWARE OPTIONS dialog.
Software Manual 1300.7462.42 - 10 11
Page 14

R&S FS-K92/93/94 Table of Contents
Starting the Application
1.3 Starting the Application
Power up the R&S FSQ spectrum analyzer. When R&S FSQ-K92/K93/K94 is correctly
installed there will be a hotkey labelled WIMAX at the bottom of the screen. Press the
WIMAX hotkey to start R&S FSQ-K92/K93/K94.
Note that if the spectrum analyzer is powered down whilst R&S FSQ-K92/K93/K94 is
active, then when the spectrum analyzer is powered up again it will start up in the R&S
FSQ-K92/K93/K94 application.
1.4 Exiting the Application
To exit the R&S FSQ-K92/K93/K94 option, press the SPECTRUM hotkey at the bottom
of the screen. This will cause the option to exit and the spectrum analyzer to be
activated.
Software Manual 1300.7462.42 - 10 12
Page 15

R&S FS-K92/93/94 Table of Contents
1
2
Quick Start Guide
1.5 Quick Start Guide
This section helps the user to quickly become familiar with R&S FSQ-K92/K93/K94 by
working step-by-step through an ordinary measurement. (Refer to section 2 for a
detailed reference guide.)
For this example a DUT using IEEE 802.16-2004 will be used. The DUT will be connected
to the analyzer using the RF input of the analyzer. The DUT will generate a signal
modulated using 64QAM 2/3.
1.5.1 Setting up the Measurement
1. Start the R&S FSQ-K92/K93/K94 application.
2. Press the GENERAL SETTINGS softkey to open the General Settings view.
3. Select the Frequency field and enter the desired frequency to measure. Note that
when a valid frequency is entered the Channel No field updates.
4. Select the Frequency Band in which the Signal to be analyzed is located. The
target band is either one of the bands given as example in the 802.16-2004
standard1 or an unspecified band.
5. Select either the Channel Bandwidth (BW) or Sampling Rate (Fs) according to the
characteristics of the signal to be analyzed. The second parameter is derived from
the first according to the standard2.
B.3.2 Wireless MAN-OFDM/OFDMA PHY symbol and performance parameters.
8.3.2.2 Derived Parameter definitions
Software Manual 1300.7462.42 - 10 13
Page 16

R&S FS-K92/93/94 Table of Contents
bg
TTG
Quick Start Guide
6. Select the
CP [Cyclic Prefix] to useful time ratio according to the
characteristics of the signal to be analyzed.
7. Switch Off the Auto Level Field. In this example the level detection measurement
will be executed manually.
All other settings in this view are sufficient for this example.
8. Press the DEMOD SETTINGS softkey to open the Demod Settings view
9. Select the Link Mode of the Bursts to be analyzed.
10. In case Modulation Detection Mode is set to All , All modulation formats of the
bursts will be analyzed.
This is useful, to get an overview of the signal content.
11. Close the Demod Settings by pressing the WIMAX hotkey.
Software Manual 1300.7462.42 - 10 14
Page 17

R&S FS-K92/93/94 Table of Contents
3
RF
Quick Start Guide
1.5.1.1 Performing Level Detection
1. Connect the DUT to the RF input of the spectrum analyzer. (see Fig. 1)
Fig. 1 Preparation for level detection
2. Start the Level Detection measurement by pressing the AUTO LVL hotkey.
3. During the level detection measurement the text "Running ..." is displayed in the
Status Bar at the bottom of the screen.
4. After successful level detection, the Status Bar will display “Measurement
Complete”, the signal level field for the selected input will be updated to show the
detected signal level and the Magnitude Capture Buffer (Screen A) will be updated
to show the zero span trace obtained during the measurement sequence.
1.5.2 Performing the main measurement
After level detection has been successfully completed the main measurement can be
started. The set-up for the main measurement is the same as that for the level detection
measurement.
1. Start the measurement by pressing the RUN SGL hotkey.
2. During the measurement, the text "Running..." is displayed in the Status Bar at the
bottom of the screen.
Measurement results are updated once the measurement has completed. The results
are displayed in graphical form. The display can be toggled to a tabular list of
measurement points by pressing the DISPLAY Softkey.
1.5.3 Setting up a MIMO-OFDMA/WiBro Measurement
For this example a 2 Tx MIMO DUT according to IEEE 802.16e-2005 is used.
1. The MIMO DUT is connected to the analyzers according to the following setup:
a two channel SMU in this example
Software Manual 1300.7462.42 - 10 15
Page 18

R&S FS-K92/93/94 Table of Contents
Two
Channel
SMU
FSx
FSx
0
Tx
1
Tx
1
Rx
0
Rx
LAN
Hub
Trigger Signal
Reference Signal
RF Signal
LAN
LAN
LAN
Quick Start Guide
2. Connect the external reference REF OUT of the SMU with the external reference REF
IN of the analyzers. Switch on the external reference for both analyzers in the
spectrum analyzer base system.
3. Connect the marker output of the SMU with the Ext Trigger input of the analyzers.
4. Either connect Path A RF connector with one analyzer and Path B RF connector
with the other analyzer, or use the air interface with appropriate antennas.
5. Connect the SMU and the analyzers via LAN according to the figure above. Make
sure, that all instruments can be accessed by their IP-address. It is sufficient to
connect the master and the slave with a cross LAN cable. But for convenience in
this example, the SMU is also connected via LAN.
Setup the SMU to transmit in example a WiMAX MIMO Matrix B signal.
Fig. 2 SMU Frame Configuration Dialog.
Software Manual 1300.7462.42 - 10 16
Page 19

R&S FS-K92/93/94 Table of Contents
Quick Start Guide
Fig. 3 SMU Configure Zone #1 Dialog.
Fig. 4 SMU Time Plan Dialog
Software Manual 1300.7462.42 - 10 17
Page 20

R&S FS-K92/93/94 Table of Contents
Quick Start Guide
Fig. 5 SMU transmitting the WiMAX Matrix B signal.
6. The analyzer with the FSQ-K94 MIMO option is called the master. The other
analyzer doesn’t require the FSQ-K94 option and is called the slave.
In the subsequent steps – if not mentioned otherwise – the master is referred.
7. For the master in General Settings select the IEEE 802.16e-2005 MIMO Standard.
8. In General Settings Advanced enter the SMU IP address.
Use the File Manager to download the WiMAX MIMO settings from the SMU.
Software Manual 1300.7462.42 - 10 18
Page 21

R&S FS-K92/93/94 Table of Contents
Quick Start Guide
9. In General Settings select External Trigger and set the Capture Time appropriate
to capture at least one sub frame.
10. In General Settings section STC/MIMO Config:
a. The DUT MIMO Configuration specifies the number of Tx antennas of the DUT.
This value defines the maximal number of Tx antennas per MIMO zone. See
Frame Config | More Zone/Segment Settings, STC/MIMO Config. In case the
setup was loaded from a SMU setting, this parameter will be set automatically.
b. Enter the IP address of the slave and switch the state of the slave On. Additionaly
check Auto Assignment in case the antenna assignment is delegated to the application.
Software Manual 1300.7462.42 - 10 19
Page 22

R&S FS-K92/93/94 Table of Contents
Quick Start Guide
11. In Demod Settings choose Channel Estimation Payload Only because the MIMO
zone is not preceded by a preamble. Note for DL, the MIMO zone is the second or
higher zone in the DL subframe.
12. In case the air interface was chosen to transmit the WiMAX signal, check
Compensate Crosstalk in Demod Settings. In case of a wired connection this
parameter might be cleared or checked.
13. In Demod Settings Frame Config select the MIMO zone for analysis.
Software Manual 1300.7462.42 - 10 20
Page 23

R&S FS-K92/93/94 Table of Contents
Navigation
14. Now start the measurement with RUN SGL or RUN CONT to get the various
WiMAX MIMO measurement results.
1.6 Navigation
This section deals with navigation within the option. Navigation here is taken to mean all
forms of interaction with the option except for remote control. The different methods of
interacting with the option are:
● Hotkeys
● Softkeys
● Hardkeys
● Numeric Keypad
● Roll-key
● Cursor Keys
● External Keyboard
● Mouse
^
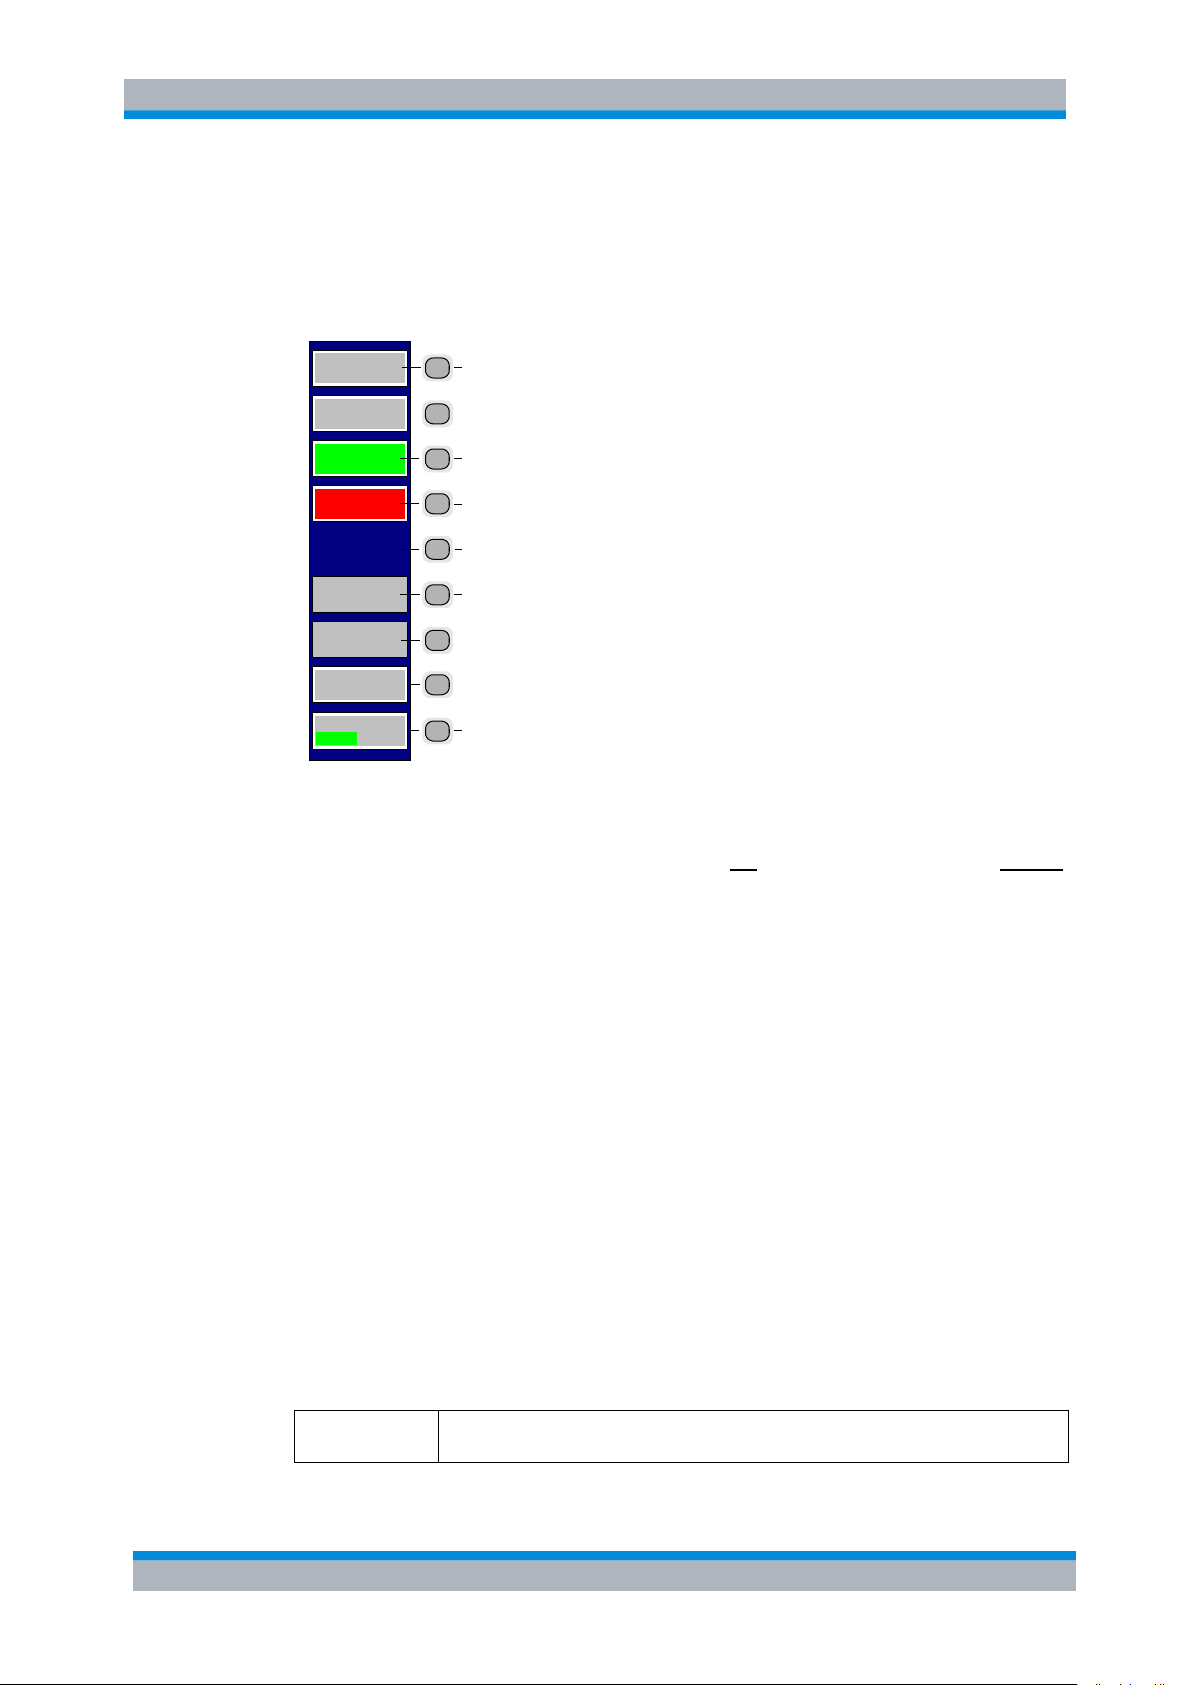
1.6.1 Hotkeys
Hotkeys are allocated to the seven keys at the bottom edge of the screen. On initial
start-up of the R&S FSQ-K92/K93/K94 option, the hotkeys provided are shown in Fig.
6. These hotkeys are present at all times once the option has been started.
Software Manual 1300.7462.42 - 10 21
Page 24

R&S FS-K92/93/94 Table of Contents
RUN SGL
RUN CONT
AUTO LVL
WIMAX
SPECTRUM
REFRESH
SCREEN B
AUTO LVL
AUTO LVL
SPECTRUM
The SPECTRUM hotkey exits the R&S FSQ-K92/K93/K94 option & returns to the
spectrum analyzer with all previous settings restored.
WIMAX
The WIMAX hotkey returns the user to the main measurement menu of R&S FSQ-
K92/K93/K94, where measurement results can be seen. All settings views and
dialogs are removed from the display, and the default softkey menu is displayed
The WIMAX hotkey remains green whenever R&S FSQ-K92/K93/K94 is active
AUTO LVL
The AUTO LVL hotkey starts an automatic level detection measurement.
If another measurement is running then the running measurement will be aborted
before the automatic level detection measurement is started. If a continuous
measurement is running when the AUTO LVL hot-key is pressed then the continuous
measurement shall resume after the automatic level detection has completed
Pressing the AUTO LVL hotkey whilst an automatic level detection measurement is
running causes the measurement to be stopped (aborted).
RUN SGL
The RUN SGL hotkey starts the selected measurement in single sweep mode.
If another measurement is running, such as a continuous sweep measurement, the
running measurement will be aborted before the single sweep measurement is started.
Pressing the RUN SGL hotkey whilst a single frequency range measurement is
running causes the measurement to be stopped (aborted).
The RUN CONT hotkey starts the selected measurement in continuous sweep mode
If another measurement is running then the running measurement will be aborted
before the continuous sweep measurement is started.
Pressing the RUN CONT hotkey whilst a continuous sweep measurement is running
causes the measurement to be stopped (aborted).
RUN CONT
Navigation
Fig. 6 Initial Hotkey menu
A keystroke activates the associated hotkey. An activated hotkey changes colour to
green, as shown.
These hotkeys perform the following operations:
Software Manual 1300.7462.42 - 10 22
Page 25

R&S FS-K92/93/94 Table of Contents
REFRE SH
The REFRESH hotkey updates the current measurement results with respect to the
current gate settings.
The REFRESH hotkey is only available for measurement results which are affected
by the gate settings (Spectrum FFT, PVT and CCDF). The REFRESH hotkey only
becomes available when the gate settings are modified after a measurement result
has been obtained.
SCREE N [A|B ]
The SCREEN [A|B] hotkey selects the specified screen as the active screen.
In full screen mode pressing the SCREEN [A|B] hotkey will display the specified screen.
After Pressing the SCREEN [A|B] hotkey the label displayed in the hotkey is changed
e.g. after pressing the SCREEN A hotkey the label of the hotkey is changed to
SCREEN B. The label indicates which screen will become the active screen after the
hotkey is pressed.
Navigation
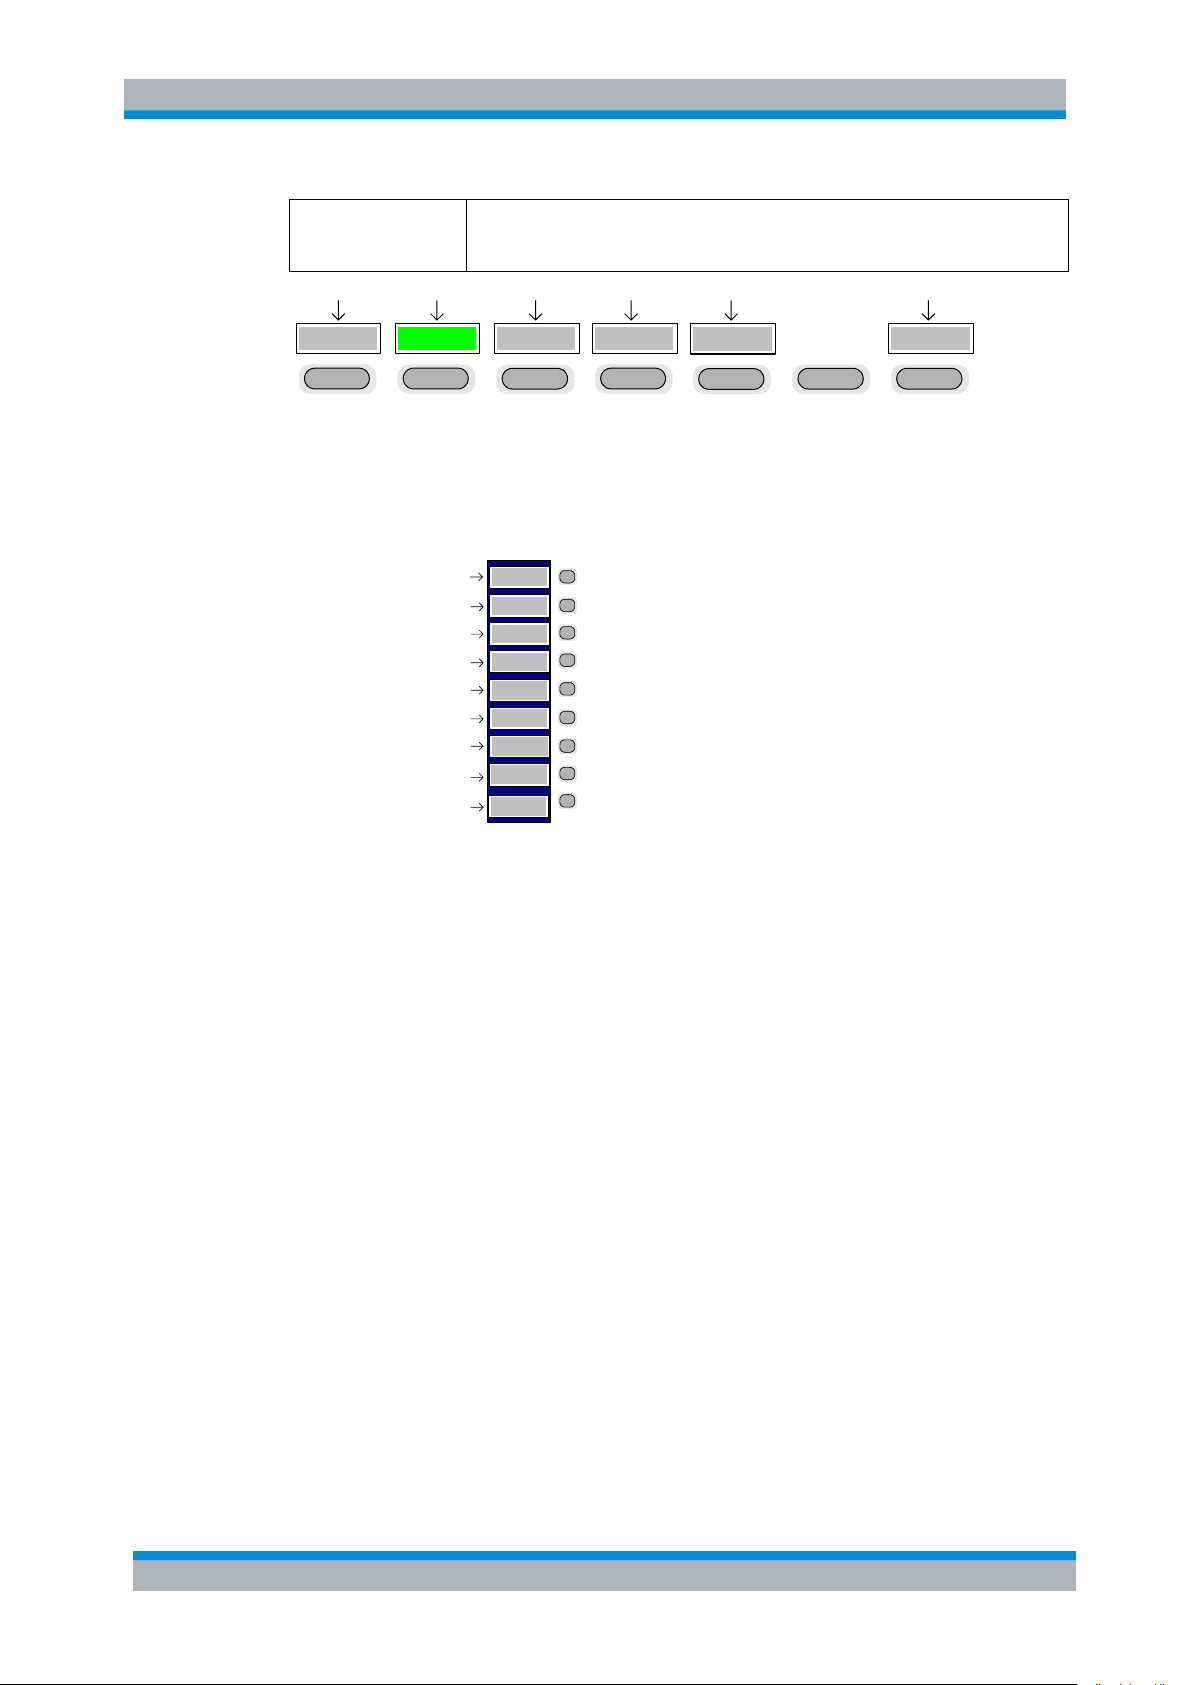
1.6.2 Softkeys
1.6.2.1 Settings Softkeys
The softkeys are assigned to the nine keys on the right-hand side of the display. These
enable quick access to all of the parameter settings and measurement screens of the
R&S FSQ-K92/K93/K94 option. Each of the top two softkeys, when pressed, brings up
a settings view for a group of parameters. These softkeys are always available (except
when using Save/Recall and Print manager or controlling markers) and are as follows:
Fig. 7 Main Softkeys
Each of these groups of settings is described in detail in the Measurements & Settings
section of this manual.
Software Manual 1300.7462.42 - 10 23
Page 26
R&S FS-K92/93/94 Table of Contents
SOFTKEY
LABEL 5
SOFTKEY
LABEL 6
SOFTKEY
LABEL 1
SOFTKEY
LABEL 2
SOFTKEY
LABEL 4
SOFTKEY
LABEL 3
Softkey active (green)
Softkey disabled => function not available
(without 3D Frame)
No softkey available
Softkey available (normal state)
SOFTKEY 8
VAL2
VAL1
SOFTKEY
LABEL 7
Toggle s oftkey (current value of parameter
highlighted in green)
So f tke y a c ti v e a n d dia l og
displayed (red)
FREQ Hardkey
When the FREQ hardkey is pressed the General Settings view is displayed (if it is not
already being displayed) and the Frequency parameter is selected.
Navigation
1.6.2.2 Other Softkeys
All other softkeys have different functions depending on the instrument state.
Therefore, the labels (text) on the softkeys will vary to reflect their current function. The
state of the softkeys is indicated by different appearances and colours, as follows:
Fig. 8 Setup of the softkey area
A softkey in its normal state, where its function is available, is coloured grey with a 3D border.
A softkey that is disabled, because its function is not available, is coloured grey without
a 3D border. Softkeys may become disabled because of the state of the instrument or
because other settings disable the function associated with the softkey.
An active softkey (highlighted in green) is used when the softkey selects an item or
view. For example, the GATE SETTINGS softkey will be highlighted green when the
Gate Settings pop-up dialog is displayed.
A toggle softkey is used to change the value of a parameter that has only two states.
Each press of the softkey toggles the value of the parameter. The current parameter
value is highlighted in green in the lower half of the softkey label. For example, in the
measurement results view, the DISPLAY softkey will have either LIST or GRAPH
highlighted in green depending on whether the results are currently displayed as a list
of measurement points or graphical trace(s).
When no function is assigned to a softkey then no softkey label will be shown.
1.6.3 Hardkeys
Hardkeys allow quick access to the desired parameter and various functions. The
hardkeys supported by the R&S-FSQ-K92/K93/K94 option are as follows (other
hardkeys do nothing):
Software Manual 1300.7462.42 - 10 24
Page 27

R&S FS-K92/93/94 Table of Contents
AMPT Hardkey
When the AMPT hardkey is pressed the General Settings view is displayed (if it is not
already being displayed) and the relevant Signal Level parameter for the selected
signal input is selected.
MKR Hardkey
When the MKR hardkey is pressed the main Marker softkey menu is displayed (if it is
not already being displayed).
MKR-> Hardkey
When the MKR-> hardkey is pressed the Marker extension softkey menu is displayed
(if it is not already being displayed).
SWEEP Hardkey
When the SWEEP hardkey is pressed the General Settings view is displayed (if it is
not already being displayed) and the Capture Time parameter is selected.
MEAS Hardkey
When the MEAS hardkey is pressed the Main softkey menu is displayed (if it is not
already being displayed).
TRACE Hardkey
When the TRACE hardkey is pressed the General Settings view is displayed (if it is not
already being displayed) and the Burst Count parameter is selected.
LINES Hardkey
When the LINES hardkey is pressed the Limit Lines softkey menu is displayed (if it is
not already being displayed) and the first limit in the results summary is selected. Note
this hard-key only functions when the results summary is displayed
DISP Hardkey
When the DISP hardkey is pressed the Display softkey menu is displayed (if it is not
already being displayed).
FILE Hardkey
When the FILE hardkey is pressed, the Save & Recall softkey menu is displayed,
allowing the save & recall of settings and/or measurement results of the R&S FSQK92/K93/K94 option.
PRESET Hardkey
When the PRESET hardkey is pressed the R&S FSQ-option is exited and a preset will be
performed. Note that all options (including R&S FSQ-K92/K93/K94) shall also be preset.
HCOPY Hardkey
When the HCOPY hardkey is pressed the print manager softkey menu is displayed,
allowing selection of the items to be printed.
Number keys 0 to 9
Decimal point (“.”)
Inserts a decimal point “.” at the cursor position.
Minus key
Changes the sign of the mantissa or exponent of a numeric parameter. A “-“ is
inserted at the cursor position in the case of an alphanumeric parameter.
ESC key
Aborts the entry before it has been terminated. The previous value is restored.
Closes the entry field after termination of input.
Closes pop-up dialogs.
ENTER key
Terminates the input of dimension quantities. The new value is set.
Invokes the input of parameters or immediately sets the new value.
Selects the highlighted item in drop-down menus.
Left and Right Cursor
Keys are used to:
Navigate between individual parameters within the setting views and some of the
pop-up dialogs.
Navigate between the individual items within drop-down menus.
Move the cursor left & right inside the entry window to reach a particular position in
the string during alphanumeric entry.
Up and Down Cursor
keys are used to:
Navigate between individual parameters within the setting views and some of the
pop-up dialogs.
Navigate between the individual items within drop-down menus.
Increment or decrement the value of a parameter during numeric entry.
Navigation
1.6.4 External Keyboard
The external keyboard is optional. The keys on the external keyboard that can be used
to interact with the R&S FSQ- option are as follows:
Software Manual 1300.7462.42 - 10 25
Page 28
R&S FS-K92/93/94 Table of Contents
CTRL keys
Used to activate hotkeys. Each of the seven hotkeys is allocated a different
function (F) key. To access these hotkeys press CTRL and the corresponding F
key together (see Fig. 9):
SCREE N BRUN SG L
RUN CO NT
AUTO L VLNOISESPECT RUM
CTRL + F1 CTRL + F2 CTRL + F3 CTRL + F4 CTRL + F5 CTRL + F7
SOFTKEY 8
SOFTKEY 1
SOFTKEY 2
SOFTKEY 4
SOFTKEY 3
SOFTKEY 5
SOFTKEY 6
SOFTKEY 9
F1
F7
F6
F5
F4
F3
F2
F8
F9
SOFTKEY 7
Navigation
Fig. 9 Quick Access to Hotkeys
Function Keys
Used to activate softkeys. Each of the nine softkeys is allocated a different function (F)
key. To access these softkeys the corresponding F key, as shown below:
Fig. 10 Quick Access to Hotkeys
1.6.5 Mouse
The mouse can be used to select individual parameters within the settings views or
data entry dialogs and to activate hotkeys and softkeys. It can also be used to select
values from a drop-down list.
1.6.6 Selecting & Editing Parameters
Parameters are set either by numeric or alphanumeric entry or by simple selection
from a list of possible values (a drop-down list is used to select an “enumerated” value)
or by using checkboxes to turn a parameter setting on and off.
In all cases, the parameter has to be selected by placing focus on it and then editing
has to be enabled before its value can be changed.
The rollkey and cursor keys on the front panel are provided for navigation and
selection of parameters.
The numeric keypad, rollkey and cursor keys on the front panel and an external
keyboard (optional) are provided for the entry of parameter values.
Software Manual 1300.7462.42 - 10 26
Page 29
R&S FS-K92/93/94 Table of Contents
mV
0
1 2
3
4
5 6
7
8 9
.
-
EN TER
O K
ESC
CANCEL
G Hz
MHz
kH z
Hz
-dBm
dBm
dB
dB..
BACK
s
V
ms
mV
µs
µV
ns
nV
Navigation
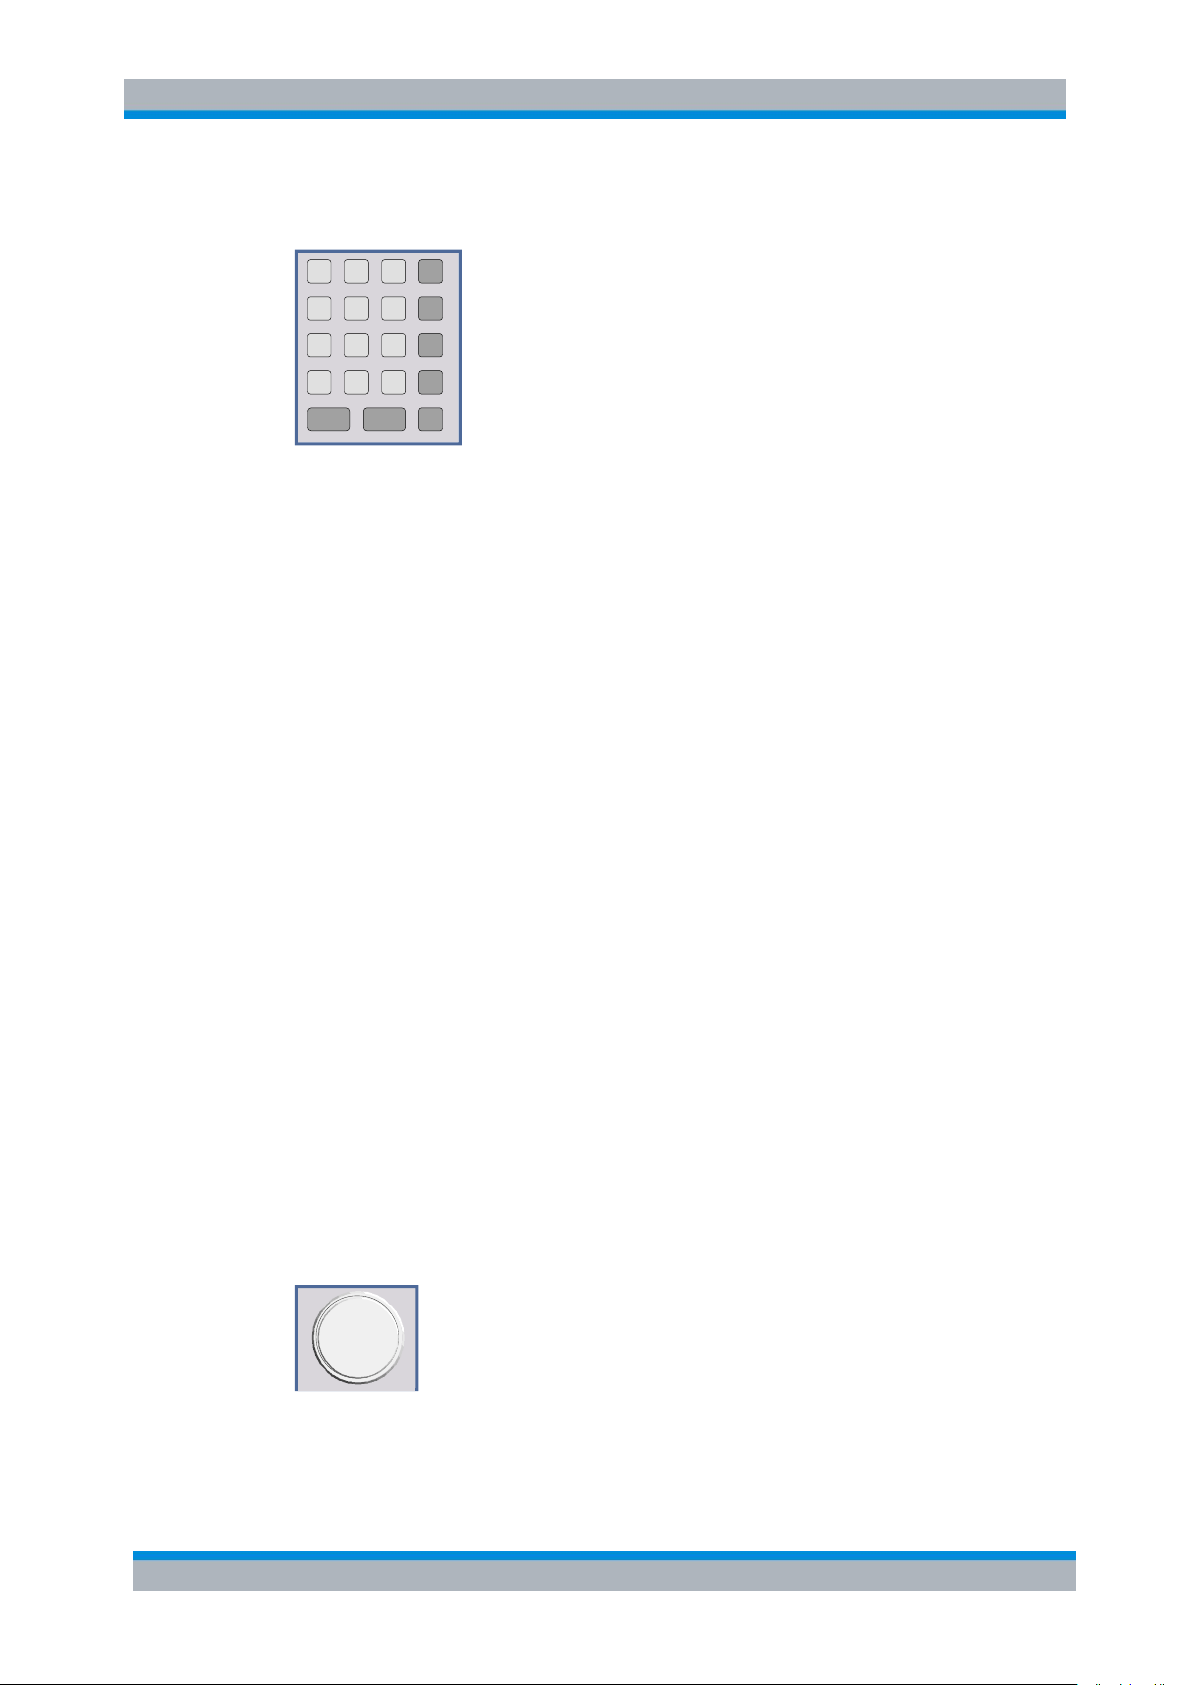
1.6.6.1 Numeric Keypad
The numeric keypad is provided for entry of numeric parameters. It contains the
following keys:
● Number keys 0 to 9
Starts editing of the selected parameter. This enables a new value to be entered for
a parameter directly without having to press ENTER first. The digit will be
displayed as the first digit of the newly entered value.
Inserts a digit at the cursor position when editing an alphanumeric parameter.
● Decimal point
Inserts a decimal point “.” at the cursor position.
● Sign key (“-“)
Changes the sign of the mantissa or exponent of a numeric parameter. A “-“ is
inserted at the cursor position when editing an alphanumeric parameter.
● Unit keys (GHz/-dBm, MHz/dBm, kHz/dB and Hz/dB)
● Provides the numeric value entered with the selected unit and sets the parameter
to that value.
The unit keys are all assigned the value “1” for dimensionless quantities or for level
entries (e.g. in dB). The unit keys thus assume the function of an ENTER key.
● BACK key
Deletes the character to the left of the cursor with alphanumeric entry.
● ESC/CANCEL key
Aborts the entry of a new parameter value. The previous value is restored.
● Closes pop-up dialogs.
● ENTER key
Enables editing of the selected parameter (using numeric keys or rollkey).
Finishes the editing of a parameter value. The new value is set.
For an alphanumeric value, the new value is set to that displayed (using the
current unit if applicable).
● In a drop-down menu, the parameter is set to the currently selected value in the list.
1.6.6.2 Rollkey
The rollkey has various functions:
● In a settings view, the rollkey can be used to navigate between individual
Software Manual 1300.7462.42 - 10 27
Page 30

R&S FS-K92/93/94 Table of Contents
Image Rejection 0 dB
Navigation
parameters (the parameter selected being highlighted).
● In drop-down menus, the rollkey can be used to navigate between the individual
values for the parameter.
● During numeric entry, the parameter is incremented (by turning clockwise) or
decremented (by turning counter-clockwise) at a defined step size (depending on
the parameter).
● In setting views and data entry dialogs pressing the rollkey invokes the input of
parameters or immediately sets the new value, i.e. pressing the rollkey is like
pressing the ENTER key.
● In drop-down menus, pressing the rollkey selects the relevant item.
1.6.6.3 Cursor Keys
The keys and are used to:
● Navigate between individual parameters within the setting views and some of the
pop-up dialogs.
● Navigate between the individual values within drop-down menus.
● Move the cursor left & right inside the entry window to reach a particular position in
the string during alphanumeric entry.
The keys and are used to:
● Navigate between individual parameters within the setting views and some of the
pop-up dialogs.
● Navigate between the individual items within drop-down menus.
● Increment or decrement the value of a parameter during numeric entry.
1.6.6.4 Selection of a parameter within a settings view
Selection using rollkey
1. Press SET FREQ softkey for example (Frequency settings view is displayed).
2. Rotate the rollkey until reaching the required parameter.
Turning the rollkey clockwise selects parameters in the upward direction, turning it
counter-clockwise selects parameters in the downward direction.
Example: Selecting Image Rejection (Frequency settings)
Software Manual 1300.7462.42 - 10 28
Page 31

R&S FS-K92/93/94 Table of Contents
When the Image Rejection parameter is selected its label is highlighted blue.
ENTER
OK
Mode Direct
Mode Direct
Fixed IF, LO = abs(RF - IF)
Fixed IF, LO = RF + IF
Fixed LO, IF = RF + LO
Fixed LO, IF = abs(RF - LO)
Direct
When ENTER is pressed, a drop-down menu is displayed, which contains all the
available settings to which the Mode parameter can be set.
Navigation
When the desired parameter is reached press the rollkey to edit the parameter.
Selection using cursor keys
3. Cursor , , or until obtaining the required parameter.
Within a list of parameters, the Down and Right both move to the next item (down)
in the list and the Up and Left keys both move to the previous item (up) in the list.
Within a table of parameters, the cursor keys move the cursor in the direction
indicated.
4. To start editing the parameter, either press the ENTER key on the numeric keypad,
or press the rollkey.
5. For numeric parameters, editing can also be started by entering the new value
directly from the numeric keypad without pressing the ENTER key first.
Example: Selecting Mode (Frequency settings)
Selection using mouse
1. Use the mouse to move the cursor to the parameter and press the left mouse
button to select the parameter.
2. To start editing the parameter, either press the ENTER key on the numeric keypad,
or press the rollkey.
For numeric parameters, editing can also be started by entering the new value
directly from the numeric keypad without pressing the ENTER key first.
Selection using external keyboard
1. Select parameter using the cursor keys (in the same way as using the cursor keys
on the front panel).
2. To start editing the parameter, either press the ENTER key on the numeric keypad,
or press the rollkey.
Software Manual 1300.7462.42 - 10 29
Page 32

R&S FS-K92/93/94 Table of Contents
2
0
0
MHz
dBm
IF Frequency 200 MHz
The parameter is not set to the new value until either one of the unit keys on the
numeric keypad, the ENTER or the rollkey is pressed.
IF Frequency 100 MHz
Navigation
For numeric parameters, editing can also be started by entering the new value
directly from the numeric keypad without pressing the ENTER key first.
Entry of a numeric value
Once a parameter has been selected (see above), a new value for a numeric parameter
can be entered in a number of ways. With the exception of entry via the number keys, to
start editing the parameter, either press the ENTER key on the numeric keypad, or press
the rollkey before following the instructions below.
If an error occurs, for example, the entered value is out of range, then the new value
will not be accepted for the parameter setting.
Entry using number keys (numeric keypad)
► Enter required value using the number keys.
Example: To enter 200 MHz
If the new value is not valid, then a message box is displayed and the entered
value will be replaced with a valid value. For example, when a value above the
maximum allowed is entered, then the maximum value allowed will be shown in the
entry box. The parameter will still be ready for editing so that another value can be
entered if desired.
Entry using cursor keys
► Cursor or until obtaining the required value.
The application prevents the minimum and maximum values of the parameter from
being exceeded and displays an “Out of range“ message box if attempted.
N.B The cursor keys increment/decrement a parameter value in large steps.
Example: Cursor down to 100MHz
Software Manual 1300.7462.42 - 10 30
Page 33

R&S FS-K92/93/94 Table of Contents
Each change of the parameter value takes place immediately. No other keys need to
be pressed.
IF Frequency 200 MHz
Each change of the parameter value takes place immediately. No other keys need to
be pressed.
Pop-up dialogs, where used, do not close automatically. They can be closed by
pressing the ESC key.
Navigation
Entry using rollkey
1. Rotate the rollkey until reaching the required value.
2. Turning the rollkey clockwise increases the value, turning it counter clockwise
decreases the value.
The application prevents the minimum and maximum values of the parameter from
being exceeded and displays an “Out of range“ message box if attempted.
N.B The rollkeys increment/decrement a parameter value in small steps.
Example: Rotate to 200MHz
Entry using external keyboard
► Enter value using number keys 0 – 9 in the same way as for using the number
keys on the numeric keypad (see above).
Terminating the entry
1. Press one of the unit keys on the numeric keypad.
The unit is entered in the parameter’s edit box and the new parameter value is set
immediately.
2. Press the ENTER key (on numeric keypad or external keyboard) or press the
rollkey.
The new parameter value is set immediately.
In both cases, if the new value is not valid, then a message box is displayed and the
entered value will be replaced with a valid value. For example, when a value above the
maximum allowed is entered, then the maximum value allowed will be shown in the
entry box. The parameter will still be ready for editing so that another value can be
entered if desired.
Software Manual 1300.7462.42 - 10 31
Page 34

R&S FS-K92/93/94 Table of Contents
When the rollkey or ENTER is pressed, a drop-down menu is displayed, which
contains all the available settings that may be selected for the parameter.
Currently selected setting of the parameter is highlighted blue.
Pressing ENTER sets the new setting of the parameter immediately.
Currently selected setting of the parameter is highlighted blue.
Pressing the rollkey sets the new setting of the parameter immediately.
Navigation
Correcting the entry
3. Position the cursor to the right of the digit which is to be deleted using the cursor
keys or .
4. Press the BACK key. The digit to the left of the cursor is deleted.
5. Enter new digits. Each digit is inserted to the left of the cursor, the other digits are
shifted right.
Aborting the entry
6. Press the ESC key during parameter editing.
The original parameter value is restored. The new entry is deleted.
7. If a pop-up dialog is displayed, press the ESC key again.
The entry window is closed, the original value remains active.
1.6.6.5 Entry of an enumerated value
Once a parameter has been selected (see above), a new value for an enumerated
parameter can be entered in a number of ways. To start editing the parameter, either
press the ENTER key on the numeric keypad, press the rollkey or left click with the
mouse on the drop down button before following the instructions below.
Selection of setting using cursor keys
1. Cursor or until obtaining the required setting.
2. Press ENTER on external keyboard or numeric keypad, or press rollkey to select
the desired setting of parameter.
Selection of setting using rollkey
1. Rotate the rollkey until reaching the required setting.
2. Press rollkey to select setting.
Example: Select Mode parameter.
Software Manual 1300.7462.42 - 10 32
Page 35

R&S FS-K92/93/94 Table of Contents
ENTER
OK
press
The checkbox is empty when the settings is Off.
ENTER
OK
Navigation
Selection of setting using mouse
► When the parameter is selected and ready for editing, select a new setting using
the mouse by left-clicking on the new setting from the drop-down list. The new
setting of the parameter is set immediately.
Selection of setting using external keyboard
1. Select setting using cursor keys.
2. Press ENTER to set the parameter to the new value.
1.6.6.6 Entry of a checkbox
A checkbox is used for parameter settings that are either On or Off (Boolean settings).
A checkmark () appears in the box when the setting is On; the checkbox is empty
when the setting is Off.
Once a parameter has been selected (see above), a new value for a Boolean
parameter can be entered in a number of ways. Because Boolean parameters are very
simple, it is not necessary to press the ENTER key on the numeric keypad or to press
the rollkey in order to edit them.
Toggle between the two states of a checkbox using rollkey
► Press the rollkey to toggle between the two states.
Example: Turn 2nd Stage Correction setting to Off
Toggle between the two states of a checkbox using numeric keypad
► Press the ENTER key to toggle between the two states.
Example: Turn 2nd Stage Correction setting to On
Toggle between the two states of a checkbox using a mouse
► Left-click on the checkbox to toggle between the two states.
Software Manual 1300.7462.42 - 10 33
Page 36

R&S FS-K92/93/94 Table of Contents
MIN:<XX.XX> MAX:<XX.XX>
Navigation
Toggle between the two states of a checkbox using external keyboard
► Press ENTER to toggle between the two states.
1.6.7 Status Bar & Title Bar
1.6.7.1 Title Bar
The title bar is visible at the very top of the display when R&S FSQ-K92/K93/K94 is
active and no settings views are displayed.
Fig. 11 Title Bar
The centre of the title bar shows the WiMAX standard applicable to the current
measurement.
1.6.7.2 Status Bar
The main status bar is displayed at the bottom of the display, just above the hotkeys.
When a parameter in a settings view is selected, the status bar will display the
minimum and maximum, settings for the selected parameter (see Fig. 12).
Fig. 12 Status Bar
When a parameter whose value is enumerated or Boolean in type is selected in any
dialog, the status bar will show “N/A“ displayed for the minimum and maximum, since
the minimum and maximum values are “Not Applicable.”
At other times, the status bar shows the current measurement status along with
detailed information about the progress through any running measurement.
The status bar is also used to display warning and error messages to the user. In order
to highlight these messages, warning messages are displayed with a blue background
and error messages with a red background. Refer to Section 6 for a list of warning and
error messages.
Software Manual 1300.7462.42 - 10 34
Page 37

R&S FS-K92/93/94 Table of Contents
● Current Settings
All user settings provided by R&S FSQ-K92/K93/K94
● WIMAX Results
All current trace and table results
● User Limits
All limit lines and table limit values.
● IQ Data
Allows the raw IQ trace results to be stored. When recalled the
data is reprocessed to generate results
Save/Recall
1.7 Save/Recall
This section of the user manual describes the Save/Recall facility of the option.
FILE
The FILE hardkey brings up the Save/Recall softkey menu. Any settings views on
display when the save/recall softkey menu is displayed shall be closed.
Fig. 13 Save/Recall softkey menu
The save/recall facility provided by R&S FSQ-K92/K93/K94 is exactly the same as that
provided by the host analyzer. Refer to the user manual for the spectrum analyzer for
details of the save/recall facility operation.
The save/recall facility in R&S FSQ-K92/K93/K94 provides the following items that can
be saved and/or recalled:
To close the save/recall softkey menu and return to the main R&S FSQ-K92/K93/K94
softkey menu, press the WIMAX hotkey.
Software Manual 1300.7462.42 - 10 35
Page 38

R&S FS-K92/93/94 Table of Contents
Printing
1.8 Printing
This section of the user manual describes print facility of the option.
The HCOPY hardkey brings up the print softkey menu. Any settings views on display
when the print softkey menu is displayed shall be closed.
Fig. 14 Print softkey menu
PRINT SCREEN
The PRINT SCREEN softkey prints the top header and displayed measurement
traces. If the table size exceeds the screen size (e.g. the Spectrum Mask and
Spectrum ACP), only the visible part of the table is printed.
Printing the entire table is done via the PRINT TABLE softkey.
Remote: HCOP:ITEM:ALL
PRINT TRACE
The PRINT TRACE softkey prints the displayed measurement traces only.
Remote: HCOP:ITEM:WIND:TRAC:STAT ON
Software Manual 1300.7462.42 - 10 36
Page 39

R&S FS-K92/93/94 Table of Contents
Printing
PRINT TABLE
The PRINT TABLE softkey prints the Results Display Table only unless the displayed
trace has its own results table (e.g. Spectrum ACP and Spectrum Mask). In this case
the entire results table is printed.
Remote: HCOP:ITEM:WIND:TABLe:STAT ON
The print facility provided by R&S FSQ-K92/K93/K94 is exactly the same as that
provided by the host analyzer. Refer to the user manual for the spectrum analyzer for
details of the print facility operation.
To close the print softkey menu and return to the main R&S FSQ-K92/K93/K94 softkey
menu, press the WIMAX hotkey.
Software Manual 1300.7462.42 - 10 37
Page 40

R&S FS-K92/93/94 Table of Contents
Measurements
2 Measurements & Settings
This section contains a detailed description of all measurement modes, settings &
results. It covers the following subjects:
● Measurement modes
● Running measurements
● Measurement results
● General settings
● Demodulation settings
● Gate settings
● Marker settings
● General hints about measurements
2.1 Measurements
This section contains a detailed description of all measurement modes, settings &
results. It covers the following subjects:
● Measurement modes
● Running measurements
● Measurement results
● General settings
● Demodulation settings
● Gate settings
● Marker settings
● General hints about measurements
R&S FSQ-K92/K93/K94 provides two main measurement types:
● IQ Measurements
● Frequency Sweep Measurements
2.1.1 IEEE 802.16e-2005 SISO- and MIMO-OFDMA/WiBro Measurements
Important Note: For the current restrictions to the application and the measurements
provided with a firmware release check the corresponding firmware release notes!
Software Manual 1300.7462.42 - 10 38
Page 41

R&S FS-K92/93/94 Table of Contents
4
5
Measurements
2.1.1.1 Current restrictions to the IEEE802.16e-2005 OFDMA, WiBro Signal to be
analyzed4
3. Standard
IEEE 16-2004, 1. Oct. 2004;
IEEE 16e-2005 and IEEE 16-2004/Cor1-2005, 28. Feb. 2006.
IEEE 16e-2005 and IEEE 16-2004/Cor1-2005, 28. Feb. 2006 based WiBro.
IEEE 16-2004/Cor1-2005, IEEE 16e-2005 based WiBro.
P802.16Rev2/D3 (February 2008)
4. FFT sizes
The FFT sizes 128, 512, 1024 and 2048 are supported.
5. Subframes
a. Either a DL-Subframe or a UL-Subframe can be analyzed at one point in time by
ticking the corresponding Zone/Segment in ‘Frame Config|Zone/Segment List|Analyze’
column. The application assumes the Zone/Segment to be analyzed being available in
the signal! Otherwise the measurement results will be bad or the application won’t
synchronize. In Frame Config the complete frame DL and UL can be defined.
b. The first UL-PUSC zone of the UL-Subframe is supported. In case each UL-zone
defined in Frame Config contains power, each defined UL-zone can be analyzed.
6. Currently supported frame structure and specific allocations.
The UL-control region5 is adjustable from 0,3,6,…,30 OFDMA Symbols.
The analysis of a rectangular DL-subframe HARQ allocation is supported. The
HARQ allocation must completely be occupied by a single modulation format.
The analysis of CQICH allocations according to the figure above is supported, in
For the current restrictions to the MIMO-OFDMA and MIMO-WiBro analysis see the corresponding release
notes.
The UL-control region is defined by the first n OFDMA Symbols of the first UL-zone using all subchannels.
Software Manual 1300.7462.42 - 10 39
Page 42

R&S FS-K92/93/94 Table of Contents
Measurements
case the UL-CQICH bursts and UL-data bursts use the same boosting value.
7. Auto demod for signals using normal DL-MAP and compressed DL-MAP is
supported. Exclusively the DL zones being available in the Frame Config | Zone
field are supported by auto demod. Assuming a valid DL-MAP according to the
WiMAX standard.
8. DL Subframes length:
The signal to be analyzed must contain at least two OFDMA data symbols. More
OFDMA data symbols will improve the accuracy of the measurement results.
9. UL Subframe length:
The signal to be analyzed must contain at least three OFDMA data symbols [1 slot].
More OFDMA data symbols will improve the accuracy of the measurement results.
2.1.1.2 IEEE802.16e-2005 SISO-OFDM, SISO- and MIMO-OFDMA/WiBro Scalar Measurement Results
For these measurement results, the minimum, mean and maximum is taken over the
analyzed zones of the current capture buffer content.
● BER Pilots (SISO- and MIMO-OFDMA/WiBro)
Deviation of the measured pilots from the expected pilots according to the standard
in percent. Not available in UL with Demod Settings | Pilots for Tracking =
According to Standard.
Accuracy measurements
● Center Frequency Error
Difference between measured and reference center frequency
● Symbol Clock Error
Difference between measured and reference symbol clock relative to the system
sampling rate.
EVM measurements
● EVM Data and Pilots
EVM over Data and Pilot Symbols for the analyzed zone or the analyzed segment.
● EVM Data
EVM over Data Symbols for the analyzed zone or the analyzed segment.
● EVM Pilots
EVM over Pilot Symbols of the analyzed zone or the analyzed segment.
● EVM Preamble (SISO- and MIMO-OFDMA/WiBro).
● Unmodulated Subcarrier Error (SISO-OFDMA/WiBro)
Accumulated power of the unmodulated subcarriers relative to the accumulated
power of the modulated subcarriers.
See IEEE Std 802.16e-2005 section “8.4.12.3.4 Unmodulated subcarrier errors for SS”.
IQ constellation measurements
● IQ Offset
Power at spectral line 0 normalized to the total transmitted power.
Software Manual 1300.7462.42 - 10 40
Page 43

R&S FS-K92/93/94 Table of Contents
1024
3/852
10log1010log10
PreambleFD,PreambleFD,PreambleTD,
P
N
N
PP
FFT
used
FFT
N
FFT
N
FFT
N
Measurements
● Gain Imbalance
Logarithm or percentage figure of the Q-Channel to I-Channel gain ratio.
● Quadrature Error
Measure of the phase angle between Q-Channel and I-Channel deviating from the
ideal 90 degree.
Power measurements (SISO-OFDM)
● Burst Power
Statistic over the burst power of the analyzed bursts.
● Crest Factor
Statistic over the peak to average power ratio of the analyzed bursts.
Power measurements for Result Summary of Analyzed Subframes (SISO- and
MIMO-OFDMA/WiBro)
● TD Power DL Preamble
Time domain power of the DL Preamble. I.e. a zero span measurement over the
DL preamble will give the corresponding measurement result.
● TD Power Subframe
Time domain power of the subframe [excluding the DL Preamble in case of DL].
I.e. a zero span measurement over the subframe will give the corresponding
measurement result.
● TD Power Zone
Time domain power of the zone to be analyzed. I.e. a zero span measurement
over the zone will give the corresponding measurement result.
● Crest Factor
Peak to average power ratio of the analyzed zone.
Power measurements for Result Summary of Analyzed Zone/Segment (SISO-
and MIMO-OFDMA/WiBro)
● Power DL Preamble
Power of the Preamble corresponding to the Zones/Segments to be analyzed.
Relation between the TD Power DL Preamble and the FD Power DL Preamble
measurement results:
in case
=1024 and on segment being used.
● Power Data and Pilots
Weighted average – according to the used number of subcarriers – between the
‘Power Data’ and ‘Power Pilots’ results.
● Power Data
Average power of the subcarriers belonging to the data parts of the zone weighted
with
.
● Power Pilots
Average power of the pilots belonging to the zone weighted with
.
Software Manual 1300.7462.42 - 10 41
Page 44

R&S FS-K92/93/94 Table of Contents
Measurements
● Power Null Pilots (MIMO-OFDMA/WiBro)
For a MIMO Tx antenna signal specific pilot positions are unused, because they
are used by the complementary Tx antennas. Power Null Pilots is the power of the
unused pilot positions.
RSSI and CINR measurements
● RSSI
The Received Signal Strength Indicator is an estimate of the total received power
of the DL preamble.
Note the TD Preamble Power from the Result Summary deviates from the RSSI
because the RSSI uses the mean over absolute amplitudes. The preamble power
in contrary uses the mean over squared absolute amplitudes.
● RSSI Standard Deviation
Standard deviation of the RSSI result.
● CINR
Carrier Interference Noise Ratio is the ratio of the signal power and the noise
power for the DL Preamble Symbol. See also section “Measurements in Detail”.
● CINR Standard Deviation
Standard deviation of the CINR result.
2.1.1.3 IEEE802.16e-2005 SISO-OFDM, SISO- and MIMO-OFDMA/WiBro Graphical Measurement Results
Power vs Time measurements
● Capture Buffer
Power profile of the capture buffer data being analyzed
● Full Subframe
min mean max power profile of the subframe containing the zone to be analyzed.
● Rising / Falling
min mean max profile of the rising respective falling edge of the subframe
containing the zone to be analyzed.
EVM measurements
● EVM vs Symbol ALL
EVM versus the symbols of the analyzed zone. In case the capture buffer contains
more than one analyzed zones, the corresponding result graphs will be appended.
The min mean max statistics is performed over carriers.
● EVM vs Carrier ALL
EVM versus physical carriers. The min mean and max statistics is performed over
the symbols of all analyzed zones in the capture buffer.
● Error Freq / Phase (SISO-OFDM and SISO-OFDMA/WiBro)
Relative Frequency Error vs Sample, and Phase Error vs Sample. The Frequency
Error vs Sample measurement is relative to the Center Frequency Error.
Software Manual 1300.7462.42 - 10 42
Page 45

R&S FS-K92/93/94 Table of Contents
Measurements
Spectrum Measurements
● Spectrum Flatness
Average energy of the constellations for the physical carriers. The limit lines are
displayed according to the requirements of the standard. The min mean and max
statistic is performed over the analyzed zones in the capture buffer.
● Spectrum Flatness Difference
Absolute difference of adjacent carriers. The limit lines are displayed according to
the requirements of the standard. The min mean and max statistic is performed
over the analyzed zones in the capture buffer.
● Preamble Channel Frequency Response: Phase
● Group Delay
● Spectrum Mask
Spectrum Emission Mask measurement according to the IEEE / ETSI standard, or
user defined configuration.
IEEE 802.16-2004 section “8.5.2 Transmit spectral Mask”.
ETSI EN 301 021 V1.6.1 (2003-07). Fixed radio systems; point-to-multipoint
equipment; time division multiple access (TDMA); Point-to-multipoint digital radio
systems in frequency bands in the range 3 GHz to 11 GHz
● Spectrum ACP ABS/REL
● Spectrum FFT
Constellation Measurements
● Constellation Diagram
Complex Constellation Diagram of the modulation symbols. The modulation
symbols belong to the Bursts of the analyzed zone. The different modulation
formats are assigned unique colors. These colors are also used for the Bitstream
measurement. With the [CONSTELL SELECTION] Softkey it is possible to
suppress unwanted information.
Statistic Measurements
● CCDF Complementary Cumulative Distribution Function
Complementary Probability Distribution for the capture buffer sample exceeding
the average power.
● Bit Stream
The modulation symbols define bit sequences. The mapping is defined in the
standard. The modulation symbols of the bursts from the analyzed zone are
displayed. The different modulation formats are assigned unique colors. These
colors are also used for the Constellation Diagram Measurement. The selection
panel allows select highlight the data the user is interested in.
● Burst Summary
Provides information about the bursts from the analyzed zone. I.e. Modulation of
the burst, Power Boosting information, EVM of the burst. Each analyzed zone will
produce a set of burst results.
Software Manual 1300.7462.42 - 10 43
Page 46

R&S FS-K92/93/94 Table of Contents
MEAS
WIMAX
GENERAL
SETTINGS
PVT
CONSTELL
DEMOD
SETTINGS
DISPLAY
LIST
EVM
SPECTRUM
STATISTIC
SUPPORT
GATING
ON OFF
GATE
SETTINGS
SUPPORT
GATING
ON OFF
GATE
SETTINGS
GENERAL
SETTINGS
DEMOD
SETTINGS
FLATNESS
FLAT GRDEL
FLATNESS
DIFFERENCE
SPECTRUM
MASK
SPECTRUM
FFT
DISPLAY
LIST
ACP
ABS REL
GENERAL
SETTINGS
DEMOD
SETTINGS
DISPLAY
LIST
CONSTELL
CONSTELL
VS CARRIER
CARRIER
SELECTION
GENERAL
SETTINGS
DEMOD
SETTINGS
DISPLAY
LIST
CCDF
BIT
STREAM
GENERAL
SETTINGS
DEMOD
SETTINGS
DISPLAY
LIST
EMV VS
SYMBOL
EMV VS
CARRIER
Y-AXIS/
DIV
ERROR
FREQ PHASE
DEMOD
SETTINGS
DISPLAY
LIST
FULL BURST
START
END
GENERAL
SETTINGS
SEM
SETTINGS
BURST
SELECTION
DISPLAY
GRAPH
BURST
SUMMARY
EXPORT
IMPORT
IMPORT
EXPORT
ACP
SETTINGS
FILE
MANAGER
RECALL
NEW FOLDER
COPY
PASTE
RENAME
DELETE
FILE
SEND TO
SMU
FILE
MANAGER
Measurements
Software Manual 1300.7462.42 - 10 44
Fig. 15 SISO-OFDM menu
Page 47

R&S FS-K92/93/94 Table of Contents
NEW FOLDER
MEAS
WIMAX
GENERAL
SETTINGS
PVT
CONSTELL
DEMOD
SETTINGS
DISPLAY
LIST 1
EVM
SPECTRUM
STATISTIC
SUPPORT
GATING
ON OFF
GATE
SETTINGS
GENERAL
SETTINGS
DEMOD
SETTINGS
DISPLAY
LIST 1
CONSTELL
CONSTELL
SELECTION
GENERAL
SETTINGS
DEMOD
SETTINGS
DISPLAY
LIST 1
CCDF
BIT
STREAM
GENERAL
SETTINGS
DEMOD
SETTINGS
DISPLAY
LIST 1
EMV VS
SYMBOL
EMV VS
CARRIER
Y-AXIS/
DIV
DEMOD
SETTINGS
DISPLAY
LIST 1
FULL
SUBFRAME
RISINGS
FALLING
GENERAL
SETTINGS
FILE
MANAGER
BURST
SUMMARY
BIT
SELECTION
RECALL
COPY
PASTE
RENAME
DELETE
FILE
GENERAL
SETTINGS
DEMOD
SETTINGS
FLATNESS
FLAT DIFF
CHANNEL
PHASE GRDEL
SPECTRUM
MASK
SPECTRUM
FFT
ACP
ABS REL
COPY
ZONE
INSERT
ZONE
NEW
ZONE
NEW
SEGMENT
LIST
ZONE BURST
DELETE
ZONE
FILE
MANAGER
COPY
BURST
INSERT
BURST
NEW
BURST
NEW
SEGMENT
LIST
ZONE BURST
DELETE
BURST
FILE
MANAGER
DISPLAY
LIST 2
DISPLAY
GRAPH
SEND TO
SMU
ERROR
FREQ PHASE
EXPORT
IMPORT
FILE
MANAGER
SUPPORT
GATING
ON OFF
GATE
SETTINGS
EXPORT
IMPORT
ACP
SETTINGS
SEM
SETTINGS
DISPLAY
LIST 1
Measurements
Fig. 16 SISO-OFDMA/WiBro menu
Software Manual 1300.7462.42 - 10 45
Page 48

R&S FS-K92/93/94 Table of Contents
NEW FOLDER
MEAS
WIMAX
GENERAL
SETTINGS
PVT
CONSTELL
DEMOD
SETTINGS
DISPLAY
LIST 1
EVM
SPECTRUM
STATISTIC
SUPPORT
GATING
ON OFF
GATE
SETTINGS
GENERAL
SETTINGS
DEMOD
SETTINGS
DISPLAY
LIST 1
CONSTELL
CONSTELL
SELECTION
GENERAL
SETTINGS
DEMOD
SETTINGS
DISPLAY
LIST 1
CCDF
BIT
STREAM
GENERAL
SETTINGS
DEMOD
SETTINGS
DISPLAY
LIST 1
EMV VS
SYMBOL
EMV VS
CARRIER
Y-AXIS/
DIV
DEMOD
SETTINGS
DISPLAY
LIST 1
FULL
SUBFRAME
RISINGS
FALLING
GENERAL
SETTINGS
FILE
MANAGER
BURST
SUMMARY
BIT
SELECTION
RECALL
COPY
PASTE
RENAME
DELETE
FILE
GENERAL
SETTINGS
DEMOD
SETTINGS
FLATNESS
FLAT DIFF
CHANNEL
PHASE GRDEL
SPECTRUM
MASK
SPECTRUM
FFT
ACP
ABS REL
COPY
ZONE
INSERT
ZONE
NEW
ZONE
NEW
SEGMENT
LIST
ZONE BURST
DELETE
ZONE
FILE
MANAGER
COPY
BURST
INSERT
BURST
NEW
BURST
NEW
SEGMENT
LIST
ZONE BURST
DELETE
BURST
FILE
MANAGER
DISPLAY
LIST 2
DISPLAY
GRAPH
ERROR
FREQ PHASE
EXPORT
IMPORT
FILE
MANAGER
SUPPORT
GATING
ON OFF
GATE
SETTINGS
EXPORT
IMPORT
ACP
SETTINGS
SEM
SETTINGS
DISPLAY
LIST 1
SEND TO SMU
Measurements
Fig. 17 MIMO-OFDMA/WiBro menu
2.1.2 IQ measurements
The following measurements results are obtained in IQ measurement mode:
● Power vs Time (PVT)
● EVM vs Symbol
● EVM vs Carrier
● Phase vs Preamble
● Frequency vs Preamble
● Spectrum Flatness
● Spectrum Group Delay
Software Manual 1300.7462.42 - 10 46
Page 49

R&S FS-K92/93/94 Table of Contents
Measurements
● Spectrum Flatness Adjacent Carrier Power Difference
● Spectrum FFT
● Constellation vs Symbol
● Constellation vs Carrier (IEEE 802.16-2004 SISO-OFDM)
● Complementary Cumulative Distribution Function (CCDF)
● Bit Stream
For each of the above results the Magnitude Capture Buffer display is available.
Fig. 18 Magnitude Capture Buffer Results (SISO-OFDM)
The Magnitude Capture buffer shows the complete range of captured data for the last sweep.
All analyzed bursts are identified with a green bar at the bottom of the Magnitude Capture
buffer. Only those bursts which matched the required criteria are marked with a green bar.
All IQ measurements process the same signal data and as such all IQ measurement
results are available after a single IQ measurement execution.
IQ measurements can be run in split screen mode (allowing both the Magnitude
Capture Buffer Display and the selected IQ measurement results to be displayed
simultaneously) or in full screen mode (with either the Magnitude Capture Buffer
Display or the selected IQ measurement results displayed).
IQ measurements may be performed for RF or Baseband input.
Software Manual 1300.7462.42 - 10 47
Page 50

R&S FS-K92/93/94 Table of Contents
Measurements
2.1.2.1 Power vs Time (PVT)
The PVT measurement results are selected by pressing the PVT softkey in the main
measurement softkey menu.
Fig. 19 PVT Results – Full Burst (SISO-OFDM)
The PVT results display shows measured input data, or over complete bursts
displayed within the gating lines if gating is switched on. The results are displayed as a
single burst.
Remote: CONF:BURS PVT:BUR
SISO-OFDM
FULL BURST
Pressing the FULL BURST softkey displays the results in a single graph with all burst
data being displayed.
Remote: CONF:BURS:PVT:SEL FULL
START END
Pressing the START END softkey displays the results in two separate graphs, the left
hand side showing the start and the right hand side showing the end of a burst.
Software Manual 1300.7462.42 - 10 48
Page 51

R&S FS-K92/93/94 Table of Contents
Measurements
Fig. 20 PVT Results – Start and End (SISO-OFDM)
BURST SELECTION
Pressing the BURST SELECTION softkey displays a pop-up dialog which allows the
burst for data display to be selected.
Remote: CONF:BURS:PVT:SEL EDGE
Software Manual 1300.7462.42 - 10 49
Page 52

R&S FS-K92/93/94 Table of Contents
Measurements
SISO-OFDMA/WiBro
FULL SUBFRAME
Pressing the FULL SUBFRAME softkey displays the results in a single graph with all
subframe data being displayed.
Fig. 21 PVT Results – Full Subframe (SISO-OFDMA/WiBro)
Remote: CONF:BURS:PVT:SEL FULL
Software Manual 1300.7462.42 - 10 50
Page 53

R&S FS-K92/93/94 Table of Contents
The Rx 1 signal is shorter by the Preamble and the first SISO DL-PUSC zone, not
transmitted from antenna 1.
Measurements
MIMO-OFDMA/WiBro
FULL SUBFRAME
Pressing the FULL SUBFRAME softkey displays the results in a single graph with all
subframe data being displayed.
Fig. 22 PVT Results – Full Subframe (MIMO-OFDMA/WiBro)
According to the overall measurement settings field ‘Meas Setup 2 TX x 2 RX’ two RX
path results are available. Therefore two Full Subframe result traces are displayed one
for each Rx Path. The Rx path information for the trace is given in the corresponding
measurement window title bar.
Remote: CONF:BURS:PVT:SEL FULL
Software Manual 1300.7462.42 - 10 51
Page 54

R&S FS-K92/93/94 Table of Contents
Measurements
SISO-OFDMA/WiBro
RSINING FALLING
Pressing the RSINING FALLING softkey displays the results in two separate graphs, the
left hand side showing the start and the right hand side showing the end of a subframe.
Fig. 23 PVT Results – Rising/Falling (SISO-OFDMA/WiBro)
Remote: CONF:BURS:PVT:SEL EDGE
Software Manual 1300.7462.42 - 10 52
Page 55

R&S FS-K92/93/94 Table of Contents
Measurements
MIMO-OFDMA/WiBro
Pressing the RSINING FALLING softkey displays the results in two separate graphs, the
left hand side showing the start and the right hand side showing the end of a subframe.
Fig. 24 PVT Results – Rising/Falling (MIMO-OFDMA/WiBro)
According to the overall measurement settings field ‘Meas Setup 2 TX x 2 RX’ two Rx
path results are available. Therefore two Rising/Falling Subframe result traces are
displayed one for each Rx Path. The Rx path information for the trace is given in the
corresponding measurement window title bar.
Note: The RX 1 signal is shorter by the Preamble and the first SISO DL-PUSC zone,
not transmitted from antenna 1.
Remote: CONF:BURS:PVT:SEL EDGE
Software Manual 1300.7462.42 - 10 53
Page 56

R&S FS-K92/93/94 Table of Contents
Measurements
2.1.2.2 EVM vs Symbol
SISO-OFDM and SISO-OFDMA/WiBro
The EVM vs Symbol measurement results are selected by pressing the EVM softkey in
the main measurement softkey menu followed by the EVM VS SYMBOL Softkey:
Fig. 25 EVM vs Symbol (SISO-OFDM)
The EVM vs Symbol results display shows the EVM measured over the full range of
the measured input data. The results are displayed on a per-symbol basis, with blue
vertical lines marking the boundaries of each burst. Note that burst boundary lines are
only displayed if the number of analyzed bursts is less than 250. The minimum,
average and maximum traces are displayed.
For the trace labelled with EVM a commonly used EVM definition is applied, which is the
square root of the momentary error power normalized by the averaged reference power.
For details of this measurements please refer to chapter 3.
Software Manual 1300.7462.42 - 10 54
Page 57

R&S FS-K92/93/94 Table of Contents
Measurements
MIMO-OFDMA/WiBro
The EVM vs Symbol measurement results are selected by pressing the EVM softkey in
the main measurement softkey menu followed by the EVM VS SYMBOL Softkey:
Fig. 26 EVM vs Symbol (MIMO-OFDMA/WiBro)
According to the overall measurement settings field ‘Meas Setup 2 TX x 2 RX’ two Rx
path results are available. Therefore two EVM vs Symbol result traces are displayed
one for each RX Path. The RX path information for the trace is given in the
corresponding measurement window title bar.
The EVM vs Symbol results display shows the EVM measured over the full range of
the measured input data. The results are displayed on a per-symbol basis, with blue
vertical lines marking the boundaries of each analyzed zone. The minimum, average
and maximum traces are displayed.
For the trace labelled with EVM a commonly used EVM definition is applied, which is the
square root of the momentary error power normalized by the averaged reference power.
For details of this measurements please refer to chapter 3.
Remote: CONF:BURS:EVM:ESYM:IMM
EVM vs Symbol Y Axis
Pressing Y AXIS/ DIV softkey displays a pop-up dialog which allows the settings of the
Y-Axis to be controlled.
Software Manual 1300.7462.42 - 10 55
Page 58

R&S FS-K92/93/94 Table of Contents
Measurements
Fig. 27 EVM vs Symbol - Y-Axis Scaling
Auto Scaling
Auto Scaling specifies whether the Y-Axis scale should be calculated manually or
automatically.
When the Auto Scaling parameter is switched OFF then the setting of the Per Division
setting is used to calculate the Y-Axis scale.
Remote: DISP2:WIN:TAC1:Y:SCAL:AUTO
Per Division
Per Division specifies the scaling is to be used when Auto Scaling is switched OFF.
Remote: DISP2:WIN:TRAC1:Y:SCAL:PDIV
Unit
Unit allows Y-Axis unit to be specified.
Remote: DISP:TABL:UNIT PCT
Software Manual 1300.7462.42 - 10 56
Page 59

R&S FS-K92/93/94 Table of Contents
Measurements
2.1.2.3 EVM vs Carrier
SISO-OFDM and SISO-OFDMA/WiBro
EVM vs Carrier
The EVM vs Carrier measurement results are selected by pressing the EVM softkey in
the main measurement softkey menu followed by the EVM vs CARRIER softkey.
Fig. 28 EVM vs Carrier Results (SISO-OFDM)
The EVM vs Carrier results display shows the all EVM values recorded on a per-carrier
basis over the full set of measured data. The minimum, average and maximum traces
are displayed.
The scaling of the Y-Axis can be modified to allow the results to be scaled to an
optimum level.
Remote: CONF:BURSt:EVM:ECAR:IMM
Software Manual 1300.7462.42 - 10 57
Page 60

R&S FS-K92/93/94 Table of Contents
Measurements
MIMO-OFDMA/WiBro
The EVM vs Carrier measurement results are selected by pressing the EVM softkey in
the main measurement softkey menu followed by the EVM vs CARRIER softkey.
Fig. 29 EVM vs Carrier Results (MIMO-OFDMA/WiBro)
According to the overall measurement settings field ‘Meas Setup 2 TX x 2 RX’ two Rx
path results are available. Therefore two EVM vs Carrier result traces are displayed
one for each Rx Path. The Rx path information for the trace is given in the
corresponding measurement window title bar.
The EVM vs Carrier results display shows the all EVM values recorded on a per-carrier
basis over the full set of measured data. The minimum, average and maximum traces
are displayed.
The scaling of the Y-Axis can be modified to allow the results to be scaled to an
optimum level.
Remote: CONF:BURS:EVM:ECAR:IMM
EVM vs Symbol Y Axis
Pressing Y AXIS/ DIV softkey displays a pop-up dialog which allows the settings of the
Y-Axis to be controlled. The settings provided are the same as for the EVM vs Symbol
measurement screen.
Remote: DISP:WIND2:TRAC:Y:SCAL:AUTO ON
DISP:WIND2:TRAC1:Y:SCAL:PDIV 2
Software Manual 1300.7462.42 - 10 58
Page 61

R&S FS-K92/93/94 Table of Contents
Measurements
2.1.2.4 Error vs Preamble (SISO-OFDM) / Error vs Sample (SISO-OFDMA/WiBro)
The Error vs Preamble results are selected by pressing the EVM softkey in the main
measurement softkey menu followed by the ERROR FREQ/PHASE softkey. Subsequent
presses of the ERROR FREQ/PHASE softkey toggle the Error measurement between
Frequency Error vs Preamble and Phase Error vs Preamble.
For SISO-OFDMA/WiBro, the measurement results provided are Frequency Error vs
Sample and Phase Error vs Sample.
Fig. 30 Rel. Frequency Error vs Preamble Results (SISO-OFDM)
Software Manual 1300.7462.42 - 10 59
Page 62

R&S FS-K92/93/94 Table of Contents
Measurements
Fig. 31 Phase Error vs Sample Result (SISO-OFDMA/WiBro).
The Error vs Preamble results display shows the error values recorded over the
preamble part of the burst. A minimum, average and maximum trace are displayed.
The results display either relative frequency error or phase error.
The scaling of the Y-Axis can be modified to allow the results to be scaled to an
optimum level.
Remote: CONF:BURS:PRE:SEL FREQ
CONF:BURS:PRE:IMM
Y AXIS/ DIV
Pressing Y AXIS/ DIV softkey displays a pop-up dialog which allows the settings of the
Y-Axis to be controlled. The settings provided are the same as for the EVM vs Symbol
measurement screen.
Remote: DISP:WIND1:TAC1:Y:AUTO
DISP:WIND1:TRAC1:Y:PDIV
2.1.2.5 Spectrum Flatness
SISO-OFDM
The Spectrum Flatness measurement results are selected by pressing the SPECTRUM
softkey in the main measurement softkey menu followed by the FLATNESS FLAT/GRDEL
softkey. Subsequent presses of the FLATNESS FLAT/GRDEL softkey toggle between the
Spectrum Flatness and the Group Delay measurement.
Software Manual 1300.7462.42 - 10 60
Page 63

R&S FS-K92/93/94 Table of Contents
Measurements
Fig. 32 Spectrum Flatness Results (SISO-OFDM).
The Spectrum Flatness measurement uses the Channel Estimation based on the
‘Demod Settings | CH Est in Preamb & Payload’ selection. A minimum, average and
maximum trace is displayed generated by averaging in time dimension. The upper and
lower limit line, according to the standard, is displayed. Finally the overall pass/fail
status, for the statistic results against these limit lines, is shown.
Remote: CONF:BURS:SPEC:FLAT:SEL FLAT
CONF:BURS:SPEC:FLAT:IMM
2.1.2.6 SISO-OFDM and SISO-OFDMA/WiBro
The Spectrum Flatness measurement result is selected by pressing the SPECTRUM
softkey in the main measurement softkey menu followed by the FLATNESS FLAT/DIFF
softkey. Subsequent presses of the FLATNESS FLAT/DIFF softkey toggle between the
Spectrum Flatness and the Spectrum Flatness Difference measurement.
Software Manual 1300.7462.42 - 10 61
Page 64

R&S FS-K92/93/94 Table of Contents
Measurements
Fig. 33 Spectrum Flatness Results (SISO-OFDMA/WiBro).
The Spectrum Flatness measurement uses the Channel Estimation based on the
‘Demod Settings | Channel Estimation Range’ selection. A minimum, average and
maximum trace is displayed generated by averaging in time dimension. The upper and
lower limit line, according to the standard, is displayed. Finally the overall pass/fail
status, for the statistic results against these limit lines, is shown.
Remote: CONF:BURS:SPEC:FLAT:SEL FLAT
CONF:BURS:SPEC:FLAT:IMM
2.1.2.7 MIMO-OFDMA/WiBro
The Spectrum Flatness measurement results are selected by pressing the SPECTRUM
softkey in the main measurement softkey menu followed by the FLATNESS FLAT/GRDEL
softkey. Subsequent presses of the FLATNESS FLAT/GRDEL softkey toggle between the
Spectrum Flatness and the Group Delay measurement.
Software Manual 1300.7462.42 - 10 62
Page 65

R&S FS-K92/93/94 Table of Contents
Measurements
Fig. 34 Spectrum Flatness Results (MIMO-OFDMA/WiBro).
According to the overall measurement settings field ‘Meas Setup 2 TX x 2 RX’ 2*2
results are available. Therefore four Spectrum Flatness result traces are displayed one
for each Tx->Rx path. The Tx->Rx path information for the result trace is given in the
corresponding measurement window title bar.
The Spectrum Flatness measurement uses the Channel Estimation based on the
‘Demod Settings | Channel Estimation Range Payload’ selection [a MIMO zone isn’t
prefixed by a preamble]. The traces are normalized by the total power of all
transmission paths. A minimum, average and maximum trace is displayed generated
by averaging in time dimension. The upper and lower limit line, according to the
standard, is displayed. Finally the overall pass/fail status, for the statistic results
against these limit lines, is shown.
In case ‘Demod Settings | Compensate Crosstalk’ is cleared, the secondary diagonal
elements are assumed being zero. Therefore the Tx1->Rx0 and Tx0->Rx1 Spectrum
Flatness traces won’t be available.
Remote: CONF:BURS:SPEC:FLAT:SEL FLAT
CONF:BURS:SPEC:FLAT:IMM
2.1.2.8 Flatness Difference
SISO-OFDM
The Spectrum Flatness Difference result is selected by pressing the SPECTRUM softkey
in the main measurement softkey menu followed by the FLATNESS DIFFERENCE
softkey.
Software Manual 1300.7462.42 - 10 63
Page 66

R&S FS-K92/93/94 Table of Contents
Measurements
Fig. 35 Flatness Difference Results (SISO-OFDM).
The Spectrum Flatness Difference result display shows the adjacent carrier power
difference. The Spectrum Flatness Difference measurement uses the Channel
Estimation based on the ‘Demod Settings | CH Est in Preamb & Payload’ selection. A
minimum, average and maximum trace is displayed generated by averaging in time
dimension. The upper and lower limit line, according to the standard, is displayed.
Finally the overall pass/fail status, for the statistic results against these limit lines, is
shown.
Remote: CONF:BURS:SPEC:FLAT:SEL DIFF
CONF:BURS:SPEC:FLAT:IMM
Software Manual 1300.7462.42 - 10 64
Page 67

R&S FS-K92/93/94 Table of Contents
Measurements
SISO-OFDM and SISO-OFDMA/WiBro
The Flatness Difference results are selected by pressing the SPECTRUM softkey in the
main measurement softkey menu followed by the FLATNESS FLAT / DIFF softkey. .
Subsequent presses of the FLATNESS FLAT / DIFF softkey toggle between the Spectrum
Flatness and the Spectrum Flatness Difference measurement.
Fig. 36 Flatness Difference Results (SISO-OFDMA/WiBro).
The Spectrum Flatness Difference result display shows the adjacent carrier power
difference. The Spectrum Flatness Difference measurement uses the Channel
Estimation based on the ‘Demod Settings | Channel Estimation Range’ selection. A
minimum, average and maximum trace is displayed generated by averaging in time
dimension. The upper and lower limit line, according to the standard, is displayed.
Finally the overall pass/fail status, for the statistic results against these limit lines, is
shown.
Remote: CONF:BURS:SPEC:FLAT:SEL DIFF
CONF:BURS:SPEC:FLAT:IMM
MIMO-OFDMA/WiBro
The Spectrum Flatness Difference result is selected by pressing the SPECTRUM softkey
in the main measurement softkey menu followed by the FLATNESS DIFFERENCE
softkey.
Software Manual 1300.7462.42 - 10 65
Page 68

R&S FS-K92/93/94 Table of Contents
Measurements
Fig. 37 Flatness Difference Results (MIMO-OFDMA/WiBro).
According to the overall measurement settings field ‘Meas Setup 2 TX x 2 RX’ 2*2
results are available. Therefore four Spectrum Flatness Difference result traces are
displayed one for each Tx->Rx path. The Tx->Rx path information for the result trace is
given in the corresponding measurement window title bar.
The Spectrum Flatness Difference results display shows the adjacent carrier power
difference. The Spectrum Flatness Difference measurement uses the Channel
Estimation based on the ‘Demod Settings | Channel Estimation Range Payload’
selection [a MIMO zone isn’t prefixed by a preamble]. A minimum, average and
maximum trace is displayed generated by averaging in time dimension. The upper and
lower limit line, according to the standard, is displayed. Finally the overall pass/fail
status, for the statistic results against these limit lines, is shown.
In case ‘Demod Settings | Compensate Crosstalk’ is cleared, the secondary diagonal
elements are assumed being zero. Therefore the Tx1->Rx0 and Tx0->Rx1 Spectrum
Flatness Difference traces won’t be available.
Remote: CONF:BURS:SPEC:FLAT:SEL DIFF
CONF:BURS:SPEC:FLAT:IMM
Software Manual 1300.7462.42 - 10 66
Page 69

R&S FS-K92/93/94 Table of Contents
Measurements
2.1.2.9 Preamble Channel Frequency Response
SISO-OFDMA/WiBro and MIMO-OFDMA/WiBro
The Preamble Channel Frequency Response result is selected by pressing the
SPECTRUM softkey in the main measurement softkey menu followed by the CHANNEL
PHASE / GRDEL softkey. . Because the measurement is based on the DL-Preamble, its
only available in case of downlink analysis.
Fig. 38 Preamble Channel Frequency Response: Phase Results (SISO-OFDMA/WiBro).
This displays the Preamble Channel Frequency Response results. A minimum,
average and maximum trace are displayed. The L/U markers indicate the points of the
trace that are closest to the lower respective upper limit lines.
Remote: CONF:BURS:SPEC:PHAS:PRE:IMM
Software Manual 1300.7462.42 - 10 67
Page 70

R&S FS-K92/93/94 Table of Contents
Measurements
2.1.2.10 Group Delay
SISO-OFDM
The Group Delay measurement result is selected by pressing the SPECTRUM softkey in
the main measurement softkey menu followed by the FLATNESS FLAT / GRDEL softkey.
Subsequent presses of the FLATNESS FLAT / GRDEL softkey toggle between the
Spectrum Flatness and the Group Delay measurement.
Fig. 39 Group Delay Result (SISO-OFDM).
The Group Delay measurement uses the Channel Estimation based on the ‘Demod
Settings | CH Est in Preamb & Payload’ selection.
Remote: CONF:BURS:SPEC:FLAT:SEL GRD
CONF:BURS:SPEC:FLAT:IMM
SISO-OFDMA/WiBro
The Group Delay measurement result is selected by pressing the SPECTRUM softkey in
the main measurement softkey menu followed by the CHANNEL PHASE / GRDEL softkey.
Subsequent presses of the CHANNEL PHASE / GRDEL softkey toggle between the Group
Delay and the Preamble Channel Frequency Response Phase.
Software Manual 1300.7462.42 - 10 68
Page 71

R&S FS-K92/93/94 Table of Contents
Measurements
Fig. 40 Group Delay Result (SISO-OFDMA/WiBro).
The Group Delay measurement uses the Channel Estimation based on the ‘Demod
Settings | Channel Estimation Range’ selection.
The measurement requires all useful carriers to be active (for example for a 1024 FFT size,
840 positions are required).
This requirement is affected by the Channel Estimation Range parameters in the
Demod Settings dialog:
● If Downlink (DL) = Preamble Only, then the requirement is automatically met.
● If Downlink (DL) = Preamble and Payload / Payload Only, then all bitgroups must
be switched on and all channels must be covered by data bursts.
Remote: CONF:BURS:SPEC:FLAT:SEL GRD
CONF:BURS:SPEC:FLAT:IMM
2.1.2.11 MIMO-OFDMA/WiBro
The Group Delay measurement result is selected by pressing the SPECTRUM softkey in
the main measurement softkey menu followed by the FLATNESS FLAT / GRDEL softkey.
Subsequent presses of the FLATNESS FLAT / GRDEL softkey toggle between the
Spectrum Flatness and the Group Delay measurement.
Software Manual 1300.7462.42 - 10 69
Page 72

R&S FS-K92/93/94 Table of Contents
Measurements
Fig. 41 Group Delay Result (MIMO-OFDMA/WiBro).
According to the overall measurement settings field ‘Meas Setup 2 TX x 2 RX’ 2*2
results are available. Therefore four Group Delay result traces are displayed one for
each Tx->Rx path. The Tx->Rx path information for the result trace is given in the
corresponding measurement window title bar.
The Group Delay measurement uses the Channel Estimation based on the ‘Demod
Settings | Channel Estimation Range’ selection.
The measurement requires all useful carriers to be active (for example for a 1024 FFT size,
840 positions are required).
This requirement is affected by the Channel Estimation Range parameters in the
Demod Settings dialog:
● If Downlink (DL) = Preamble Only, then the requirement is automatically met.
● If Downlink (DL) = Preamble and Payload / Payload Only, then all bitgroups must
be switched on and all channels must be covered by data bursts.
In case ‘Demod Settings | Compensate Crosstalk’ is cleared, the secondary diagonal
elements are assumed being zero. Therefore the Tx1->Rx0 and Tx0->Rx1 Spectrum
Flatness Difference traces won’t be available.
Remote: CONF:BURS:SPEC:FLAT:SEL GRD
CONF:BURS:SPEC:FLAT:FFT:IMM
Software Manual 1300.7462.42 - 10 70
Page 73

R&S FS-K92/93/94 Table of Contents
Measurements
2.1.2.12 Spectrum FFT
SISO-OFDM and SISO-OFDMA/WiBro
The Spectrum FFT measurement results are selected by pressing the SPECTRUM
softkey in the main measurement softkey menu followed by the SPECTRUM FFT
softkey.
Fig. 42 Spectrum FFT Result (SISO-OFDM).
The Spectrum FFT results display shows the Power vs Frequency results obtained
from a FFT performed over the range of data in the Magnitude Capture buffer which
lies within the gate lines. If the gate start or gate length are altered then the results can
be updated to reflect these changes by pressing the REFRESH hotkey.
Remote: CONF:BURS:SPEC:FLAT:FFT:IMM
Software Manual 1300.7462.42 - 10 71
Page 74

R&S FS-K92/93/94 Table of Contents
Measurements
MIMO-OFDMA/WiBro
The Spectrum FFT measurement results are selected by pressing the SPECTRUM
softkey in the main measurement softkey menu followed by the SPECTRUM FFT
softkey.
Fig. 43 Spectrum FFT Results (MIMO-OFDMA/WiBro).
According to the overall measurement settings field ‘Meas Setup 2 RX’ results are
available. Therefore two Spectrum FFT result traces are displayed one for each Rx
path. The Rx path information for the result trace is given in the corresponding
measurement window title bar.
The Spectrum FFT results display shows the Power vs Frequency results obtained
from a FFT performed over the range of data in the Magnitude Capture buffer which
lies within the gate lines. If the gate start or gate length are altered then the results can
be updated to reflect these changes by pressing the REFRESH hotkey.
Remote: CONF:BURS:SPEC:FLAT:FFT:IMM
Software Manual 1300.7462.42 - 10 72
Page 75

R&S FS-K92/93/94 Table of Contents
Measurements
2.1.2.13 Constellation vs Symbol
SISO-OFDM
The Constellation diagram is selected by pressing the CONSTELL softkey in the main
measurement softkey menu.
Fig. 44 Constellation vs Symbol Results (SISO-OFDM).
The Constellation display shows the Inphase and Quadrature phase results over the
full range of the measured input data. The ideal points for the selected modulations
scheme are displayed for reference purposes.
The amount of data displayed in the Constellation results display can be reduced by
selecting the carrier or carriers for which data is to be displayed.
Remote: CONF:BURS:CONS:CSYM:IMM
CARRIER SELECTION
Pressing CARRIER SELECTION softkey displays a pop-up dialog which allows the
carrier for data display to be selected. Either a specific carrier number or pilots only
can be selected. Selecting All Carriers allows all the results to be displayed.
Remote: CONF:BURSt:CONS:CARR:SEL
Software Manual 1300.7462.42 - 10 73
Page 76

R&S FS-K92/93/94 Table of Contents
Measurements
SISO-OFDMA/WiBro
The Constellation diagram is selected by pressing the CONSTELL softkey in the main
measurement softkey menu.
Fig. 45 Constellation vs Symbol Results (SISO-OFDMA/WiBro).
The Constellation display shows the Inphase and Quadrature phase results over the
full range of the measured input data. The ideal points for the selected modulations
scheme are displayed for reference purposes.
The amount of data displayed in the Constellation results display can be reduced by
selecting the carrier or carriers for which data is to be displayed.
Remote: CONF:BURS:CONS:CSYM:IMM
Pressing CONSTELL SELECTION softkey displays a pop-up dialog which allows the
displayed results to be filtered. The results may be filtered by any combination of
modulation, burst, symbol or carrier. The results will be updated as soon as any
change to the constellation selection parameters are made.
Software Manual 1300.7462.42 - 10 74
Page 77

R&S FS-K92/93/94 Table of Contents
Measurements
Fig. 46 Constellation vs Symbol - Constell Section (SISO-OFDMA/WiBro)
Remote: CONF:BURS:CONS:FORM:SEL ALL|QPSK|QAM16|QAM64
CONF:BURS:CONS:BURS:SEL ALL|<value>
CONF:BURS:CONS:SYMB:SEL ALL|<value>
CONF:BURS:CONS:CARR:SEL <value>
Software Manual 1300.7462.42 - 10 75
Page 78

R&S FS-K92/93/94 Table of Contents
Measurements
MIMO-OFDMA/WiBro
CONSTEL
The Constellation diagram is selected by pressing the CONSTELL softkey in the main
measurement softkey menu.
Fig. 47 Constellation vs Symbol Results (MIMO-OFDMA/WiBro).
According to the overall measurement settings field ‘Meas Setup 2 TX x 2 RX’ two Rx
path results are available. Therefore two Constellation vs Symbol result traces are
displayed one for each Rx Path. The Rx path information for the trace is given in the
corresponding measurement window title bar.
The Constellation display shows the Inphase and Quadrature phase results over the
full range of the measured input data. The ideal points for the selected modulations
scheme are displayed for reference purposes.
The amount of data displayed in the Constellation results display can be reduced by
selecting the carrier or carriers for which data is to be displayed.
Remote: CONF:BURS:CONS:CSYM:IMM
Software Manual 1300.7462.42 - 10 76
Page 79

R&S FS-K92/93/94 Table of Contents
Measurements
CONSTELL SELECTION
Pressing CONSTELL SELECTION softkey displays a pop-up dialog which allows the
displayed results to be filtered. The results may be filtered by any combination of
modulation, burst, symbol or carrier. The results will be updated as soon as any
change to the constellation selection parameters are made. Currently the selection
applies to both constellation diagrams.
Fig. 48 Constellation vs Symbol - Constell Section (MIMO-OFDMA/WiBro).
Remote: CONF:BURS:CONS:FORM:SEL ALL|QPSK|QAM16|QAM64
CONF:BURS:CONS:BURS:SEL ALL|<value>
CONF:BURS:CONS:SYMB:SEL ALL|<value>
CONF:BURS:CONS:CARR:SEL ALL|<value>
Software Manual 1300.7462.42 - 10 77
Page 80

R&S FS-K92/93/94 Table of Contents
Measurements
2.1.2.14 Constellation vs Carrier
SISO-OFDM
The Constellation vs Carrier measurement results are selected by pressing the
CONSTELL softkey in the main measurement softkey menu followed by the
CONSTELL VS CARRIER softkey,
Fig. 49 Constellation vs Carrier Results (SISO-OFDM).
The Constellation vs Carrier results display shows the Inphase and Quadrature phase
results over the full range of the measured input data plotted on a per-carrier basis.
The magnitude of the Inphase and Quadrature part is shown on the Y-axis, both are
displayed as separate traces (I-> trace 1, Q-> trace 2).
This measurement is not available when the IEEE 802.16e-2005 OFDMA or WiBro
standards are selected.
Remote: CONF:BURSt:CONS:CCAR:IMM
Software Manual 1300.7462.42 - 10 78
Page 81

R&S FS-K92/93/94 Table of Contents
Measurements
2.1.2.15 Complementary Cumulative Distribution Function (CCDF)
SISO-OFDM and SISO-OFDMA/WiBro
The CCDF measurement results are selected by pressing the STATISTICS softkey in
the main measurement softkey menu followed by the CCDF softkey.
Fig. 50 CCDF Results (SISO-OFDM).
The CCDF results display shows the probability of an amplitude within the gating lines
exceeding the mean power measured between the gating lines. The X-axis displays
power relative to the measured mean power. If the gate start or gate length are altered
then the results can be updated to reflect these changes by pressing the REFRESH
hotkey.
Remote: CONF:BURS:STAT:CCDF:IMM
Software Manual 1300.7462.42 - 10 79
Page 82

R&S FS-K92/93/94 Table of Contents
Measurements
MIMO-OFDMA/WiBro
The CCDF measurement results are selected by pressing the STATISTICS softkey in
the main measurement softkey menu followed by the CCDF softkey.
Fig. 51 CCDF Results (MIMO-OFDMA/WiBro).
According to the overall measurement settings field ‘Meas Setup 2 TX x 2 RX’ two
results are available. Therefore two CCDF result traces are displayed one for each RX
path. The RX path information for the result trace is given in the corresponding
measurement window title bar.
The CCDF results display shows the probability of an amplitude within the gating lines
exceeding the mean power measured between the gating lines. The X-axis displays
power relative to the measured mean power. If the gate start or gate length are altered
then the results can be updated to reflect these changes by pressing the REFRESH
hotkey.
Remote: CONF:BURS:STAT:CCDF:IMM
Software Manual 1300.7462.42 - 10 80
Page 83

R&S FS-K92/93/94 Table of Contents
Measurements
2.1.2.16 Bit Stream
SISO-OFDM and SISO-OFDMA/WiBro
The Bit Stream measurement results are selected by pressing the STATISTICS softkey in
the main measurement softkey menu followed by the BIT STREAM softkey.
Fig. 52 Bit-Stream Results (SISO-OFDM).
According to the overall measurement settings field ‘Meas Setup 2 RX’ results are
available. Therefore two CCDF result traces are displayed one for each RX path. The
RX path information for the result trace is given in the corresponding measurement
window title bar.
The bit stream results display shows the demodulated data stream. These results are
grouped by burst and symbol. When no other dialogs are on display the results can be
scrolled through using the cursor keys or scroll wheel.
Pilot Errors (SISO-OFDMA/WiBro)
If pilots errors are detected in the analyzed signal, then they will be displayed with a
red background in the Bit Stream (see Fig. 54).
Note that this behavior is affected by the Pilots for Tracking setting in the DEMOD
SETTINGS.
Remote: CONF:BURS:STAT:BSTR:IMM
Software Manual 1300.7462.42 - 10 81
Page 84

R&S FS-K92/93/94 Table of Contents
Measurements
MIMO-OFDMA/WiBro
The Bit Stream measurement results are selected by pressing the STATISTICS softkey in
the main measurement softkey menu followed by the BIT STREAM softkey.
Fig. 53 Bit-Stream Results (MIMO-OFDMA/WiBro).
According to the overall measurement settings field ‘Meas Setup 2 TX x 2 RX’ two Rx
results are available. Therefore two Bit Stream result traces are displayed one for each
Rx path. The Rx path information for the result trace is given in the corresponding
measurement window title bar.
The bit stream results display shows the demodulated data stream. These results are
grouped by burst and symbol. When no other dialogs are on display the results can be
scrolled through using the cursor keys or scroll wheel.
If pilots errors are detected in the analyzed signal, then they will be displayed with a
red background in the Bit Stream (see figure ‘Bit-Stream for OFDMA, showing the Bit
Selection dialog and highlighted erroneous pilots’).
Note that this behavior is affected by the Pilots for Tracking setting in the DEMOD
SETTINGS.
Remote: CONF:BURS:STAT:BSTR:IMM
Software Manual 1300.7462.42 - 10 82
Page 85

R&S FS-K92/93/94 Table of Contents
Measurements
Bit Selection (SISO-OFDMA/WiBro and MIMO-OFDMA/WiBro)
Pressing BIT SELECTION softkey displays a pop-up dialog which allows the displayed
results to be filtered. The results may be filtered by any combination of modulation,
symbol or burst. The results will be updated as soon as any change to the bit selection
parameters are made.
Fig. 54 Bit-Stream for OFDMA, showing the Bit Selection dialog and highlighted erroneous pilots.
Remote: CONF:BURS:CONS:SYMB:SEL ALL | <numeric value> (Symbol)
CONF:BURS:CONS:FORM:SEL QPSK ALL|QPSK|QAM16|QAM64
(Modulation)
CONF:BURS:CONS:BURS:SEL ALL|PILOTS|<numeric value>
(Burst)
Software Manual 1300.7462.42 - 10 83
Page 86

R&S FS-K92/93/94 Table of Contents
Measurements
2.1.2.17 Burst Summary
SISO-OFDM
The Burst Summary measurement results are selected by pressing the STATISTICS
softkey in the main measurement softkey menu followed by the BURST SUMMARY
softkey.
Fig. 55 Burst-Summary Results (SISO-OFDM).
The burst summary results display shows the summary data for the analyzed bursts.
The colour in the Modulation and Burst column indicates the modulation format used
by the corresponding burst. When no other dialogs are on display the results can be
scrolled through using the cursor keys or scroll wheel.
Remote: CONF:BURS:STAT:BSUM:IMM
Software Manual 1300.7462.42 - 10 84
Page 87

R&S FS-K92/93/94 Table of Contents
Measurements
SISO-OFDMA/WiBro
The Burst Summary measurement results are selected by pressing the STATISTICS
softkey in the main measurement softkey menu followed by the BURST SUMMARY
softkey.
Fig. 56 Burst-Summary Results (SISO-OFDMA/WiBro).
The burst summary results display shows the summary data for the analyzed bursts.
The colour in the Modulation and Burst column indicates the modulation format used
by the corresponding burst. When no other dialogs are on display the results can be
scrolled through using the cursor keys or scroll wheel.
Remote: CONF:BURS:STAT:BSUM:IMM
MIMO-OFDMA/WiBro
The Burst Summary measurement results are selected by pressing the STATISTICS softkey
in the main measurement softkey menu followed by the BURST SUMMARY softkey.
Software Manual 1300.7462.42 - 10 85
Page 88

R&S FS-K92/93/94 Table of Contents
Measurements
Fig. 57 Burst-Summary Results (MIMO-OFDMA/WiBro).
According to the overall measurement settings field ‘Meas Setup 2 TX x 2 RX’ two Rx
results are available. Therefore two burst summary overview result tables are displayed
one for each RX path. The RX path information for the result table is given in the
corresponding measurement window title bar.
The burst summary overview result tables show the averaged overall results for the
corresponding RX path.
The burst summary ‘detailed’ results are displayed after using the following sequence:
Bring the measurement windows focus to the burst summary overview window of
interest by toggling the [SCREEN …] hotkey. Now press the [DISP][FULL SCREEN]
key sequence. This brings up the burst summary ‘detailed’ results for the measurement
window of intrest. Pressing [DISP][SPLIT SCREEN] will restore the split screen mode
as shown inn the figure above.
This measurement shows the summary data for the analyzed bursts. For each
analyzed subframe the corresponding set of analyzed bursts is added to the burst
summary list. The colour in the modulation and burst column indicates the modulation
format used by the corresponding burst. Power, null pilot power (UL) and EVM results
for each analyzed bursts are shown. The overall results at the end of each subframe
section gives the mean of this values.
In case no dialog is displayed, the results can be scrolled using the cursor keys or
scroll wheel.
Remote: CONF:BURS:STAT:BSUM:IMM
Software Manual 1300.7462.42 - 10 86
Page 89

R&S FS-K92/93/94 Table of Contents
Measurements
2.1.3 Frequency sweep measurements
The following measurements results are obtained in frequency sweep mode:
● Spectrum Mask
● Spectrum ACP/ACPR
The frequency sweep measurements use different signal data to IQ measurements
and as such it is not possible to run an IQ measurement and then view the results in
the frequency sweep measurements and vice-versa. Also because each of the
frequency sweep measurement use different settings to obtain signal data it is not
possible to run a frequency sweep measurement and view the results in another
frequency sweep measurement.
All frequency sweep measurements are run in full screen mode. Frequency sweep
measurements are only available when RF input is selected.
2.1.3.1 Spectrum Emission Mask
The Spectrum Emission Mask measurement results are selected by pressing the
SPECTRUM softkey in the main measurement softkey menu followed by the SPECTRUM
MASK softkey.
Fig. 58 Spectrum Emission Mask Results
The Spectrum Mask results display shows power against frequency. The span of the
results is related to the specified sample rate respective channel bandwidth. A limit line
representing the spectrum mask specified for the selected standard is displayed and
an overall pass/fail status is displayed for the obtained results against this limit line. If
the Sweep Count (Mask/ACP) parameter in the General Settings view is set to any
Software Manual 1300.7462.42 - 10 87
Page 90

R&S FS-K92/93/94 Table of Contents
Measurements
value other than 1 then the measurement is performed over the specified number of
sweeps. When the measurement is performed over multiple sweeps a max hold trace
is displayed as well as an average trace.
Spectrum Emission Mask Table Results
Fig. 59 Spectrum Emission Mask Table Results
The Tx Channel Bandwidth is the difference between the right and left border of the
innermost [closest to the center frequency] frequency segments. According to the table
above 9.54MHz = 4.77MHz + 4.77MHz.
● The Power in the head line of the table is the reference power according to the
‘SEM Settings | Reference Power’ setting:
● TX Channel Power: The integrated power of the Tx Channel is used as reference
power for the spectrum emission mask limits.
● TX Channel Peak Power: The Peak of the sweep trace in the TX Channel is used
as reference power for the spectrum emission mask limits.
● The Start Freq. Rel. and Stop Freq. Rel. columns specify the frequency segments
of the SEM mask definition to be measured. The values are relative to the center
frequency.
● Freq. at to Limit states the absolute frequency whose power measurement being
closest to the limit line; for the corresponding frequency segment.
● Pwr Abs states the absolute power at the frequency whose power measurement
being closest to the limit line; for the corresponding frequency segment.
● Pwr Rel states the power relative to the Reference Power at the frequency closest
to the limit line; for the corresponding frequency segment.
●
to Limit states the minimal distance of the tolerance limit to the SEM trace for the
corresponding frequency segment. Negative distances indicate the trace is below
the tolerance limit, positive distances indicate the trace is above the tolerance limit.
The Spectrum Emission Mask (SEM) measurement can be configured from the SEM
settings view. The SEM Settings softkey is located in the right side menu - [NEXT]
hotkey - of the spectrum measurement :
Software Manual 1300.7462.42 - 10 88
Page 91

R&S FS-K92/93/94 Table of Contents
Measurements
SEM SETTINGS
The SEM SETTINGS softkey brings up the SEM Settings view.
Fig. 60 Spectrum Emission Mask Settings view
SEM according to
SEM according to specifies how the Spectrum Emission Mask settings and limits are
applied. This parameter provides the following settings:
TTA Standard – Settings and limits are as specified in the standard (SISO- and
MIMO-WiBro)
ETSI – Settings and limits are as specified in the standard (SISO- and MIMOOFDM/OFDMA)
IEEE – Settings and limits are as specified in the standard (SISO- and MIMOOFDM/OFDMA)
User – Settings and limits are configured via an XML file (SISO- and MIMOOFDM/OFDMA/WiBro)
Remote: SENS:POW:SEM USER|STANdard|IEEE|ETSI
Software Manual 1300.7462.42 - 10 89
Page 92

R&S FS-K92/93/94 Table of Contents
Measurements
File Name
When User settings are specified, File Name shows the name of the loaded XML file.
Clicking the arrow switches to the File Manager to locate an XML file, and
automatically selects SEM According To: User.
When using TTA/ETSI/IEEE standards, File Name reflects the name of the built-in
configuration.
Remote: SENS:POW:SEM USER
MMEM:LOAD:SEM:STAT 1,'D:\USER\WMAN\SEM\SEM_example2.xml’
Link Direction
Link Direction allows the settings and limits for the relevant link direction (Uplink or
Downlink) to be displayed.
Remote: SENS:POW:SEM:MODE UL|DL
Power Class
The SEM settings allow different set of limits depending on the signal level. By default
the Power Class is set to Auto, which selects the limits automatically based on the
measured signal level. If required, the Power Class can be set by hand, to force a set
of limits to be used.
Remote: SENS:POW:SEM:CLAS
Reference Power
In case of a user selected Spectrum Emission Mask, the Reference Power can be set
in the corresponding xml file.
Value Range:
Tx Channel Power: The integrated power of the Tx Channel is used as reference power
for the spectrum emission mask limits.
Software Manual 1300.7462.42 - 10 90
Page 93

R&S FS-K92/93/94 Table of Contents
Measurements
Tx Channel Peak Power: The Peak of the sweep trace in the TX Channel is used as
reference power for the spectrum emission mask limits.
Remote: N.A.
SEM Configuration
The SEM configuration shows the settings and limits applied over specified frequency
ranges around the TX channel. The settings displayed are dependent on the selected
Link Direction and Power Class
Fig. 61 SEM Configuration
● The Start Freq. Rel. and Stop Freq. Rel. columns specify the frequency segments
of the SEM mask definition to be measured. The values are relative to the center
frequency.
● Resolution Bandwidth RBW used for the frequency segment.
● Video Bandwidth used for the frequency segment.
● In case Auto is ticked, the sweep time for the frequency segment will be
determined automatically.
● Detector
● Start Limit defines the tolerance limit at the beginning of the frequency segment.
The unit dB indicates the tolerance limit value is relative to the measured
‘Reference Power’.
The unit dBm indicates the tolerance limit is absolute. Ie. the measured ‘Reference
Power’ has no effect on the tolerance limit.
● Stop Limit defines the tolerance limit at the end of the frequency segment.
The unit dB indicates the tolerance limit value is relative to the measured
‘Reference Power’.
The unit dBm indicates the tolerance limit value is absolute. Ie. the measured
‘Reference Power’ has no effect on the tolerance limit.
User SEM Configuration
The FSQ contains in
D:\USER\WMAN\SEM\SEM_example1.xml
D:\USER\WMAN\SEM\SEM_example2.xml
two example User SEM xml setting files.
Software Manual 1300.7462.42 - 10 91
Page 94

R&S FS-K92/93/94 Table of Contents
6
Measurements
Fig. 62 D:\USER\WMAN\SEM\SEM_example2.xml Example SEM xml setting file.
Description of the User SEM xml file setting parameters
Link Direction {DL, UL}.
For the usage of Power Class see SEM_example2.xml.
In case SEM Settings Panel | Power Class = Auto,
the power measured according to the Reference Power setting
determines the power class to be used.
In case SEM Settings Panel | Power Class = [29, 40)dBm, the corresponding
power class will be used regardless of the power measured according to the
Reference Power setting.
Reference Power {TX Channel Power, TX Channel Peak Power}.
Start Frequency of the frequency segment [relative to center frequency] StartF in Hz.
Stop Frequency of the frequency segment [relative to center frequency] StopF in Hz.
RBW in Hz can be selected according to the values supported by the used instrument.
VBW in Hz can be selected according to the values supported by the used instrument.
Det
{RMS, POS}
FilterType
{NORMal [=default], CFILter , RRC, FFT, P5}6
SWT_Mode {Auto, Manual}
In case of Auto, the SWT_Value is treated as dummy and has no effect.
In case of Manual, the SWT_Value defines the sweep time for the corresponding
frequency segment.
Supported from FSQ V4.20; FSL V1.80
Software Manual 1300.7462.42 - 10 92
Page 95

R&S FS-K92/93/94 Table of Contents
kkckk
f qRelStopFre,eqRelStartFr:qAbsStopFre,eqAbsStartFr
kk
qRelStopFre,eqRelStartFr
c
f
kk
StopFreq,StartFreq
MCS
BW
kkkk
*StopFreq,StartFreq:qRelStopFre,eqRelStartFr
kkkk
StopFreq,StartFreq:qRelStopFre,eqRelStartFr
kkkk
StopFreq,StartFreq:qRelStopFre,eqRelStartFr
Measurements
Tolerance Limit StartL at the Start Frequency StartF of the frequency segment
StartL="float_value unit" with unit {dB, dBm}
unit = dB: the tolerance limit is relative to the power measured according to the
Reference Power setting
unit = dBm: the tolerance limit is an absolute dBm value. The Reference Power
setting has no effect onto this tolerance limit.
Tolerance Limit StopL at the Stop Frequency StopF of the frequency segment
StopL="float_value unit" with unit {dB, dBm}
unit = dB: the tolerance limit is relative to the power measured according to the
Reference Power setting
unit = dBm: the tolerance limit is an absolute dBm value. The Reference Power
setting has no effect onto this tolerance limit.
Scaling the frequency segments with the Bandwidth (BW)
In this section the functionality of the
AUTOFreqFromBW
MASKChannelSpacing (MCS)
parameters are described.
Relations between absolute and relative Start- StopFrequencies
k indexes the different frequency segments
the center frequency.
is the Start- StopFrequency relative to
are the Start- StopFrequencies, from the ranges list in the
*.xml file. See document further down.
1. AutoFreqFromBW = true, MASKChannelSpacing (MCS) is defined
,
2. AutoFreqFromBW = true, MASKChannelSpacing (MCS) is NOT defined
3. AutoFreqFromBW = false, MASKChannelSpacing (MCS) is defined or NOT defined.
Current restrictions to the definition of SEM xml files:
The sweeps must have no gaps. Otherwise the message
'The file cannot be loaded: incorrect or corrupt content' is displayed.
There must be at least one DL power class and one UL power class per xml file! Otherwise
the message 'The file cannot be loaded: incorrect or corrupt content' is displayed.
Software Manual 1300.7462.42 - 10 93
Page 96

R&S FS-K92/93/94 Table of Contents
Measurements
2.1.3.2 Spectrum ACP
The Spectrum ACP measurement results are selected by pressing the SPECTRUM
softkey in the main measurement softkey menu followed by the ACP REL/ABS softkey.
Subsequent presses of the ACP REL/ABS softkey toggle the measurement between
relative and absolute results display.
Fig. 63 Spectrum ACPR Results (example)
The Spectrum ACPR (Adjacent Channel Power (Relative)) is similar to the Spectrum
Mask measurement, and provides information about leakage into adjacent channels.
The results show the relative power measured in the three nearest channels either side
of the measured channel. This measurement is the same as the Adjacent Channel
Power measurement provided by the Spectrum Analyzer. . If the Sweep Count
(Mask/ACP) parameter in the General Settings view is set to any value other than 1
then the measurement is performed over the specified number of sweeps. When the
measurement is performed over multiple sweeps a max hold trace is displayed as well
as an average trace.
By default the ACP Settings are derived from the Channel Bandwidth setting of the
General Settings Panel.
Remote: SENS:POW:ACH:MODE REL | ABS
CONF:BURS:SPEC:ACPR:IMM
The Spectrum ACP measurement can be configured from the ACP settings view:
ACP SETTINGS
The ACP SETTINGS softkey brings up the ACP Settings view.
Software Manual 1300.7462.42 - 10 94
Page 97

R&S FS-K92/93/94 Table of Contents
Measurements
Fig. 64 ACP Settings view
2.1.3.3 Noise Correction
Noise Correction - when selected enables noise reduction to be performed on the
signal.
Remote: SENS:POWer:NCOR
2.1.3.4 No of Channels
No of Channels specifies then number of channels adjacent to the transmit channel to
be measured.
If No of Channels is set to 0 then only the transmit channel is measured.
Remote: SENS:POW:ACH:ACP
TX/ACP Channel BW
The TX/ACP Channel BW settings specify the bandwidth of specific channels.
Software Manual 1300.7462.42 - 10 95
Page 98

R&S FS-K92/93/94 Table of Contents
Measurements
TX Channel Bandwidth
TX Channel Bandwidth specifies the bandwidth of the transmit channel to be measured
by the ACP measurement.
Remote: SENS:POW:ACH:BAND:CHAN
Adjacent Channel Bandwidth
Adjacent Channel Bandwidth specifies the bandwidth of the first channel before and
after the transmit channel to be measured.
Remote: SENS:POW:ACH:BAND:ACH
Alternate 1,2,3 & 4 Channel Bandwidth
Adjacent Channel Bandwidth specifies the bandwidth of the specified channel before
and after the transmit channel to be measured.
Remote: SENS:POW:ACH:BAND:ALT<1..11>
ACP Channel Spacing
The ACP Channel Spacing settings specify the spacing of specific channels.
Adjacent Channel Spacing
Adjacent Channel Bandwidth specifies the spacing of the first channel before and after
the transmit channel to be measured.
Remote: SENS:POW:ACH:SPAC:ACH
Software Manual 1300.7462.42 - 10 96
Page 99

R&S FS-K92/93/94 Table of Contents
Running measurements
Alternate 1,2,3 & 4 Channel Spacing
Adjacent Channel Bandwidth specifies the spacing of the specified channel before and
after the transmit channel to be measured.
Remote: SENS:POW:ACH:SPAC:ALT<1..11>
2.1.4 Automatic Level Detection
Automatic level detection allows the Signal Level and Reference Level settings to be
calculated from the input signal.
Automatic level detection can be performed in one of two ways:
► Pressing the AUTO LVL hot-key
► Setting Auto Level in the General Settings view to ON.
Running the Automatic Level Detection by pressing the AUTO LVL hot-key allows the
level detection to be run at any time. Once the Automatic Level Detection has
completed the trace is displayed in the Magnitude Capture Buffer display.
Running the Automatic Level Detection by Setting Auto Level in the General
Settings view to ON means that an Automatic Level Detection measurement is
executed before each main measurement sweep. When running the Automatic
Level Detection this way no trace for the Automatic Level Detect ion measurement
is displayed. This way of running the Automatic Level Detection will cause
measurements to run more slowly and as such it is recommended that Automatic
Level Detection is only run in this way when the speed of measurement is not
important or when running continuous measurements are being run with a signal
which varies in level from one sweep to the next.
2.2 Running measurements
To start a measurement, press the RUN SGL hotkey (single) or RUN CONT hotkey
(continuous).
Note that if one measurement is started whilst another measurement is in progress, for
example, a single measurement is started whilst a continuous measurement is in progress,
then the first measurement will be aborted and the new measurement started immediately.
During a measurement, the text "Running..." is displayed in the Status Bar at the bottom of
the screen. After successful completion of a single measurement, the Status Bar will
display “Measurement Complete”.
Software Manual 1300.7462.42 - 10 97
Page 100

R&S FS-K92/93/94 Table of Contents
Frequency
The frequency of the measured input signal according to the
General Settings value.
Sweep Mode
Shows “Single” for a single measurement and “Continuous” for a
continuous measurement.
Burst Type
The type of burst being analyzed. SISO-OFDM
Signal Level Setting
The expected mean signal level of the input signal according to
the General Settings value.
Trigger Mode
The trigger source used to start the measurement sweep. SISOOFDM.
Modulation
The Demodulator setting from the Demod Settings panel is
shown. In case the Modulation Analysis Scope is set to ALL, ALL
is displayed.
Ref Level
The internal instrument reference level used for the measurement.
Att
The attenuation (positive values) or gain (negative values)
applied to the signal externally (i.e. before the RF- or IQconnector of the spectrum analyzer). e.g.
External Att = 10 dB means that before the RF-connector of the
R&S a 10 dB attenuator is used
External Att = -20 dB means that before the RF-connector of the
R&S FSQ a amplifier with 20 dB gain is used
Trigger Offset
The trigger delay (positive value) or pre-trigger time (negative
value) applied to the trigger according to the General Settings
value. SISO-OFDM
Trigger Mode/Offset
A combined display of the trigger source and any associated
offset applied according to the General Settings values. SISOOFDMA/WiBro.
No Of Data Symbols
Shows the minimum and maximum number of data symbols that
a burst may have if it is to be considered in results analysis.
SISO-OFDM.
Measurement results
2.3 Measurement results
The tabular section below the title bar shows the overall measurement settings used to
obtain the current measurement results.
SISO-OFDM
Fig. 65 Overall measurement settings summary for IEEE 802.16 – 2004 OFDM
The settings summary includes the following information:
SISO-OFDMA/WiBro and MIMO-OFDMA/WiBro
Fig. 66 Overall measurement settings summary for IEEE 802.16e – 2005 OFDMA and WiBro
Software Manual 1300.7462.42 - 10 98
 Loading...