

Page 1

R&S®FS-K112PC
NFC Measurement Software
User Manual
(;ÙÏÜ2)
1175.6578.02 ─ 02
User Manual
Test & Measurement
Page 2

This manual contains the documentation for the following products.
●
R&S®FS-K112PC (1310.0448.02)
●
R&S®FSPC (1310.0002.03)
The contents correspond to software version 1.1 and higher.
The firmware of the instrument makes use of several valuable open source software packages. For information, see the "Open Source
Acknowledgement" on the user documentation CD-ROM (included in delivery).
Rohde & Schwarz would like to thank the open source community for their valuable contribution to embedded computing.
© 2013 Rohde & Schwarz GmbH & Co. KG
Mühldorfstr. 15, 81671 München, Germany
Phone: +49 89 41 29 - 0
Fax: +49 89 41 29 12 164
E-mail: info@rohde-schwarz.com
Internet: www.rohde-schwarz.com
Printed in Germany – Subject to change – Data without tolerance limits is not binding.
R&S® is a registered trademark of Rohde & Schwarz GmbH & Co. KG.
Trade names are trademarks of the owners.
The following abbreviations are used throughout this manual: R&S®FS-K112PC is abbreviated as R&S FS-K112PC.
Page 3

Customer Support
Technical support – where and when you need it
For quick, expert help with any Rohde & Schwarz equipment, contact one of our Customer Support
Centers. A team of highly qualified engineers provides telephone support and will work with you to find a
solution to your query on any aspect of the operation, programming or applications of Rohde & Schwarz
equipment.
Up-to-date information and upgrades
To keep your instrument up-to-date and to be informed about new application notes related to your
instrument, please send an e-mail to the Customer Support Center stating your instrument and your wish.
We will take care that you will get the right information.
Europe, Africa, Middle East
North America
Latin America
Asia/Pacific
China
Phone +49 89 4129 12345
customersupport@rohde-schwarz.com
Phone 1-888-TEST-RSA (1-888-837-8772)
customer.support@rsa.rohde-schwarz.com
Phone +1-410-910-7988
customersupport.la@rohde-schwarz.com
Phone +65 65 13 04 88
customersupport.asia@rohde-schwarz.com
Phone +86-800-810-8228 /
+86-400-650-5896
customersupport.china@rohde-schwarz.com
1171.0200.22-06.00
Page 4

Quality management
Certied Quality System
ISO 9001
and environmental
management
Sehr geehrter Kunde,
Sie haben sich für den Kauf
eines Rohde & Schwarz Produktes entschieden. Sie erhalten
damit ein nach modernsten Fertigungsmethoden hergestelltes
Produkt. Es wurde nach den
Regeln unserer Qualitäts- und
Umweltmanagementsysteme
entwickelt, gefertigt und geprüft.
Rohde & Schwarz ist unter anderem nach den Managementsystemen ISO 9001 und ISO 14001
zertifiziert.
Der Umwelt verpflichtet
❙ Energie-efziente,
RoHS-konforme Produkte
❙ Kontinuierliche
Weiterentwicklung nachhaltiger
Umweltkonzepte
❙ ISO 14001-zertiziertes
Umweltmanagementsystem
Dear customer,
You have decided to buy a
Rohde & Schwarz product. This
product has been manufactured
using the most advanced methods. It was developed, manufactured and tested in compliance
with our quality management
and environmental management systems. Rohde & Schwarz
has been certified, for example, according to the ISO 9001
and ISO 14001 management
systems.
Environmental commitment
❙ Energy-efcient products
❙ Continuous improvement in
environmental sustainability
❙ ISO 14001-certied
environmental management
system
Certied Environmental System
ISO 14001
Cher client,
Vous avez choisi d’acheter un
produit Rohde & Schwarz. Vous
disposez donc d’un produit
fabriqué d’après les méthodes
les plus avancées. Le développement, la fabrication et les
tests de ce produit ont été effectués selon nos systèmes de
management de qualité et de
management environnemental.
La société Rohde & Schwarz a
été homologuée, entre autres,
conformément aux systèmes
de management ISO 9001 et
ISO 14001.
Engagement écologique
❙ Produits à efcience
énergétique
❙ Amélioration continue de la
durabilité environnementale
❙ Système de management
environnemental certié selon
ISO 14001
1171.0200.11 V 05.01
1171020011
Page 5

R&S®FS-K112PC
1 Preface....................................................................................................5
1.1 Documentation Overview.............................................................................................5
1.2 Conventions Used in the Documentation...................................................................5
2 Welcome to the NFC Measurement Software......................................7
2.1
2.2 Using the Smart Card Reader......................................................................................8
2.3
2.4 Customizing the User Interface.................................................................................15
2.5 Connecting Measurement Equipment.......................................................................16
3 Measurements and Result Displays...................................................20
Contents
Contents
Installing R&S FS-K112PC...........................................................................................7
Starting the R&S FS-K112PC.....................................................................................11
3.1 Graphical Results........................................................................................................20
3.2 Numerical Results.......................................................................................................28
4 Configuration........................................................................................42
4.1 Managing Measurement Configurations...................................................................42
4.2 Selecting the NFC Modulation Type..........................................................................43
4.3 Selecting a Particular Burst.......................................................................................44
4.4 Configuring the Measurement Equipment................................................................45
4.5 Triggering Measurements..........................................................................................48
4.6 Defining Diagram Properties......................................................................................50
5 Analysis................................................................................................52
6 Remote Control Commands................................................................54
6.1 Introduction.................................................................................................................54
6.2 Common Commands..................................................................................................58
6.3 Measurement Control.................................................................................................59
6.4 General Commands....................................................................................................59
6.5 Result Overview..........................................................................................................62
6.6 Querying NFC-A Poller Results.................................................................................65
6.7 Querying NFC-B and -F Poller Results.....................................................................72
6.8 Querying NFC-A Listener Results.............................................................................75
6.9 Querying NFC-B and -F Listener Results.................................................................79
3User Manual 1175.6578.02 ─ 02
Page 6

R&S®FS-K112PC
6.10 Configuring Listener Characteristics........................................................................80
6.11 Signal Decoding..........................................................................................................80
6.12 Instrument Configuration...........................................................................................82
6.13 Trigger Configuration.................................................................................................86
6.14 Result Display Configuration.....................................................................................89
Contents
Glossary: NFC Terms..........................................................................91
List of Commands................................................................................93
Index......................................................................................................96
4User Manual 1175.6578.02 ─ 02
Page 7

R&S®FS-K112PC
1 Preface
Preface
Documentation Overview
1.1 Documentation Overview
The user documentation for the R&S FS-K112PC consists of the following parts:
Documentation CD-ROM with:
●
– User Manual
– Release Notes
– Data sheet and product brochures
User Manual
The user manual is available in PDF format - in printable form - on the Documentation
CD-ROM delivered with the software. In the user manual, all software functions are
described in detail. Furthermore, it provides a complete description of the remote control
commands.
The user manual is also integrated in the software.
► Select the "View Help" menu item from the "Help" menu.
The software opens the user manual.
Release Notes
The release notes describe new and modified functions, eliminated problems, and last
minute changes to the documentation. The corresponding firmware version is indicated
on the title page of the release notes. The most recent release notes are provided on the
internet.
1.2 Conventions Used in the Documentation
Typographical Conventions
The following text markers are used throughout this documentation:
5User Manual 1175.6578.02 ─ 02
Page 8

R&S®FS-K112PC
Preface
Conventions Used in the Documentation
Convention Description
"Graphical user interface elements" All names of graphical user interface elements on the
screen, such as dialog boxes, menus, options, buttons, and softkeys are enclosed by quotation marks.
KEYS Key names are written in capital letters.
File names, commands, program code
Input Input to be entered by the user is displayed in italics.
Links Links that you can click are displayed in blue font.
"References" References to other parts of the documentation are
File names, commands, coding samples and screen
output are distinguished by their font.
enclosed by quotation marks.
6User Manual 1175.6578.02 ─ 02
Page 9

R&S®FS-K112PC
2 Welcome to the NFC Measurement Software
Welcome to the NFC Measurement Software
Installing R&S FS-K112PC
2.1
Installing R&S FS-K112PC
Successful installation of the program requires two steps.
● Installing Required Components
● Installing R&S FS-K112PC
2.1.1 Installing Required Components
The software requires the installation of several components to run properly. All of these
components are delivered with the software package. Thus, you can install them directly
from the CD-ROM prior to installing the software itself.
Required software components
Microsoft .NET Framework 2.0
●
VISA
●
If the required components are already installed on your computer, you can skip this step.
Installing Microsoft .NET Framework 2.0
The R&S FS-K112PC requires the installation of Microsoft .NET Framework 2.0 or later.
Check if .NET Framework is already installed.
1. Navigate to the installation location (usually the CD-ROM drive).
2. Start \Microsoft .NET Framework 2.0\Check for .NET
Installed.exe
The file checks if .NET Framework is installed or not.
3. If not, start \Install\Framework\Microsoft .NET Framework
2.0\dotnetfx.exe and follow the instructions.
Install VISA
It is also necessary to install VISA (Virtual Instrument Software Architecture) to access
instruments connected to the PC via IEEE or LAN bus. It is then possible to remote control
the measurement instrument.
You can use both National Instruments and Agilent VISA.
● The National Instrument VISA driver CD is supplied together with the R&S FSPC.
You can also visit http://www.ni.com/visa to get the latest version for your operating
system if you are licensed to.
7User Manual 1175.6578.02 ─ 02
Page 10

R&S®FS-K112PC
Welcome to the NFC Measurement Software
Using the Smart Card Reader
If you are using an Agilent hardware or need to use the Agilent VISA, visit http://
●
www.agilent.com to get the latest version for your operating system.
2.1.2
2.1.3
Installing R&S FS-K112PC
After installing all required components, you can install the R&S FS-K112PC.
► Start \FS-K112_v1.1.exe
The installer will do the following:
● Install the R&S FS-K112PC software including an uninstall tool
● Create a Windows Start Menu entry (Programs ⇨ R&S NFC Analysis)
Create a shortcut on the desktop (optional)
●
If necessary (the software will specifically ask you to), set the required environment
●
variables.
Start the software via the Windows "Start Menu" entry or the shortcut on the desktop.
Deinstalling R&S FS-K112PC
You can uninstall the software itself via the uninstall tool available in the Windows "Start
Menu" folder or via "Add or Remove Software" in the Windows "Control Panel".
The Framework components have to be uninstalled manually via "Add or Remove Software" in the Windows "Control Panel".
Before uninstalling the components, make sure that no other software uses one of the
components.
The following components and programs have been installed:
Microsoft .NET Framework 2.0
●
R&S Port Mapper
●
● Rohde & Schwarz NFC Analysis (R&S FS-K112PC)
2.2 Using the Smart Card Reader
The software is licensed by a smart card licensing system. This licensing system requires
a smart card to be connected to the PC when you are using the software. The smart card
and dongle are available as separate products.
You can connect the smart card in two ways.
Connect the smart card in SIM format.
●
If you want to connect the smart card in SIM format, use the USB smart card reader
that is included in the delivery of the software.
Connect the smart card in its full format.
●
8User Manual 1175.6578.02 ─ 02
Page 11

R&S®FS-K112PC
Welcome to the NFC Measurement Software
Using the Smart Card Reader
If you want to connect the smart card in full format, an interface compatible to the
card format is required.
The following devices are able to read the smart card in full format.
– smart card reader integrated in a keyboard
– smart card reader integrated in a notebook
– smart card reader integrated in a desktop PC (e.g. OMNIKEY)
– smart card reader connected to the computer via serial bus or USB (e.g. OMNI-
KEY)
– USB reader connected to a LAN-to-USB converter to distribute the license via
the network (e.g DIGI AnaywhereUSB/2)
Licensing support
If you have any difficulties with the licensing system, support is only assured when you
are using the USB smart card reader that is delivered with the smart card.
Using the USB smart card reader
1. Included in the delivery of the software is the smart card in full format and a smart
card reader.
2. Break out the smart card in SIM format.
3. Insert the smart card into the smart card reader.
a) Turn the smart card reader in a way that the OMNIKEY label faces upward.
b) Insert the smart card with the chip face down and the angled corner facing away
from the reader.
9User Manual 1175.6578.02 ─ 02
Page 12

R&S®FS-K112PC
Welcome to the NFC Measurement Software
Using the Smart Card Reader
4. Push the smart card into the reader as far as possible.
The smart card reader is ready for use on any USB interface.
When you connect the reader to the computer, MS Windows automatically installs
the necessary drivers. If not, you can install the drivers manually from the software
CD. The required files are stored in the directory \Install\USB SmartCard
Reader Driver Files. The driver files are named according to the processor
architecure for which they are designed. (OMNIKEY3x21_x86 or
OMNIKEY3x21_x64).
Information on drivers and driver updates are also included in the ReadMe.txt file
in the same directory as the drivers.
Locking the computer
If you have difficulties unlocking the computer while the smart card is connected because
MS Windows tries to get log-in information from the card after you have locked the computer.
You can solve this issue by editing the system registry.
Automatic change
► Run DisableCAD.reg to change the registry entry automatically.
The file is in the same directory as the driver files.
Manual change
1. Open the Windows "Start Menu" and select the "Run" item.
2. Enter regedit into the dialog box to open the system registry.
3. Look for
HKEY_LOCAL_MACHINE\SOFTWARE\Microsoft\Windows\CurrentVersion\
policies\system.
4. Set the value of DisableCad to 0.
Administration rights
Security policies of your network environment might prevent you from editing the system
registry or installing drivers. Contact your IT administration in that case.
10User Manual 1175.6578.02 ─ 02
Page 13

R&S®FS-K112PC
Welcome to the NFC Measurement Software
Starting the R&S FS-K112PC
2.3
Starting the R&S FS-K112PC
►
Start the R&S FS-K112PC with the desktop icon or select "Programs" ⇨ "R&S NFC
Analysis" in the Windows "Start Menu"
The user interface (GUI) of the software opens.
Software user interface
Basically, the user interface consists of these elements
a menu bar that provides access to the software functionality at the top
●
a toolbar that provides easy access to the most important functions
●
a workspace
●
In the initial state, the R&S FS-K112PC shows the Result Overview, the Decoding results
and the Poller Values. All other result displays are added to the Poller Values result displays as tabs. For more information on available result displays see chapter 3, "Meas-
urements and Result Displays", on page 20.
If you want another layout of the workspace, you can customize its layout. For more
information see chapter 2.4, "Customizing the User Interface", on page 15.
Adding or removing windows from the workspace
The R&S FS-K112PC provides several types of windows.
● Result displays contain the measurement results of the NFC analysis. The R&S FS-
K112PC provides several result displays, each containing a set of related results.
The "Settings" dialog contains functionality to configure the measurement.
●
You can add as many different windows to the workspace as you want, but each type of
window only once.
► Select the "Window" item in the menu bar.
The software opens a dropdown menu to add or remove windows.
To add a window, just select the corresponding entry in the dropdown menu ( ).
11User Manual 1175.6578.02 ─ 02
Page 14
R&S®FS-K112PC
Welcome to the NFC Measurement Software
Starting the R&S
To remove a window, deselect the corresponding entry in the dropdown menu ( )
or close it with the button.
Hidden tabs
If the icon is visible in one of the window frames, there are hidden tabs that don't fit in
the user interface. If you click on the icon, a list of all active tabs in that window opens.
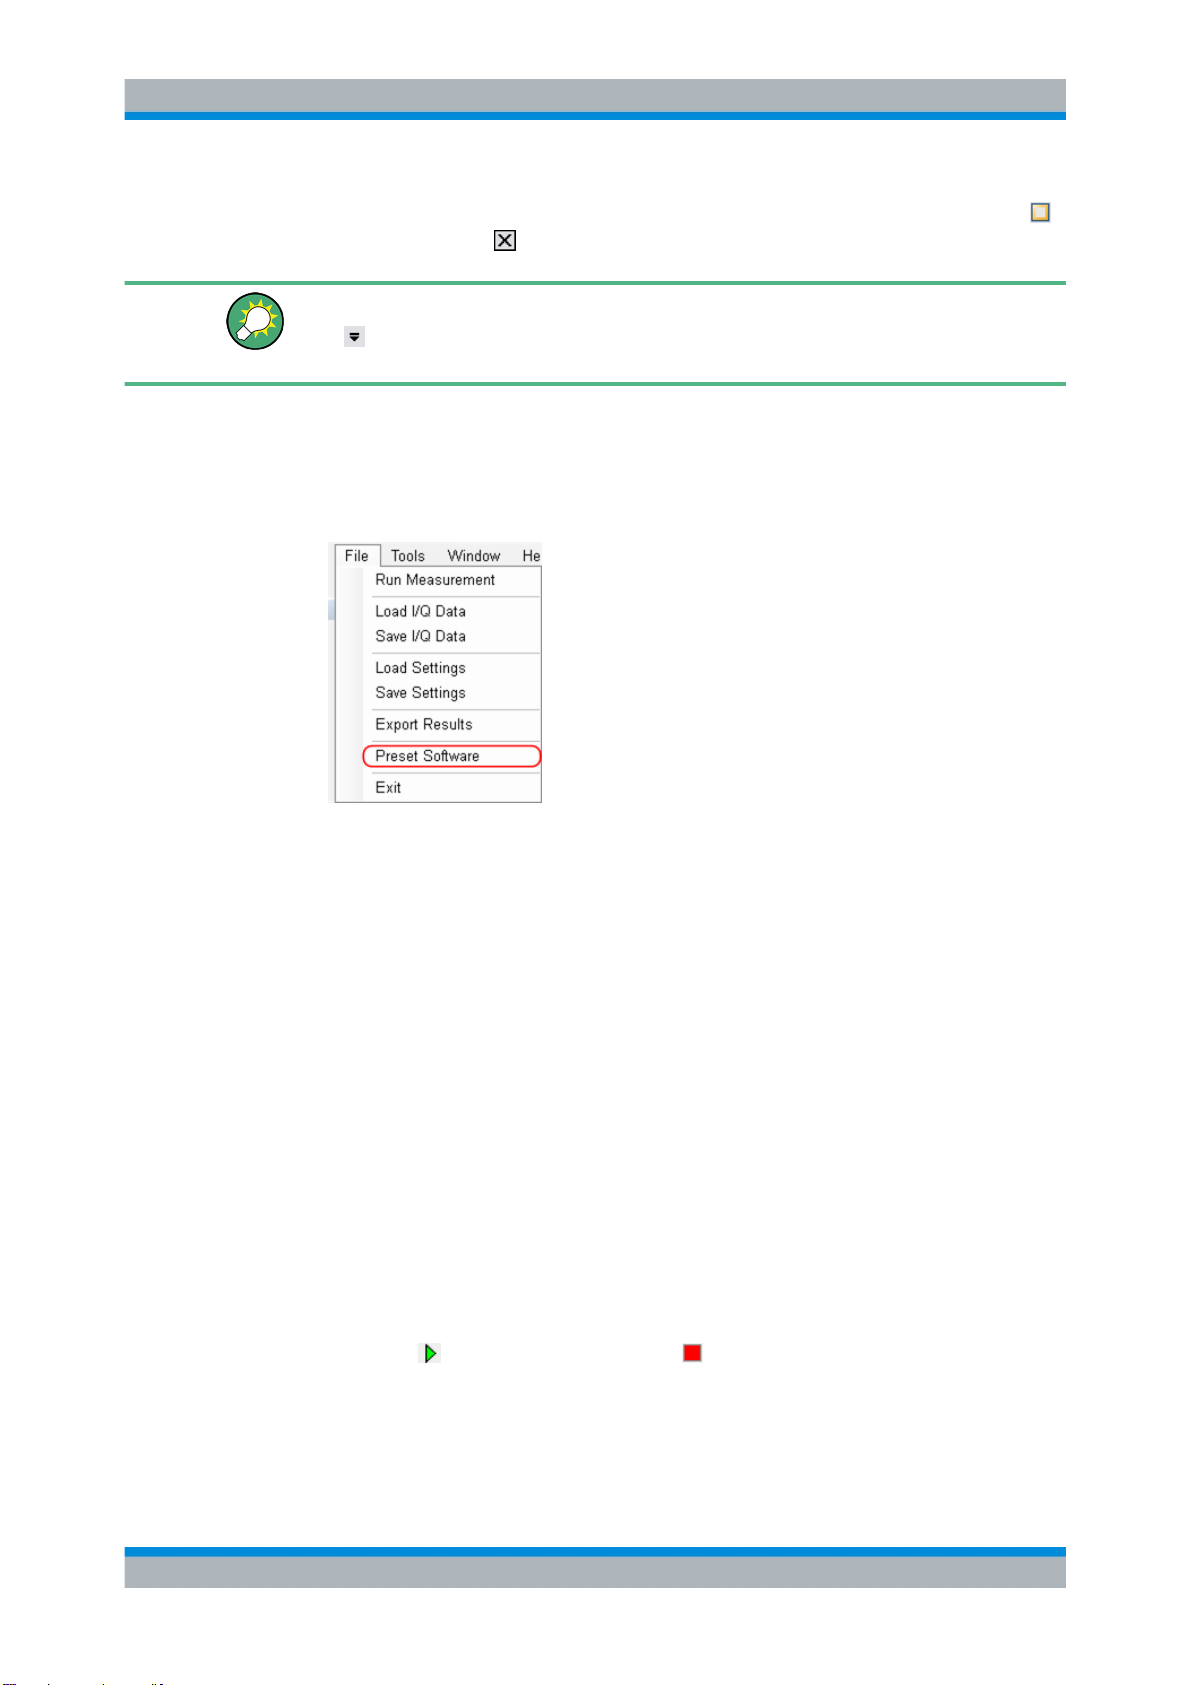
Performing a preset
All settings have been assigned predefined values that you can restore anytime you need.
► Select the "Preset" menu item from the "File" menu.
FS-K112PC
The software restores the predefined values for all settings.
SCPI command:
SYSTem:PRESet on page 61
Running measurements
When you start the software, it assumes that it gets the data from an instrument (spectrum
analyzer or oscilloscope) that is connected to the PC via TCP/IP. In that case, the
R&S FS-K112PC records and evaluates the I/Q data live from the measurement equipment.
Currently, the R&S FS-K112PC supports the following instruments:
● R&S FSL (spectrum analyzer)
● R&S FSV (signal analyzer)
● R&S FSQ (signal analyzer)
● R&S FSW (signal analyzer)
● R&S ZVL (network analyzer)
● R&S RTO (oscilloscope)
►
Press the
measurement.
Note that the button initiates the recording of the I/Q data. Current I/Q data is lost.
The amount of I/Q data depends on the "Capture Length" you have defined. For more
("Run Measurement") and buttons in the toolbar to start or stop a
12User Manual 1175.6578.02 ─ 02
Page 15

R&S®FS-K112PC
Welcome to the NFC Measurement Software
Starting the R&S FS-K112PC
information see chapter 4.4, "Configuring the Measurement Equipment",
on page 45.
SCPI command:
INITiate[:IMMediate] on page 59
►
Press the button to evaluate the I/Q data currently in the capture buffer again.
Refreshing the results is useful if you want to evaluate the I/Q data with different
settings, for example.
SCPI command:
INITiate:REFResh on page 59
As an alternative to a live recording you can restore previously recorded I/Q data from a
file and evaluate that I/Q data again.
Importing signal data
If you have a recorded set of I/Q data stored in a file with the file extension *.iq.tar, you
can load it into the software.
► Select the "Load I/Q Data" menu item from the "File" menu.
The software opens a dialog box to select the file. The file must have the .iq.tar format.
SCPI command:
MMEMory:NFC:LOAD:IQ on page 60
After you have opened the file, the software analyzes the data that the file contains automatically.
13User Manual 1175.6578.02 ─ 02
Page 16

R&S®FS-K112PC
Welcome to the NFC Measurement Software
Starting the R&S
The iq.tar file format
An .iq.tar file contains I/Q data in binary format together with meta information that
describes the nature and the source of data, e.g. the sample rate. The objective of
the .iq.tar file format is to separate I/Q data from the meta information while still having
both inside one file. In addition, the file format allows you to include customized data.
An .iq.tar file must contain the following files.
I/Q parameter .xml file
●
Contains meta information about the I/Q data (e.g. sample rate). The filename can
be defined freely, but there must be only one single I/Q parameter .xml file inside
an .iq.tar file.
I/Q data binary file
●
Contains the binary I/Q data of all channels. There must be only one single I/Q data
binary file inside an .iq.tar file.
Optionally, an .iq.tar file can contain the following file.
I/Q preview .xslt file
●
Contains a stylesheet to display the I/Q parameter .xml file and a preview of the I/Q
data in a web browser.
FS-K112PC
Exporting signal data
When you have recorded I/Q data that you want to have access to later, the R&S FSK112PC allows you to export the I/Q data to a file.
► Select the "Save I/Q Data" menu item from the "File" menu.
The software opens a dialog box to define the name and target folder of the file.
Note that the file extension you have to use is *.iq.tar.
SCPI command:
MMEMory:NFC:STORe:IQ on page 60
When you save the signal to a file you can load and view it again anytime you want (see
"Importing signal data" on page 13).
Exiting the software
► Select the "Exit" menu item from the "File" menu.
14User Manual 1175.6578.02 ─ 02
Page 17

R&S®FS-K112PC
Welcome to the NFC Measurement Software
Customizing the User Interface
2.4 Customizing the User Interface
In addition to adding and removing elements to and from the workspace, you can also
customize the layout of the user interface by docking elements to a particular position of
the working area, by adding a tab to an existing element or by altogether removing an
element from the user interface.
2.4.1 Docking Elements
1. Select an element in the title bar with the mouse and move it around until a docking
spot appears.
Docking spots look like this:
2. Move the mouse cursor over one of the possible docking spots.
The border of the docking spot turns blue. The screen area in which the element will
be positioned also turns blue.
3. Release the element.
The element docks itself to the corresponding area of the GUI.
15User Manual 1175.6578.02 ─ 02
Page 18

R&S®FS-K112PC
Welcome to the NFC Measurement Software
Connecting Measurement Equipment
2.4.2 Adding an Element as a Tab
1. Select an element with the mouse and move it over the center docking spot in an
area where another element already is.
2. Release the element.
The released element is added as a tab to the element.
The active tab always is in a lighter color than the others.
Note that tabs may be at the top of the window or at the bottom of the window,
depending on where the window is in the user interface.
3.
Select the tab you need by either clicking on the tab itself or by clicking on the
symbol and selecting the tab you need from the list.
2.4.3 Removing an Element from the GUI
► Select an element with the mouse, move it around and release it.
If you haven't docked the element or added it as a tab, it is floating around as an
individual window. You can also move the element completely out of the GUI and
work with it in an independent window (e.g. another monitor).
2.5 Connecting Measurement Equipment
In order to be able to communicate with an analyzer or oscilloscope, you have to establish
a connection between the measurement equipment and the computer in a local area
network (LAN).
16User Manual 1175.6578.02 ─ 02
Page 19

R&S®FS-K112PC
Welcome to the NFC Measurement Software
Connecting Measurement Equipment
For more information on supported instruments see "Running measurements"
on page 12.
Requirements
To be able to capture signal data, you need one of the instruments mentioned above.
To establish a connection, you also have to determine the network address of the instruments and set it up in the software.
For more information on including the instrument configuration in the software see chap-
ter 4.4, "Configuring the Measurement Equipment", on page 45.
2.5.1 Figuring Out the Address of an R&S FSV
Follow these steps to figure out the network address of an R&S FSV.
1. Press the SETUP key.
2. Press the "General Setup" softkey.
3. Press the "Network Address" softkey.
4. Press the "IP Address" softkey.
The R&S FSV opens a dialog box that contains information about the LAN connection.
2.5.2 Figuring Out the Address of an R&S FSL or R&S ZVL
Follow these steps to figure out the network address of an R&S FSL or R&S ZVL.
1. Press the SETUP key.
2. Press the "General Setup" softkey.
3. Press the "Network Address" softkey.
4. Press the "IP Address" softkey.
The analyzer opens a dialog box that contains information about the LAN connection.
17User Manual 1175.6578.02 ─ 02
Page 20

R&S®FS-K112PC
Welcome to the NFC Measurement Software
Connecting Measurement Equipment
2.5.3 Figuring Out the Address of an R&S FSQ
Follow these steps to figure out GPIB or IP address of an R&S FSQ.
1. Press the SETUP key.
2. Press the "General Setup" softkey.
3. Press the "Configure Network" softkey.
4. Press the "Configure Network" softkey.
The MS Windows "Network Connections" dialog box opens.
5. Select the "Local Area Connection" item.
The "Local Area Connection Status" dialog box opens.
6. Select the "Support" tab.
The "Support" tab shows the current TCP/IP information of the R&S FSQ.
2.5.4 Figuring Out the Address of an R&S FSW
Follow these steps to figure out the GPIB or IP address of an R&S FSW.
1. Press the SETUP key.
2. Press the "Network + Remote" softkey.
The R&S FSW opens the "Network & Remote" dialog box and shows its current IP
address in the corresponding field.
18User Manual 1175.6578.02 ─ 02
Page 21

R&S®FS-K112PC
Welcome to the NFC Measurement Software
Connecting Measurement Equipment
2.5.5 Figuring Out the Address of an R&S RTO
Follow these steps to figure out the network address of an R&S RTO.
► Press the SETUP key.
The R&S RTO opens a dialog box that contains general information about the system.
19User Manual 1175.6578.02 ─ 02
Page 22

R&S®FS-K112PC
3 Measurements and Result Displays
Measurements and Result Displays
Graphical Results
After the R&S FS-K112PC has evaluated the I/Q data, you can display the test results in
various graphical and numerical result displays.
Quick evaluation of test results
Each result display has a colored bar at the top that displays the test results so that you
can see at a quick glance if the test has passed or failed.
The results are highlighted depending on the quality of the signal (and provided that the
software could find an actual NFC signal in the I/Q data).
green highlighting
●
The test has passed. The signal complies to the specifications defined by the NFC
Forum.
yellow highlighting
●
The test has passed in parts. However, something did not comply to the specifications
defined by the NFC Forum (e.g. if the listener has passed the test, but the poller did
not).
red highlighting
●
The test has failed completely. No signal parts comply to the specifications defined
by the NFC Forum or the software was not able to process the data as expected.
no highlighting
●
The R&S FS-K112PC could not detect an NFC signal in the I/Q data.
3.1 Graphical Results
The graphical displays are basically a representation of the signal power against a particular period of time.
► Select the "Capture Buffer", the "Poller PvT Graph" or the "Listener PvT Graph" item
from the "Windows" menu.
20User Manual 1175.6578.02 ─ 02
Page 23

R&S®FS-K112PC
Measurements and Result Displays
Graphical Results
The software opens the corresponding windows and displays the results if you have
previously performed a measurement.
● Capture Buffer.........................................................................................................21
● Poller Characteristics..............................................................................................23
● Listener Characteristics...........................................................................................25
3.1.1 Capture Buffer
The "Capture Buffer" result display shows the power level of the complete I/Q data stored
in the capture buffer. The size of the capture buffer depends on the capture length you
have defined (see chapter 4, "Configuration", on page 42).
Fig. 3-1: Capture buffer containing the I/Q data of an NFC-F signal (based on example file NFC-
F_212kB_Example.iq.tar)
The software calculates and shows the envelope voltage of the signal relative to the level
of the carrier signal transmitted by the poller. The carrier signal is a continuous wave.
The carrier signal is normalized to 100 %. The voltage is displayed on the left diagram
axis.
When two NFC devices exchange data, the carrier signal supplied by the poller is modulated for a particular amount of time (the 'low state transition' in case of poller signals and
'load modulation' in case of listener signals). During this time, the voltage of the carrier
signal drops or rises by a certain amount. You can see the taps into the power by the
shape of the trace.
= carrier signal, power = 100 %
1
2 = low state transition, power = < 10 % of the modulation depth (poller signal)
2 =
load modulation, power ≠ 100 % (listener signal, not shown)
21User Manual 1175.6578.02 ─ 02
Page 24

R&S®FS-K112PC
Measurements and Result Displays
Graphical Results
In order to synchronize to the signal, the software looks for a poller request. A poller
request consists of a set of low state transitions, whose characteristics depend on the
modulation type. A set of low state transitions in that context is also referred to as a burst.
When the software is synchronized to the signal, it tries to analyze and demodulate all
bursts that it finds in the capture buffer (poller and listener communication).
Note that the R&S FS-K112PC only analyzes bursts of one NFC modulation type at a
time. Therefore, it analyzes subsequent bursts only if they are of the same modulation
type as the first detected modulation type (automatic detection) or if they are of the modulation type you have selected manually from the toolbar.
After the analysis of the NFC bursts is done, the software shows the results for each burst
of the same modulation type as a colored bar at the bottom of the diagram.
Green bar
●
Signal areas where an (NFC) signal has been detected and analyzed. The signal
complies to the specifications by the NFC Forum.
Grey bar
●
Signal areas where an (NFC) signal has been detected, but not analyzed because
the signal does not comply to the currently selected modulation type.
Red bar
●
Signal areas where an (NFC) signal has been detected and analyzed. The signal,
however, does not comply to the currently selected modulation type.
However, even if the signal is a valid NFC signal, demodulation might not be possible.
This may be the case if, for example, the selected modulation type does not match the
modulation type of the signal.
The figure below shows the same signal in both diagrams. In the left picture, the signal
has not been evaluated because the selected modulation type does not match the signal
modulation type. The software shows a grey bar. If the selected modulation type matches
that of the signal, the demodulation did work and the signal is marked by a green bar.
Fig. 3-2: NFC-B signal with NFC-A selected (left) and NFC-B selected (right) (based on example file NFC-
B_Example.iq.tar)
The result display also shows the phase oscillation in the diagram as a red line when you
turn on the display of the phase characteristics (see "Phase Shown" on page 51). In
that case, the right vertical diagram axis represents the scale of the phase display.
22User Manual 1175.6578.02 ─ 02
Page 25

R&S®FS-K112PC
Measurements and Result Displays
Graphical Results
3.1.2 Poller Characteristics
The "Poller PvT" result display shows the level characteristics of the NFC poller over the
period of exactly one low state transition. It also shows if the low state transition is within
the limits defined by the NFC Forum graphically.
Basically, a poller transmission consists of several low state transitions. During a low
state transition, the voltage drops to a lower level than the carrier signal. The number of
low state transitions in the signal depends on the amount of bits that are transmitted.
Fig. 3-3: NFC-A poller signal (based on example file NFC-A_Example.iq.tar)
Viewing all low state transitions
If you want to see all low state transitions of the transmission, use the "Capture Buffer"
result display.
The displayed voltage is the voltage of the signal in % of the carrier signal transmitted by
the poller. The carrier signal is normalized to 100 %.
Note that the result display consists of two panes in case of NFC-B and NFC-F signals.
The left pane shows the falling edge of the low state transition.
●
The right pane shows the rising edge of the low state transition.
●
23User Manual 1175.6578.02 ─ 02
Page 26

R&S®FS-K112PC
ba
ba
i
VV
VV
m
Measurements and Result Displays
Graphical Results
Fig. 3-4: NFC-B poller signal (based on example file NFC-B_Example.iq.tar); NFC-F looks similar
Compared to NFC-A, NFC-B and NFC-F do not define limits for the duration of the low
state transition. Limits are only defined for the rising and falling edges. Thus, the scale
of the horizontal axis is variable for these modulation types and the R&S FS-K112PC
only shows the falling and rising edges.
For NFC-A, the limits and duration of the transition are fix. Therefore, the scale of the
horizontal axis is also fix.
The result display contains several lines, distinguished by colors. For a quick assessment
of the contents of the result display, it includes a key to the colors above the diagram.
Red lines
●
The red lines are the upper and lower limits defined by the NFC Forum. If the signal
complies to the specified limits, all RF traces have to be within the two red lines. If
one of the signal traces violates the limits, the RF test fails.
In case of NFC-A signals, the limits not only define the voltage that the signal should
have, but also the duration of the transmission.
Grey lines
●
The grey lines indicate the modulation depth.
The modulation depth is the magnitude of the voltage drop during the low state transition. The modulation depth is a percentage with the carrier signal being 100%.
The modulation index defined for NFC-B and NFC-F also represents the voltage drop
during the low state transitions, but is a ratio of voltages at defined locations of the
transition.
with Va being the high amplitude and Vb being the low amplitude.
Blue, black and green traces
●
The blue, black and green traces show the level characteristics of the poller signal
over time. The displayed time is a little longer than one NFC low state transition lasts.
The different colors represent different evaluation methods.
– The blue trace represents the minimum voltage that has been measured for all
transitions during the transmission.
24User Manual 1175.6578.02 ─ 02
Page 27

R&S®FS-K112PC
Measurements and Result Displays
Graphical Results
– The light green trace represents the maximum voltage that has been measured
for all transitions during the transmission.
– The black trace represents the average voltage of all transitions during the trans-
mission.
The number of low state transitions included in the evaluation of the minimum, maximum and average voltage depends on the amount of information contained in the
poller request.
Example:
In case of the signal shown below (from the "Capture Buffer" result display), the R&S FS-
K112PC would include seven low state transitions in the evaluation of the minimum,
maximum and average traces.
3.1.3
Fig. 3-5: Several NFC-A low state transitions (based on example file NFC-A_Example.iq.tar)
Listener Characteristics
The "Listener PvT" result display shows the level characteristics (load modulation) of the
NFC listener over the period of the transmission.
The listening device is a passive device that draws its power from the carrier signal that
the NFC poller generates. This passive use of power from an external device is called
load modulation, whose characteristics are the main focus when testing the listening
device.
In case of NFC-A signals, the result display consist of two panes, both showing the load
modulation.
The left pane shows the minimum, maxmimum and average load modulation over
●
eight ASK transitions. Eight transitions correspond to one bit. This number is defined
by the NFC Forum as a quality indicator of the load modulation.
The right pane shows the minimum, maximum and average load modulation over one
●
ASK transition.
25User Manual 1175.6578.02 ─ 02
Page 28

R&S®FS-K112PC
Measurements and Result Displays
Graphical Results
Fig. 3-6: NFC-A listener signal (based on example file NFC-A_Example.iq.tar)
The displayed results are an indicator of the evenness of the ASK transitions. The
load modulation results are displayed in the unit mV. The zero level is normalized to
the 100 % of the voltage of the carrier signal.
In case of NFC-B, the result display shows one pane. The pane shows the minimum,
maximum and average load modulation over all measured ASK transitions.
Fig. 3-7: NFC-B listener signal (based on example file NFC-B_Example.iq.tar)
In case of NFC-F, the result display shows two panes.
The left pane shows the falling edge of the load modulation.
●
The right pane shows the rising edge of the load modulation.
●
26User Manual 1175.6578.02 ─ 02
Page 29

R&S®FS-K112PC
Measurements and Result Displays
Graphical Results
Fig. 3-8: NFC-B listener signal (based on example file NFC-F_424kB_Example.iq.tar)
The listener RF characteristics contain several traces, distinguished by different colors.
For a quick assessment of the contents of the result display, the result display also contains a key to the colors above the diagram.
Grey lines
●
The grey lines indicate the lower and upper load modulation levels.
Blue, black and green traces
●
The blue, black and green traces show the RF characteristics of the load modulation.
The different colors represent different evaluation methods.
– The blue trace represents the maximum load modulation that occured during the
transmission.
– The light green trace represents the minimum load modulation that occured dur-
ing the transmission.
– The black trace represents the average load modulation that occured during the
transmission.
The number of load modulation cycles included in the evaluation of the minimum, maximum and average voltage depends on the number of transmitted bits.
27User Manual 1175.6578.02 ─ 02
Page 30

R&S®FS-K112PC
Measurements and Result Displays
Numerical Results
Example:
In case of the signal shown below (from the "Capture Buffer" result display), the software
would include 17 load modulation cycles in the evaluation of the minimum, maximum and
average traces.
Fig. 3-9: Several NFC-F load modulation cycle (based on example file NFC-F_424kB_Example.iq.tar)
3.2 Numerical Results
The numerical results for NFC measurements show various test results in numerical format.
The R&S FS-K112PC features four numerical result displays, containing different information about the complete RF signal, the NFC poller and the NFC listener.
► Select the "Overview", the"Poller Values", the "Listener Values" or the "Decoding"
item from the "Window" menu.
The software opens the corresponding windows and displays the results if already
available.
3.2.1 Result Overview
The result overview contains basic characteristics of the signal that has been analyzed.
28User Manual 1175.6578.02 ─ 02
Page 31

R&S®FS-K112PC
Measurements and Result Displays
Numerical Results
Fig. 3-10: Result overview containing the results for the analysis of an NFC-F signal (based on example
file NFC-F_212kB_Example.iq.tar)
Analyzed Signal
The "Analyzed Signal" pane of the "Result Overview" contains various general information about the signal currently analyzed.
The analyzed modulation type and bitrate are the modulation type and bitrate that have
been detected. If you have set those two manually, they have to match the actual signal.
Otherwise, the software is not able to decode the signal and will show "n/a" for all results.
The pane also contains general pass and fail information of the poller and listener RF
characteristics regarding the limits defined by the NFC Forum. If the signal is within the
defined limits, the test has "Passed", otherwise it has "Failed". If the result could not be
interpreted, the software shows an "Unclear" information.
The Functional Test checks if the communication between poller and listener works
alright. Details of the functional test are summarized in the Decoding result display.
The signal capture time is the Capture Length defined on the measurement equipment.
Remote command:
FETCh:DEMod:RESult? on page 62
FETCh:LISTener:RF:RESult? on page 62
FETCh:NFC:STANdard? on page 64
FETCh:NFC:BITRate? on page 63
FETCh:POLLer:RF:RESult? on page 64
FETCh:NOFBursts? on page 64
Detected Poller Signals
The "Detected Poller Signals" pane of the "Result Overview" shows the number of poller
signals of each NFC modulation type that has been detected in the recorded I/Q data.
Remote command:
FETCh:NFC:ASIGnals? on page 63
FETCh:NFC:BSIGnals? on page 63
FETCh:NFC:FSIGnals? on page 63
29User Manual 1175.6578.02 ─ 02
Page 32

R&S®FS-K112PC
Measurements and Result Displays
Numerical Results
Capture Buffer
The "Capture Buffer" pane of the "Result Overview" shows the number of all bursts that
have been detected in the signal.
File Information / Instrument Information
The "File Information" pane of the "Result Overview" shows details of the .iq.tar file in
case you analyze a signal from a file. The file information consists of the file name, the
file type and the location of the file.
When record I/Q data from measurement equipment, the "Instrument Information" pane
is shown instead. It contains the IP address and center frequency of the equipment.
3.2.2 Decoded Signal
The "Decoding" result display shows the details of the functional test.
Fig. 3-11: Decoded NFC-F signal (based on example file NFC-F_424kB_Example.iq.tar)
The functional test determines if the communication between NFC devices work. It contains the commands and corresponding bit sequences that have been sent during the
transmission of the signal. The result display shows the commands in consecutive order
and shows if the command is a command sent by the poller or a command sent by the
listener. Poller commands are shown in blue, listener commands in a light shade of blue.
The bit stream can either be displayed as binary or hexadecimal numbers, depending on
the selected "Display Format". If the conversion from binary to hexadecimal leaves a
remainder, the software adds a corresponding number of "0"s to the start of the stream.
The communication works if the listener sends a response to a poller request as expected. If not, the functional test fails. If the communication contains an unknown command,
the functional test will show an "Unclear" message.
SCPI commands:
CONFigure:NFC:DECoding:FORMat on page 81
[SENSe]:DEMod:BITS? on page 81
[SENSe]:DEMod:COMMands? on page 81
3.2.3 Poller Characteristics
The "Poller Values" result display contains miscellaneous test results for the NFC poller.
In addition, it contains an illustration that shows the typical characteristics of an NFC poller
30User Manual 1175.6578.02 ─ 02
Page 33

R&S®FS-K112PC
Measurements and Result Displays
Numerical Results
low state transition. Note that the shape of the low state transistion for NFC-A signals is
different to that of NFC-B and NFC-F signals.
Combining graphical and numerical results
When you display the numerical results, it is best if you do so in combination with the
graphical poller test results.
For more information see chapter 3.1.2, "Poller Characteristics", on page 23.
The poller is defined as the device that actively sends the data and provides the power
necessary for the data transmission.
The "Poller Values" result display is made up out of several elements and result categories.
Fig. 3-12: Poller results of an NFC-F signal (based on example file NFC-F_424kB_Example.iq.tar)
●
NFC-<x> Poller RF Analysis...................................................................................31
● Poller Statistics........................................................................................................34
● Level Calculation.....................................................................................................34
3.2.3.1 NFC-<x> Poller RF Analysis
The RF analysis contains several results that indicate the signal quality. For most results,
the software shows several numbers.
Lower limit
●
Shows the minimum value the result may have and still be compliant to the limits
specified by the NFC Forum.
This number is not a test result, but is taken from the standard.
Minimum
●
Shows the result with the lowest value within the signal section defined for that result.
31User Manual 1175.6578.02 ─ 02
Page 34

R&S®FS-K112PC
Measurements and Result Displays
Numerical Results
The minimum result is determined over all poller signals of the same modulation type
in the capture buffer.
Average
●
Shows the average result within the signal section defined for that result.
The average result is determined over all poller signals of the same modulation type
in the capture buffer.
Maximum
●
Shows the result with the highest value within the signal section defined for that result.
The maximum result is determined over all poller signals of the same modulation type
in the capture buffer.
Upper limit
●
Shows the maximum value the result may have and still be compliant to the limits
specified by the NFC Forum.
This number is not a test result, but is taken from the standard.
The contents depend on the NFC standard. The main difference are the timing results.
In case of the NFC-A modulation type, the low state transition is split into several sections,
each with a different, but fix, length.
Fig. 3-13: Poller RF analysis table for NFC-A signals (based on example file NFC-A_Example.iq.tar)
In case of the NFC-B and NFC-F modulation type, only the length of the rising and falling
flanks need to be evaluated.
Fig. 3-14: Poller RF analysis table for NFC-B and -F signals (based on example file NFC-F_212kB_Exam-
ple.iq.tar)
If the signal is within the limits defined by the NFC Forum, the minimum, average or
maximum value that has been measured is highlighted in green. If one of the measured
values violates the specified limits, it is highlighted in red.
Note that for the modulation index (NFC-B and NFC-F only), the R&S FS-K112PC evaluates a single result only and shows it in the "Average" column.
32User Manual 1175.6578.02 ─ 02
Page 35

R&S®FS-K112PC
Measurements and Result Displays
Numerical Results
Timing results for NFC-A
Each of the five timing results (t1 to t5) evaluates if a particular section of the signal is
within the limits that are defined by NFC Forum. The corresponding sections of t1 to t5 as
defined in the standard are shown in the illustration next to the results.
Remote command:
FETCh:POLLer:TFIVe? on page 70
FETCh:POLLer:TFIVe:LIMit? on page 71
FETCh:POLLer:TFIVe:RESult? on page 71
Timing results for NFC-B and NFC-F
Each of the two timing results (tf and tr) evaluates if the rising or falling slope of the signal
is within the limits that are defined by the NFC Forum. The exact definitions of tf and t
r
are a function of the voltage (VA and VB). They are shown in the illustration next to the
results.
Remote command:
FETCh:POLLer:FTIMe? on page 72
FETCh:POLLer:FTIMe:LIMit? on page 73
FETCh:POLLer:FTIMe:RESult? on page 73
FETCh:POLLer:RTIMe? on page 73
FETCh:POLLer:RTIMe:LIMit? on page 74
FETCh:POLLer:RTIMe:RESult? on page 74
Over- and undershoot results
The over- and undershoot results evaluate if the overshoot and undershoot of the signal
is within the limits that are defined by the NFC Forum. The over- and undershoot are a
percentage of the initial voltage of the carrier signal.
In case of NFC-B and NFC-F the undershoot and overshoot are shown in the illustration
as hr and hf.
Remote command:
FETCh:POLLer:OSHoot? on page 67
FETCh:POLLer:OSHoot:LIMit? on page 68
FETCh:POLLer:OSHoot:RESult? on page 68
FETCh:POLLer:USHoot? on page 69
FETCh:POLLer:USHoot:LIMit? on page 69
FETCh:POLLer:USHoot:RESult? on page 69
ASK Modulation Depth (NFC-A only)
The modulation depth is a result that indicates the magnitude of the voltage drop during
the low state transition. The modulation depth is a percentage with 100% voltage representing the voltage of the carrier signal (V1).
Remote command:
FETCh:POLLer:ASKMod? on page 65
FETCh:POLLer:ASKMod:LIMit? on page 66
FETCh:POLLer:ASKMod:RESult? on page 66
33User Manual 1175.6578.02 ─ 02
Page 36

R&S®FS-K112PC
ba
ba
i
VV
VV
m
Measurements and Result Displays
Numerical Results
Modulation Index [mod_i.F.] (NFC-B and -F only)
The modulation index also represents the power drop during the low state transitions, but
is a ratio of voltages at defined locations of the low state transition.
with Va being the high amplitude and Vb being the low amplitude.
Remote command:
see commands at "ASK Modulation Depth (NFC-A only)" on page 33.
3.2.3.2 Poller Statistics
The statistics section contains statistics about the poller signal.
Analyzed commands
●
Number of commands that have been sent during the transmission of the recorded
signal.
Analyzed bits
●
Number of bits that have been transmitted in the recorded signal.
Analyzed ASK transitions
●
Number of low state transitions that could be found in the recorded signal.
SCPI commands:
FETCh:POLLer:NCOMmands? on page 67
FETCh:POLLer:NBITs? on page 66
FETCh:POLLer:NTRansitions? on page 67
3.2.3.3 Level Calculation
The level calculation shows the factor that has been used to normalize the voltage of the
carrier signal to 100 %.
34User Manual 1175.6578.02 ─ 02
Page 37

R&S®FS-K112PC
Measurements and Result Displays
Numerical Results
Example:
If the voltage of the carrier signal is 2 V, a normalization factor of 0.5 is required to normalize the signal to a 100 %.
2 V * 0.5 = 1 = 100 %
3.2.4 Listener Characteristics
The "Listener Values" result display contains miscellaneous test results for the NFC listener. In addition, it contains an illustration that shows the characteristics of the load
modulation used to transmit an NFC signal. Note that the illustration for NFC-A signals
is different to that of NFC-B and NFC-F signals.
Combining graphical and numerical results
When you display the numerical results, it is best if you do so in combination with the
graphical listemer test results.
For more information see chapter 3.1.2, "Poller Characteristics", on page 23.
Typically, the listener is defined as the device that passively receives the data. In case
of a passive listener, the poller provides the power necessary for the transmission.
The "Listener Values" result display is made up out of several elements and result categories.
Fig. 3-15: Listener results of an NFC-A signal (based on example file NFC-A_Example.iq.tar)
35User Manual 1175.6578.02 ─ 02
Page 38

R&S®FS-K112PC
Measurements and Result Displays
Numerical Results
● NFC-<x> Listener RF Analysis................................................................................36
● Listener Statistics....................................................................................................38
● Level Calculation and Poller Settings......................................................................38
3.2.4.1 NFC-<x> Listener RF Analysis
The RF analysis contains several results that indicate the signal quality. For each result,
the R&S FS-K112PC shows several numbers.
Lower limit
●
Shows the minimum value the result may have and still be compliant to the standard
specification.
This number is not a test result, but is taken from the standard.
Minimum
●
Shows the result with the lowest value within the signal section defined for that result.
The minimum result is determined over all listener signals of the same modulation
type in the capture buffer.
Average
●
Shows the average result within the signal section defined for that result.
The average result is determined over all listener signals of the same modulation type
in the capture buffer.
Maximum
●
Shows the result with the highest value within the signal section defined for that result.
The maximum result is determined over all listener signals of the same modulation
type in the capture buffer.
Upper limit
●
Shows the maximum value the result may have and still be compliant to the standard
specification.
This number is not a test result, but is taken from the standard.
Fig. 3-16: Listener RF analysis table for NFC-A signals (based on example file NFC-A_Example.iq.tar);
the contents of NFC-B and NFC-F are a subset of the parameters shown for NFC-A
If the signal is within the limits defined by the NFC Forum, the minimum, average or
maximum value that has been measured is highlighted in green. If one of the measured
values violates the specified limits, it is highlighted in red.
Note that limits are defined only for the load modulation.
Load Modulation
The two load modulation results evaluate the load which attenuates the electromagnetic
field.
NFC-A
36User Manual 1175.6578.02 ─ 02
Page 39

R&S®FS-K112PC
Measurements and Result Displays
Numerical Results
For NFC-A, the load modulation limits are defined for one bit which consists of 8 ASK
transitions.
Fig. 3-17: 8 ASK transitions in a NFC-A signal, corresponding to 1 bit
The R&S FS-K112PC shows these as well as the load modulation over all ASK transitions
in the signal. The result over all transitions is not measured against limits, because no
limits have been defined by the NFC Forum for that case.
NFC-B
For NFC-B and -F limits are defined for one ASK transition. Thus, the software only shows
the minimum, maxmimum and average load modulation of all ASK transitions that have
been analyzed.
Note that the limit values are different, depending on the poller you are using. For more
information see chapter 3.2.4.3, "Level Calculation and Poller Settings", on page 38.
For more information on load modulation see chapter 3.1.3, "Listener Characteristics",
on page 25.
Remote command:
FETCh:LISTener:LMALl? on page 76
FETCh:LISTener:LMEight? on page 77
FETCh:LISTener:LMEight:LIMit? on page 77
FETCh:LISTener:LMEight:RESult? on page 77
Frame Delay Time Listener / Poller
The frame delay time is the time that goes by between a poller request and subsequent
communication (response or recurring request) or vice versa.
The time between a poller request and the listener response is called "Frame Delay Time
Listener". The time between the listener reponse and a subsequent communication is
called "Frame Delay Time Poller".
= Poller burst
1
2 = Listener burst
3 = Frame delay time listener
4 = Frame delay time poller
37User Manual 1175.6578.02 ─ 02
Page 40

R&S®FS-K112PC
Measurements and Result Displays
Note that the NFC Forum defines no limits for the frame delay time.
Remote command:
FETCh:LISTener:FDTL? on page 75
FETCh:LISTener:FDTP? on page 76
Timing Offset
The timing offset is the time between two bursts.
1
= Transmission (on time)
2 = Timing offset (off time)
Remote command:
FETCh:LISTener:TOFF? on page 79
Numerical Results
3.2.4.2 Listener Statistics
The statistics section contains statistics about the listener signal.
Analyzed commands
●
Number of commands that have been sent during the transmission of the recorded
signal.
Analyzed bits
●
Number of bits that have been transmitted in the recorded signal.
Analyzed ASK transitions
●
Number of ASK transitions that could be found in the recorded signal.
SCPI commands:
FETCh:LISTener:NBITs? on page 78
FETCh:LISTener:NCOMmands? on page 78
FETCh:LISTener:NTRansitions? on page 78
3.2.4.3 Level Calculation and Poller Settings
The I/Q data that the R&S FS-K112PC analyzes is recorded as RMS values. However,
load modulation is not calculated as an RMS value. Therefore, the input signal has to be
normalized by a factor of root 2 to get the load modulation result.
38User Manual 1175.6578.02 ─ 02
Page 41

R&S®FS-K112PC
Measurements and Result Displays
Numerical Results
SCPI command:
[SENSe]:LISTener:RAWFactor on page 80
[SENSe]:LISTener:RMSFactor on page 80
Poller settings
The NFC Forum defines three different poller reference antennas with different characteristics. The used poller changes the limits of the load modulation as defined by the NFC
Forum.
SCPI command:
[SENSe]:LISTener:UPFL on page 80
3.2.5 Exporting Numerical Results
The R&S FS-K112PC allows you to export the numerical test results as a html file, for
example for documentation purposes.
► Select the "Export Results" item from the "File" menu.
The software opens a dialog box to define the name and directory for the html file.
The file contains four separate tables. Each table corresponds to one of the available
numerical results displays. Therefore, the html file basically contains the same information as the numerical result displays available in the software.
Results that have passed the limits defined by the standard are highlighted green. Results
that pass in parts are highlighted in yellow and results that have failed in red.
39User Manual 1175.6578.02 ─ 02
Page 42

R&S®FS-K112PC
Measurements and Result Displays
Numerical Results
SCPI command:
MMEMory:NFC:STORe:RESults on page 61
Result Overview
The result overview contains basic characteristics of the signal that has been analyzed.
For more information on each result see chapter 3.2.1, "Result Overview", on page 28.
Poller Values
The "Poller Values" result display contains miscellaneous test results for the NFC poller.
For more information on each result see chapter 3.2.3, "Poller Characteristics",
on page 30.
Listener Values
The "Listener Values" result display contains miscellaneous test results for the NFC listener.
40User Manual 1175.6578.02 ─ 02
Page 43

R&S®FS-K112PC
Measurements and Result Displays
Numerical Results
For more information on each result see chapter 3.2.4, "Listener Characteristics",
on page 35.
Decoding
The "Decoding" result display shows the commands and corresponding bit sequences
that have been sent during the transmission
For more information see chapter 3.2.2, "Decoded Signal", on page 30.
41User Manual 1175.6578.02 ─ 02
Page 44

R&S®FS-K112PC
4 Configuration
Configuration
Managing Measurement Configurations
The R&S FS-K112PC provides several tools and ways to configure an NFC test setup.
● chapter 4.1, "Managing Measurement Configurations", on page 42 (via the menu
bar)
● chapter 4.2, "Selecting the NFC Modulation Type", on page 43 (via the toolbar)
● chapter 4.4, "Configuring the Measurement Equipment", on page 45 (via the "Set-
tings" dialog)
● chapter 4.5, "Triggering Measurements", on page 48 (via the "Settings" dialog)
● chapter 4.6, "Defining Diagram Properties", on page 50 (via the "Settings" dialog)
► Select the "Settings" menu item from the "Tools" menu.
The software opens the "Settings" dialog box.
For an overview of the contents, see the corresponding topics below.
Note that you have to confirm any changes you have made in the dialog box by pressing
the "OK" button. If you have entered an invalid value, the R&S FS-K112PC gives a corresponding message.
● Managing Measurement Configurations.................................................................42
● Selecting the NFC Modulation Type.......................................................................43
● Selecting a Particular Burst.....................................................................................44
● Configuring the Measurement Equipment...............................................................45
● Triggering Measurements.......................................................................................48
● Defining Diagram Properties...................................................................................50
4.1 Managing Measurement Configurations
The R&S FS-K112PC provides functionality to save and restore a measurement configuration. Saving a configuration is an easy way if a particular configuration is necessary
more than once.
Saving measurement configurations
► Select the "Save Settings" menu item from the "Settings" menu.
42User Manual 1175.6578.02 ─ 02
Page 45

R&S®FS-K112PC
Configuration
Selecting the NFC Modulation Type
The software opens a dialog box to save the current measurement configuration in
a file with the *.nfcset file extension.
SCPI command:
MMEMory:NFC:STORe:SETTings on page 61
Restoring measurement configurations
► Select the "Recall Settings" menu item from the "Settings" menu.
The software opens a dialog box to select a file in the *.nfcset format that contains a
previously saved measurement configuration.
SCPI command:
MMEMory:NFC:LOAD:SETTings on page 60
4.2 Selecting the NFC Modulation Type
The NFC Forum defines three near field communication modulation standards: NFC-A,
NFC-B and NFC-F. Each modulation type supports one or more bitrates also defined by
the NFC Forum. The R&S FS-K112PC supports measurements on all three modulation
types and all available bitrates.
Selecting the modulation type
By default, the R&S FS-K112PC automatically detects the modulation type and its bitrate.
In case of automatic detection, the software analyzes the first modulation type it can find
in the current capture buffer. If you know the modulation type and bitrate you want to test
43User Manual 1175.6578.02 ─ 02
Page 46

R&S®FS-K112PC
Configuration
Selecting a Particular Burst
or want to test a particular modulation type (that is not necessarily the first one) in a multimodulation type signal, you can also select the modulation type and bitrate manually.
► In the toolbar, select the modulation type from the "NFC Standard" dropdown menu.
SCPI command:
CONFigure:NFC:STANdard on page 83
Selecting the bitrate
► In the toolbar, select the bitrate from the "NFC Bitrate" dropdown menu.
Note that the available bitrates (or transmission speeds) depend on the modulation
type you have selected:
● NFC-A supports 106 kbit/s
● NFC-B supports 106 kbit/s
● NFC-F supports 212 and 424 kbit/s
SCPI command:
CONFigure:NFC:BITRate on page 83
Interdependences of modulation type and bitrate
If both modulation and bitrate are determined automatically, the software analyzes
●
the first burst in the capture buffer.
If you have selected automatic detection of the modulation type and a particular
●
bitrate, the software analyzes the first burst with the selected bitrate.
If you have selected a particular modulation type and automatic detection of the
●
bitrate, the software analyzes the first burst with the selected modulation.
4.3 Selecting a Particular Burst
By default, the R&S FS-K112PC analyzes the first NFC burst that it can find in the capture
buffer, regardless of its modulation type and bitrate.
If several NFC bursts are available in the capture buffer, the software also allows you to
analyze a particular burst.
44User Manual 1175.6578.02 ─ 02
Page 47

R&S®FS-K112PC
Configuration
Configuring the Measurement Equipment
► In the toolbar, select the number of the burst you want to analyze from the "Burst
No." dropdown menu.
The size of the dropdown menu corresponds to the number of NFC bursts that the
R&S FS-K112PC has detected in the I/Q data. For example, if the signal contains
five bursts, the dropdown menu contains five entries.
SCPI command:
CONFigure:NFC:BURSt on page 83
Availability of burst selection
Burst selection is only possible after the I/Q data has been recorded because the software
first needs to determine the number of NFC bursts in the capture buffer.
If you want to select a burst before the I/Q data has been captured and evaluated, only
automatic selection or evaluation of the first burst are available.
When you have selected a particular burst, use the "Refresh" button (
) to evaluate that
burst.
Interdependences with modulation type and bitrate
If all three parameters (modulation, bitrate and burst number) are detected automat-
●
ically, the software analyzes the first NFC burst.
If you have selected a particular modulation and / or bitrate with automatic burst
●
selection, the software analyzes the first corresponding NFC burst. The first corresponding NFC burst may be the first burst in the capture buffer, or the <n>th burst in
the capture buffer. If it does not find a burst of the selected standard, it does not
evaluate any results.
If you have selected automatic detection of the standard and / or bitrate, but a par-
●
ticular burst number, the software analyzes that burst only.
If you have selected a particular modulation and / or bitrate and a particular burst
●
number, the software also analyzes the burst you have selected. If the burst does not
comply to the selected modulation and bitrate, the software does not evaluate any
results.
4.4 Configuring the Measurement Equipment
If you are recording signals with an analyzer or oscilloscope, you need to set up and
establish a connection. You also have to define the basic signal or measurement characteristics in order to get valid results.
45User Manual 1175.6578.02 ─ 02
Page 48

R&S®FS-K112PC
Configuration
Configuring the Measurement Equipment
The measurement instrument is either a Rohde & Schwarz spectrum analyzer or oscilloscope. For a list of supported measurement equipment see chapter 2.5, "Connecting
Measurement Equipment", on page 16.
All necessary settings are part of the "Settings" dialog box.
Instrument IP Address...................................................................................................46
Center Frequency.........................................................................................................46
Sample Rate.................................................................................................................47
Capture Length.............................................................................................................47
(Auto) Level...................................................................................................................47
Attenuation....................................................................................................................47
Noise Tolerance............................................................................................................48
Channel (RTO only)......................................................................................................48
Instrument IP Address
Defines the IP address of the instrument.
If you don't know the IP address of the analyzer, you can figure it out on the analyzer
itself. For more information see chapter 2.5, "Connecting Measurement Equipment",
on page 16.
If you are not sure if the IP address you have entered is the right one, you can check if
the connection was successful with the "Check Connection" button.
Remote command:
CONFigure:ADDRess<instid> on page 82
Center Frequency
Defines the frequency of the NFC signal in MHz.
46User Manual 1175.6578.02 ─ 02
Page 49

R&S®FS-K112PC
Configuration
Configuring the Measurement Equipment
The frequency corresponds to the center frequency the measurement equipment is tuned
to. For measurements on a signal compliant to the NFC standard, the frequency is usually
13.56 MHz.
Remote command:
[SENSe]:FREQuency:CENTer on page 85
Sample Rate
Defines the sample rate in MHz used used during signal processing.
To get valid measurement results, a sample rate of at least 10 MHz is recommended.
Remote command:
TRACe:IQ:SRATe on page 86
Capture Length
Defines the amount of data to be captured.
The capture length corresponds to the amount of I/Q data that the measurement equipment captures during the measurements. Make sure that all NFC commands you want
to analyze are captured completely.
Remote command:
[SENSe]:SWEep:TIME on page 86
(Auto) Level
Defines the expected power level of the NFC signal at the RF input.
The expected level corresponds to the reference level of the measurement equipment.
You can define the level manually or turn on automatic detection of the signal level. If you
select automatic detection of the level, the software performs a test measurement that
determines the signal power. Based on this measurement, the software subsequently
sets the ideal reference level for the measurement.
The "Auto Level Track Time" defines the duration of the test measurement that determines the ideal level.
Remote command:
CONFigure:POWer:AUTO on page 84
DISPlay:TRACe:Y:RLEV on page 84
[SENSe]:POWer:AUTO:TIME on page 85
Attenuation
Defines the attenuation level of an analyzer.
Attenuation of the signal may become necessary if you have to reduce the power of the
signal that you have applied. Power reduction is necessary, for example, to prevent an
overload of the input mixer.
The range of the RF attenuation depends on the hardware you are using in the measurement setup. For details refer to its data sheet.
Manual selection of the attenuation is available for measurements with a spectrum or
signal analyzer and if "Auto Level" is off.
Remote command:
INPut:ATTenuation on page 84
47User Manual 1175.6578.02 ─ 02
Page 50

R&S®FS-K112PC
Configuration
Triggering Measurements
Noise Tolerance
Selects the tolerance that the software applies to find a NFC signal in the vicinity of noise.
A high tolerance only finds bursts whose distance to the noise floor is large. A low tolerance on the other hand also aims to find bursts that otherwise might get lost in the noise
floor.
Remote command:
[SENSe]:NFC:NTOLerance on page 85
Channel (RTO only)
Selects the channel number the signal is applied to.
Channel selection is available for measurements with an oscilloscope. The number of
channels you can select from depends on the hardware configuration of the oscilloscope.
If necessary, you can select an impedance of 1 MΩ instead of the default 50 Ω (➙ "Use
1 MOhm Coupling").
Remote command:
CONFigure:CHANnel on page 82
CONFigure:COUPling on page 82
4.5 Triggering Measurements
The R&S FS-K112PC supports several trigger types or sources and the appropriate trig-
ger settings.
All necessary settings are part of the "Settings" dialog box.
48User Manual 1175.6578.02 ─ 02
Page 51

R&S®FS-K112PC
Configuration
Triggering Measurements
Trigger Type..................................................................................................................49
Trigger Event.................................................................................................................49
Trigger Characteristics..................................................................................................49
Trigger Type
Selects the trigger source.
Using a trigger initiates a measurement only under certain circumstances (the trigger
event). After the trigger event has happened, the analyzer measures until the required
amount of data has been captured. The R&S FS-K112PC supports the use of several
trigger sources or types.
Free Run
●
Free Run mode is basically a measurement without a trigger. The measurement
instrument captures data regardless of the I/Q data contents.
External
●
Starts the measurement when the signal meets or exceeds a particular power level
at the external trigger input of the equipment.
IF Power (spectrum analyzer only)
●
Starts the measurement when the IF power meets or exceeds a particular power level
at the IF stage of the signal processing.
NFC Trigger (RTO only)
●
Starts the measurement on a poller request (NFC-A and -B) or the characteristic Start
of Sequence (SoS) pattern (NFC-F).
Because the poller request is distinctive for each modulation type, the R&S RTO
provides a customized trigger for each modulation type and bitrate.
Note that you can additionally select a trigger event for each NFC standard.
Remote command:
TRIGger:MODE on page 88
Trigger Event
Selects a trigger event for the NFC trigger source.
The available trigger events depend on the modulation and bitrate of the NFC signal.
NFC-A
●
The trigger events for NFC-A are the commands SENS_REQ and ALL_REQ.
NFC-B
●
The trigger events for NFC-B are the commands SENSB_REQ and ALLB_REQ.
NFC-F
●
The trigger event for NFC-F is the characteristic Start of the bit Sequence (SoS) with
a length of 48 or 96 bits.
Remote command:
TRIGger:EVENt on page 86
Trigger Characteristics
In addition to the trigger source, you can define several trigger characteristics.
The trigger level defines the voltage that the signal must meet or exceed in order to
initiate a measurement. For the NFC trigger, the R&S FS-K112PC supports the automatic
definition of the trigger level. In that case, the trigger level is selected according to the
typical level of the NFC signal.
49User Manual 1175.6578.02 ─ 02
Page 52

R&S®FS-K112PC
Configuration
Defining Diagram Properties
The trigger hold off time defines a time period that has to pass between one trigger
event and the next. If the trigger event happens before this hold off time is over, it does
not initiate a new measurement.
The time out time defines the time that the trigger is armed. If the R&S FS-K112PC
detects no signal within the time out period, it aborts the measurement.
The trigger offset (or delay) is the time that should pass between the trigger event and
the start of the measurement. The trigger offset is a certain period of time in ms. An
automatic trigger offset makes sure that the signal itself is at the beginning of the capture
buffer.
Remote command:
Trigger level:
TRIGger:LEVel:AUTO on page 87
TRIGger:LEVel[:VALue] on page 87
Holdoff time:
TRIGger:HOLDoff[:TIME] on page 87
Time out time:
TRIGger:TIMeout[:TIME] on page 89
Trigger offset:
TRIGger:OFFSet:AUTO on page 88
TRIGger:OFFSet:TIME on page 88
4.6 Defining Diagram Properties
All necessary settings are part of the "Settings dialog box."
50User Manual 1175.6578.02 ─ 02
Page 53

R&S®FS-K112PC
Configuration
Defining Diagram Properties
File Reduced To Burst..................................................................................................51
Phase Shown................................................................................................................51
File Reduced To Burst
Turns a reduction of the recorded signal on and off.
If on, the software analyzes only those parts of the recorded signal that it detects as a
burst according to one of the modulation types. The rest of the data is dismissed. Reducing the data to the bursts increases the speed of the measurement.
If the capture buffer contains several bursts, the software displays only the burst that is
currently analyzed. Thus, the software shows an improved performance when you have
captured several bursts and reduce the file to burst.
Remote command:
[SENSe]:NFC:FRTBurst on page 89
Phase Shown
Turns the display of the phase characteristics of the signal on and off.
Remote command:
[SENSe]:NFC:PSHown on page 90
51User Manual 1175.6578.02 ─ 02
Page 54

R&S®FS-K112PC
5 Analysis
Analysis
The R&S FS-K112PC provides several tools to get more detailed information on the
measurement results. The corresponding tools are part of the context menu.
► Click anywhere within the diagram area of one of the result displays with the right
mouse button.
The context menu opens.
Taking a screenshot of the results
The R&S FS-K112PC allows you to save a copy of the result display to the computer
clipboard. Alternatively, you can directly save an image of the result display to an internal
or external storage device in various image formats like emf, png or jpg.
► Select the "Copy" or "Save Image As..." menu item from the context menu.
When you copy the results, the software moves the screenshot to the clipboard.
When you save the image, the software opens a dialog box to define a name and file
format for the screenshot.
Printing the results
The R&S FS-K112PC allows you to send a copy of the result display to any of the printers
you have installed on your computer.
Before you print the results, you can configure the printer page setup.
► Select the "Page Setup..." menu item from the context menu.
The software opens a dialog box to define the page layout
► Select the "Print..." menu item from the context menu.
The software sends the copy of the result display to the selected printing device.
Displaying numeric results in the diagram
If you want to see the exact results or values at a particular point of one of the traces,
you can turn on the display of coordinates when you move the mouse over a line or trace.
Note that this works only in places of the diagram where it is occupied by a line or trace.
52User Manual 1175.6578.02 ─ 02
Page 55

R&S®FS-K112PC
Analysis
► Select the "Show Point Values" menu item from the context menu.
Zooming into the diagram
If you want to see parts of the diagram area in more detail, you can use the zoom.
► Mark the area by keeping the mouse button pressed and moving the cursor over the
area you need to see in more detail.
You can zoom in as far as you want. The software adjusts the scale and labels of the
horizontal and vertical axis accordingly.
► To zoom out again, select "Unzoom" from the context menu.
Note that if you use "Unzoom", the software only zooms back to the last magnification
stage. So if you used the zoom three times, you also have to unzoom three times to
return to the original state of the diagram.
To return to the default state, select "Set Scale to Default" from the context menu.
53User Manual 1175.6578.02 ─ 02
Page 56

R&S®FS-K112PC
6 Remote Control Commands
Remote Control Commands
Introduction
The following remote control commands are necessary to use the NFC measurement
software.
● Introduction.............................................................................................................54
● Common Commands..............................................................................................58
● Measurement Control..............................................................................................59
● General Commands................................................................................................59
● Result Overview......................................................................................................62
● Querying NFC-A Poller Results..............................................................................65
● Querying NFC-B and -F Poller Results...................................................................72
● Querying NFC-A Listener Results...........................................................................75
● Querying NFC-B and -F Listener Results...............................................................79
● Configuring Listener Characteristics.......................................................................80
● Signal Decoding......................................................................................................80
● Instrument Configuration.........................................................................................82
● Trigger Configuration..............................................................................................86
● Result Display Configuration...................................................................................89
6.1 Introduction
Commands are program messages that a controller (e.g. a PC) sends to the instrument
or software. They operate its functions ('setting commands') and request information
('query commands'). Some commands only work either way (setting only, query only),
others work both ways (setting and query).
The syntax of a SCPI command consists of a so-called header and, in most cases, one
or more parameters. A query command must append a question mark after the last
header element, even if it contains a parameter.
A header contains one or more keywords, separated by a colon. Header and parameters
are separated by a "white space" (ASCII code 0 to 9, 11 to 32 decimal, e.g. blank). If
there is more than one parameter for a command, these are separated by a comma from
one another.
This chapter summarizes the most important characteristics that you need to know when
working with SCPI commands. For a more complete description, refer to the manual of
one of the R&S analyzers.
Remote command examples
Note that some remote command examples mentioned in this introductory chapter may
not be supported by this application.
54User Manual 1175.6578.02 ─ 02
Page 57

R&S®FS-K112PC
Remote Control Commands
Introduction
6.1.1 Long and Short Form
The keywords have a long and a short form. You can use either the long or the short
form, but no other abbreviations of the keywords.
The short form is emphasized in upper case letter. Note however, that this emphasis only
serves the purpose to distinguish the short from the long form in the manual. For the
instrument, the case does not matter.
Example:
SENSe:FREQuency:CENTer is the same as SENS:FREQ:CENT.
6.1.2 Numeric Suffixes
Some keywords have a numeric suffix if the command can be applied to multiple instances of an object. In that case, the suffix selects a particular instance (e.g. a measurement
window).
Numeric suffixes are indicated by angular brackets (<n>) next to the keyword.
If you don't use a suffix for keywords that support one, it is treated as a 1.
Example:
DISPlay[:WINDow<1...4>]:ZOOM:STATe enables the zoom in a particular measurement window, selected by the suffix at WINDow.
DISPlay:WINDow4:ZOOM:STATe ON refers to window 4.
6.1.3 Optional Keywords
Some keywords are optional and are only part of the syntax because of SCPI compliance.
You can include them in the header or not.
Note that if an optional keyword has a numeric suffix and you need to use the suffix, you
have to include the optional keyword. Otherwise, the suffix is recognized as a 1.
Optional keywords are emphasized with square brackets.
Example:
Without a numeric suffix in the optional keyword:
[SENSe:]FREQuency:CENTer is the same as FREQuency:CENTer
With a numeric suffix in the optional keyword:
DISPlay[:WINDow<1...4>]:ZOOM:STATe
DISPlay:ZOOM:STATe ON enables the zoom in window 1 (no suffix).
DISPlay:WINDow4:ZOOM:STATe ON enables the zoom in window 4.
55User Manual 1175.6578.02 ─ 02
Page 58

R&S®FS-K112PC
Remote Control Commands
Introduction
6.1.4 | (Vertical Stroke)
A vertical stroke indicates alternatives for a specific keyword. You can use both keywords
to the same effect.
Example:
[SENSe:]BANDwidth|BWIDth[:RESolution]
In the short form without optional keywords, BAND 1MHZ would have the same effect as
BWID 1MHZ.
6.1.5 SCPI Parameters
Many commands feature one or more parameters.
If a command supports more than one parameter, these are separated by a comma.
Example:
LAYout:ADD:WINDow Spectrum,LEFT,MTABle
Parameters may have different forms of values.
● Numeric Values.......................................................................................................56
● Boolean...................................................................................................................57
● Text.........................................................................................................................57
● Character Strings....................................................................................................58
● Block Data...............................................................................................................58
6.1.5.1 Numeric Values
Numeric values can be entered in any form, i.e. with sign, decimal point or exponent. In
case of physical quantities, you can also add the unit. If the unit is missing, the command
uses the basic unit.
Example:
with unit: SENSe:FREQuency:CENTer 1GHZ
without unit: SENSe:FREQuency:CENTer 1E9 would also set a frequency of 1 GHz.
Values exceeding the resolution of the instrument are rounded up or down.
If the number you have entered is not supported (e.g. in case of discrete steps), the
command returns an error.
Instead of a number, you can also set numeric values with a text parameter in special
cases.
MIN/MAX
●
Defines the minimum or maximum numeric value that is supported.
DEF
●
Defines the default value.
56User Manual 1175.6578.02 ─ 02
Page 59

R&S®FS-K112PC
Remote Control Commands
Introduction
UP/DOWN
●
Increases or decreases the numeric value by one step. The step size depends on
the setting. In some cases you can customize the step size with a corresponding
command.
Querying numeric values
When you query numeric values, the system returns a number. In case of physical quantities, it applies the basic unit (e.g. Hz in case of frequencies). The number of digits after
the decimal point depends on the type of numeric value.
Example:
Setting: SENSe:FREQuency:CENTer 1GHZ
Query: SENSe:FREQuency:CENTer? would return 1E9
In some cases, numeric values may be returned as text.
INF/NINF
●
Infinity or negative infinity. Represents the numeric values 9.9E37 or -9.9E37.
NAN
●
Not a number. Represents the numeric value 9.91E37. NAN is returned in case of
errors.
6.1.5.2 Boolean
Boolean parameters represent two states. The "ON" state (logically true) is represented
by "ON" or a numeric value 1. The "OFF" state (logically untrue) is represented by "OFF"
or the numeric value 0.
Querying boolean parameters
When you query boolean parameters, the system returns either the value 1 ("ON") or the
value 0 ("OFF").
Example:
Setting: DISPlay:WINDow:ZOOM:STATe ON
Query: DISPlay:WINDow:ZOOM:STATe? would return 1
6.1.5.3 Text
Text parameters follow the syntactic rules of keywords. You can enter text using a short
or a long form. For more information see chapter 6.1.1, "Long and Short Form",
on page 55.
Querying text parameters
When you query text parameters, the system returns its short form.
57User Manual 1175.6578.02 ─ 02
Page 60

R&S®FS-K112PC
Remote Control Commands
Common Commands
Example:
Setting: SENSe:BANDwidth:RESolution:TYPE NORMal
Query: SENSe:BANDwidth:RESolution:TYPE? would return NORM
6.1.5.4 Character Strings
Strings are either text or number. They have to be in straight quotation marks. You can
use a single quotation mark - ' - or a double quotation mark - ".
Example:
INSTRument:DELete 'Spectrum'
6.1.5.5 Block Data
Block data is a format which is suitable for the transmission of large amounts of data.
The ASCII character # introduces the data block. The next number indicates how many
of the following digits describe the length of the data block. In the example the 4 following
digits indicate the length to be 5168 bytes. The data bytes follow. During the transmission
of these data bytes all end or other control signs are ignored until all bytes are transmitted.
#0 specifies a data block of indefinite length. The use of the indefinite format requires a
NL^END message to terminate the data block. This format is useful when the length of
the transmission is not known or if speed or other considerations prevent segmentation
of the data into blocks of definite length.
6.2 Common Commands
*IDN?..............................................................................................................................58
*RST...............................................................................................................................58
*IDN?
This command queries information about the software version.
Return values:
<Identification> String containing parameters about the software version.
Example:
*IDN
would return, e.g.
'Rohde&Schwarz,K112,000000/000,Version1.0'
Usage: Query only
*RST
This command initiates a reset of the R&S FS-K112PC.
A reset restore the default configuration.
58User Manual 1175.6578.02 ─ 02
Page 61

R&S®FS-K112PC
Remote Control Commands
Measurement Control
Example:
*RST
Resets the software.
Usage: Event
6.3 Measurement Control
The following commands are required to perform and control measurements.
INITiate:REFResh............................................................................................................59
INITiate[:IMMediate].........................................................................................................59
INITiate:REFResh
This command updates the measurement results based on the I/Q data currently in the
capture buffer.
Note that the command does not initiate a recording of new I/Q data.
Example:
INIT:REFR
Updates the measurement results.
Usage: Event
INITiate[:IMMediate]
This command initiates a measurement sequence.
The measurement sequence consists of the recording of I/Q data on the measurement
equipment and subsequent analysis of the I/Q data.
Example:
INIT
Initiates the measurement.
Usage: Event
6.4 General Commands
The following commands are necessary to store and load instrument settings and import
and export measurement results.
FORMat[:DATA]...............................................................................................................60
MMEMory:NFC:LOAD:IQ..................................................................................................60
MMEMory:NFC:LOAD:SETTings.......................................................................................60
MMEMory:NFC:STORe:IQ................................................................................................60
MMEMory:NFC:STORe:RESults........................................................................................61
MMEMory:NFC:STORe:SETTings.....................................................................................61
SYSTem:PRESet.............................................................................................................61
TRACe[:DATA]?..............................................................................................................61
59User Manual 1175.6578.02 ─ 02
Page 62

R&S®FS-K112PC
Remote Control Commands
General Commands
FORMat[:DATA] [<Format>]
This command selects the data format that is used for transmission of trace data.
Parameters:
<Format> ASCii
ASCii format, separated by commas.
This format is almost always suitable, regardless of the actual data
format. However, the data is not as compact as other formats may
be.
REAL,32
32-bit IEEE 754 floating-point numbers in the "definite length block
format".
Example:
MMEMory:
This command restores a previously saved I/Q data file.
Setting parameters:
<Filename> Sting containing the file name and path.
Example:
Usage: Setting only
MMEMory:NFC:LOAD:SETTings <Filename>
This command restores a previously saved configuration file.
Setting parameters:
<Filename> String containing the file name and path.
NFC:LOAD:IQ <Filename>
FORM ASC
Selects the ASCII format.
The extension of the file is *.iq.tar.
MMEM:NFC:LOAD:IQ 'c:
\signals\iq_nfc_data.iq.tar'
Loads the I/Q file iq_nfc_data.iq.tar located in the directory
c:\signals\.
The extension of the file *.nfcset.
Example:
Usage: Setting only
MMEMory:NFC:STORe:IQ <Filename>
This command saves recorded I/Q data to a file.
Parameters:
<Filename> String containing the file name and path.
MMEM:NFC:LOAD:SETT 'nfc_settings.nfcset'
Loads the I/Q data file nfc_settings.nfcset.
The extension of the file is *.iq.tar.
60User Manual 1175.6578.02 ─ 02
Page 63

R&S®FS-K112PC
Remote Control Commands
General Commands
Example:
Usage: Setting only
MMEMory:NFC:STORe:RESults <Filename>
This command exports measurement results as a html file.
Parameters:
<Filename> String containing the path and file name.
Example:
Usage: Setting only
MMEMory:
This command saves the currrent software configuration to a file.
Setting parameters:
<Filename> String containing the file name and path.
NFC:STORe:SETTings <Filename>
MMEM:NFC:STOR:IQ 'iq_nfc_data.iq.tar'
Saves the I/Q data to a the file iq_nfc_data.iq.tar.
The extension of the file is *.html.
MMEM:NFC:STOR:RES 'c:\iq_nfc_data.html'
Exports the I/Q data to file c:\iq_nfc_data.html.
The extension of the file is *.nfcset.
Example:
Usage: Event
SYSTem:PRESet
This command presets the software.
Example:
Usage: Event
TRACe[:DATA]? <ResultType>
This command queries the I/Q data.
Parameters:
<ResultType> TRACE1
MMEM:NFC:STOR:SETT 'c:
\signals\nfc_settings.nfcset'
Saves the settings to file c:
\signals\nfc_settings.nfcset.
SYST:PRES
Initiates a preset.
Queries the I/Q data shown in the Capture Buffer.
61User Manual 1175.6578.02 ─ 02
Page 64

R&S®FS-K112PC
Remote Control Commands
Result Overview
Return values:
<TraceData> List of level values in % of the continuous wave signal.
The amount of values depends on the capture length and sample
rate.
6.5
Example:
TRAC? TRACE1
would return, e.g.
99.6267547607422,100.052139282227,
99.947868347168,99.8878326416016,99.8515625,
100.108985900879,99.5992965698242,...
Usage: Query only
Result Overview
The following commands query general measurement results.
FETCh:DEMod:RESult?....................................................................................................62
FETCh:LISTener:RF:RESult?............................................................................................62
FETCh:NFC:BITRate?......................................................................................................63
FETCh:NFC:ASIGnals?....................................................................................................63
FETCh:NFC:BSIGnals?....................................................................................................63
FETCh:NFC:FSIGnals?....................................................................................................63
FETCh:NFC:STANdard?...................................................................................................64
FETCh:NOFBursts?.........................................................................................................64
FETCh:POLLer:RF:RESult?..............................................................................................64
FETCh:DEMod:RESult? <DemodResuls>
This command queries the result of the functional check as shown in the "Result Overview".
Return values:
<DemodResuls> PASS
The functional test was successful.
FAIL
The functional test was not successful.
UNCLEAR
The functional test result could not be determined.
Example:
FETCh:DEM:RES?
would return, e.g.:
PASSED
Usage: Query only
FETCh:LISTener:RF:RESult? <RFResuls>
This command queries the result of the listener test as shown in the "Result Overview".
62User Manual 1175.6578.02 ─ 02
Page 65

R&S®FS-K112PC
Remote Control Commands
Result Overview
Return values:
<RFResuls> FAIL
Listener test has failed.
NAV
Result not available.
PASS
Listener test has passed.
UNSYNC
Software could not synchronize with the signal.
Example:
Usage: Query only
FETCh:NFC:BITRate?
This command queries the NFC bitrate of the signal that has been analyzed.
Return values:
<NFCBitrate> BR106
Example:
Usage: Query only
FETC:LIST:RF:RES?
would return, e.g.
FAIL
The bitrate is 106 kbit/s.
BR212
The bitrate is 212 kbit/s.
BR424
The bitrate is 424 kbit/s.
FETC:NFC:BITR?
would return, e.g.
BR212
FETCh:NFC:ASIGnals?
FETCh:NFC:BSIGnals?
FETCh:NFC:FSIGnals?
This command queries the number of poller commands that have been analyzed.
Return values:
<Number> Number of NFC-A, -B and -F poller commands in the I/Q data.
The modulation type is defined by the last syntax element.
Example:
Usage: Query only
FETC:NFC:ASIG?
Queries the number of NFC-A poller commands and would return,
e.g.:
2
63User Manual 1175.6578.02 ─ 02
Page 66

R&S®FS-K112PC
Remote Control Commands
Result Overview
FETCh:NFC:STANdard?
This command queries the NFC modulation type that has been analyzed.
Return values:
<NFCStandard> NFCA
The signal is based on NFC-A.
NFCB
The signal is based on NFC-B.
NFCF
The signal is based on NFC-F.
Example:
Usage: Query only
FETCh:
This command queries the number of bursts found in the capture buffer.
Return values:
<Bursts> Number of NFC bursts.
Example:
Usage: Query only
FETCh:POLLer:RF:RESult? <RFResuls>
This command queries the result of the poller test as shown in the "Result Overview".
Return values:
<RFResuls> FAIL
NOFBursts?
FETC:NFC:STAN?
would return, e.g.:
NFCB
FETC:NOFB?
would return, e.g.
3
Poller test has failed.
NAV
Result not available.
PASS
Poller test has passed.
UNSYNC
Software could not synchronize with the signal.
Example:
Usage: Query only
FETC:POLL:RF:RES?
would return, e.g.:
PASS
64User Manual 1175.6578.02 ─ 02
Page 67

R&S®FS-K112PC
Remote Control Commands
Querying NFC-A Poller Results
6.6 Querying NFC-A Poller Results
The following commands query the results of NFC-A signals.
FETCh:POLLer:ASKMod?................................................................................................65
FETCh:POLLer:ASKMod:LIMit?.........................................................................................66
FETCh:POLLer:ASKMod:RESult?.....................................................................................66
FETCh:POLLer:NBITs?....................................................................................................66
FETCh:POLLer:NFACtor?.................................................................................................67
FETCh:POLLer:NCOMmands?..........................................................................................67
FETCh:POLLer:NTRansitions?..........................................................................................67
FETCh:POLLer:OSHoot?..................................................................................................67
FETCh:POLLer:OSHoot:LIMit?..........................................................................................68
FETCh:POLLer:OSHoot:RESult?.......................................................................................68
FETCh:POLLer:USHoot?..................................................................................................69
FETCh:POLLer:USHoot:LIMit?..........................................................................................69
FETCh:POLLer:USHoot:RESult?.......................................................................................69
FETCh:POLLer:TONE?....................................................................................................70
FETCh:POLLer:TTWO?....................................................................................................70
FETCh:POLLer:TTHRee?.................................................................................................70
FETCh:POLLer:TFOur?....................................................................................................70
FETCh:POLLer:TFIVe?....................................................................................................70
FETCh:POLLer:TONE:LIMit?............................................................................................70
FETCh:POLLer:TTWO:LIMit?............................................................................................70
FETCh:POLLer:TTHRee:LIMit?.........................................................................................70
FETCh:POLLer:TFOur:LIMit?............................................................................................71
FETCh:POLLer:TFIVe:LIMit?............................................................................................71
FETCh:POLLer:TONE:RESult?.........................................................................................71
FETCh:POLLer:TTWO:RESult?.........................................................................................71
FETCh:POLLer:TTHRee:RESult?......................................................................................71
FETCh:POLLer:TFOur:RESult?.........................................................................................71
FETCh:POLLer:TFIVe:RESult?.........................................................................................71
FETCh:POLLer:ASKMod?
This command queries the modulation depth (NFC-A) or the modulation index (NFC-B
and -F).
Return values:
<ModulationDepth> NFC-A: modulation depth in %.
NFC-B / -F: modulation index in %.
Example:
FETC:POLL:ASKM?
Queries the modulation depth or index.
Result: 99.9 %
Usage: Query only
65User Manual 1175.6578.02 ─ 02
Page 68

R&S®FS-K112PC
Remote Control Commands
Querying NFC-A Poller Results
FETCh:POLLer:ASKMod:LIMit? <Limit>
This command queries the limits of the ASK modulation depth (NFC-A) or the modulation
index (NFC-B and -F).
The limits for the modulation depth and index are defined by the NFC Forum.
Query parameters:
<Limit> LOWer
Queries the lower limit.
UPPer
Queries the upper limit.
Return values:
<LimitValue> Limit in %.
Example:
Usage: Query only
FETCh:POLLer:ASKMod:RESult?
This command queries the limit check result of the modulation depth (NFC-A) or modulation index (NFC-B and NFC-F).
Return values:
<LimitCheck> 1
Example:
Usage: Query only
FETC:POLL:ASKM:LIM? LOW
would return, e.g.:
95
Pass: modulation depth or index within the limits.
0
Fail: modulation depth or index not within the limits.
FETC:POLL:ASKM:RES?
would return, e.g.:
1
FETCh:POLLer:NBITs?
This command queries the number of bits that have been transmitted in the recorded
signal.
Return values:
<BitNumber> Number of bits.
Example:
Usage: Query only
FETC:POLL:NBIT?
would return, e.g.
128
66User Manual 1175.6578.02 ─ 02
Page 69

R&S®FS-K112PC
Remote Control Commands
Querying NFC-A Poller Results
FETCh:POLLer:NFACtor?
This command queries the normalization factor used for level calculation.
Return values:
<NFactor> Normalization factor without unit.
Example:
Usage: Query only
FETCh:
This command queries the number of commands that have been found during transmission of the recorded signal.
Return values:
<CommandNumber> Number of the commands.
Example:
Usage: Query only
FETCh:POLLer:NTRansitions?
This command queries the number of low state transitions that have been found in the
recorded signal.
POLLer:NCOMmands?
FETC:POLL:NFAC?
would return, e.g.
9.9625
FETC:POLL:NCOM?
would return, e.g.:
1
Return values:
<Number> Number of low state transitions.
Example:
Usage: Query only
FETCh:POLLer:OSHoot? <ResultType>
This command queries the measurement results for the signal overshoot.
Query parameters:
<ResultType> AVERage
FETC:POLL:NTR?
would return, e.g.:
156
Queries the average results.
MINimum
Queries the minimum results.
MAXimum
Queries the maximum results.
67User Manual 1175.6578.02 ─ 02
Page 70

R&S®FS-K112PC
Remote Control Commands
Querying NFC-A Poller Results
Return values:
<Overshoot> Signal overshoot in %.
Example:
Usage: Query only
FETCh:POLLer:OSHoot:LIMit? <Limit>
This command queries the limits of the signal overshoot.
The limits for the overshoot are defined in the standard.
Query parameters:
<Limit> LOWer
Return values:
<LimitValue> Limit in %.
Example:
FETC:POLL:OSH? MIN
would return, e.g.
0.0695343
Queries the lower limit.
UPPer
Queries the upper limit.
FETC:POLL:OSH:LIM? UPP
would return, e.g.:
1.5909356
Usage: Query only
FETCh:POLLer:OSHoot:RESult? <State>
This command queries the limit check result of the signal overshoot.
The limits for the signal overshoot are defined in the standard.
Parameters:
<State> AVERage
Queries the overshoot limit check result of the average value.
MINimum
Queries the overshoot limit check result of the minimum value.
MAXimum
Queries the overshoot limit check result of the maximum value.
Return values:
<LimitCheck> 1
Pass: signal within the limits.
0
Fail: signal not within the limits.
Example:
FETC:POLL:OSH:RES? MAX
would return, e.g.:
1
68User Manual 1175.6578.02 ─ 02
Page 71

R&S®FS-K112PC
Remote Control Commands
Querying NFC-A Poller Results
Usage: Query only
FETCh:POLLer:USHoot? <ResultType>
This command queries the measurement results for the signal undershoot.
Query parameters:
<ResultType> AVERage
Queries the average results.
MINimum
Queries the minimum results.
MAXimum
Queries the maximum results.
Return values:
<Undershoot> Signal undershoot in %.
Example:
Usage: Query only
FETCh:POLLer:USHoot:LIMit? <Limit>
This command queries the limits of the signal undershoot.
The limits for the undershoot are defined in the standard.
Query parameters:
<Limit> LOWer
Return values:
<LimitValue> Limit in %.
Example:
FETC:POLL:USH MAX?
would return, e.g.:
0.5830841
Queries the lower limit.
UPPer
Queries the upper limit.
FETC:POLL:USH:LIM? LOW
would return, e.g.:
1.5457385
Usage: Query only
FETCh:POLLer:USHoot:RESult? <State>
This command queries the limit check result of the signal undershoot.
The limits for the signal undershoot are defined in the standard.
69User Manual 1175.6578.02 ─ 02
Page 72

R&S®FS-K112PC
Remote Control Commands
Querying NFC-A Poller Results
Parameters:
<State> AVERage
Queries the undershoot limit check result of the average value.
MINimum
Queries the undershoot limit check result of the minimum value.
MAXimum
Queries the undershoot limit check result of the maximum value.
Return values:
<LimitCheck> 1
Pass: signal within the limits.
0
Fail: signal not within the limits.
Example:
Usage: Query only
FETCh:POLLer:TONE?
FETCh:POLLer:TTWO?
FETCh:POLLer:TTHRee?
FETCh:POLLer:TFOur?
FETCh:POLLer:TFIVe? <ResultType>
This command queries the measurement results for the corresponding signal segment
tx.
Query parameters:
<ResultType> AVERage
Return values:
<Time> Length of signal segment t1, t2, t3, t4 or t5.
FETC:POLL:USH:RES? MAX
would return, e.g.:
1
Queries the average results.
MINimum
Queries the minimum results.
MAXimum
Queries the maximum results.
Default unit: s
Example:
Usage: Query only
FETCh:POLLer:TONE:LIMit?
FETCh:POLLer:TTWO:LIMit?
FETCh:POLLer:TTHRee:LIMit?
FETC:POLL:TONE? MAX
would return e.g.
2.31005e-006
70User Manual 1175.6578.02 ─ 02
Page 73

R&S®FS-K112PC
Remote Control Commands
Querying NFC-A Poller Results
FETCh:POLLer:TFOur:LIMit?
FETCh:POLLer:TFIVe:LIMit? <Limit>
This command queries the limits of signal segments tx.
The limits for the signal segments are defined in the standard.
Query parameters:
<Limit> LOWer
Queries the lower limit.
UPPer
Queries the upper limit.
Return values:
<LimitValue> Limit of signal segment t1, t2, t3, t4 or t5.
Default unit: s
Example:
Usage: Query only
FETCh:POLLer:TONE:RESult?
FETCh:POLLer:TTWO:RESult?
FETCh:POLLer:TTHRee:RESult?
FETCh:POLLer:TFOur:RESult?
FETCh:POLLer:TFIVe:RESult? <State>
This command queries the limit check result of the corresponding signal segment tx.
Query parameters:
<State> AVERage
Return values:
<LimitCheck> 1
FETC:POLL:TTWO:LIM? UPP
would return, e.g.:
2.30498e-006
Queries the limit check result of the average value.
MAXimum
Queries the limit check result of the maximum value.
MINimum
Queries the limit check result of the minimum value.
Pass: signal within the limits.
0
Fail: signal not within the limits.
Example:
Usage: Query only
FETC:POLL:TONE:RES? MIN
would return, e.g.:
0
71User Manual 1175.6578.02 ─ 02
Page 74

R&S®FS-K112PC
Remote Control Commands
Querying NFC-B and -F Poller Results
6.7 Querying NFC-B and -F Poller Results
The following commands query the results of NFC-B and NFC-F signals.
Commands useful to query NFC-B and NFC-F pollers described elsewhere:
● FETCh:POLLer:ASKMod? on page 65
● FETCh:POLLer:ASKMod:LIMit? on page 66
● FETCh:POLLer:ASKMod:RESult? on page 66
● FETCh:POLLer:NBITs? on page 66
● FETCh:POLLer:NCOMmands? on page 67
● FETCh:POLLer:NFACtor? on page 67
● FETCh:POLLer:NTRansitions? on page 67
● FETCh:POLLer:OSHoot? on page 67
● FETCh:POLLer:OSHoot:LIMit? on page 68
● FETCh:POLLer:OSHoot:RESult? on page 68
● FETCh:POLLer:USHoot? on page 69
● FETCh:POLLer:USHoot:LIMit? on page 69
● FETCh:POLLer:USHoot:RESult? on page 69
Commands exclusive to NFC-B and -F
FETCh:POLLer:FTIMe?....................................................................................................72
FETCh:POLLer:FTIMe:LIMit?............................................................................................73
FETCh:POLLer:FTIMe:RESult?.........................................................................................73
FETCh:POLLer:RTIMe?....................................................................................................73
FETCh:POLLer:RTIMe:LIMit?............................................................................................74
FETCh:POLLer:RTIMe:RESult?.........................................................................................74
FETCh:POLLer:FTIMe? <ResultType>
This command queries the measurement results for the signal fall time tf.
Query parameters:
<ResultType> AVERage
Queries the average results.
MINimum
Queries the minimum results.
MAXimum
Queries the maximum results.
Return values:
<FallTime> Default unit: s
Example:
FETC:POLL:FTIM? MAX
would return, e.g.:
5.5943e-007
72User Manual 1175.6578.02 ─ 02
Page 75

R&S®FS-K112PC
Remote Control Commands
Querying NFC-B and -F Poller Results
Usage: Query only
FETCh:POLLer:FTIMe:LIMit? <Limit>
This command queries the limits of signal fall time tf.
The limits for the fall time are defined in the standard.
Query parameters:
<Limit> LOWer
Queries the lower limit.
UPPer
Queries the upper limit.
Return values:
<LimitValue> Default unit: s
Example:
Usage: Query only
FETCh:POLLer:FTIMe:RESult? <State>
This command queries the limit check result of the signal fall time tf.
The limits for the signal fall time are defined in the standard.
Parameters:
<State> AVERage
Return values:
<LimitCheck> 1
FETC:POLL:FTIM:LIM? UPP
would return, e.g.:
1.18e-006
Queries the limit check result of the average signal fall time.
MINimum
Queries the limit check result of the minimum signal fall time.
MAXimum
Queries the limit check result of the maximum signal fall time.
Pass: signal fall time within the limits.
0
Fail: signal fall time not within the limits.
Example:
Usage: Query only
FETCh:POLLer:RTIMe? <ResultType>
This command queries the measurement results for the signal rise time tr.
FETC:POLL:FTIM:RES? MAX
would return, e.g.:
1
73User Manual 1175.6578.02 ─ 02
Page 76

R&S®FS-K112PC
Remote Control Commands
Querying NFC-B and -F Poller Results
Query parameters:
<ResultType> AVERage
Queries the average results.
MINimum
Queries the minimum results.
MAXimum
Queries the maximum results.
Return values:
<RiseTime> Default unit: s
Example:
Usage: Query only
FETCh:
This command queries the limits of signal rise time.
The limits for the rise time are defined in the standard.
Query parameters:
<Limit> LOWer
Return values:
<LimitValue> Default unit: s
Example:
POLLer:RTIMe:LIMit? <Limit>
FETC:POLL:RTIM? MIN
would return, e.g.:
5.2772e-007
Queries the lower limit.
UPPer
Queries the upper limit.
FETC:POLL:RTIM:LIM? UPP
would return, e.g.:
1.14206e-006
Usage: Query only
FETCh:POLLer:RTIMe:RESult? <State>
This command queries the limit check result of the signal rise time tr.
The limits for the signal rise time are defined in the standard.
Parameters:
<State> AVERage
Queries the limit check result of the average signal rise time.
MINimum
Queries the limit check result of the minimum signal rise time.
MAXimum
Queries the limit check result of the maximum signal rise time.
74User Manual 1175.6578.02 ─ 02
Page 77

R&S®FS-K112PC
Remote Control Commands
Querying NFC-A Listener Results
Return values:
<LimitCheck> 1
Pass: signal rise time within the limits.
0
Fail: signal rise time not within the limits.
6.8
Example:
FETC:POLL:RTIM:RES? MAX
would return, e.g.:
0
Usage: Query only
Querying NFC-A Listener Results
The following commands query the results of NFC-A signals.
FETCh:LISTener:FDTL?...................................................................................................75
FETCh:LISTener:FDTP?...................................................................................................76
FETCh:LISTener:LMALl?..................................................................................................76
FETCh:LISTener:LMEight?...............................................................................................77
FETCh:LISTener:LMEight:LIMit?.......................................................................................77
FETCh:LISTener:LMEight:RESult?....................................................................................77
FETCh:LISTener:NBITs?..................................................................................................78
FETCh:LISTener:NCOMmands?.......................................................................................78
FETCh:LISTener:NTRansitions?........................................................................................78
FETCh:LISTener:TOFF?...................................................................................................79
FETCh:LISTener:FDTL? <Result Type>
This command queries the measurement results for the frame delay time (FDT) of the
listening device.
Query parameters:
<ResultType> AVERage
Queries the average results.
MINimum
Queries the minimum results.
MAXimum
Queries the maximum results.
Return values:
<FrameDelay> Default unit: s
Example:
FETC:LIST:FDTL? MAX
would return, e.g.:
0.0024248
Usage: Query only
75User Manual 1175.6578.02 ─ 02
Page 78

R&S®FS-K112PC
Remote Control Commands
Querying NFC-A Listener Results
FETCh:LISTener:FDTP? <ResultType>
This command queries the measurement results of the frame delay time (FDT) of the
poller.
Query parameters:
<ResultType> AVERage
Queries the average results.
MINimum
Queries the minimum results.
MAXimum
Queries the maximum results.
Return values:
<FrameDelay> Default unit: s
Example:
Usage: Query only
FETCh:LISTener:LMALl? <ResultType>
This command queries the measurement results of the load modulation over all ASK
transitions.
Query parameters:
<ResultType> Note that the parameters only have an effect for NFC-A signals.
Return values:
<LoadModulation> Default unit: V
FETC:LIST:FDTP? MAX
would return, e.g.:
0.00005339
NFC-B and -F analysis does not calculate minimum and maximum
values.
AVERage
Queries the average results.
MINimum
Queries the minimum results.
MAXimum
Queries the maximum results.
Example:
Usage: Query only
FETC:LIST:LMAL?
Queries the (average) load modulation over all transitions for NFCB and -F signals.
would return, e.g.:
0.0206
76User Manual 1175.6578.02 ─ 02
Page 79

R&S®FS-K112PC
Remote Control Commands
Querying NFC-A Listener Results
FETCh:LISTener:LMEight? <ResultType>
This command queries the measurement results of the load modulation over eight low
state transistions.
Query parameters:
<ResultType> AVERage
Queries the average results.
MINimum
Queries the minimum results.
MAXimum
Queries the maximum results.
Return values:
<LoadModulation> Default unit: V
Example:
Usage: Query only
FETCh:LISTener:LMEight:LIMit? <Limit>
This command queries the limits of the load modulation over eight low state transitions.
The limits for the load modulation are defined in the standard.
Query parameters:
<Limit> LOWer
Return values:
<LimitValue> Default unit: V
Example:
FETC:LIST:LME? MIN
would return, e.g.:
0.0205
Queries the lower limit.
UPPer
Queries the upper limit.
FETC:LIST:LME:LIM? UPP
would return, e.g.:
0.058
Usage: Query only
FETCh:LISTener:LMEight:RESult? <State>
This command queries the limit check result of the load modulation.
77User Manual 1175.6578.02 ─ 02
Page 80

R&S®FS-K112PC
Remote Control Commands
Querying NFC-A Listener Results
Parameters:
<State> AVERage
Queries the limit check result of the average value.
MINimum
Queries the limit check result of the minimum value.
MAXimum
Queries the limit check result of the maximum value.
Return values:
<LimitCheck> 1
Pass: load modulation within the limits.
0
Fail: load modulaiton not within the limits.
Example:
Usage: Query only
FETCh:LISTener:NBITs?
This command queries the number of bits that have been transmitted in the recorded
signal.
Return values:
<BitNumber> Number of bits you have queried.
Example:
Usage: Query only
FETCh:LISTener:NCOMmands?
This command queries the number of commands that have been sent during transmission
of the recorded signal.
Return values:
<CommandNumber> Number of the commands you have queried.
FETC:LIST:LME:RES? MIN
would return, e.g.
1
FETC:LIST:NBIT?
Queries the analysed bits.
Example:
Usage: Query only
FETCh:LISTener:NTRansitions?
This command queries the number of ASK transitions that could be found in the recorded
signal.
Return values:
<Number> Number of transitions you have queried.
FETC:LIST:NCOM?
Queries the analysed commands.
78User Manual 1175.6578.02 ─ 02
Page 81

R&S®FS-K112PC
Remote Control Commands
Querying NFC-B and -F Listener Results
6.9
Example:
FETC:LIST:NTR?
Queries the analysed transitions.
Usage: Query only
FETCh:LISTener:TOFF?
This command queries the timing offset.
Return values:
<Offset> Time period between two bursts in seconds.
Default unit: s
Example:
FETC:LIST:TOFF?
Queries the timing offset.
Usage: Query only
Querying NFC-B and -F Listener Results
The following commands query the results of NFC-A signals.
Commands useful to query NFC-B and -F listener results described elsewhere:
● FETCh:LISTener:FDTL? on page 75
● FETCh:LISTener:LMALl? on page 76
● FETCh:LISTener:NBITs? on page 78
● FETCh:LISTener:NCOMmands? on page 78
● FETCh:LISTener:NTRansitions? on page 78
FETCh:LISTener:LMALl:LIMit?..........................................................................................79
FETCh:LISTener:LMALl:LIMit? <Limit>
This command queries the limits of the load modulation over all low state transitions.
Limits over all low state transitions are not defined in the standard.
Query parameters:
<Limit> LOWer
Queries the lower limit.
UPPer
Queries the upper limit.
Return values:
<LimitValue> Default unit: V
Example:
FETC:LIST:LMAL:LIM? LOW
would return, e.g.:
0.0095
Usage: Query only
79User Manual 1175.6578.02 ─ 02
Page 82

R&S®FS-K112PC
Remote Control Commands
Configuring Listener Characteristics
6.10 Configuring Listener Characteristics
[SENSe]:LISTener:RAWFactor..........................................................................................80
[SENSe]:LISTener:RMSFactor..........................................................................................80
[SENSe]:LISTener:UPFL..................................................................................................80
[SENSe]:LISTener:RAWFactor <RAWFactor>
This command defines the raw normalization factor for calculation of the load modulation
level.
Parameters:
<RAWFactor> Raw normalization factor for load modulation level calculation.
Example:
LIST:RAWF 1.1
Defines a raw factor of 1.1.
[
SENSe]:LISTener:RMSFactor <RMSFactor>
This command defines the RMS normalization factor for calculation of the load modulation level.
Parameters:
<RMSFactor> RMS normalization factor for load modulation level calculation.
Example:
LIST:RMSF 1.41241
Defines an RMS factor of 1.41241.
[SENSe]:LISTener:UPFL <Signal>
This command selects the poller type.
The poller type changes the limits for the load modulation.
Parameters:
<Signal> P0
Selects poller P0.
P3
Selects poller P3.
P6
Selects poller P6.
*RST: P3
Example:
LIST:UPFL P6
Selects poller type P6.
6.11 Signal Decoding
The following commands query the decoding results.
80User Manual 1175.6578.02 ─ 02
Page 83

R&S®FS-K112PC
Remote Control Commands
Signal Decoding
CONFigure:NFC:DECoding:FORMat..................................................................................81
[SENSe]:DEMod:BITS?....................................................................................................81
[SENSe]:DEMod:COMMands?..........................................................................................81
CONFigure:NFC:DECoding:FORMat <DisplayFormat>
This command selects the format for the decoding results.
Parameters:
<DisplayFormat> BIN
Selects binary format.
HEX
Selects hexadecimal format.
Example:
CONF:NFC:DEC:FORM BIN
Selects binary format for the decoding results.
[
SENSe]:DEMod:BITS?
This command queries the bit sequences that have been found for the poller and listener.
Return values:
<Bits> List of poller and listener bit sequences, separated by commas.
The command first returns the poller bit sequences in consecutive
order, then the listener bit sequences in consecutive order.
Example:
DEM:BITS?
would return, e.g.
00111010,01101100100011010100,
1010000111101000001
Usage: Query only
[SENSe]:DEMod:COMMands?
This command queries the command syntax of the commands that have been found for
poller and listener.
Return values:
<Commands> List of poller and listener commands, separated by commas.
The command first returns the poller commands in consecutive
order, then the listener commands in consecutive order.
Example:
DEM:COMM?
would returnd, e.g.:
SENS REQ,SDD REQ CL1,SENS RES
Usage: Query only
81User Manual 1175.6578.02 ─ 02
Page 84

R&S®FS-K112PC
Remote Control Commands
Instrument Configuration
6.12 Instrument Configuration
CONFigure:ADDRess<instid>...........................................................................................82
CONFigure:CHANnel.......................................................................................................82
CONFigure:COUPling.......................................................................................................82
CONFigure:NFC:BITRate..................................................................................................83
CONFigure:NFC:BURSt....................................................................................................83
CONFigure:NFC:STANdard..............................................................................................83
CONFigure:POWer:AUTO................................................................................................84
DISPlay:TRACe:Y:RLEV...................................................................................................84
INPut:ATTenuation...........................................................................................................84
[SENSe]:FREQuency:CENTer...........................................................................................85
[SENSe]:NFC:NTOLerance...............................................................................................85
[SENSe]:POWer:AUTO:TIME............................................................................................85
[SENSe]:SWEep:SAMPles................................................................................................85
[SENSe]:SWEep:TIME.....................................................................................................86
TRACe:IQ:SRATe............................................................................................................86
CONFigure:ADDRess<instid> <IPAddress>
This command defines the network address for a connection with measurement equipment.
Parameters:
<IPAddress> String containing the instrument's IP address.
Example:
CONF:ADDR '192.168.0.1'
Defines a TCP/IP connection with a corresponding address.
CONFigure:CHANnel <RTOChannel>
This command selects the channel the signal is applied to on an oscilloscope.
Parameters:
<RTOChannel> CH1 | CH2 | CH3 | CH4
The available number of channels depends on the hardware configuration of the oscilloscope.
*RST: CH1
Example:
CONF:CHAN CH1
Selects channel 1 as the measurement channel.
CONFigure:COUPling <RTOCoupling>
This command turns the 1 MOhm coupling of the oscilloscope on and off.
82User Manual 1175.6578.02 ─ 02
Page 85

R&S®FS-K112PC
Remote Control Commands
Instrument Configuration
Parameters:
<RTOCoupling> DC50
Selects 50 Ω impedance.
DC1M
Selects 1 MΩ impedance.
*RST: DC50
Example:
CONFigure:NFC:BITRate <NFCBitrate>
This command selects the bitrate of the signal.
Parameters:
<NFCBitrate> AUTO
Example:
CONFigure:NFC:BURSt <BurstNumber>
CONF:COUP DC1M
Turns the 1 MOhm coupling on.
Automatically detects the data rate.
BR106
Selects 106 kbit/s.
BR212
Selects 212 kbit/s.
BR424
Selects 424 kbit/s.
*RST: AUTO
CONF:NFC:BITR AUTO
Automatically detects the bitrate.
This command selects a particular NFC burst to be analyzed.
For more information see chapter 4.3, "Selecting a Particular Burst", on page 44.
Parameters:
<BurstNumber> AUTO
Automatically selects an NFC burst for analysis.
<numeric_value>
Selects a particular NFC burst for analysis.
The range depends on the number of bursts found in the I/Q data.
*RST: AUTO
Example:
CONFigure:NFC:STANdard <NFCStandard>
This command selects the NFC modulation type.
CONF:NFC:BURS AUTO
Automatically selects the burst to be analyzed.
83User Manual 1175.6578.02 ─ 02
Page 86

R&S®FS-K112PC
Remote Control Commands
Instrument Configuration
Parameters:
<NFCStandard> AUTO
Automatically detects the modulation type.
NFCA
Selects modulation type NFC-A.
NFCB
Selects modulation type NFC-B.
NFCF
Selects modulation type NFC-F.
*RST: AUTO
Example:
CONFigure:
This command turns automatic determination of the (reference) level on and off.
Parameters:
<State> ON | OFF
Example:
DISPlay:TRACe:Y:RLEV <RefLevel>
This command defines the expected signal level (reference level).
This command is available if CONFigure:POWer:AUTO is off.
Parameters:
<RefLevel> Level value in dBm.
POWer:AUTO <State>
CONF:NFC:STAN NFCB
Selects the NFC-B.
*RST: ON
CONF:POW:AUTO OFF
Turns off automatic determination of the level.
*RST: -6.00 dBm
Default unit: dBm
Example:
INPut:ATTenuation <Attenuation>
This command defines the attenuation.
The command is available for measurements with a spectrum analyzer and if
CONFigure:POWer:AUTO is off.
Parameters:
<Attenuation> Attenuation level of the analyzer.
DISP:TRAC:Y:RLEV -5
Defines a level of -5 dBm.
Default unit: dB
84User Manual 1175.6578.02 ─ 02
Page 87

R&S®FS-K112PC
Remote Control Commands
Instrument Configuration
Example:
[SENSe]:FREQuency:CENTer <Frequency>
This command defines the frequency of the signal and the frequency the measurement
instrument is tuned to.
Parameters:
<Frequency> Range: 13 MHz to 14 MHz
Example:
[
SENSe]:NFC:NTOLerance <NoiseTolerance>
This command selects the noise tolerance.
Parameters:
<NoiseTolerance> HIGH
CONF:POW:AUTO OFF
INP:ATT 10
Defines an attenuation of 10 dB.
*RST: 13.56 MHz
Default unit: Hz
FREQ:CENT 13.6MHZ
Defines a frequency of 13.6 MHz.
LOW
MEDium
Example:
[SENSe]:POWer:AUTO:TIME <Tracktime>
This command defines the auto level track time.
Parameters:
<Tracktime> Length of the measurement to determine the ideal level.
Example:
[SENSe]:SWEep:SAMPles <Samples>
This command defines the signal capture length.
Parameters:
<Samples> Size of the capture buffer in samples.
Example:
NFC:NTOL LOW
Selects low noise tolerance.
*RST: 500
Default unit: s
POW:AUTO:TIME 1MS
Defines an auto level track time of 1 ms.
SWE:SAMP 2000
Defines a capture length of 2000 samples.
85User Manual 1175.6578.02 ─ 02
Page 88

R&S®FS-K112PC
Remote Control Commands
Trigger Configuration
[SENSe]:SWEep:TIME <Time>
This command defines the signal capture length.
Parameters:
<Time> Size of the capture buffer in seconds.
Default unit: s
Example:
SWE:TIME 5ms
Defines a capture length of 5 ms.
TRACe:
IQ:SRATe <SampleRate>
This command defines the sample rate.
Parameters:
<SampleRate> *RST: 20 MHz
Default unit: Hz
Example:
TRAC:IQ:SRAT 10MHZ
Defines a sample rate of 10 MHz.
6.13 Trigger Configuration
TRIGger:EVENt...............................................................................................................86
TRIGger:HOLDoff[:TIME]..................................................................................................87
TRIGger:LEVel:AUTO......................................................................................................87
TRIGger:LEVel[:VALue]....................................................................................................87
TRIGger:MODE...............................................................................................................88
TRIGger:OFFSet:AUTO....................................................................................................88
TRIGger:OFFSet:TIME.....................................................................................................88
TRIGger:OFFSet[:VALue].................................................................................................89
TRIGger:TIMeout[:TIME]...................................................................................................89
TRIGger:EVENt <NFCTriggerEvent>
This command selects a certain trigger event.
Note that you have to select the NFC trigger source with the appropriate NFC modulation
type with TRIGger:MODE on page 88.
86User Manual 1175.6578.02 ─ 02
Page 89

R&S®FS-K112PC
Remote Control Commands
Trigger Configuration
Parameters:
<NFCTriggerEvent> ALL | SEN
ALL_REQ or SENS_REQ command is the trigger event.
Available for NFC-A
ALLB | SENB
ALLB_REQ or SENSB_REQ command is the trigger event.
Available for NFC-B
SOS48 | SOS96
Start of Sequence (SoS) with a 48 or 96 bit length is the trigger
event.
Available for NFC-F.
*RST: depends on trigger type
Example:
TRIGger:HOLDoff[:TIME] <HoldOff>
This command defines the trigger holdoff.
Parameters:
<HoldOff> Minimum time between one trigger event and the next.
Example:
TRIGger:LEVel:AUTO <State>
This command turns automatic definition of the trigger level on and off.
Parameters:
<State> ON | OFF
TRIG:MODE NFCA
TRIG:EVEN SEN
Defines the SENS_REQ command (NFC-A) as the trigger event.
*RST: 10.0 µs
Default unit: s
TRIG:HOLD 0.000015
Defines a holdoff time of 15 µs.
*RST: ON
Example:
TRIGger:LEVel[:VALue] <Level>
This command defines the trigger level.
The trigger level is available for all trigger types and if TRIGger:LEVel:AUTO is off.
Parameters:
<Level> Trigger level that must be met to initiate a measurement.
See TRIGger:LEVel[:VALue] on page 87
*RST: 1.4 V
Default unit: V
87User Manual 1175.6578.02 ─ 02
Page 90

R&S®FS-K112PC
Remote Control Commands
Trigger Configuration
Example:
TRIGger:MODE <NFCBitrate>
This command selects the trigger type or source.
Parameters:
<NFCBitrate> EXTernal
TRIG:LEV:AUTO OFF
TRIG:LEV 2V
Defines a trigger level of 2 Volt.
Selects the External trigger.
IFPower
Selects the IF Power trigger.
Available for measurements with R&S FSL, R&S ZVL and
R&S FSV.
IMMediate
Selects no trigger source (Free Run mode).
NFCA | NFCB | NFCF212 | NFCF424
Selects one of the NFC triggers.
The characters after NFC define the standard and, in case of the
NFC-F standard, the bitrate.
Available for measurements with R&S RTO.
*RST:
NFCA
Example:
TRIGger:OFFSet:AUTO <State>
This command turns automatic determination of the trigger offset on and off.
Parameters:
<State> ON | OFF
Example:
TRIGger:OFFSet:TIME <Offset>
This command defines a trigger offset.
The trigger offset is available for all trigger types and if TRIGger:OFFSet:AUTO is off.
Parameters:
<Offset> Time that passes between the trigger event and the start of the
TRIG:MODE EXT
Selects an external trigger source.
*RST: ON
See TRIGger:OFFSet:TIME on page 88
measurement.
*RST: 0
Default unit: s
88User Manual 1175.6578.02 ─ 02
Page 91

R&S®FS-K112PC
Remote Control Commands
Result Display Configuration
Example:
TRIG:OFFS:AUTO OFF
TRIG:OFFS:TIME 10ms
Defines a trigger offset of 10 ms.
TRIGger:OFFSet[:VALue] <Offset>
This command defines the trigger offset.
The trigger offset is available for all trigger types and if TRIGger:OFFSet:AUTO is off.
Parameters:
<Offset> Time that passes between the trigger event and the start of the
measurement.
*RST: 0
Default unit: samples
Example:
TRIG:OFFS:AUTO OFF
TRIG:OFFS 10
Defines a trigger offset of 10 samples.
TRIGger:TIMeout[:TIME] <Timeout>
This command defines the trigger time out time.
Parameters:
<Timeout> Maximum time that the trigger stays armed before the measure-
ment is aborted (when no trigger event occurs).
*RST: 60 s
Default unit: s
Example:
TRIG:TIM 50
Defines a trigger time out time of 50 s.
6.14 Result Display Configuration
[SENSe]:NFC:FRTBurst....................................................................................................89
[SENSe]:NFC:PSHown.....................................................................................................90
[SENSe]:NFC:FRTBurst <State>
This command turns a reduction of the I/Q data to include the first burst only on and off.
Parameters:
<State> ON | OFF
*RST: OFF
Example:
NFC:FRTB ON
Reduces the file to a burst.
89User Manual 1175.6578.02 ─ 02
Page 92

R&S®FS-K112PC
Remote Control Commands
Result Display Configuration
[SENSe]:NFC:PSHown <State>
This command turns the display of phase characteristics on and off.
Parameters:
<State> ON | OFF
*RST: OFF
Example:
NFC:PSH ON
Turns the display of phase characteristics on and off.
90User Manual 1175.6578.02 ─ 02
Page 93

R&S®FS-K112PC
A
B
C
Glossary: NFC Terms
Glossary: NFC Terms
ASK transition: see Low level state
Bit sequence: Series of bits that contains the information to be transmitted from one
device to another.
Burst: Change in the radio frequency power resulting from the transmission of data from
one device to another. The duration of a burst corresponds to the amount of data contained in one frame.
A change in the radio frequency power occurs when modulation is applied to the carrier
signal for a short time. When a device sends data, you can observe multiple drops in the
carrier signal level, resulting in low level states (or low state transitions).
Carrier signal: Continous wave signal supplied by the poller providing the power for data
transmission.
In its original state, the carrier signal is unmodulated. When a transmission is initiated,
modulation is applied to the carrier signal, resulting in a change of the power level.
Command: A command is a instruction from one device to another.
A command is either a request by the poller or a response by the listener.
F
Frame: Group of data bits that is transferred from one device to another.
The format of a frame depends on the modulation type, the type of information that is
transmitted and the direction of the transmission (poller ➙ listener or listener ➙ poller.
H
High level state: State of the carrier signal when no modulation is applied.
L
Listener: Passive device in a NFC communication that reacts to a request in the com-
munication and receives the necessary power from the poller.
Load modulation: Variation of an electromagnetic field by a passive communication
device in order to receive the power required for the data transmission.
Low level state: State of the carrier signal during the period when modulation is applied
and the power level drops.
Low state transition: Period in which the signal enters the Low level state and goes
back to the High level state
91User Manual 1175.6578.02 ─ 02
Page 94

R&S®FS-K112PC
M
N
Glossary: NFC Terms
Measurement equipment: Equipment necessary to test NFC devices. For a list of sup-
ported equipment see "Running measurements" on page 12.
Modulation type: Near Field Communication (NFC) modulation type as defined by the
NFC Forum.
Currently three NFC modulation types with different bitrates are defined: NFC-A, NFC-B
and NFC-F.
NFC: Near Field Communication.
Term to decribe a technology that allows smartphones or similar devices to establish
radio communication with each other. For successful communication, the devices usually
are only a few centimeters apart. Applications are , e.g. contactless transactions or data
exchange.
Communication between two NFC devices usually consists of a (poller) request and (listener) response.
NFC Forum: The NFC Forum is a non-profit industry association that promotes and
specifies the use of NFC short-range wireless interaction in consumer electronics, mobile
devices and PCs.
O
Overshoot: Signal state, when, after the low level state, the signal level rises and over-
shoots the original carrier level before it settles again.
P
Poller: Active device in a NFC communication that initiates the communication and sup-
plies the necessary power.
R
Reference equipment: A set of reference poller and reference listener.
The reference equipment has been specified by the NFC Forum and has been designed
to allow for valid testing of the RF characteristics of an NFC device.
S
Standard: Specification documents by the NFC Forum.
U
Undershoot: Signal state, when, in the process of modulation, the signal level is under
a specified level for a short time, before reaching the targeted signal level.
92User Manual 1175.6578.02 ─ 02
Page 95

R&S®FS-K112PC
List of Commands
List of Commands
*IDN?...............................................................................................................................................................58
*RST................................................................................................................................................................58
CONFigure:ADDRess<instid>.........................................................................................................................82
CONFigure:CHANnel.......................................................................................................................................82
CONFigure:COUPling......................................................................................................................................82
CONFigure:NFC:BITRate................................................................................................................................83
CONFigure:NFC:BURSt..................................................................................................................................83
CONFigure:NFC:DECoding:FORMat..............................................................................................................81
CONFigure:NFC:STANdard.............................................................................................................................83
CONFigure:POWer:AUTO...............................................................................................................................84
DISPlay:TRACe:Y:RLEV.................................................................................................................................84
FETCh:DEMod:RESult?..................................................................................................................................62
FETCh:LISTener:FDTL?..................................................................................................................................75
FETCh:LISTener:FDTP?.................................................................................................................................76
FETCh:LISTener:LMALl:LIMit?........................................................................................................................79
FETCh:LISTener:LMALl?.................................................................................................................................76
FETCh:LISTener:LMEight:LIMit?.....................................................................................................................77
FETCh:LISTener:LMEight:RESult?.................................................................................................................77
FETCh:LISTener:LMEight?..............................................................................................................................77
FETCh:LISTener:NBITs?.................................................................................................................................78
FETCh:LISTener:NCOMmands?.....................................................................................................................78
FETCh:LISTener:NTRansitions?.....................................................................................................................78
FETCh:LISTener:RF:RESult?..........................................................................................................................62
FETCh:LISTener:TOFF?.................................................................................................................................79
FETCh:NFC:ASIGnals?...................................................................................................................................63
FETCh:NFC:BITRate?.....................................................................................................................................63
FETCh:NFC:BSIGnals?...................................................................................................................................63
FETCh:NFC:FSIGnals?...................................................................................................................................63
FETCh:NFC:STANdard?.................................................................................................................................64
FETCh:NOFBursts?.........................................................................................................................................64
FETCh:POLLer:ASKMod:LIMit?......................................................................................................................66
FETCh:POLLer:ASKMod:RESult?...................................................................................................................66
FETCh:POLLer:ASKMod?...............................................................................................................................65
FETCh:POLLer:FTIMe:LIMit?..........................................................................................................................73
FETCh:POLLer:FTIMe:RESult?.......................................................................................................................73
FETCh:POLLer:FTIMe?...................................................................................................................................72
FETCh:POLLer:NBITs?...................................................................................................................................66
FETCh:POLLer:NCOMmands?.......................................................................................................................67
FETCh:POLLer:NFACtor?...............................................................................................................................67
FETCh:POLLer:NTRansitions?........................................................................................................................67
FETCh:POLLer:OSHoot:LIMit?........................................................................................................................68
FETCh:POLLer:OSHoot:RESult?....................................................................................................................68
FETCh:POLLer:OSHoot?................................................................................................................................67
FETCh:POLLer:RF:RESult?............................................................................................................................64
FETCh:POLLer:RTIMe:LIMit?..........................................................................................................................74
93User Manual 1175.6578.02 ─ 02
Page 96

R&S®FS-K112PC
List of Commands
FETCh:POLLer:RTIMe:RESult?......................................................................................................................74
FETCh:POLLer:RTIMe?..................................................................................................................................73
FETCh:POLLer:TFIVe:LIMit?...........................................................................................................................71
FETCh:POLLer:TFIVe:RESult?.......................................................................................................................71
FETCh:POLLer:TFIVe?...................................................................................................................................70
FETCh:POLLer:TFOur:LIMit?..........................................................................................................................71
FETCh:POLLer:TFOur:RESult?.......................................................................................................................71
FETCh:POLLer:TFOur?...................................................................................................................................70
FETCh:POLLer:TONE:LIMit?..........................................................................................................................70
FETCh:POLLer:TONE:RESult?.......................................................................................................................71
FETCh:POLLer:TONE?...................................................................................................................................70
FETCh:POLLer:TTHRee:LIMit?.......................................................................................................................70
FETCh:POLLer:TTHRee:RESult?...................................................................................................................71
FETCh:POLLer:TTHRee?................................................................................................................................70
FETCh:POLLer:TTWO:LIMit?..........................................................................................................................70
FETCh:POLLer:TTWO:RESult?......................................................................................................................71
FETCh:POLLer:TTWO?...................................................................................................................................70
FETCh:POLLer:USHoot:LIMit?........................................................................................................................69
FETCh:POLLer:USHoot:RESult?....................................................................................................................69
FETCh:POLLer:USHoot?.................................................................................................................................69
FORMat[:DATA]...............................................................................................................................................60
INITiate:REFResh............................................................................................................................................59
INITiate[:IMMediate].........................................................................................................................................59
INPut:ATTenuation..........................................................................................................................................84
MMEMory:NFC:LOAD:IQ.................................................................................................................................60
MMEMory:NFC:LOAD:SETTings.....................................................................................................................60
MMEMory:NFC:STORe:IQ..............................................................................................................................60
MMEMory:NFC:STORe:RESults.....................................................................................................................61
MMEMory:NFC:STORe:SETTings..................................................................................................................61
SYSTem:PRESet.............................................................................................................................................61
TRACe:IQ:SRATe............................................................................................................................................86
TRACe[:DATA]?...............................................................................................................................................61
TRIGger:EVENt...............................................................................................................................................86
TRIGger:HOLDoff[:TIME].................................................................................................................................87
TRIGger:LEVel:AUTO......................................................................................................................................87
TRIGger:LEVel[:VALue]...................................................................................................................................87
TRIGger:MODE...............................................................................................................................................88
TRIGger:OFFSet:AUTO...................................................................................................................................88
TRIGger:OFFSet:TIME....................................................................................................................................88
TRIGger:OFFSet[:VALue]................................................................................................................................89
TRIGger:TIMeout[:TIME].................................................................................................................................89
[SENSe]:DEMod:BITS?...................................................................................................................................81
[SENSe]:DEMod:COMMands?........................................................................................................................81
[SENSe]:FREQuency:CENTer.........................................................................................................................85
[SENSe]:LISTener:RAWFactor........................................................................................................................80
[SENSe]:LISTener:RMSFactor........................................................................................................................80
[SENSe]:LISTener:UPFL.................................................................................................................................80
[SENSe]:NFC:FRTBurst..................................................................................................................................89
94User Manual 1175.6578.02 ─ 02
Page 97

R&S®FS-K112PC
List of Commands
[SENSe]:NFC:NTOLerance.............................................................................................................................85
[SENSe]:NFC:PSHown....................................................................................................................................90
[SENSe]:POWer:AUTO:TIME..........................................................................................................................85
[SENSe]:SWEep:SAMPles..............................................................................................................................85
[SENSe]:SWEep:TIME....................................................................................................................................86
95User Manual 1175.6578.02 ─ 02
Page 98

R&S®FS-K112PC
Index
Index
Symbols
.iq.tar ........................................ ........................................ 14
B
Bitrate .................................... .................................... 29, 43
Bit sequence .................................. .................................. 30
Burst ........................................ ........................................ 51
C
Capture buffer ................................. ................................. 21
Capture length ............................. ............................. 29, 47
Carrier ....................................... ....................................... 21
Commands ................................... ................................... 30
Configuration .................................. .................................. 42
D
Data import / export ............................ ............................ 13
Decoding ..................................... ..................................... 30
Deinstallation .................................. .................................. 7
E
External trigger ................................ ................................ 49
F
Fall time ..................................... ..................................... 33
Frame delay time .............................. .............................. 37
Frequency .................................... .................................... 46
Functional test ................................. ................................. 29
G
GUI customization .............................. .............................. 15
GUI elements
add as tab ................................. ................................. 16
docking ................................... ................................... 15
remove ................................... ................................... 16
H
Hardcopy ..................................... ..................................... 52
I
IF power trigger ................................ ................................ 49
Installation ..................................... ..................................... 7
IP address ................................. ................................. 16, 46
L
Level ........................................ ........................................ 47
License ....................................... ....................................... 8
Limits ..................................... ..................................... 31, 36
Listener results ............................. ............................. 25, 35
Load modulation ............................ ............................ 25, 36
Modulation index
Modulation type ............................. ............................. 29, 43
........................................................ 23, 34
N
NFC trigger ................................... ................................... 49
Normalization .............................. .............................. 34, 38
O
Oscilloscope channel ........................... ........................... 48
Overshoot .................................... .................................... 33
P
Phase ....................................... ....................................... 51
Poller results ............................... ............................... 23, 30
Preset ....................................... ....................................... 12
R
Reference level ................................ ................................ 47
Reference poller ............................... ............................... 38
Result overview ................................ ................................ 28
Results
Capture buffer .............................. .............................. 21
Decoding ................................. ................................. 30
Listener ................................ ................................ 25, 35
poller ..................................... ..................................... 23
Poller .................................... .................................... 30
Statistics ............................... ............................... 34, 38
RF analysis ................................ ................................ 31, 36
Rise time ..................................... ..................................... 33
S
Sample rate ................................... ................................... 47
Screenshot ................................... ................................... 52
Settings ...................................... ...................................... 42
Signal carrier .................................. .................................. 21
Smart card .................................... .................................... 8
Statistics .................................. .................................. 34, 38
T
Timing offset .................................. .................................. 38
Timing results ................................. ................................. 33
Trigger ....................................... ....................................... 48
Trigger event .................................. .................................. 49
Trigger level .................................. .................................. 49
U
Undershoot ................................... ................................... 33
User interface ................................. ................................. 11
Z
Zoom ........................................ ........................................ 52
M
Measurement equipment ..................... ..................... 12, 45
Modulation depth ........................... ........................... 23, 33
96User Manual 1175.6578.02 ─ 02
 Loading...