

Page 1

Test and Measurement
Division
Operating Manual
OPTION: SIGNAL VECTOR ANALYSIS
FOR SPECTRUM ANALYZER FSE
FSE-B7
1066.4317.02
Printed in the Federal
Republic of Germany
1066.4323.12 - 07 1
Page 2

Page 3

FSE-B7 Contents
Contents
Index
Data sheet
Page
1 Preparation for Use..........................................................................................1.1-1
1.1 Introduction.........................................................................................................................1.1-1
2.2 Menu Overview ...................................................................................................................2.2-1
2.2.1 SYSTEM Key Group.................................................................................................2.2-1
2.2.2 CONFIGURATION Key Group .................................................................................2.2-4
2.2.3 HARDCOPY Key Group ...........................................................................................2.2-6
2.2.4 FREQUENCY Key Group.........................................................................................2.2-7
2.2.5 LEVEL Key Group, INPUT Key.................................................................................2.2-8
2.2.6 MARKER Key Group ..............................................................................................2.2-10
2.2.7 LINES Key Group ...................................................................................................2.2-11
2.2.8 TRACE Key Group..................................................................................................2.2-12
2.2.9 SWEEP Key Group.................................................................................................2.2-13
2.2.10 MEMORY Key Group..............................................................................................2.2-14
2.2.11 USER Key Group....................................................................................................2.2-14
2.4 Vector Analyzer Mode........................................................................................................2.4-1
2.4.1 Selecting the Operating Mode ..................................................................................2.4-2
2.4.2 Analog Demodulation Methods.................................................................................2.4-4
2.4.3 Digital Modulation Methods.....................................................................................2.4-29
2.4.4 Frequency Settings - FREQUENCY Key Group.....................................................2.4-61
2.4.5 Setting the Frequency Span - START, STOP, and SPAN Key...............................2.4-62
2.4.6 Setting the Level Display and Configuring the RF Input .........................................2.4-63
2.4.7 MARKER Key Group ..............................................................................................2.4-69
LINES
2.4.8 Setup of Display and Limit Lines –
2.4.9 Selection and Setting of Traces - TRACE Key Group............................................2.4-89
2.4.10 SWEEP Key Group.................................................................................................2.4-92
Remote Control is described in the operating manual for the corresponding instrument
Key Field..............................................2.4-79
1066.4317.02 3 E-5
Page 4

Contents FSE-B7
Page
5 Checking Rated Specifications..........................................................................5.1
5.1 Preliminary Remarks:............................................................................................................5.1
5.2 Test Equipment Required..................................................................................................... 5.2
5.3 Test Procedure ...................................................................................................................... 5.3
5.3.1 Digital Demodulation....................................................................................................5.3
5.3.2 Analog Demodulation................................................................................................. 5.10
5.4 Performance Test Report.................................................................................................... 5.17
1066.4317.02 4 E-4
Page 5

FSE-B7 Index
Index
DQPSK.....................................................................2.4-35
A
AC coupling...............................................................2.4-10
Alpha (roll-off factor)..................................................2.4-41
AM signal...................................................................
AM-demodulated time signal......................................2.4-13
Amplitude droop (sum error)..................................2.4-55
Amplitude modulation.............................................2.4-28
Analog Demodulation...................................................
Analysis bandwidth....................................................2.4-62
Anzeigebereich..........................................................2.4-23
Audio signal...............................................................2.4-13
Average .....................................................................2.4-17
carrier power .......................................................2.4-77
Averaging......................................................2.4-27,
Averaging of summary markers.................................2.4-77
2.4-13
2.4-6
2.4-90
B
Bandwidth
analog demodulation.............................................2.4-6
analog IF filters......................................................2.4-7
IF.........................................................................2.4-92
Bandwidth, analog.....................................................2.4-92
Bandwidth/symbol period product..............................2.4-41
BPSK......................................................................... 2.4-35
BT..............................................................................
Burst search..............................................................2.4-96
2.4-41
C
Capture buffer............................................................2.4-43
Capture buffer............................................................2.4-58
CCITT filter..................................................................2.4-9
CCITT P.53 .................................................................2.4-9
CDPD............................................................2.4-34, 2.4-36
Center frequency.......................................................2.4-61
Constellation diagram................................................2.4-48
Coupling
DC or AC.............................................................
CT2 ...........................................................................2.4-36
2.4-10
D
/4-DQPSK..................................................................2.4-35
D Lines......................................................................2.4-80
D8PSK.......................................................................2.4-35
DC coupling...............................................................2.4-10
DCS1800...................................................................2.4-36
Decision point............................................................2.4-50
DECT standard..........................................................2.4-35
Deemphasis...............................................................2.4-12
Delta markers............................................................2.4-72
DEMOD BANDWIDTH.................................................
Demodulation
analog ...................................................................2.4-6
bandwidth ..............................................................
Demodulation bandwidth. ............................................2.4-6
Demodulator, digital...................................................2.4-35
Demodulator,standard settings..................................2.4-36
Differential PSK.........................................................2.4-32
Digital demodulator....................................................
Digital modulation methods........................................2.4-29
Digital standard..........................................................2.4-36
Display range.............................................................2.4-65
Display width (eye diagram)...........................2.4-47, 2.4-50
DMSK........................................................................2.4-35
2.4-7
2.4-6
2.4-35
Dynamic range..........................................................2.4-64
E
EDGE........................................................................ 2.4-31
ERMES standard ......................................................2.4-36
Error
constellation diagram.......................................... 2.4-53
frequency............................................................2.4-52
frequency (FSK) (FSK)........................................2.4-53
magnitude........................................................... 2.4-52
magnitude (FSK)................................................. 2.4-53
magnitude of error vector.................................... 2.4-53
phase .................................................................. 2.4-52
real and imaginary part .......................................2.4-52
vector diagram.................................................... 2.4-53
Error signal................................................................2.4-52
External triggering..................................................... 2.4-95
Eye diagram.................................................. 2.4-46, 2.4-50
Eye length.................................................................2.4-47
F
2FSK......................................................................... 2.4-35
4FSK......................................................................... 2.4-35
Filter
input.................................................................... 2.4-39
reference.............................................................2.4-39
Find burst..................................................................
FLEX......................................................................... 2.4-36
Floating averaging.....................................................2.4-27
FM signal ..................................................................
FM-demodulated time signal..................................... 2.4-14
Frame length ............................................................. 2.4-59
Free-running trigger...................................................2.4-94
Frequency
carrier .................................................................2.4-61
offset................................................................... 2.4-61
setting accuracy.................................................. 2.4-61
Frequency error.........................................................2.4-52
Frequency error (FSK)..................................2.4-53, 2.4-57
Frequency error (sum error) ................................... 2.4-55
Frequency setting......................................................2.4-61
Frequency shift keying..............................................2.4-33
Frequency-demodulated signal .....................2.4-45, 2.4-50
FSK............................................................... 2.4-33, 2.4-36
deviation............................................................. 2.4-41
FSK deviation..........................................................2.4-57
FSK deviation error.................................................2.4-57
2.4-96
2.4-14
G
Group mid-points.......................................................2.4-42
GSM..........................................................................2.4-36
K
Hardkey
RANGE...............................................................
High pass AF filter.......................................................
2.4-23
2.4-9
1066.4317.02 I.1 E-5
Page 6

Inhaltsverzeichnis FSE-B7
I
I/Q diagram................................................................2.4-48
I/Q imbalance (sum error) .......................................2.4-56
I/Q offset (sum error)...............................................2.4-56
IF bandwidth..............................................................2.4-92
IF BW AUTO ...............................................................
IF BW MANUAL...........................................................
IF filter.........................................................................2.4-7
INDICATION ABS REL..............................................
Inphase component...................................................2.4-48
Input filter...................................................................2.4-39
2.4-7
2.4-7
2.4-18
K
Key
CENTER .............................................................
COUPLING..........................................................2.4-92
D LINES..............................................................2.4-79
DELTA.................................................................
LIMITS ................................................................2.4-82
MKR ->................................................................
MODE...................................................................2.4-2
NORMAL.............................................................
REF.....................................................................2.4-64
SWEEP...............................................................2.4-93
TRACE................................................................2.4-89
TRIGGER............................................................2.4-94
2.4-61
2.4-72
2.4-78
2.4-69
L
Level
line ......................................................................2.4-80
Limit line
copy ....................................................................2.4-84
delete..................................................................2.4-84
save ....................................................................2.4-88
select...................................................................2.4-82
value ...................................................................2.4-88
Limit lines..................................................................2.4-81
Line
display 1,2...........................................................2.4-80
limit......................................................................2.4-81
reference.............................................................2.4-80
threshold.............................................................2.4-80
time 1, 2..............................................................2.4-80
Low pass AF filter........................................................
2.4-9
M
Magnitude
peak....................................................................2.4-76
Magnitude (capture buffer).........................................2.4-44
Magnitude (measurement signal)............................... 2.4-45
Magnitude (reference signal).....................................2.4-45
Magnitude error.............................................2.4-52, 2.4-53
Magnitude error (FSK).............................................2.4-57
Magnitude error (sum error)....................................2.4-55
Marker.......................................................................2.4-69
coupled................................................................2.4-70
delta....................................................................2.4-72
Marker ->.............................................................2.4-78
phase indication ..................................................2.4-70
polar diagram ......................................................2.4-70
search.................................................................2.4-73
Search Limit........................................................2.4-74
Max Hold...................................................................2.4-91
Mean.........................................................................2.4-77
Measurement (digital demodulation)..........................2.4-43
Measurement curve
minimum-value averaging................................... 2.4-91
peak-value averaging.......................................... 2.4-91
Measurement filter ....................................................2.4-39
Measurement signal
phase .................................................................. 2.4-45
Measurement signal (digital demodulation)...............2.4-44
Measuring time..........................................................2.4-19
Memory size.............................................................. 2.4-58
Min Hold.................................................................... 2.4-91
Minimum shift keying................................................. 2.4-34
Minimum-value averaging......................................... 2.4-91
MODACOM............................................................... 2.4-36
Mode
vector signal analysis............................................ 2.4-1
Modulation
summary.............................................................
Modulation error........................................................2.4-51
Modulation parameters.............................................. 2.4-38
analog demodulation.............................................
MSK.............................................................. 2.4-34, 2.4-35
2.4-15
2.4-8
N
NADC (IS54) ............................................................. 2.4-36
Normalization............................................................ 2.4-42
Number of sweeps.................................................... 2.4-77
Nyquist filter.............................................................. 2.4-41
O
OQPSK..................................................................... 2.4-35
Output formats (digital demodulation)........................2.4-44
P
Parameters
analog demodulation............................................. 2.4-8
Pattern.................................................................... 2.4-102
name.................................................................2.4-103
selection ...........................................................2.4-102
PCS1900...................................................................2.4-36
PDC.......................................................................... 2.4-36
Peak..........................................................................2.4-76
Peak hold.................................................................. 2.4-77
Peak-value averaging................................................2.4-91
Phase
shift.....................................................................2.4-45
Phase error............................................................... 2.4-52
Phase error (sum error) ..........................................2.4-55
Phase of the measurement....................................... 2.4-45
Phase shift keying..................................................... 2.4-30
Phase wrap...............................................................
PHS ..........................................................................2.4-36
PM signal..................................................................
Point of decision........................................................2.4-60
Points of decision (highlighting)................................. 2.4-49
Points per symbol......................................................2.4-60
Polar diagram............................................................ 2.4-48
marker.................................................................2.4-70
Polar marker..............................................................2.4-70
PSK...........................................................................2.4-30
differential...........................................................2.4-32
8PSK.........................................................................2.4-35
2.4-45
2.4-14
1066.4317.02 I.2 E-5
Page 7

FSE-B7 Index
Q
QAM..........................................................................2.4-34
16QAM......................................................................2.4-35
QCDMA.....................................................................2.4-36
QPSK........................................................................2.4-35
Quadrature amplitude modulation ..............................2.4-34
Quadrature component..............................................2.4-48
R
Range............................................................2.4-23, 2.4-65
Real time...................................................................2.4-19
REAL TIME ON...........................................................
Real-time demodulation...............................................2.4-4
Reference
deviation.............................................................. 2.4-41
filter.....................................................................2.4-39
level.....................................................................2.4-63
level offset...........................................................2.4-64
modulation...........................................................2.4-18
position................................................................2.4-67
signal (digital demodulation)................................2.4-44
value ...................................................................2.4-63
value (position)....................................................2.4-67
value X/Y axis .....................................................2.4-65
values..................................................................2.4-18
Reference deviation...................................................2.4-54
Reference line ...........................................................2.4-80
Reference signal (digital demodulator).......................2.4-40
Reference value
Y axis..................................................................
Reference value position...........................................2.4-23
Resolution bandwidth ................................................2.4-92
Result length......................................2.4-27, 2.4-60, 2.4-93
RF input
configuration........................................................2.4-68
Rho factor (sum error).............................................2.4-57
Rms value.................................................................2.4-76
Roll-off factor.............................................................2.4-41
2.4-4
2.4-23
S
Save
limit line...............................................................2.4-88
Scale unit...................................................................2.4-67
Scaling
AF output.............................................................2.4-19
vertical..................................................... 2.4-23, 2.4-65
Sensitivity
AF output.............................................................2.4-19
Side band..................................................................
SINAD measurement.................................................2.4-18
Slope.........................................................................
Soft key
ALPHA/BT...........................................................2.4-41
SYMBOL RATE................................................... 2.4-38
Softkey
+PEAK ................................................................
±PEAK ................................................................
50us....................................................................
750us ..................................................................
75us....................................................................
ACTIVE MKR / DELTA............................
AF COUPL'G AC/DC...........................................
AF SIGNAL .........................................................
ALL DELTA OFF.................................................
ALL MARKER OFF.............................................
ALL SUM MKR OFF............................................
AM SIGNAL.........................................................
AM/FM DEEMPH ................................................
2.4-11
2.4-22
2.4-76
2.4-76
2.4-12
2.4-12
2.4-12
2.4-74, 2.4-78
2.4-10
2.4-22
2.4-72
2.4-71
2.4-77
2.4-13
2.4-12
ANALOG DEMOD.................................................
AVERAGE..........................................................
AVERAGE/HOLD ON.........................................
AVERAGE/HOLD ON / OFF...............................2.4-77
BLANK................................................................ 2.4-89
CLEAR/WRITE................................................... 2.4-89
COMMENT (SYNC PATTERN).........................
CONTINOUS SWEEP........................................
CONTINUOUS SWEEP......................................
CONTINUOUS WRITE .......................................2.4-90
COPY LIMIT LINE...............................................
COUPLED MARKER..........................................
DEEMPHASIS ON/OFF......................................
DELETE LIMIT LINE...........................................
DELETE PATTERN..........................................
DELETE VALUE (limit line).................................
DELTA 1/2..........................................................
DELTA ABS / REL..............................................
DEMOD BANDWIDTH..........................................
DIGITAL DEMOD................................................
DIGITAL STANDARD......................................... 2.4-36
DISPLAY LINE 1/2..............................................
D-LINES..............................................................
EDIT SYNC PATTERN....................................
EDIT LIMIT LINE ................................................
ERROR SIGNAL.................................................
ERROR SIGNAL (FSK demodulation).................2.4-53
ERROR VECT MAGNITUDE.............................. 2.4-53
EXTERN.................................................
EYE DIAG [FREQ] (FSK demodulation)..............2.4-50
EYE DIAG [I].......................................................
EYE DIAG [Q].....................................................
EYE DIAG TRELLIS...........................................
EYE LENGTH.....................................................2.4-47
EYE LENGTH (FSK demodulation).................... 2.4-50
FIND BURST......................................................
FIND SYNC ON/OFF ..........................................
FM SIGNAL........................................................
FRAME LENGTH................................................ 2.4-59
FREE RUN.............................................
FREQUENCY (error)...........................................2.4-52
FREQUENCY (FSK demodulation).....................2.4-50
FREQUENCY (MSK demodulation).................... 2.4-45
FREQUENCY OFFSET......................................
FSK REF DEVIATION........................................
FREQUENCY (error............................................ 2.4-53
MAGNITUDE (error............................................. 2.4-53
HIGHPASS AF FILTER........................................
IF BANDWIDTH....................................................
IF BW AUTO.............................................
IF BW MANUAL........................................
INDICATION ABS REL .......................................
INSERT VALUE (limit line)..................................
LOW PASS AF FILTER........................................
MAGNITUDE...................................................... 2.4-45
MAGNITUDE (error)............................................2.4-52
MAGNITUDE (FSK demodulation) ...................... 2.4-49
MAGNITUDE CAP BUFFER............................... 2.4-44
MARKER INFO................................................... 2.4-71
MARKER1..2......................................................
MAX |PEAK| ...........................................
MAX HOLD.........................................................
MEAN.................................................................2.4-77
MEAS FILTER.................................................... 2.4-39
MEAS ONLY IF SYNC'D.....................................
MEAS RESULT ......................................
MEAS SIGNAL ...................................................
MEAS→REF.......................................................
MEMORY SIZE...................................................2.4-58
MIN.....................................................................
MIN HOLD..........................................................
2.4-21
2.4-21
2.4-74, 2.4-76
2.4-13
2.4-7
2.4-7
2.4-6
2.4-90
2.4-17
2.4-103
2.4-26
2.4-93
2.4-84
2.4-70
2.4-12
2.4-84
2.4-102
2.4-88
2.4-72
2.4-72
2.4-6
2.4-35
2.4-80
2.4-80
2.4-103
2.4-86
2.4-52
, 2.4-95
2.4-46
2.4-46
2.4-46
2.4-96
2.4-97
2.4-14
, 2.4-94
2.4-61
2.4-41
2.4-9
2.4-7
, 2.4-92
, 2.4-92
2.4-18
2.4-88
2.4-9
2.4-69
2.4-91
2.4-95
, 2.4-43
2.4-44
2.4-18
2.4-74
2.4-91
1066.4317.02 I.3 E-5
Page 8

Inhaltsverzeichnis FSE-B7
MKR → TRACE...................................................
MODULATION PARAMETER...............................
MODULATION PARAMETERS...........................2.4-38
MODULATION SUMMARY .................................
NAME (limit line)..................................................
NAME (SYNC PATTERN) .................................
NEW LIMIT LINE.................................................
NEW SYNC PATTERN.....................................
NORMALIZE.......................................................2.4-42
PEAK ..................................................................
-PEAK.................................................................
PEAK HOLD ON / OFF.......................................2.4-77
PHASE................................................................2.4-45
PHASE (error).....................................................2.4-52
PHASE WRAP ON/OFF......................................2.4-45
PM SIGNAL.........................................................
POINTS PER SYMBOL.......................................2.4-60
POLAR [IQ] CONSTELL (error)...........................2.4-53
POLAR [IQ] CONSTELLATION...........................
POLAR [IQ] VECTOR..........................................
POLAR [IQ] VECTOR (error)............................... 2.4-53
POLAR MARKER DEG/ RAD..............................
POLAR MARKER R/I / MA/PH ............................
PRE DISPL ON/OFF...........................................
RANGE...................................................
REAL TIME ON/OFF...........................................2.4-19
REAL/IMAG PART..............................................2.4-45
REAL/IMAG PART (error)....................................2.4-52
REF LEVEL.........................................................
REF LEVEL OFFSET..........................................
REF VALUE POSITION..........................
REF VALUE X AXIS............................................
REF VALUE Y AXIS................................
REFERENCE LINE.............................................
REFERENCE SIGNAL........................................
REL UNIT............................................................
RESULT LENGTH...................................
RESULT LENGTH...............................................2.4-60
RMS....................................................................2.4-76
SAVE LIMIT LINE................................................
SAVE PATTERN...............................................
SCALE UNIT...........................................
SEARCH LIMIT ON/OF F.....................................2.4-74
SELECT LIMIT LINE...........................................
SELECT MARKER..............................................
SELECT PATTERN...........................................
SENSITIV AF OUTPUT...........................
SET REFERENCE..............................................
SHIFT X LIMIT LINE ...........................................
SHIFT Y LIMIT LINE ...........................................
SIDE BAND NORM / INV....................................
SIDEBAND INV...................................................
SIDEBAND NORM..............................................
SINAD 1 kHz ON.................................................
SINGLE SWEEP.....................................
SLOPE POS/NEG ...................................
SQUELCH LEVEL...............................................
SQUELCH ON.....................................................
SUM MKR...........................................................
SUMMARY MARKER..........................................
SUMMARY MEAS TIME.....................................
SUMMARY SETTINGS.......................................
SWEEP...............................................................
SWEEP COUNT..............
SWEEP COUNT..................................................2.4-77
SWEEP TIME......................................................
SYMB TABLE / ERRORS....................................2.4-54
SYMBOL DISPLAY.............................................
SYMBOL DISPLAY (FSK demodulation) .............2.4-50
SYNC OFFSET...................................................
SYNC PATTERN...............................................2.4-102
THRESHOLD LINE .............................................
2.4-17
, 2.4-27,
2.4-78
2.4-8
2.4-15
2.4-87
2.4-103
2.4-86
2.4-103
2.4-74
2.4-76
2.4-14
2.4-48
2.4-48
2.4-70
2.4-70
2.4-12
2.4-23
, 2.4-65
2.4-64
2.4-64
2.4-23
, 2.4-67
2.4-65
2.4-23
, 2.4-65
2.4-80
2.4-44
2.4-17
2.4-27
, 2.4-93
2.4-88
2.4-104
2.4-25
, 2.4-67
2.4-82
2.4-74
2.4-102
2.4-19
, 2.4-24
2.4-18
2.4-88
2.4-88
2.4-38
2.4-11
2.4-11
2.4-18
2.4-26, 2.4-93
2.4-22, 2.4-95
2.4-11
2.4-11
2.4-75
2.4-75
2.4-19
2.4-17
2.4-26
2.4-90
, 2.4-93
2.4-27
2.4-49
2.4-98
2.4-80
TIME LINE 1/2.................................................... 2.4-80
TRIGGER OFFSET................................
VALUE (SYNC PATTERN)...............................2.4-104
VALUES (limit line).............................................
VECTOR ANALYZER...........................................
VIDEO ....................................................
VIEW ..................................................................2.4-89
VOLUME.................................................
WEIGHTING AF FILTER..................................... 2.4-9
X OFFSET..........................................................
Y OFFSET..........................................................
Y PER DIV..............................................
Softkey REFERENCE FILTER..................................2.4-39
Squelch.....................................................................
SQUELCH LEVEL.....................................................
Sum level .................................................................2.4-63
Summary
numeric measured values...................................2.4-17
Summary Marker....................................................... 2.4-75
Sweep
continuous ..............................................2.4-26,
count....................................................... 2.4-77,
number................................................................2.4-17
single.................................................................. 2.4-93
single.................................................................. 2.4-26
time..................................................................... 2.4-27
Sweep number..........................................................2.4-27
Symbol decision point...............................................2.4-50
Symbol decision points..............................................2.4-49
Symbol mapping .......................................................2.4-30
Symbol rate...............................................................2.4-38
Symbol table............................................................. 2.4-54
Sync offset................................................................ 2.4-98
Sync pattern............................................................ 2.4-102
Sync pattern, editing ...............................................2.4-103
Sync search..............................................................
Synchronization sequence........................................2.4-97
2.4-22
2.4-21
2.4-20
2.4-23
, 2.4-95
2.4-88
2.4-2
, 2.4-94
, 2.4-24
2.4-84
2.4-84
, 2.4-65
2.4-11
2.4-11
2.4-93
2.4-90
2.4-97
T
TETRA...................................................................... 2.4-36
TFTS......................................................................... 2.4-36
Threshold line............................................................2.4-80
Time lines..................................................................2.4-80
Time signal
AM-demodulated.................................................2.4-13
FM-demodulated................................................. 2.4-14
PM-demodulated.................................................2.4-14
Trellis diagram...........................................................2.4-46
Trigger.......................................................................2.4-94
AF signal.............................................................
delay...................................................................2.4-95
edge, pos./neg.................................................... 2.4-95
external............................................................... 2.4-95
external voltage...................................................2.4-21
free run............................................................... 2.4-21
free running......................................................... 2.4-94
offset.......................................................
slope...................................................................2.4-22
threshold............................................................. 2.4-94
video...................................................................2.4-94
video voltage....................................................... 2.4-21
Trigger edge.............................................................. 2.4-22
2.4-22
2.4-22
, 2.4-95
U
Unit
relative display.................................................... 2.4-17
Y-axis..................................................................2.4-25
Unit circle.................................................................. 2.4-42
Unit, ..........................................................................2.4-67
1066.4317.02 I.4 E-5
Page 9

FSE-B7 Index
V
Vector diagram..........................................................2.4-48
Vector error (sum error)..........................................2.4-55
Vector Signal Analyzer.................................................2.4-1
Video trigger..............................................................2.4-94
Volume......................................................................
2.4-20
W
WCPE....................................................................... 2.4-36
Weighting filter............................................................ 2.4-9
1066.4317.02 I.5 E-5
Page 10

Page 11

FSE-B7 Preparation for Use
1 Preparation for Use
1.1 Introduction
This manual is an ex tension to the FSE manual and des cribes exclus ively vector analysis functions . All
other functions are described in the FSE manual. For a better orientation refer to the alphabetically
arranged table below.
Subject Section in FSE manual
Basic Steps of Operat i on 2.3
Emulations AnnexE
Firmware Update 1.8
Gereral Configuration 2.4
Interfaces Annex A
List of Error Messages Annex B
Macros 2.8
Measurement Documentat i on 2.6
Programming Examples Annex D
Remote Control Command Processing
and Status Reporting Syst em
Remote Control Introduct i on 3.1 to 3.5
Saving and Recalling Data Sets 2.7
Setup of Display and Limi t Lines 2.9.4
Status Display-Remote/Manual Control 2.5
3.7 to 3.8
1066.4317.02 1.1-1 E-1
Page 12

Preparation for Use FSE-B7
This page is intentionally blank
1066.4317.02 1.1-2 E-1
Page 13
FSE-B7 Menu Overview
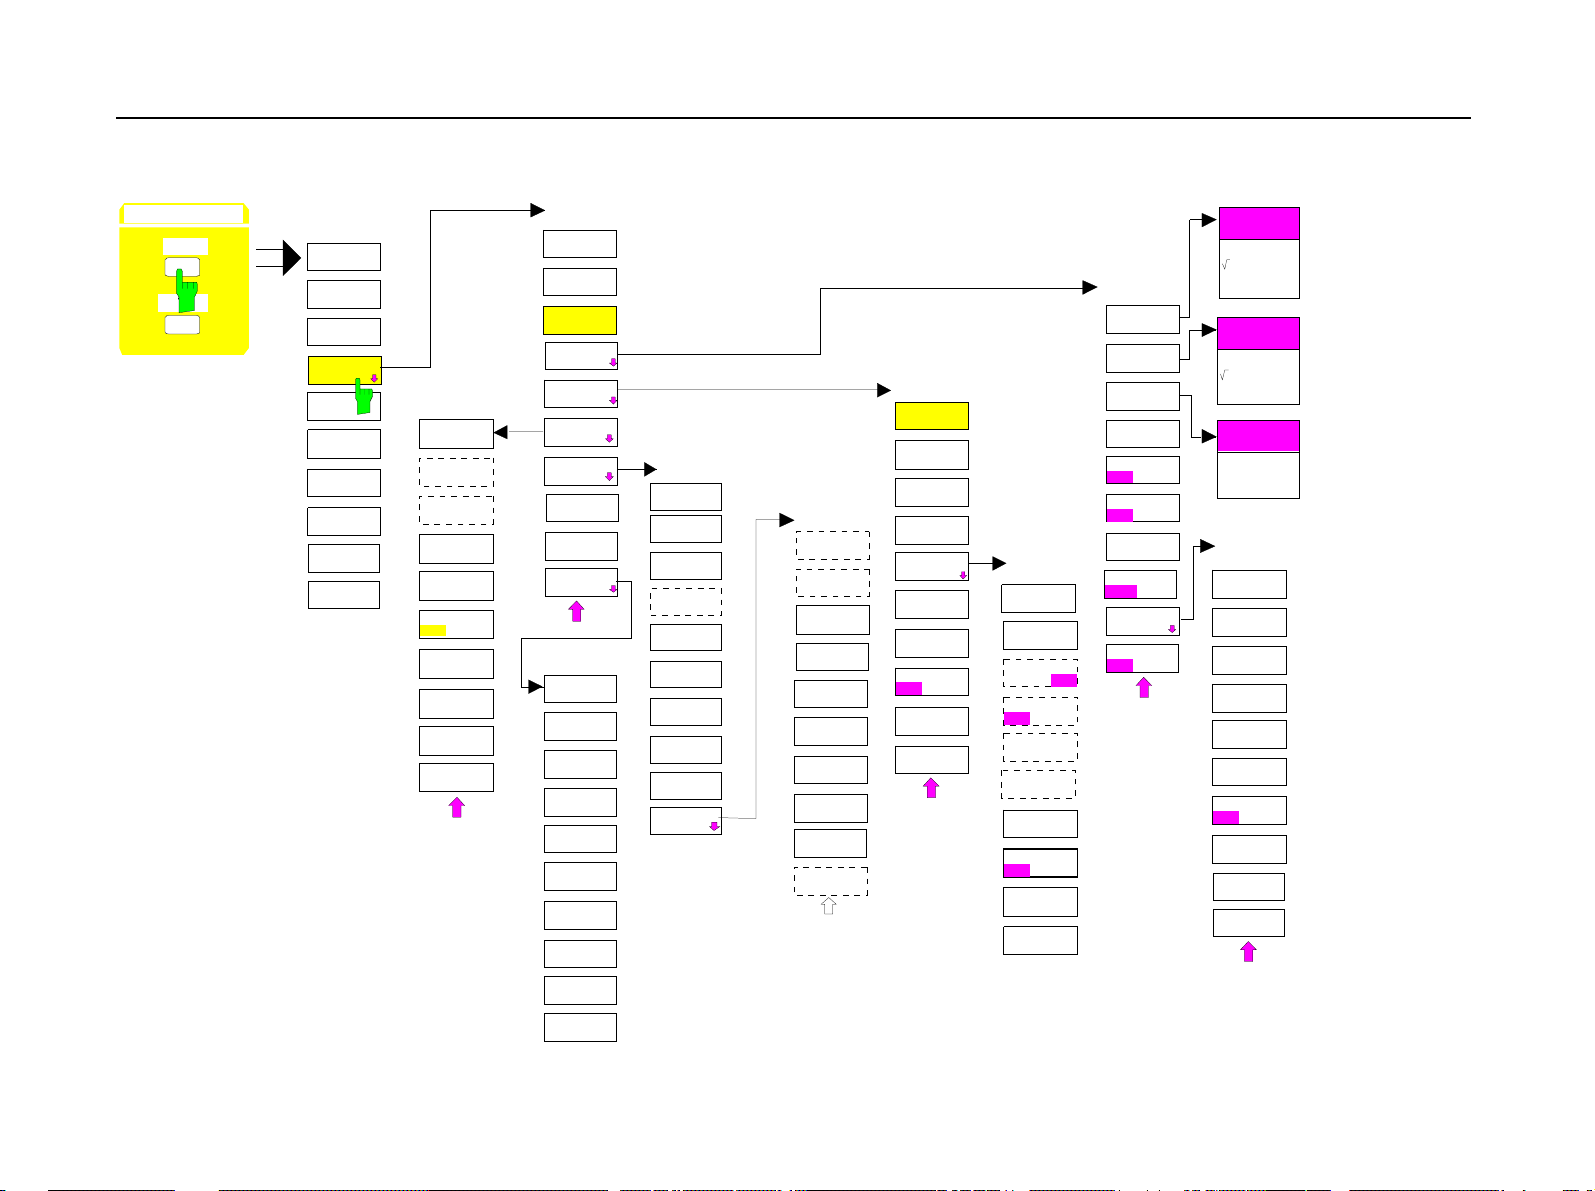
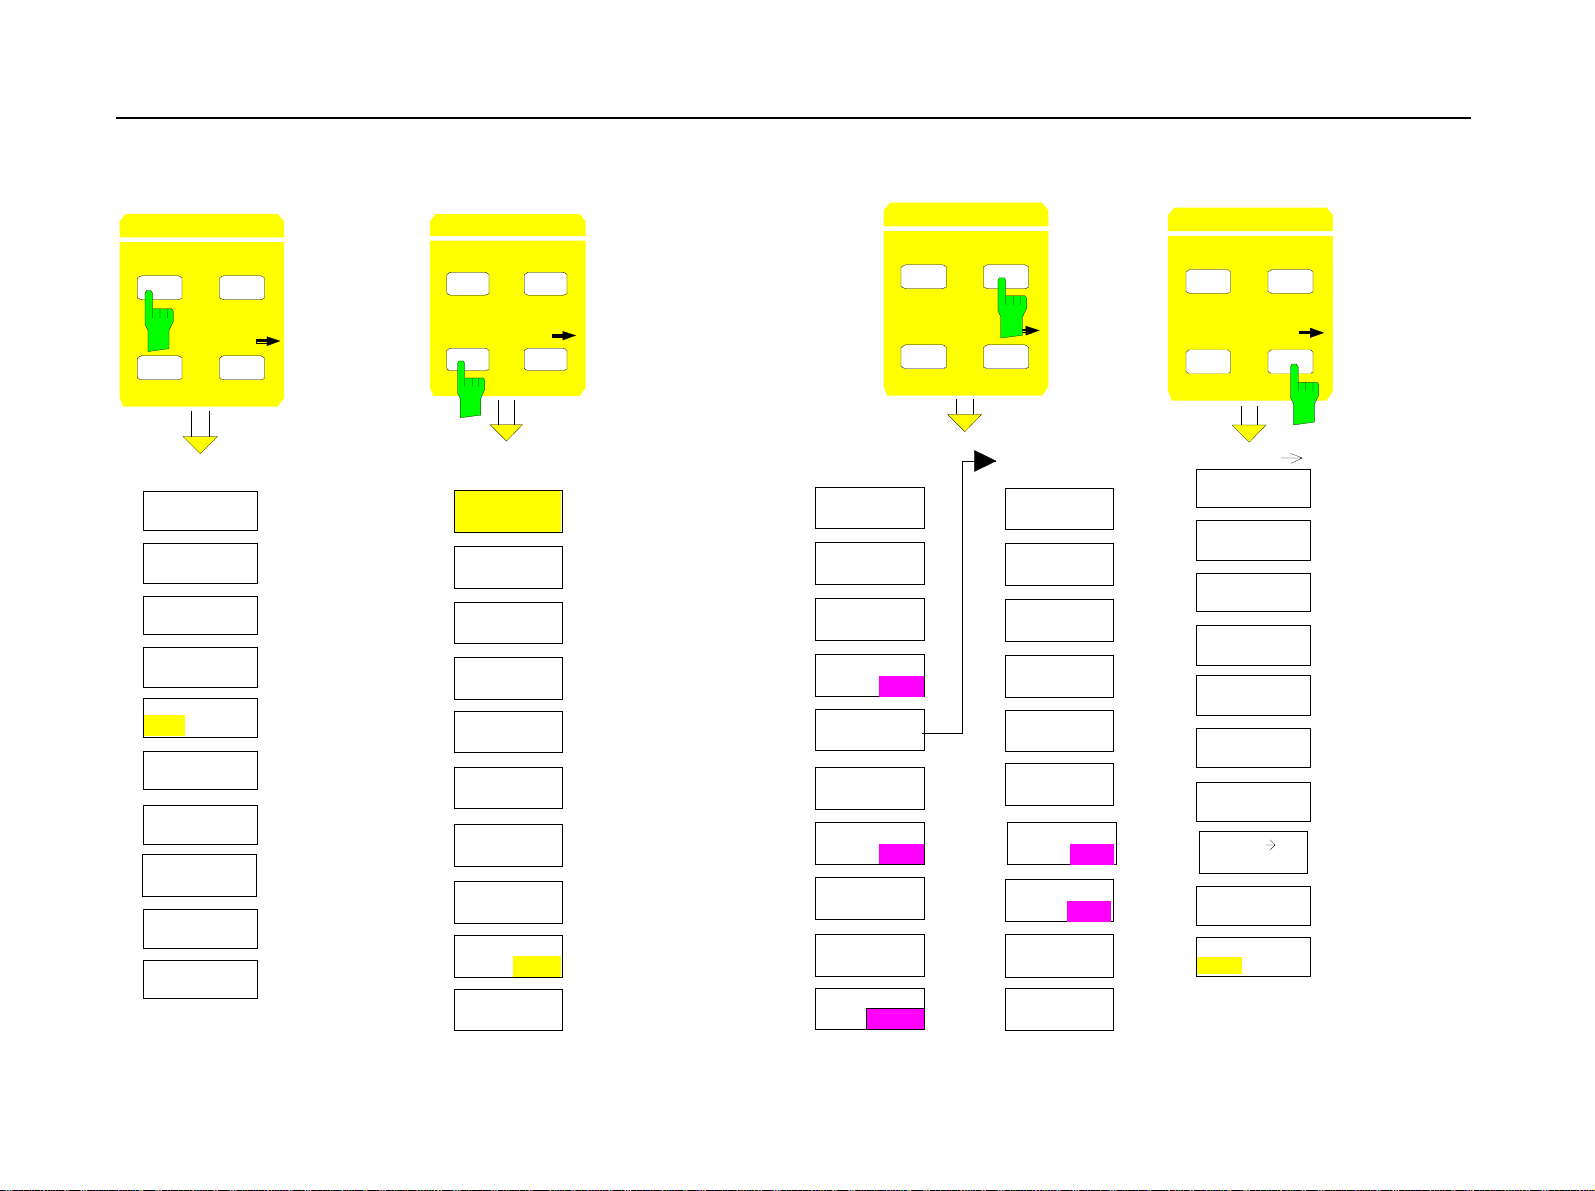
2.2 Menu Overview
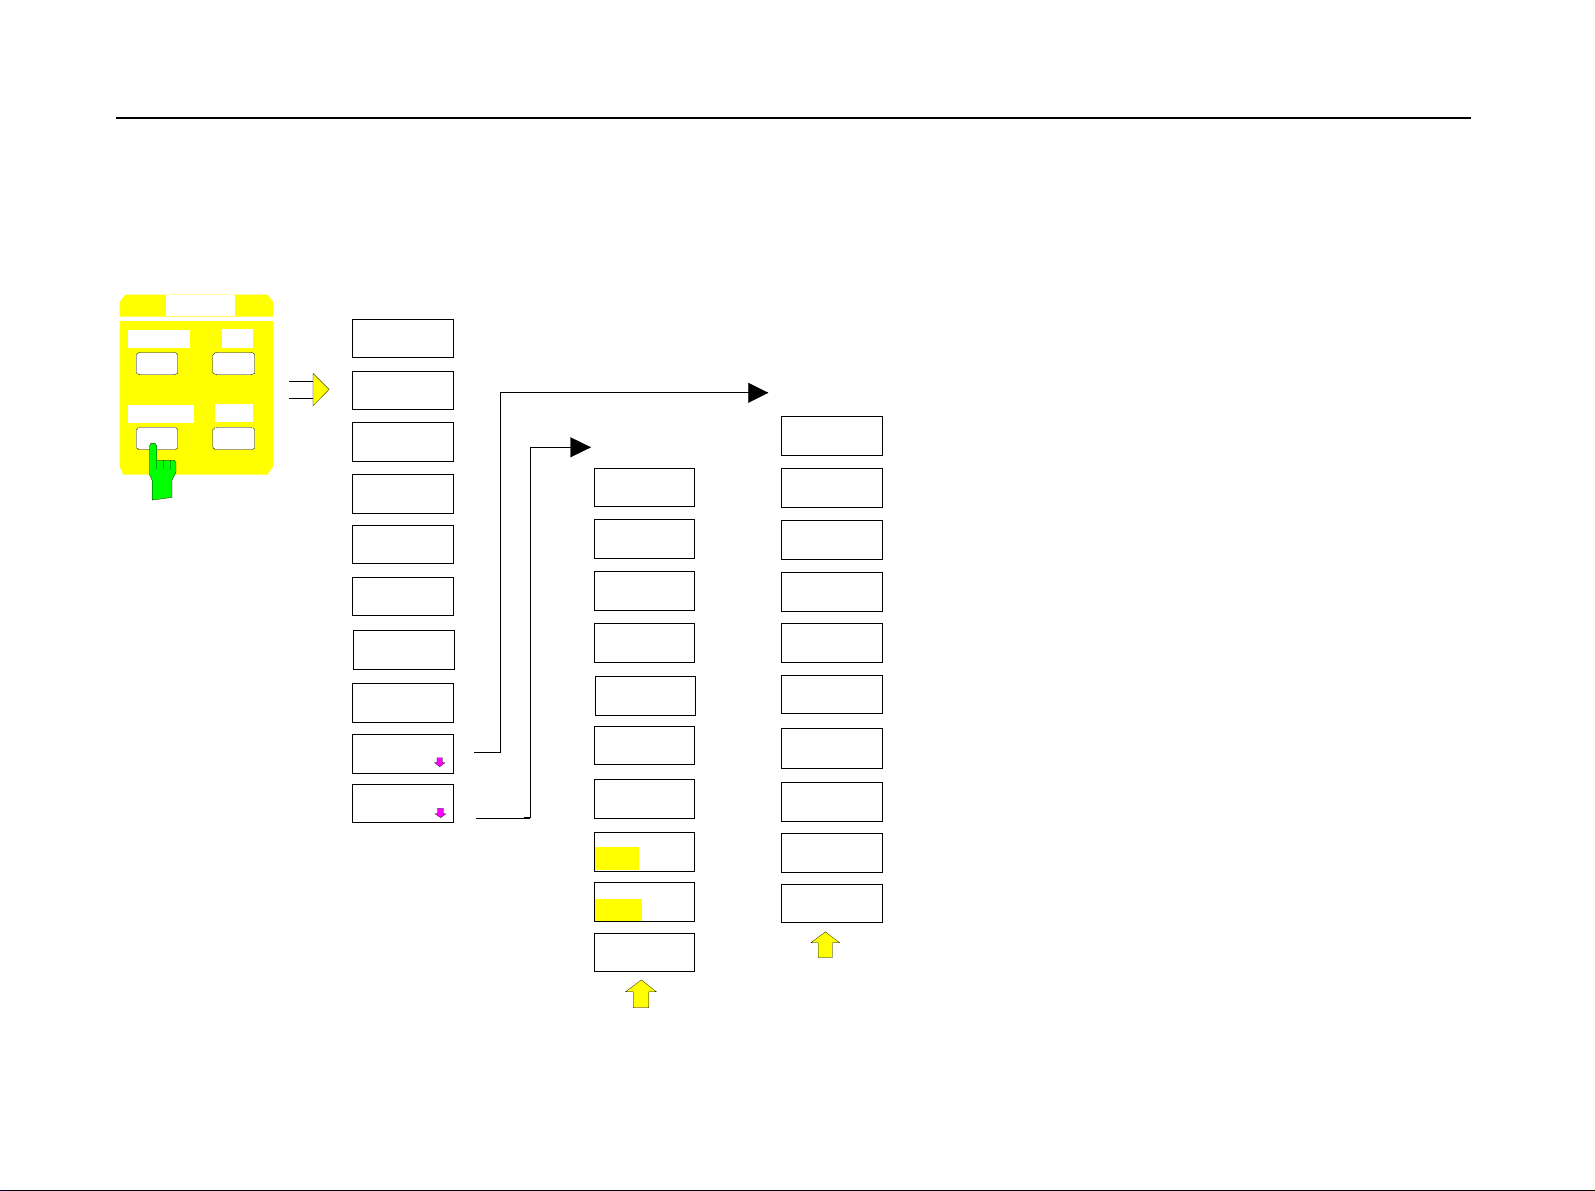
2.2.1 SYSTEM Key Group
SYSTEM
PRESET
DISPLAY
CAL
INFO
DISPLAY
FULL
SCREEN
SPLIT
SCREEN
ACTIVE
SCREEN A
ACTIVE
SCREEN B
SCREEN
COUPLING
CONFIG
DISPLAY
CONFIG
DISPLAY
SELECT
OBJECT
BRIGHTNESS
TINT
SATURATION
DEFAULT
COLORS
PREDEFINED
COLORS
LOGO
ON OFF
FREQUENCY
ON OFF
DATA ENTRY
OPAQUE
SCREEN
COUPLING
MODE
COUPLED
HORIZONTAL
SCALING
VERTICAL
SCALING
SCREENS
UNCOUPLED
- Identical to analyzer mode
1066.4317.02 2.2-1 E-6
Page 14
FSE-B7 Menu Overview
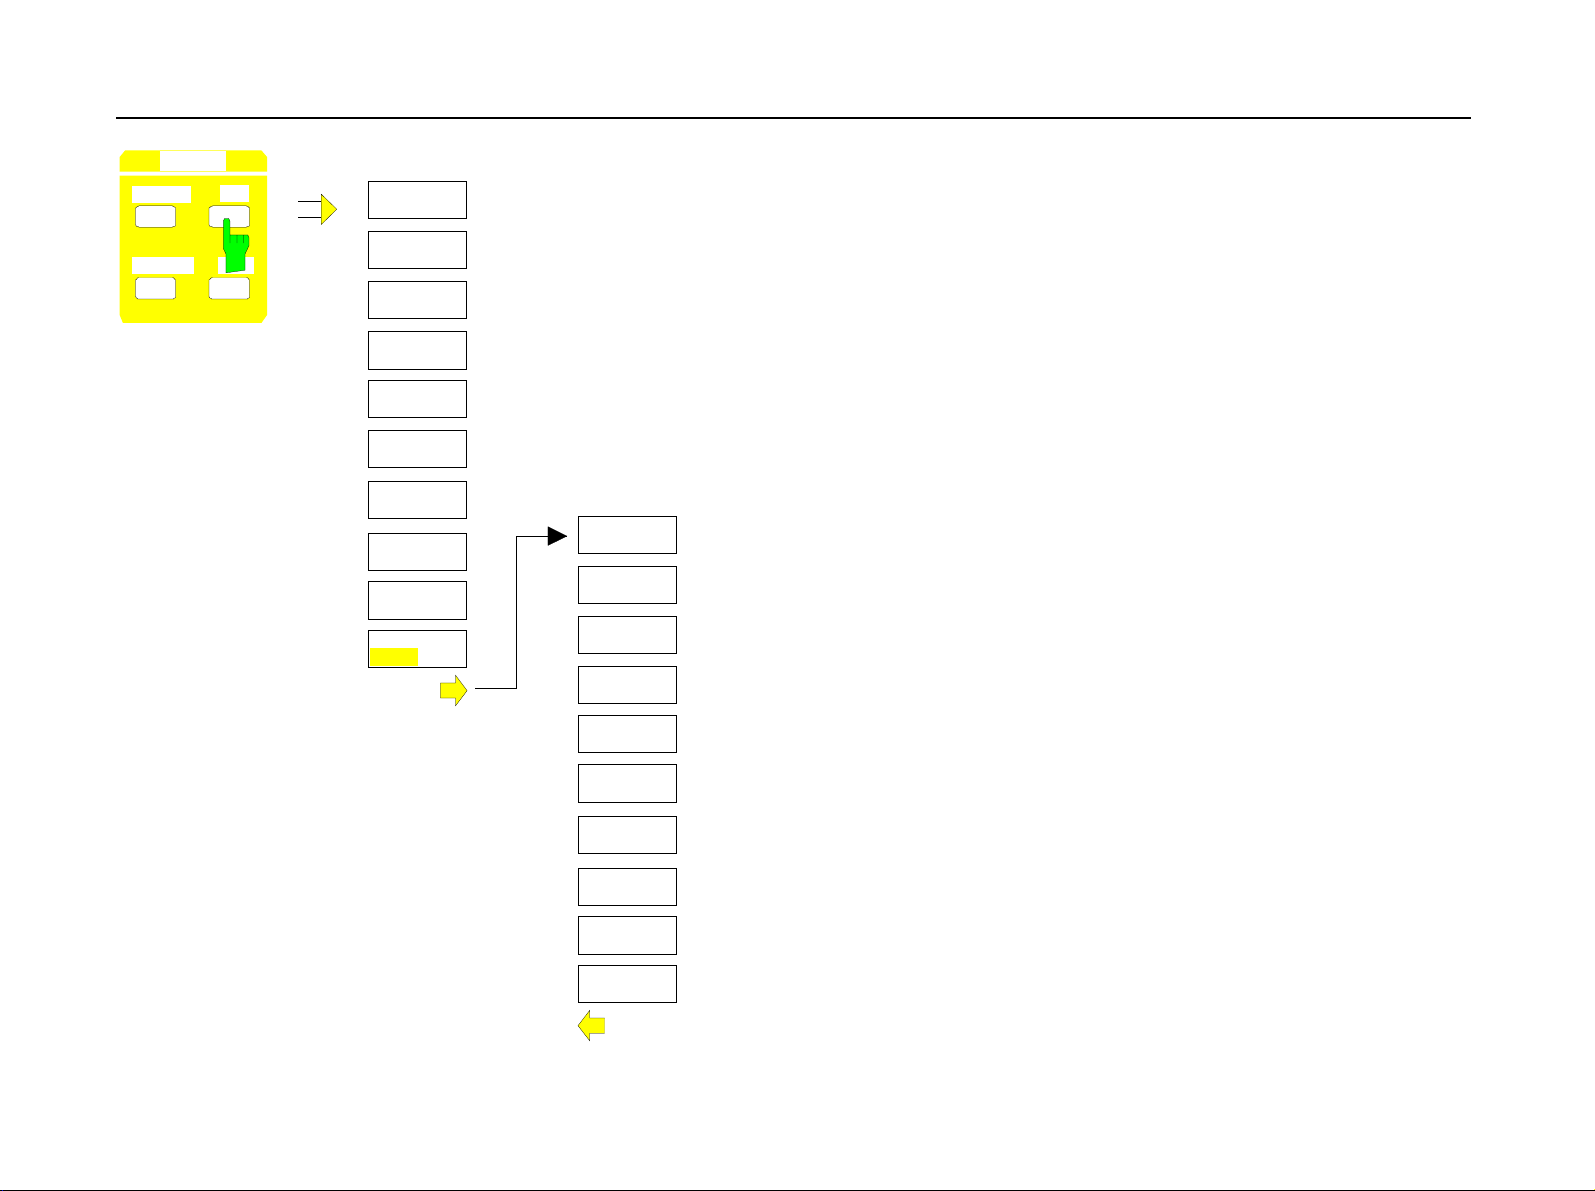
SYSTEM
PRESET
DISPLAY INFO
CAL
CALIBR ATE
CAL S HORT
CAL TOTAL
CAL
RES BW
CAL LOG
CAL
LO SUPP
CAL
CAL I/Q
I/Q
CAL CORR
ON OFF
CALIBRATE
CAL
RESULTS
PAGE UP
PAGE DOWN
- Identical to analyzer mode
1066.4317.02 2.2-2 E-6
Page 15
FSE-B7 Menu Overview
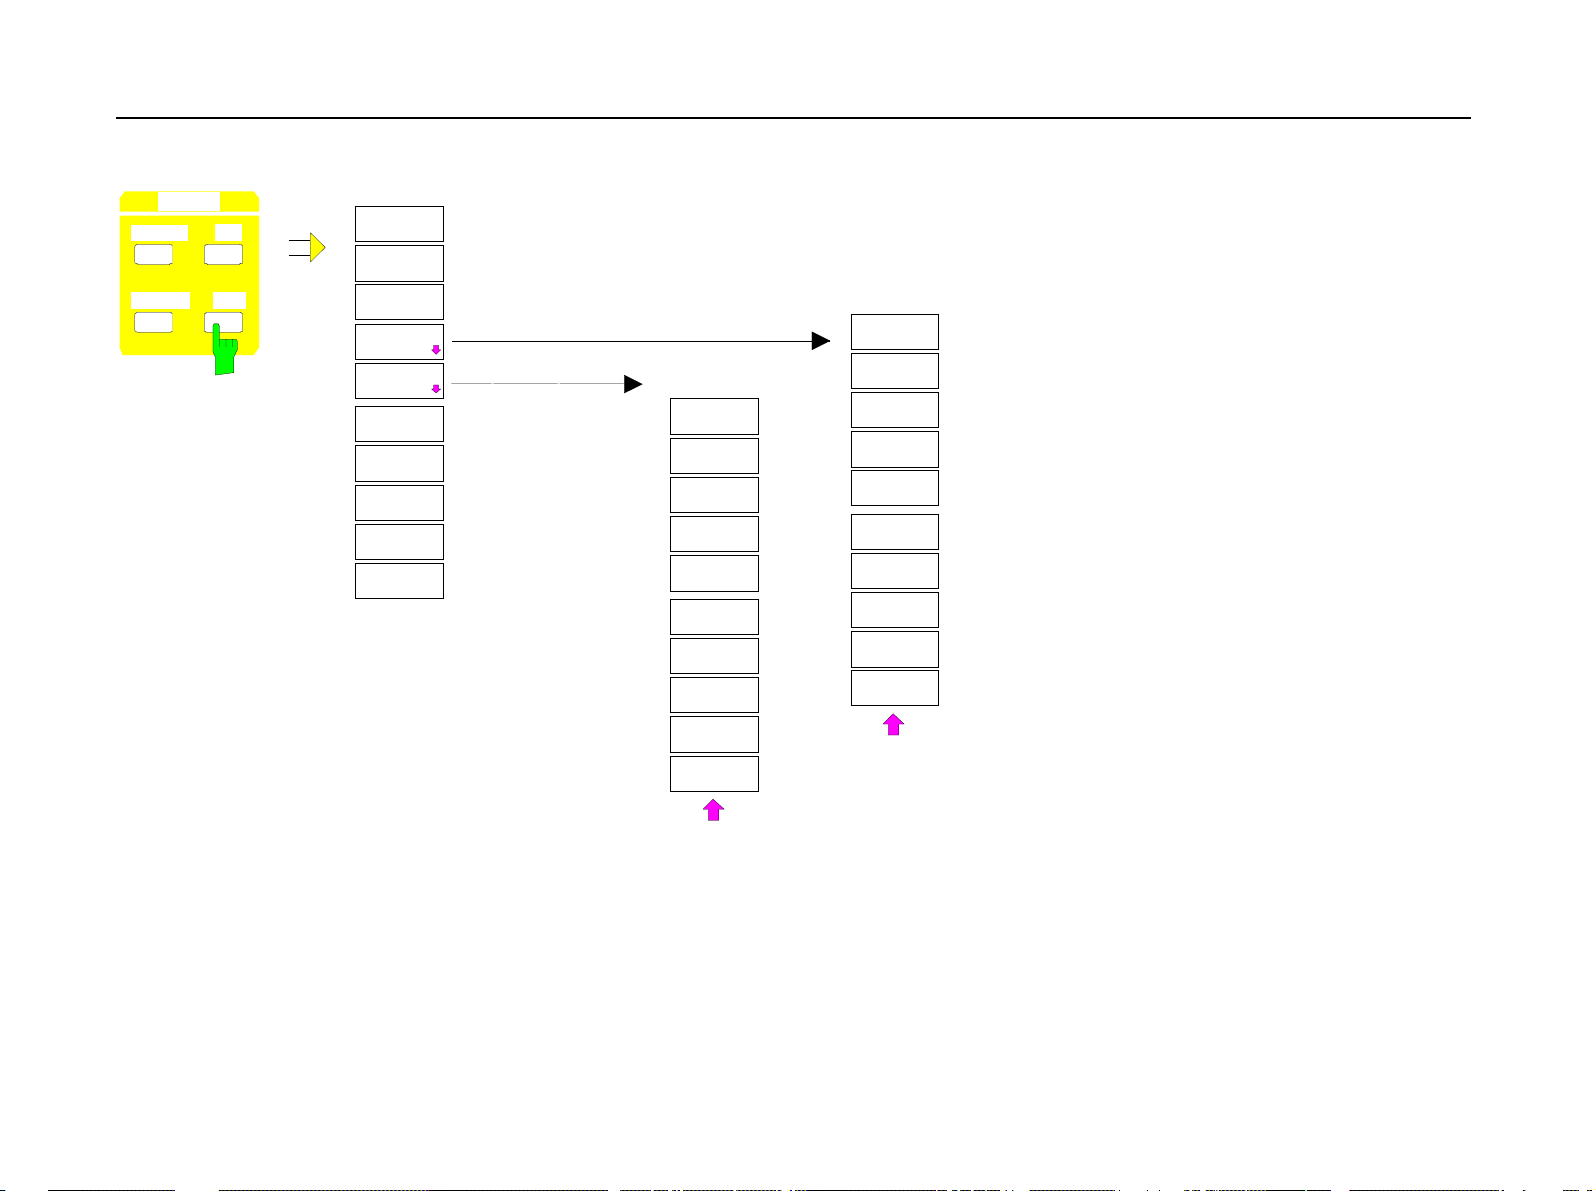
SYSTEM
PRESET
CAL
DISPLAY INFO
INFO
INSTRUMENT
SETTINGS
FIRMWARE
VERSIONS
HARDWARE+
OPTIONS
SELFTEST
SYSTEM
MESSAGES
HELP
HELP
FIRST
TOPIC
SEARCH
TOPIC
LIST OF
TOPICS
HELP
ON HELP
RETURN
TO MENU
SYSTEM
MESSAGES
SELECT
MESSAGE
CLEAR
MESSAGE
CLEAR ALL
MESSAGES
UPDATE
MESSAGES
PAGE UP
SELFTEST
EXECUTE
TESTS
ENABLE
ALL TESTS
DISABLE
ALL TESTS
CLEAR TEST
RESULTS
PAGE UP
PAGE DOWN
INSTRUMENT
SETTINGS
PAGE UP
PAGE DOWN
PAGE UP
PAGE DOWN
PAGE DOWN
- Identical to analyzer mode
1066.4317.02 2.2-3 E-5
Page 16
FSE-B7 Menu Overview
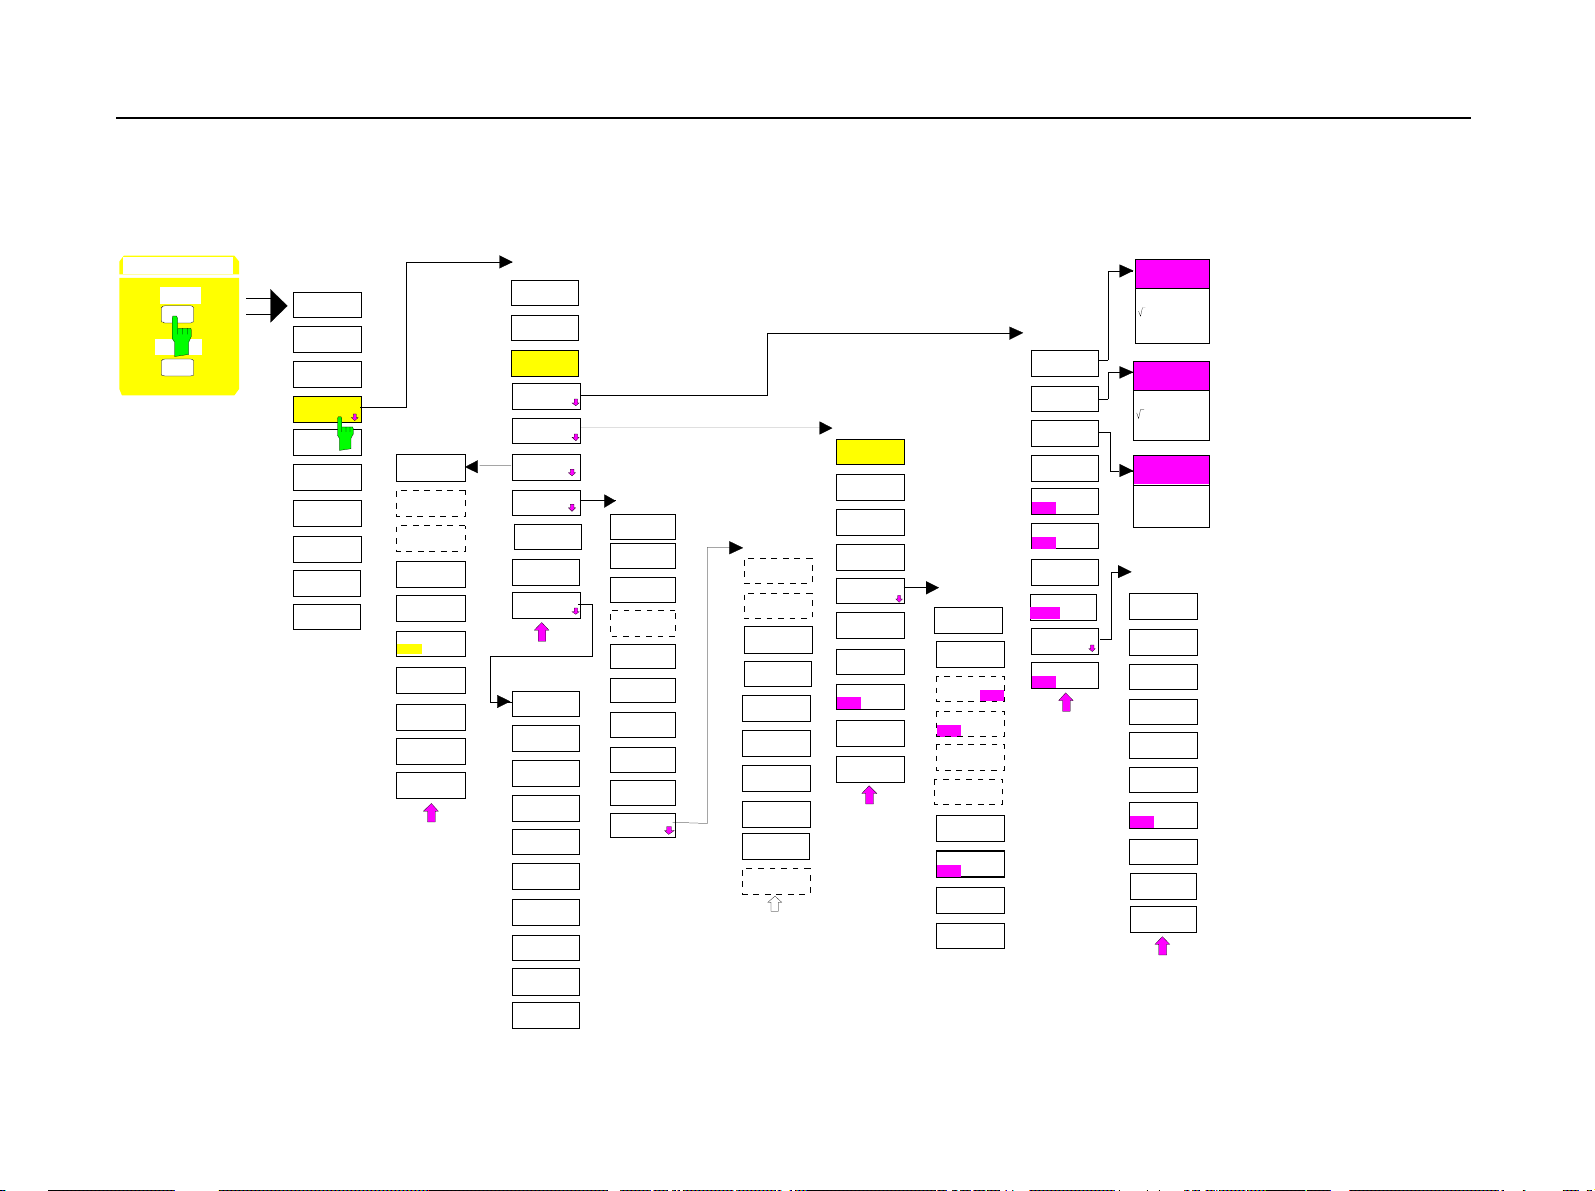
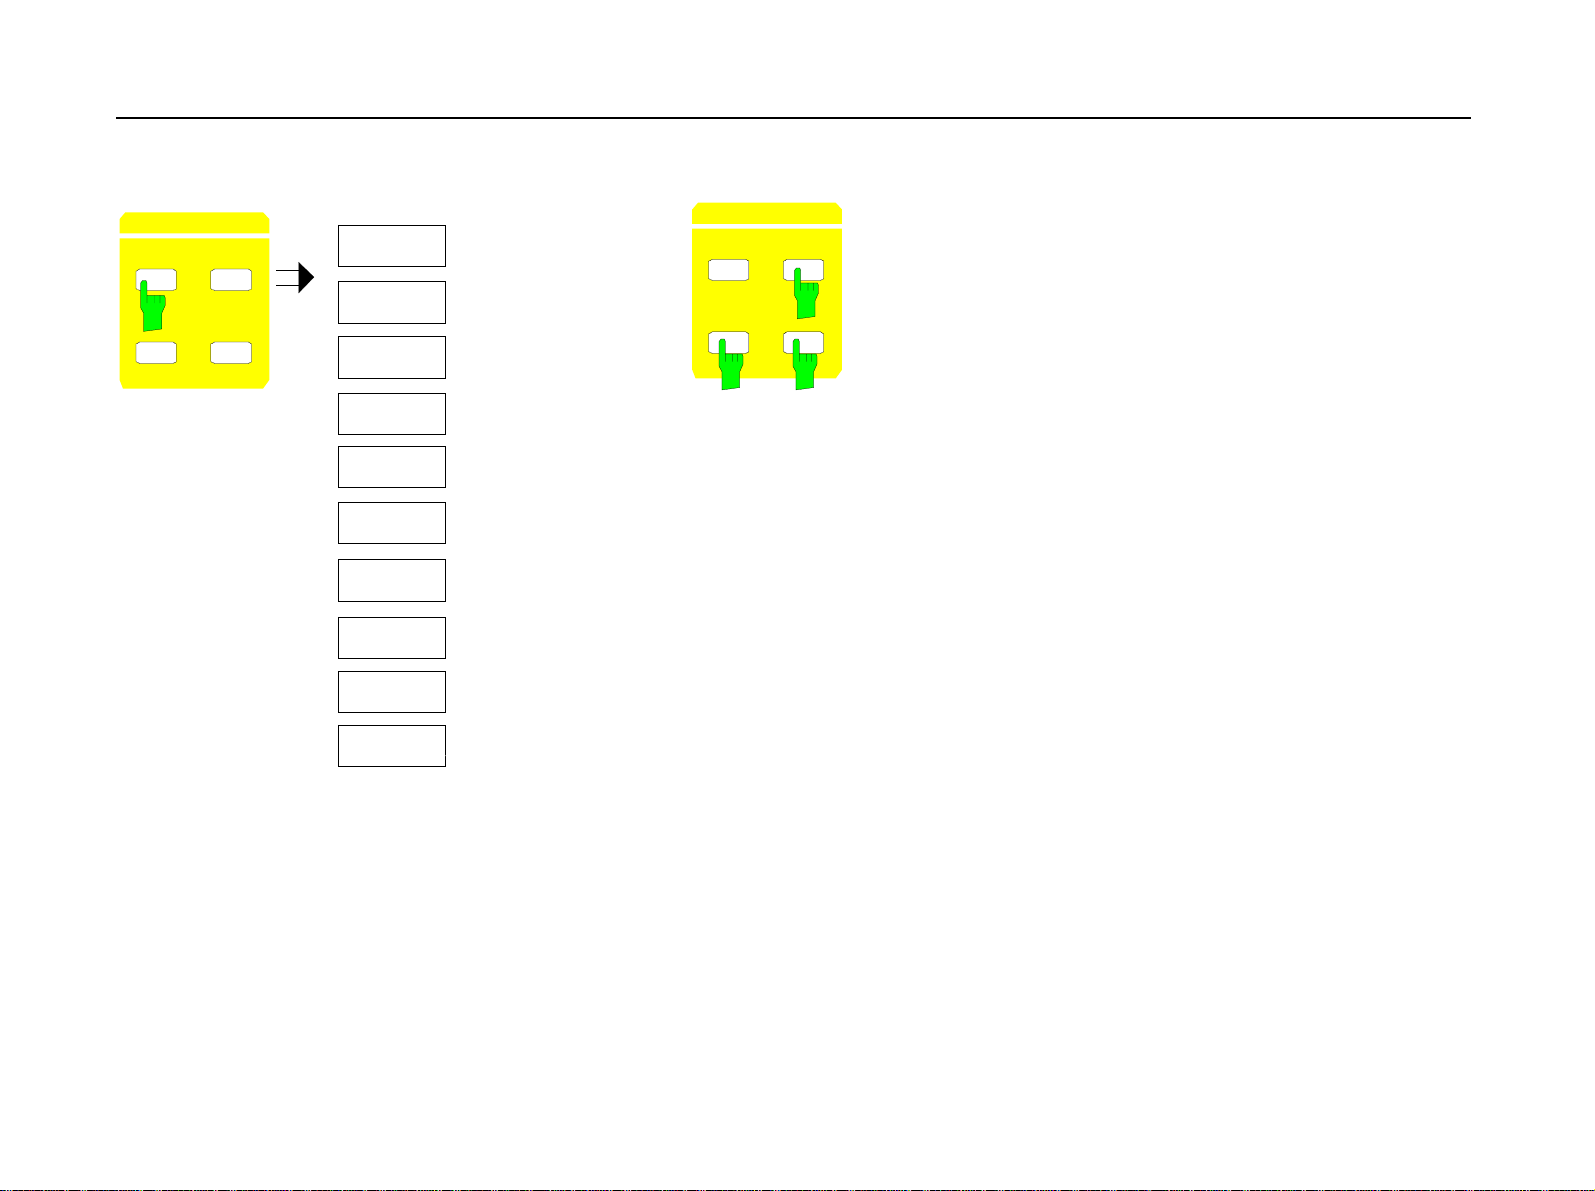
2.2.2 CONFIGURATION Key Group
a) In Digital Demodulation Mode (not FSK-Demodulation)
CONFIGURATION
MODE
SETUP
MODE
ANALYZER
RECEIVER
VECTOR
ANALYZER
AF DEMOD
TRIGGER
FREE RUN
VIDEO
EXTERN
AF SIGNAL
TRIGGER
OFFFSET
SLOPE
POS NEG
VECTOR
ANALYZER
DIGITAL
STANDARDS
DIGITAL
DEMOD
ANALOG
DEMOD
MODULATION
PARAMETER
MEAS
RESULT
TRIGGER
RANGE
SWEEP
TIME
DEMOD
BANDWIDTH
IF
BANDWIDTH
IF BW
AUTO
IF BW
MANUAL
RANGE
SCALE
Y PER DIV
REF VALUE
Y AXIS
REF VALUE
X AXIS
REF VALUE
POSITION
SENSITIV
AF OUTPUT
VOLUME
SCALE
UNIT
SCALE
UNIT
Y UNIT
LOG[dB ]
Y UNIT
LINEAR
Y UNIT
DEG
Y UNIT
RAD
Y UNIT
dBm
Y UNIT
VOLT
Y UNIT
WAT T
X UNIT
TIME
X UNIT
SYMBOL
MEAS RESULT
AM SIGNAL
FM SIGNAL
PM SIGNAL
MODULATION
SUMMARY
SUMMARY
SETTINGS
SUMMARY
MEAS TIME
REAL TIME
ON OFF
SENSITIV
AF OUTPUT
VOLUME
SUMMARY
SETTINGS
AVERAGE/
HOLD ON
SWEEP
COUNT
REL UNIT
%
INDICATION
ABS REL
SET
REFERENCE
MEAS->REF
SINAD 1kHz
ON OFF
dB
DEMOD
SETTINGS
HIGH PASS
AF FILTER
LOW PASS
AF FILTER
WEIGHTING
AF FILTER
AF COUPL’G
AC DC
SQUELCH
ON OFF
SQUELCH
LEVEL
SIDE BAND
NORM INV
AM/FM
DEEMPH
DEEMPHASIS
ON OFF
HIGH PASS
AF F ILTE R
NONE
30 Hz
300 Hz
LOW PASS
AF FILTER
NONE
3 kHz
15 kHz
WEIGHTING
AF FILTER
CCITT
C-Message
AM/FM
DEEMPHASIS
50 us
75 us
750 us
PRE DISPL
ON OFF
1066.4317.02 2.2-4 E-6
Page 17
FSE-B7 Menu Overview
b) In Analog Demodulation (REAL TIME ON)
CONFIGURATION
MODE
SETUP
MODE
ANALYZER
RECEIVER
VECTOR
ANALYZER
AF DEMOD
TRIGGER
FREE RUN
VIDEO
EXTERN
AF SIGNAL
TRIGGER
OFFFSET
SLOPE
POS NEG
VECTOR
ANALYZER
DIGITAL
STANDARDS
DIGITAL
DEMOD
ANALOG
DEMOD
MODULATION
PARAMETER
MEAS
RESULT
TRIGGER
RANGE
SWEEP
TIME
DEMOD
BANDWIDTH
IF
BANDWIDTH
IF BW
AUTO
IF BW
MANUAL
RANGE
SCALE
Y PER DIV
REF VALUE
Y AXIS
REF VALUE
X AXIS
REF VALUE
POSITION
SENSITIV
AF OUTPUT
VOLUME
SCALE
UNIT
SCALE
UNIT
Y UNIT
LOG[dB]
Y UNIT
LINEAR
Y UNIT
DEG
Y UNIT
RAD
Y UNIT
dB m
Y UNIT
VO L T
Y UNIT
WA TT
X UNIT
TIME
X UNIT
SYMBOL
MEAS RESULT
AM SIGNAL
FM SIGNAL
PM SIGNAL
MODULATIO N
SUMMARY
SUMMARY
SETTINGS
SUMMARY
MEAS TIME
REAL TIME
ON OFF
SENSITIV
AF OU TPUT
VOLUME
SUMMARY
SETTINGS
AVERAGE/
HOLD ON
SWEEP
COUNT
REL UNIT
%
INDICATION
ABS REL
SET
REFERENCE
MEAS->REF
SINAD 1kHz
ON OFF
dB
DEMOD
SETTINGS
HIGH PASS
AF FILTER
LOW PASS
AF FILTER
WEIGHTING
AF FILTER
AF COUPL’G
AC DC
SQUELCH
ON OFF
SQUELCH
LEVEL
SIDE BAND
NORM INV
AM/FM
DEEMPH
DEEMPHASIS
ON OFF
HIGH PASS
AF F ILT ER
NONE
30 Hz
300 Hz
LOW PASS
AF FILTER
NONE
3 kHz
15 kHz
WEIGHTING
AF FILTER
CCITT
C-Message
AM/FM
DEEMPHASIS
50 us
75 us
750 us
PRE DISPL
ON OFF
1066.4317.02 2.2-5 E-5
Page 18

FSE-B7 Menu Overview
CONFIG URATION
MODE
SETUP
See analyzer mod e
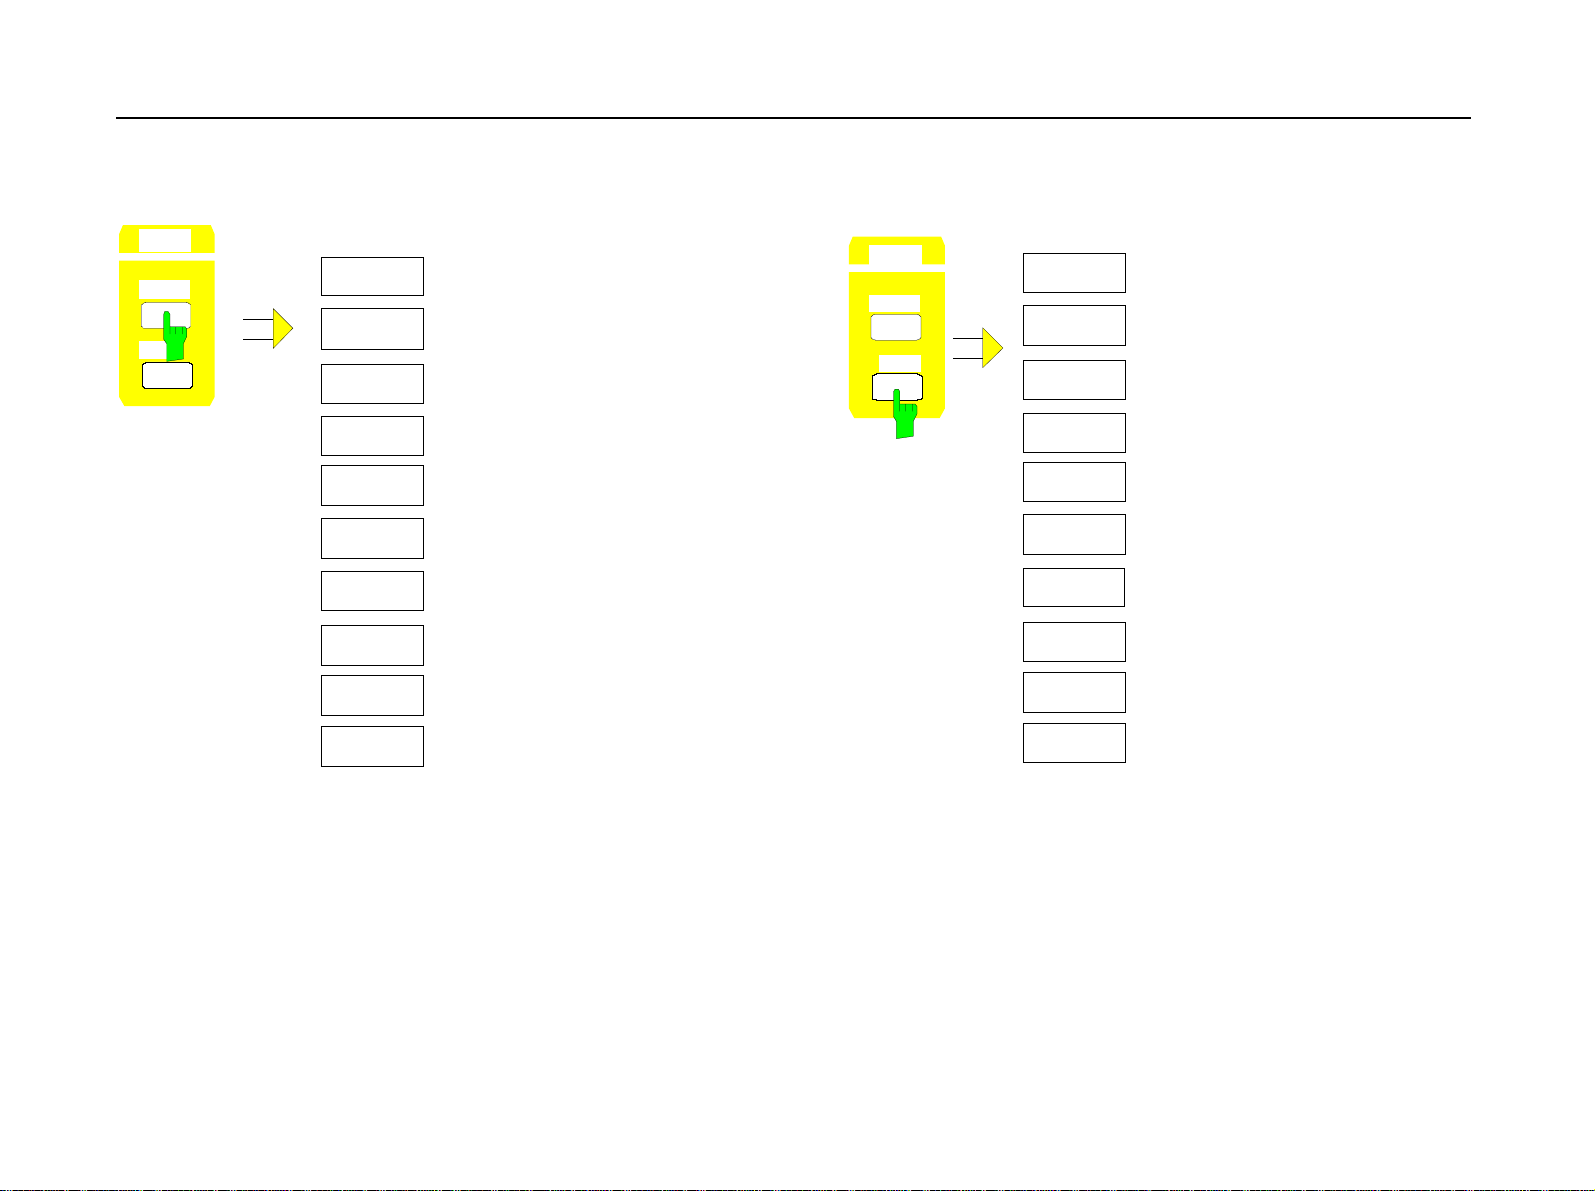
2.2.3 HARDCOPY Key Group
See analyzer mode
1066.4317.02 2.2-6 E-6
Page 19
FSE-B7 Menu Overview
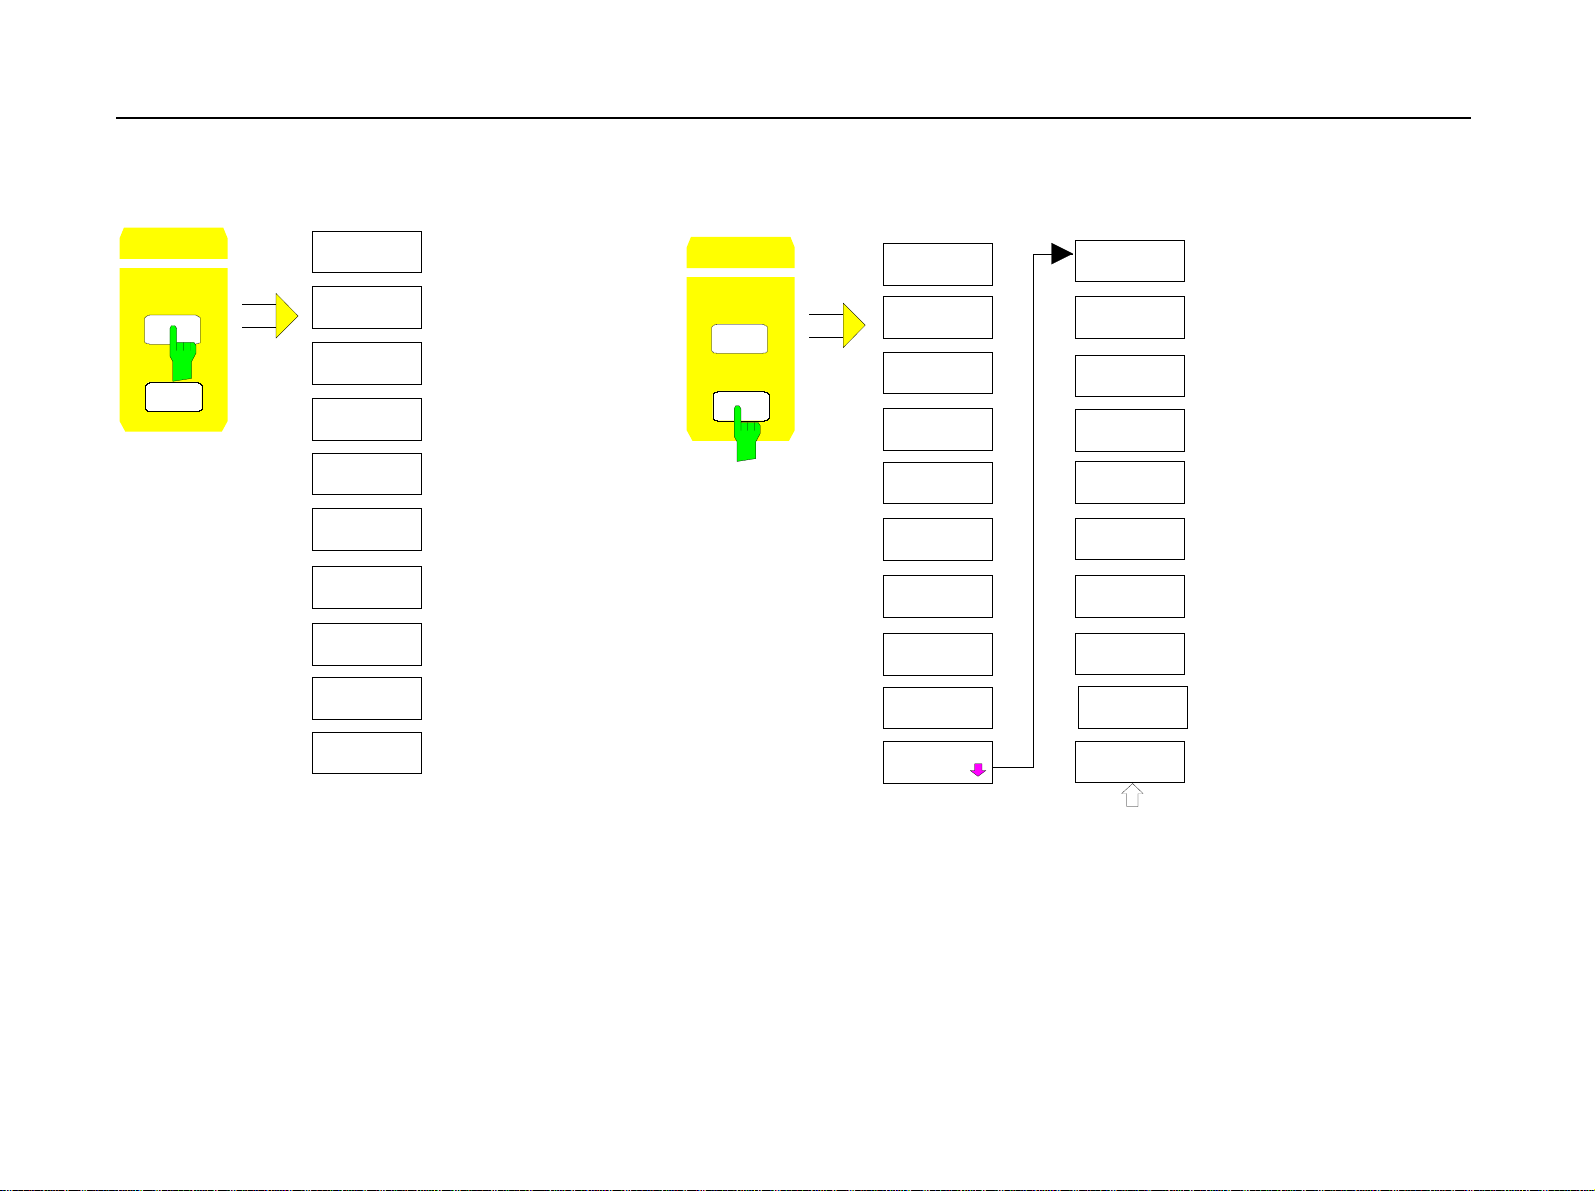
2.2.4 FREQUENCY Key Group
FREQUENCY
CENTER SPAN
START STOP
CENTER
CENTER
FREQUENCY
FREQUENCY
OFFSET
MIXER
INTERNAL
MIXER
EXTERNAL
FREQUENCY
CENTER SPAN
START STOP
SPAN, START and STOP are
without function in the
vector analyzer mode!
1066.4317.02 2.2-7 E-5
Page 20
FSE-B7 Menu Overview
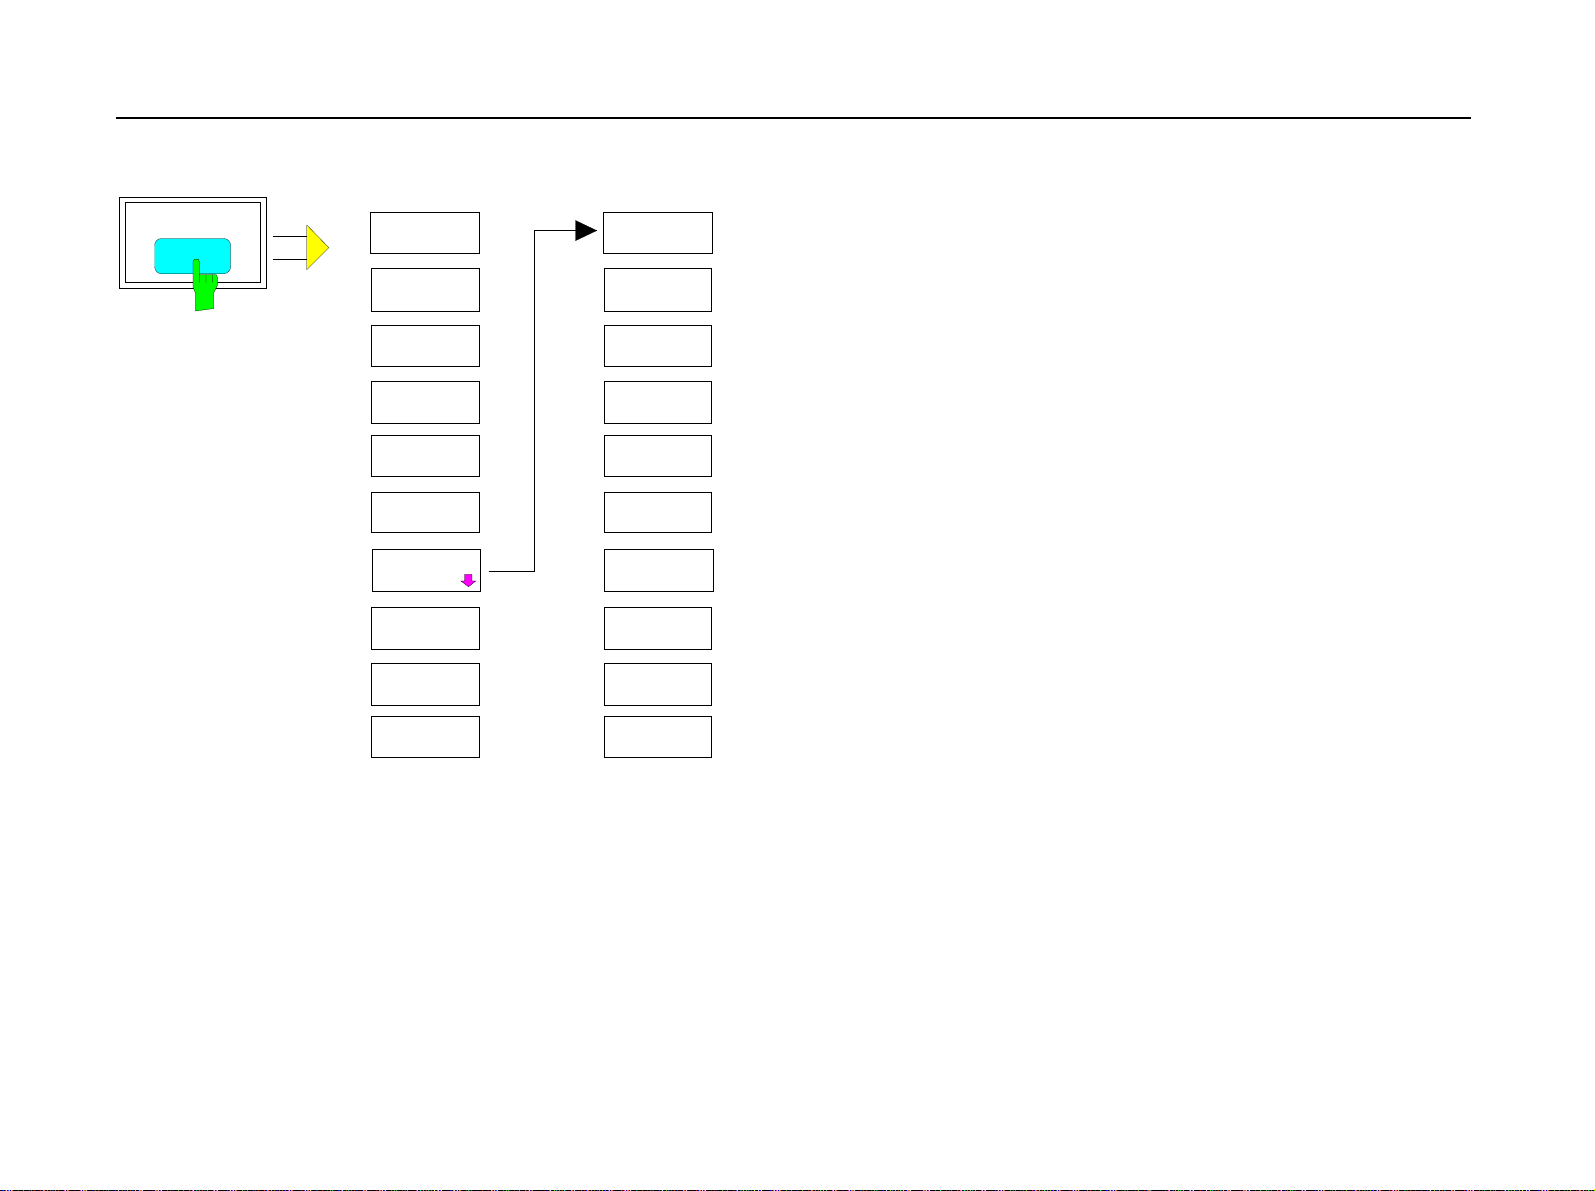
2.2.5 LEVEL Key Group, INPUT Key
LEVEL
REF
RAN GE
REF LE VE L
RE F LEVEL
SINGLE
REF LEVEL
AUT O RA NG E
OFFSET
RF ATTE N
MANUAL
ATTEN AUTO
NORMAL
ATTEN AUTO
LOW NOISE
ATTEN AUTO
LOW DIST
MIXER
LEVEL
LEVE L
REF
RANGE
RANGE
SCALE
AUTO
SCALE
Y PER DIV
REF VALUE
Y AXIS
REF VALUE
X AXIS
REF VALUE
POSITION
GRID
ABS REL
SCALE
UNIT
SCALE
UNIT
Y UNIT
LOG[dB]
Y UNIT
LINEAR
Y UNIT
DEG
Y UNIT
RAD
Y UNIT
dBm
Y UNIT
VOLT
Y UNIT
WATT
X UNIT
TIME
X UNIT
SYMBOL
1066.4317.02 2.2-8 E-6
Page 21
FSE-B7 Menu Overview
INPU T
INPUT
RF ATTEN
MANUAL
ATTEN AUTO
NORMAL
ATTEN AUTO
LOW NOISE
ATTEN AUTO
LOW DIST
MIXER
LEVEL
INPUT
SELECT
INPUT
SELECT
RF INPUT
50 OHM
RF INPUT
75 OHM/RAM
RF INPUT
75 OHM/RAZ
1066.4317.02 2.2-9 E-5
Page 22
FSE-B7 Menu Overview
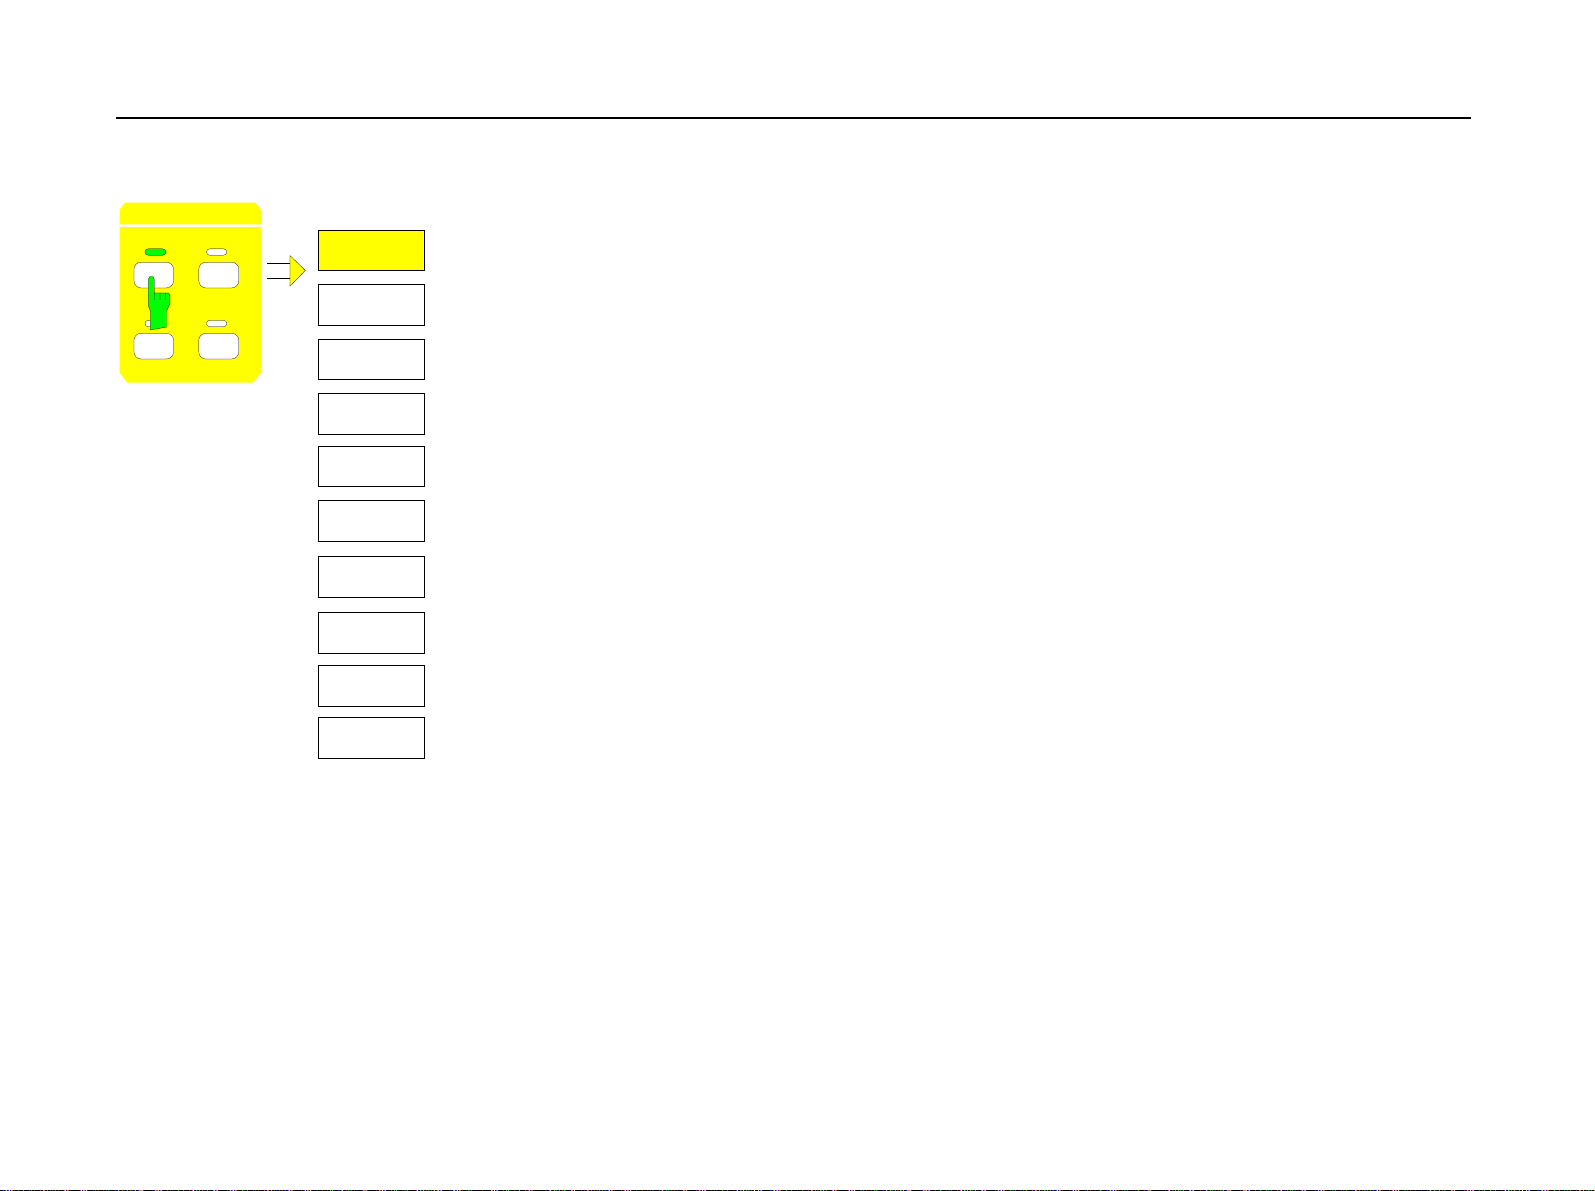
2.2.6 MARKER Key Group
MARKER
NORMAL SEARCH
DELTA
POLAR MKR
R/I MA/PH
ALL MARKER
OFF
MKR
MARKER
NORMAL
MARKER 1
MARKER 2
COUPLED
MARKERS
MARKER
INFO
PHASE
NOISE
MARKER
NORMAL SEARCH
DELTA
REFERENCE
POINT
DELTA MKR
ABS REL
ALL DELTA
OFF
MKR
DELTA
MARKER
DELTA 1
DELTA 2
REFERENCE
REFERENCE
FIXED
POINT
REFERENCE
FIXED
DELTA MKR
ABS REL
ALL DELTA
OFF
REFERENCE
POINT
REF POINT
X VALUE
REF POINT
Y VALUE
NORMAL SEARCH
DELT A
MARKER
SEARCH
PEAK
MIN
MAX |P EAK|
SUM MKR
ON OFF
SUMMARY
MARKER
SEARCH LIM
ON
ACTIVE
MKR DELTA
OFF
SELECT
MARKER
MKR
SUMMARY
MARKER
MAX |P EAK |
+ PEAK
- PEAK
+
PEAK/2
-
RMS
MEAN
PEAK HO LD
ON OFF
AVERAGE
ON OFF
SWEEP
COUNT
ALL MOD
MKR OFF
NORMAL SEARCH
DELTA
MARKER
MKR
MARKER
PEAK
MKR
REF VALUE
MKR
TRACE
SELECT
ACTIVE
MKR DELTA
1066.4317.02 2.2-10 E-6
Page 23
FSE-B7 Menu Overview
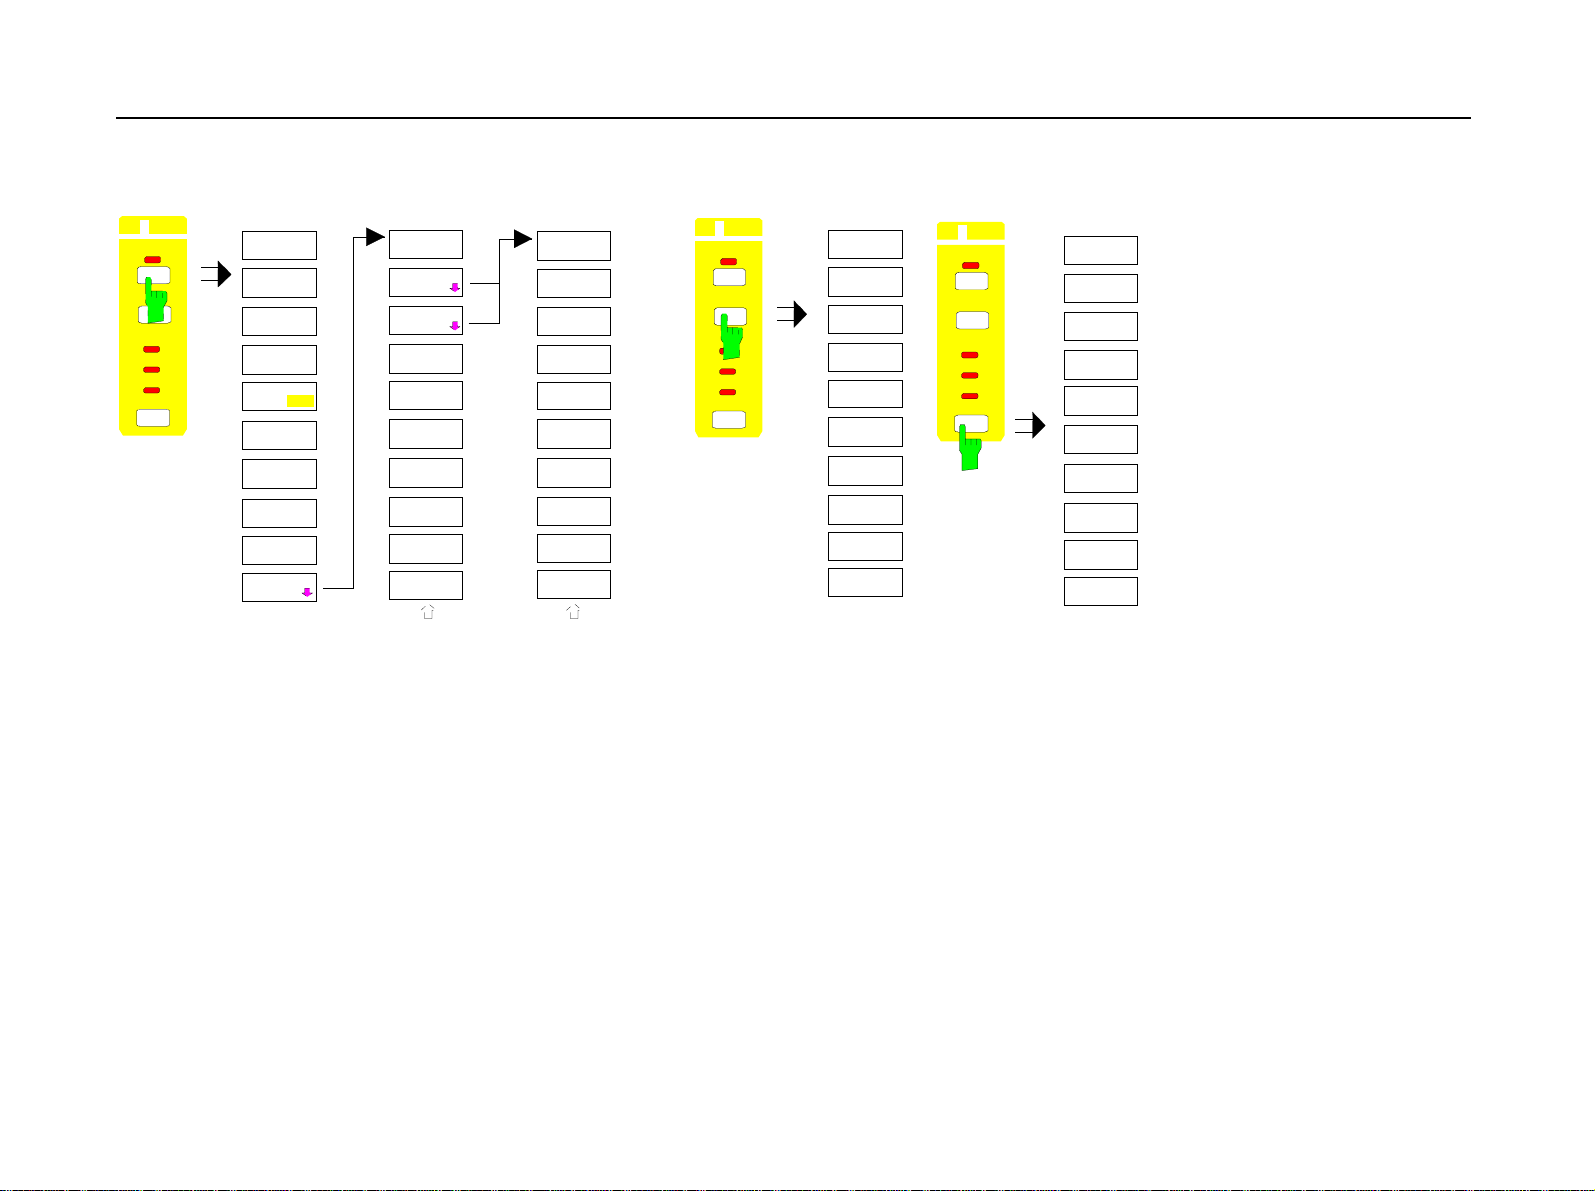
2.2.7 LINES Key Group
LINES
D LINES
LIMITS
D LINES
DISPLAY
LINE 1
DISPLAY
LINE 2
THRESH OLD
LINE
REFERENCE
LINE
TIME/SY MB
LINE 1
TIME/SYMB
LINE 2
SHOW
LINE IN FO
LINES
D LINES
LIMITS
LIMIT
SELECT
LIMIT LINE
NEW LIMIT
LINE
EDIT LIMIT
LINE
COPY LIMIT
LINE
DELETE
LIMIT LINE
x OFFSET
Y OFFSET
PAGE UP
PAGE DOWN
1066.4317.02 2.2-11 E-5
Page 24
FSE-B7 Menu Overview
2.2.8 TRACE Key Group
TRACE
1
3
TRACE 1
2
4
CLEAR/
WR IT E
VIEW
BLANK
CONTINUOUS
WRITE
AVERAGE
MAX HOLD
MIN HOLD
SWEEP
COUNT
1066.4317.02 2.2-12 E-6
Page 25
FSE-B7 Menu Overview
2.2.9 SWEEP Key Group
SWEEP
TRIGGER
SWEEP
RBW
VBW
SWT
COUPLING
TRIGGER
FREE RUN
VIDEO
EXTERN
TRIGGER
OFFSET
SLOP E
POS NEG
MEAS ONLY
IF SYNC’D
FIND BURST
ON OFF
FIND SYNC
ON OFF
SYNC
OFFSET
SYNC
PATTERN
SYNC
PATTERN
SELECT
PATTERN
NEW SYNC
PATTERN
EDIT SYNC
PATTERN
DELETE
PATTERN
COUPLING
PAGE UP
DEFAULT
PAGE DOWN
EDIT SYNC
PATTERN
NAME
VALUE
COMMENT
SAVE
PATTERN
SWEEP
TRIGGER
SWEEP
RBW
VBW
SWT
COUPLING
SWEEP
CONTINOUS
SWEEP
SINGLE
SWEEP
SWEEP
COUNT
SWEEP
TIME
RESULT
LENGTH
SWEEP
TRIGGER
SWEEP
RBW
VBW
SWT
COUPLING
COUPLED
FUNCTIONS
ANALOG BW
AUTO
ANALOG BW
MANUAL
SWEEPTI ME
TIME CPLD
TO SPAN
1066.4317.02 2.2-13 E-5
Page 26

FSE-B7 Menu Overview
2.2.10 MEMORY Key Group
See analyzer mode
2.2.11 USER Key Group
See analyzer mode
1066.4317.02 2.2-14 E-6
Page 27
FSE-B7 Vector Analyzer Mode
2.4 Vector Analyzer Mode
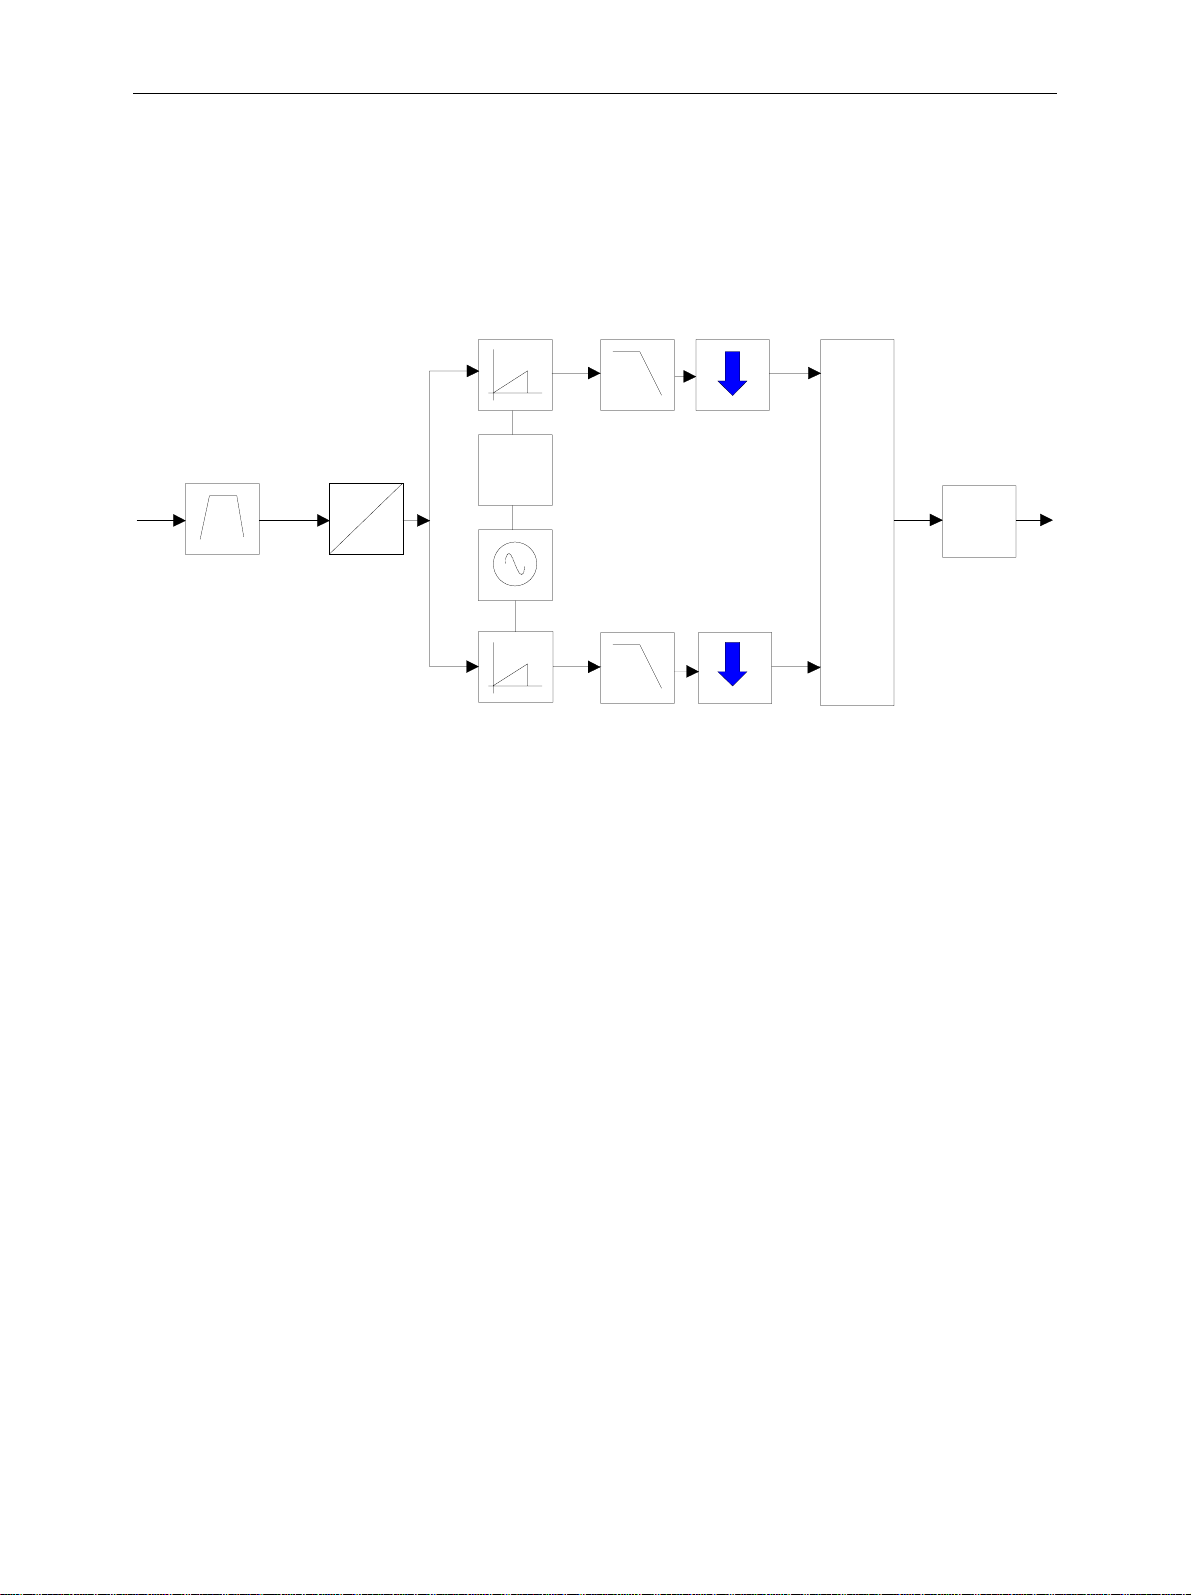
The Vector Signal Analyzer in the FSE allows the analysis of analog and digital modulations. For this
purpose, the FSE samples the IF signal which is band-limited by the resolution bandwidth (RBW ) and
mixes it into the complex baseband. The real and im aginary section of the signal is then digitally filtered
and further processed in digital signal processors. The complex baseband contains the whole signal
information which can be evaluated according to the different criteria.
Decimate
Phi
o
90
IF filter
A
20 to
25.6 M H z
D
Dig LO
Memory
DSP
4x
56002
Decimate
Fig. 2.4-1 Block diagram of FSE vector signal analyzer
Three types of analysis are distinguished in the vector signal analyzer:
• In the analog demodulation m ode, the amplitude (AM), frequency (FM) or phase (PM) demodulated
signal is represented as a function of tim e. Alternatively, display of a table containing the numerical
demodulation parameters can be selected
(RESULT DISPLAY)
.
• For digitally modulated signals, the m ost comm only used demodulators are available to evaluate the
modulation parameters.
• In the
DIGITAL DEMODULATION
mode, the magnitude of the non-demodulated signal c an also be
displayed (MAGNITUDE CAP BUFFER).
1066.4317.02 2.4-1 E-3
Page 28
Vector Analyzer Mode FSE-B7
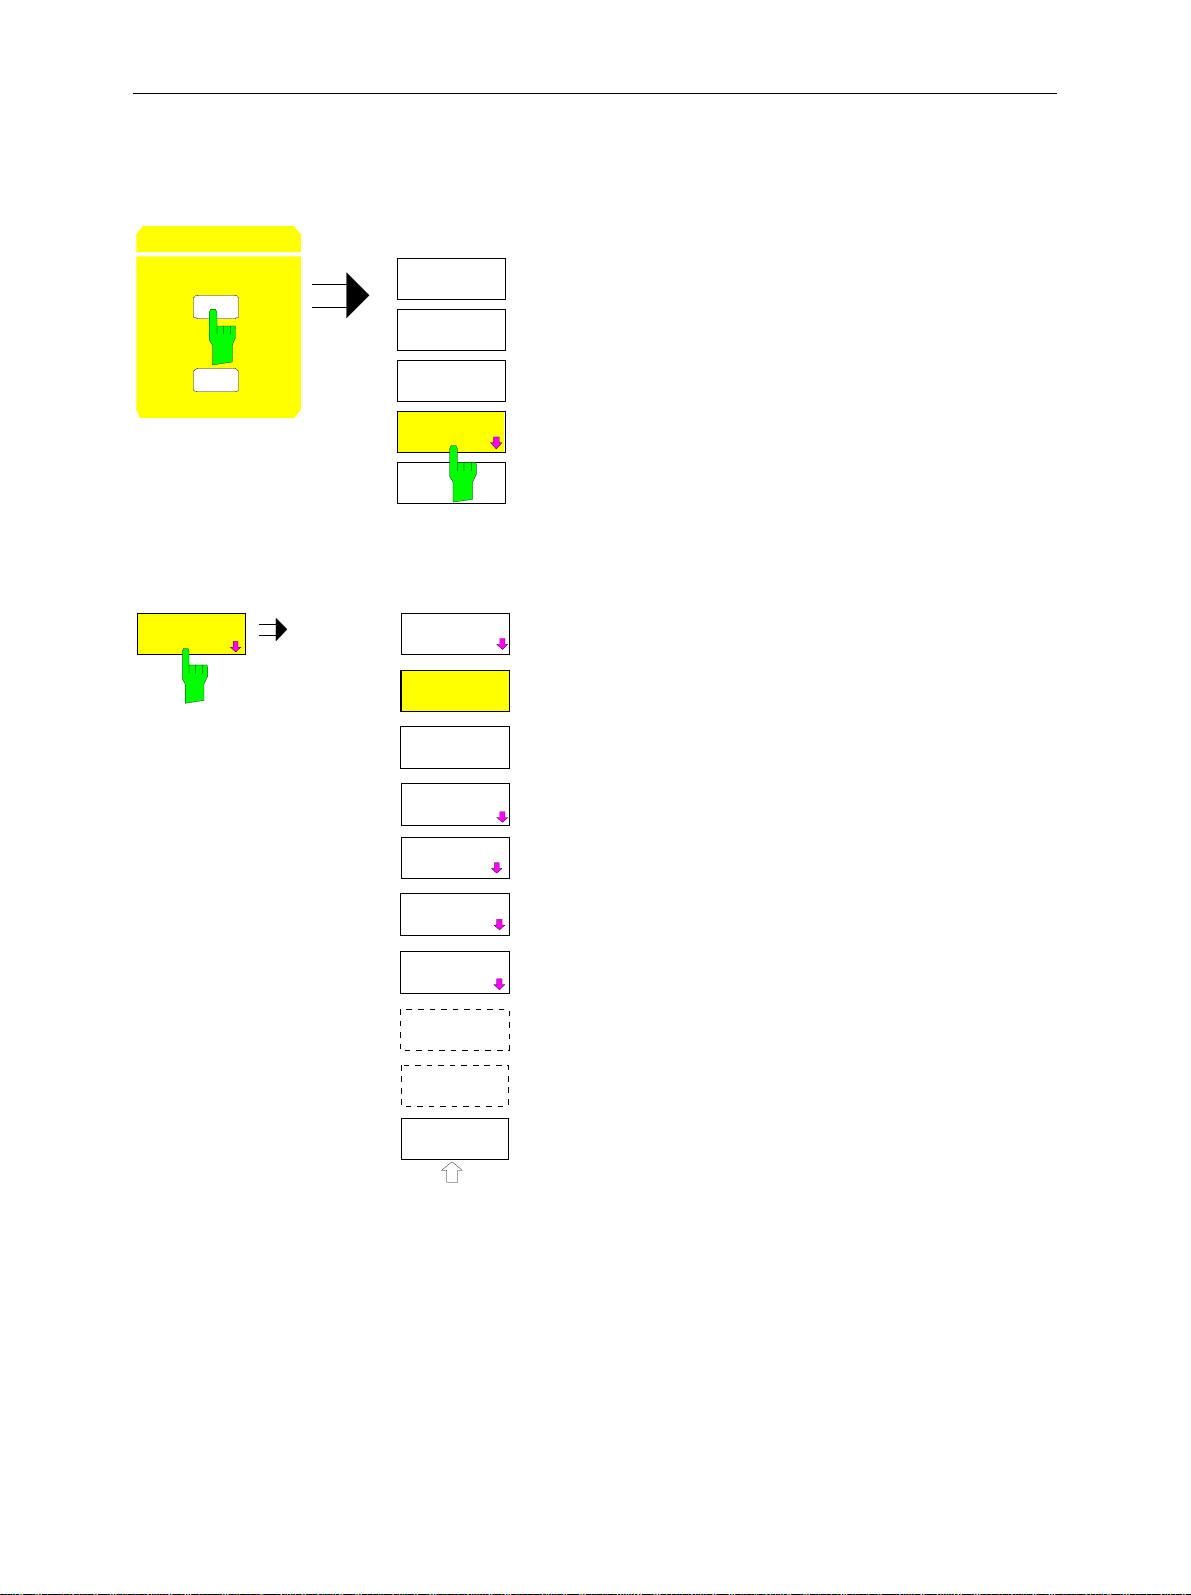
2.4.1 Selecting the Operating Mode
The vector analyzer mode is activated in the
CONFIGURATION
MODE
SE P
The type of analysis is selected in the
VECTOR
ANALYZER
MODE
ANALYZER
VECTOR
ANALYZER
VECTOR ANALYZER
VECTOR
ANALYZER
DIGITAL
STANDARDS
DIGITAL
DEMOD
ANALOG
DEMOD
CONFIGURATION MODE
The
MODE
key calls up the menu for selecting the
menu
operating mode.
sub menu
he
VECTOR ANALYZER
.
softkey calls up a subm enu. The
specific settings for the vector analyzer are entered into
this submenu.
The menus for the test parameter settings lying below
these keys (
COUPLING, TRIGGER
FREQUENCY, LEVEL, MARKER, TRACE,
) are adapted to the specific
capabilities of the vector signal analyzer.
MODULATION
PARAMETER
MEAS
RESULT
TRIGGER
DIGITAL STANDARDS, DIGITAL DEMOD
The
ANALOG DEMOD
softkeys are selectors with which the
and
required type of analysis is set.
MODULATION PARAMETER
The
softkey sets the
required modulation parameters for the demodulation of
digitally modulated signals.
RANGE
MEAS RESULT
The
softkey calls up a subm enu in which
the required evaluation of the selected type of analysis is
SWEEP
TIME
set. For digital demodulation, for example, this is the
evaluation of the signal itself or the reference signal, I/Q or
vector errors etc.
DEMOD
BANDWDITH
IF
BANDWDITH
The
TRIGGER
softkey calls up a menu equal to the
SWEEP TRIGGER
The
RANGE
RANGE
The
IF BANDWIDTH
softkey calls up the sam e menu called by the
key in the
menu.
LEVEL
key group.
softkey calls up a subm enu in which
the analog IF Bandwidth is set.
Note: If two displays (screen A and screen B) are opened after switch-on of the vector signal
analysis, the vector analyzer mode is only set for the dis play activated for entr y (marked at
the top right corner of diagram). For the other display, the previous settings remain valid.
Storage and display of measured values is sequential: first in the upper and then in the
lower display.
1066.4317.02 2.4-2 E-3
Page 29

FSE-B7 Vector Analyzer Mode
The configuration of the vector analysis is performed in four steps:
1. Setting the type of analysis: Analog demodulation of the signal
demodulation of digitally modulated signals (
transmission mode (
2. Selecting the modulation parameters (
3. Selecting the required measurement results (
4. Selecting the output format for measurement results (
DIGITAL STANDARDS,
MODULATION PARAMETER
DIGITAL DEMOD)
in this case, step no. 2 can be skipped).
MEAS RESULT)
or setting as required by a specific
).
.
RESULT DISPLAY
(ANALOG DEMOD),
).
general
1066.4317.02 2.4-3 E-3
Page 30

Analog demodulation methods FSE-B7
2.4.2 Analog Demodulation Methods
With am plitude, frequency and phase demodulation, the FSE pr ovides all demodulation m ethods which
can be used for analog RF carrier m odulation or which may impair a carrier. The bandwidth used for
demodulation depends on the demodulation bandwidth selected. Make sure that the entire modulation
spectrum is included in the demodulation bandwidth. Otherwise, signal distortions that impair the
modulation will be caused by analog prefiltering with the IF filters of the FSE and digital filtering for
suppression of aliasing products due to sampling or data reduction. Correct measurement of the
modulation parameters will no longer be possible.
For correct demodulation make sure that only the signal to be analyzed is located within the
demoduation bandwidth
(DEMOD BANDWIDTH)
impaired by adjacent signals. Spectral com ponents of adjacent signals should be at a distance of at
least 1.285 times the (demodulation bandwidth)/2 from the center frequency (= carrier frequency).
of the FSE. Otherwise, the demodulation would be
Depending on the demodulation bandwidth set (
DEMOD BANDWIDTH
), two modes of demodulation are
provided:
DEMOD BANDWIDTH
With
demodulation can be selected, with
≤ 200 kHz real-time
DEMOD BANDWIDTH
(REAL TIME ON)
> 200 kHz only offline demodulation is
or offline
(REAL TIME OFF)
possible.
Real-time and offline demodulation differ as follows:
• Real-time demodulation
♦ The bandwidth of the demodulated signal can be reduced in the AF region using switchable
(REAL TIME ON)
highpass, lowpass or weighting filters (CCITT or C-message filter) to enable spurious modulation
measurements for analog radio systems in line with the standard; moreover, deemphases can also
be switched on for FM (and AM). A deemphasis, if switched on, has an effect on the audio signal
(provided via loudspeaker or headphones connector) and on the result display or on the audio
signal only. The switchable filters, however, always have an effect on the display and
AF/loudspeaker output.
♦ The demodulated signal can be monitored via the built-in loudspeaker or via the headphones
output.
♦ In addition, the demodulated signal (parts of it) or a summary of numerical modulation parameters
can be displayed on the sceen. With the aid of the split screen display, the demodulated signal and
the summery of numerical modulation parameters can be displayed at the same time.
• Offline demodulation
♦ The demodulation is not carried out continuously, but in blocks, ie a data block is written into the
(REAL TIME OFF)
memory and then demodulated and displayed:
♦ The measurement result displayed on the screen is the time function of the demodulated AF signal
and/or a summary of numerical modulation parameters.
♦ The internal loudspeaker, the headphones output is switched off.
♦ No highpass filters and no weighting filters can be activated.
Deemphases cannot be switched on.
♦ To restrict the noise bandwidth, AF lowpass filters can be selected, standardized to the
demodulation bandwidth (cutoff frequency = 5, 10 or 25 % of demodulation bandwidth).
The two demodulation modes provided are designed for the following main applications:
• Real-time demodulation (
REAL TIME ON
) for demodulation bandwidths up to max. 200 kHz for
modulation measurements to the standard on analog radio systems and also for monitoring.
• Offline demodulation (
REAL TIME OFF
), especially for measurement of transients (e.g. frequency
settling of oscillators and synthesizers).
The following diagram shows the menus which permit to set the par ameters and the result dis play with
analog demodulation.
1066.4317.02 2.4-4 E-2
Page 31

FSE-B7 Analog demodulation methods
Menu: CONFIGURATION MODE - VECTOR ANALYZER - ANALOG DEMOD (with REAL TIME ON)
VECTOR
ANALYZER
TRIGGER
FR EE RUN
VIDEO
EXTERN
AF SIG N AL
TRIGG E R
OFFFS E T
SLOPE
POS NEG
VECTOR
ANALYZER
DIGITAL
STANDARDS
DIGITAL
DEMOD
ANALOG
DEMOD
MODULATION
PARAMETER
MEAS
RESULT
TRIGGER
RANGE
SWEEP
TIME
DEMOD
BANDWIDTH
IF
BANDWIDTH
IF BW
AUTO
IF BW
MANUAL
RANGE
SCALE
Y PER DIV
REF VALUE
Y AXIS
REF VALUE
X AXIS
REF VALUE
POSITI ON
SENSITIV
AF OUTP U T
VOLUME
SCALE
UNIT
MEAS RESULT
AM SIGNAL
FM SIGNAL
PM SIGNAL
MODULATION
SUMMARY
SUMMARY
SETTINGS
SUMMARY
MEAS TIME
REAL TIME
ON OFF
SENSITIV
AF OUTPUT
VOLUME
SCAL E
UNIT
Y UNIT
LOG[dB]
Y UNIT
LINEAR
Y UNIT
DEG
Y UNIT
RAD
Y UNI T
dB m
Y UNI T
VO LT
Y UNI T
WA TT
SUMMARY
SETTINGS
AVERAGE/
HOLD ON
SWEEP
COUNT
REL UNIT
%
INDICATION
ABS REL
SET
REFERENCE
MEAS->REF
SINAD 1kHz
ON OFF
dB
DEMOD
SETTINGS
HIGH PASS
AF FILTER
LOW PASS
AF FILTER
WEIGHTING
AF FILTER
AF COUPL’G
AC DC
SQUELCH
ON OFF
SQUELCH
LEVE L
SIDE BAND
NORM INV
AM/FM
DEEMPH
DEEMPHASIS
ON OFF
HIGH PASS
AF FILTER
NONE
30 Hz
300 Hz
LOW PASS
AF FILTER
NONE
3 kHz
15 kHz
WEIGHTING
AF FILTER
CCITT
C-Message
AM/FM
DEEMPHASIS
50 us
75 us
750 us
PRE DISPL
ON OFF
X UNIT
TIME
X UNIT
SYMBOL
Fig. 2.4-2 Menu structure for setting the demodulation with analog-modulated signals
1066.4317.02 2.4-5 E-2
Page 32

Analog demodulation methods FSE-B7
ANALOG
DEMOD
MODULATION
PARAMETER
MEAS
RESULT
TRIGGER
The
ANALOG DEMOD
softkey activates the analog demodulation mode.
The demodulation (AM, FM and PM demodulation) is performed in parallel.
The type of demodulation or display (AM, FM or PM or numeric al display) is
set under MEAS RESULT.
See section "Selecting the Modulation Parameters"
See section "Selecting the Audio Signal"
See section "Triggering with Analog Demodulation - Softkey
Hardkey
TRIGGER
"
TRIGGER
or
RANGE
SWEEPTIME
DEMOD
BANDWIDTH
See section "Setting the Display Range and the Scaling - Softk ey
Hardkey
RANGE
"
See section "Sweep Menu with Analog Demodulation - Softkey
or Hardkey
The
SWEEP
"
DEMOD BANDWIDTH
softkey calls up a field for entering the
RANGE
or
SWEEP TIME
demodulation bandwidth.
The spectrum to be demodulated should be located completely within this
bandwidth, if possible (check in spectrum analyzer mode) in order to avoid
demodulation distortions. Spurious signals outside the spectrum to be
demodulated do not cause any demodulation errors if the frequency spacing
with respect to the tuning frequency is (
1.28 x (
The
DEMOD BANDWIDTH
DEMOD BANDWIDTH
)/2.
can be set in steps of 1, 2, 3 and 5 in the range
CENTER FREQUENCY
) Delta f ≥
from 5 kHz to 5 MHz or, if diff erent entries are made, it will be rounded off to
the nearest possible step.
With FM demodulation the maximum deviation that can be measured is
restricted to (0.4 x
DEMOD BANDWIDTH
).
1066.4317.02 2.4-6 E-2
Page 33

FSE-B7 Analog demodulation methods
IF
BANDWIDTH
IF BW
AUTO
IF BW
MANUAL
O
The
IF BANDWIDTH
softkey opens up a submenu where the
bandwidth of the analog IF filters is set (corresponds to the
resolution bandwidth in spectrum analyzer mode).
IF BW
AUTO
IF BW
MANUAL
The
IF BW AUTO
softkey is used to set the IF bandwidth to the maximum
possible value 10 MHz (irrespective of the demodulation bandwidth).
The
IF BW MANUAL
softkey permits to restrict the analog IF bandwidth
specifically.
To avoid modulation distortions and errors it is recommended to set the IF
bandwidth as large as possible (
IF BANDWIDTH
≥ 5 x
DEMOD BANDWIDTH
).
If spurious signals are to be suppressed outside the useful modulation
spectrum, IF BW MANUAL can be used to r educe the IF bandwidth down to a
value equal to the demodulation bandwidth.
Possible input values: ≥
DEMOD BANDWIDTH
, 5 kHz to 10 MHz.
1066.4317.02 2.4-7 E-2
Page 34

Analog demodulation methods FSE-B7
2.4.2.1 Selecting the Modulation Parameters
Submenu:
MODULATION
PARAMETER
REAL TIME ON
MODULATION
PARAMETER
CONFIGURATION MODE - VECTOR ANALYZER - ANALOG DEMOD
The
MODULATION PARAMETER
softkey calls up a submenu which permits to
select the modulation parameters for analog demodulation.
Which menu is displayed depends on whether real-time demodulation is
:
MODULATIOJN
PARAMETER
HIGH PASS
AF FILTER
LOW PASS
AF FILTER
WEIGHTING
AF FILTER
AF COUPL’G
AC DC
SQUELCH
ON OFF
SQUELCH
LEVEL
SIDE BAND
NORM INV
AM/FM
DEEMPH
DEEMPHASIS
ON OFF
activated
HIGH PASS
AF FILTER
NONE
30 Hz
300 Hz
LOW PASS
AF FILTER
NONE
3 kHz
15 kHz
WEIGHTING
AF FILTER
CCITT
C-Message
DEEMPHASIS
(REAL TIME ON)
AM/FM
50 us
75 us
or not
(REAL TIME OFF)
REAL TIME OFF
MODULATION
PARAMETER
:
MODULATIOJN
PARAMETER
HIGH PASS
AF FILTER
LOW PASS
AF FIL T ER
WEIGHTING
AF FILTER
AF COUPL’G
AC DC
SQUELCH
ON OFF
SQUELCH
LEVEL
SIDE BAN D
NORM INV
AM/FM
DEEMPH
DEEMPHASIS
ON OFF
.
AF FILTER
LOW PASS
NONE
5 % [DEMOD BW]
10 % [DEMOD BW]
25 % [DEMOD BW]
750 us
PRE DISPL
ON OFF
Note: The dashed softkeys cannot be activated in the operating mode selected
1066.4317.02 2.4-8 E-2
Page 35

FSE-B7 Analog demodulation methods
The possible selection of the filter depends on whether real-time
demodulation is activated or not (
REAL TIME ON:
REAL TIME ON/OFF
).
HIGH PASS
AF FILTER
LOW PASS
AF FILTER
WEIGHTING
AF FILTER
The softkeys
HIGHPASS AF FILTER
and
LOW PASS AF FILTER
call up
input fields which permit to select highpass or lowpass filters for restriction
of the AF bandwidth.
HIGH PASS
AF FILTE R
NONE
30 Hz
300 Hz
If
REAL TIME ON
LOW PASS
AF FILTER
NONE
3 kHz
15 kHz
is activated, the opposite highpass and lowpass filters as
well as standard weighting filters can be selected.
If AF filters are switched on, they act on the display and AF output or
loudspeaker output.
The 3-dB cutoff frequencies are indicated for the highpass and lowpass
filters.
1st-order highpass filters (6 dB/octave slope) and 2nd-order lowpass filters
(12 dB/octave slope) are used.
The
WEIGHTING AF FILTER
softkey calls up the inpit firld for selection of a
standard weighting filter.
The CCITT filter (CCITT P.53) and the C-message filter are used as
weighting filters according to US standard.
WEIGHTING
AF FILTER
CCITT
C-Message
When one of the two weighting filters is activated, the demodulation
bandwidth is automatically switched to 30 kHz. If the demodulation
bandwidth is subsequently changed with active weighting filter, the latter is
switched off.
REAL TIME OFF
If R
EAL TIME OFF
:
is selected, only lowpass filters can be activated for
restriction of the noise bandwidth.
AF FILTER
LOW PASS
NONE
5 % [DEMOD BW]
10 % [DEMOD BW]
25 % [DEMOD BW]
The filter bandwidth (-3 dB) can be selected in % of the demodulation
bandwidth.
5, 10 or 25 % of the demodulation bandwidth are possible.
The filters are designed as 2nd-order Butterworth filters (12 dB/octave
slope).
1066.4317.02 2.4-9 E-2
Page 36

Analog demodulation methods FSE-B7
AF COUPL’G
AC DC
The
AF COUPL’G AC/DC
demodulators to DC or AC voltage coupling.
FM:
With FM, AC coupling (
center frequency of the signal to be measured and correcting the
demodulated signal accordingly.
AF COUPL’G DC
With
carrier frequency, and no frequency correction is perf ormed. The AF signal
is DC-coupled.
PM:
With PM, AC coupling (
frequency offset and the phase offset and setting them to zero.
Only with
With
deviates, the phase varies with a period corresponding to the difference
between applied and set center frequency (0 to 360°).
If the frequency is consistent (e.g. in the case of synchronization to a
common reference frequency) the phase is constant on an offset in the
range from 0 to 360°. The PM demodulator is DC-coupled.
REAL TIME OFF
AF COUPL’G DC
softkey switches the AF analysis stages after the
AF COUPL’G AC
the center frequency of the FSE is assumed as the
AF COUPL’G AC
:
, if the center frequency of the signal to be measured
) is achieved by determining the
) is achieved by estimating both the
AM:
As a mere envelope demodulator, the AM demodulator is insensitive to
frequency errors as long as carrier and sidebands are within the set
frequency display range.
In the case of AC coupling (
is standardized to the DC voltage (corresponds to the aver age c arr ier value)
and the DC component is removed.
The amplitude of the AF signal is directly proportional to the AM modulation
depth.
In the case of DC coupling (
demodulated signal is proportional both to the AM depth and to the level,
there is no standardization to the average carrier value. The measured
value is displayed in absolute level units.
AF COUPL’G AC
AF COUPL’G DC
), the demodulated AF signal
), the amplitude of the
1066.4317.02 2.4-10 E-2
Page 37

FSE-B7 Analog demodulation methods
SQUELCH
ON OFF
SQUELCH
LEVEL
REAL TIME ON:
The
SQUELCH ON
softkey mutes the louds peaker or headphones output
provided that the level falls below a threshold that can be entered under
SQUELCH LEVEL. The trace of the dem odulated signal is also set to zero
at this point in time. The muting circuit responds with a delay that is
designed such that a signal modulated with ≥ 30 Hz AM does not cause the
circuit to respond in a modulation low status.
Loudspeaker or headphones output are only active if real-time dem odulation
is selected.
REAL TIME OFF:
With
MEAS RESULT: AM-, FM SIGNAL
or
:PM SIGNAL
the frequency or
phase deviation is set to zero when the value falls below the squelch. The
muting circuit responds without delay, which is why it is suitable for transient
measurements in particular.
SQUELCH LEVEL
which the SQUELCH function is activated (only with
permits to enter an absolute level in the unit dBm , below
SQUELCH ON
).
SIDEBAND
NORM INV
The softkey
SIDEBAND INV (INVERTED)
demodulates and inverts the
signal received.
Thus, with FM or PM demodulation, a receive signal with increasing
frequency at the FSE input leads to a falling AF signal.
Default status is
SIDEBAND NORM
(normal): A receive signal with
increasing frequency at the FSE input leads to an increasing AF signal.
1066.4317.02 2.4-11 E-2
Page 38

Analog demodulation methods FSE-B7
AM/FM
DEEMPH
AM/FM
DEEMPHASIS
50 us
75 us
750 us
PRE DISPL
ON OFF
REAL TIME ON
AM/FM DEEMPH
The
only
softkey opens the submenu in which a
deemphasis can be selected for FM (or AM) demodulation
(An AM deemphasis is prescribed in a few regulations for
measurement of synchronous amplitude modulation on FM
transmitters.).
Deemphases with the time cons tants 50 µs, 75 µs (used for
radio broadcasting) and 750 µs (used for radio
communication) are provided.
If switched on, the deemphasis acts on the audio output.
DEEMPHASIS
ON OFF
50 us
REAL TIME ON only
The
75 us
constant of the deemphasis
The default setting is 50 µs.
750 us
REAL TIME ON only
PRE DISPL
ON OFF
The
effect of the deemphasis to the result display.
Via the function
effect of the deem phasis can also be extended to the res ult
display to enable spurious modulation measurements
complying with the standard.
To be able to measure the correct deviation of the signal
applied in spite of the corrected audio signal, the active
deemphasis can be switched of f via
result display.
REAL TIME ON
DEEMPHASIS ON/OFF
The
under
AM/FM DEEMPHASIS
50us, 75 us
PRE DISPL ON/OFF
PRE DISP ON
only
softkey switches the demphasis selected
on or off.
and
750 us
softkeys select the time
.
softkey switches on or off the
(PRE DISPLAY ON) the
PRE DISP OFF
for the
In the default status, the deemphasis is switched of
1066.4317.02 2.4-12 E-2
Page 39

FSE-B7 Analog demodulation methods
2.4.2.2 Selecting the Audio Signal
Submenu:
MEAS
RESULT
CONFIGURATION: MODE - VECTOR ANALYZER - ANALOG DEMOD
MEAS RESULT
AM SIGNAL
The
MEAS RESULT
softkey opens up a submenu for
selection of the AM, FM, or PM demodulated audio signal
(display and audio output).
FM SIGNAL
PM SIGNAL
MODULATION
SUMMARY
SUMMARY
SETTINGS
SUMMARY
MEAS TIME
REAL TIME
REAL TIME
ON
OFF
ON OFF
SENSITIV
AF OUTPUT
AM SIGNAL
VOLUME
The
AM SIGNAL
softkey is used to display the AM-demodulated time s ignal
provided that MODULATION SUMMARY is not active. If MODULATION
SUMMARY is active, the modulation parameters will be numerically
displayed with main signal AM (see MODULATON SUMMARY).
1066.4317.02 2.4-13 E-2
Page 40

Analog demodulation methods FSE-B7
The AM-demodulated signal is applied to the audio output (if
REAL TIME ON)
.
FM SIGNAL
PM SIGNAL
he
FM SIGNAL
that MODULATION SUMMARY is not active. If MODULAT ION SUMMARY
is active, the modulation param eter will be numerically displayed with main
signal FM (see MODULATION SUMMARY).
The FM-demodulated signal is pr esent at the audio output (in the case of
real-time demodulation).
The
PM SIGNALL
provided that MODULATION SUMMARY is not active. If MODULATION
SUMMARY is active, the modulation parameter will be numerically displayed
with main signal PM (see MODULATION SUMMARY).
In the case of
audio output.
softkey displays the FM-demodulated time signal provided
softkey displays the PM-demodulated time signal
REAL TIME ON
the PM-demodulated signal is pres ent at the
1066.4317.02 2.4-14 E-2
Page 41

FSE-B7 Analog demodulation methods
The
MODULATION
SUMMARY
MODULATION SUMMARY
display of the audio signal versus time to the summary of the numeric
modulation parameters.
Of the main signal in question the positive and negative peak modulation
value, peak-to-peak value as well as the rms value are displayed with
absolute display (see
SUMMARY SETTING
detector does not display the peak-to-peak value, but the average from
positive and negative peak value).
Parallel to the main signal, the parameter s of the remaining demodulators
are also displayed, ie the absolute, arithmetic average from positive and
negative peak value.
The following parameters of the demodulation main signal can be displayed
in addition:
• SINAD value (1-kHz modulation frequency fixed)
• Audio frequency
In addition, the frequency error as well as the carrier power (to be more
exact: power of the unmodulated carr ier) and the configuration of the active
AF filter and deemphasis are displayed.
softkey (on/off switch) switches from the
) (except for AM DC: the +-Pk/2
Example: AM signal/REAL TIME ON:
CF 978.3 MHz
Ref Lvl
10 dBm
Bit No.
AM: 54.20 % +Pk 54.68 -Pk
54.44 % PK/2 33.3 % RMS
SINAD 1 kHz: 35.1 dB
AUDIO FREQ: 1.001 kHz
FREQ ERROR: 101.1 Hz
CARR PWR: 7.88 dBm
FILTER: HP 30 Hz LP 3 kHz DEEMPH OFF
FM: 1.031 kHz PK/2
PM 1.011 rad PK/2
Symbol Table
MODULATION SUMMARY AM
+
-
+
-
+
-
DEMOD BW: 100 kHz
Example: AM signal/REAL TIME OFF:
CF 978.3 MHz
Ref Lvl
10 dBm
Bit No.
AM: 54.20 % +Pk 54.68 -Pk
54.44 % PK/2 33.3 % RMS
SINAD 1 kHz: -AUDIO FREQ: 1.001 kHz
FREQ ERROR: 101.1 Hz
CARR PWR: 7.88 dBm
FILTER: HP -- LP 10 % [DEMOD BW] DEEMPH OFF
FM: 1.031 kHz PK/2
PM 1.011 rad PK/2
Symbol Table
MODULATION SUMMAR Y AM
+
-
+
-
+
-
DEMOD BW: 100 kHz
REAL TIME OFF
MOD SUMMARY AM
ANALOG DEMOD
REAL TIME ON
MOD SUMMARY AM
ANALOG DEMOD
A
A
1066.4317.02 2.4-15 E-2
Page 42

Analog demodulation methods FSE-B7
Example: FM signal, relative measurement:
In the case of relative meas urement, the absolute arithm etic average from
positive and negative peak value as well as the rms value of the main signal
are also displayed. The separate display of positive and negative peak value
is omitted. Instead, the referenc e value is additionally displayed as peak and
rms value.
CF 978.3 MHz
ef Lvl
0 dBm
Bit No.
FM RELATIV: -45.21 dB PK/2 -58 dB RMS
REF Deviation: 10.00 kHz Pk 7.07 kHz RMS
SINAD 1 kHz: OFF
AUDIO FREQ: 1.001 kHz
FREQ ERROR: 101.1 Hz
CARR PWR: 7.88 dBm
FILTER: CCITT DEEMPH 50us PRE DISP O N
AM: 1.031 % PK/2
PM 1.011 rad PK/2
Symbol Table
MODULATION SUMMARY FM
+
-
-
+
-
+
-
Example: AVERAGE/ HOLD ON:
ef Lvl
0 dBm
Bit No.
FM RELATIV: -45.21 dB PK/2 HLD -58 dB RMS AV
REF Deviation: 10.00 kHz Pk HLD 7.07 kHz RMS AV
SINAD 1 kHz: OFF
AUDIO FREQ: 1.001 kHz AV
FREQ ERROR: 101.1 Hz AV
CARR PWR: 7.88 dBm
FILTER: CCITT DEEMPH 50us PRE DISP O N
AM: 1.031 % PK/2
PM 1.011 rad PK/2
Symbol Table
MODULATION SUMMARY FM
+
-
+
-
+
-
DEMOD BW: 100 kHz
CF 978.3 MHz
DEMOD BW: 100 kHz
REAL TIME ON
MOD SUMMARY FM
ANALOG DEMOD
A
REAL TIME ON
MOD SUMMARY FM
ANALOG DEMOD
A
1066.4317.02 2.4-16 E-2
Page 43

FSE-B7 Analog demodulation methods
SUMMARY
SETTINGS
AVERAGE/
HOLD ON
SUMMARY
SETTINGS
AVERAGE /
HOLD ON
SWEEP
COUNT
REL UNIT
%
INDICATION
ABS REL
SET
REFERENCE
MEAS->REF
SINAD 1kHz
ON OFF
The
dB
AVERAGE/HOLD ON
The
SUMMARY SETTINGS
softkey opens up the
submenu for conf iguration of the sum m ary of all num eric
measured values.
softkey permits to average all display values
obtained in the number of sweeps defined under Sweep Count except for
the Pk values with Single Sweep (the disp lay
in the modulation summary,
AV
is indicated after the units).
No of Measurements
appears
SWEEP
COUNT
REL UNIT
dB %
The Pk values are displayed in the Pk Hold m ode ( display
Hold
after the Pk
units).
In the case of a restart, the Pk values and AV values ar e res et by m eans of
Single Sweep or by switching
The
SWEEP COUNT
softkey sets the number of sweeps used to determ ine
TRACE AVERAGE/HOLD ON
off and on.
the average or PK Hold values (see also the corresponding softkey in
analyzer mode)).
The
REL UNIT dB/%
display (
INDICATION REL
softkey selects the unit (% and dB) with relative
) .
1066.4317.02 2.4-17 E-2
Page 44

Analog demodulation methods FSE-B7
INDICATION
ABS REL
SET
REFERENCE
MEAS-> REF
The
INDICATION ABS REL
default setting) and relative display (
relative display can be entered by means of
REF
.
softkey switches between absolute (
REL
). The reference value for the
SET REFERENCE
or
MEAS
ABS
→
Only the main signal can be displayed in relative mode, the other signals
are indicated in absolute display in any case.
For relative indication, the default unit is dB and can be changed f rom dB to
% via the softkey
The
SET REFERENCE
REL UNIT%
.
softkey opens up a field for input of a reference
modulation (for main signal).
The peak value of the modulation is to be entered. The rm s ref erence value
will then be peak value/√2.
The
MEAS→REF
softkey is used to represent the current absolute
measured values of the main modulation signal (+-PK/2 and RMS) as
reference values for the relative display.
,
SINAD 1kHz
ON OFF
REAL TIME ON only.
The
SINAD 1 kHz ON
softkey activates the SINAD measurement for the
main modulation signal.
Irrespective of the signal applied, the m ain modulation signal is compared
with the main modulation signal which is filtered by a 1-kHz notch filter. T he
display unit is dB.
When a signal m odulated with 1 kHz is applied, the SINAD value is thus
displayed correctly.
Default setting is
With
REAL TIME OFF
SINAD 1 kHz OFF
(no real-time demodulation) no SINAD measurement
.
is possible, the softkey cannot be operated.
1066.4317.02 2.4-18 E-2
Page 45

FSE-B7 Analog demodulation methods
SUMMARY
MEAS TIME
REAL TIME ON only.
The
SUMMARY MEAS TIME
softkey opens up a field for entering the
measuring time (as well as the measured value update rate) for the
numerical measured values of the modulation summary.
Default setting is 100 ms
Thus, with a stationary modulation frequency of 30 (typ. 20) Hz, peak values
and rms value can be determined correctly.
The measured values are updated at least every 100 ms, ie max. 10x/s.
With a measur ing tim e of 1 s and a st ationary modulation f r equency of up to
5 Hz peak values and rms values can be determined correctly.
The measured values are updated every second, ie max. 1x/s.
In both cases, the peak values are measured continuously, the time
constant of the rms detector is adapted accordingly.
SUMMARY MEAS TIME
100 ms
1 s
REAL TIME
ON OFF
SENSITIV
AF OUTPUT
The
REAL TIME ON/OFF
softkey switches real time demodulation on or off.
For demodulation bandwidths ≤ 200 kHz, real-time demodulation can be
switched on or off.
(Off is default status).
Demodulation bandwidths > 200 kHz do not allow real-time modulation.
REAL TIME ON only.
The
SENSITIV AF OUTPUT
real-time modulation. Depending on
softkey sets the scaling of the AF output f or
MEAS RESULT
(AM, FM or PM
signal), an input field appears, where the modulation amplitude is to be
entered so that the dynamic range of the AF output is fully utilized.
(Peak voltage 1V):
m[%] FOR FULL SCALE SIGNAL
20
FM DEV FOR FULL SCALE SIGNAL
100
PM DEV FOR FULL SCALE SIGNAL
1
SENSITIV AF OUTPUT
also has an effect on the volume of the
loudspeaker and on the headphones output.
1066.4317.02 2.4-19 E-2
Page 46

Analog demodulation methods FSE-B7
VOLUME
REAL TIME ON only
The
VOLUME
(loudspeaker and headphones output) according to the slope of the AF
output.
REAL TIME OFF
With
off.
softkey sets the volume of the demodulated signal
(no real-time demodulation) the outputs are switched
Note: If the modulation depth / deviation is very small, the scaling of
the AF output (softkey
SENSITIV AF OUTPUT
) is to be
matched to achieve a usable volume.
On the other hand, the modulation depth / deviation must not
be greater than the full-scale setting under SENSITIV AF
OUTPUT, or a distorted signal will be obtained at the
loudspeaker/headphones output even with the volume
reduced.
1066.4317.02 2.4-20 E-2
Page 47

FSE-B7 Analog demodulation methods
2.4.2.3 Triggering with Analog Demodulation - Softkey TRIGGER or Hardkey TRIGGER
Submenu:
TRIGGER
or
SWEEP
TRIGGER
SWEEP
RBW
VB W
SW T
COUPLING
CONFIGURATION MODE - VECTOR ANALYZER - ANALOG DEMOD
TRIGGER
FREE RUN
VIDEO
EXTERN
AF SIGNAL
TRIGGER
OFFFSET
SLOPE
POS NEG
The
TRIGGER
softkey as well as the
permit to call up the menu for setting the trigger.
TRIGGER
hardkey
FREE RUN
VIDEO
EXTERN
The
FREE RUN
softkey activates a measurement without trigger. After a
measurement has been terminated, data acquisition for a new
measurement takes place immediately.
REAL TIME OFF only
The
VIDEO
softkey starts the meas urement by means of the video voltage
.
of the analog path of the spectrum analyzer. For this purpose, the analog
video voltage of the spectrum analyzer is analyzed parallel to the vector
signal analyzer.
Video triggering is of particular use f or frequency settling m easurem ents on
synthesizers.
Video triggering requires the trigger threshold to be entered. It is identical
with the trigger threshold of the spectrum analyzer. The trigger threshold is
entered numerically into the data input field in % of the last grid that was
active in spectrum analysis mode.
The appropriate value for the trigger threshold can be determined in the
spectrum analysis mode.
REAL TIME OFF only
The
EXTERN
softkey activates triggering via an external voltage in the
.
range from - 5 V to + 5 V at the BNC connector EXT TRIGGER / GATE
(rear panel). Enter the desired value in the data input field.
1066.4317.02 2.4-21 E-2
Page 48

Analog demodulation methods FSE-B7
AF
SIGNAL
TRIGGER
OFFSET
SLOPE
POS
NEG
The
AF SIGNAL
softkey opens up a data input field where the level of the
AF signal is entered as the trigger level for display of the time signal.
The AF trigger level is entered in %, Hz, deg or rad according to the current
demodulation AM, FM or PM (in the case of AM DC in the curr ent absolute
level unit).
Triggering on the AF signal is similarly possible with
REAL TIME ON/OFF.
REAL TIME OFF only
The
TRIGGER OFFSET
softkey opens up an input window for entry of the
desired offset with video trigger or external trigger (only with ).
The softkey cannot be operated with
REAL TIME ON
and
REAL TIME OFF
in conjunction with AF trigger.
The trigger offset
is used to determine the start of data acquisition relative to
the trigger event. Both positive values for a trigger delay and negative
values for a pretrigger are permissible.
The input is made in absolute tim e irrespective of the scale select ed for the
X-axis.
The
SLOPE POS/NEG
softkey determines the trigger edge for triggering y
means of the video signal, AF signal or external trigger.
The measurement run is started on a positive or negative edge of the
trigger signal. W ith free-running trigger (
FREE RUN
), the setting is not of
any significance.
1066.4317.02 2.4-22 E-2
Page 49

FSE-B7 Analog demodulation methods
2.4.2.4 Setting the Display Range and the Scaling Softkey RANGE or Hardkey RANGE
The menu for setting the range differs from that in the signal analysis mode.
Submenu:
RANGE
or
LEVEL
REF
RANGE
Y PER DIV
CONFIGURATION MODE - VECTORANALYZER - ANALOG DEMOD
RANGE
SCALE
The
RANGE
softkey as well as the
used to call up a menu, which contains all the
parameters important for the vertical axis (y-axis) and
Y PER DIV
REF VALUE
Y AXIS
REF VALUE
x AXIS
REF VALUE
POSITION
SENSITIV
AF OUTPUT
VOLUME
SCALE
UNIT
The
Y PER DIV
the horizontal axis of the screen display of the AF signal,
such as reference values, scaling, etc.
In addition, with real-time demodulation, the slope of the
AF output as well as the volume of the loudspeaker or
headphones connector can be set here.
softkey indicates the vertical scaling in the current unit.
Hz or % are set for AM or FM, respectively. PM permits to choos e between
the units deg and rad (default status: rad).
RANGE
hardkey are
REF VALUE
Y AXIS
REF VALUE
POSITION
For the relative value display of the modulation sum mary, it is possible to
choose between % and dB (default setting dB).
The
REF VALUE Y AXIS
softkey prompts the user to enter the reference
value for the Y-axis of the diagram.
The reference value is entered in the respective display unit (see
The
REF VALUE POSITION
softkey opens up an input window, in which
UNIT
).
reference value positions deviating from the default setting are set.
REF VALUE POSITION
determines the position of the ref erence value. It is
normally 50 % when the AF signal is displayed.
1066.4317.02 2.4-23 E-2
Page 50

Analog demodulation methods FSE-B7
SENSITIV
AF OUTPUT
VOLUME
The
SENSITIV AF OUTPUT
(sensitivity AF output) softkey is used to set
the scaling of the AF output with real-time demodulation. Depending on
MEAS RESULT
(AM, FM, or PM signal), an input field appears , where the
modulation amplitude is to be entered at which the dynamic range of the AF
output is fully utilized.
(Peak voltage 1V):
m[%] FOR FULL SCALE SIGNAL
20
FM DEV FOR FULL SCALE SIGNAL
100
PM DEV FOR FULL SCALE SIGNAL
1
SENSITIV AF OUTPUT
also affects the volum e of the loudspeak er and the
headphones output.
REAL TIME ON only
The
VOLUME
softkey sets the volume of the demodulated signal
(loudspeaker and headphones output) according to the slope of the AF
output.
REAL TIME OFF (
With
no real-time demodulation) the outputs are switched
off.
Note: If the modulation depth / deviation is very small, the scaling of
the AF outputs (Softkey SENSITIV AF OUTPUT) is to be
matched to achieve a usable volume.
On the other hand, the modulation depth / deviation must not
be greater than the full-scale setting under SENSITIV AF
OUTPUT, or a distorted signal will be obtained at the
loudspeaker/headphones output even with reduced volume.
1066.4317.02 2.4-24 E-2
Page 51

FSE-B7 Analog demodulation methods
Submenu:
SCALE
UNIT
CONFIGURATION MODE - VECTOR ANALYZER - ANALOG DEMOD - RANGE
SCALE
UNIT
Y UNIT
LOG[dB]
Y UNIT
INEAR
L
UNIT DEG
The
SCALE UNIT
softkey calls up a subm enu for setting
the unit of the Y-axis .
The units offered depend on the signal displayed.If a
marker is s witched on, the marker results are output in
the current scale units.
ANALOG DEMODULATION,
With
the following Y-units
are possible according to the type of modulation
AM: AM[%],
UNIT RAD
FM: Hz,
PM: rad (default setting) or deg.
Y UNIT
dBm
Y UNIT
VOLT
(With AM and FM, the units cannot be selected).
With tim e display of the AM signal and
AF COUPL’G DC
selected, the AM-demodulated signal is not
standardized, but scaled in absolute levels.
Y UNIT
WATT
X UNIT
TIME
Possible units are dBm, V and W. The default unit is dBm.
X UNIT
SYMBOL
1066.4317.02 2.4-25 E-2
Page 52

Analog demodulation methods FSE-B7
2.4.2.5 Sweep Menu with Analog Demodulation - Softkey SWEEP TIME or
Hardkey SWEEP
Submenu:
SWEEP
TIME
oder
SWEEP
TRIGGER
SWEEP
RBW
VBW
SWT
COUPLING
CONFIGURATION MODE - VECTORANALYZER - ANALOG DEMOD
SWEEP
CONTINOUS
SWEEP
SINGLE
SWEEP
SWEEP
COUNT
SWEEP
TIME
The
SWEEP
key calls up a menu, which permits to
determine the type of measurement - single measurement
or continuous measurement - and the length of the
measurement results to be displayed in terms of time.
CONTINOUS
SWEEP
SINGLE
SWEEP
The
CONTINUOUS SWEEP
softkey starts a continuous measurement in
accordance with the trigger condition and the selected test settings.
Triggering is followed by data acquisition first and then by evaluation and
display on the screen.
If, with split screen display, vector analysis mode is used fo r measurement
in both windows, the data in the measurement RAM are used for both
evaluations.
The
SINGLE SWEEP
softkeystarts n measurements in accordance with the
trigger settings. The number of measurement runs n is determined by
means of
It can be restarted by pressing the
SWEEP
SWEEP COUNT
softkey again.
. The measurement stops after n measur ements.
SINGLE SWEEP
or
CONTINUOUS
1066.4317.02 2.4-26 E-2
Page 53

FSE-B7 Analog demodulation methods
5000
SWEEP
COUNT
SWEEP
TIME
The
SWEEP COUNT
measurements is determined for the
softkey opens up an input field in which the number of
SINGLE SWEEP
.
The number of measurements can be selected between 0 and 32767.
If averaging of the measur ed values is s et (
MARKER
COUNT
If
SWEEP COUNT
:
RMS
to be found under the
also determines the number of measurements used for averaging.
= 0, 10 measured values are always used for floating
AVG/HOLD ON, MODULATION
MARKER SEARCH key
),
SWEEP
averaging.
If
SWEEP COUNT
If
SWEEP COUNT
= 1, no averaging takes place.
>1, the average is taken of the set num ber of m easured
values.
SWEEP TIME
is used to define the time during which the demodulated
signal is to be displayed.
The maxim um time is determined by the demodulation bandwidth set and
the buffer length for the demodulated signal, which is 5000 points with
analog demodulation.
Thus, the following settable maximum time is obtained:
SWEEP TIME
=
max
08.*( _ )DEMOD BW
[s]
RESULT
LENGTH
A minimum of 10 points can be displayed, which means for the minimum
settable time:
SWEEP TIME
=
min
08.*( _ )DEMOD BW
10
Example:
With Demod BW 1kHz, the maximum and minimum time scale is as
follows:
TIME/DIV
TIME/DIV
The
RESULT LENGTH
DEMODULATION
= 6.25 s
max
= 12.5 ms
min
softkey cannot be operated with
ANALOG
.
1066.4317.02 2.4-27 E-2
Page 54

Analog demodulation methods FSE-B7
Example: Measurement of amplitude modulation
Measurement of a carrier modulated with 1 kHz, 50 % at 100 MHz, level 0 dBm
1. [PRESET] Default setting
2. [CENTER: 100 MHz] Frequency setting
3. [REF: REF LEVEL: +6 dBm] Level setting (the max. level of AM-modulated signals is 6 dB
above the nominal level with 100 % AM).
4. [MODE: VECTOR ANALYSIS] Selection of vector analysis mode The FSE is in the analysis
mode
DIGITAL DEMODULATION
5. [ANALOG DEMODULATION] Switch to analog demodulation. The AM-modulated signal
appears on the display (display in the time domain, the default
setting for [
demodulation bandwidth (analysis bandwidth) is 100 kHz in the
default setting, i.e. audio signals up to max. 0.4* demodulation
bandwidth can be demodulated.
6. [DEMOD BW: 30 kHz] The demodulation bandwidth is changed eg to 30 kHz
7. [TRIGGER:AF SIGNAL 0%] Trigger setting to achieve a stable display. The display of the AF
signal at the left edge of the screen starts at 0 %.
ANALOG DEMODULATION
(default setting).
] is AM-SIGNAL). The
8. [SWEEP: SWEEPTIME 100 ms] Setting of the sweep time. The sweep time depends on the
demodulation bandwidth and the sampling points provided
(=5000 with analog demodulation). With a demodulation
bandwidth of 30 kHz, the max. sweep time is 208 ms in the
default setting.
9. [SEARCH: SUM MKR ON] Activating the summary marker for numeric trace evaluation.
1066.4317.02 2.4-28 E-2
Page 55

FSE Digital Modulation Methods
2.4.3 Digital Modulation Methods
2.4.3.1 Diagram for signal processing
In modern mobile radio networks digital transmission methods are used to avoid the disadvantages of a
transmission channel in mobile communication and to be able to serve more subscribers in the available
frequency spectrum. The FSE offers all commonly used demodulators for digitally modulated signals. All
modulation parameters for standard transmission methods can be loaded as required by the user. The
FSE determines all relevant modulation parameters such as frequency, phase, amplitude and vector
errors, etc. Measurements are carried out on continuous as well as pulsed signals such as TDMA
signals. Bit patterns can be defined to be able to trigger to known bit sequences like preambles or
midambles. The demodulator requires neither a coherent carrier nor a symbol clock for demodulation. It
comprises matched filters and synchronizes automatically to the carrier and to the symbol clock.
Furthermore, the demodulator can generate the ideal I/Q signal from the demodulated bit stream and
thus determine the errors of the analyzed signal.
For a correct demodulation of digital signals, a number of modulation parameters in addition to the
modulation mode has to be specified for the signal to be analyzed. The most important are the symbol
rate and the input filter. And in addition, the frequency of the FSE (approx. 2% of the symbol rate) has to
be tuned exactly to the frequency of the signal to be analyzed.
The bandwidth for demodulation is a function of the symbol rate and the selected oversampling method
(
POINTS PER SYMBOL
PER
SYMBOL
is reduced, fewer points are used in the display. The demodulation bandwidth for 1, 2
and 4 points per symbol is 3.125 times the symbol rate, with 8 points per symbol 6.5 times and for 16
points per symbol 13 times. It should be ensured that no modulation spectrum of adjacent signals is
within the displayed range during demodulation, as this may introduce errors in the measurement of
modulation parameters. If required, check for correct settings in the analyzer mode. The block diagram
below shows the digital demodulator and its measurement capabilities:
). At least 4-fold oversampling is performed. If the number set under
POINTS
Digital
A
IF
6,4 MHz/
1,4 MHz
I/Q Measure Signal
I/Q-R eferen ce Sig nal
Bit Strom
Filter
Digital
LO
D
fa
o
90
Error
Calcutation
Digital
Filter
I/Q Amplitude Error
I/Q Phas e Error
I/Q Error
ERROR VECTOR MAGNITUDE
Symbol Table
I
Capture
RAM
Q
Graphi k-
Processing
Pulse
Search
I/Q
Display
Digital
Demodulation
SYNC
SEARCH
I/Q Measured Si ignal
I/Q Referen ce Signal
Bits for Symbo l Tabl e
Fig. 2.4-4 Block diagram for signal processing during digital demodulation
1119.5063.12 2.4-29 E-5
Page 56

Digital Modulation Methods FSE
2.4.3.2 Symbol Mapping
The following types of symbol mapping are used for representing the results in the vector and
constellation diagrams (PSK, MSK, QAM) and for the time/frequency representations with FSK
modulation. The symbols are always in the binary code (MSB at left).
2.4.3.2.1 Phase Shift Keying (PSK)
With these modulation types, the symbol represents the absolute phase of the received signal at the
decision time. The following representations are given:
• a constellation diagram containing all symbols
• a table containing the symbol designations and the associated reference phases
With this type of phase modulation, transitions from any symbol to any other in the constellation diagram
are permitted.
BPSK QPSK (WCDMA)
Q
Symbol Phase
0 0
1 Π
01
I
QPSK (QCDMA FWD; WCDMA; APCO25) 8PSK
OQPSK (QCDMA REV)
Q
Symbol Phase
00 Π/4
01 3Π/4
0001
11 5Π/4
10 7Π/4
100
11
Q
Q
010
Symbol Phase
00 Π/4
01 3Π/4
0001
11 5Π/4
10 7Π/4
I
10
Symbol Phase
000 0Π/4
001 1Π/4
010 2Π/4
001011
011 3Π/4
100 4Π/4
101 5Π/4
110 6Π/4
000
111 7Π/4
I
I
101 111
11
10
110
Fig. 2.4-5 Symbol mapping - phase shift keying
1066.4313.02 2.4-30 E-5
Page 57

FSE Digital Modulation Methods
3PI/8-8PSK (EDGE)
For these modulation methods the digital information is NOT coded in the phase transitions but in the
absolute position of the constellation diagram. The constellation diagram consists of 16 points. For each
symbol transition, an offset of 3pi/8 is inserted counterclockwise.
The symbol allocation in the constellation diagram is thus only valid for the first symbol of the data
record.
Five symbol transitions with an offset of 3pi/8 each is given as an example. The modulated symbol "111"
remains constant.
This phase offset is taken into account during decoding and the display of symbols.
Phase
011
111
Symbol
000
001
010
011
100
101
110
111
I
3Π/8
4Π/8
2Π/8
1Π/8
6Π/8
5Π/8
7Π/8
0Π/8
001
000
3Π/8
Q
010
3Π/8
3Π/8
3Π/8 3Π/8
101
100
Fig. 2.4-6 Symbol mapping - phase shift keying - EDGE
110
1119.5063.12 2.4-31 E-5
Page 58

Digital Modulation Methods FSE
2.4.3.2.2 Differential PSK
When using differential phase modulation, the symbol is the result of the phase difference between the
current and the previous decision point. The absolute position of the pointer at the decision time is
therefore not relevant. In the following diagrams, the phase transitions are shown, as examples, in the
first quadrant, while the pointers point to the constellation point relevant for the current decision time.
The signal is demodulated such that the decision times coincide with the constellation points.
The following representations are given:
• a constellation diagram containing all permissible symbol transitions
• a table containing the symbol designations and the associated phase differences
The absolute phase of the signal is not relevant for the symbol decision.
PI/4 DQPSK
The positions of the permissible constellation points is as with 8PSK. With this technique, only the phase
transitions given in the tables are permitted.
NADC, PDC, PHS, TETRA, APCO25, PWT TFTS
Phase
Q
00
Symbol difference
00 Π/4
01 3Π/4
10 -Π/4
11 -3Π/4
Q
11
Phase
Symbol difference
11 Π/4
01 3Π/4
10 -Π/4
00 -3Π/4
01
11
10
01
I
10
I
00
D8PSK
The positions of the permissible constellation points is as with 8PSK. With this technique, transitions to
all 8 constellation points possible are permitted.
Phase
Q
001
011
010
110 111 101
Symbol difference
000 0*Π/4
001 1*Π/4
000
011 2*Π/4
010 3*Π/4
110 4*Π/4
111 5*Π/4
100
101 6*Π/4
100 7*Π/4
I
Fig. 2.4-7 Symbol mapping - differential phase modulation
1066.4313.02 2.4-32 E-5
Page 59

FSE Digital Modulation Methods
2.4.3.2.3 Frequency Shift Keying (FSK)
When working with FSK demodulation, a frequency/time diagram will be displayed instead of the
constellation and vector diagrams. The symbol decision is based on the signal deviation at the decision
times.
2FSK (DECT, CT2; FLEX16_2; FLEX32_2)
With 2FSK, the symbol decision is taken by a
f
simple frequency discriminator with the following
decision threshold:
f = f
Tmid
"1" for f f
Symbol =
f
I
f
T
f
MID
"0" for f f
= instantaneous frequency
= decision threshold
= middle frequency of analyzer
≥
ET
<
ET
1
T
F
0
4FSK (ERMES; MODACOM; APCO25; FLEX32_4; FLEX64_4)
With 4FSK the symbol decision is taken by a
f
frequency discriminator using three decision
thresholds derived from the operating parameter
11
REF_DEVIATION:
F
f = f -
T1 MID
f = f
T2 MID
f = f +
T3 MID
Symbol =
1
3
11
""
10
""
01
""
00
""
REF_DEVIATION
⋅
1
REF_DEVIATION
⋅
3
for f f
≥
ET3
for f f
≤<
f
ET3
2
T
for f f
≤<
T1 E
for f < f
IT1
f
2
T
T3
F
10
F
T2
F
01
F
T1
F
00
"1"
"0"
"11"
"10"
"01"
"00"
t
REF_DEVIATION
t
REF_DEVIATION
f
I
fff
,, = decision thresholds
T1 T2 T3
f
MID
= instantaneous frequency
= middle frequency of analyzer
Fig. 2.4-8 Symbol mapping - FSK demodulation
1119.5063.12 2.4-33 E-5
Page 60

Digital Modulation Methods FSE
2.4.3.2.4 Minimum Shift Keying (MSK), CDPD
Phase
Q
1
Fig. 2.4-9 Symbol mapping - minimum shift keying (MSK)
DMSK (and the derived GSMK) uses additional difference coding of two subsequent symbols. Static
symbol mapping therefore does not exist.
Symbol difference
0 -Π/2
1 Π/2
0
I
2.4.3.2.5 Quadrature Amplitude Modulation (QAM)
With the QAM technique, the symbols are counted linearly from right to left and from top to bottom
(linear mapping).
Note: For reliable demodulation make sure the available symbols are utilized. If only some of the
symbols or only the symbols in one quadrant are utilized, demodulation errors may occur.
Q
0000000100100011
0100010101100111
1011 1010 1001 1000
1111 1110 1101 1100
Fig. 2.4-10 Symbol mapping - 16QAM
I
1066.4313.02 2.4-34 E-5
Page 61

FSE Digital Modulation Methods
2.4.3.3 Selecting the Digital Demodulators
Submenu:
DIGITAL
DEMOD
CONFIGURATION MODE - VECTOR ANALYZER
The
DIGITAL DEMOD
DIGITAL
DEMODULATION
BPSK
QPSK
DQPSK
PI/4DQPSK
OQSK
8PSK
D8PSK
3π/8-8PSK
MSK
DMSK
2FSK
4FSK
16QAM
4FSK APCO25
softkey opens a list of all available demodulators.
Demodulators are provided for the two-, four- and eight-level PSK modulation
modes BPSK, QPSK and 8PSK. For QPSK and 8PSK demodulation, the
demodulators for differential signals DQPSK and D8PSK can be selected
additionally.
Demodulators are also availabe for the special versions of QPSK modulation,
such as differential QPSK with π/4 phase offset (π/4-DQPSK) and offset
QPSK (OQPSK).
QPSK is used, for instance, by the IS95- CDMA for modulating signals from
the base station to the mobile, OQPSK for signals from the mobile to the
base station. The American TDMA system NADC (IS54) uses π/4-DQPSK for
digital signal transmissions.
For higher-level modulation modes the demodulator for 16QAM is available.
MSK (minimum shift keying) demodulators pertain to the group of continuousphase demodulators. MSK with Gaussian filters (GMSK = Gaussian minimum
shift keying) is used for the European mobile radio systems GSM and
DCS1800 or PCS1900 in the USA. For correct bit detection for GSM, DCS
1800 and PCS 1900 and 1800 the MSK demodulator with additional
differential decoding (DMSK) should be activated.
For FSK (frequency shift keying modulation, two-level (2FSK) and four-level
(4FSK) demodulators can be selected.
2FSK modulation methods are used for instance for the digital cordless
telephone to DECT standard, 4FSK for the paging system to ERMES
standard.
1119.5063.12 2.4-35 E-5
Page 62

Digital Modulation Methods FSE
2.4.3.4 Standard Settings
To simplify the selection of parameters when standard transmission methods are used, standard setups
are available in the FSE. All modulation parameters and the width of the display range are set
automatically.
The following table shows available standards and respective settings.
For the GSM, DCS1800 and PCS 1900 standards the sync pattern GSM_BTS0 with the associated
synchronization offset of 61 symbols is preset in addition. When selecting the NADC standard, the
instrument is set to the burst of the base station with a slot length of 162 symbols. When selecting the
NADC FORWARD CH standard, the instrument is set to the non-burst signal of the base station with a
slot length of 162 symbols. For the burst of the mobile station, the standard length NADC REVERSE CH
must be set.
For the DECT standard the sync pattern of the fixed part DECT_FP is preset, the sync offset is set to 0.
When selecting the TETRA standard, the sync pattern Tetra_1 is preset, the sync offet is preset to 122.
Sync pattern and sync offset become active be switching
FIND SYNC
(menu
SWEEP TRIGGER
) on.
Note: The pager standards ERMES and FLEX (2FSK and 4FSK modulation) feature modulation
filters with increased bandwidth (B*T> 1). This means that with normal oversampling (4
points per symbol) there is an intolerable bandwidth restriction which causes a distinctly
higher demodulation error probability. Therefore the number of points per symbol is preset
to 8 when the ERMES standard is selected and to 16 when the FLEX standard is selected.
Attention: In case of departures from the preset value (which may happen automatically when
increasing the frame length or result length) there is a higher system error probability.
Submenu:
DIGITAL
STANDARDS
CONFIGURATION MODE - VECTOR ANALYZER
DIGITAL
STANDARDS
PDC UP
PDC DOW N
NADC
FWD CH
NADC
REV CH
DIGITAL
STANDARDS
IS95-CD MA
FWD CH
IS95-CDMA
REV CH
DIGITAL
STANDARDS
CT2
APCO25
ERMES
MODACOM
FLEX16_2
The
DIGITAL STANDARDS
softkey
calls up a submenu of available
standard setups.
If one of the following modulation
parameters is modified, any digital
standard that may be selected is
switched off automatically:
• Symbol rate
• Measurement filter
FLEX32_2
• Reference filter
DECT
FLEX32_4
• α/BT
PHS
PWT
TETRA
TFTS
EDGE
GSM
FLEX64_4
APCO25
C4FM
APCO25
CQPSK
CDPD
1066.4313.02 2.4-36 E-5
Page 63

FSE Digital Modulation Methods
Table 2.4-1 Standard settings
Modulation/
Standard
IS95-CDMA
FWD CH QPSK
IS95-CDMA
REV CH OQPSK
EDGE
8π/8-8PSK
GSM, (DCS1800,
PCS 1900) MSK
NADC FWD CH*)
π/4 DQPSK
NADC REV CH
π/4 DQPSK
PDC DOWN
π/4 DQPSK
PDC UP
π/4 DQPSK
PHS π/4 DQPSK
CDPD MSK 19.2 kHz NONE GAUSSIAN 0,5 -- -- -- 4
DECT 2-FSK 1152 kHz NONE GAUS S IAN 0,5 VIDEO
TETRA
π/4-DQPSK
CT2
2-FSK
ERMES 4-FSK 3.125 kHz NONE BESSEL 1_25 -- -- -- 8
MODACOM
4-FSK
FLEX 16_2
(FLEX 1600) 2FSK
FLEX 32_2
(FLEX 3200) 2FSK
FLEX 32_4
(FLEX 3200 4-FSK
FLEX 64_4
(FLEX 6400) 4FSK
PWT
WCPE π/4 DQPSK
TFTS
π/4 DQPSK**)
APCO25 C4FM 4.8 kHz NONE RAISED COS 0.2 -- -- 8
APCO25 CQPSK 4.8 kHz APCO25FM RAISED COS 0.2 -- -- 4
Symbol rate Measureme
nt filter
1.2288 MHz IS95_FM IS95_FR -- -- -- -- 4
1.2288 MHz IS95_FR I S95_RR -- -- -- -- 4
270.833 kHz EDGE_MES EDGE_REF -- BURST
270.833 kHz NONE GAUSSIAN 0,3 BURST
24.3 kHz ROOT
RAISED COS
24.3 kHz ROOT
RAISED COS
21 kHz ROOT
RAISED COS
21 kHz ROOT
RAISED COS
192 kHz ROOT
RAISED COS
18 kHz ROOT
RAISED COS
72 kHz NONE GAUSSIAN 0,5 BURST
4.8 kHz ROOT
RAISED COS
1.6 kHz NONE BESSEL 2_44 -- -- -- -- 16
3.2 kHz NONE BESSEL 1_22 -- -- -- -- 16
1.6 kHz NONE BESSEL 2_44 -- -- -- -- 16
3.2 kHz NONE BESSEL 1_22 -- -- -- 16
562.5 kHz ROOT
RAISED COS
22.1 kHz ROOT
RAISED COS
Reference
filter
RAISED COS 0,35 SYNC
RAISED COS 0,35 BURST
RAISED COS 0,5 SYNC
RAISED COS 0,5 BURST
RAISED COS 0,5 BURST
RAISED COS 0,35 BURST
RAISED COS 0,2 -- -- -- 4
RAISED COS 0,5 BURST
RAISED COS 0,4 BURST
AlphaBTSynchro-
nization
SEARCH
SEARCH
SEARCH
SEARCH
SEARCH
SEARCH
SEARCH
TRIGGER
+ BURST
SEARCH
SEARCH
SEARCH
SEARCH
SEARCH
Sync
Pattern
EDGE_BT0061 4
GSM_BTS0 61 4
NADC_S1 0 4
NADC_S1 8 4
PDC_S1 57 4
PDC_S1 57 4
PHS_DO1 32 4
DECT_FP 0 4
TETRA_1 122 4
CT2_CFP 0 4
WCPE_FP1 0 4
TFTS_G1 0
SYNC
OFFSET
Points/
symbol
*) The standard setting is matched t o t he slot of the NADC base stati on. As the base station doesn’t burst, the FIND BURST
function is disabled.
**) W hen selecting the TFTS standard, the special bit decoding is made according to the TFTS s t andard.
The standard settings are called up by means of the DIGITAL STANDARD softkey.
1119.5063.12 2.4-37 E-5
Page 64

Digital Modulation Methods FSE
2.4.3.5 Selecting Modulation Parameters for Digital Demodulation
Submenu:
MODULATION
PARAMETERS
CONFIGURATION MODE - VECTOR ANALYZER
MODULATION
PARAMETERS
SYMBOL
RATE
SIDE BAND
NORM INV
MEAS
FILTER
REFERENCE
FILTER
ALPHA/BT
FSK REF
DEVIATION
NORMALIZE
ON OFF
The
MODULATION PARAMETERS
setting of the modulation parameters.
softkey calls up a submenu for
SYMBOL
RATE
SIDEBAND
NORM INV
The
SYMBOL RATE
soft key opens a window for entering the symbol rate of the
digitally modulated signal to be measured.
The symbol rate is a function of the bit rate determined via the modulation level and
corresponds to the baud rate. With QPSK, for instance, the symbol rate
corresponds to half the bit rate (= 2 bits per symbol). Symbols are only valid while
the signal is evaluated by the receiver. The time of demodulation is the point of
decision. The demodulator of the FSE uses the set symbol rate to find the points of
decision.
To be able to select the correct symbols, the symbol rate has to be entered exactly.
The more complex (high-level) the modulation method, the more critical the exact
definition of the symbol rate. An inaccurately defined symbol rate causes
demodulation errors. The settings below should also be observed for selecting the
symbol rate:
• Maximum possible symbol rate is 2.133 MHz.
• The number of points per symbol is limited to 8 for symbol rates >200 kHz and to
4 for symbol rates >400 kHz.
The
SIDE BAND NORM / INV (INVERTED)
demodulates and inverts the
signal received.
Thus, with FSK demodulation, the frequency states are inverted, and, with
non-FSK modulation, the I and Q signal are inverted.
Default status is
SIDEBAND NORM
(normal).
1066.4313.02 2.4-38 E-5
Page 65

FSE Digital Modulation Methods
MEAS
FILTER
REFERENCE
FILTER
The
MEAS FILTER
softkey selects the input filter for the signal to be
measured. The required filter is selected in a table:
MEAS FILTER
None
Raised Cos
Root Raised Cos
Gaussian
apco25fm
edge_mes
edge_ref
bess1_22
bess1_25
bess2_44
is95_fm
is95_fr
is95_rm
is95_rr
Further information is given in the description of the
REFERENCE FILTER
softkey.
The
REFERENCE FILTER
softkey selects the filter for the ideal reference
signal for detecting modulation errors at the baseband level. The required
filter is selected in a table:
REFERENCE FILTER
Raised Cos
Root Raised Cos
Gaussian
apco25fm
edge_mes
edge_ref
bess1_22
bess1_25
bess2_44
IS95_fm
IS95_fr
IS95_rm
IS95_rr
Predefined filters are the squarewave filter (only for setting
FILTER:NONE
), the raised cosine filter, the root raised cosine filter and the
MEAS
Gaussian filter. Cosine filters are generally used for PSK modulation,
Gaussian filters by MSK and FSK modulators.
The filter parameters are set via
ALPHA/BT
.
1119.5063.12 2.4-39 E-5
Page 66

Digital Modulation Methods FSE
The digital demodulator of FSE generates two signals at the I/Q level, the
signal to be measured (
(
REFERENCE SIGNAL
MEAS SIGNAL
).
) and the reference signal
Frequency and
symbol
synchronization
Symbol
detector
Amplitude/
phase
correction
Reference signal
generator
Meas
filter
Reference
filter
Test
signal
(I/Q)
Reference
signal
(I/Q)
Bits for
symbol
table
The signal to be measured is present at the RF input after demodulation. The
reference signal is the signal that would be obtained in the case of an ideal
RF signal. A separate filter is provided for the signal and the reference signal.
For digital transmissions, filtering can be carried out at the transmitter or
receiver end or be split up between both. The filter at the receiver is the
measurement filter. The reference filter is used for the total system.
Depending on the configuration of filters, the following combinations can be
used:
Filters of transmission system Filters to be selected
Transmitter Receiver MEAS FILTER REFERENCE FILTER
Root-raised cos Root-rai sed cos Root-raised cos Raised cos
Raised Cos none none Raised cos
Gaussian none none Gaussian
If no modulation filter is provided in the transmitter, it may also be useful to
employ a RAISED COS or GAUSSIAN filter as measurement filter.
However, the non-existing band limiting at the FSE input may cause unwanted
aliasing products in the vector analyzer mode, which might impair the
measurement. A measurement without reference filter is not possible!
1066.4313.02 2.4-40 E-5
Page 67

FSE Digital Modulation Methods
ALPHA/BT
If an input filter is used for demodulation or a filter for generating the
reference signal, the filter characteristic has to be determined by means of
ALPHA/BT
filters the product of the symbol period T and bandwidth B (
The A
the cosine filters or the bandwidth/symbol period product
filters is entered. All filters are computed up to a length of 16 symbols.
Permissible input values are 0.2 to 3 in steps of 0.05. The value for
ALPHA/BT
ALPHA
values should be used for measurements with FSE as higher demodulation
errors could otherwise occur.
ALPHA/BT >1
For
symbol is usually not sufficient. In this case it is recommended to set the
number of points per symbol to 8 or 16. See also the note under DIGITAL
STANDARDS.
filter (cosine filter). It is also designated as roll-off factor or bandwidth factor.
The greater ALPHA, the greater is the bandwidth occupied by the digitally
modulated signal relatives to the theoretical minimum. In digital transmission
systems typical bandwidth factors of 0.25 to 0.5 are used, ie the occupied
bandwidth is 25% to 50% larger than the theoretical minimum. The
bandwidth/time product
factor of Gaussian filters.
. With Nyquist filters
LPHA/BT
or BT are determined by the digital transmission system. These
soft key opens a window where the roll-off factor (
applies to the measurement and to the reference filter. Values for
, the demodulation bandwidth with sampling of 4 points per
ALPHA
describes the transmission characteristic of a Nyquist
BT
ALPHA
has to be specified, with Gaussian
BT
).
ALPHA
BT
for the Gaussian
describes the characteristic or the bandwidth
) for
FSK REF
DEVIATION
The
FSK REF DEVIATION
deviation for FSK demodulation.
FSK deviation is defined as the (unilateral) deviation from the center
frequency occurring in the case of modulation with constant 0 or 1
sequences, ie the stationary value.
For 4FSK, the modulation deviation is the deviation from the center frequency
for the bit sequences causing maximum frequency deviation.
The reference deviation is used for computing the deviation error in
NORMALIZE ON
mode
softkey opens a window for entering the reference
1119.5063.12 2.4-41 E-5
Page 68

Digital Modulation Methods FSE
NORMALIZE
ON OFF
The
NORMALIZE ON/OFF
softkey has the following effect:
The measurement result in the vector and constellation diagram is always
normalized to a circle, the radius of which corresponds to the mean distance
between the center of the circle and the mid-points (of all groups of sampling
values).
This circle is defined as a unit circle with the radius 1.
Softkey
NORMALIZE ON
shifts the center of the unit circle by the I/Q offset to
the center for the group mid-points.
NORMALIZE ON
r=1
is the default state:
Q
I
Center for
group mid-points
Diagram in the case of
r=1
Center for
group mid-points
Mid-point of a group
of sampling values
NORMALIZE OFF
Q
I/Q Offset
Mid-point of a group
of sam p ling va lues
:
I
1066.4313.02 2.4-42 E-5
Page 69

FSE Digital Modulation Methods
2.4.3.4 Selecting Measurement Results for Digital Demodulation
After entering all modulation parameters the required measurement is selected using the
RESULT
softkey. The contents of the trace memory (magnitude), the demodulated measurement
MEAS
signal, the reference signal, i.e. the ideal signal derived from the measurement signal, or the error signal
can be displayed as the measurement res ult. The I/Q error and the vector error are the two possible
error signals. A table is available listing all errors together with the demodulated bits.
Submenu:
MEAS
RESULT
CONFIGURATION MODE - VECTOR ANALYZER
MEAS
RESULT
MAGNITUDE
CAP BUFFER
MEAS
SIGNAL
REFERENCE
SIGNAL
ERROR
SIGNAL
SYMB TABLE
/ERRORS
The
MEAS RESULT
different displays for the measured signal can be selected.
The
MAGNITUDE CAP BUFFER, MEAS SIGNAL
REFERENCE SIGNAL, ERROR SIGNAL
TABLE/ERRORS
softkeys are selection switches, i.e. only one
of the measurem ent results of fered c an be selected per sc reen.
If two screens are available, (split-screen mode) a different
measurement result can be displayed in each screen.
When the measurement signal, the reference signal and the
error signal are displayed, submenus are called up by the
corresponding softkeys and the associated parameter can be
softkey opens a submenu in which the
and
SYMB
set.
Moreover, softkeys are available for setting the memory size,
MEMORY
SIZE
the number of bits to be demodulated and displayed.
,
FRAME
LENGTH
RESULT
LENGTH
POINTS PER
SYMBOL
2.4.3.4.1 Magnitude of Capture Buffer
The capture buffer is the memory comprising the samples that are entered during the storage of
measured values. These samples are used for demodulation but are retained over the complete
measurement. A reason for this is the loss in the dynamic range during the synchronization and
demodulation of the signal. For synchronization, an interpolation between the samples is necessary, for
example, for determ ining the symbol decision point acc urately. Interpolation is always synonymous with
a loss in the amplitude dynamic range. In case of synchronization, the signal has to be normalized. T he
normalization is also linked with a loss in the dynamic range.
When measuring the power ramping of a TDMA burst, a maximum dynamic range is required. This
dynamic range is obtained when using the capture buffer for samples.
1119.5063.12 2.4-43 E-5
Page 70

Digital Modulation Methods FSE
Submenu:
CONFIGURATION MODE - VECTOR ANALYZER
MAGNITUDE
CAP BUFFER
The
MAGNITUDE CAP BUFFER
signal in the capture buffer in the time domain.
The
MAGNITUDE CAP BUFFER
-
MEAS RESULT
softkey indicates the magnitude of the
mode is therefore recommended in all
cases where power ramping of TDMA bursts should be measured with a wide
dynamic range. Timing will be accurate to les s than or equal to half a clock
period of the sampling unit
Example:
A signal is sampled with 8 values per symbol. The maximum timing error of
the TDMA burst synchronized to a bit sequence is 1/16, i.e. 6.25% of the
symbol period
.
2.4.3.4.2 Measurement of Reference Signal
The FSE can display both the waveform of the m easur ement signal, which is derived f rom the s amples
in the baseband, and that of the reference signal. T o this effec t, the m easurement signal is f iltered and
synchronized to the carrier and the symbol clock. The I/Q off set and the amplitude reduction of the
signal is compensated prior to the display. The reference signal is generated f rom the dem odulated bits
by modulation down to the baseband. It is identical to the measurement signal freed of modulation
errors and noise.
The output formats for the measurement signal and the reference signal are identical. The output
formats are different for FSK demodulation and thel other demodulation modes.
Output formats for non-FSK demodulation:
Submenu:
SIGNAL
REFERENCE
SIGNAL
CONFIGURATION MODE - VECTOR ANALYZER
MEAS
MEAS
SIGNAL
MAGNITUDE
PHASE
FREQUENCY
REAL/IMAG
PART
EYE DIAG
[I]
EYE DIAG
[Q]
EYE DIAG
TRELLIS
POLAR [IQ]
VECTOR
POLAR [IQ]
CONSTELL
SYMBOL
DISPLAY
MEAS
SIGNAL
PHASE WRAP
ON
EYE
LENGTH
OFF
-
MEAS RESULT
The
MEAS SIGNAL
SIGNAL
softkeys call up identical submenus.
and
REFERENCE
The output formats of the two signals can be
selected there.
1066.4313.02 2.4-44 E-5
Page 71

FSE Digital Modulation Methods
The
MAGNITUDE
PHASE
MAGNITUDE
measurement or reference signal, which is normalized to 1, as a function of
time and symbol.
The
PHASE
signal.
softkey displays the magnitude of the demodulated
softkey displays the phase of the measurement or reference
PHASE WRAP
ON
FREQUENCY
REAL/IMAG
PART
OFF
The
PHASE WRAP ON/OFF
softkey activates/deactivates a phase shift.
The phase of a signal can have very high values due to the modulation.
Therefore, scaling should be very coarse to display the phase over many
bits. FSE therefore offers the phase to be shifted by means of the
WRAP ON/OFF
ON
The FSE displays the phase in the range of ±180°. If the phase
softkey.
PHASE
exceeds +180°, for example, 360° is subtracted from the phase
value so that >-180° is indicated. This avoids very high phase
values to be displayed which would impair the reading accuracy.
OFF
The phase is not shifted. It is displayed within the range of the Y
axis. Phase values above or below this range are cut off at the
diagram edges.
The
FREQUENCY
softkey displays the time or symbol-dependent frequency
response of the signal, i.e., the frequenc y-demodulated s ignal. The softkey is
only available for MSK demodulation.
The frequency display is suitable for measuring the frequency deviation by
using the markers.
The
REAL/
IMAG
PART
softkey calls up the display of the real and imaginary
parts of the measurement or reference signal in separate diagrams.
To this effect, the diagram is split up. The r eal part is displayed in the upper
half whereas the imaginary part is displayed in the bottom half. The X ax is
(which is scaled in time units or symbols) is identical for the two diagrams.
1119.5063.12 2.4-45 E-5
Page 72

Digital Modulation Methods FSE
Fig. 2.4-11 Sim ultaneous display of inphase and quadrature component in a
single diagram (here: screen A in split-screen display)
EYE DIAG
[I]
EYE DIAG
[Q]
EYE DIAG
TRELLIS
The
EYE DIAG [I], EYE DIAG [Q]
the various eye diagrams:
and
EYE DIAG TRELLIS
softkeys select
• eye diagram for the inphase signal,
• eye diagram for the quadrature signal and
• trellis diagram.
The eye diagram is the representation of inphase and quadrature signal
EYE DIAG [I] or EYE DIAG [Q]
(
symbol clock at the points of decision. The display range of the eye
diagram (number of states on the time ax is) is determined by softkey
LENGTH
The individual traces of the eye diagram are s uperimposed on each other
until the number of symbols spec ified with
The successive trac es are the continuation of the trac e written last, i.e. the
total trace is displayed in a folded form. T o obtain a com plete eye diagram,
all the states of a signal have to be traced at least once. T he number of
eyes vertically corresponds to the number of m odulation states les s 1. T he
eye aperture is a measure for diff erentiating between two decision levels. A
small eye apertures indicate a high, large eye apertures a sm all bit error
rate.
.
) as a function of time. It is triggered by the
EYE
RESULT LENGTH
is attained.
1066.4313.02 2.4-46 E-5
Page 73

FSE Digital Modulation Methods
The trellis diagram is used f or representing the states of c ontinuous-phase
modulation methods (e.g. MSK). It indicates the phase versus time and
permits also phases above ±180° to be displayed. The trellis diagram is
similar to the eye diagram in that measured traces ar e superimposed onto
each other in the display until the number of symbols defined by
LENGTH
is attained.
For the FSE, the trellis diagram is particularly useful f or testing MSK and
GMSK modulation. The symbols ar e spaced by 90°. A phase shift of +90 °
corresponds to logic 1, a shift of -90° to logic 0. A rising phase edge
therefore indicates a logic 1, a falling edge a logic 0. Same as with the eye
diagram, the width of the trellis diagram is defined by
EYE LENGTH
obtain a clear display, a minimum of 5 symbols should be selected as
display width.
RESULT
. To
The number of P
OINTS PER SYMBOL
should be as high as possible to
obtain a continuous trace in the eye diagram. 8 to 16 points are
recommended.
Meas Signal
Eye [Q]
Demod DQPSK
200
LN
T1
-2
Ref Lvl
10 dBm
2
0
SYMBOLS
CF 890.195 MHz
SR 15.3 kHz
Fig. 2.4-12 Eye diagram over 200 symbols of a DQPSK-modulated signal.
Display range is five symbols.
EYE
LENGTH
The
EYE LENGTH
softkey determines the display width of the eye diagram
in symbols. The number of symbols is entered in the field.
At least one symbol length or two states are required for a com plete eye. To
be able to detect the errors particularly at the zero crossings, two to five
symbols are recomm ended. The number of symbols is limited with
LENGTH
. In the case of
EYE LENGTH
=
RESULT LENGTH
RESULT
, however, the
signal versus time is displayed, the eyes are no longer visible.
1119.5063.12 2.4-47 E-5
Page 74

Digital Modulation Methods FSE
POLAR [IQ]
VECTOR
POLAR [IQ]
CONSTELL
The
POLAR [IQ] VECTOR and POLAR [IQ] CONSTELL
softkey display the
trace in the form of a polar diagram. In the vector diagr am, all the points are
marked. In the constellation diagram only those at the points of decision.
In the I/Q diagram, the FSE displays the inphase component of the signal on
the X axis, the quadrature component on the Y axis. Eac h trac e repr es ents a
vector. The magnitude of the vector is the distance to the zero point, the
phase is the angle between the positive X axis and the vector measured
counterclockwise.
Q
o
90
270
e
d
u
t
i
n
g
a
M
Phase
I
o
0
o
Magnitude = I + Q
22
180
o
Fig. 2.4-13 Vector in the I/Q diagram
In the vector diagram the num ber of points between the points of decision is
determined with
POINTS PER SYMBOL
. For instance, if 5 points per symbol
have been selected, every 5th point is a symbol at the point of decision. The
other four points are intermediate values. The points of decision can be
marked by selecting
DOTS
under
SYMBOL DISPLAY
.
The constellation diagram displays only the measurement values at the
points of decision.
Fig. 2.4-14 Constellation diagram (example QPSK)
1066.4313.02 2.4-48 E-5
Page 75

FSE Digital Modulation Methods
The S
SYMBOL
DISPLAY
YMBOL DISPLAY
displayed trace. The desired form of highlighting can be selected from the
table. Points of decision can be marked by vertical lines or by means of dots.
SYMBOL DISPLAY
o
ff
Dots
L
ines
With
off
selected, the points of decision are not marked. When
selected, points are drawn on the trace and for
constellation diagrams) ver tical lines are drawn between the X axis and the
trace.
softkey marks the symbol decision points in the
Dots
are
Lines
, (except for vector and
For vector and constellation diagrams dots are inserted with
For the constellation diagram dots are also displayed even in the
This function is used for displaying the time characteristic of measurement
results, e.g. as an I/Q characteristic or error signal.
Output formats with FSK demodulation:
Submenu:
MEAS
SIGNAL
REFERENCE
SIGNAL
CONFIGURATION MODE - VECTOR ANALYZER - MEAS RESULTS
MEAS
SIGNAL
MAGNITUDE
FREQUENCY
EYE DIAG
[FREQ]
EYE
LENGTH
Dots
and
off
Lines
mode.
.
SYMBOL
DISPLAY
The
MAGNITUDE
MAGNITUDE
measurement or reference signal as a function of time and symbol.
softkey displays the magnitude of the demodulated
1119.5063.12 2.4-49 E-5
Page 76

Digital Modulation Methods FSE
The
FREQUENCY
FREQUENCY
frequency response of the signal, i.e., the frequency-demodulated signal.
The frequency display is for instance suitable for m easuring the frequency
deviation by using the markers.
softkey displays the time- or symbol-dependent
EYE DIAG
[FREQ]
EYE
LENGTH
The
EYE DIAG [FREQ]
softkey displays the frequency-demodulated signal
as a function of time. This signal is triggered by the symbol clock at the
points of decision.
on the time axis) is determined by
The display range of the eye diagram (number of st ates
EYE LENGTH
.
The individual traces of the eye diagram are s uperimposed on each other
until the number of symbols spec ified with
RESULT LENGTH
is attained.
The successive trac es are the continuation of the trac e written last, i.e. the
total trace is displayed in a folded form. T o obtain a com plete eye diagram,
all the states of a signal have to be traced at least once. T he number of
eyes corresponds to the number of modulation states less 1. The eye
aperture is a measure for differentiating between two decision levels. A
small eye apertures indicate a high, large eye apertures a sm all bit error
rate.
The
EYE LENGTH
softkey determines the display width of the eye diagram in
symbols. The number of symbols is entered in the field.
At least one symbol length or two states are required for a complete eye. Two
to five symbols are recomm ended however to detect the err ors particular ly at
the zero crossings. The number of symbols is limited by
In the case of
EYE LENGTH
=
RESULT LENGTH
RESULT LENGTH
, however, the signal
versus time is displayed, the eyes are no longer visible.
.
SYMBOL
DISPLAY
SYMBOL DISPLAY
displayed trace. The desired form of highlighting can be selected from the
softkey marks the symbol decision points in the
The
table. Points of decision can be marked by vertical lines or by dots..
SYMBOL DISP LAY
off
Dots
Lines
With
off
selected, the points of decision are not highlighted. When
selected, points are drawn on the trace and with
Lines
selected (except for
Dots
are
vector and constellation diagrams), vertical lines are drawn between the X
axis and the trace.
1066.4313.02 2.4-50 E-5
Page 77

FSE Digital Modulation Methods
2.4.3.4.3 Measurement of Modulation Errors
The FSE evaluates the modulation errors by comparing the measurement signal with the internally
generated ideal reference signal. The output formats diff er depending on whether FSK demodulation is
selected or not. The different output formats of the er ror are selec ted by means of the
softkey.
Non-FSK demodulation:
The modulation error of the measurement signal can be displayed separately, i.e. according to
magnitude and phase, as I and Q error, error vector magnitude or, in polar diagrams, as vector or
constellation diagram.
The magnitude and phase error are determined according to the following equations:
Error signal magnitude =
Error signal phase =
arctan
22
IQ
+ - IQ
Q
− , where
arctan
I
+ and
ref2ref
Q
ref
I
ref
2
the real and imaginary part of the error signal are given as follows
ERROR SIGNAL
Error signal real part = I - I
Error signal imag part = Q - Q
ref
and
ref
The magnitude of the error vector (error vector magnitude) is
EVM =
(I I ) ( Q Q )
2
−+−
ref
ref
2
I, Q = measured I/Q component
,
Q
I
ref
= I/Q components ideally calculated from the bit sequence.
ref
The following vector diagram indicates the different types of errors resulting from the measurement
signal and the reference signal:
Quadrature
component
Ideal
Q
ref
Q
symbol point
Reference
vector
Amplitude
error
Error vector
Measured
symbol point
Phase
error
Phase of
error vector
I
ref
Error vector shifted to its origin
(polar diagram of error vector)
I
Inphase component
Fig. 2.4-15 Graphic display of modulation errors by means of a point of decision
1119.5063.12 2.4-51 E-5
Page 78

Digital Modulation Methods FSE
Submenu:
ERROR
SIGNAL
CONFIGURATION MODE - VECTOR ANALYZER - MEAS RESULT
ERROR
SIGNAL
MAGNITUDE
The
ERROR SIGNAL
softkey opens the submenu for selecting
the type of error to be displayed.
The following types of error representation are available
• amplitude error (MAGNITUDE)
PHASE
FREQUENCY
• phase error (PHASE)
• frequency error (FREQUENCY)
• error if the real part (REAL/IMAG PART) and
REAL/IMAG
PART
• error of the imaginary part (REAL/IMAG PART)
• magnitude error (ERROR VECTOR MAGNITUDE)
For error representation the FSE compares all the points of the
measurement and reference signal and displays them in the
ERROR VECT
MAGNITUDE
POLAR [IQ]
VECTOR
POLAR [IQ]
CONSTELL
SYMBOL
DISPLAY
error diagram (except for
number of measurement results depends on the number of
points per symbol. If only the errors are to be evaluated at the
points of decision, the number of points per symbol has to be
set to one.
To maintain the correct error for discontinuous transmission,
e.g. for TDMA methods , make sure that only valid symbols are
displayed. The result length and the trigger condition have to be
set appropriately.
POLAR [IQ] CONSTELL
). Thus, the
MAGNITUDE
PHASE
FREQUENCY
REAL/IMAG
PART
The
MAGNITUDE
softkey starts the point by point comparison of the
magnitude of the meas urement signal with the m agnitude of the ideal signal.
The difference of the two magnitudes is displayed..
The
PHASE
softkey starts the point by point comparison of the phase of the
measurement s ignal with the phase of the ideal signal. T he differenc e of the
two phases is displayed as phase error.
The
FREQUENCY
softkey displays the frequency error. The frequency
response of the measurement signal is compared with that of the ideal
reference signal and the difference between the two responses is displayed
as a function of time and symbol. The softkey is only available for MSK
demodulation .
The
REAL/IMAG PART
softkey displays the error of the real and imaginary
part in separate diagrams. T o this effect, the measurement diagr am is split
up. The real part is displayed in the top half and the imaginary part in the
bottom half. The X axis (time or symbols) is identical for the two diagrams.
1066.4313.02 2.4-52 E-5
Page 79

FSE Digital Modulation Methods
ERROR VECT
MAGNITUDE
POLAR [IQ]
VECTOR
POLAR [IQ]
CONSTELL
FSK demodulation:
Submenu:
ERROR
SIGNAL
CONFIGURATION MODE - VECTOR ANALYZER - MEAS RESULT
The
ERROR VECT MAGNITUDE
softkey displays the magnitude of the error
vector versus time or symbols.
The
POLAR [IQ] VECTOR
and
POLAR [IQ] CONSTELL
softkeys display the
error vector in the polar diagram. The error vector diagram and the error
constellation diagram.
With these form s of representation, the points of decis ion are all shifted bac k
to the origin and are laid on top of each other. The errors at the points of
decision can thus be seen at a glance.
ERROR
SIGNAL
MAGNITUDE
The
ERROR SIGNAL
softkey opens the submenu for selecting
the type of error to be displayed.
The following quantities can be displayed:
• Magnitude error (MAGNITUDE)
• Frequency error (FREQUENCY)
FREQUENCY
MAGNITUDE
MAGNITUDE
measurement signal with the magnitude of the ideal signal.
softkey starts the point by point comparison of the
The
The difference of the two magnitudes is displayed.
The
FREQUENCY
FREQUENCY
The frequency response of the measurement signal is compared with that of
softkey displays the frequency error.
the ideal reference signal and the differ ence between the two responses is
displayed as a function of time and symbol.
1119.5063.12 2.4-53 E-5
Page 80

Digital Modulation Methods FSE
2.4.3.4.4 Symbol Table and Table of Modulation Errors
The symbol table and the table with modulation errors are indicated in the same display. In this case, the
two tables are assigned to a trace. Similar to the trace display, the corresponding trace can be frozen
VIEW
) or faded out (
(
The range for the error calculation can be limited by means of the time lines (TIME LINES 1/2;
SEARCH
If only one window is displayed, the symbol table is assigned to trace 1 and the error table to trace 2.
menu,
BLANK
).
SEARCH LIM ON/OFF
MARKER
menu).
Submenu:
SYMB TABLE
/ERRORS
CONFIGURATION MODE - VECTOR ANALYZER - MEAS RESULT
The
SYMB TABLE / ERRORS
and a table of modulation errors of the measured signal.
The symbol table shows the demodulated bits of the signal. The number of
bits is defined under
related to the traces (in split screen mode) by means of the marker
coupling. The mark er on the trace and the associated symbol are m arked
at the same time.
The indicated modulation error s differ depending on whether FSK signals
are demodulated or one of the other digital demodulators is active.
The following parameters are indicated as sum errors of the modulation
(except with FSK demodulation):
• Frequency error
• Magnitude error
• Phase error
• Error vector magnitude
• I/Q offset
• I/Q imbalance and
• Amplitude droop
RESULT LENGTH
softkey displays a table of demodulated bits
in the same menu. Bits can be
• Rho factor.
The FSE evaluates these errors within the result length
by the vertical lines within the result length.
With FSK demodulation, the following parameters are indicated as sum
errors of the modulation:
• Frequency error
• Magnitude error
• FSK deviation
• FSK deviation error
The entered reference deviation is indicated in addition (
DEVIATION
1066.4313.02 2.4-54 E-5
).
or in a range limited
FSK REF
Page 81

FSE Digital Modulation Methods
Non-FSK demodulations:
Fig. 2.4-16 Symbol table and table of sum errors (not FSK demodulation)
Description of errors as follows (not FSK signals):
Magnitude error: The magnitude error is the amplitude difference of the I/Q components of
measurement signal and reference signal at the points of decision. For MSK
modulations, all the points are consider ed in the calculation. It is a measure for the
quality of the amplitude component of the modulated signal.
Phase error: The phase error is the phase difference of the I/Q components of measurement
signal and reference signal at the points of decision. For MSK modulations, all the
points are considered in the calculation.
Vector error: The error vector magnitude is the magnitude of the error vector which links the
measured I and Q value in the complex plane to the ideal I and Q value at the points
of decision. The error is calculated according to the following equation:
Error vector magnitude (EVM) =
I
= error of the inphase signal and
err
= error of the quadrature signal
Q
err
2
IQ
err
2
+ , where
err
Frequency error : The frequenc y error is the deviation of the FSE c enter frequency from the measured
carrier frequency. It is derived from the frequency shift to be effected for
synchronization to the carrier. The reference error of the FSE is also part of the
frequency error.
Amplitude droop:The amplitude droop indicates the amplitude variation of the signal between the two
symbols at the points of decision in dB. This parameter is ver y important for TDMA
signals and is a measure for the quality of pulse modulation.
1119.5063.12 2.4-55 E-5
Page 82

Digital Modulation Methods FSE
I/Q offset: The I/Q offset is a m easure for the LO feedthrough with analog I/Q modulators. It
can be seen through a shift of the zero point in the constellation diagram. Without LO
feedthrough (LO 100 % suppressed), the I/Q offset is zero. It is measured at the
points of decision.
Q
I/Q offset
I
Fig. 2.4-17 Constellation diagram with I/Q offset
Amplitude and vector errors ar e given in %, phase errors in degrees ( deg) or radian
(rad). Prior to calculation, the measurement result is normalized in the vector or
constellation diagram to a circle around the center of the group mid-points, the radius
corresponding to the mean distanc e of all group mid- points to the center. This circle
is defined as a unit circle with the radius 1 (see
MODULATION PARAMETER menu
)
NORMALIZE
Then, the errors at the points of decision are determined and the rms of the
individual error values is calculated. Sinc e the constellation diagram is norm alized,
the result is the rms value of the error in %.
function in the
I/Q imbalance: The I/Q imbalance is a measure for the symmetry of the I/Q modulator to be
measured. The I/Q gain error is the result of unequal gain factors in the I and Q path
of the transmitter. The I/Q imbalance is calculated from the square root of the
quotient of the vector magnitude for the wanted and interfering signals averaged
over all points of decision:
2
%
[]
2
Interference vector
Signal vector
I
I / Q imbalance = 100*
Ideal
constellat ion poin t
Offset-cor rect ed
center
n
Interferencevector
∑
Signal vector
i1
=
Q
Fig. 2.4-18 Constellation diagram with I/Q imbalance
1066.4313.02 2.4-56 E-5
Page 83

FSE Digital Modulation Methods
Rho factor: Sim ilar to the error vector magnitude, the Rho f actor is a m easure for the quality of
digital modulation. It is determined by measurement of the normalized correlated
power between the measured signal and reference signal (IS95-CDMA to US
standard IS-98) and is designated as waveform quality factor.
The Rho factor can assume a maximum value of 1.0 (measured signal and
reference signal are a 100% identical).
FSK demodulation:
Fig. 2.4-19 Symbol table and table of sum errors (FSK demodulation)
The various errors and measured values have the following meaning (FSK signals):
FSK deviation: The FSK deviation is determined by the square difference between m easure-
ment and reference signal being m inimized. The reference signal is based is
formed on the basis of the known demodulated bits and modulation
parameters. The frequency offset is determined separately and indicated
under Freq Error. The frequency error is not considered in the indicated FSK
deviation.
FSK deviation error: The FSK deviation error is the deviation difference between the measured
signal and the reference signal, measured as an rms and peak value over all
symbols. Frequency errors (frequency offset) are part of the indicated FSK
deviation error.
Normalize ON The entered FSK reference deviation is used for sc aling of
the reference signal.
Normalize OFF The reference signal is automatically derived from the
measurement signal on the basis of the known
demodulated symbols and modulation parameters so as to
ensure maximum agreement between measurement and
reference signal.
Magnitude error: With FSK, the magnitude error is the deviation of the individual amplitudes of
the AM envelope from the mean (rms) car rier am plitude, meas ured as an rm s
value over all symbols displayed and as a peak value normalized to the rms
amplitude in %.
Frequency error: The frequency error is the deviation of the FSE center frequency from the
measured carrier frequency. It is derived from the frequency shift to be
effected for synchronization to the carrier. The ref erence error of the FSE is
also part of the frequency error.
1119.5063.12 2.4-57 E-5
Page 84

Digital Modulation Methods FSE
2.4.3.5 Selecting Memory Size, Demodulation Length and Display Range
The size of the capture buffer c ontaining the stored samples, the frame length to be demodulated and
displayed and the number of points per symbol can be set to allow an adaptation to the meas urement or
to optimize the measurement speed.
At the beginning of a measurement, the FSE stores the samples into the c apture buffer which can be
selected between 1 and 16-k symbols. It then tries to find the suitable frame length for further
processing according to the trigger c ondition (
for error calculation is defined with
synchronization sequence triggering (
MEMORY SIZE
RESULT LENGTH
FIND SYNC
FRAME
LENGTH
RESULT
LENGTH
FIND BURST
).
). The fram e length to be displayed or used
. It can be positioned within the frame length by
Trigger:
Free Run
Video
Extern
Find Burst Find Sync
Finally, the number of points per symbol can be set. This number defines the maximum number of
symbols that can be processed in the
Submenu
CONFIGURATION MODE - VECTOR ANALYZER - MEAS RESULT
MEMORY
SIZE
The
saved in the capture buffer per measurement is determined. Within the
memory size
FIND BURST
for (
MEMORY SIZE
163 84 PO INT S
8192 PO INT S
4096 PO INT S
2048 PO INT S
1024 PO INT S
Only the symbols entered under
FRAME LENGTH.
MEMORY SI Z E
a burst, e.g. in the case of a TDMA signal, can be sear ched
function).
softkey calls up a table in which the num ber of sam p les
FRAME LENGTH
are used for
demodulation.
For symbol rates > 1 MHz the data are stored in the m emory without prior
filtering and reduction. The maximum memory size is therefore reduced to
4096 points.
1066.4313.02 2.4-58 E-5
Page 85

FSE Digital Modulation Methods
FRAME
LENGTH
The
FRAME LENGTH
softkey calls up a table in which the number of
symbols to be demodulated or evaluated is defined.
FRAME
LENGTH
1600 SYMBOLS
1500 SYMBOLS
1400 SYMBOLS
1300 SYMBOLS
1200 SYMBOLS
1100 SYMBOLS
1000 SYMBOLS
900 SYMBOLS
800 SYMBOLS
700 SYMBOLS
600 SYMBOLS
500 SYMBOLS
400 SYMBOLS
300 SYMBOLS
200 SYMBOLS
100 SYMBOLS
With up to 4 points per symbol a maximum of 1600 symbols can be
demodulated per measur ement and their modulation parameters measured.
With 8 points per symbol up to 800 symbols, and with 16 points per symbol
up to 400 symbols can be handled.
With symbol rates >1 MHz to ≤1.28 MHz a maxim um of 600 symbols can be
handled. This is due to the fact that the data are stored in the memory without
prior reduction. The subsequent reduc tion limits the FRAME LENGT H in the
specified frequency range.
The frame length markedly influences the time required for evaluating a
measurement signal. It is therefore recommended to choose the frame length
as short as possible. 400 symbols, f or ex am ple, ar e suf f icient f or determ ining
the phase error of a GSM burst as only 147 symbols are to be evaluated. The
FSE automatically searches for the correct tim e domain by trigger functions
FIND BURST
and
FIND SYNC
.
The choice of the frame length influences the m aximum number of points per
symbol. With up to 400 s ymbols a maximum of 16 points, with >400 up to
800 symbols a maximum of 8 points and with >800 symbols a maximum of 4
points per symbol is possible.
With symbol rates >1MHz to ≤1.20 MHz, the maximum number of
symbols is 500!
1119.5063.12 2.4-59 E-5
Page 86

Digital Modulation Methods FSE
RESULT
LENGTH
POINTS PER
SYMBOL
The
RESULT LENGTH
softkey opens a window for defining the number of
symbols for display on the screen.
The maximum result length is identical to the frame length.
With the
FIND SYNC
function activated (synchronization to bit sequences in
the signal), the maximum result length can be reduced (or the frame length
increased).
The
POINTS PER SYMBOL
softkey opens a window for entering the number
of points per symbol.
1, 2, 4, 8 and 16 points per symbol can be selected. With one point per
symbol, each point in the display corresponds to a symbol sampled at the
time of decision. With n points per symbol, each n-th value is a point of
decision. With 1 and 2 points per symbol, the FSE demodulates with 4 points
per symbol for reasons of accuracy. Only one or two samples are output,
however.
For up to 4 points per symbol, a frame length of max.
1600 symbols is
possible, with 8 points per symbol a frame length of m ax. 800 symbols and
with 16 points per symbol of max. 400 symbols.
In the case of MSK demodulation, the number of points per symbol
influences the result of the error measurement as all the points are
considered in the calculation. With all other demodulators, only the values
measured at the points of decision are taken into account. For GSM
(DCS1800 and PCS1900) less than 4 points per symbol should not be used.
The number of points per symbol largely influences the m easurement s peed
attained during the evaluation of the signal. If high measurem ent rates are to
be attained for automatic tests, for example, a low number of points per
symbol is recommended.
1066.4313.02 2.4-60 E-5
Page 87

FSE Frequency Settings /Vector Signal Analysis
2.4.4 Frequency Settings - FREQUENCY Key Group
In vector signal analysis, FSIQ is always set to a fixed frequency. The RF signal is analyzed by
converting the signal into the complex baseband.
The frequency of FSIQ is set in the same way as in the spectrum analysis mode, i.e. with the
key in the
FREQUENCY CENTER
FREQUENCY
CENTE R SPAN
FREQUENCY
key group.
menu
CENTER
CENTER
FREQUENCY
The
CENTER
key calls up the entry window for the
center frequency .
For the demodulation of digitally modulated signals, the
FSIQ frequency has to be accurately set to the frequency
START STOP
(carrier) of the signal to be measured so that
synchronization to the carrier is possible. The required
setting accuracy depends on the symbol rate and must
not exceed 2% of the symbol rate.
FREQUENCY
OFFSET
CENTER
FREQUENCY
OFFSET
The
FREQUENCY OFFSET
softkey activates the input of a frequency
offset which can be added to the frequency-axis labeling. The displayed
frequency is shifted by the frequency offset. The range of values for the
offset is -100 GHz to +100 GHz.
1066.4313.02 2.4-61 E-5
Page 88

Frequency Settings - Vector Analyzer FSIQ
2.4.5 Setting the Frequency Span - START, STOP, and SPAN Key
The
SPAN, START
digitally modulated signals since FSIQ is always set to a fixed frequency and the measurement results
are displayed in the time domain. The analysis bandwidth by which the demodulation is perform ed is
predefined by the symbol rate and the number of sampling points.
and
STOP
keys are not assigned in vector signal analysis for the dem odulation of
1066.4313.02 2.4-62 E-5
Page 89

FSE Level Display/RF Input
2.4.6 Setting the Level Display and Configuring the RF Input
2.4.6.1 Setting the Reference Level
With spectrum analysis (ANALYZER mode) of the FSIQ, the level applied to the RF input is always
indicated on the display so that one can see the relationship between the setting of the reference level
and the measurement results on the display.
With vector s ignal analysis, this only applies to operating mode
BUFFER
demodulated signal is displayed this relationship is not obvious. That is why a strict distinction has to be
made between setting the reference value which is an important reference point for the measuredvalue display and the reference level relating to the RF input.
To obtain a maximum dynamic range it is impor tant for the signal level at the A/D converter to be close
to the maximum level of the converter. The maximum level of the converter corresponds to the
reference level (
attains the reference level in the spectrum analysis mode is ideal for the vector analyzer mode. An
important factor is the sum level within the IF bandwidth (=
analysis mode) of the analyzer.
The reference level can be manually set by checking the signal level in the spectrum analysis mode
against the set frequency (at the same IF bandwidth!) and by operating the vector analyzer with the
same setting.
The FSET can perform this in vector signal analysis but also by a single automatic setting of the
reference level.
Certain settings of the spectrum analysis mode such as center frequency, reference level and
attenuation are taken over by the vector signal analysis. Parameters that are not af fected are span (in
vector signal analysis, the frequency span has a different meaning: it corresponds to the analysis
bandwidth and is thus independent in the two operating modes), resolution bandwidth, ref. level offset as
well as trace and trigger settings
The reference value (
measured value. Apart from
BUFFER
determined.
In operating mode
REF LEVEL
DIGITAL DEMODULATION
) in the spectrum analysis mode. This means that a signal whose amplitude
REF VALUE
) of the vector signal analysis is the reference point f or scaling the
DIGITAL DEMODULATION-RESULT DISPLAY-MAGNITUDE CAP
it is decoupled from the setting of the reference level, i.e. a direct relationship cannot be
DIGITAL DEMODULATION, MAG CAP
with activated demodulation , e.g. when the
ANALOG BANDWIDTH
in vector signal
With the
The
such as auto scaling (
(X/Y_REF VALUE) and the relative position of the reference value on the diagram (
POSITION
1066.4313.02 2.4-63 E-5
REF
RANGE
).
key, the reference level can be set like in the spectrum analysis mode.
key calls up a menu com prising all the settings required for scaling the measured value
AUTO SCALE
), scaling (Y per Div), reference values in the X and Y direction
REF VALUE
Page 90

Level Display/RF Input FSE
LEVEL REF
LEVEL
REF
RA E
Menu
REF LEVEL
REF LEVEL
RF LEVEL
OFFSET
ATTEN STEP
1dB 10dB
RF ATTEN
MANUAL
ATTEN AUTO
NORMAL
ATTEN AUTO
LOW NOISE
ATTEN AUTO
LOW DIST
MIXER
LEVEL
The REF key calls up the menu for setting the reference
level and at the same time activates the level entry field.
Operation and softkey functions identical to analyzer
mode:
ATTEN STEP 1dB/10dB
RF ATTEN MANUAL
ATTEN AUTO NORMAL
ATTEN AUTO LOW NOISE
ATTEN AUTO LOW DIST
MIXER LEVEL
Softkey
ATTEN STEP 1dB/10dB
is only available when
the FSIQ is equiped with option FSE-B13, 1dB
attenuator
REF LEVEL
REF LEVEL
OFFSET
The
REF LEVEL
softkey activates entry of the manual gain of the FSIQ. For
a maximum dynamic range, it has to be ensured that the A/D converter is
driven to its full range but not overdriven.
In the vector analyzer mode, this is indicated by the messages
(overload) and
UNLD
(underrange) which inform on the dynamic range
IF OVLD
when measured data are read in.
When
IF OVLD
is displayed, the instrument or the A/D converter is
overdriven during data read-in and entered data are invalid.
With
UNLD
displayed, the A/D converter is not sufficiently driven during
data read-in (level <-6 dB of full range). Indicated values may have a
reduced dynamic range, i.e. have a greater error.
For a correct level setting in the case of
IF OVLD
, reduce the REF LEVEL
(continuous sweep mode) in sufficiently small steps (e.g. 2 dB) until the
message disappears.
UNLD
Proceed analogously for increasing the REF LEVEL when
is
displayed until the message disappears.
The maximum dynamic range is attained approx. 1 dB below the
OVLD
level.
The reference level can also be set to the test signal in the spectrum
analysis mode at the same IF bandwidth as in the vector signal analysis
mode (with
COUPLED: ANALOG BW AUTO
also 10 kHz) and vector signal
analysis can then be selected again.
The
REF LEVEL OFFSET
softkey activates the entry of a level offset.
It is added to the measured level, irrespective of the unit used. The s caling
of the Y axis is changed accordingly.
This function is used to take into account the effect of an external attenuator
on the displayed values.
The setting range is ± 200 dB in 0.1 dB steps.
1066.4313.02 2.4-64 E-5
Page 91

FSE Level Display/RF Input
2.4.6.2 Setting the Display Range and Scaling - RANGE Key
The menu for setting the display range is different from that of the spectrum analysis mode.
LEVEL RANGE
LEVEL
REF
RANGE
Y PER DIV
menu
LEVEL
RANGE
Y PER DIV
REF VALUE
Y AXIS
REF VALUE
X AXIS
REF VA LUE
POSITION
SCALE
UNIT
The
Y PER DIV
current unit.
The
RANGE
key calls up a menu comprising all the
important display parameters such as reference value,
scaling etc.
softkey calls for the entry of the vertical scaling in the
REF VALUE
Y AXIS
REF VALUE
X AXIS
For vector or constellation diagrams, the corres ponding X sc aling is linked
with Y scaling:
X PER DIV =5/4 *(Y PER DIV)
Reason: The diagram has 400 x 500 points. In case of a free X scaling
circles would be reproduced as ellipses.
The
REF VALUE Y AXIS
and
REF VALUE X AXIS
softkeys call for the entry
of the reference value for the Y or X axis of the m easurement diagram. The
REF VALUE X AXIS
softkey is only displayed if a polar diagram has been
selected for the trace.
The reference value is entered in the corresponding unit of the diagram
UNIT
(See
).
1066.4313.02 2.4-65 E-5
Page 92

Level Display/RF Input FSE
Example 1: Constellation diagram: y reference value: +1.20; x reference value: - 0,35
(reference position: 50%)
Fig. 2.4-17 Representation of the reference values in the constellation diagram
Example 2: Display of I and Q signals: Y reference value: -0.2 REF position: 50%
Fig. 2.4-18 Display of I and Q signals
1066.4313.02 2.4-66 E-5
Page 93

FSE Level Display/RF Input
REF VALUE
POSITION
Submenu:
SCALE
UNIT
The
positions diverging from the basic setting.
REF VALUE POSITION
lies at 100%, i.e. the maxim um displayable Y value is also the ref erence value.
It is best to use this setting for displaying the magnitude which is then the basic
setting.
When, for ex ample, the timing of I/Q signals or the phas e s pectr um is displayed
it might be desirable to set the refer ence value to the center. T he basic setting
is thus 50% (also for polar diagrams).
LEVEL RANGE
REF VALUE POSITION
defines the position of the reference value. It nor mally
SCALE
UNIT
Y UNIT
LOG[dB]
Y UNIT
LINEAR
UNIT DEG
UNIT RAD
Y UNIT
dBm
Y UNIT
VOLT
Y UNIT
WATT
The
SCALE UNIT
the unit of the Y axis and the X axis are set.
The units offered depend on the setting of
DISPLAY
The logarithmic unit dB (
linear units (
axis.
ERROR
units:
Y UNIT LOG [dB
Y UNIT LINEAR
Errors of
Phase errors are displayed in DEG or RAD, frequency
errors in Hz.
Units which are not allowed in the current operating
mode are disabled.
softkey opens a window for setting the reference
softkey calls up a submenu in which
RESULT
and
MEAS RESULT
Y UNIT LINEAR
and
MAGNITUDE
.
Y UNIT [dB]
) or dimensionless
) are permissible for the Y
are displayed in the following
]: dB
: %.
REAL/IMAG PART
are always displayed in %.
X UNIT
TIME
X UNIT
SYMB OL
In polar diagrams, the units for the X -axis and Y-axis are
equal. The softkeys
X UNIT...
The time representation, the units time (
symbols (
X UNIT SYMBOLS
are suppressed.
X UNIT TIME
) can be used for the
) or
X-axis. The sof tkey for the X-axis unit are only shown in
time representation.
If a marker is active, the m arker values are read out in
the current scale units.
Only for MEAS RESULT: MAGNITUDE CAP BUFFER:
Possible display units:
dBm , Volt
and
Watt.
YUNIT LOG [dB], YUNIT LINEAR,
1066.4313.02 2.4-67 E-5
Page 94

Level Display/RF Input FSE
Table 2.4-3 Allocation table of selectable units or, in c ase of error display, of the displayed units in
operating mode
MEAS RESULT
DIGITAL DEMODULATION
depending on
RESULT DISPLAY
and
RESULT
DISPLAY
-------------------
MEAS RESULT
MEAS
SIGNAL
REFERENCE
SIGNAL
ERROR
SIGNAL
VECTOR
ERROR
MAGNITUDE
CAP
BUFFER
Y_UNIT
LINEAR
Y-UNIT
LOG[dB]
dBm
VOLT
WATT
-- like
-- [%]
-- [%]
MAGNI-
Y_UNIT
LINEAR
Y-UNIT
LOG[dB]
MEAS
SIGNAL
[dB]
[dB]
TUDE
PHASE FREQUENCY
DEG/RAD Hz Y_UNIT
like
MEAS
SIGNAL
PHASE
DEG/RAD
DEG/
RAD
[with FSK and
MSK only]
like
MEAS
SIGNAL
Hz -- - - -
-- [%] - [%] [%]
REAL/
IMAG
PART
LINEAR
like
MEAS
SIGNAL
EYE
DIAG
Y_UNIT
LINEAR
like
MEAS
SIGNAL
2.4.6.3 Configuration of RF Input in Vector Signal Analysis
This section is identical to that of the spectrum analysis mode.
POLAR
[IQ]
VECTOR
Y_UNIT
LINEAR
like
MEAS
SIGNAL
POLAR
[IQ]
CONSTELL
Y_UNIT
LINEAR
like
MEAS
SIGNAL
INPU T
INPUT
RF ATTEN
MANUAL
ATTEN AUTO
NORMAL
ATTEN AUTO
LOW NOISE
ATTEN AUTO
LOW DIST
MIXER
LEVEL
ATTEN STEP
1 dB 10dB
INPUT
SELECT
Note: The operating mode recommended for the vector
analyzer input is ATTEN AUTO NORMAL.
If ATTEN AUTO LOW NOISE is set (or for
MIXER LEVEL
≥
–30 dB), the higher signal
modulation occuring within the IF-bandwidth
causes a nonlinear behavior in the IF branch.
This leads to increased measurement er rors, in
particular for modulation types with a nonconstant level (e.g. PSK).
1066.4313.02 2.4-68 E-5
Page 95

FSE Vector Analyzer - Main Marker
2.4.7 MARKER Key Group
In the vector analyzer mode markers m ay be used for highlighting points in a trace and for reading out
measured values.
For detailed information see section ’Marker Function’ in chapter ’Analyzer Mode’.
In the vector analyzer mode marker softkey functions depend on the selected measurement.
2.4.7.1 Main Marker -
NORMAL
Key
The main markers and their functions are selected with the
MARKER NORMAL
MARKER
NORMAL SEARCH
D TA
MKR
menu
MARKER
NORMAL
MARKER 1
MARKER 2
The
NORMAL
standard marker functions.
Activated marker functions are indicated by a dark
background of the softkeys. If no marker is activated
when the
activated as a reference and set to the maximum value
in the curve. (automatic switch-on of peak search
POLAR MKR
R/I MA/PH
POLAR MKR
DEG RAD
COUPLED
MARKERS
function provided at least one trace is active; not with
polar diagram). In all other cases the reference marker is
activated but no automatic peak search is performed.
In the marker field the marker position (time), the
measured value or values (in the case of a complex
display) and the trace relevant for the marker (here [T1])
are displayed.
Example:
Marker display in the digital demodulation and I/Q display
mode:
MARKER
INFO
ALL MARKER
OFF
Marker 1 [T1/3] 22.3 µs
Real 0.998
Imag -0.124
When the symbol table is displayed (softkey
TABLE/ERRORS
marker m oves from symbol to symbol in the table. T he
position of the mark er is indicated by a dark back ground
and its numerical value in inverse video.
NORMAL
key.
key calls up a menu comprising all
NORMAL
key is pressed, MARKER 1 is
in submenu
MEAS RESULT
SYMB
) the
In the marker f ield, the marker position and the decimal
value of the symbol are displayed.
MARKER
NORMAL
MARKER 1
MARKER 2
The
MARKER 1
and
MARKER 2
softkeys switch the respective m arker on or
off or define it as an entry marker (reference marker).
1066.4313.02 2.4-69 E-5
Page 96

Main Marker - Vector Analyzer FSE
POLAR MKR
R/I MA/PH
POLAR MKR
DEG RAD
COUPLE D
MARKER S
The
POLAR MARKER R/I / MA/PH
(
MA/PH
) or real and imaginary part (
softkey selects magnitude and phase
R/I
) for the numeric result display in the
polar diagram.
When measured values are indicated versus time this softkey is disabled.
The
POLAR MARKER DEG/RAD
radiant (
RAD
) for indication of the phase of the marker in the respective
softkey selects the unit degree (
DEG
) or
diagram.
The
COUPLED MARKER
different traces in the com bined display mode
softkey couples markers (and delta markers) of
REAL/IMAG PAR
. In this case
the X position of corresponding markers is identical.
This allows complex marker values to be dis played which correspond to the
polar display.
Marker 1 6.75 SYM [T1/3]
RE 0.895
IM 1.002
If several windows are displayed, the markers of all windows are coupled
when the
COUPLED MARKERS
function is active.
1119.5063.12 2.4-70 E-5
Page 97

FSE Vector Analyzer - Main Marker
ALL MARKER
OFF
MARKER
INFO
The
ALL MARKER OFF
softkey switches all m ark ers inc luding ref erenc e and
delta markers off and closes the marker entry window. In addition the
MARKER INFO
The
MARKER INFO
softkey is switched off.
softkey allows several mark ers to be displayed in the
grid, in addition to the display of marker information in the m arker field of the
diagram headline.
In the top right-hand corner of the grid the two mar kers or delta mark ers are
displayed with symbols ∇/∆, marker number (1, 2), position and measured
value (may be complex). The number of symbols for spec ifying the marker
position is limited in certain cases.
If there are not enough lines for displaying all active markers and delta
markers, the markers are listed first and then the delta markers.
SPLIT SCREEN
In the
SCREEN A
and one for
display this list is divided into two lists, one for
SCREEN B
.
1066.4313.02 2.4-71 E-5
Page 98

Delta Marker - Vector Analyzer FSE
2.4.7.2 Delta Marker - DELTA Key
MARKER DELTA
MARKER
NORMAL SEARCH
DELTA
MKR
menu
DELTA
MARKER
DELTA 1
DELTA 2
DELTA MKR
ABS REL
The
DELTA
key in the MARKER key group selects the
delta markers.
Delta markers are always referenced to the active
reference mark er . When no m arker is active, switching
on a delta marker automatically activates marker 1. Delta
markers are displayed as an unfilled symbol
the delta marker is active for entry, a f illed symbol
. When
is
displayed.
DELTA
MARKER
DELTA 1
DELTA 2
DELTA MKR
ABS REL
ALL DELTA
OFF
ALL DELTA
OFF
The
DELTA 1
and
DELTA 2
softkeys switch on delta markers 1 and 2.
Operation of delta markers is identical to that of markers. When a delta
marker is s witched on, all entries apply to the delta mark er. For changing
the position of the main marker, the main m arker has to be reactivated.
Displayed differences normally apply to the active reference marker.
In the delta marker field, the number of the delta marker, the time
difference to the referenc e mark er and the differ ence of meas ured values
between the active delta marker and reference marker are displayed.
The
DELTA ABS / REL
relative (
REL
) input of time of the delta marker.
Default setting is
The
ALL DELTA OFF
REL
softkey switches between absolute (
ABS
) and
(input relative to the reference marker)
softkey switches off all active delta markers and any
associated functions.
1119.5063.12 2.4-72 E-5
Page 99

FSE Vector Analyzer - Search Menu
2.4.7.3 Search Functions (Marker Search menu) - SEARCH Key
The menus called up with
SEARCH
offer functions for a peak/min search and universal marker
functions for overall evaluation of traces. The search functions can be used for markers and delta
markers.
Important: With polar diagrams, peak/min. peak values refer to the vector length (with origin as
reference), in all other cases to the Y deflection. In this diagram , sum mar y markers cannot
be switched on or are not displayed.
Functions in the
MARKER SEARCH
Switchover between the active marker and delta marker is possible with the
menu refer to the marker or delta marker active during entry.
ACTIVE MKR DELTA
softkey.
If no marker is switched on when the
SEARCH
key is pressed, marker 1 is activated as reference
marker (by means of peak search).
The search range can be limited by time lines (
TIME LINE 1/2
) switched on with
SEARCH LIM ON/OFF
The limitation of the search range is valid f or all the marker s earch functions including the SUMMARY
MARKERS and for error calculation during
SYMB TABLE/ERRORS
.
The time lines are only visible for diagr ams vers us time, i.e. not f or polar diagram s and for diagr ams of
SYMB TABLE/ERRORS
. The limitation of the search range is valid for
SEARCH LIMITS ON
for all
diagrams irrespective of whether the time lines are visible or not.
MARKER SEARCH
MARKER
NORMAL SEARCH
DELTA
MKR
menu
MARKER
SEARCH
PEAK
MIN
SUMMARY
MARKER
MAX |PEAK|
+ PEAK
.
MAX |PEAK|
SUM MKR
ON
SEARCH LIM
ON
ACTIVE
MKR DELTA
OFF
SUMMARY
MARKER
OFF
SELECT
The search range can be lim ited by the time lines (TIME LINE 1/2) (softkey
The limitation of the search range extends to all marker search functions including the
MARKER
as well as to error calculation during
SYMB TABLE/ERRORS
- PEAK
+
PEAK/2
-
RMS
MEAN
PEAK HOLD
ON OFF
AVERAGE
ON OFF
SWEEP
COUNT
ALL SUM
MKR OFF
SEARCH LIM ON/OFF)
SUMMARY
.
The time lines are only visible for diagrams versus time, ie not for polar diagrams and for diagrams
representing
SYMB TABLE/ERRORS
. The limitation of the search range during
SEARCH LIM ON
extends to all types of representation, irrespective of whether the time lines are visible or not.
The functions in the
for entries. Softkey
MARKER SEARCH
ACTIVE MKR DELTA
active delta marker. If no mark er is switched on bef ore
menu refer to the mark er or delta marker that is currently active
may be used to switch between the active mark er and the
SEARCH
is pressed, mar ker 1 will be activated
as reference marker (with peak search).
.
1066.4313.02 2.4-73 E-5
Page 100

Search Men FSE
ACTIVE
MKR DELTA
SELECT
MARKER
MAX |PEAK|
PEAK
The
ACTIVE MKR / DELTA
softkey switches over between active mark er
and active delta marker.
With
DELTA
highlighted, subsequent search functions are carried out with
the active delta marker.
Note: Switchover between marker and delta marker entry is also
possible with the NORMAL and DELTA keys.
The
SELECT MARKER
softkey opens the table for selection of the mark er
or delta marker.
The
MAX |PEAK|
highest magnitude displayed (
softkey sets the active marker or delta marker to the
PEAK
or
MIN
) in the associated curve.
For instance, the function searches for the maximum phase error of a
signal, which may be positive or negative.
The
PEAK
softkey sets the active marker or delta marker to the highest
value displayed in the associated measured curve.
MIN
SEARCH LIM
ON OFF
The
MIN
softkey sets the reference marker to the lowest value in the
associated curve.
The
SEARCH LIMIT ON/OFF
switches between limited (ON) and unlim ited
(OFF) search range.
The search range can be limited by time lines (
TIME LINE1/2)
for peak-
and min-search functions as well as for the summary markers.
If
SEARCH LIMIT
is ON, a search for the corresponding signals is only
performed between the two lines.
If only one line is switched on,
upper limit is the stop frequency),
TIME LINE 1
TIME LINE 2
is valid as lower limit (the
defines the upper limit
value.
If no line is active, lines 1 and 2 are switched on automatically and
positioned to 20 % and 80 % of the grid.
If the function is switched off, the lines continue to be switched on.
Time lines are not visible for polar diagrams and for Symb Table/Errors.
The limitation of the search range, however, remains effective.
Default value is
SEARCH LIMIT OFF.
1066.4313.02 2.4-74 E-5
 Loading...