

Page 1
R&S®FPS-K82/-K83
CDMA2000® Measurements
User Manual
(;ÚãW2)
1176.8539.02 ─ 04
User Manual
Test & Measurement
Page 2

This manual applies to the following R&S®FPS models with firmware version 1.50 and higher:
●
R&S®FPS4 (1319.2008K04)
●
R&S®FPS7 (1319.2008K07)
●
R&S®FPS13 (1319.2008K13)
●
R&S®FPS30 (1319.2008K30)
●
R&S®FPS40 (1319.2008K40)
The following firmware options are described:
●
R&S FPS-K82 (1321.4156.02)
●
R&S FPS-K83 (1321.4162.02)
The software contained in this product uses several valuable open source software packages. For information, see the "Open
Source Acknowledgment" on the user documentation CD-ROM (included in delivery).
Rohde & Schwarz would like to thank the open source community for their valuable contribution to embedded computing.
© 2017 Rohde & Schwarz GmbH & Co. KG
Mühldorfstr. 15, 81671 München, Germany
Phone: +49 89 41 29 - 0
Fax: +49 89 41 29 12 164
Email: info@rohde-schwarz.com
Internet: www.rohde-schwarz.com
Subject to change – Data without tolerance limits is not binding.
R&S® is a registered trademark of Rohde & Schwarz GmbH & Co. KG.
CDMA2000® is a registered trademark of the Telecommunications Industry Association (TIA -USA).
Trade names are trademarks of the owners.
The following abbreviations are used throughout this manual: R&S®FPS is abbreviated as R&S FPS. R&S®FPS-K82 / R&S®FPS-K83
is abbreviated as R&S FPS-K82/-K83
Page 3

R&S®FPS-K82/-K83
Contents
1 Preface.................................................................................................... 7
1.1 About this Manual......................................................................................................... 7
1.2 Typographical Conventions.........................................................................................8
2 Welcome to the CDMA2000 Applications............................................ 9
2.1 Starting the CDMA2000 Applications........................................................................10
2.2 Understanding the Display Information....................................................................11
3 Measurements and Result Displays...................................................13
3.1 Code Domain Analysis............................................................................................... 13
3.2 RF Measurements....................................................................................................... 28
4 Measurement Basics........................................................................... 36
Contents
4.1 PCGs and Sets............................................................................................................ 36
4.2 Channels, Codes and Symbols..................................................................................36
4.3 Code Display and Sort Order..................................................................................... 38
4.4 Scrambling via PN Offsets and Long Codes............................................................ 40
4.5 Code Mapping and Branches.....................................................................................40
4.6 Radio Configuration....................................................................................................41
4.7 Transmission with Multiple Carriers and Multiple Antennas..................................41
4.8 Channel Detection and Channel Types.....................................................................43
4.9 Test Setup for CDMA2000 Tests................................................................................46
4.10 CDA Measurements in MSRA Operating Mode........................................................ 48
5 I/Q Data Import and Export..................................................................50
5.1 Import/Export Functions............................................................................................ 50
6 Configuration........................................................................................53
6.1 Result Display............................................................................................................. 53
6.2 Code Domain Analysis............................................................................................... 54
6.3 RF Measurements....................................................................................................... 88
7 Analysis................................................................................................ 94
7.1 Code Domain Analysis Settings................................................................................ 94
7.2 Evaluation Range........................................................................................................ 96
3User Manual 1176.8539.02 ─ 04
Page 4

R&S®FPS-K82/-K83
7.3 Traces...........................................................................................................................98
7.4 Markers........................................................................................................................ 99
8 Optimizing and Troubleshooting the Measurement....................... 106
8.1 Error Messages......................................................................................................... 106
9 How to Perform Measurements in CDMA2000 Applications..........107
10 Measurement Examples.................................................................... 111
10.1 Meas 1: Measuring the Signal Channel Power.......................................................111
10.2 Meas 2: Measuring the Spectrum Emission Mask................................................. 112
10.3 Meas 3: Measuring the Relative Code Domain Power and Frequency Error...... 113
10.4 Meas 4: Measuring the Triggered Relative Code Domain Power......................... 115
10.5 Meas 5: Measuring the Composite EVM................................................................. 116
10.6 Meas 6: Measuring the Peak Code Domain Error and the RHO Factor............... 118
Contents
11 Remote Commands for CDMA2000 Measurements........................120
11.1 Introduction............................................................................................................... 120
11.2 Common Suffixes......................................................................................................125
11.3 Activating the Measurement Channel..................................................................... 125
11.4 Selecting a Measurement......................................................................................... 129
11.5 Configuring Code Domain Analysis........................................................................130
11.6 Configuring RF Measurements................................................................................168
11.7 Configuring the Result Display................................................................................170
11.8 Starting a Measurement........................................................................................... 178
11.9 Retrieving Results.....................................................................................................183
11.10 General Analysis....................................................................................................... 203
11.11 Importing and Exporting I/Q Data and Results...................................................... 215
11.12 Configuring the Slave Application Data Range (MSRA mode only).....................217
11.13 Querying the Status Registers.................................................................................219
11.14 Deprecated Commands............................................................................................ 221
11.15 Programming Examples for CDMA2000 BTS Measurements............................... 223
Annex.................................................................................................. 226
A Annex - Reference Data.....................................................................226
A.1 Reference: Predefined Channel Tables.................................................................. 226
4User Manual 1176.8539.02 ─ 04
Page 5

R&S®FPS-K82/-K83
A.2 Reference: Code Tables........................................................................................... 228
A.3 Reference: Supported Bandclasses........................................................................231
A.4 I/Q Data File Format (iq-tar)......................................................................................232
A.5 Abbreviations............................................................................................................ 238
List of Remote Commands (CDMA2000)......................................... 240
Index....................................................................................................244
Contents
5User Manual 1176.8539.02 ─ 04
Page 6

R&S®FPS-K82/-K83
Contents
6User Manual 1176.8539.02 ─ 04
Page 7

R&S®FPS-K82/-K83
1 Preface
Preface
About this Manual
1.1 About this Manual
This User Manual provides all the information specific to the CDMA2000 applications. All general instrument functions and settings common to all applications and
operating modes are described in the main R&S FPS User Manual.
The main focus in this manual is on the measurement results and the tasks required to
obtain them. The following topics are included:
●
Welcome to the CDMA2000 Measurements Application
Introduction to and getting familiar with the application
●
Measurements and Result Displays
Details on supported measurements and their result types
●
Measurement Basics
Background information on basic terms and principles in the context of the measurement
●
Configuration + Analysis
A concise description of all functions and settings available to configure measurements and analyze results with their corresponding remote control command
●
I/Q Data Import and Export
Description of general functions to import and export raw I/Q (measurement) data
●
Optimizing and Troubleshooting the Measurement
Hints and tips on how to handle errors and optimize the test setup
●
How to Perform Measurements in CDMA2000 Applications
The basic procedure to perform each measurement and step-by-step instructions
for more complex tasks or alternative methods
●
Measurement Examples
Detailed measurement examples to guide you through typical measurement scenarios and allow you to try out the application immediately
●
Remote Commands for CDMA2000 Measurements
Remote commands required to configure and perform CDMA2000 measurements
in a remote environment, sorted by tasks
(Commands required to set up the environment or to perform common tasks on the
instrument are provided in the main R&S FPS User Manual)
Programming examples demonstrate the use of many commands and can usually
be executed directly for test purposes
●
Annex
Reference material
●
List of remote commands
Alpahabetical list of all remote commands described in the manual
●
Index
7User Manual 1176.8539.02 ─ 04
Page 8
R&S®FPS-K82/-K83
Preface
Typographical Conventions
1.2 Typographical Conventions
The following text markers are used throughout this documentation:
Convention Description
"Graphical user interface elements"
KEYS Key names are written in capital letters.
File names, commands,
program code
Input Input to be entered by the user is displayed in italics.
Links Links that you can click are displayed in blue font.
"References" References to other parts of the documentation are enclosed by quota-
All names of graphical user interface elements on the screen, such as
dialog boxes, menus, options, buttons, and softkeys are enclosed by
quotation marks.
File names, commands, coding samples and screen output are distinguished by their font.
tion marks.
8User Manual 1176.8539.02 ─ 04
Page 9

R&S®FPS-K82/-K83
2 Welcome to the CDMA2000 Applications
The CDMA2000 options are firmware applications that add functionality to the
R&S FPS to perform measurements on downlink or uplink signals according to the
CDMA2000 standard.
R&S FPS-K82 performs Base Transceiver Station (BTS) measurements on forward
link signals on the basis of the 3GPP2 Standard (Third Generation Partnership Project
2).
R&S FPS-K83 performs Mobile Station (MS) measurements on reverse link signals on
the basis of the 3GPP2 Standard (Third Generation Partnership Project 2).
The measurements are based on the "Physical Layer Standard for CDMA2000 Spread
Spectrum Systems Release C" of version C.S0002-C V1.0 dated May 2002 and "Recommended Minimum Performance Standard for CDMA2000 Spread Spectrum Base
Stations" of version C.S0010-B dated December 2002. This standard has been adopted by the following authorities with the specified norm:
TIA: TIA/EIA-97-E dated February 2003 (also known as IS-97-E)
Welcome to the CDMA2000 Applications
Reference made to the CDMA2000 specification in the following text alludes to these
standards.
The application firmware R&S FPS-82 supports radio configurations 1 to 5 and 10.
Thus, IS95A/B signals conforming to radio configurations 1&2 can also be measured
with this application firmware. Channels and modulation types of the 1xEV– DV
enhancement are supported as well.
The application firmware R&S FPS-83 supports the radio configurations 3 and 4. Apart
from CDMA2000 reverse link signals, the 1xEV-DV reverse link channels of Release C
are also supported. Code Domain Analysis is also possible at signals where the pilot
channel is active in at least one of the captured power control groups (pilot gating).
In addition to the code domain measurements described in the CDMA2000 standard,
the CDMA2000 applications feature measurements in the spectral range such as channel power, adjacent channel power, occupied bandwidth and spectrum emission mask
with predefined settings.
This user manual contains a description of the functionality that the applications provide, including remote control operation.
Functions that are not discussed in this manual are the same as in the Spectrum application and are described in the R&S FPS User Manual. The latest version is available
for download at the product homepage
http://www2.rohde-schwarz.com/product/FPS.html.
Installation
You can find detailed installation instructions in the R&S FPS Getting Started manual
or in the Release Notes.
9User Manual 1176.8539.02 ─ 04
Page 10
R&S®FPS-K82/-K83
Welcome to the CDMA2000 Applications
Starting the CDMA2000 Applications
2.1 Starting the CDMA2000 Applications
The CDMA2000 measurements require special applications on the R&S FPS.
Manual operation via an external monitor and mouse
Although the R&S FPS does not have a built-in display, it is possible to operate it interactively in manual mode using a graphical user interface with an external monitor and
a mouse connected.
It is recommended that you use the manual mode initially to get familiar with the instrument and its functions before using it in pure remote mode. Thus, this document
describes in detail how to operate the instrument manually using an external monitor
and mouse. The remote commands are described in the second part of the document.
For details on manual operation see the R&S FPS Getting Started manual.
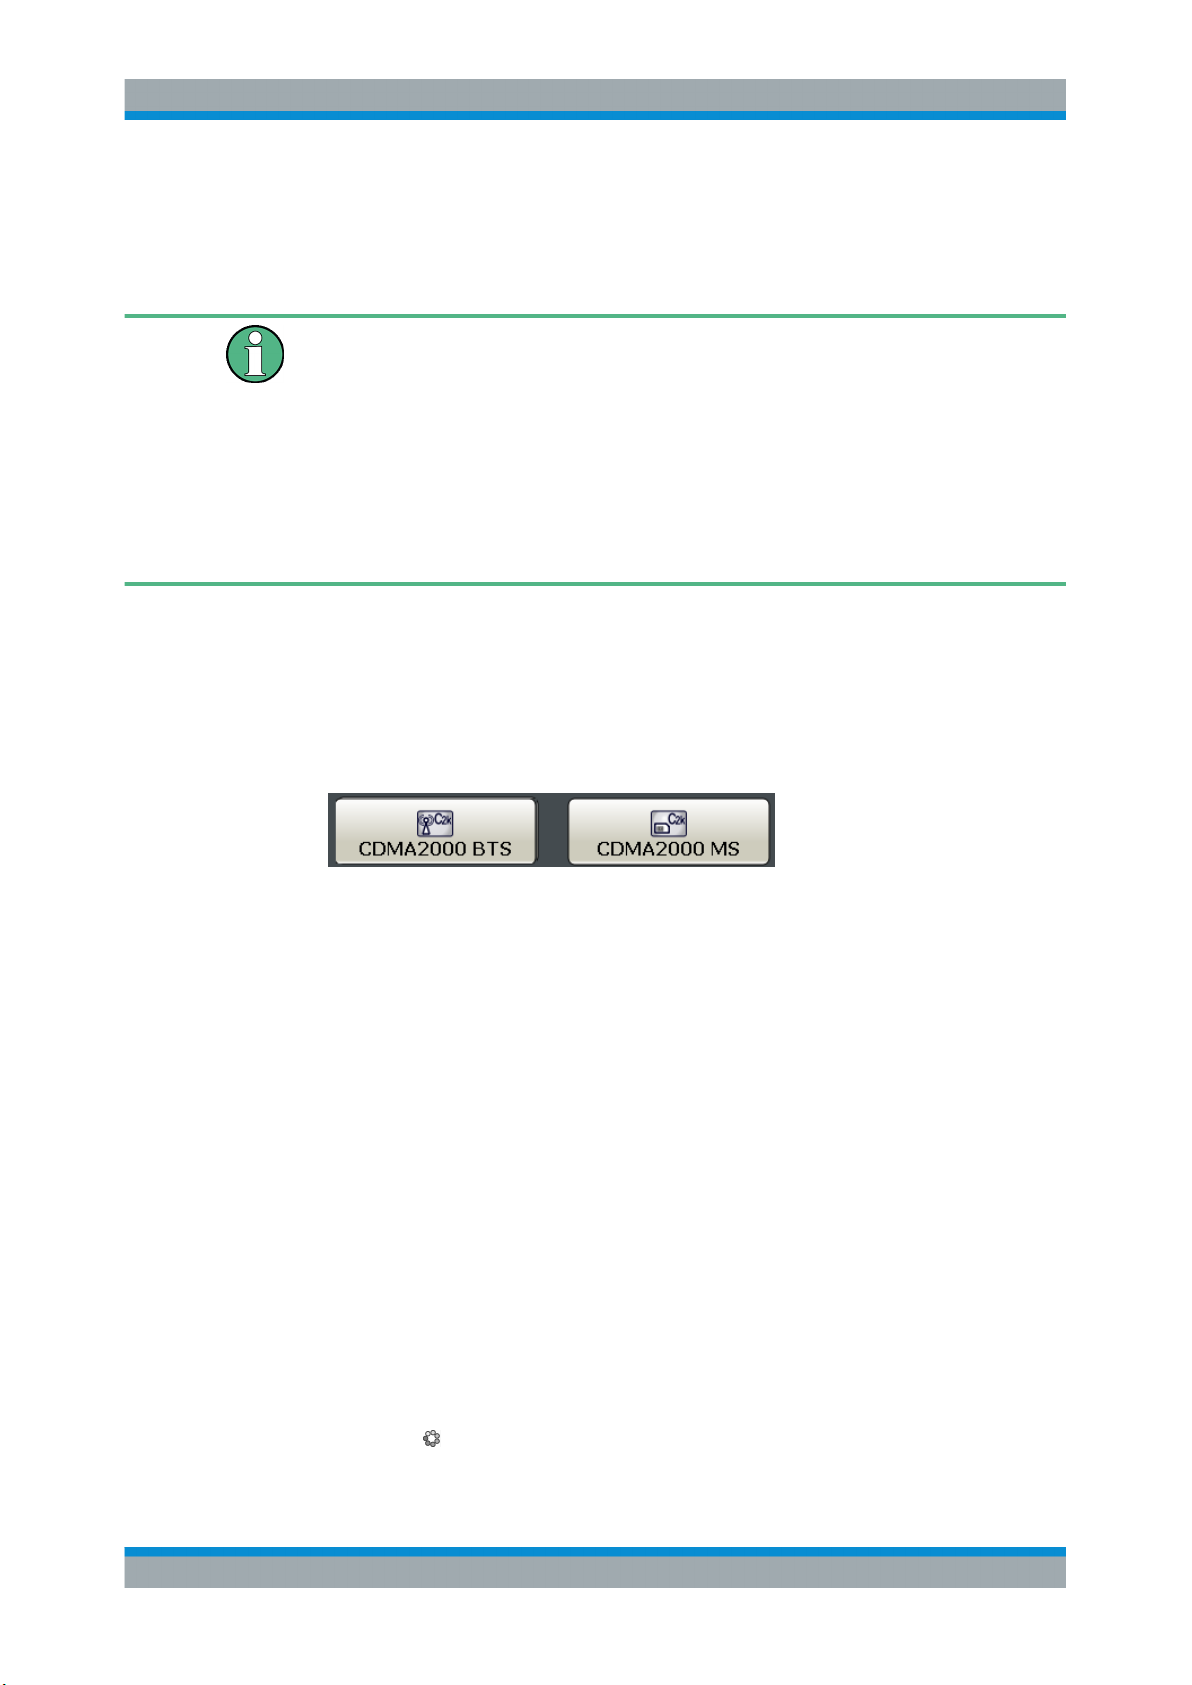
To activate the CDMA2000 applications
1. Press the MODE key.
A dialog box opens that contains all operating modes and applications currently
available on your R&S FPS.
2. Select the "cdma2000 BTS" or "cdma2000 MS" item.
The R&S FPS opens a new measurement channel for the CDMA2000 application.
The measurement is started immediately with the default settings. It can be configured
in the CDMA2000 "Overview" dialog box, which is displayed when you select the
"Overview" softkey from any menu (see Chapter 6.2.1, "Configuration Overview",
on page 55).
Multiple Measurement Channels and Sequencer Function
When you activate a CDMA2000 application, a new measurement channel is created
which determines the measurement settings for that application. The same application
can be activated with different measurement settings by creating several channels for
the same application.
The number of channels that can be configured at the same time depends on the available memory on the instrument.
Only one measurement can be performed at any time, namely the one in the currently
active channel. However, in order to perform the configured measurements consecutively, a Sequencer function is provided.
If activated, the measurements configured in the currently active channels are performed one after the other in the order of the tabs. The currently active measurement is
indicated by a
symbol in the tab label. The result displays of the individual channels
10User Manual 1176.8539.02 ─ 04
Page 11
R&S®FPS-K82/-K83
are updated in the tabs (as well as the "MultiView") as the measurements are performed. Sequential operation itself is independent of the currently displayed tab.
For details on the Sequencer function see the R&S FPS User Manual.
Welcome to the CDMA2000 Applications
Understanding the Display Information
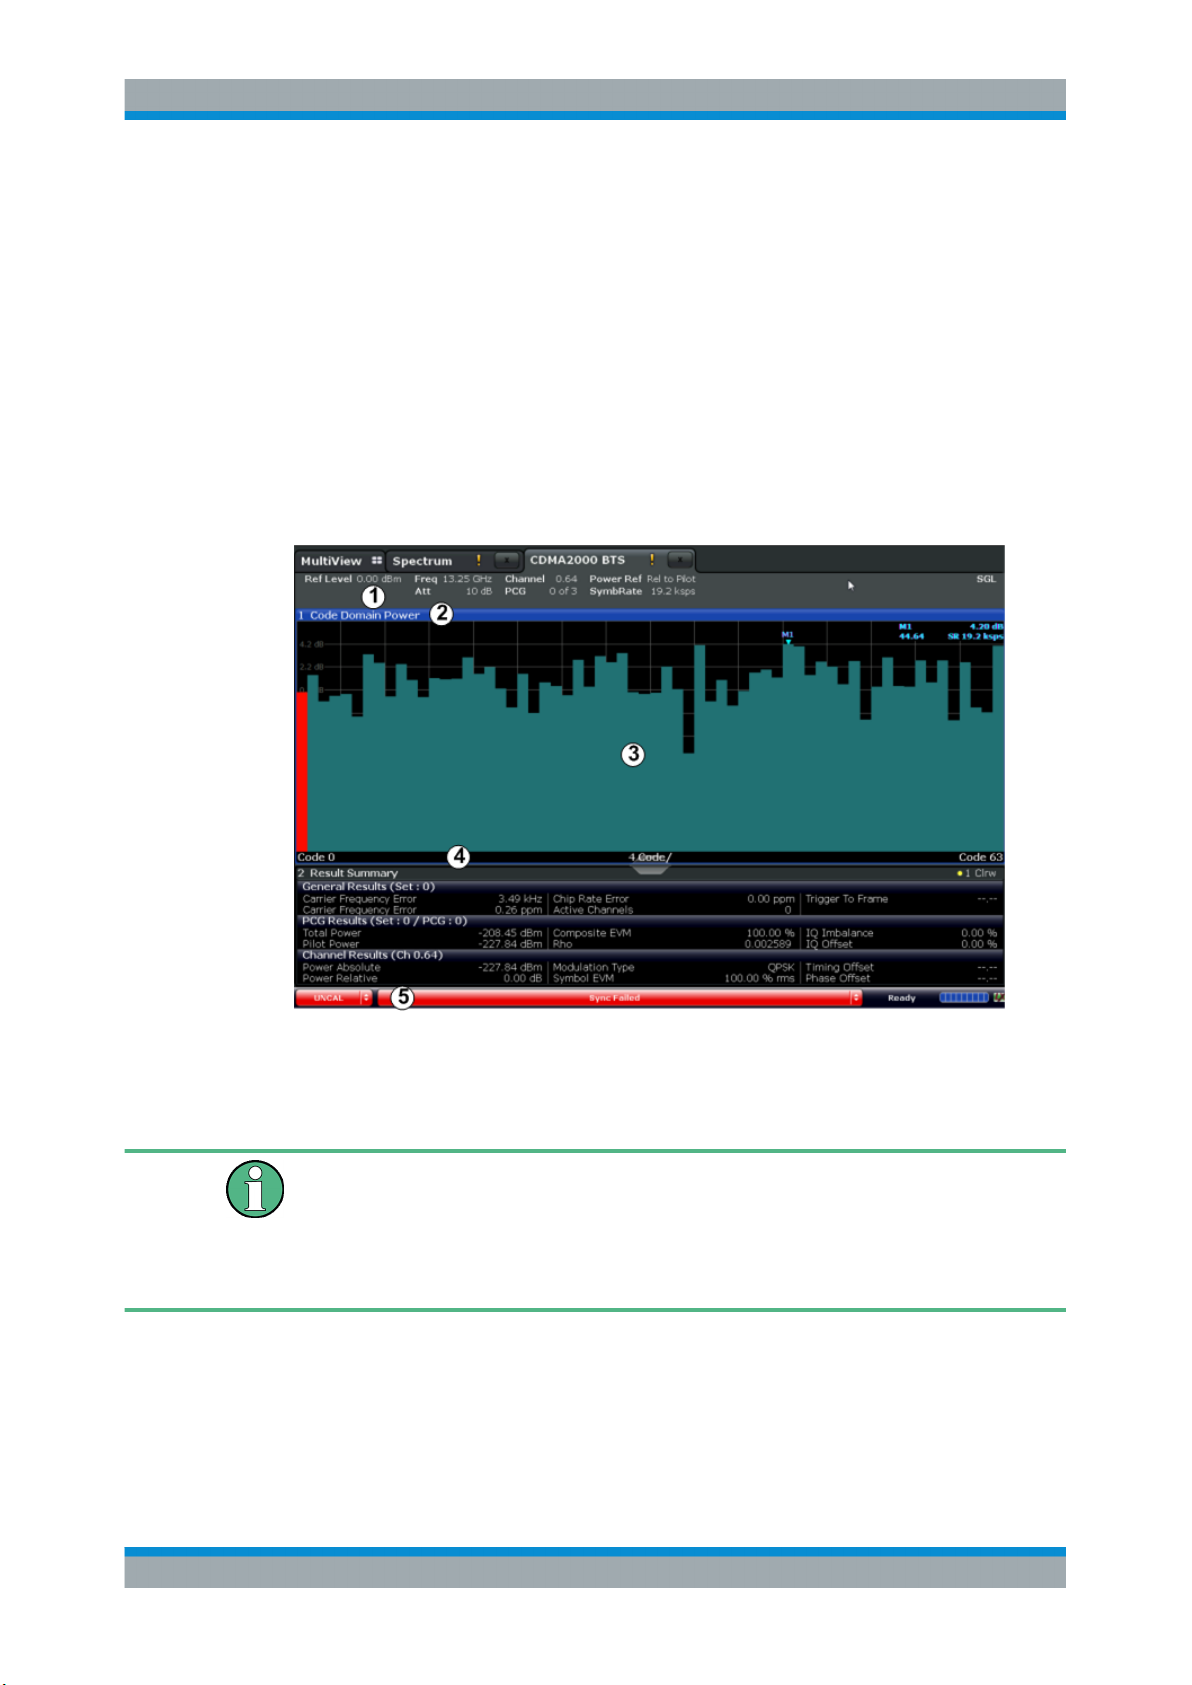
2.2 Understanding the Display Information
The following figure shows a measurement diagram in the CDMA2000 BTS application. All different information areas are labeled. They are explained in more detail in the
following sections.
(The basic screen elements are identical in the CDMA2000 MS application.)
1
= Channel bar for firmware and measurement settings
2 = Window title bar with diagram-specific (trace) information
3 = Diagram area with marker information
4 = Diagram footer with diagram-specific information, depending on measurement
5 = Instrument status bar with error messages, progress bar and date/time display
MSRA operating mode
In MSRA operating mode, additional tabs and elements are available. A colored background of the screen behind the measurement channel tabs indicates that you are in
MSRA operating mode. RF measurements are not available in MSRA operating mode.
For details on the MSRA operating mode see the R&S FPS MSRA User Manual.
Channel bar information
In CDMA2000 applications, the R&S FPS shows the following settings:
11User Manual 1176.8539.02 ─ 04
Page 12

R&S®FPS-K82/-K83
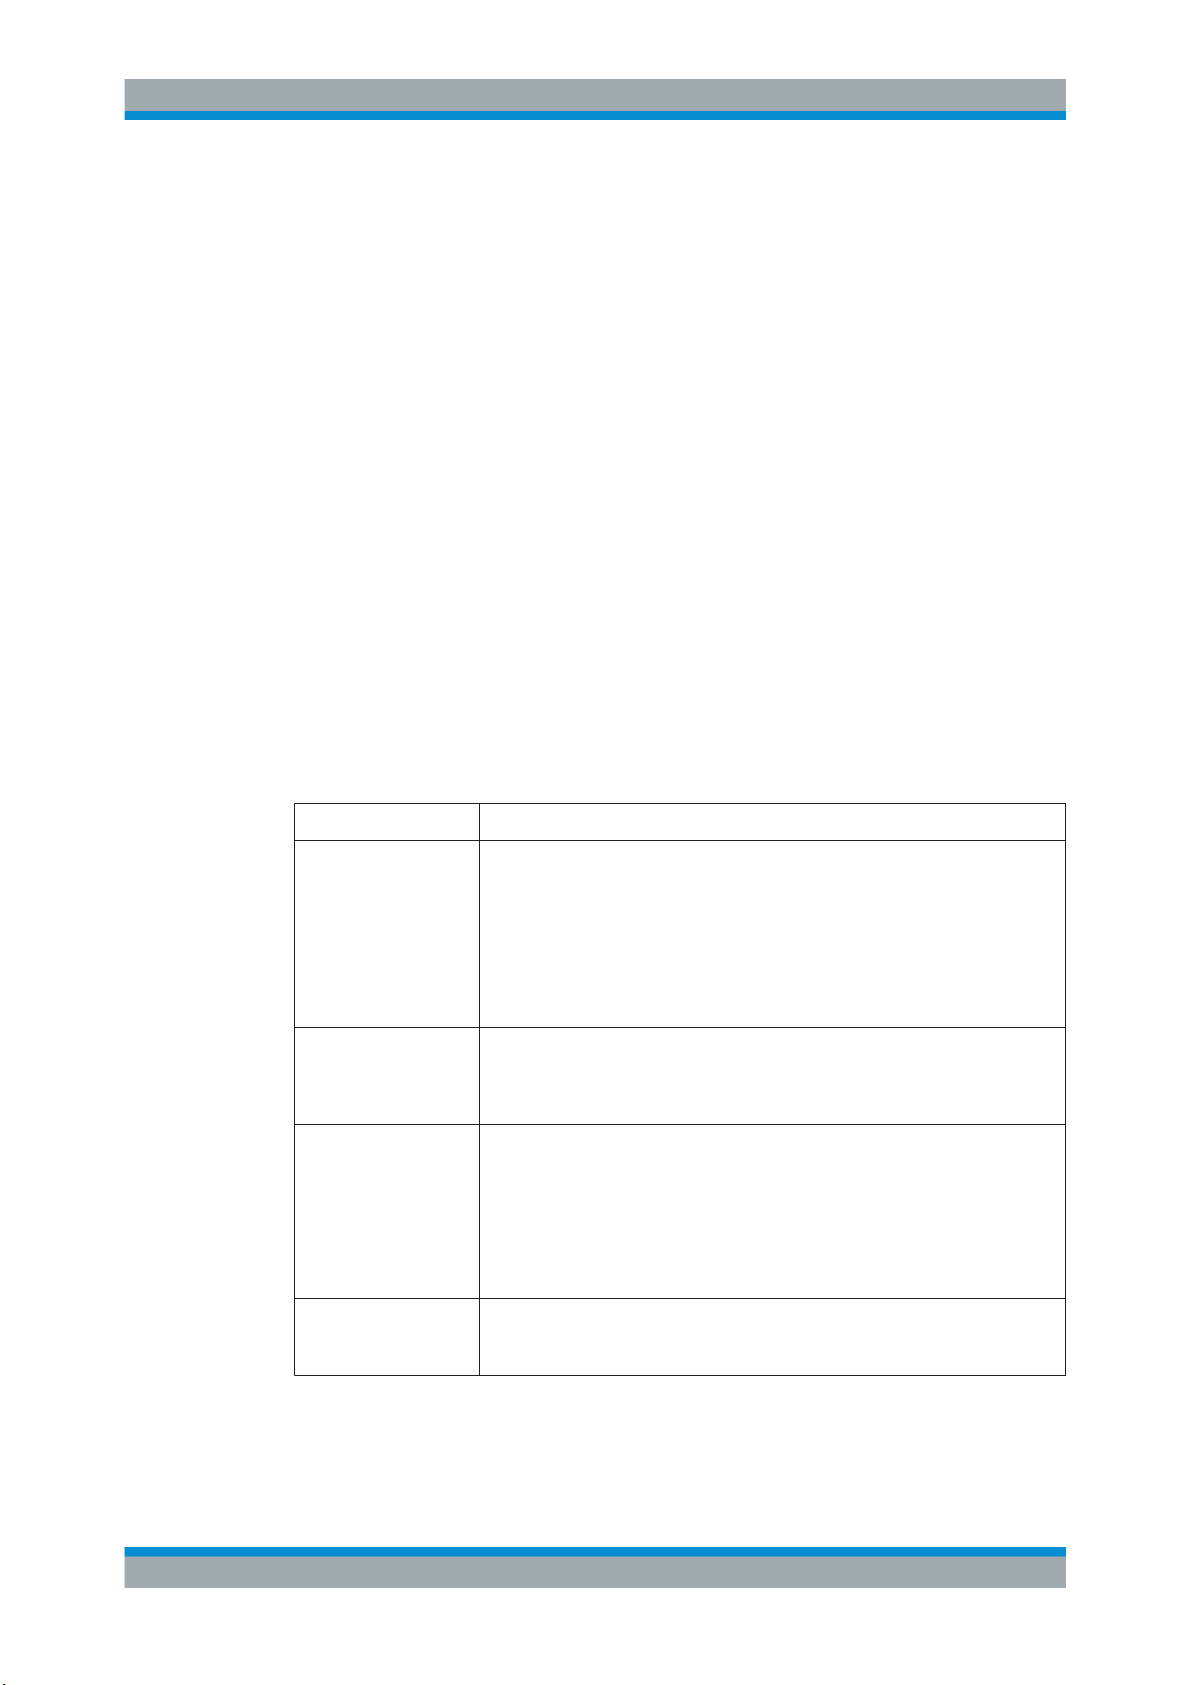
Table 2-1: Information displayed in the channel bar in CDMA2000 applications
Ref Level Reference level
Freq Center frequency for the RF signal
Att Mechanical and electronic RF attenuation
Channel Channel number (code number and spreading factor)
PCG Power control group (see Chapter 4.1, "PCGs and Sets", on page 36)
Power Ref Reference used for power results
SymbRate Symbol rate of the currently selected channel
In addition, the channel bar also displays information on instrument settings that affect
the measurement results even though this is not immediately apparent from the display
of the measured values (e.g. transducer or trigger settings). This information is displayed only when applicable for the current measurement. For details see the
R&S FPS Getting Started manual.
Window title bar information
Welcome to the CDMA2000 Applications
Understanding the Display Information
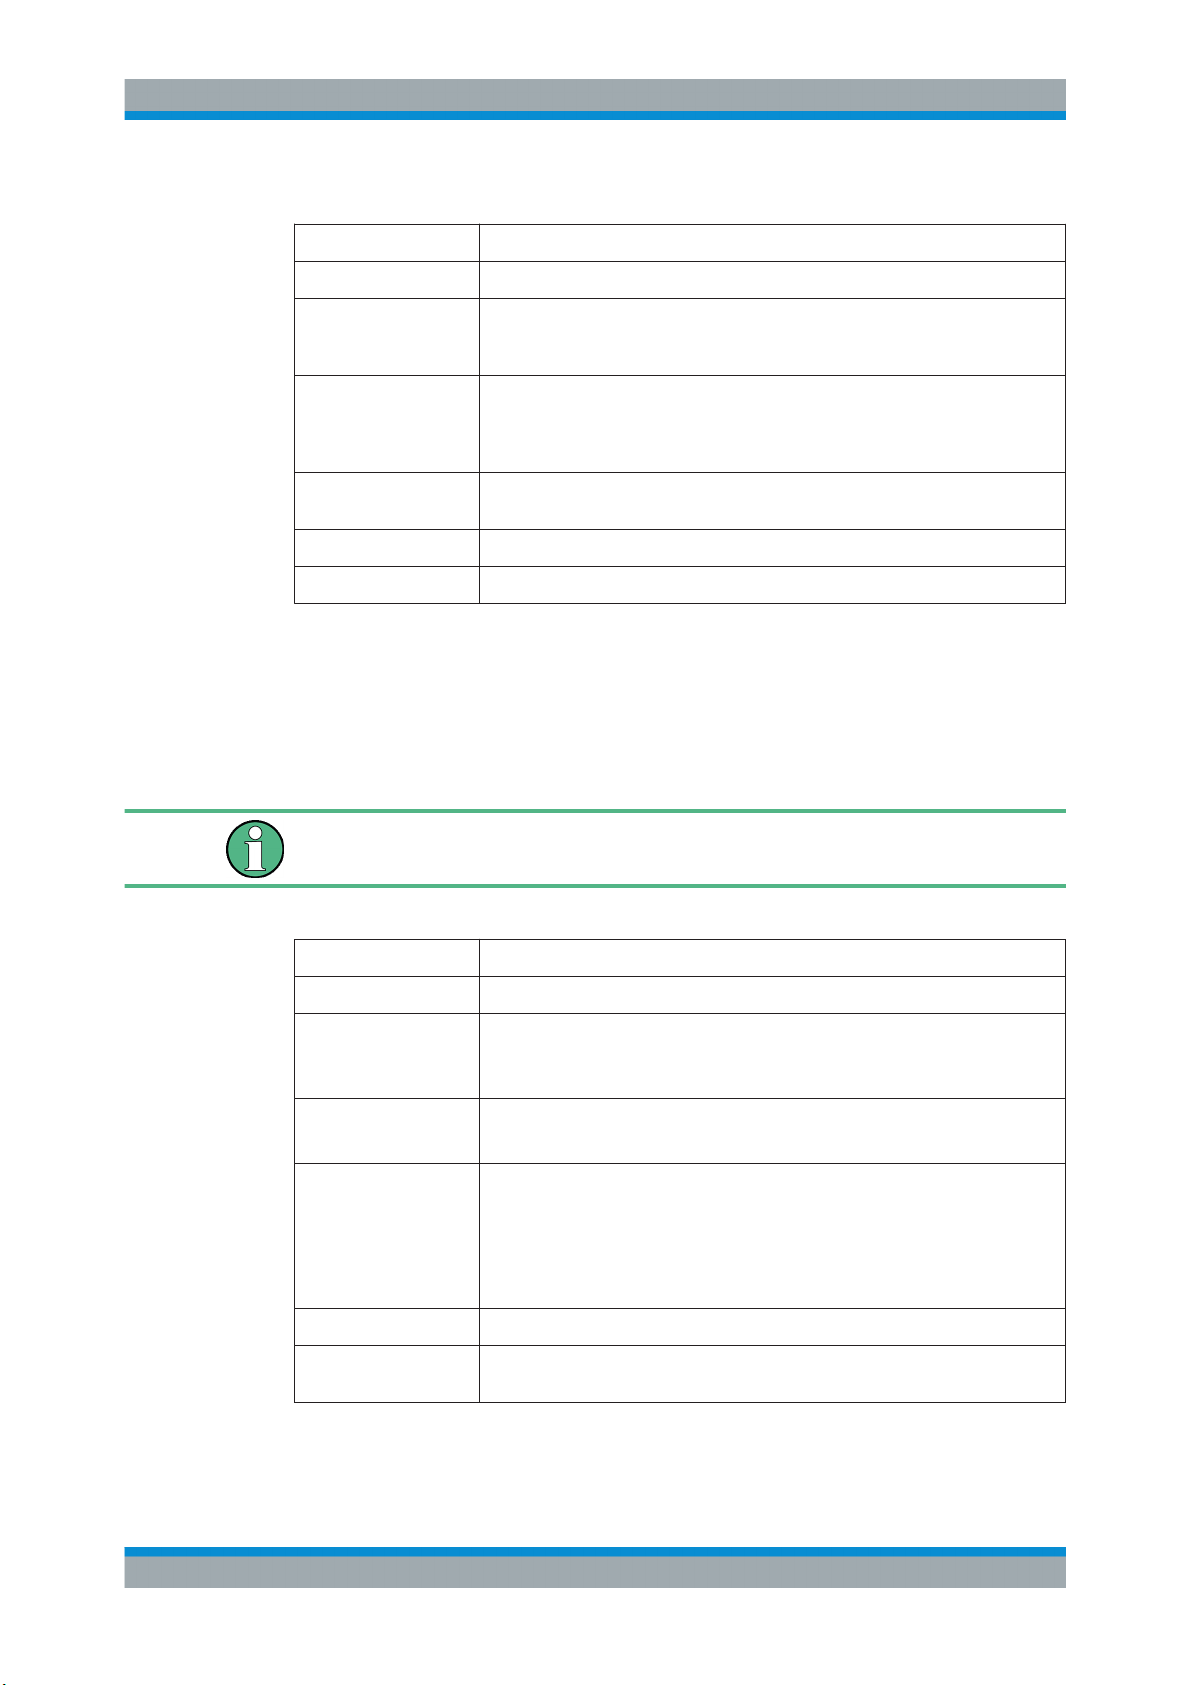
For each diagram, the header provides the following information:
Figure 2-1: Window title bar information in CDMA2000 applications
1 = Window number
2 = Window type
3 = Trace color
4 = Trace number
5 = Detector
Diagram footer information
The diagram footer (beneath the diagram) contains the following information, depending on the evaluation:
Status bar information
Global instrument settings, the instrument status and any irregularities are indicated in
the status bar beneath the diagram. Furthermore, the progress of the current operation
is displayed in the status bar.
12User Manual 1176.8539.02 ─ 04
Page 13

R&S®FPS-K82/-K83
3 Measurements and Result Displays
Access: "Overview" > "Select Measurement"
The CDMA2000 applications provide several different measurements for signals
according to the CDMA2000 standard. The main and default measurement is Code
Domain Analysis. In addition to the code domain power measurements specified by the
CDMA2000 standard, the CDMA2000 applications offer measurements with predefined
settings in the frequency domain, e.g. RF power measurements.
For details on selecting measurements, see "Selecting the measurement type"
on page 53.
Evaluation methods
The captured and processed data for each measurement can be evaluated with various different methods. All evaluation methods available for the selected CDMA2000
measurement are displayed in the evaluation bar in SmartGrid mode.
The evaluation methods for CDA are described in Chapter 3.1.2, "Evaluation Methods
for Code Domain Analysis", on page 16.
Measurements and Result Displays
Code Domain Analysis
● Code Domain Analysis............................................................................................13
● RF Measurements...................................................................................................28
3.1 Code Domain Analysis
Access: "Overview" > "Select Measurement" > "Code Domain Analyzer"
The CDMA2000 firmware applications feature a Code Domain Analyzer. It can be used
used to perform the measurements required in the CDMA2000 standards with regard
to the power of the different codes and code channels (concentrated codes). In addition, the modulation quality (EVM and RHO factor), frequency errors and trigger–to–
frame time, as well as the peak code domain errors are determined. Constellation evaluations and bitstream evaluations are also available. Furthermore, the timing and
phase offsets of the channels to the pilot can also be calculated. The observation
period can be set as multiples of the power control group (PCG).
Basically, the firmware differentiates between the following result classes for the evaluations:
●
Results which take the overall signal into account over the whole observation
period (all PCGs)
●
Results which take the overall signal into account over a power control group
(PCG)
●
Results which take one channel into account over the whole observation period (all
PCGs)
●
Results which take one channel into account over a power control group (PCG)
13User Manual 1176.8539.02 ─ 04
Page 14
R&S®FPS-K82/-K83
Remote command:
CONF:CDP:MEAS CDP, see CONFigure:CDPower[:BTS]:MEASurement
on page 129
● Code Domain Parameters.......................................................................................14
● Evaluation Methods for Code Domain Analysis......................................................16
Measurements and Result Displays
Code Domain Analysis
3.1.1 Code Domain Parameters
In the Result Summary, three different types of measurement results are determined
and displayed:
●
General results for the current set
●
PCG results for the current set and PCG
●
Channel results for the selected channel
In the Channel Table, channel results for all channels are displayed.
General Results
Under "General Results", the measurement results that concern the total signal (that is,
all channels) for the entire period of observation (that is, all PCGs) are displayed:
Table 3-1: General code domain power results for the current set
Parameter Description
Carrier Frequency Error Shows the frequency error referred to the center frequency of the R&S FPS. The
absolute frequency error is the sum of the frequency error of the R&S FPS and
that of the device under test. Frequency differences between the transmitter and
receiver of more than 1.0 kHz impair synchronization of the Code Domain Power
measurement. It is strongly recommended that you synchronize the transmitter
and the receiver.
The frequency error is available in the units Hz or ppm referred to the carrier frequency.
Chip Rate Error Shows the chip rate error (1.2288 Mcps) in ppm. A large chip rate error results in
symbol errors and, therefore, in possible synchronization errors for Code
Domain Power measurements. This measurement result is also valid if the
R&S FPS could not synchronize to the CDMA2000 signal.
Trigger to Frame Reflects the time offset from the beginning of the recorded signal section to the
start of the first PCG. In case of triggered data recording, this corresponds to the
timing offset:
timing offset = frame trigger (+ trigger offset) – start of first PCG
If it was not possible to synchronize the R&S FPS to the CDMA2000 signal, this
measurement result is meaningless. For the "Free Run" trigger mode, dashes
are displayed.
Active Channels Specifies the number of active channels found in the signal. Detected data chan-
nels as well as special channels are regarded as active. With transmit diversity,
the result applies to the selected Antenna Diversity - Antenna Number.
PCG Results
PCG results concern the total signal (that is, all channels) for the selected PCG.
14User Manual 1176.8539.02 ─ 04
Page 15
R&S®FPS-K82/-K83
Table 3-2: Code domain power results for the current PCG
Parameter Description
Total Power Shows the total power of the signal.
Pilot Power Shows the power of the pilot channel. If antenna 2 is selected, the power of the
RHO Shows the quality parameter RHO. According to the CDMA2000 standard, RHO
Composite EVM The composite EVM is the difference between the test signal and the ideal refer-
IQ Imbalance Shows the IQ imbalance of the signal in %.
Offset Shows the IQ offset of the signal in %.
Channel results
Measurements and Result Displays
Code Domain Analysis
F-TDPICH is displayed, in all other cases that of the F-PICH. For details on
antenna selection, refer to "Antenna Diversity - Antenna Number" on page 58.
is the normalized, correlated power between the measured and the ideally generated reference signal. When RHO is measured, the CDMA2000 standard
requires that only the pilot channel be supplied.
ence signal. For further details, refer to the Composite EVM result display.
In the Result Summary, channel results of the selected channel and the selected PCG
are displayed.
In the Channel Table, channel results for all channels are displayed. For details, see
"Channel Table" on page 17.
Not all channel results displayed in the Result Summary are also displayed in the
Channel Table and vice versa.
Table 3-3: Channel-specific parameters
Parameter Description
Channel Channel number including the spreading factor (in the form <Channel>.<SF>)
Modulation Type (BTS application only):
Displays the modulation type of the channel and PCG: BPSK, QPSK, 8PSK, or
16QAM
Mapping (MS application only):
Indicates the selected branch (I or Q)
Phase Offset Phase offset between the selected channel and the pilot channel
If enabled (see "Timing and phase offset calculation " on page 95), the maximum value of the phase offset is displayed together with the associated channel
in the last two lines. Since the phase offset values of each active channel can be
either negative or positive, the absolute values are compared and the maximum
is displayed with the original sign.
Power Absolute Absolute (dBm) power of the channel
Power Relative Relative (dB) power of the channel (refers either to the pilot channel or the total
power of the signal)
15User Manual 1176.8539.02 ─ 04
Page 16
R&S®FPS-K82/-K83
Parameter Description
Symbol EVM Peak or mean value of the EVM measurement result
Timing Offset Timing offset between the selected channel and the pilot channel
Measurements and Result Displays
Code Domain Analysis
For further details, refer to the result display "Symbol EVM" on page 27.
If enabled (see "Timing and phase offset calculation " on page 95), the maximum value of the timing offset is displayed together with the associated channel
in the last two lines. Since the timing offset values of each active channel can be
either negative or positive, the absolute values are compared and the maximum
is displayed with the original sign.
3.1.2 Evaluation Methods for Code Domain Analysis
Access: "Overview" > "Display Config"
The captured I/Q data can be evaluated using various different methods without having
to start a new measurement. All evaluation methods available for the selected
CDMA2000 measurement are displayed in the evaluation bar in SmartGrid mode.
The selected evaluation not only affects the result display, but also the results of the
trace data query (see TRACe<n>[:DATA]? on page 186).
The Code Domain Analyzer provides the following evaluation methods for measurements in the code domain:
Bitstream.......................................................................................................................16
Channel Table...............................................................................................................17
└ Table Configuration.........................................................................................18
Code Domain Power / Code Domain Error Power........................................................19
Composite Constellation............................................................................................... 20
Composite EVM............................................................................................................ 21
Mag Error vs Chip......................................................................................................... 22
Peak Code Domain Error..............................................................................................23
Phase Error vs Chip......................................................................................................23
Power vs PCG...............................................................................................................25
Power vs Symbol.......................................................................................................... 25
Result Summary............................................................................................................26
Symbol Constellation.................................................................................................... 26
Symbol EVM................................................................................................................. 27
Symbol Magnitude Error............................................................................................... 27
Symbol Phase Error......................................................................................................28
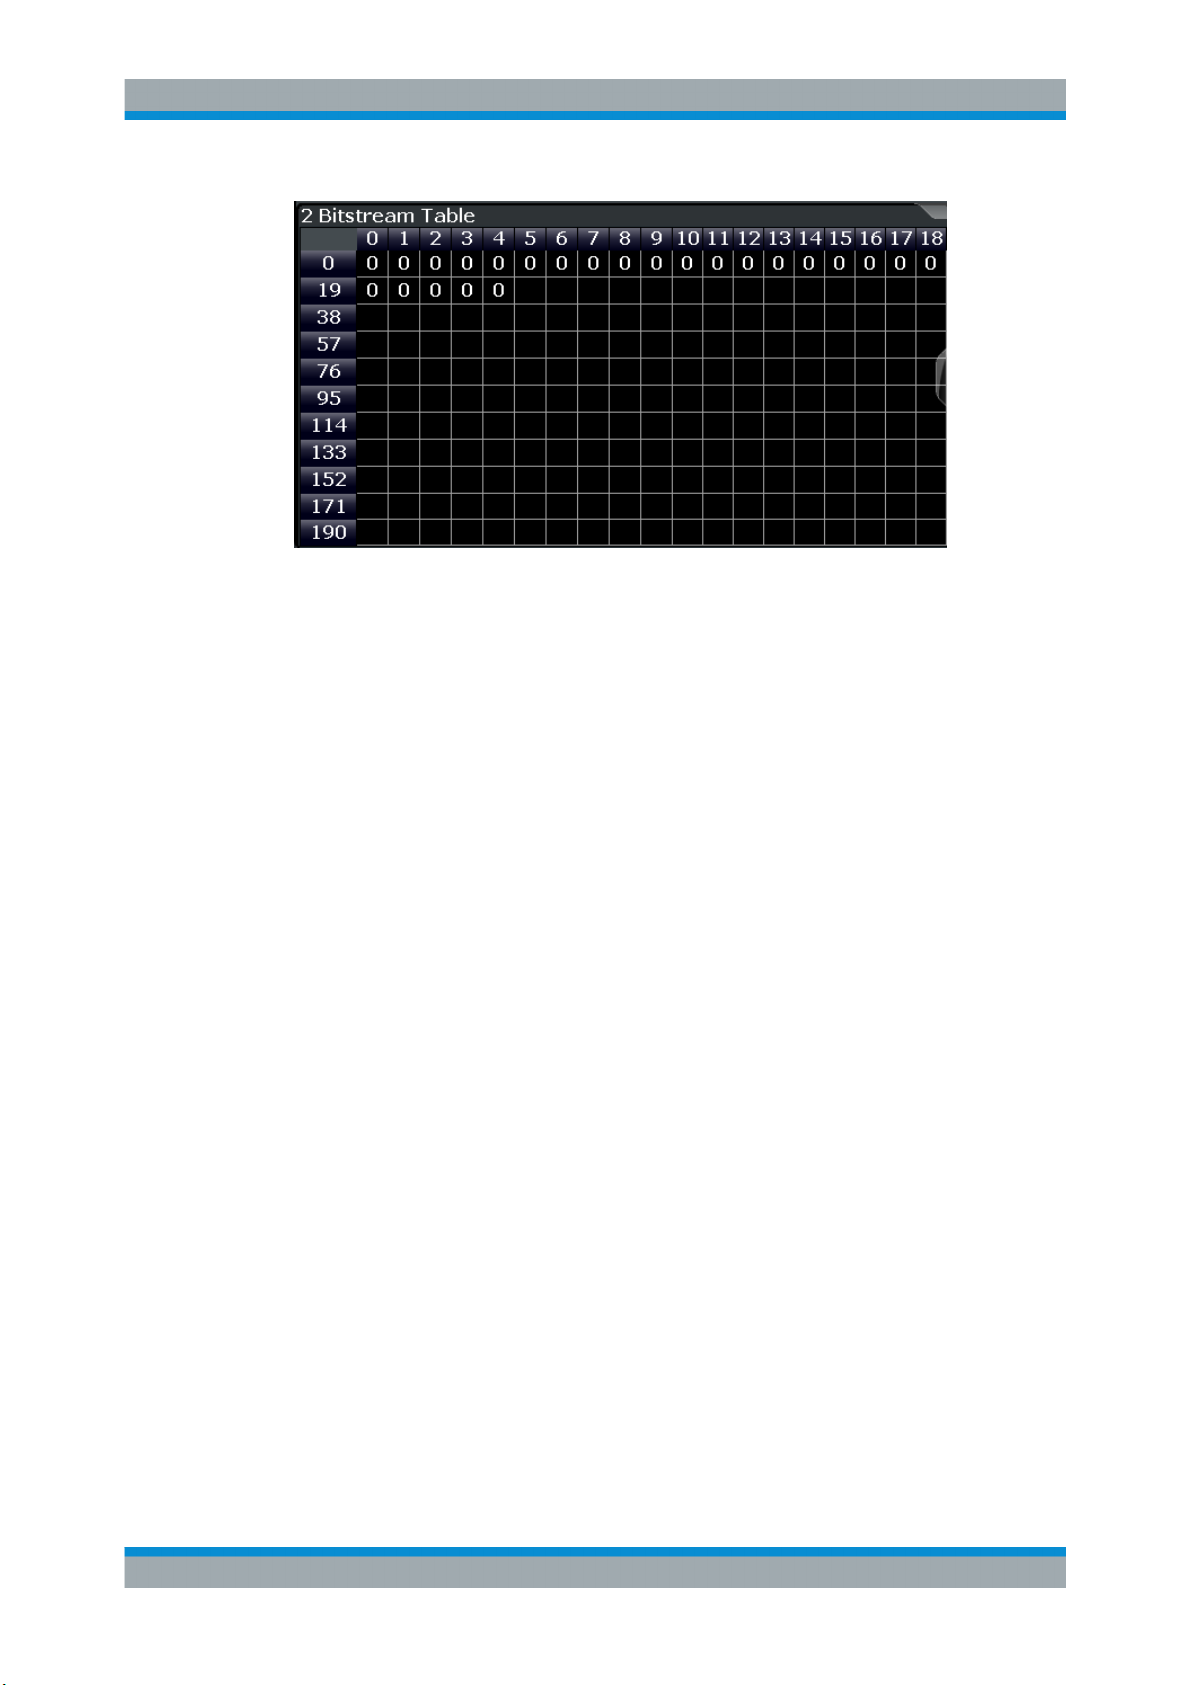
Bitstream
The "Bitstream" evaluation displays the demodulated bits of a selected channel over a
selected PCG.
All bits that are part of inactive channels are marked as being invalid using dashes.
16User Manual 1176.8539.02 ─ 04
Page 17
R&S®FPS-K82/-K83
Figure 3-1: Bitstream result display for the BTS application
To select a specific symbol, press the MKR key. If you enter a number, the marker
jumps to the selected symbol. If there are more symbols than the screen can display,
use the marker to scroll inside the list.
The number of symbols per PCG depends on the spreading factor (symbol rate) and
the antenna diversity. The number of bits per symbol depends on the modulation type.
For details, see Chapter 4, "Measurement Basics", on page 36.
Remote command:
LAY:ADD? '1',RIGH, 'XTIM:CDP:BSTR', see LAYout:ADD[:WINDow]?
on page 171
Measurements and Result Displays
Code Domain Analysis
Channel Table
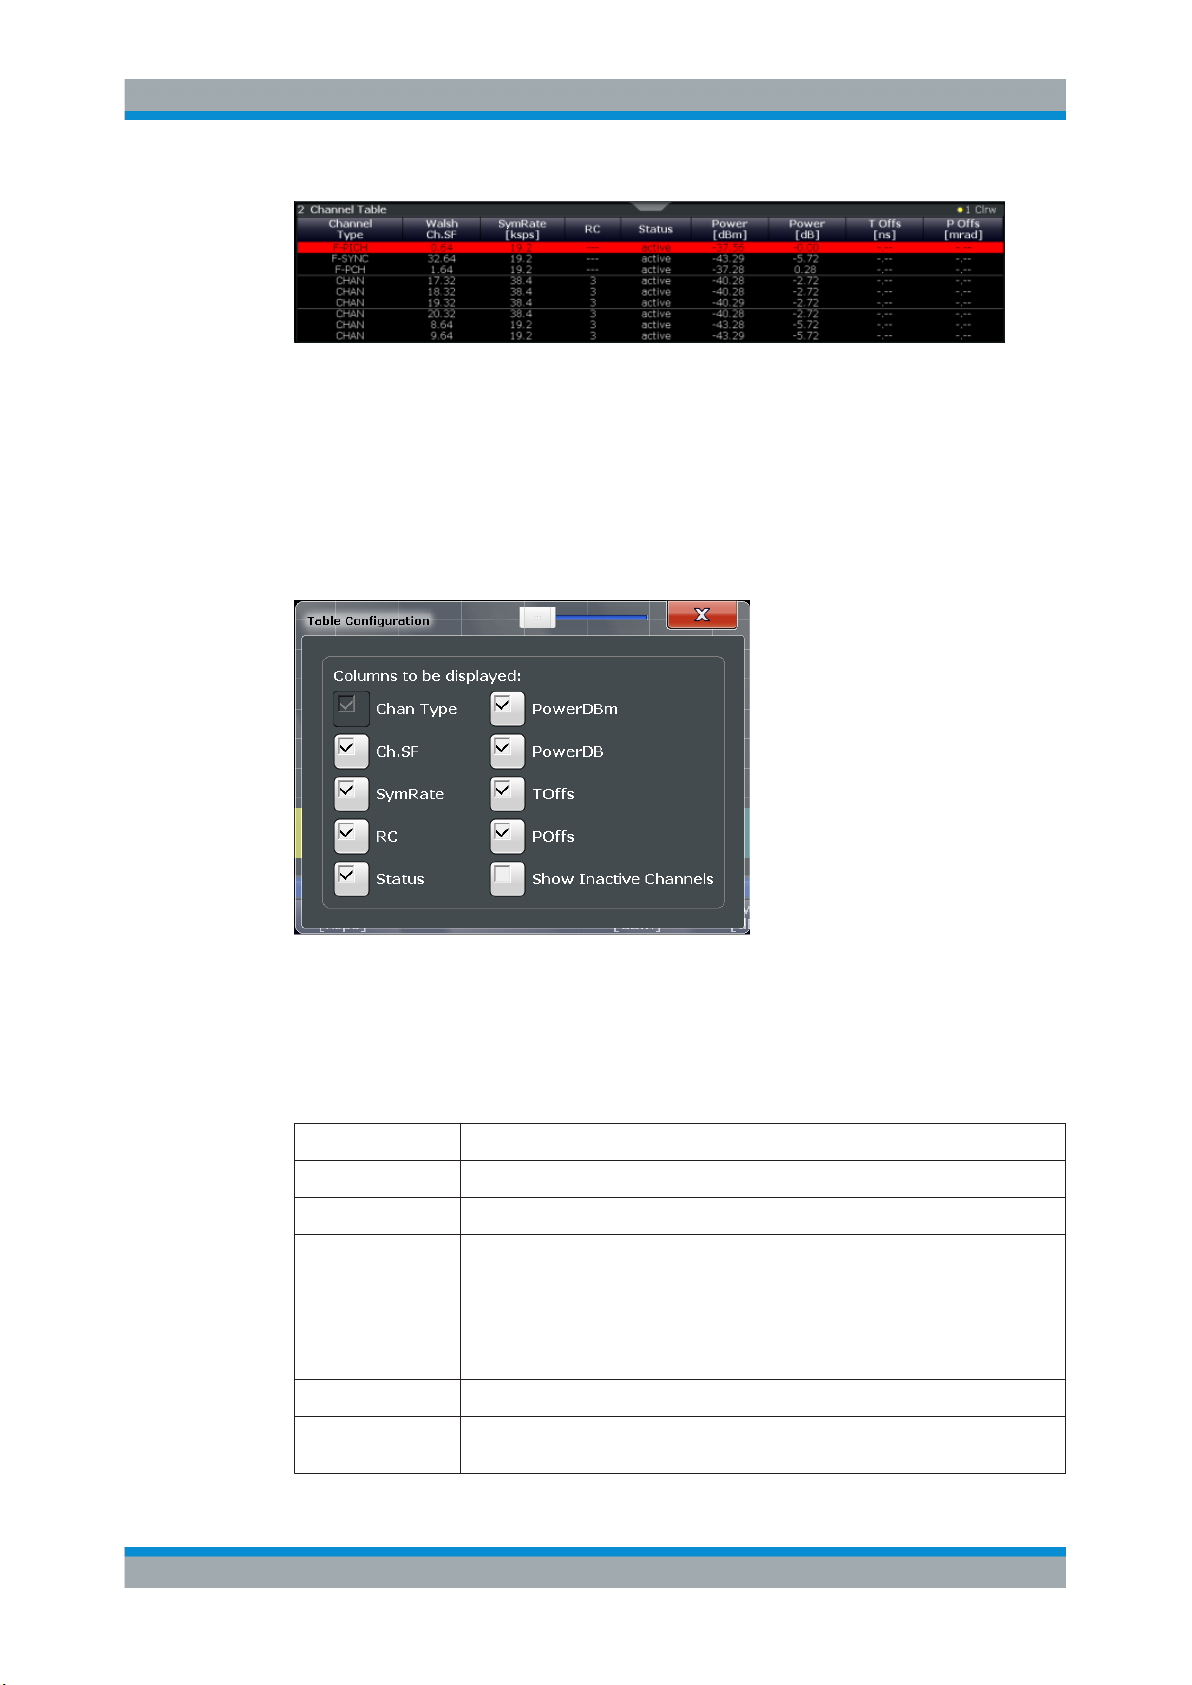
The "Channel Table" evaluation displays the detected channels and the results of the
code domain power measurement over the selected PCG. The analysis results for all
channels are displayed. Thus, the Channel Table can contain up to 128 entries, corresponding to the highest base spreading factor of 128.
The first entries of the table indicate the channels that must be available in the signal to
be analyzed and any other control channels (PICH, SYNC etc.).
The lower part of the table indicates the data channels that are contained in the signal.
If the type of a channel can be fully recognized, based on pilot sequences or modula-
tion type, the type is indicated in the table. In the BTS application, all other channels
are of type CHAN.
The channels are in descending order according to symbol rates and, within a symbol
rate, in ascending order according to the channel numbers. Therefore, the inactive
codes are always displayed at the end of the table (if "Show inactive channels" is
enabled, see "Table Configuration" on page 18.
17User Manual 1176.8539.02 ─ 04
Page 18
R&S®FPS-K82/-K83
Figure 3-2: Channel Table display for the BTS application
Remote command:
LAY:ADD? '1',RIGH, CTABle, see LAYout:ADD[:WINDow]? on page 171
Table Configuration ← Channel Table
You can configure which parameters are displayed in the Channel Table by doubleclicking the table header. A "Table Configuration" dialog box is displayed in which you
select the columns to be displayed.
Measurements and Result Displays
Code Domain Analysis
By default, only active channels are displayed. To display all channels, including the
inactive ones, enable the "Show Inactive Channels" option.
The following parameters of the detected channels are determined by the CDP measurement and can be displayed in the Channel Table result display. (For details, see
Chapter 3.1.1, "Code Domain Parameters", on page 14.)
Table 3-4: Code domain power results in the channel table
Parameter Description
Channel Type Shows the channel type ('---' for inactive channels)
Walsh Ch.SF Channel number including the spreading factor (in the form <Channel>.<SF>)
(P Offs [mrad]) Phase offset between the selected channel and the pilot channel
If enabled (see "Timing and phase offset calculation " on page 95), the maximum
value of the phase offset is displayed together with the associated channel in the
last two lines. Since the phase offset values of each active channel can be either
negative or positive, the absolute values are compared and the maximum is displayed with the original sign.
Pwr [dBm]) Absolute (dBm) power of the channel
Pwr [dB] Relative (dB) power of the channel (refers either to the pilot channel or the total
power of the signal)
18User Manual 1176.8539.02 ─ 04
Page 19
R&S®FPS-K82/-K83
Parameter Description
RC (BTS application only):
Mapping (MS application only):
Status Channel status; Unassigned codes are identified as inactive channels
Symbol Rate [ksps] Symbol rate at which the channel is transmitted (9.6 ksps to 307.2 ksps)
(T Offs [ns]) Timing offset between the selected channel and the pilot channel
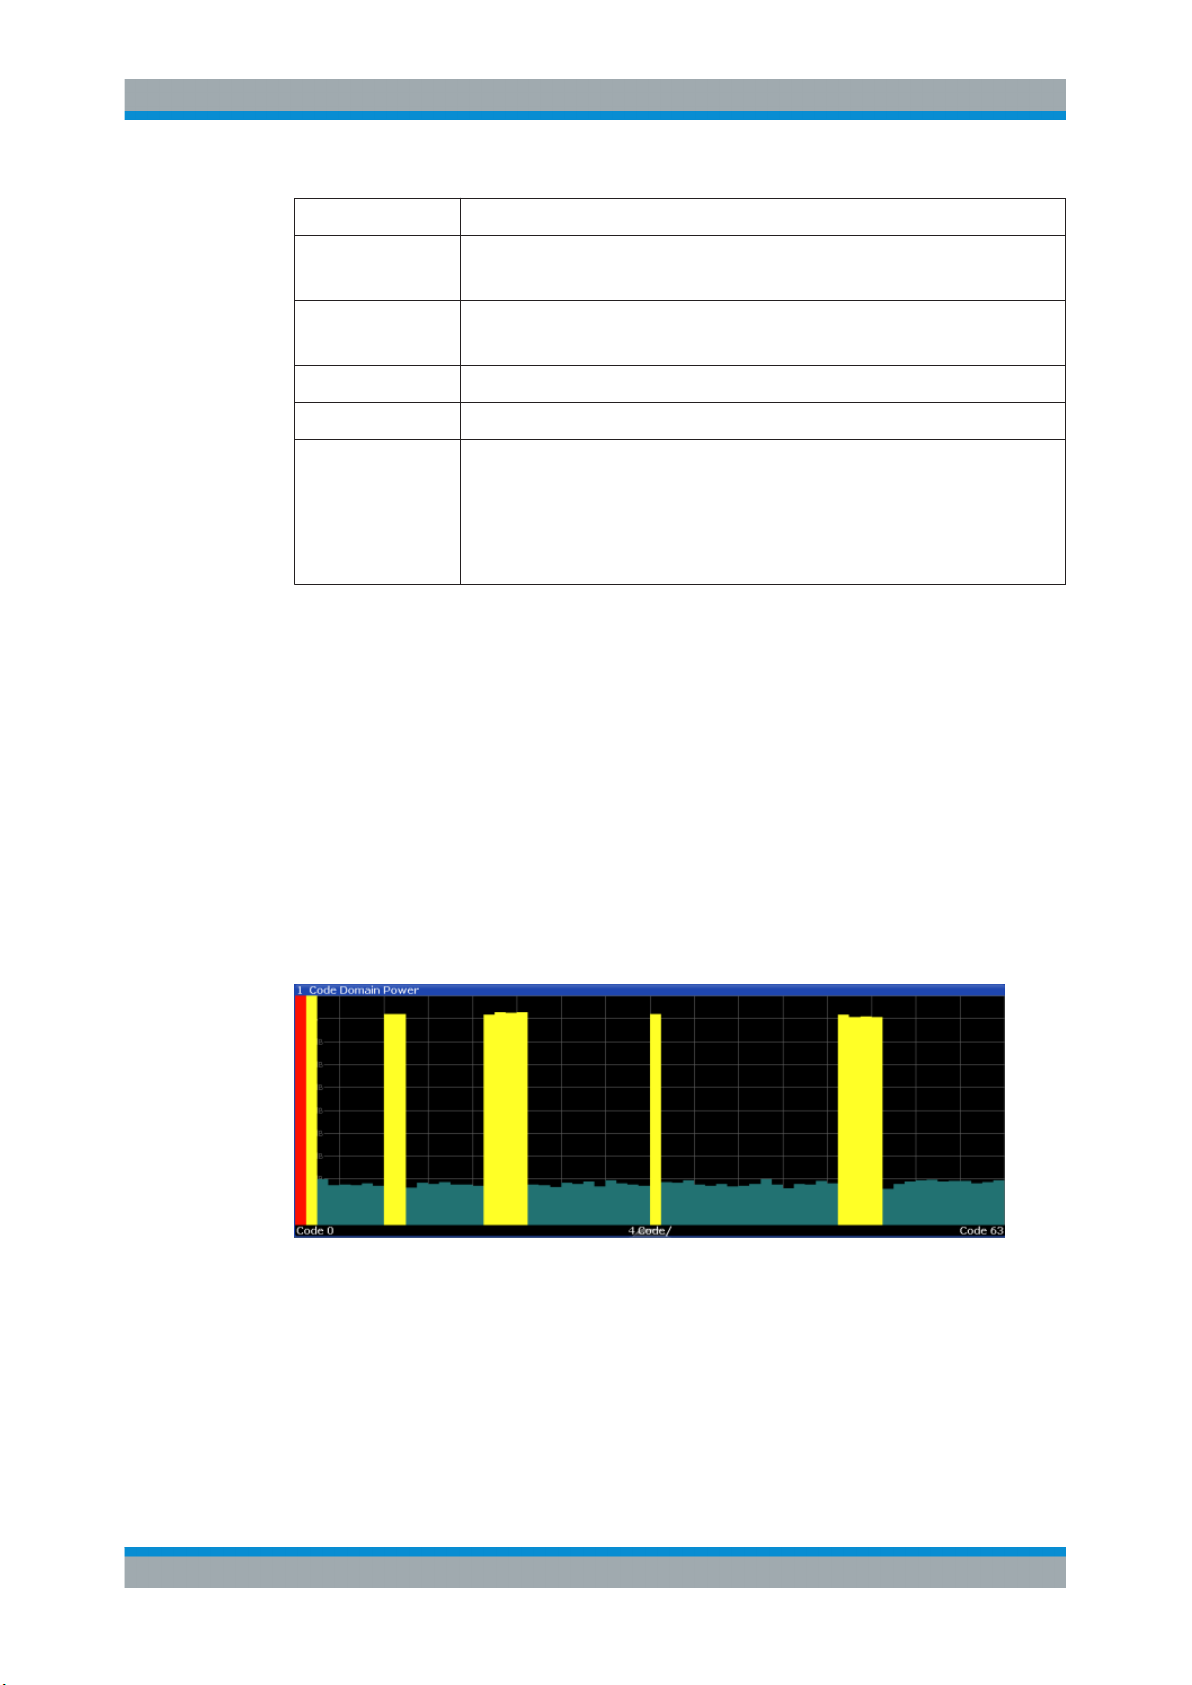
Code Domain Power / Code Domain Error Power
The "Code Domain Power" evaluation shows the power of all possible code channels
in the total signal over the selected PCG.
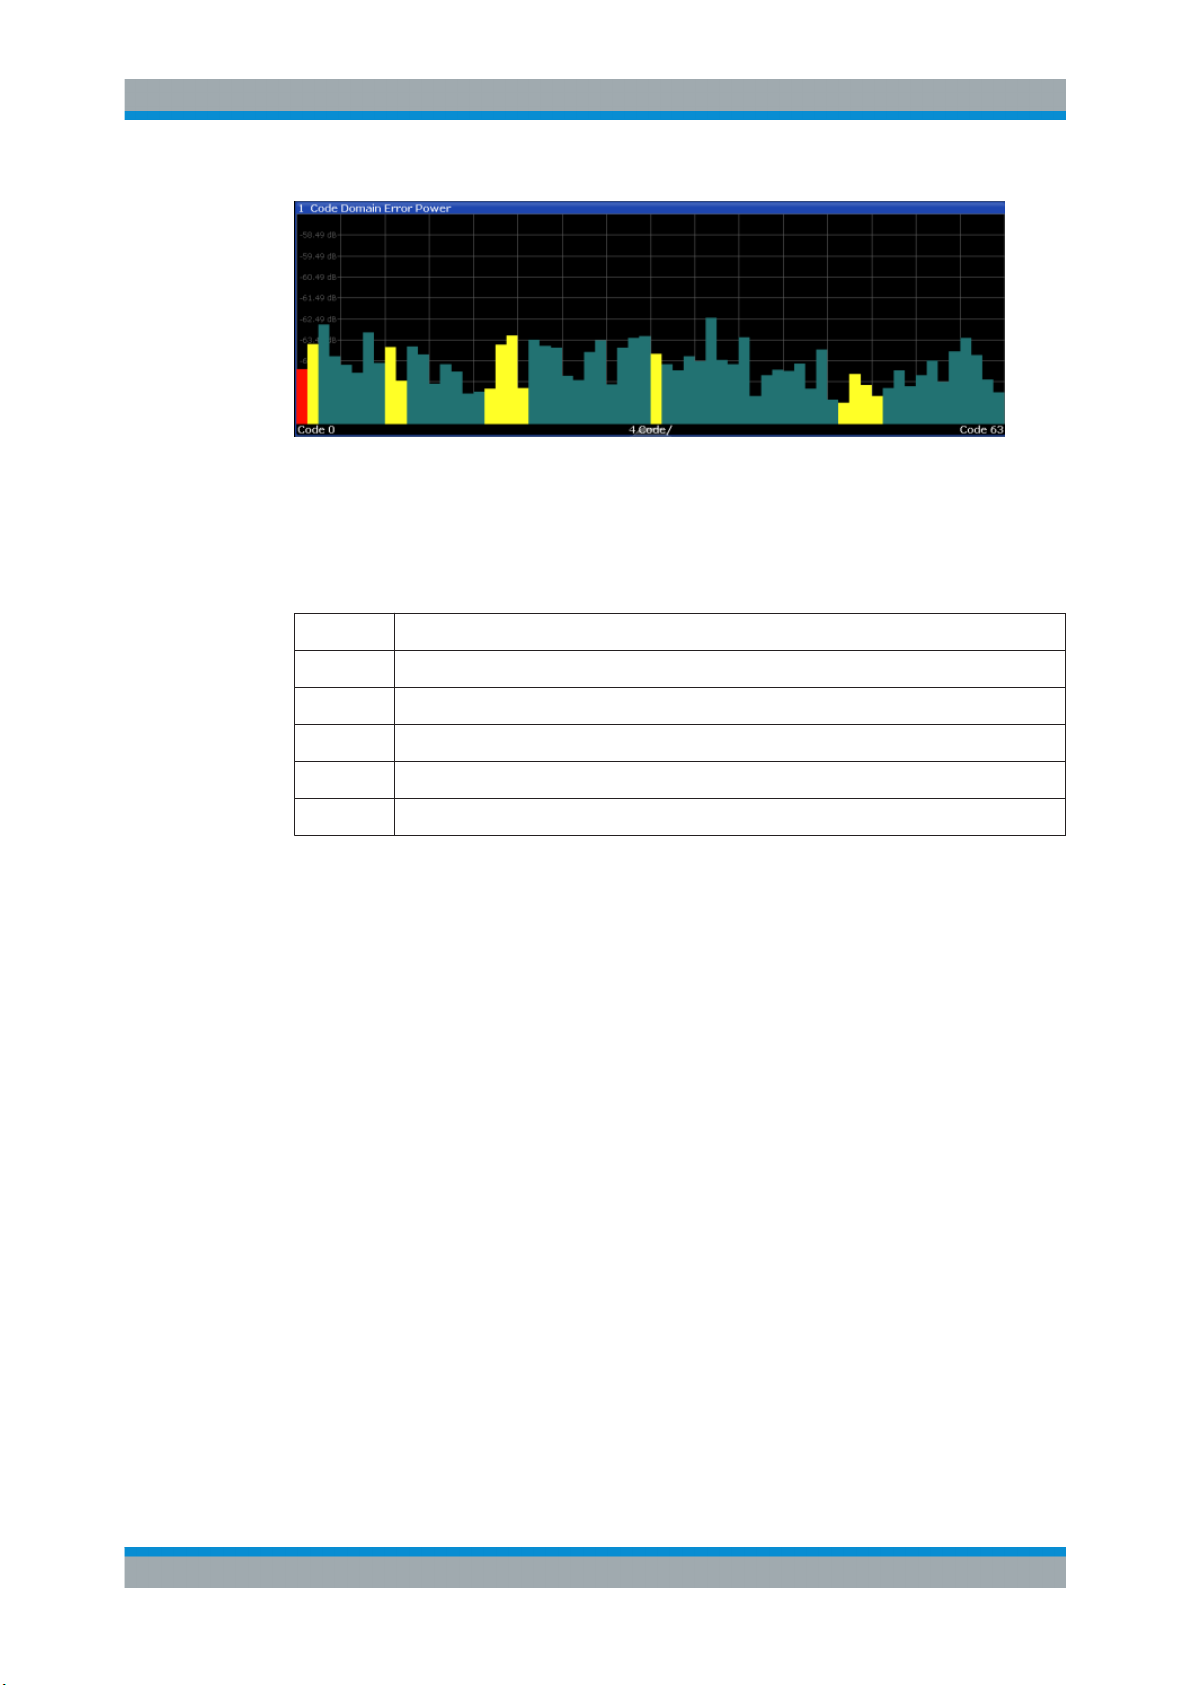
"Code Domain Error Power" is the difference in power between the measured and the
ideal signal.
The x-axis represents the channel (code) number, which corresponds to the base
spreading factor. The y-axis is a logarithmic level axis that shows the (error) power of
each channel. With the error power, both active and inactive channels can be evaluated at a glance.
Both evaluations support either Hadamard or BitReverse code sorting order (see
Chapter 4.3, "Code Display and Sort Order", on page 38).
MS application only: the (error) power is calculated only for the selected branch (I or
Q).
Measurements and Result Displays
Code Domain Analysis
Radio configuration
Branch the data is mapped to
If enabled (see "Timing and phase offset calculation " on page 95), the maximum
value of the timing offset is displayed together with the associated channel in the
last two lines. Since the timing offset values of each active channel can be either
negative or positive, the absolute values are compared and the maximum is displayed with the original sign.
Figure 3-3: Code Domain Power Display for the BTS application
19User Manual 1176.8539.02 ─ 04
Page 20
R&S®FPS-K82/-K83
Figure 3-4: Code Domain Error Power result display for the MS application
Active and inactive data channels are defined via the Inactive Channel Threshold. The
power values of the active and inactive channels are shown in different colors. In addition, codes with alias power can occur (see "Alias power" on page 39).
Table 3-5: Assignment of colors in CDEP result display
Color Usage
Red Selected channel (code number)
Measurements and Result Displays
Code Domain Analysis
Yellow Active channel
Green Inactive channel
Light blue Alias power of higher spreading factor
Magenta Alias power as a result of transmit diversity
Note: If codes with alias power are displayed, set the highest base spreading factor
available in the Base Spreading Factor field.
It is not recommended that you select more detailed result displays (such as "Symbol
Constell") for unassigned or inactive codes, since the results are not valid.
Remote command:
CDP:
LAY:ADD? '1',RIGH, CDPower, see LAYout:ADD[:WINDow]? on page 171
CALC:MARK:FUNC:CDP:RES? CDP or CALC:MARK:FUNC:CDP:RES? CDPR; see
CALCulate<n>:MARKer<m>:FUNCtion:CDPower[:BTS]:RESult? on page 183
CDEP:
LAY:ADD? '1',RIGH, CDEPower, see LAYout:ADD[:WINDow]? on page 171
CALC:MARK:FUNC:CDP:RES? ; see CALCulate<n>:MARKer<m>:FUNCtion:
CDPower[:BTS]:RESult? on page 183.
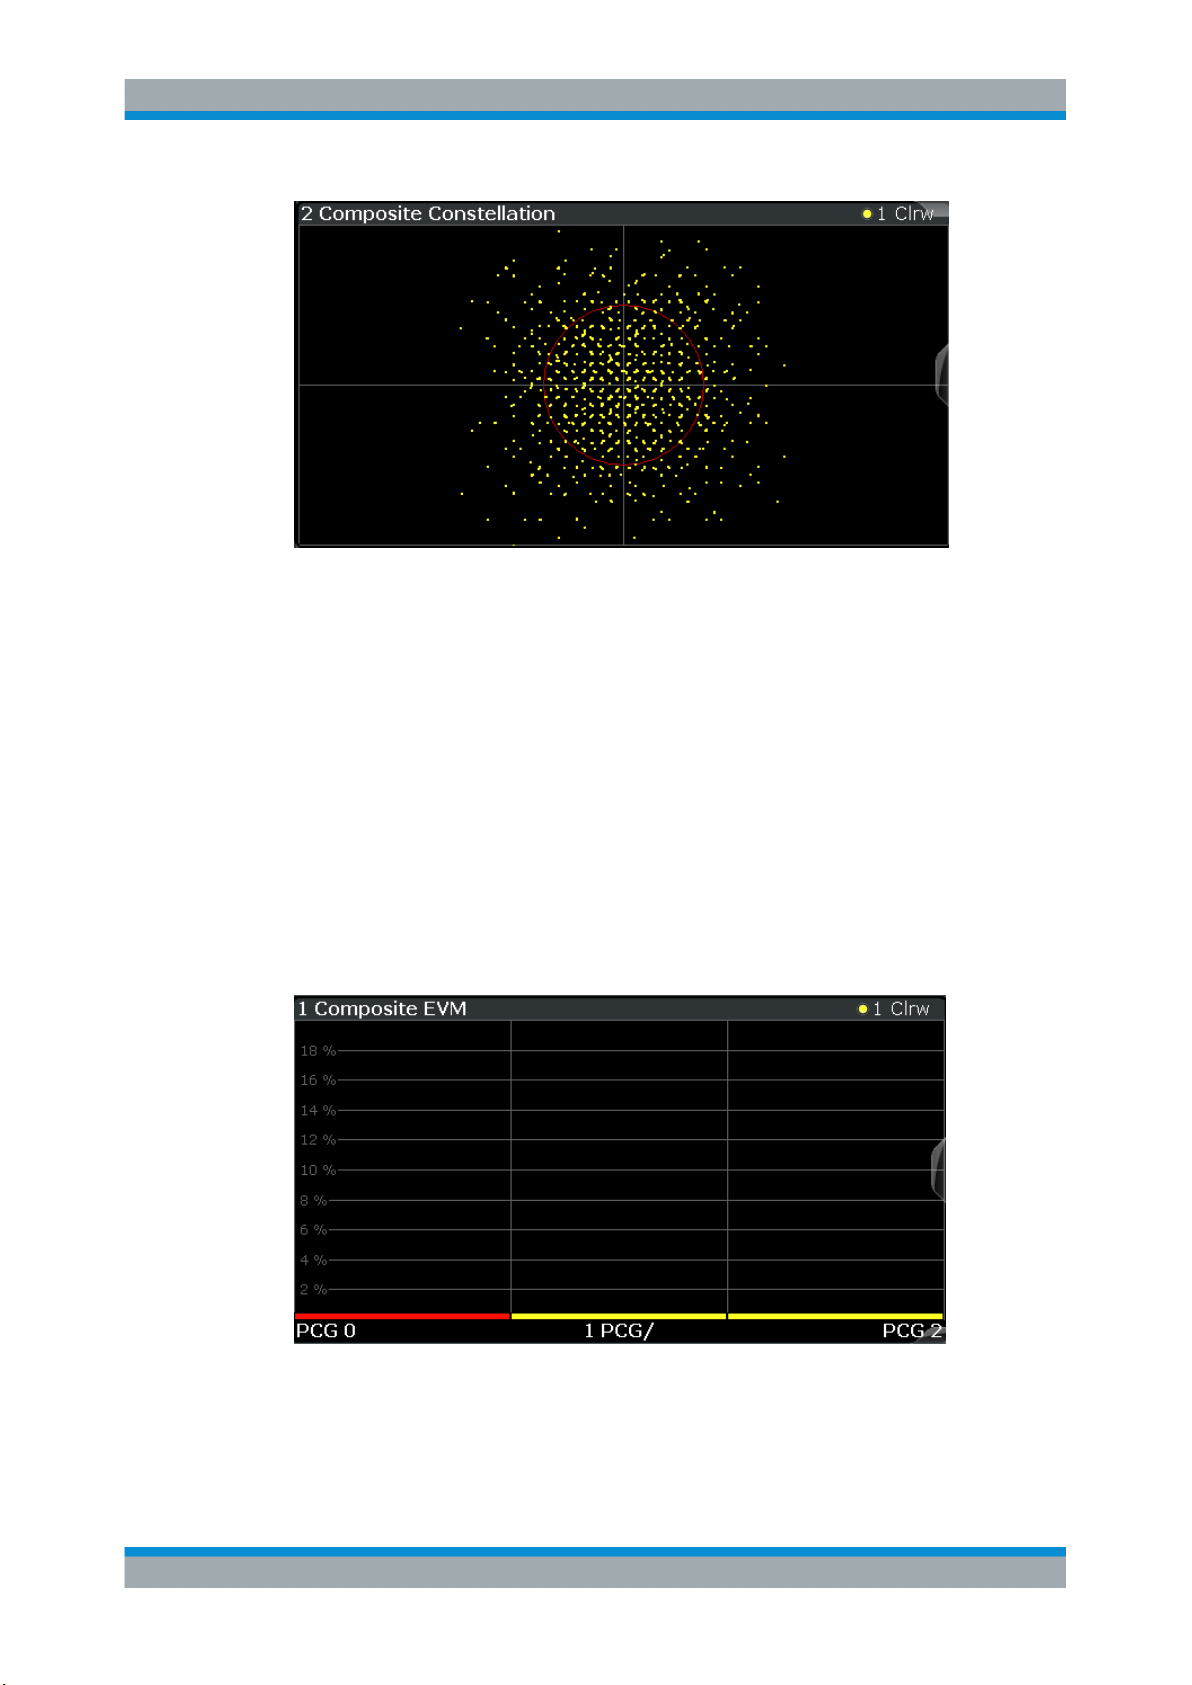
Composite Constellation
In "Composite Constellation" evaluation, the constellation points of the 1536 chips are
displayed for the specified PCG. This data is determined inside the DSP even before
the channel search. Thus, it is not possible to assign constellation points to channels.
The constellation points are displayed normalized with respect to the total power.
20User Manual 1176.8539.02 ─ 04
Page 21
R&S®FPS-K82/-K83
Figure 3-5: Composite Constellation display for the BTS application
Remote command:
LAY:ADD? '1',RIGH, CCON, see LAYout:ADD[:WINDow]? on page 171
CALC:MARK:FUNC:CDP:RES? ; see CALCulate<n>:MARKer<m>:FUNCtion:
CDPower[:BTS]:RESult? on page 183
Measurements and Result Displays
Code Domain Analysis
Composite EVM
This result display measures the modulation accuracy. It determines the error vector
magnitude (EVM) over the total signal. The EVM is the root of the ratio of the mean
error power (root mean square) to the power of an ideally generated reference signal.
Thus, the EVM is shown in %. The diagram consists of a composite EVM for each
PCG.
The measurement evaluates the total signal over the entire period of observation. The
selected PCG is highlighted red. You can set the number of PCGs in the "Signal Capture" settings (see "Number of PCGs" on page 76).
Figure 3-6: Composite EVM result display
21User Manual 1176.8539.02 ─ 04
Page 22
R&S®FPS-K82/-K83
Only the channels detected as being active are used to generate the ideal reference
signal. For example, a channel may not be detected as being active due to low power.
In this case, the difference between the test signal and the reference signal - and
therefore the composite EVM - is very large. Distortions also occur if unassigned codes
are wrongly given the status of "active channel". To obtain reliable measurement
results, select an adequate channel threshold via the Inactive Channel Threshold setting.
Remote command:
LAY:ADD? '1',RIGH, CEVM, see LAYout:ADD[:WINDow]? on page 171
CALC:MARK:FUNC:CDP:RES? MACCuracy; see CALCulate<n>:MARKer<m>:
FUNCtion:CDPower[:BTS]:RESult? on page 183
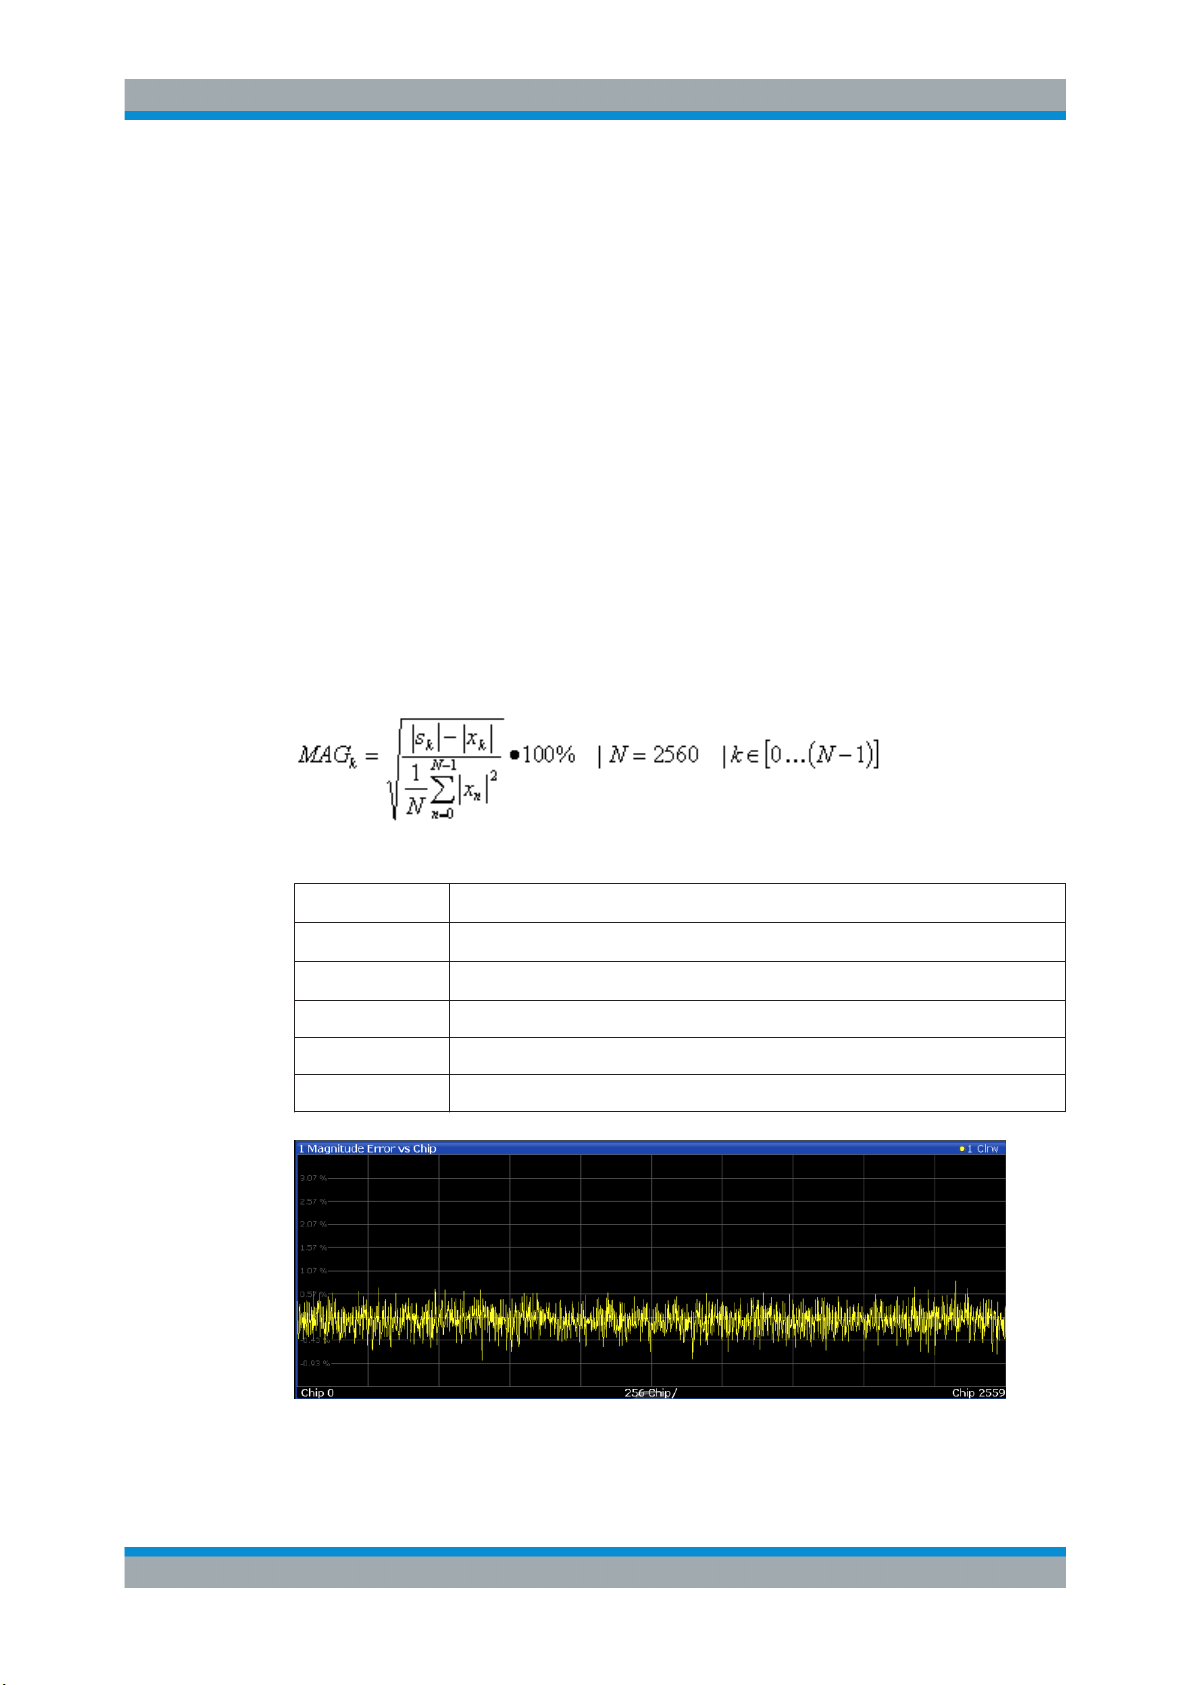
Mag Error vs Chip
The Magnitude Error versus chip display shows the magnitude error for all chips of the
selected slot.
The magnitude error is calculated as the difference of the magnitude of the received
signal to the magnitude of the reference signal. The reference signal is estimated from
the channel configuration of all active channels. The magnitude error is related to the
square root of the mean power of reference signal and given in percent.
Measurements and Result Displays
Code Domain Analysis
Where:
MAG
k
s
k
x
k
k Index number of the evaluated chip
N Number of chips at each CPICH slot
n Index number for mean power calculation of reference signal
Figure 3-7: Magnitude Error vs Chip display for CDMA2000 BTS measurements
Magnitude error of chip number k
Complex chip value of received signal
Complex chip value of reference signal
22User Manual 1176.8539.02 ─ 04
Page 23
R&S®FPS-K82/-K83
Remote command:
LAY:ADD? '1',RIGH, MECHip, see LAYout:ADD[:WINDow]? on page 171
TRACe<n>[:DATA]? TRACE<1...4>
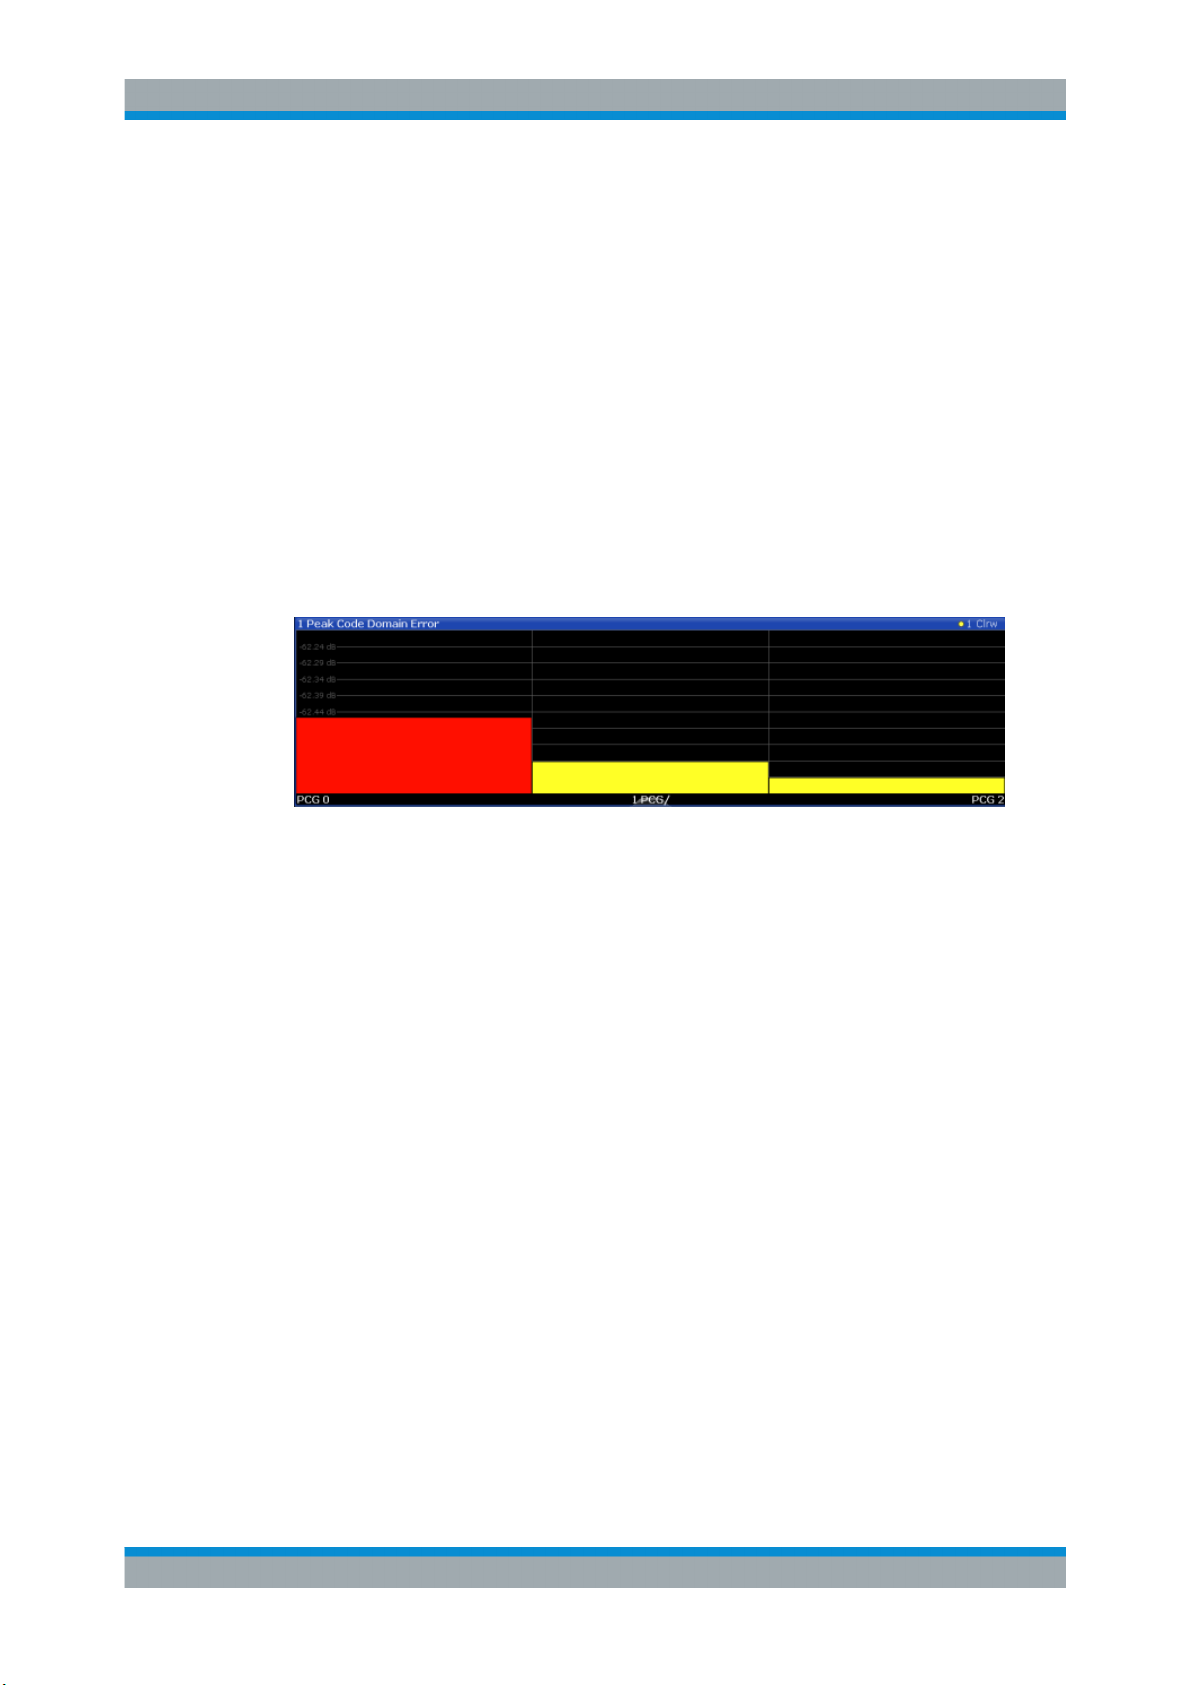
Peak Code Domain Error
The Peak Code Domain Error is defined as the maximum value for the Code Domain
Power / Code Domain Error Power for all codes. Thus, the error between the measure-
ment signal and the ideal reference signal is projected onto the code domain at a specific base spreading factor. In the diagram, each bar of the x-axis represents one PCG.
The y-axis represents the error power.
The measurement evaluates the total signal over the entire period of observation. The
currently selected PCG is highlighted red.
You can select the Base Spreading Factor and the number of evaluated PCGs in the
Signal Capture settings (see "Number of PCGs" on page 76).
MS application: the error is calculated only for the selected branch (I or Q).
Measurements and Result Displays
Code Domain Analysis
Figure 3-8: Peak Code Domain Error display for the BTS application
Note: Only the channels detected as being active are used to generate the ideal reference signal. For example, a channel may not be detected as being active due to low
power. In this case, the difference between the test signal and the reference signal is
very large. The result display therefore shows a peak code domain error that is too
high. Distortions also occur if unassigned codes are wrongly given the status of "active
channel". To obtain reliable measurement results, select an adequate channel threshold via the Inactive Channel Threshold setting.
Remote command:
LAY:ADD? '1',RIGH, PCDerror, see LAYout:ADD[:WINDow]? on page 171
CALC:MARK:FUNC:CDP:RES? PCDerror; see CALCulate<n>:MARKer<m>:
FUNCtion:CDPower[:BTS]:RESult? on page 183
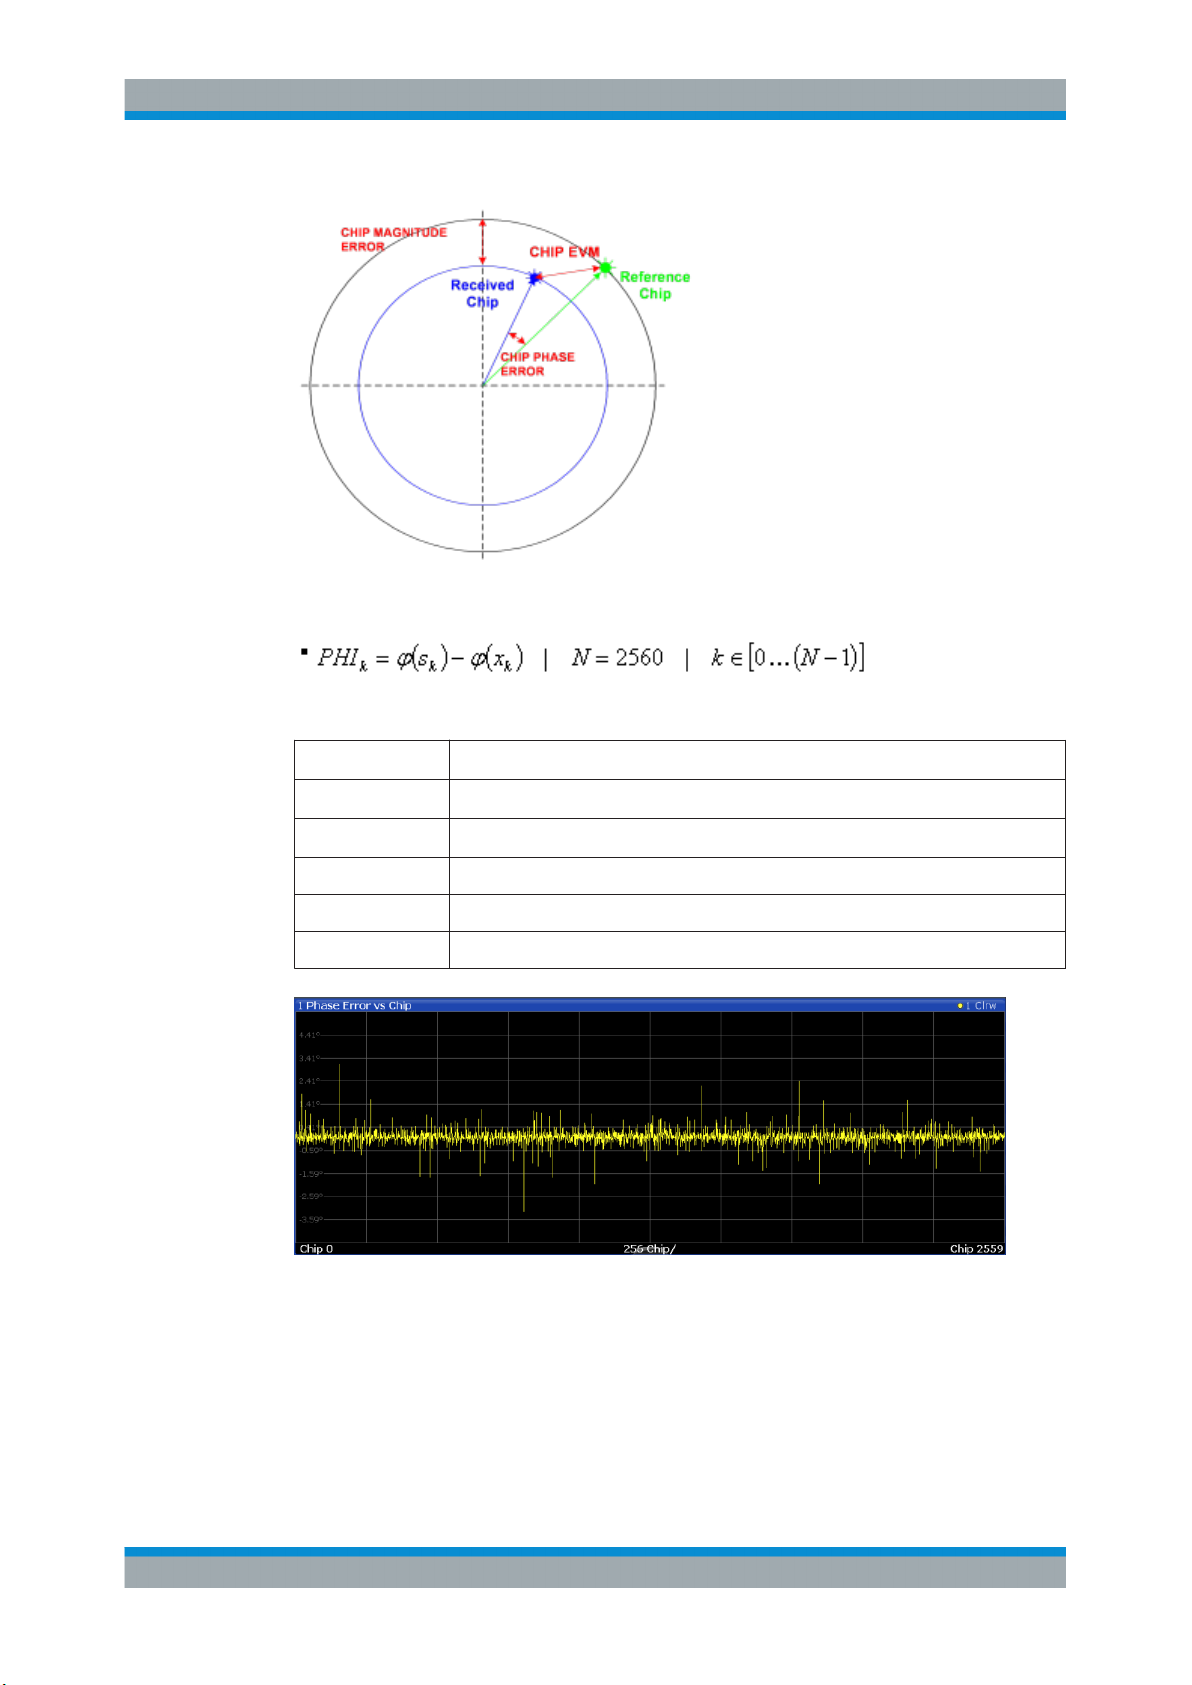
Phase Error vs Chip
Phase Error vs Chip activates the phase error versus chip display. The phase error is
displayed for all chips of the selected slot.
The phase error is calculated by the difference of the phase of received signal and
phase of reference signal. The reference signal is estimated from the channel configuration of all active channels. The phase error is given in degrees in a range of +180° to
-180°.
23User Manual 1176.8539.02 ─ 04
Page 24
R&S®FPS-K82/-K83
Figure 3-9: Calculating the magnitude, phase and vector error per chip
Measurements and Result Displays
Code Domain Analysis
Where:
PHI
k
s
k
x
k
k Index number of the evaluated chip
N Number of chips at each CPICH slot
φ(x) Phase calculation of a complex value
Phase error of chip number k
Complex chip value of received signal
Complex chip value of reference signal
Remote command:
LAY:ADD? '1',RIGH, PECHip, see LAYout:ADD[:WINDow]? on page 171
TRACe<n>[:DATA]? TRACE<1...4>
24User Manual 1176.8539.02 ─ 04
Page 25
R&S®FPS-K82/-K83
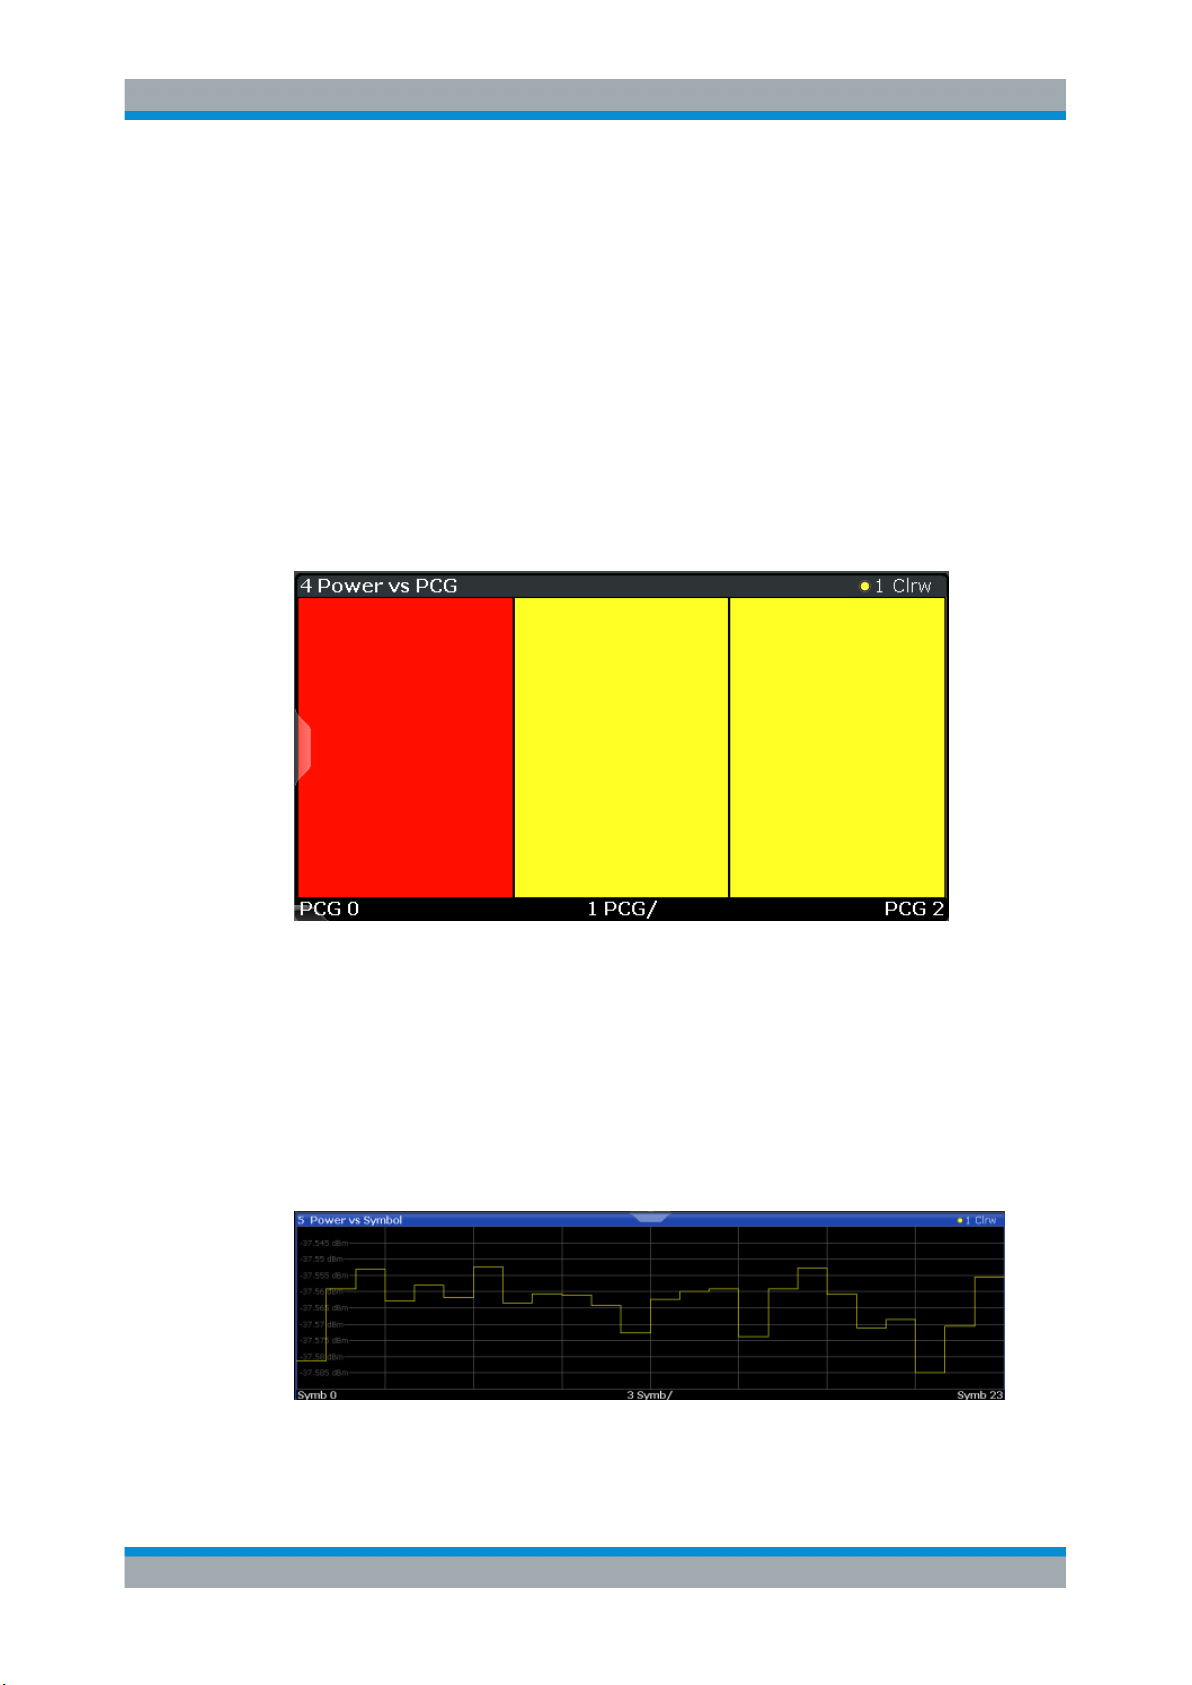
Power vs PCG
In this result display, the power of the selected channel is averaged for each measured
PCG and referred to the pilot power of the PCG. Therefore the unit of the y-axis is dB
(relative to the Pilot Channel). The result display consists of the number of the PCGs in
the measurement and the power value of each one.
For measurements in which antenna diversity is inactive (OFF) or set to "Antenna 1",
the F-PICH channel is used as reference. The F-TDPICH channel is used for measurements in which antenna diversity is set to "Antenna 2".
Note: For signals with enabled power control, use the default reference power setting.
For details, refer to "Power Reference" on page 96.
The measurement evaluates one code channel over the entire period of observation.
The selected PCG is highlighted red.
MS application: the power is calculated only for the selected branch (I or Q).
Measurements and Result Displays
Code Domain Analysis
Figure 3-10: Power vs PCG Display for the BTS application
Note: To detect the start of a power control group correctly, the external trigger must
be used for power-regulated signals.
Remote command:
LAY:ADD? '1',RIGH, PSLot, see LAYout:ADD[:WINDow]? on page 171
Power vs Symbol
The "Power vs. Symbol" evaluation calculates the absolute power in dBm for each
symbol in the selected channel and the selected PCG.
Figure 3-11: Power vs Symbol result display
25User Manual 1176.8539.02 ─ 04
Page 26
R&S®FPS-K82/-K83
Remote command:
LAY:ADD? '1',RIGH, PSYMbol, see LAYout:ADD[:WINDow]? on page 171
CALC:MARK:FUNC:CDP:RES? ; see CALCulate<n>:MARKer<m>:FUNCtion:
CDPower[:BTS]:RESult? on page 183
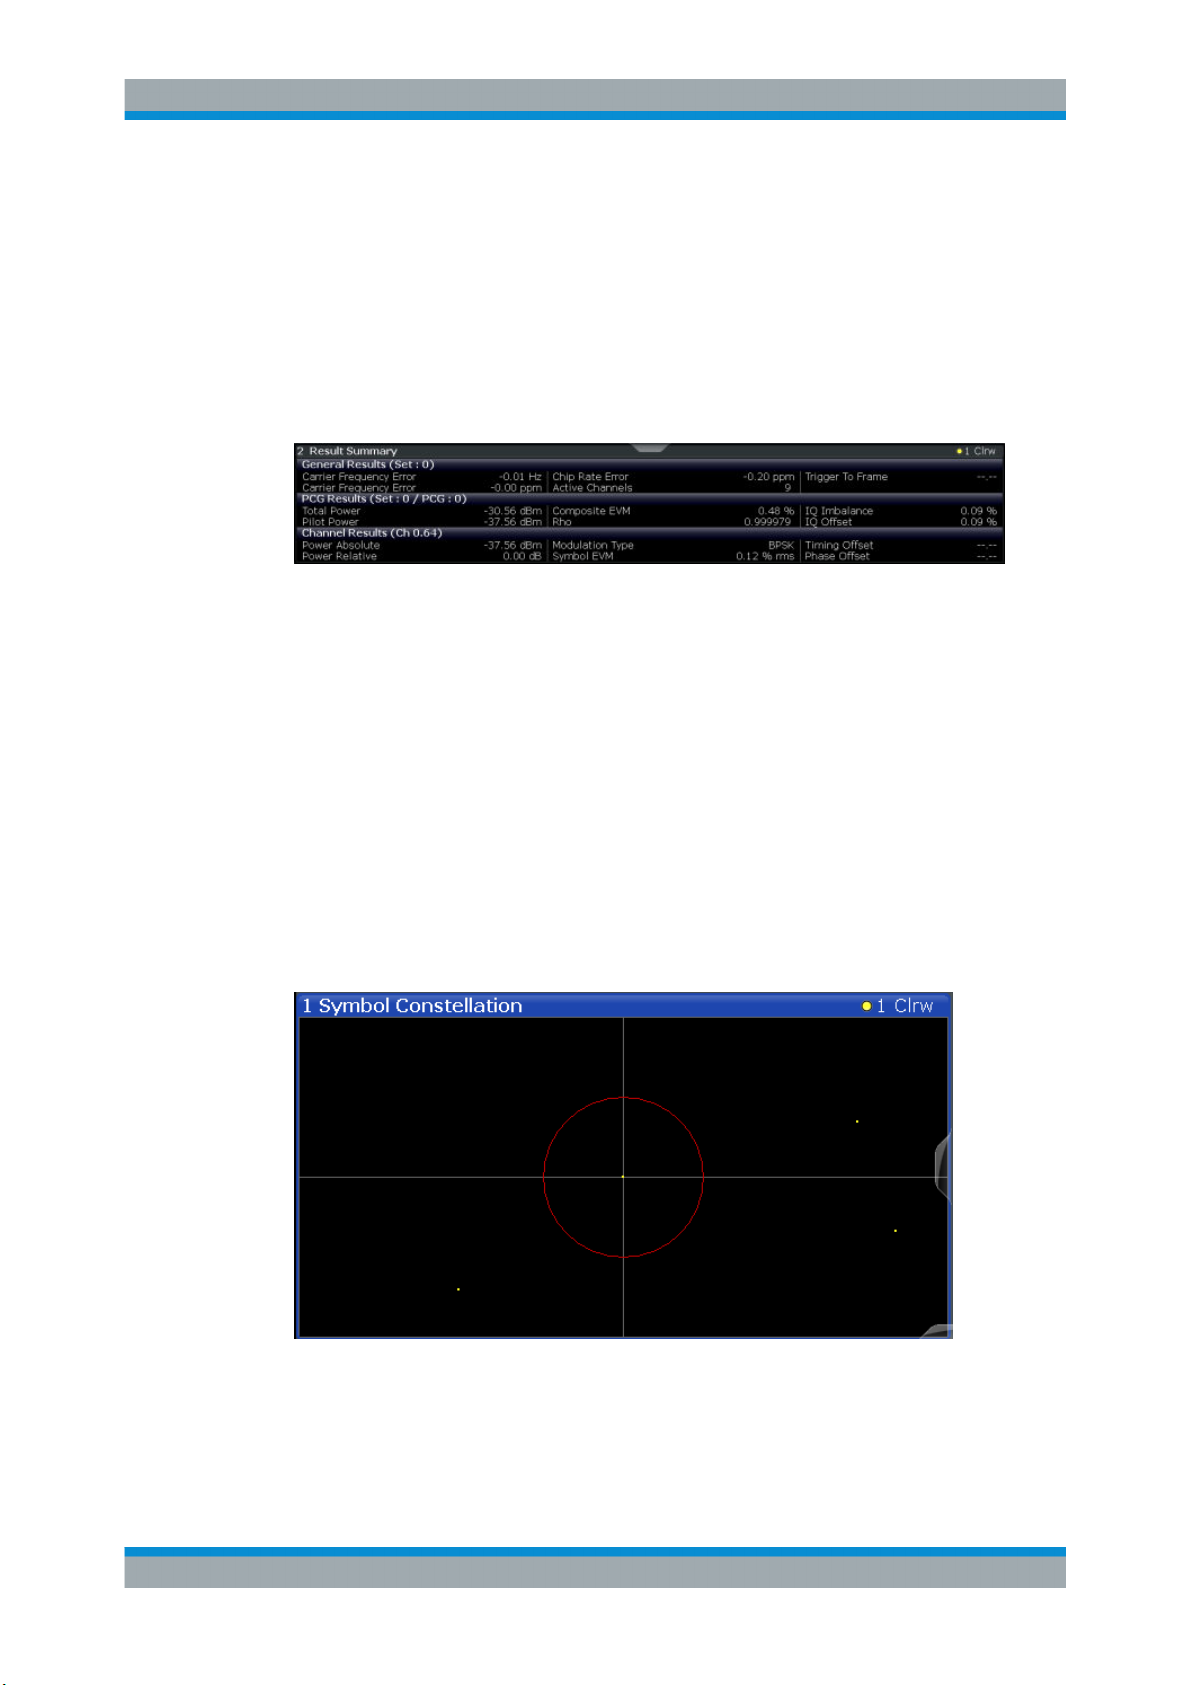
Result Summary
The "Result Summary" evaluation displays a list of measurement results on the screen.
For details on the displayed values, see Chapter 3.1.1, "Code Domain Parameters",
on page 14.
Figure 3-12: Result Summary result display
Remote command:
LAY:ADD? '1',RIGH, RSUMmary, see LAYout:ADD[:WINDow]? on page 171
CALC:MARK:FUNC:CDP:RES? ; see CALCulate<n>:MARKer<m>:FUNCtion:
CDPower[:BTS]:RESult? on page 183
Measurements and Result Displays
Code Domain Analysis
Symbol Constellation
The "Symbol Constellation" evaluation shows all modulated symbols of the selected
channel and the selected PCG.
The BTS application supports BPSK, QPSK, 8PSK and 16QAM modulation types. The
modulation type itself depends on the channel type. Refer to Chapter 4.8.1, "BTS
Channel Types", on page 43 for further information.
Note: QPSK constellation points are located on the diagonals (not x and y-axis) of the
constellation diagram. BPSK constellation points are always on the x-axis.
Figure 3-13: Symbol Constellation display for the BTS application
The number of symbols is in the range from 6 (min) to 384 (max), depending on the
symbol rate of the channel (see Chapter 4, "Measurement Basics", on page 36).
26User Manual 1176.8539.02 ─ 04
Page 27
R&S®FPS-K82/-K83
Remote command:
LAY:ADD? '1',RIGH, SCONst, see LAYout:ADD[:WINDow]? on page 171
CALC:MARK:FUNC:CDP:RES? ; see CALCulate<n>:MARKer<m>:FUNCtion:
CDPower[:BTS]:RESult? on page 183
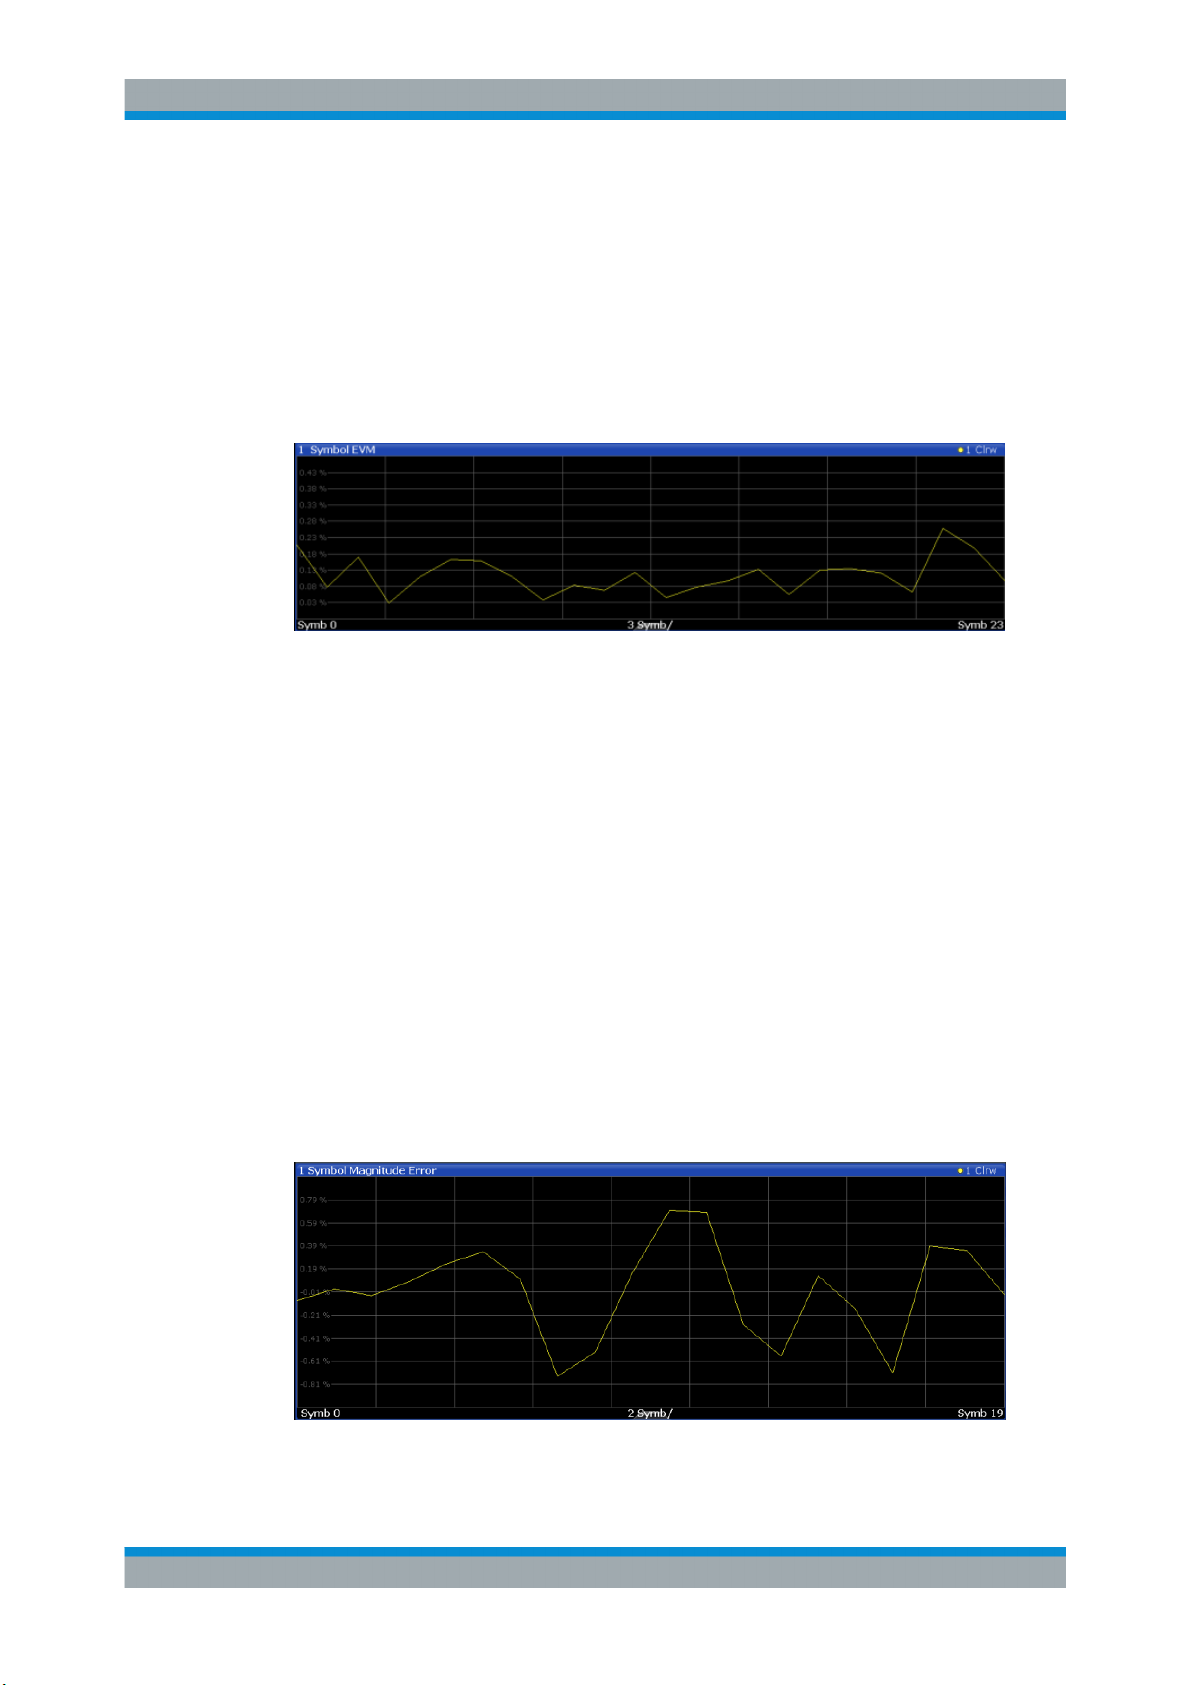
Symbol EVM
The "Symbol EVM" evaluation shows the error between the measured signal and the
ideal reference signal in percent for the selected channel and the selected PCG. A
trace over all symbols of a PCG is drawn.
Figure 3-14: Symbol EVM display for the BTS application
Measurements and Result Displays
Code Domain Analysis
The number of symbols is in the range from 6 (min) to 384 (max), depending on the
symbol rate of the channel (see Chapter 4, "Measurement Basics", on page 36).
Inactive channels can be measured, but the result is meaningless since these channels do not contain data.
Remote command:
LAY:ADD? '1',RIGH, SEVM, see LAYout:ADD[:WINDow]? on page 171
CALC:MARK:FUNC:CDP:RES? ; see CALCulate<n>:MARKer<m>:FUNCtion:
CDPower[:BTS]:RESult? on page 183
Symbol Magnitude Error
The Symbol Magnitude Error is calculated analogous to symbol EVM. The result is one
symbol magnitude error value for each symbol of the slot of a special channel. Positive
values of symbol magnitude error indicate a symbol magnitude that is larger than the
expected ideal value. Negative symbol magnitude errors indicate a symbol magnitude
that is less than the expected ideal value. The symbol magnitude error is the difference
between the magnitude of the received symbol and that of the reference symbol, related to the magnitude of the reference symbol.
Figure 3-15: Symbol Magnitude Error display for CDMA2000 BTS measurements
27User Manual 1176.8539.02 ─ 04
Page 28
R&S®FPS-K82/-K83
Remote command:
LAY:ADD? '1',RIGH, SMERror, see LAYout:ADD[:WINDow]? on page 171
TRACe<n>[:DATA]? TRACE<1...4>
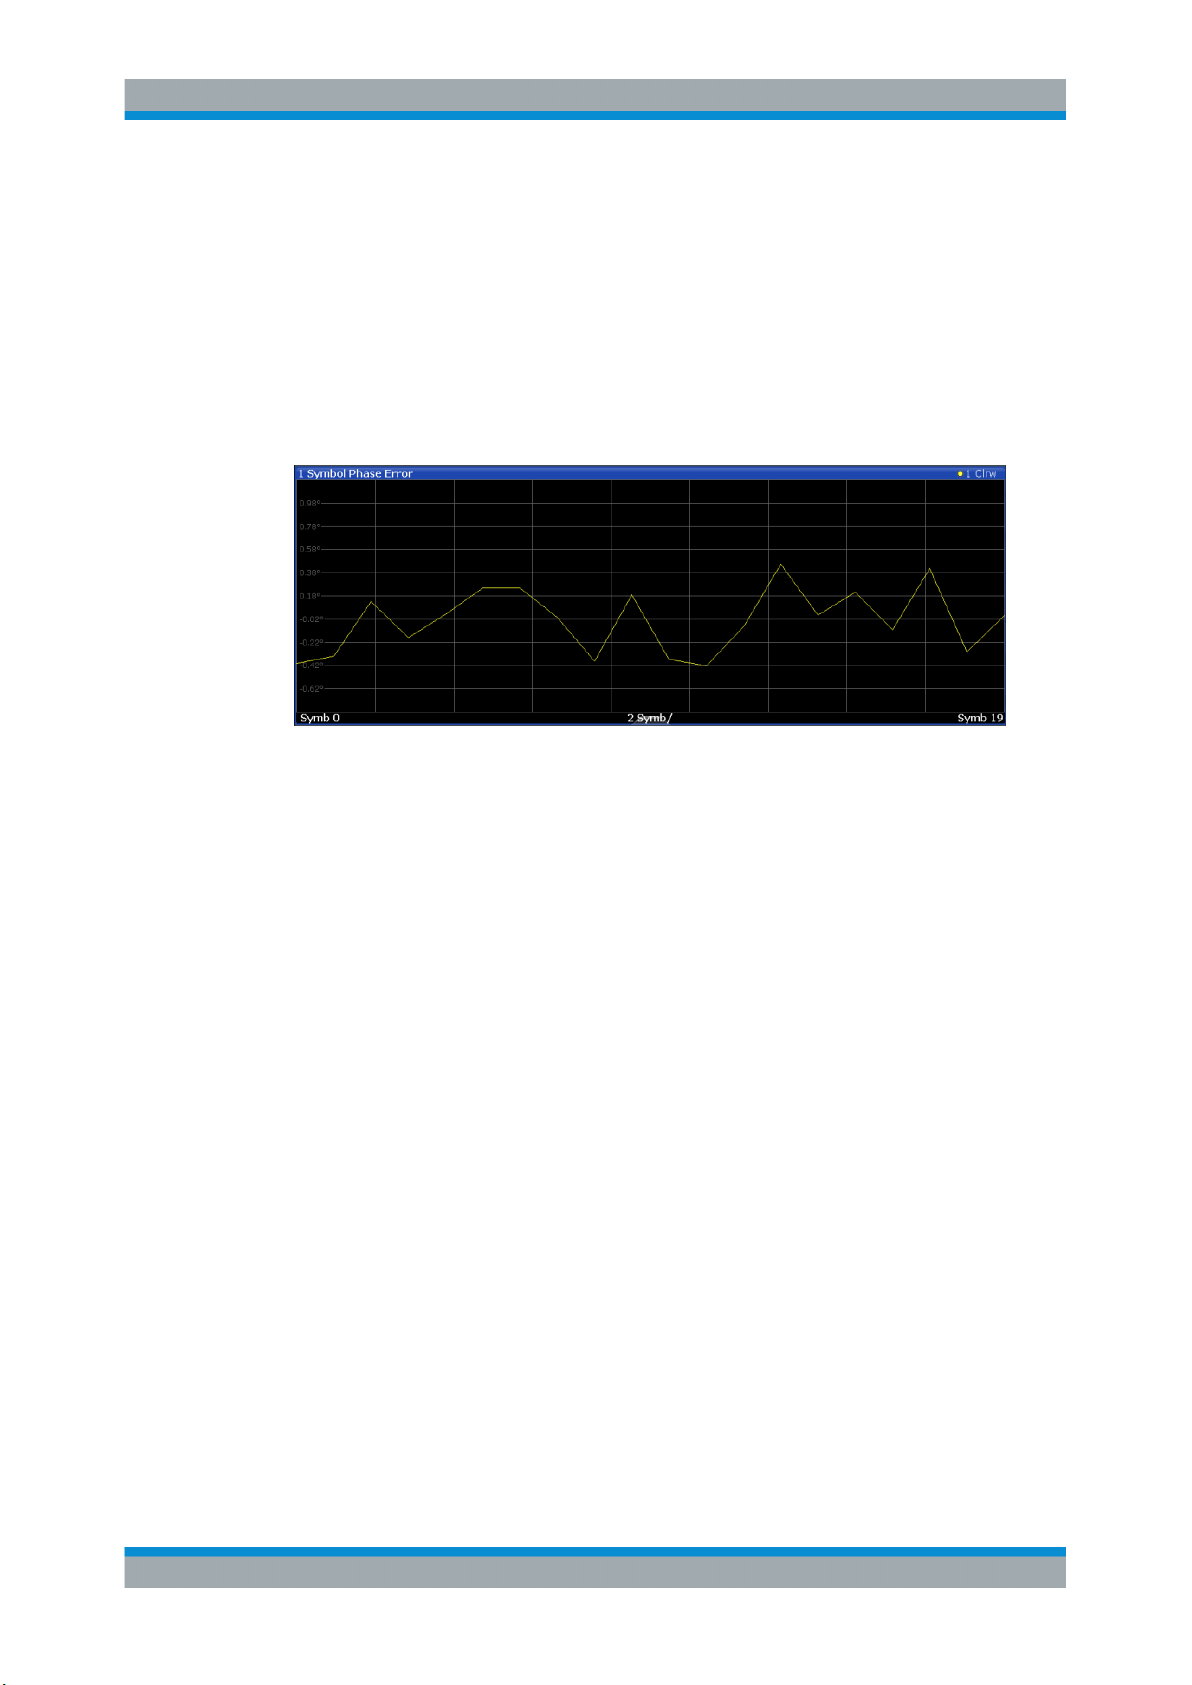
Symbol Phase Error
The Symbol Phase Error is calculated analogous to symbol EVM. The result is one
symbol phase error value for each symbol of the slot of a special channel. Positive values of symbol phase error indicate a symbol phase that is larger than the expected
ideal value. Negative symbol phase errors indicate a symbol phase that is less than the
expected ideal value.
Measurements and Result Displays
RF Measurements
Figure 3-16: Symbol Phase Error display for CDMA2000 BTS measurements
Remote command:
LAY:ADD? '1',RIGH, SPERror, see LAYout:ADD[:WINDow]? on page 171
TRACe<n>[:DATA]? TRACE<1...4>
3.2 RF Measurements
Access: "Overview" > "Select Measurement"
In addition to the Code Domain Analysis measurements, the CDMA2000 firmware
applications also provide some RF measurements as defined in the CDMA2000 standard. RF measurements are identical to the corresponding measurements in the base
unit, but configured according to the requirements of the CDMA2000 standard.
For details on these measurements, see the R&S FPS User Manual.
3.2.1 RF Measurement Types and Results
The CDMA2000 applications provide the following RF measurements:
Power............................................................................................................................29
Channel Power ACLR...................................................................................................29
Spectrum Emission Mask..............................................................................................30
Occupied Bandwidth..................................................................................................... 31
CCDF............................................................................................................................ 32
28User Manual 1176.8539.02 ─ 04
Page 29
R&S®FPS-K82/-K83
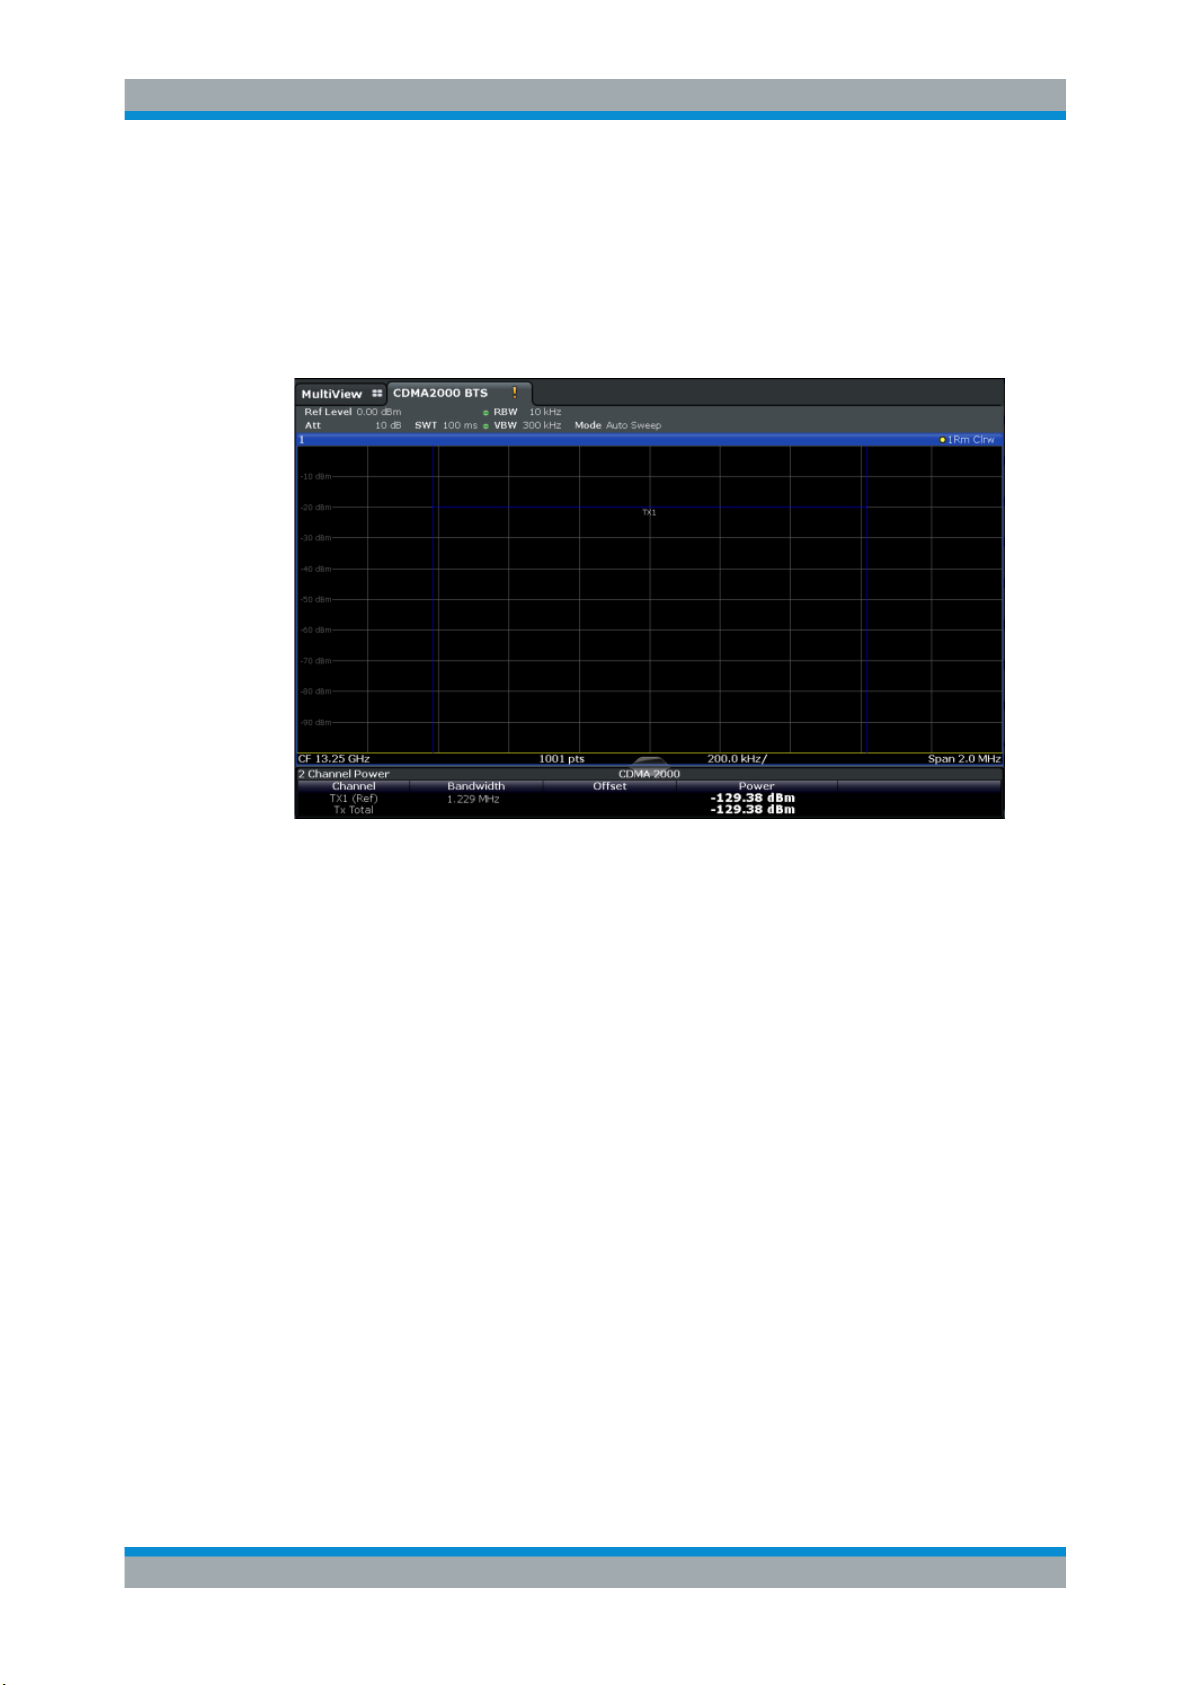
Power
Access: "Overview" > "Select Measurement" > "Power"
The Power measurement determines the CDMA2000 signal channel power.
To do so, the CDMA2000 application performs a Channel Power measurement as in
the Spectrum application with settings according to the CDMA2000 standard. The
bandwidth and the associated channel power are displayed in the Result Summary.
Measurements and Result Displays
RF Measurements
Remote command:
CONF:CDP:MEAS POW, see CONFigure:CDPower[:BTS]:MEASurement
on page 129
Querying results: CALC:MARK:FUNC:POW:RES? CPOW, see CALCulate<n>:
MARKer<m>:FUNCtion:POWer<sb>:RESult? on page 201
CALC:MARK:FUNC:POW:RES? ACP, see CALCulate<n>:MARKer<m>:FUNCtion:
POWer<sb>:RESult? on page 201
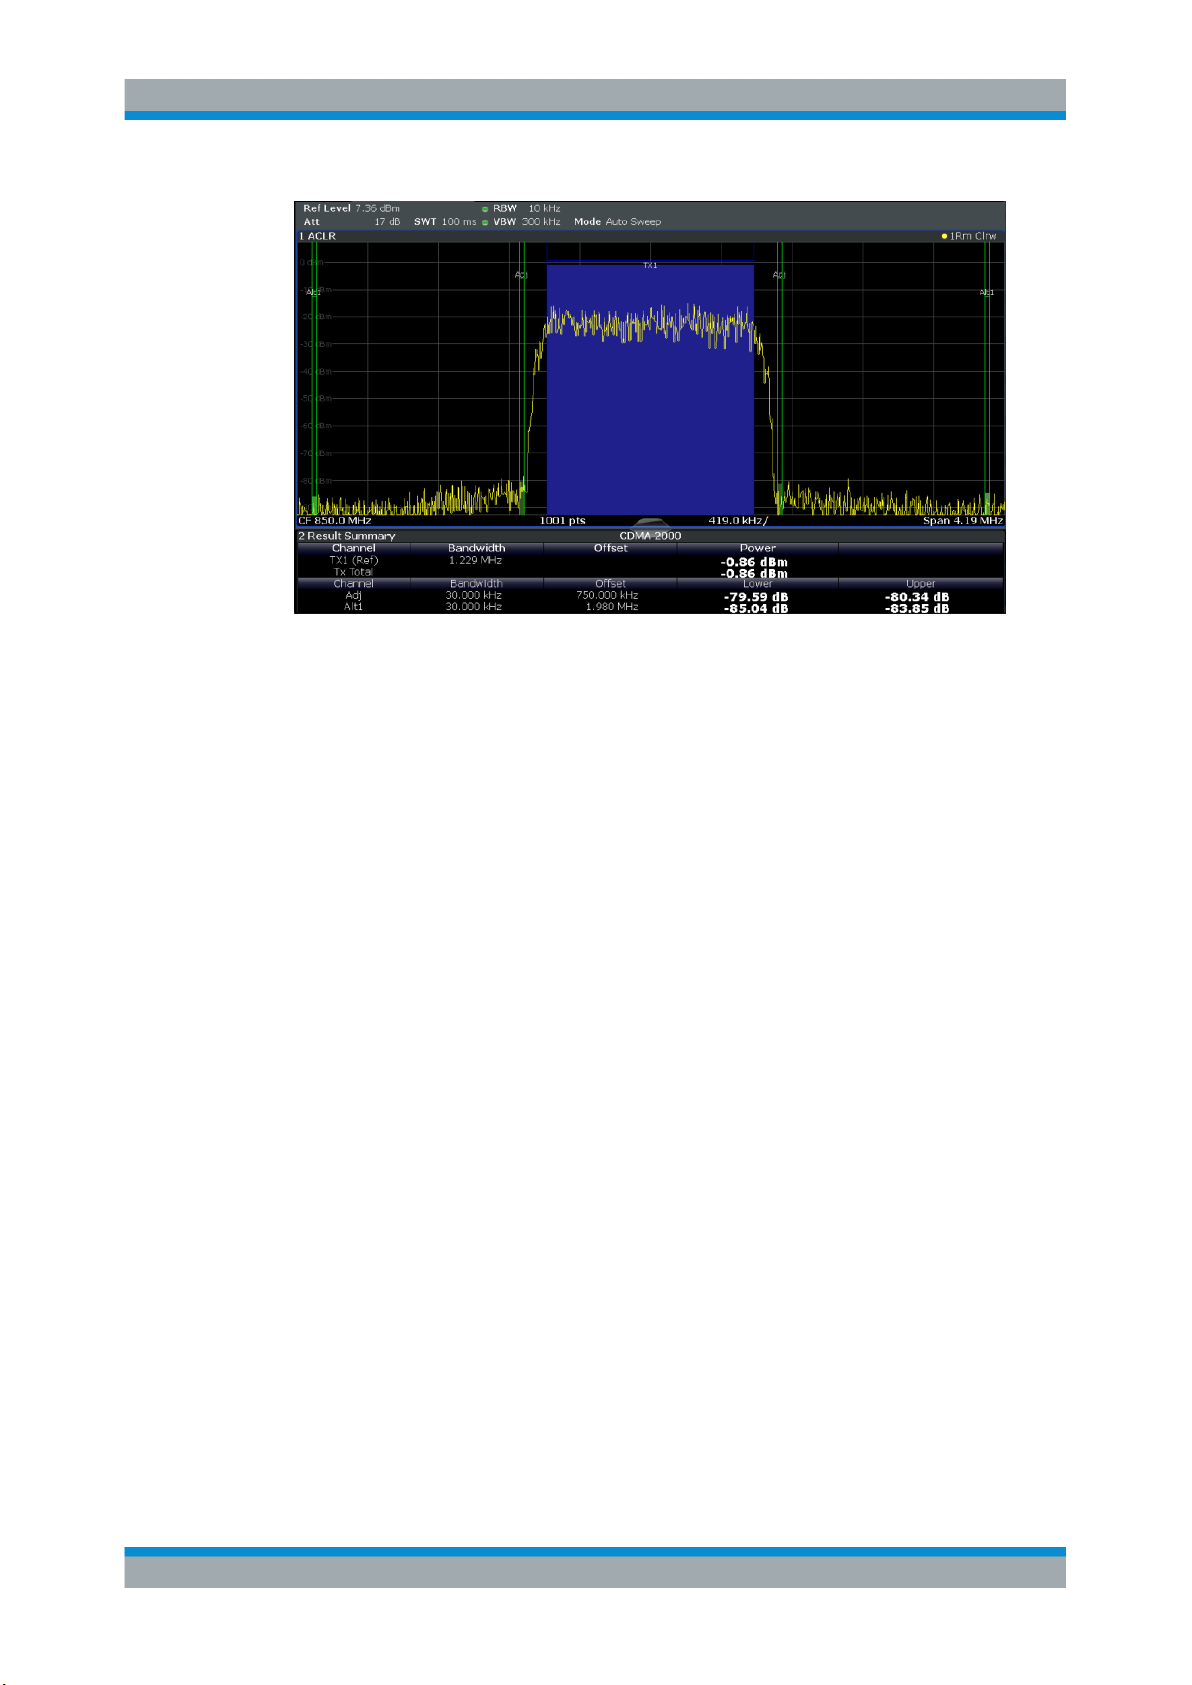
Channel Power ACLR
Access: "Overview" > "Select Measurement" > "Channel Power ACLR"
Channel Power ACLR performs an adjacent channel power measurement in the
default setting according to CDMA2000 specifications (adjacent channel leakage ratio).
The R&S FPS measures the channel power and the relative power of the adjacent
channels and of the alternate channels. The results are displayed in the Result Summary.
29User Manual 1176.8539.02 ─ 04
Page 30
R&S®FPS-K82/-K83
Remote command:
CONF:CDP:MEAS ACLR, see CONFigure:CDPower[:BTS]:MEASurement
on page 129
Querying results:
CALC:MARK:FUNC:POW:RES? ACP, see CALCulate<n>:MARKer<m>:FUNCtion:
POWer<sb>:RESult? on page 201
CALC:MARK:FUNC:POW:RES? ACP, see CALCulate<n>:MARKer<m>:FUNCtion:
POWer<sb>:RESult? on page 201
Measurements and Result Displays
RF Measurements
Spectrum Emission Mask
Access: "Overview" > "Select Measurement" > "Spectrum Emission Mask"
The Spectrum Emission Mask measurement determines the power of the CDMA2000
signal in defined offsets from the carrier and compares the power values with a spectral mask specified by the CDMA2000 specifications. The limits depend on the selected
bandclass. Thus, the performance of the DUT can be tested and the emissions and
their distance to the limit be identified.
Note: The CDMA2000 standard does not distinguish between spurious and spectral
emissions.
30User Manual 1176.8539.02 ─ 04
Page 31

R&S®FPS-K82/-K83
Figure 3-17: SEM measurement results for the BTS application
Measurements and Result Displays
RF Measurements
Remote command:
CONF:CDP:MEAS ESP, see CONFigure:CDPower[:BTS]:MEASurement
on page 129
Querying results:
CALC:MARK:FUNC:POW:RES? CPOW, see CALCulate<n>:MARKer<m>:FUNCtion:
POWer<sb>:RESult? on page 201
CALC:MARK:FUNC:POW:RES? ACP, see CALCulate<n>:MARKer<m>:FUNCtion:
POWer<sb>:RESult? on page 201
CALCulate<n>:LIMit<k>:FAIL? on page 201
Occupied Bandwidth
Access: "Overview" > "Select Measurement" > "OBW"
The Occupied Bandwidth measurement determines the bandwidth in which – in default
settings - 99 % of the total signal power is found. The percentage of the signal power
to be included in the bandwidth measurement can be changed.
The occupied bandwidth (Occ BW) and the frequency markers are displayed in the
marker table.
31User Manual 1176.8539.02 ─ 04
Page 32

R&S®FPS-K82/-K83
Remote command:
CONF:CDP:MEAS OBAN, see CONFigure:CDPower[:BTS]:MEASurement
on page 129
Querying results:
CALC:MARK:FUNC:POW:RES? OBW, see CALCulate<n>:MARKer<m>:FUNCtion:
POWer<sb>:RESult? on page 201
CALC:MARK:FUNC:POW:RES? ACP, see CALCulate<n>:MARKer<m>:FUNCtion:
POWer<sb>:RESult? on page 201
Measurements and Result Displays
RF Measurements
CCDF
Access: "Overview" > "Select Measurement" > "CCDF"
The CCDF measurement determines the distribution of the signal amplitudes (complementary cumulative distribution function). The CCDF and the Crest factor are displayed. For the purposes of this measurement, a signal section of user-definable
length is recorded continuously in the zero span, and the distribution of the signal
amplitudes is evaluated.
32User Manual 1176.8539.02 ─ 04
Page 33

R&S®FPS-K82/-K83
Figure 3-18: CCDF measurement results for the BTS application
Measurements and Result Displays
RF Measurements
Remote command:
CONF:CDP:MEAS CCDF, see CONFigure:CDPower[:BTS]:MEASurement
on page 129
Querying results:
CALCulate<n>:MARKer<m>:Y? on page 185
CALC:MARK:FUNC:POW:RES? ACP, see CALCulate<n>:MARKer<m>:FUNCtion:
POWer<sb>:RESult? on page 201
CALC:MARK:FUNC:POW:RES? ACP, see CALCulate<n>:MARKer<m>:FUNCtion:
POWer<sb>:RESult? on page 201
CALCulate<n>:STATistics:RESult<t>? on page 203
3.2.2 Evaluation Methods for RF Measurements
Access: "Overview" > "Display Config"
The evaluation methods for RF measurements are identical to those in the Spectrum
application.
Diagram ........................................................................................................................33
Result Summary ...........................................................................................................34
Marker Table ................................................................................................................34
Marker Peak List .......................................................................................................... 34
Diagram
Displays a basic level vs. frequency or level vs. time diagram of the measured data to
evaluate the results graphically. This is the default evaluation method. Which data is
displayed in the diagram depends on the "Trace" settings. Scaling for the y-axis can be
configured.
33User Manual 1176.8539.02 ─ 04
Page 34

R&S®FPS-K82/-K83
Remote command:
LAY:ADD? '1',RIGH, DIAG, see LAYout:ADD[:WINDow]? on page 171
Results:
Result Summary
Result summaries provide the results of specific measurement functions in a table for
numerical evaluation. The contents of the result summary vary depending on the
selected measurement function. See the description of the individual measurement
functions for details.
Measurements and Result Displays
RF Measurements
Remote command:
LAY:ADD? '1',RIGH, RSUM, see LAYout:ADD[:WINDow]? on page 171
Marker Table
Displays a table with the current marker values for the active markers.
This table is displayed automatically if configured accordingly (see " Marker Table Dis-
play " on page 102).
Remote command:
LAY:ADD? '1',RIGH, MTAB, see LAYout:ADD[:WINDow]? on page 171
Results:
CALCulate<n>:MARKer<m>:X on page 206
CALCulate<n>:MARKer<m>:Y? on page 185
Marker Peak List
The marker peak list determines the frequencies and levels of peaks in the spectrum or
time domain. How many peaks are displayed can be defined, as well as the sort order.
In addition, the detected peaks can be indicated in the diagram. The peak list can also
be exported to a file for analysis in an external application.
34User Manual 1176.8539.02 ─ 04
Page 35

R&S®FPS-K82/-K83
Remote command:
LAY:ADD? '1',RIGH, PEAK, see LAYout:ADD[:WINDow]? on page 171
Results:
CALCulate<n>:MARKer<m>:X on page 206
CALCulate<n>:MARKer<m>:Y? on page 185
Measurements and Result Displays
RF Measurements
35User Manual 1176.8539.02 ─ 04
Page 36

R&S®FPS-K82/-K83
4 Measurement Basics
CDMA2000® is based on code division multiplex access (CDMA), where all users
share the same 1.25 MHz-wide channel, but use individual pseudo noise (PN) sequences for differentiation.
CDMA2000® was specified by 3GPP2 (3rd Generation Partnership Project 2). The following link provides access to 3GPP2 specifications:
http://www.3gpp2.org/Public_html/specs/index.cfm
Some background knowledge on basic terms and principles used in CDMA2000 tests
and measurements is provided here for a better understanding of the required configuration settings.
● PCGs and Sets....................................................................................................... 36
● Channels, Codes and Symbols...............................................................................36
● Code Display and Sort Order..................................................................................38
● Scrambling via PN Offsets and Long Codes...........................................................40
● Code Mapping and Branches..................................................................................40
● Radio Configuration................................................................................................ 41
● Transmission with Multiple Carriers and Multiple Antennas....................................41
● Channel Detection and Channel Types.................................................................. 43
● Test Setup for CDMA2000 Tests............................................................................ 46
● CDA Measurements in MSRA Operating Mode......................................................48
Measurement Basics
Channels, Codes and Symbols
4.1 PCGs and Sets
The user data is transmitted in individual data packages, each of which can have different transmission settings such as the power level. The data in one such package, for
which the power remains constant, is called a power control group, or PCG. A PCG
has a duration of 1.25 ms (or 1536 chips, same as slots in other standards).
The CDMA2000 applications can capture up to 31360 PCGs (about 26 seconds) in a
single sweep. To improve performance during measurement and analysis, the R&S
CDMA2000 Measurements application does not process the captured PCGs all at
once, but rather in sets, one at a time. One set consists of 64 PCGs. You can select
how many sets are captured and which set is currently analyzed and displayed. The
possible value range is from 1 to a maximum of 490 sets.
4.2 Channels, Codes and Symbols
In CDMA2000 applications, the data is transmitted in channels. These channels are
based on orthogonal codes and can have different symbol rates. The symbol rate
depends on the used modulation type and the spreading factor of the channel.
36User Manual 1176.8539.02 ─ 04
Page 37

R&S®FPS-K82/-K83
Spreading factors
Spreading factors determine whether the transmitted data is sent in short or long
sequences. The spreading factor is re-assigned dynamically in certain time intervals
according to the current demand of users and data to be transmitted. The higher the
spreading factor, the lower the data rate; the lower the spreading factor, the higher the
data rate.
A channel with a lower spreading factor consists of several combined codes. That
means a channel can be described by its number and its spreading factor.
The spread bits are called chips.
Since a PCG is a fixed time unit, knowing the symbol rate you can calculate how many
symbols are transmitted for each PCG.
For evaluations which display symbols on the x–axis, the maximum number of symbols
varies according to the symbol rate of the selected code channel. With transmit diversity signals, the symbols of the signal are distributed on two antennas (see Chap-
ter 4.7.2, "Antenna Diversity", on page 42). Therefore the symbol number is reduced
to half.
Measurement Basics
Channels, Codes and Symbols
The following table shows the relationship between the code class, the spreading factor, the number of codes per channel, and the symbol rate.
Table 4-1: Relationship between various code parameters for CDMA2000 BTS signals
Code
class
2 4 128 307.2 384 192
3 8 64 153.6 192 96
4 16 32 76.8 96 48
5 32 16 38.4 48 24
6 64 8 19.2 24 12
7 128 4 9.6 12 6
Table 4-2: Relationship between various code parameters for CDMA2000 MS signals
Code
class
1 2 128 614.4 768
2 4 64 307.2 384
3 8 32 153.6 192
Spreading
factor
Spreading
factor
No.
codes /
channel
No. codes /
channel
Symbol rate [ksps] Symbols per PCG
(no transmit diversity)
Symbol rate [ksps] Symbols per PCG
Symbols per PCG
(transmit diversity)
4 16 16 76.8 96
5 32 8 38.4 48
6 64 4 19.2 24
37User Manual 1176.8539.02 ─ 04
Page 38

R&S®FPS-K82/-K83
Number of bits per symbol
Depending on the modulation type, a symbol consists of the following number of bits:
●
●
●
●
Measurement Basics
Code Display and Sort Order
BPSK: 1 bit (for BTS signals, only the I-component is assigned)
QPSK: 2 bits (I-component followed by the Q-component)
8PSK: 3 bits
16QAM: 4 bits
Figure 4-1: Bits per symbol constellations for different modulation types in the BTS application
4.3 Code Display and Sort Order
In the result displays that refer to codes, the currently selected code is highlighted in
the diagram. You select a code by entering a code number in the "Evaluation Range"
settings.
By default, codes are displayed in ascending order of the code number (Hadamard
order). The currently selected code number is highlighted. If the code belongs to a
detected active channel, the entire channel is highlighted. (For details on active channels and channel detection see Chapter 4.8, "Channel Detection and Channel Types",
on page 43.)
However, in CDMA2000 signals, the codes that belong to the same channel need not
lie next to each other in the code domain, they can be distributed.
38User Manual 1176.8539.02 ─ 04
Page 39

R&S®FPS-K82/-K83
Example: Example for Hadamard order
For a base spreading factor of 64, the following code order is displayed:
0.64, 1.64, 2.64, …, 63.64.
Figure 4-2: Code Domain Error Power result display in Hadamard code sorting order
To compare all codes in the same channel visually, a Bit-Reverse sorting order is provided. In this case, all codes of a channel are displayed next to each other.
Measurement Basics
Code Display and Sort Order
Example: Example for Bit-Reverse order
For a base spreading factor of 64, the following code order can be displayed:
0.64, 32.64, 16.64, 48.64, 8.64, 40.64, …, 15.64, 47.64,31.64, 63.64
Figure 4-3: Code Domain Error Power result display in BitReverse code sorting order
For the display in the CDMA2000 BTS application, the scale for code-based diagrams
displays 64 codes by default (32 in the MS application). However, you can change the
base spreading factor for the display, and thus the number of displayed codes.
Alias power
Note, however, that if you select a base spreading factor that is lower than the actual
spreading factor used by the channel (e.g. 64 for channels with a base spreading factor of 128), the results are distorted. This is due to the fact that a wider area of the
code domain is considered than the code actually occupies, for example when calculating the power level. The excess power calculated due to a false spreading factor is
referred to as alias power.
39User Manual 1176.8539.02 ─ 04
Page 40

R&S®FPS-K82/-K83
Measurement Basics
Code Mapping and Branches
4.4 Scrambling via PN Offsets and Long Codes
Short code scrambling
Base stations use a pseudo noise (PN) sequence (also referred to as short code
sequence) to scramble the data during transmission. The used PN sequence is circulated in fixed time intervals. A specified PN offset value determines the start phase for
the short code sequence.
The PN parameter is unique for each base station. Thus, the CDMA2000 BTS application can distinguish the signals from different base stations quickly if both of the following conditions apply:
●
The "PN Offset" is defined in the signal description
●
An external trigger is used to provide a reference for the start phase
If no offset is specified or no external trigger is available, calculation is much slower as
the correct PN must be determined from all possible positions.
During short code scrambling, the channel data is split up into I and Q components.
Long code scrambling
Mobile stations also use a PN short code, but with a fixed or no offset. Additionally, a
complex long code is used for scrambling, making the data less susceptible to interference. The long code used by a mobile station is defined by a mask and an offset.
The CDMA2000 MS application requires these settings to distinguish the senders.
They are defined in the signal description.
The long code offset also includes the PN offset (if any) and is defined in chips. The
offset corresponds to the GPS timing since 6.1.1980 00:00:00 UTC. The offset in chips
is calculated as follows:
tSinceStartGPS * 1.2288 MChips/s
Where tSinceStartGPS is defined in seconds
The offset is applied at the next trigger pulse, which cannot occur until a setup time of
300 ms has elapsed.
A special long code generation mode is provided to analyze signals sent by an Agilent ESG 101 generator.
During long code scrambling, the channel data is mapped either to the I or to the Q
branch of the complex input signal.
4.5 Code Mapping and Branches
Since MS signals use long code scrambling, the channel data is mapped either to the I
or to the Q branch of the complex input signal. During channel detection, the branch to
which the data was mapped is determined and indicated in the channel table. During
analysis, each branch of the symbol constellation area (imaginary part, I, or real part,
40User Manual 1176.8539.02 ─ 04
Page 41

R&S®FPS-K82/-K83
Q) can be evaluated independently. Thus, when analyzing MS signals, you must define
which branch results you want to analyze. Especially for code power measurements
the results can vary considerably. While a channel can be active on one branch, the
other branch can belong to an inactive channel.
Measurement Basics
Transmission with Multiple Carriers and Multiple Antennas
4.6 Radio Configuration
The radio configuration specifies various settings for transmission according to the
CDMA2000 standard including:
●
Allowed data rates
●
Modulation types
●
Use of special channels
●
Transmit diversity
The standard describes nine RCs for BTS and six for MS signals, for different transmission scenarios.
In the BTS application, the radio configuration can be customized for two channel
types: PDCH and CHAN (see Chapter 4.8.1, "BTS Channel Types", on page 43).
The applied RC is specified for each channel of these types in the channel tables. Predefined channel tables are provided for particular radio configurations (see Chapter A.
1, "Reference: Predefined Channel Tables", on page 226).
The following RCs are used in the BTS application:
Table 4-3: RCs used in the BTS application:
Channel type Modulation Manual operation SCPI parameter
PDCH QPSK 10 10
8PSK 10 20
16QAM 10 30
CHAN
Special channels
4.7 Transmission with Multiple Carriers and Multiple
1-2 1
3-5 3
- 0
Antennas
The CDMA2000 standard allows for transmission using multiple carriers as well as
transmission via multiple antennas.
41User Manual 1176.8539.02 ─ 04
Page 42

R&S®FPS-K82/-K83
Measurement Basics
Transmission with Multiple Carriers and Multiple Antennas
4.7.1 Multicarrier Mode
The CDMA2000 applications can filter out and analyze one carrier out of a multicarrier
signal, if a special multicarrier mode is activated in the signal description.
Two filter types used to select the required carrier from the signal are available for
selection: a low-pass filter and an RRC filter.
By default, the low-pass filter is active. The low-pass filter affects the quality of the
measured signal compared to a measurement without a filter. The frequency response
of the low-pass filter is shown below.
Figure 4-4: Frequency response of the low-pass multicarrier filter
The RRC filter comes with an integrated Hamming window. The roll-off factor of the
RRC filter defines the slope of the filter curve and therefore the excess bandwidth of
the filter. The cut-off frequency of the RRC filter is the frequency at which the passband
of the filter begins. Both parameters can be configured.
4.7.2 Antenna Diversity
The standard allows for transmission via multiple antennas (transmit diversity). If
transmit diversity is implemented for the input signal, the CDMA2000 BTS application
must know which antenna to analyze the input from. This information is provided by the
signal description ("Antenna Diversity"). Depending on which antenna is selected for
analysis, certain special channels are required for predefined channel tables (see also
"Channel table definition for transmit diversity" on page 45):
42User Manual 1176.8539.02 ─ 04
Page 43

R&S®FPS-K82/-K83
Antenna Required special channels
1 Pilot channel (F-PICH, 0.64) required and used as power reference
2 Transmit diversity pilot channel (F-TDPICH, 16.128) required and used as power ref-
- (No diversity) Pilot channel (F-PICH, 0.64) required and used as power reference
Measurement Basics
Channel Detection and Channel Types
Transmit diversity pilot channel (F-TDPICH, 16.128) not allowed
erence
Pilot channel (F-PICH, 0.64) not allowed
Transmit diversity pilot channel (F-TDPICH, 16.128) required
4.8 Channel Detection and Channel Types
The CDMA2000 applications provide two basic methods of detecting active channels:
●
Automatic search using pilot sequences
The application performs an automatic search for active (DPCH) channels throughout the entire code domain. At the specific codes at which channels can be expected, the application detects an active channel if the corresponding symbol rate and
a sufficiently high power level is measured (see "Inactive Channel Threshold"
on page 78).
Any channel that does not have a predefined channel number and symbol rate is
considered to be a data channel.
In the MS application, a channel is considered to be active if a minimum signal/
noise ratio is maintained within the channel.
●
Comparison with predefined channel tables
The input signal is compared to a predefined channel table. All channels that are
included in the predefined channel table are considered to be active.
For a list of predefined channel tables provided by the CDMA2000 applications,
see Chapter A.1, "Reference: Predefined Channel Tables", on page 226.
Quasi-inactive channels in the MS application
In the MS application, only one branch in the code domain is analyzed at a time (see
also Chapter 4.5, "Code Mapping and Branches", on page 40). However, even if the
code on the analyzed branch is inactive, the code with the same number on the other
branch can belong to an active channel. In this case, the channel is indicated as
quasi-inactive in the current branch evaluation.
4.8.1 BTS Channel Types
The CDMA2000 standard defines various BTS channel types. Some special channels
are mandatory and must be contained in the signal, as they have control or synchronization functions. Thus, these channels always occupy a specific channel number and
use a specific symbol rate by which they can be identified.
43User Manual 1176.8539.02 ─ 04
Page 44

R&S®FPS-K82/-K83
Special channels
The CDMA2000 BTS application expects at least the Pilot Channel (F-PICH) or the
Transmit Diversity Pilot CHannel (F-TDPICH) for the Code Domain Power measurements.
The following channels are detected automatically during automatic channel detection:
Table 4-4: Common CDMA2000 BTS channels and their usage
Measurement Basics
Channel Detection and Channel Types
Channel
type
F-PICH 0.64 BPSK Pilot channel
F-PCH 1.64 BPSK Paging channel
F-TDPICH 16.128 BPSK Transmit Diversity Pilot CHannel
F-SYNC 32.64 BPSK Synchronization channel
F-CHAN
INACTIVE
F-PDCCH
F-PDCH 0.32 QPSK, 8PSK,
Ch.no
. / SF
Modulation Description
BPSK (RC 1+2)
QPSK (RC 3-5)
- Inactive channel
QPSK Packet Data Control CHannel
or 16-QAM
Active data channel
Packet Data CHannel
In addition, the following channel types can be defined in a predefined channel table
for the CDMA2000 BTS application.
Channel type Ch.no. / SF Description
F-APICH BPSK Auxiliary Pilot CHannel
F-ATDPICH BPSK Auxiliary Transmit Diversity Pilot CHannel
F-BCH QPSK Broadcast CHannel
F-CACH QPSK Common Assignment Channel
F-CCCH QPSK Common Control CHannel
F-CPCCH QPSK Common Power Control CHannel
44User Manual 1176.8539.02 ─ 04
Page 45

R&S®FPS-K82/-K83
Channel table definition for transmit diversity
In a measurement scenario with two antennas (transmit diversity), the following conditions apply to the channel table definition:
●
●
●
Measurement Basics
Channel Detection and Channel Types
Antenna 1 is used for transmission:
– The pilot channel F-PICH must be included.
– The pilot channel of antenna 2 F-TDPICH must not be included.
Antenna 2 is used for transmission:
– The pilot channel of antenna 2 F-TDPICH must be included.
– The pilot channel F-PICH must not be included.
Both antennas are used for transmission:
– The pilot channel F-PICH must be included.
– The pilot channel of antenna 2 F-TDPICH must be included.
4.8.2 MS Channel Types
The following channel types can be detected in CDMA2000 MS signals by the
CDMA2000 MS application.
Channel
type
ACKCH 16.64 Q Reverse Acknowledgment Channel (1xEV-DV)
CCCH 2.8 Q Reverse Common Control Channel
CQICH 12.16 I (if FCH
DCCH 8.16 I Reverse Dedicated Control Channel
EACH 2.8 Q Enhanced Access Channel
FCH 4.16 Q Reverse Fundamental Channel
PICH 0.32 I Reverse Pilot Channel
S1CH 1.2 or
S2CH 2.4 or
Ch.no /SFMapping Description
available) /Q
Q Reverse Supplemental 1 Channel
2.4
I Reverse Supplemental 2 Channel
6.8
Reverse Channel Quality Indicator Channel (1xEV-DV)
Note: Since the EACH has the same mapping, the same channel number and the same spreading factor
as the CCCH, it is not possible to distinguish them during an automatic search. In this case, both the
EACH and CCCH are output.
45User Manual 1176.8539.02 ─ 04
Page 46

R&S®FPS-K82/-K83
Measurement Basics
Test Setup for CDMA2000 Tests
4.9 Test Setup for CDMA2000 Tests
Before a CDMA measurement can be performed, the R&S FPS must be set up in a
test environment. This section describes the required settings of the R&S FPS if it is
used as a CDMA2000 base or mobile station tester. The R&S FPS must be supplied
with power and configured correctly, as described in the R&S FPS Getting Started
manual, "Preparing For Use". Furthermore, the application firmware CDMA2000 BTS
or CDMA2000 MS must be enabled. Installation and enabling of the application firmware are described in the R&S FPS Getting Started manual or in the Release Notes.
Risk of instrument damage due to inappropriate operating conditions
An unsuitable operating site or test setup can damage the instrument and connected
devices. Before switching on the instrument, observe the information on appropriate
operating conditions provided in the data sheet. In particular, ensure the following:
●
All fan openings are unobstructed and the airflow perforations are unimpeded. The
minimum distance from the wall is 10 cm.
●
The instrument is dry and shows no sign of condensation.
●
The instrument is positioned as described in the following sections.
●
The ambient temperature does not exceed the range specified in the data sheet.
●
Signal levels at the input connectors are all within the specified ranges.
●
Signal outputs are connected correctly and are not overloaded.
Required units and accessories
The measurements are performed with the following units and accessories:
●
An R&S FPS equipped with the CDMA2000 BTS or MS option.
●
R&S SMU signal generator equipped with option SMU-B9/B10/B11 baseband generator and SMUK46 CDMA2000 incl. 1xEVDV.
●
1 coaxial cable, 50 Ω, approximately 1 m, N connector
●
2 coaxial cables, 50 Ω, approximately 1 m, BNC connector
General Test Setup
Connect the antenna output (or TX output) of the base station/mobile station to the RF
input of the R&S FPS. Use a power attenuator exhibiting suitable attenuation.
46User Manual 1176.8539.02 ─ 04
Page 47

R&S®FPS-K82/-K83
The following values for external attenuation are recommended to ensure that the RF
input of the R&S FPS is protected and the sensitivity of the unit is not reduced too
much:
Maximum Power Recommended external attenuation
≥ 55 to 60 dBm 35 to 40 dB
Measurement Basics
Test Setup for CDMA2000 Tests
TX signal
3
2
GHI1ABC
DEF
5 64
7
8
9
STU
ÜVW
XYZ
.-0
S CRCL M
RF
INPUT
≥ 50 to 55 dBm 30 to 35 dB
≥ 45 to 50 dBm 25 to 30 dB
≥ 40 to 45 dBm 20 to 25 dB
≥ 35 to 40 dBm 15 to 20 dB
≥ 30 to 35 dBm 10 to 15 dB
≥ 25 to 30 dBm 0 to 10 dB
≥ 20 to 25 dBm 0 to 5 dB
≤ 20 dBm 0 dB
●
For signal measurements at the output of two-port networks, connect the reference
frequency of the signal source to the rear reference input (REF INPUT) of the
R&S FPS.
●
The R&S FPS must be operated with an external frequency reference to ensure
that the error limits of the CDMA2000 specification for frequency measurements on
base stations/mobile stations are met. A rubidium frequency standard can be used
as a reference source, for example.
●
If the device under test (DUT) has a trigger output, connect the trigger output of the
DUT to one of the trigger inputs (TRIGGER INPUT) of the R&S FPS (see "Trigger
2" on page 74).
Presettings
(For details see Chapter 6.2, "Code Domain Analysis", on page 54)
●
Enter the external attenuation.
●
Enter the reference level.
●
Enter the center frequency.
47User Manual 1176.8539.02 ─ 04
Page 48

R&S®FPS-K82/-K83
●
●
●
●
Measurement Basics
CDA Measurements in MSRA Operating Mode
Set the trigger.
If used, enable the external reference.
Select the CDMA2000 standard and the desired measurement.
Set the PN offset.
4.10 CDA Measurements in MSRA Operating Mode
The CDMA2000 BTS application can also be used to analyze data in MSRA operating
mode.
In MSRA operating mode, only the MSRA Master actually captures data; the MSRA
applications receive an extract of the captured data for analysis, referred to as the
application data. For the CDMA2000 BTS application in MSRA operating mode, the
application data range is defined by the same settings used to define the signal capture in Signal and Spectrum Analyzer mode. In addition, a capture offset can be
defined, i.e. an offset from the start of the captured data to the start of the analysis
interval for the CDMA2000 BTS measurement.
Data coverage for each active application
Generally, if a signal contains multiple data channels for multiple standards, separate
applications are used to analyze each data channel. Thus, it is of interest to know
which application is analyzing which data channel. The MSRA Master display indicates
the data covered by each application, restricted to the channel bandwidth used by the
corresponding standard (for CDMA2000: 1.2288 MHz), by vertical blue lines labeled
with the application name.
Analysis interval
However, the individual result displays of the application need not analyze the complete data range. The data range that is analyzed by the individual result display is
referred to as the analysis interval.
In the CDMA2000 BTS application, the analysis interval is automatically determined
according to the selected set, PCG or code to analyze, which is defined for the evaluation range, depending on the result display. The analysis interval cannot be edited
directly in the CDMA2000 BTS application, but is changed automatically when you
change the evaluation range.
Analysis line
A frequent question when analyzing multi-standard signals is how each data channel is
correlated (in time) to others. Thus, an analysis line has been introduced. The analysis
line is a common time marker for all MSRA slave applications. It can be positioned in
any MSRA slave application or the MSRA Master and is then adjusted in all other slave
applications. Thus, you can easily analyze the results at a specific time in the measurement in all slave applications and determine correlations.
48User Manual 1176.8539.02 ─ 04
Page 49

R&S®FPS-K82/-K83
If the marked point in time is contained in the analysis interval of the slave application,
the line is indicated in all time-based result displays, such as time, symbol, slot or bit
diagrams. By default, the analysis line is displayed, however, it can be hidden from
view manually. In all result displays, the "AL" label in the window title bar indicates
whether the analysis line lies within the analysis interval or not:
●
●
●
Measurement Basics
CDA Measurements in MSRA Operating Mode
orange "AL": the line lies within the interval
white "AL": the line lies within the interval, but is not displayed (hidden)
no "AL": the line lies outside the interval
For details on the MSRA operating mode, see the R&S FPS MSRA User Manual.
49User Manual 1176.8539.02 ─ 04
Page 50

R&S®FPS-K82/-K83
5 I/Q Data Import and Export
Baseband signals mostly occur as so-called complex baseband signals, i.e. a signal
representation that consists of two channels; the in phase (I) and the quadrature (Q)
channel. Such signals are referred to as I/Q signals. The complete modulation information and even distortion that originates from the RF, IF or baseband domains can be
analyzed in the I/Q baseband.
Importing and exporting I/Q signals is useful for various applications:
●
●
As opposed to storing trace data, which may be averaged or restricted to peak values,
I/Q data is stored as it was captured, without further processing. The data is stored as
complex values in 32-bit floating-point format. Multi-channel data is not supported. The
I/Q data is stored in a format with the file extension .iq.tar.
I/Q Data Import and Export
Import/Export Functions
Generating and saving I/Q signals in an RF or baseband signal generator or in
external software tools to analyze them with the R&S FPS later
Capturing and saving I/Q signals with an RF or baseband signal analyzer to analyze them with the R&S FPS or an external software tool later
For a detailed description see the R&S FPS I/Q Analyzer and I/Q Input User Manual.
An application note on converting Rohde & Schwarz I/Q data files is available from the
Rohde & Schwarz website:
1EF85: Converting R&S I/Q data files
Export only in MSRA mode
In MSRA mode, I/Q data can only be exported to other applications; I/Q data cannot be
imported to the MSRA Master or any MSRA applications.
● Import/Export Functions..........................................................................................50
5.1 Import/Export Functions
Access: "Save" / "Open" icon in the toolbar > "Import" / "Export"
The R&S FPS provides various evaluation methods for the results of the performed
measurements. However, you may want to evaluate the data with further, external
applications. In this case, you can export the measurement data to a standard format
file (ASCII or XML). Some of the data stored in these formats can also be re-imported
to the R&S FPS for further evaluation later, for example in other applications.
The following data types can be exported (depending on the application):
●
Trace data
●
Table results, such as result summaries, marker peak lists etc.
50User Manual 1176.8539.02 ─ 04
Page 51

R&S®FPS-K82/-K83
I/Q data can only be imported and exported in applications that process I/Q data, such
as the I/Q Analyzer or optional applications.
See the corresponding user manuals for those applications for details.
These functions are only available if no measurement is running.
In particular, if Continuous Sweep / Run Cont is active, the import/export functions are
not available.
Import ...........................................................................................................................51
Export ...........................................................................................................................51
Import
Access: "Save/Recall" > Import
Provides functions to import data.
Importing I/Q data is not possible in MSRA operating mode.
I/Q Data Import and Export
Import/Export Functions
└ I/Q Import .......................................................................................................51
└ I/Q Export .......................................................................................................51
I/Q Import ← Import
Opens a file selection dialog box to select an import file that contains I/Q data. This
function is only available in single sweep mode and only in applications that process
I/Q data, such as the I/Q Analyzer or optional applications.
Note that the I/Q data must have a specific format as described in the R&S FPS I/Q
Analyzer and I/Q Input User Manual.
Input from I/Q data files is imported as it was stored, including any correction factors,
for example from transducers or SnP files. Any currently configured correction factors
at the time of import, however, are not applied.
Remote command:
MMEMory:LOAD:IQ:STATe on page 215
Export
Access: "Save/Recall" > Export
Opens a submenu to configure data export.
I/Q Export ← Export
Opens a file selection dialog box to define an export file name to which the I/Q data is
stored. This function is only available in single sweep mode.
Note: MSRA operating mode. Importing I/Q data is not possible in MSRA operating
mode.
Note: Storing large amounts of I/Q data (several Gigabytes) can exceed the available
(internal) storage space on the R&S FPS. In this case, it can be necessary to use an
external storage medium.
Note: Secure user mode.
51User Manual 1176.8539.02 ─ 04
Page 52

R&S®FPS-K82/-K83
In secure user mode, settings that are stored on the instrument are stored to volatile
memory, which is restricted to 256 MB. Thus, a "memory limit reached" error can occur
although the hard disk indicates that storage space is still available.
To store data permanently, select an external storage location such as a USB memory
device.
For details, see "Protecting Data Using the Secure User Mode" in the "Data Management" section of the R&S FPS User Manual.
Remote command:
MMEMory:STORe<n>:IQ:STATe on page 216
MMEMory:STORe<n>:IQ:COMMent on page 215
I/Q Data Import and Export
Import/Export Functions
52User Manual 1176.8539.02 ─ 04
Page 53

R&S®FPS-K82/-K83
6 Configuration
The CDMA2000 applications provide several different measurements for signals
according to the CDMA2000 standard. The main and default measurement is Code
Domain Analysis. In addition to the code domain power measurements specified by the
CDMA2000 standard, the CDMA2000 applications offer measurements with predefined
settings in the frequency domain, e.g. RF power measurements.
Only one measurement type can be configured per channel; however, several channels for CDMA2000 applications can be configured in parallel on the R&S FPS. Thus,
you can configure one channel for a Code Domain Analysis, for example, and another
for a Power measurement for the same input signal. Then you can use the Sequencer
to perform all measurements consecutively and either switch through the results easily
or monitor all results at the same time in the "MultiView" tab.
For details on the Sequencer function see the R&S FPS User Manual.
Selecting the measurement type
Configuration
Result Display
When you activate a measurement channel in a CDMA2000 application, Code Domain
Analysis of the input signal is started automatically. However, the CDMA2000 applications also provide other measurement types.
► To select a different measurement type, do one of the following:
● Select the "Overview" softkey. In the "Overview", select the "Select Measurement" button. Select the required measurement.
● Press the MEAS key. In the "Select Measurement" dialog box, select the
required measurement.
● Result Display......................................................................................................... 53
● Code Domain Analysis............................................................................................54
● RF Measurements...................................................................................................88
6.1 Result Display
The captured signal can be displayed using various evaluation methods. All evaluation
methods available for CDMA2000 applications are displayed in the evaluation bar in
SmartGrid mode when you do one of the following:
●
Select the
●
Select the "Display" button in the "Overview".
●
Press the MEAS key.
●
Select the "Display Config" softkey in any CDMA2000 menu.
"SmartGrid" icon from the toolbar.
Up to 16 evaluation methods can be displayed simultaneously in separate windows.
The CDMA2000 evaluation methods are described in Chapter 3.1.2, "Evaluation Meth-
ods for Code Domain Analysis", on page 16.
53User Manual 1176.8539.02 ─ 04
Page 54

R&S®FPS-K82/-K83
To close the SmartGrid mode and restore the previous softkey menu select the
"Close" icon in the righthand corner of the toolbar, or press any key.
For details on working with the SmartGrid see the R&S FPS Getting Started manual.
Configuration
Code Domain Analysis
6.2 Code Domain Analysis
Access: MODE > "CDMA2000 BTS"/"CDMA2000 MS"
CDMA2000 measurements require a special application on the R&S FPS
When you activate a CDMA2000 application the first time, a set of parameters is
passed on from the currently active application:
●
Center frequency and frequency offset
●
Reference level and reference level offset
●
Attenuation
After initial setup, the parameters for the measurement channel are stored upon exiting
and restored upon re-entering the channel. Thus, you can switch between applications
quickly and easily.
When you activate a CDMA2000 application, Code Domain Analysis of the input signal
is started automatically with the default configuration. The "Code Domain Analyzer"
menu is displayed and provides access to the most important configuration functions.
This menu is also displayed when you press the MEAS CONFIG key.
The "Span", "Bandwidth", "Lines", and "Marker Functions" menus are not available for
CDA measurements.
Code Domain Analysis can be configured easily in the "Overview" dialog box, which is
displayed when you select the "Overview" softkey from any menu.
Importing and Exporting I/Q Data
Access: , "Save/Recall" menu > "Import I/Q"/ "Export I/Q"
The CDMA2000 applications can not only measure the CDMA2000 I/Q data to be evaluated. They can also import I/Q data, provided it has the correct format. Furthermore,
the evaluated I/Q data from the CDMA2000 applications can be exported for further
analysis in external applications.
For details on importing and exporting I/Q data, see the R&S FPS User Manual.
● Configuration Overview...........................................................................................55
● Signal Description................................................................................................... 57
● Data Input and Output Settings...............................................................................62
54User Manual 1176.8539.02 ─ 04
Page 55

R&S®FPS-K82/-K83
● Frontend Settings....................................................................................................65
● Trigger Settings.......................................................................................................70
● Signal Capture (Data Acquisition)...........................................................................75
● Application Data (MSRA) ....................................................................................... 77
● Channel Detection...................................................................................................77
● Sweep Settings....................................................................................................... 85
● Automatic Settings.................................................................................................. 87
Configuration
Code Domain Analysis
6.2.1 Configuration Overview
Access: all menus
Throughout the measurement channel configuration, an overview of the most important
currently defined settings is provided in the "Overview".
In addition to the main measurement settings, the "Overview" provides quick access to
the main settings dialog boxes. Thus, you can easily configure an entire measurement
channel from input over processing to output and evaluation by stepping through the
dialog boxes as indicated in the "Overview".
The available settings and functions in the "Overview" vary depending on the currently
selected measurement. For RF measurements, see Chapter 6.3, "RF Measurements",
on page 88.
For Code Domain Analysis, the "Overview" provides quick access to the following configuration dialog boxes (listed in the recommended order of processing):
1. "Select Measurement"
See "Selecting the measurement type" on page 53
2. "Signal Description"
See Chapter 6.2.2, "Signal Description", on page 57
55User Manual 1176.8539.02 ─ 04
Page 56

R&S®FPS-K82/-K83
3. "Input/ Frontend"
4. (Optionally:) "Trigger"
5. "Signal Capture"
6. "Channel Detection"
7. "Analysis"
8. "Display Configuration"
Configuration
Code Domain Analysis
See Chapter 6.2.3, "Data Input and Output Settings", on page 62 and Chap-
ter 6.2.4, "Frontend Settings", on page 65
See Chapter 6.2.5, "Trigger Settings", on page 70
See Chapter 6.2.6, "Signal Capture (Data Acquisition)", on page 75
Note: The "Synchronization" button indicated in the "Overview" is not required for
CDMA2000 measurements.
See Chapter 6.2.8, "Channel Detection", on page 77
See Chapter 7, "Analysis", on page 94
See Chapter 3.1.2, "Evaluation Methods for Code Domain Analysis", on page 16
To configure settings
► Select any button in the "Overview" to open the corresponding dialog box.
Select a setting in the channel bar (at the top of the measurement channel tab) to
change a specific setting.
Preset Channel
Select the "Preset Channel" button in the lower left-hand corner of the "Overview" to
restore all measurement settings in the current channel to their default values.
Do not confuse the "Preset Channel" button with the PRESET key, which restores the
entire instrument to its default values and thus closes all channels on the R&S FPS
(except for the default channel)!
Remote command:
SYSTem:PRESet:CHANnel[:EXEC] on page 129
Select Measurement
Selects a different measurement to be performed.
See "Selecting the measurement type" on page 53.
Specifics for
The channel may contain several windows for different results. Thus, the settings indicated in the "Overview" and configured in the dialog boxes vary depending on the
selected window.
Select an active window from the "Specifics for" selection list that is displayed in the
"Overview" and in all window-specific configuration dialog boxes.
The "Overview" and dialog boxes are updated to indicate the settings for the selected
window.
56User Manual 1176.8539.02 ─ 04
Page 57

R&S®FPS-K82/-K83
Configuration
Code Domain Analysis
6.2.2 Signal Description
Access: "Overview" > "Signal Description"
The signal description provides information on the expected input signal.
● BTS Signal Description........................................................................................... 57
● MS Signal Description.............................................................................................59
6.2.2.1 BTS Signal Description
Access: "Overview" > "Signal Description"
These settings describe the input signal in BTS measurements.
PN Offset.......................................................................................................................57
Antenna Diversity - Antenna Number............................................................................58
Multicarrier.................................................................................................................... 58
└ Enhanced Algorithm........................................................................................58
└ Multicarrier Filter............................................................................................. 58
└ Filter Type.......................................................................................................58
└ Roll-Off Factor...................................................................................... 59
└ Cut Off Frequency................................................................................ 59
PN Offset
Specifies the Pseudo Noise (PN) offset from an external trigger. If no offset is specified
or no external trigger is available, calculation is much slower as the correct PN must be
determined from all possible positions.
57User Manual 1176.8539.02 ─ 04
Page 58

R&S®FPS-K82/-K83
For details, see Chapter 4.4, "Scrambling via PN Offsets and Long Codes",
on page 40.
Remote command:
[SENSe:]CDPower:PNOFfset on page 134
Antenna Diversity - Antenna Number
Activates or deactivates the orthogonal transmit diversity (two-antenna system) and
defines the antenna for which the results are displayed.
For details on antenna diversity, see also Chapter 4.7.2, "Antenna Diversity",
on page 42.
"Antenna 1"
"Antenna 2"
"Off"
Remote command:
[SENSe:]CDPower:ANTenna on page 133
Configuration
Code Domain Analysis
The signal of antenna 1 is fed in.
The signal of antenna 2 is fed in.
The aggregate signal from both antennas is fed in.
The pilot channels of both antennas are required.
As reference for the code power (Power Reference), PICH is used.
Multicarrier
Activates or deactivates the multicarrier mode. This mode improves the processing of
multicarrier signals. It allows you to measure one carrier out of a multicarrier signal.
Remote command:
CONFigure:CDPower[:BTS]:MCARrier[:STATe] on page 133
Enhanced Algorithm ← Multicarrier
Activates or deactivates the enhanced algorithm that is used for signal detection on
multicarrier signals. This algorithm slightly increases the calculation time.
This setting is only available if "Multicarrier" on page 58 is activated.
Remote command:
CONFigure:CDPower[:BTS]:MCARrier:MALGo on page 133
Multicarrier Filter ← Multicarrier
Activates or deactivates the usage of a filter for signal detection on multicarrier signals.
This setting is only available if "Multicarrier" on page 58 is activated.
For details, see Chapter 4.7.1, "Multicarrier Mode", on page 42.
Remote command:
CONFigure:CDPower[:BTS]:MCARrier:FILTer[:STATe] on page 132
Filter Type ← Multicarrier
Selects the filter type if Multicarrier Filter is activated.
Two filter types are available for selection: a low-pass filter and an RRC filter.
By default, the low-pass filter is active. The low-pass filter affects the quality of the
measured signal compared to a measurement without a filter.
58User Manual 1176.8539.02 ─ 04
Page 59

R&S®FPS-K82/-K83
The RRC filter comes with an integrated Hamming window. If selected, two more settings become available for configuration: the Roll-Off Factor and the Cut Off Fre-
quency.
Remote command:
CONFigure:CDPower[:BTS]:MCARrier:FILTer:TYPE on page 132
Roll-Off Factor ← Filter Type ← Multicarrier
Defines the roll-off factor of the RRC filter which defines the slope of the filter curve
and therefore the excess bandwidth of the filter. Possible values are between 0.01 and
0.99 in 0.01 steps. The default value is 0.02.
This parameter is available for the RRC filter.
Remote command:
CONFigure:CDPower[:BTS]:MCARrier:FILTer:TYPE on page 132
CONFigure:CDPower[:BTS]:MCARrier:FILTer:ROFF on page 131
Cut Off Frequency ← Filter Type ← Multicarrier
Defines the frequency at which the passband of the RRC filter begins. Possible values
are between 0.1 MHz and 2.4 MHz in 1 Hz steps. The default value is 1.25 MHz
This parameter is available for the RRC filter.
Remote command:
CONFigure:CDPower[:BTS]:MCARrier:FILTer:TYPE on page 132
CONFigure:CDPower[:BTS]:MCARrier:FILTer:COFRequency on page 131
Configuration
Code Domain Analysis
6.2.2.2 MS Signal Description
Access: "Overview" > "Signal Description"
These settings describe the input signal in MS measurements.
59User Manual 1176.8539.02 ─ 04
Page 60

R&S®FPS-K82/-K83
Configuration
Code Domain Analysis
Long Code Mask...........................................................................................................60
Long Code Offset..........................................................................................................60
Long Code Generation..................................................................................................61
Multicarrier.................................................................................................................... 61
└ Enhanced Algorithm........................................................................................61
└ Multicarrier Filter............................................................................................. 61
└ Filter Type.......................................................................................................61
└ Roll-Off Factor...................................................................................... 62
└ Cut Off Frequency................................................................................ 62
Long Code Mask
Defines the long code mask of the mobile in hexadecimal form. The value range is
from 0 to 4FFFFFFFFFF.
For the default mask value of 0, the Long Code Offset is not considered.
For more information on long codes, see "Long code scrambling" on page 40.
Remote command:
[SENSe:]CDPower:LCODe:MASK on page 134
Long Code Offset
Defines the long code offset, including the PN offset, in chips in hexadecimal format
with a 52-bit resolution. This value corresponds to the GPS timing since 6.1.1980
00:00:00 UTC. This offset is applied at the next trigger pulse (which cannot occur until
a setup time of 300 ms has elapsed). The default value is 0.
The setting is ignored if the Long Code Mask is set to 0.
For more information on long codes, see "Long code scrambling" on page 40.
60User Manual 1176.8539.02 ─ 04
Page 61

R&S®FPS-K82/-K83
Remote command:
[SENSe:]CDPower:LCODe:OFFSet on page 135
Long Code Generation
Selects the mode of the long code generation.
"Standard"
"ESG 101"
Remote command:
[SENSe:]CDPower:LCODe:MODE on page 135
Multicarrier
Activates or deactivates the multicarrier mode. This mode improves the processing of
multicarrier signals. It allows you to measure one carrier out of a multicarrier signal.
Remote command:
CONFigure:CDPower[:BTS]:MCARrier[:STATe] on page 133
Configuration
Code Domain Analysis
The CDMA2000 standard long code generator is used.
The Agilent ESG option 101 long code is used; in this case, only sig-
nals from that generator can be analyzed.
Enhanced Algorithm ← Multicarrier
Activates or deactivates the enhanced algorithm that is used for signal detection on
multicarrier signals. This algorithm slightly increases the calculation time.
This setting is only available if "Multicarrier" on page 58 is activated.
Remote command:
CONFigure:CDPower[:BTS]:MCARrier:MALGo on page 133
Multicarrier Filter ← Multicarrier
Activates or deactivates the usage of a filter for signal detection on multicarrier signals.
This setting is only available if "Multicarrier" on page 58 is activated.
For details, see Chapter 4.7.1, "Multicarrier Mode", on page 42.
Remote command:
CONFigure:CDPower[:BTS]:MCARrier:FILTer[:STATe] on page 132
Filter Type ← Multicarrier
Selects the filter type if Multicarrier Filter is activated.
Two filter types are available for selection: a low-pass filter and an RRC filter.
By default, the low-pass filter is active. The low-pass filter affects the quality of the
measured signal compared to a measurement without a filter.
The RRC filter comes with an integrated Hamming window. If selected, two more set-
tings become available for configuration: the Roll-Off Factor and the Cut Off Fre-
quency.
Remote command:
CONFigure:CDPower[:BTS]:MCARrier:FILTer:TYPE on page 132
61User Manual 1176.8539.02 ─ 04
Page 62

R&S®FPS-K82/-K83
Roll-Off Factor ← Filter Type ← Multicarrier
Defines the roll-off factor of the RRC filter which defines the slope of the filter curve
and therefore the excess bandwidth of the filter. Possible values are between 0.01 and
0.99 in 0.01 steps. The default value is 0.02.
This parameter is available for the RRC filter.
Remote command:
CONFigure:CDPower[:BTS]:MCARrier:FILTer:TYPE on page 132
CONFigure:CDPower[:BTS]:MCARrier:FILTer:ROFF on page 131
Cut Off Frequency ← Filter Type ← Multicarrier
Defines the frequency at which the passband of the RRC filter begins. Possible values
are between 0.1 MHz and 2.4 MHz in 1 Hz steps. The default value is 1.25 MHz
This parameter is available for the RRC filter.
Remote command:
CONFigure:CDPower[:BTS]:MCARrier:FILTer:TYPE on page 132
CONFigure:CDPower[:BTS]:MCARrier:FILTer:COFRequency on page 131
Configuration
Code Domain Analysis
6.2.3 Data Input and Output Settings
Access: INPUT / OUTPUT
The R&S FPS can analyze signals from different input sources and provide various
types of output (such as noise or trigger signals).
● Input Source Settings..............................................................................................62
● Output Settings....................................................................................................... 64
6.2.3.1 Input Source Settings
Access: "Overview" > "Input/Frontend" > "Input Source"
The input source determines which data the R&S FPS will analyze.
The default input source for the R&S FPS is "Radio Frequency" , i.e. the signal at the
RF INPUT connector of the R&S FPS. If no additional options are installed, this is the
only available input source.
● Radio Frequency Input............................................................................................62
Radio Frequency Input
Access: "Overview" > "Input/Frontend" > "Input Source" > "Radio Frequency"
62User Manual 1176.8539.02 ─ 04
Page 63

R&S®FPS-K82/-K83
Radio Frequency State ................................................................................................ 63
Input Coupling ..............................................................................................................63
Impedance ................................................................................................................... 63
YIG-Preselector ............................................................................................................63
Radio Frequency State
Activates input from the RF INPUT connector.
Remote command:
INPut:SELect on page 137
Configuration
Code Domain Analysis
Input Coupling
The RF input of the R&S FPS can be coupled by alternating current (AC) or direct current (DC).
AC coupling blocks any DC voltage from the input signal. This is the default setting to
prevent damage to the instrument. Very low frequencies in the input signal may be distorted.
However, some specifications require DC coupling. In this case, you must protect the
instrument from damaging DC input voltages manually. For details, refer to the data
sheet.
Remote command:
INPut:COUPling on page 136
Impedance
For some measurements, the reference impedance for the measured levels of the
R&S FPS can be set to 50 Ω or 75 Ω.
Select 75 Ω if the 50 Ω input impedance is transformed to a higher impedance using a
75 Ω adapter of the RAZ type. (That corresponds to 25Ω in series to the input impedance of the instrument.) The correction value in this case is 1.76 dB = 10 log (75Ω/
50Ω).
This value also affects the unit conversion (see " Reference Level " on page 67).
Remote command:
INPut:IMPedance on page 137
YIG-Preselector
Activates or deactivates the YIG-preselector, if available on the R&S FPS.
63User Manual 1176.8539.02 ─ 04
Page 64

R&S®FPS-K82/-K83
An internal YIG-preselector at the input of the R&S FPS ensures that image frequencies are rejected. However, this is only possible for a restricted bandwidth. To use the
maximum bandwidth for signal analysis you can deactivate the YIG-preselector at the
input of the R&S FPS, which can lead to image-frequency display.
Note that the YIG-preselector is active only on frequencies greater than 8 GHz. Therefore, switching the YIG-preselector on or off has no effect if the frequency is below that
value.
Remote command:
INPut:FILTer:YIG[:STATe] on page 137
Configuration
Code Domain Analysis
6.2.3.2 Output Settings
Access: INPUT/OUTPUT > "Output"
The R&S FPS can provide output to special connectors for other devices.
For details on connectors, refer to the R&S FPS Getting Started manual, "Front / Rear
Panel View" chapters.
How to provide trigger signals as output is described in detail in the R&S FPS User
Manual.
Noise Source Control....................................................................................................64
Noise Source Control
The R&S FPS provides a connector (NOISE SOURCE CONTROL) with a 28 V voltage
supply for an external noise source. By switching the supply voltage for an external
noise source on or off in the firmware, you can activate or deactivate the device as
required.
External noise sources are useful when you are measuring power levels that fall below
the noise floor of the R&S FPS itself, for example when measuring the noise level of an
amplifier.
64User Manual 1176.8539.02 ─ 04
Page 65

R&S®FPS-K82/-K83
In this case, you can first connect an external noise source (whose noise power level is
known in advance) to the R&S FPS and measure the total noise power. From this
value you can determine the noise power of the R&S FPS. Then when you measure
the power level of the actual DUT, you can deduct the known noise level from the total
power to obtain the power level of the DUT.
Remote command:
DIAGnostic:SERVice:NSOurce on page 138
Configuration
Code Domain Analysis
6.2.4 Frontend Settings
Access: "Overview" > "Input / Frontend"
The frequency, amplitude and y-axis scaling settings represent the "frontend" of the
measurement setup.
● Frequency Settings................................................................................................. 65
● Amplitude Settings.................................................................................................. 66
● Y-Axis Scaling.........................................................................................................69
6.2.4.1 Frequency Settings
Access: "Overview" > "Input/Frontend" > "Frequency"
Center Frequency ........................................................................................................ 65
Center Frequency Stepsize ..........................................................................................66
Frequency Offset ..........................................................................................................66
Center Frequency
Defines the center frequency of the signal in Hertz.
The allowed range of values for the center frequency depends on the frequency span.
span > 0: span
f
and span
max
/2 ≤ f
min
depend on the instrument and are specified in the data sheet.
min
center
≤ f
max
– span
min
/2
65User Manual 1176.8539.02 ─ 04
Page 66

R&S®FPS-K82/-K83
Remote command:
[SENSe:]FREQuency:CENTer on page 139
Center Frequency Stepsize
Defines the step size by which the center frequency is increased or decreased using
the arrow keys.
When you use the rotary knob the center frequency changes in steps of only 1/10 of
the span.
The step size can be coupled to another value or it can be manually set to a fixed
value.
This setting is available for frequency and time domain measurements.
"X * Span"
Configuration
Code Domain Analysis
Sets the step size for the center frequency to a defined factor of the
span. The "X-Factor" defines the percentage of the span.
Values between 1 % and 100 % in steps of 1 % are allowed. The
default setting is 10 %.
"= Center"
Sets the step size to the value of the center frequency. The used
value is indicated in the "Value" field.
"Manual"
Defines a fixed step size for the center frequency. Enter the step size
in the "Value" field.
Remote command:
[SENSe:]FREQuency:CENTer:STEP on page 139
Frequency Offset
Shifts the displayed frequency range along the x-axis by the defined offset.
This parameter has no effect on the instrument's hardware, or on the captured data or
on data processing. It is simply a manipulation of the final results in which absolute frequency values are displayed. Thus, the x-axis of a spectrum display is shifted by a
constant offset if it shows absolute frequencies, but not if it shows frequencies relative
to the signal's center frequency.
A frequency offset can be used to correct the display of a signal that is slightly distorted
by the measurement setup, for example.
The allowed values range from -100 GHz to 100 GHz. The default setting is 0 Hz.
Note: In MSRA mode, this function is only available for the MSRA Master.
Remote command:
[SENSe:]FREQuency:OFFSet on page 140
6.2.4.2 Amplitude Settings
Access: "Overview" > "Input/Frontend" > "Amplitude"
Amplitude settings determine how the R&S FPS must process or display the expected
input power levels.
Reference Level ...........................................................................................................67
└ Shifting the Display ( Offset ).......................................................................... 67
└ Unit .................................................................................................................67
66User Manual 1176.8539.02 ─ 04
Page 67

R&S®FPS-K82/-K83
RF Attenuation ............................................................................................................. 68
Using Electronic Attenuation ........................................................................................68
Input Settings ............................................................................................................... 69
Reference Level
Defines the expected maximum reference level. Signal levels above this value may not
be measured correctly. This is indicated by an "IF Overload" status display.
The reference level can also be used to scale power diagrams; the reference level is
then used as the maximum on the y-axis.
Since the hardware of the R&S FPS is adapted according to this value, it is recommended that you set the reference level close above the expected maximum signal level.
Thus you ensure an optimum measurement (no compression, good signal-to-noise
ratio).
Remote command:
DISPlay[:WINDow<n>]:TRACe<t>:Y[:SCALe]:RLEVel on page 143
Configuration
Code Domain Analysis
└ Setting the Reference Level Automatically ( Auto Level )...............................67
└ Attenuation Mode / Value ...............................................................................68
└ Preamplifier (option B22/B24).........................................................................69
Shifting the Display ( Offset ) ← Reference Level
Defines an arithmetic level offset. This offset is added to the measured level. In some
result displays, the scaling of the y-axis is changed accordingly.
Define an offset if the signal is attenuated or amplified before it is fed into the R&S FPS
so the application shows correct power results. All displayed power level results are
shifted by this value.
The setting range is ±200 dB in 0.01 dB steps.
Note, however, that the internal reference level (used to adjust the hardware settings to
the expected signal) ignores any "Reference Level Offset" . Thus, it is important to
keep in mind the actual power level the R&S FPS must handle. Do not rely on the displayed reference level (internal reference level = displayed reference level - offset).
Remote command:
DISPlay[:WINDow<n>]:TRACe<t>:Y[:SCALe]:RLEVel:OFFSet on page 143
Unit ← Reference Level
For CDA measurements, do not change the unit, as this would lead to useless results.
Setting the Reference Level Automatically ( Auto Level ) ← Reference Level
Automatically determines a reference level which ensures that no overload occurs at
the R&S FPS for the current input data. At the same time, the internal attenuators are
adjusted so the signal-to-noise ratio is optimized, while signal compression and clipping are minimized.
To determine the required reference level, a level measurement is performed on the
R&S FPS.
If necessary, you can optimize the reference level further. Decrease the attenuation
level manually to the lowest possible value before an overload occurs, then decrease
the reference level in the same way.
67User Manual 1176.8539.02 ─ 04
Page 68

R&S®FPS-K82/-K83
You can change the measurement time for the level measurement if necessary (see "
Changing the Automatic Measurement Time ( Meastime Manual )" on page 88).
Remote command:
[SENSe:]ADJust:LEVel on page 164
RF Attenuation
Defines the attenuation applied to the RF input of the R&S FPS.
Attenuation Mode / Value ← RF Attenuation
The RF attenuation can be set automatically as a function of the selected reference
level (Auto mode). This ensures that no overload occurs at the RF INPUT connector
for the current reference level. It is the default setting.
By default and when no (optional) electronic attenuation is available, mechanical
attenuation is applied.
In "Manual" mode, you can set the RF attenuation in 1 dB steps (down to 0 dB). Other
entries are rounded to the next integer value. The range is specified in the data sheet.
If the defined reference level cannot be set for the defined RF attenuation, the reference level is adjusted accordingly and the warning "limit reached" is displayed.
NOTICE! Risk of hardware damage due to high power levels. When decreasing the
attenuation manually, ensure that the power level does not exceed the maximum level
allowed at the RF input, as an overload may lead to hardware damage.
Remote command:
INPut:ATTenuation on page 144
INPut:ATTenuation:AUTO on page 144
Configuration
Code Domain Analysis
Using Electronic Attenuation
If the (optional) Electronic Attenuation hardware is installed on the R&S FPS, you can
also activate an electronic attenuator.
In "Auto" mode, the settings are defined automatically; in "Manual" mode, you can
define the mechanical and electronic attenuation separately.
Note: Electronic attenuation is not available for stop frequencies (or center frequencies
in zero span) above 7 GHz.
In "Auto" mode, RF attenuation is provided by the electronic attenuator as much as
possible to reduce the amount of mechanical switching required. Mechanical attenuation may provide a better signal-to-noise ratio, however.
When you switch off electronic attenuation, the RF attenuation is automatically set to
the same mode (auto/manual) as the electronic attenuation was set to. Thus, the RF
attenuation can be set to automatic mode, and the full attenuation is provided by the
mechanical attenuator, if possible.
The electronic attenuation can be varied in 1 dB steps. If the electronic attenuation is
on, the mechanical attenuation can be varied in 5 dB steps. Other entries are rounded
to the next lower integer value.
If the defined reference level cannot be set for the given attenuation, the reference
level is adjusted accordingly and the warning "limit reached" is displayed in the status
bar.
68User Manual 1176.8539.02 ─ 04
Page 69

R&S®FPS-K82/-K83
Remote command:
INPut:EATT:STATe on page 145
INPut:EATT:AUTO on page 145
INPut:EATT on page 145
Input Settings
Some input settings affect the measured amplitude of the signal, as well.
The parameters "Input Coupling" and "Impedance" are identical to those in the "Input"
settings.
Preamplifier (option B22/B24) ← Input Settings
Switches the preamplifier on and off. If activated, the input signal is amplified by 20 dB.
If option R&S FPS-B22 is installed, the preamplifier is only active below 7 GHz.
If option R&S FPS-B24 is installed, the preamplifier is active for all frequencies.
Remote command:
INPut:GAIN:STATe on page 143
Configuration
Code Domain Analysis
6.2.4.3 Y-Axis Scaling
Access: "Overview" > "Input/Frontend" > "Scale"
Or: AMPT > "Scale Config"
The vertical axis scaling is configurable. In Code Domain Analysis, the y-axis usually
displays the measured power levels.
Y-Maximum, Y-Minimum...............................................................................................69
Auto Scale Once .......................................................................................................... 70
Restore Scale (Window)............................................................................................... 70
Y-Maximum, Y-Minimum
Defines the amplitude range to be displayed on the y-axis of the evaluation diagrams.
69User Manual 1176.8539.02 ─ 04
Page 70

R&S®FPS-K82/-K83
Remote command:
DISPlay[:WINDow<n>]:TRACe<t>:Y[:SCALe]:MAXimum on page 142
DISPlay[:WINDow<n>]:TRACe<t>:Y[:SCALe]:MINimum on page 142
Auto Scale Once
Automatically determines the optimal range and reference level position to be displayed for the current measurement settings.
The display is only set once; it is not adapted further if the measurement settings are
changed again.
Remote command:
DISPlay[:WINDow<n>]:TRACe<t>:Y[:SCALe]:AUTO ONCE on page 141
Restore Scale (Window)
Restores the default scale settings in the currently selected window.
Configuration
Code Domain Analysis
6.2.5 Trigger Settings
Access: "Overview" > "Trigger"
Trigger settings determine when the input signal is measured.
External triggers from one of the TRIGGER INPUT/OUTPUT connectors on the
R&S FPS are configured in a separate tab of the dialog box.
70User Manual 1176.8539.02 ─ 04
Page 71

R&S®FPS-K82/-K83
For step-by-step instructions on configuring triggered measurements, see the main
R&S FPS User Manual.
Configuration
Code Domain Analysis
Trigger Source.............................................................................................................. 71
└ Trigger Source................................................................................................ 71
└ Free Run ..............................................................................................71
└ External Trigger 1/2.............................................................................. 72
└ IF Power .............................................................................................. 72
└ Trigger Level ..................................................................................................72
└ Drop-Out Time ............................................................................................... 72
└ Trigger Offset .................................................................................................73
└ Hysteresis ...................................................................................................... 73
└ Trigger Holdoff ............................................................................................... 73
└ Slope ..............................................................................................................73
└ Capture Offset ................................................................................................73
Trigger 2........................................................................................................................74
└ Output Type ................................................................................................... 74
└ Level .................................................................................................... 74
└ Pulse Length ........................................................................................75
└ Send Trigger ........................................................................................75
Trigger Source
The trigger settings define the beginning of a measurement.
Trigger Source ← Trigger Source
Defines the trigger source. If a trigger source other than "Free Run" is set, "TRG" is
displayed in the channel bar and the trigger source is indicated.
Remote command:
TRIGger[:SEQuence]:SOURce on page 149
Free Run ← Trigger Source ← Trigger Source
No trigger source is considered. Data acquisition is started manually or automatically
and continues until stopped explicitly.
71User Manual 1176.8539.02 ─ 04
Page 72

R&S®FPS-K82/-K83
Remote command:
TRIG:SOUR IMM, see TRIGger[:SEQuence]:SOURce on page 149
External Trigger 1/2 ← Trigger Source ← Trigger Source
Data acquisition starts when the TTL signal fed into the specified input connector
meets or exceeds the specified trigger level.
(See " Trigger Level " on page 72).
Note: The "External Trigger 1" softkey automatically selects the trigger signal from the
TRG IN connector.
For details, see the "Instrument Tour" chapter in the R&S FPS Getting Started manual.
"External Trigger 1"
"External Trigger 2"
Configuration
Code Domain Analysis
Trigger signal from the TRG IN connector.
Trigger signal from the TRG AUX connector.
Note: Connector must be configured for "Input" in the "Output" configuration
(See the R&S FPS User Manual).
Remote command:
TRIG:SOUR EXT, TRIG:SOUR EXT2
See TRIGger[:SEQuence]:SOURce on page 149
IF Power ← Trigger Source ← Trigger Source
The R&S FPS starts capturing data as soon as the trigger level is exceeded around the
third intermediate frequency.
For frequency sweeps, the third IF represents the start frequency. The trigger bandwidth at the third IF depends on the RBW and sweep type.
For measurements on a fixed frequency (e.g. zero span or I/Q measurements), the
third IF represents the center frequency.
This trigger source is only available for RF input.
This trigger source is available for frequency and time domain measurements only.
The available trigger levels depend on the RF attenuation and preamplification. A refer-
ence level offset, if defined, is also considered.
For details on available trigger levels and trigger bandwidths, see the data sheet.
Remote command:
TRIG:SOUR IFP, see TRIGger[:SEQuence]:SOURce on page 149
Trigger Level ← Trigger Source
Defines the trigger level for the specified trigger source.
For details on supported trigger levels, see the data sheet.
Remote command:
TRIGger[:SEQuence]:LEVel[:EXTernal<port>] on page 148
Drop-Out Time ← Trigger Source
Defines the time the input signal must stay below the trigger level before triggering
again.
72User Manual 1176.8539.02 ─ 04
Page 73

R&S®FPS-K82/-K83
Remote command:
TRIGger[:SEQuence]:DTIMe on page 146
Trigger Offset ← Trigger Source
Defines the time offset between the trigger event and the start of the measurement.
Offset > 0: Start of the measurement is delayed
Offset < 0: Measurement starts earlier (pretrigger)
Remote command:
TRIGger[:SEQuence]:HOLDoff[:TIME] on page 147
Hysteresis ← Trigger Source
Defines the distance in dB to the trigger level that the trigger source must exceed
before a trigger event occurs. Setting a hysteresis avoids unwanted trigger events
caused by noise oscillation around the trigger level.
This setting is only available for "IF Power" trigger sources. The range of the value is
between 3 dB and 50 dB with a step width of 1 dB.
Configuration
Code Domain Analysis
This setting is available for frequency and time domain measurements only.
Remote command:
TRIGger[:SEQuence]:IFPower:HYSTeresis on page 147
Trigger Holdoff ← Trigger Source
Defines the minimum time (in seconds) that must pass between two trigger events.
Trigger events that occur during the holdoff time are ignored.
Remote command:
TRIGger[:SEQuence]:IFPower:HOLDoff on page 147
Slope ← Trigger Source
For all trigger sources except time, you can define whether triggering occurs when the
signal rises to the trigger level or falls down to it.
Remote command:
TRIGger[:SEQuence]:SLOPe on page 149
Capture Offset ← Trigger Source
This setting is only available for slave applications in MSRA operating mode. It has a
similar effect as the trigger offset in other measurements: it defines the time offset
between the capture buffer start and the start of the extracted slave application data.
In MSRA mode, the offset must be a positive value, as the capture buffer starts at the
trigger time = 0.
For details on the MSRA operating mode, see the R&S FPS MSRA User Manual.
Remote command:
[SENSe:]MSRA:CAPTure:OFFSet on page 219
73User Manual 1176.8539.02 ─ 04
Page 74

R&S®FPS-K82/-K83
Trigger 2
Defines the usage of the variable TRIGGER AUX connector on the rear panel.
(Trigger 1 is INPUT only.)
Note: Providing trigger signals as output is described in detail in the R&S FPS User
Manual.
"Input"
"Output"
Remote command:
OUTPut:TRIGger<port>:DIRection on page 150
Configuration
Code Domain Analysis
The signal at the connector is used as an external trigger source by
the R&S FPS. Trigger input parameters are available in the "Trigger"
dialog box.
The R&S FPS sends a trigger signal to the output connector to be
used by connected devices.
Further trigger parameters are available for the connector.
Output Type ← Trigger 2
Type of signal to be sent to the output
"Device Trig-
gered"
"Trigger
Armed"
"User Defined"
Remote command:
OUTPut:TRIGger<port>:OTYPe on page 151
Level ← Output Type ← Trigger 2
Defines whether a high (1) or low (0) constant signal is sent to the trigger output connector.
(Default) Sends a trigger when the R&S FPS triggers.
Sends a (high level) trigger when the R&S FPS is in "Ready for trigger" state.
This state is indicated by a status bit in the STATus:OPERation register (bit 5).
Sends a trigger when you select the "Send Trigger" button.
In this case, further parameters are available for the output signal.
74User Manual 1176.8539.02 ─ 04
Page 75

R&S®FPS-K82/-K83
The trigger pulse level is always opposite to the constant signal level defined here. For
example, for "Level = High", a constant high signal is output to the connector until you
select the Send Trigger function. Then, a low pulse is provided.
Remote command:
OUTPut:TRIGger<port>:LEVel on page 151
Pulse Length ← Output Type ← Trigger 2
Defines the duration of the pulse (pulse width) sent as a trigger to the output connector.
Remote command:
OUTPut:TRIGger<port>:PULSe:LENGth on page 152
Configuration
Code Domain Analysis
Send Trigger ← Output Type ← Trigger 2
Sends a user-defined trigger to the output connector immediately.
Note that the trigger pulse level is always opposite to the constant signal level defined
by the output Level setting. For example, for "Level" = "High", a constant high signal is
output to the connector until you select the "Send Trigger" function. Then, a low pulse
is sent.
Which pulse level will be sent is indicated by a graphic on the button.
Remote command:
OUTPut:TRIGger<port>:PULSe:IMMediate on page 152
6.2.6 Signal Capture (Data Acquisition)
Access: "Overview" > "Signal Capture"
You must define how much and how data is captured from the input signal.
75User Manual 1176.8539.02 ─ 04
Page 76

R&S®FPS-K82/-K83
MSRA operating mode
In MSRA operating mode, only the MSRA Master channel actually captures data from
the input signal. The data acquisition settings for the CDMA2000 BTS application in
MSRA mode define the application data (see Chapter 6.2.7, "Application Data
(MSRA) ", on page 77).
For details on the MSRA operating mode, see the R&S FPS MSRA User Manual.
Sample Rate................................................................................................................. 76
Invert Q......................................................................................................................... 76
Number of PCGs...........................................................................................................76
Number of Sets............................................................................................................. 76
Set to Analyze...............................................................................................................76
Sample Rate
The sample rate is always 5.33333 MHz (indicated for reference only).
Invert Q
Inverts the sign of the signal's Q-branch. The default setting is OFF.
Remote command:
[SENSe:]CDPower:QINVert on page 153
Configuration
Code Domain Analysis
Number of PCGs
Sets the number of PCGs you want to analyze. The input value is always in multiples
of the PCGs. The maximum capture length is 64. The default value is 3.
If the "Number of Sets" on page 76 to capture is larger than 1, the number of PCGs
is always 64.
For more information on PCGs and sets, see Chapter 4.1, "PCGs and Sets",
on page 36.
Remote command:
[SENSe:]CDPower:IQLength on page 152
Number of Sets
Defines the number of consecutive sets to be captured and stored in the instrument's
IQ memory. The possible value range is from 1 to a maximum of 1500 (BTS application) or 810 (MS application) sets.
The default setting is 1.
If you capture more than one set, the number of slots/PCGs is always 64 (CDMA2000
BTS application: 32) and is not available for modification.
Remote command:
[SENSe:]CDPower:SET:COUNt on page 153
Set to Analyze
Selects a specific set for further analysis. The value range is between 0 and "Number
of Sets" on page 76 – 1.
Remote command:
[SENSe:]CDPower:SET on page 165
76User Manual 1176.8539.02 ─ 04
Page 77

R&S®FPS-K82/-K83
Configuration
Code Domain Analysis
6.2.7 Application Data (MSRA)
For the CDMA2000 BTS application in MSRA operating mode, the application data
range is defined by the same settings used to define the signal capturing in Signal and
Spectrum Analyzer mode (see "Number of Sets" on page 76).
In addition, a capture offset can be defined, i.e. an offset from the start of the captured
data to the start of the analysis interval for the CDMA2000 BTS measurement (see "
Capture Offset " on page 73).
The analysis interval cannot be edited manually. It is determined automatically
according to the selected PCG, code or set to analyze, which is defined for the evaluation range, depending on the result display. Note that the PCG/code/set is analyzed
within the application data.
6.2.8 Channel Detection
Access: "Overview" > "Channel Detection"
The channel detection settings determine which channels are found in the input signal.
77User Manual 1176.8539.02 ─ 04
Page 78

R&S®FPS-K82/-K83
● General Channel Detection Settings.......................................................................78
● Channel Table Management...................................................................................79
● Channel Table Settings and Functions................................................................... 80
● BTS Channel Details...............................................................................................81
● MS Channel Details................................................................................................ 83
Configuration
Code Domain Analysis
6.2.8.1 General Channel Detection Settings
Access: "Overview" > "Channel Detection"
Inactive Channel Threshold.......................................................................................... 78
Using Predefined Channel Tables................................................................................ 78
Inactive Channel Threshold
Defines the minimum power that a single channel must have compared to the total signal to be recognized as an active channel.
The default value is -60 dB. With this value, the Code Domain Power Analyzer detects
all channels with signals such as the CDMA2000 test models. Decrease the "Inactive
Channel Threshold" value if not all channels contained in the signal are detected.
Remote command:
[SENSe:]CDPower:ICTReshold on page 155
Using Predefined Channel Tables
Defines the channel search mode.
78User Manual 1176.8539.02 ─ 04
Page 79

R&S®FPS-K82/-K83
Configuration
Code Domain Analysis
"Predefined"
Compares the input signal to the predefined channel table selected in
the "Predefined Tables" list
"Auto"
Detects channels automatically using pilot sequences and fixed code
numbers
The automatic search provides an overview of the channels contained in the currently measured signal. If channels are not detected
as being active, change the Inactive Channel Threshold or select the
"Predefined" channel search mode.
Remote command:
CONFigure:CDPower[:BTS]:CTABle[:STATe] on page 157
6.2.8.2 Channel Table Management
Access: "Overview" > "Channel Detection" > "Predefined Channel Tables"
Predefined Tables.........................................................................................................79
Selecting a Table.......................................................................................................... 79
Creating a New Table................................................................................................... 80
Editing a Table.............................................................................................................. 80
Copying a Table............................................................................................................80
Deleting a Table............................................................................................................80
Restoring Default Tables...............................................................................................80
Predefined Tables
The list shows all available channel tables and marks the currently used table with a
checkmark. The currently focussed table is highlighted blue.
For details on predefined channel tables provided by the CDMA2000 applications, see
Chapter A.1, "Reference: Predefined Channel Tables", on page 226.
The following channel tables are available by default:
"RECENT"
Contains the most recently selected channel table
"BPC_RC4, MPC_RC1, MPC_RC4, TDC_RC4"
Channel tables for BTS measurements; configured according to a
specific radio configuration
"EACHOP, RCCCHOP, RTCHOP3, RTCHOP5"
Channel tables for MS mode; configured according to a specific radio
configuration
Remote command:
CONFigure:CDPower[:BTS]:CTABle:CATalog? on page 155
Selecting a Table
Selects the channel table currently focused in the "Predefined Tables" list and compares it to the measured signal to detect channels.
Remote command:
CONFigure:CDPower[:BTS]:CTABle:SELect on page 157
79User Manual 1176.8539.02 ─ 04
Page 80

R&S®FPS-K82/-K83
Creating a New Table
Creates a new channel table. For a description of channel table settings and functions,
see Chapter 6.2.8.3, "Channel Table Settings and Functions", on page 80.
For step-by-step instructions on creating a new channel table, see "To define or edit a
channel table" on page 108.
Remote command:
CONFigure:CDPower[:BTS]:CTABle:NAME on page 160
Editing a Table
You can edit existing channel table definitions. The details of the selected channel are
displayed in the "Channel Table" dialog box.
Copying a Table
Copies an existing channel table definition. The details of the selected channel are displayed in the "Channel Table" dialog box.
Remote command:
CONFigure:CDPower[:BTS]:CTABle:COPY on page 156
Configuration
Code Domain Analysis
Deleting a Table
Deletes the currently selected channel table after a message is confirmed.
Remote command:
CONFigure:CDPower[:BTS]:CTABle:DELete on page 157
Restoring Default Tables
Restores the predefined channel tables delivered with the instrument.
Remote command:
CONFigure:CDPower[:BTS]:CTABle:RESTore on page 157
6.2.8.3 Channel Table Settings and Functions
Access: "Overview" > "Channel Detection" > "Predefined Channel Tables" > "New"/
"Copy"/ "Edit"
Some general settings and functions are available when configuring a predefined
channel table.
For details on channel table entries, see Chapter 6.2.8.4, "BTS Channel Details",
on page 81 or Chapter 6.2.8.5, "MS Channel Details", on page 83.
Name.............................................................................................................................81
Comment.......................................................................................................................81
Adding a Channel..........................................................................................................81
Deleting a Channel........................................................................................................81
Creating a New Channel Table from the Measured Signal (Measure Table)............... 81
Sorting the Table...........................................................................................................81
Cancelling the Configuration.........................................................................................81
Saving the Table........................................................................................................... 81
80User Manual 1176.8539.02 ─ 04
Page 81

R&S®FPS-K82/-K83
Name
Name of the channel table that is displayed in the "Predefined Channel Tables" list.
Remote command:
CONFigure:CDPower[:BTS]:CTABle:NAME on page 160
Comment
Optional description of the channel table.
Remote command:
CONFigure:CDPower[:BTS]:CTABle:COMMent on page 158
Adding a Channel
Inserts a new row in the channel table to define another channel.
Deleting a Channel
Deletes the currently selected channel from the table.
Creating a New Channel Table from the Measured Signal (Measure Table)
Creates a completely new channel table according to the current measurement data.
Remote command:
CONFigure:CDPower[:BTS]:MEASurement on page 129
Configuration
Code Domain Analysis
Sorting the Table
Sorts the channel table entries.
Cancelling the Configuration
Closes the "Channel Table" dialog box without saving the changes.
Saving the Table
Saves the changes to the table and closes the "Channel Table" dialog box.
6.2.8.4 BTS Channel Details
Access: "Overview" > "Channel Detection" > "Predefined Channel Tables" > "New"/
"Copy"/ "Edit" > "Add Channel"
81User Manual 1176.8539.02 ─ 04
Page 82

R&S®FPS-K82/-K83
Configuration
Code Domain Analysis
Channel Type................................................................................................................82
Channel Number (Ch. SF)............................................................................................ 82
Symbol Rate..................................................................................................................82
RC.................................................................................................................................83
Power............................................................................................................................83
Status............................................................................................................................83
Domain Conflict.............................................................................................................83
Channel Type
Type of channel according to CDMA2000 standard.
For a list of possible channel types, see Chapter 4.8.1, "BTS Channel Types",
on page 43 or Chapter 4.8.2, "MS Channel Types", on page 45.
Remote command:
BTS application:
CONFigure:CDPower[:BTS]:CTABle:DATA on page 158
MS application:
CONFigure:CDPower:MS:CTABle:DATA on page 159
Channel Number (Ch. SF)
Number of channel spreading code (0 to [spreading factor-1])
Remote command:
BTS application:
CONFigure:CDPower[:BTS]:CTABle:DATA on page 158
MS application:
CONFigure:CDPower:MS:CTABle:DATA on page 159
Symbol Rate
Symbol rate at which the channel is transmitted.
82User Manual 1176.8539.02 ─ 04
Page 83

R&S®FPS-K82/-K83
RC
The Radio Configuration (RC) can be customized for two channel types. For the
PDCH, you can set the configuration to either 10 (QPSK), 10 (8PSK) or 10 (16QAM).
For CHAN channels, you can set the radio configuration to 1-2 or 3-5.
For details on radio configurations, see Chapter 4.6, "Radio Configuration",
on page 41.
Power
Contains the measured relative code domain power. The unit is dB. The fields are filled
with values after you press the "Meas" button (see "Creating a New Channel Table
from the Measured Signal (Measure Table)" on page 81).
Remote command:
BTS application:
CONFigure:CDPower[:BTS]:CTABle:DATA on page 158
MS application:
CONFigure:CDPower:MS:CTABle:DATA on page 159
Status
Indicates the channel status. Codes that are not assigned are marked as inactive
channels.
Remote command:
BTS application:
CONFigure:CDPower[:BTS]:CTABle:DATA on page 158
MS application:
CONFigure:CDPower:MS:CTABle:DATA on page 159
Configuration
Code Domain Analysis
Domain Conflict
Indicates a code domain conflict between channel definitions (e.g. overlapping channels).
6.2.8.5 MS Channel Details
Access: "Overview" > "Channel Detection" > "Predefined Channel Tables" > "New"/
"Copy"/ "Edit" > "Add Channel"
83User Manual 1176.8539.02 ─ 04
Page 84

R&S®FPS-K82/-K83
Configuration
Code Domain Analysis
Channel Type................................................................................................................84
Channel Number (Ch. SF)............................................................................................ 84
Symbol Rate..................................................................................................................85
Mapping........................................................................................................................ 85
Power............................................................................................................................85
Status............................................................................................................................85
Domain Conflict.............................................................................................................85
Channel Type
Type of channel according to CDMA2000 standard.
For a list of possible channel types, see Chapter 4.8.1, "BTS Channel Types",
on page 43 or Chapter 4.8.2, "MS Channel Types", on page 45.
Remote command:
BTS application:
CONFigure:CDPower[:BTS]:CTABle:DATA on page 158
MS application:
CONFigure:CDPower:MS:CTABle:DATA on page 159
Channel Number (Ch. SF)
Number of channel spreading code (0 to [spreading factor-1])
Remote command:
BTS application:
CONFigure:CDPower[:BTS]:CTABle:DATA on page 158
MS application:
CONFigure:CDPower:MS:CTABle:DATA on page 159
84User Manual 1176.8539.02 ─ 04
Page 85

R&S®FPS-K82/-K83
Symbol Rate
Symbol rate at which the channel is transmitted.
Mapping
Branch onto which the channel is mapped (I or Q). The setting is not editable, since the
standard specifies the channel assignment for each channel.
For more information, see Chapter 4.5, "Code Mapping and Branches", on page 40.
Remote command:
[SENSe:]CDPower:MAPPing on page 165
Power
Contains the measured relative code domain power. The unit is dB. The fields are filled
with values after you press the "Meas" button (see "Creating a New Channel Table
from the Measured Signal (Measure Table)" on page 81).
Remote command:
BTS application:
CONFigure:CDPower[:BTS]:CTABle:DATA on page 158
MS application:
CONFigure:CDPower:MS:CTABle:DATA on page 159
Configuration
Code Domain Analysis
Status
Indicates the channel status. Codes that are not assigned are marked as inactive
channels.
Remote command:
BTS application:
CONFigure:CDPower[:BTS]:CTABle:DATA on page 158
MS application:
CONFigure:CDPower:MS:CTABle:DATA on page 159
Domain Conflict
Indicates a code domain conflict between channel definitions (e.g. overlapping channels).
6.2.9 Sweep Settings
Access: SWEEP
The sweep settings define how the data is measured.
Sweep/Average Count ................................................................................................. 85
Continuous Sweep / Run Cont .....................................................................................86
Single Sweep / Run Single ...........................................................................................86
Continue Single Sweep ................................................................................................86
Sweep/Average Count
Defines the number of measurements to be performed in the single sweep mode. Values from 0 to 200000 are allowed. If the values 0 or 1 are set, one measurement is
performed.
85User Manual 1176.8539.02 ─ 04
Page 86

R&S®FPS-K82/-K83
The sweep count is applied to all the traces in all diagrams.
If the trace modes "Average" , "Max Hold" or "Min Hold" are set, this value also deter-
mines the number of averaging or maximum search procedures.
In continuous sweep mode, if "Sweep Count" = 0 (default), averaging is performed
over 10 measurements. For "Sweep Count" =1, no averaging, maxhold or minhold
operations are performed.
Remote command:
[SENSe:]SWEep:COUNt on page 161
[SENSe:]AVERage<n>:COUNt on page 161
Continuous Sweep / Run Cont
After triggering, starts the measurement and repeats it continuously until stopped.
While the measurement is running, the "Continuous Sweep" softkey and the RUN
CONT key are highlighted. The running measurement can be aborted by selecting the
highlighted softkey or key again. The results are not deleted until a new measurement
is started.
Note: Sequencer. If the Sequencer is active, the "Continuous Sweep" softkey only
controls the sweep mode for the currently selected channel. However, the sweep mode
only takes effect the next time the Sequencer activates that channel, and only for a
channel-defined sequence. In this case, a channel in continuous sweep mode is swept
repeatedly.
Furthermore, the RUN CONT key controls the Sequencer, not individual sweeps. RUN
CONT starts the Sequencer in continuous mode.
For details on the Sequencer, see the R&S FPS User Manual.
Configuration
Code Domain Analysis
Remote command:
INITiate<n>:CONTinuous on page 179
Single Sweep / Run Single
After triggering, starts the number of sweeps set in "Sweep Count". The measurement
stops after the defined number of sweeps has been performed.
While the measurement is running, the "Single Sweep" softkey and the RUN SINGLE
key are highlighted. The running measurement can be aborted by selecting the highlighted softkey or key again.
Remote command:
INITiate<n>[:IMMediate] on page 180
Continue Single Sweep
After triggering, repeats the number of sweeps set in "Sweep Count", without deleting
the trace of the last measurement.
While the measurement is running, the "Continue Single Sweep" softkey and the RUN
SINGLE key are highlighted. The running measurement can be aborted by selecting
the highlighted softkey or key again.
Remote command:
INITiate<n>:CONMeas on page 179
86User Manual 1176.8539.02 ─ 04
Page 87

R&S®FPS-K82/-K83
Configuration
Code Domain Analysis
6.2.10 Automatic Settings
Access: AUTO SET
The R&S CDMA2000 Measurements application can adjust some settings automatically according to the current measurement settings. To do so, a measurement is performed. The duration of this measurement can be defined automatically or manually.
MSRA operating mode
In MSRA operating mode, the following automatic settings are not available, as they
require a new data acquisition. However, CDMA2000 applications cannot acquire data
in MSRA operating mode.
Adjusting all Determinable Settings Automatically ( Auto All )...................................... 87
Setting the Reference Level Automatically ( Auto Level ).............................................87
Auto Scale Window.......................................................................................................88
Auto Scale All................................................................................................................88
Restore Scale (Window)............................................................................................... 88
Resetting the Automatic Measurement Time ( Meastime Auto )...................................88
Changing the Automatic Measurement Time ( Meastime Manual ).............................. 88
Upper Level Hysteresis ................................................................................................88
Lower Level Hysteresis ................................................................................................88
Adjusting all Determinable Settings Automatically ( Auto All )
Activates all automatic adjustment functions for the current measurement settings.
This includes:
●
Auto Level
●
"Auto Scale All" on page 88
Note: MSRA operating modes. In MSRA operating mode, this function is only available
for the MSRA Master, not the applications.
Remote command:
[SENSe:]ADJust:ALL on page 162
Setting the Reference Level Automatically ( Auto Level )
Automatically determines a reference level which ensures that no overload occurs at
the R&S FPS for the current input data. At the same time, the internal attenuators are
adjusted so the signal-to-noise ratio is optimized, while signal compression and clipping are minimized.
To determine the required reference level, a level measurement is performed on the
R&S FPS.
If necessary, you can optimize the reference level further. Decrease the attenuation
level manually to the lowest possible value before an overload occurs, then decrease
the reference level in the same way.
You can change the measurement time for the level measurement if necessary (see "
Changing the Automatic Measurement Time ( Meastime Manual )" on page 88).
Remote command:
[SENSe:]ADJust:LEVel on page 164
87User Manual 1176.8539.02 ─ 04
Page 88

R&S®FPS-K82/-K83
Auto Scale Window
Automatically determines the optimal range and reference level position to be displayed for the current measurement settings in the currently selected window. No new
measurement is performed.
Auto Scale All
Automatically determines the optimal range and reference level position to be displayed for the current measurement settings in all displayed diagrams. No new measurement is performed.
Restore Scale (Window)
Restores the default scale settings in the currently selected window.
Resetting the Automatic Measurement Time ( Meastime Auto )
Resets the measurement duration for automatic settings to the default value.
Remote command:
[SENSe:]ADJust:CONFigure[:LEVel]:DURation:MODE on page 163
Configuration
RF Measurements
Changing the Automatic Measurement Time ( Meastime Manual )
This function allows you to change the measurement duration for automatic setting
adjustments. Enter the value in seconds.
Remote command:
[SENSe:]ADJust:CONFigure[:LEVel]:DURation:MODE on page 163
[SENSe:]ADJust:CONFigure[:LEVel]:DURation on page 163
Upper Level Hysteresis
When the reference level is adjusted automatically using the Auto Level function, the
internal attenuators and the preamplifier are also adjusted. To avoid frequent adaptation due to small changes in the input signal, you can define a hysteresis. This setting
defines an upper threshold the signal must exceed (compared to the last measurement) before the reference level is adapted automatically.
Remote command:
[SENSe:]ADJust:CONFigure:HYSTeresis:UPPer on page 164
Lower Level Hysteresis
When the reference level is adjusted automatically using the Auto Level function, the
internal attenuators and the preamplifier are also adjusted. To avoid frequent adaptation due to small changes in the input signal, you can define a hysteresis. This setting
defines a lower threshold the signal must fall below (compared to the last measurement) before the reference level is adapted automatically.
Remote command:
[SENSe:]ADJust:CONFigure:HYSTeresis:LOWer on page 163
6.3 RF Measurements
Access: "Overview" > "Select Measurement"
88User Manual 1176.8539.02 ─ 04
Page 89

R&S®FPS-K82/-K83
When you activate a CDMA2000 application, Code Domain Analysis of the input signal
is started automatically. However, the CDMA2000 applications also provide various RF
measurement types.
The main measurement configuration menus for the RF measurements are identical to
the Spectrum application.
For details, refer to "Measurements" in the R&S FPS User Manual.
The measurement-specific settings for the following measurements are available via
the "Overview".
● Signal Channel Power Measurements....................................................................89
● Channel Power (ACLR) Measurements..................................................................89
● Spectrum Emission Mask........................................................................................90
● Occupied Bandwidth............................................................................................... 91
● CCDF...................................................................................................................... 92
Configuration
RF Measurements
6.3.1 Signal Channel Power Measurements
Access: "Overview" > "Select Measurement" > "Power"
The Power measurement determines the CDMA2000 signal channel power.
To do so, the RF signal power of a single channel is analyzed with 1.2288 MHz bandwidth over a single trace. The displayed results are based on the root mean square.
The bandwidth and the associated channel power are displayed in the Result Summary.
To determine the signal channel power, the CDMA2000 application performs a Channel Power measurement as in the Spectrum application with the following settings:
Table 6-1: Predefined settings for CDMA2000 Output Channel Power measurements
Setting Default Value
ACLR Standard CDMA2000 MC1
Number of adjacent channels 0
Frequency Span 2 MHz
For further details about the Power measurement, refer to "Channel Power and Adjacent-Channel Power (ACLR) Measurements" in the R&S FPS User Manual.
6.3.2 Channel Power (ACLR) Measurements
Access: "Overview" > "Select Measurement" > "Channel Power ACLR"
The Adjacent Channel Power measurement analyzes the power of the Tx channel and
the power of adjacent and alternate channels on the left and right side of the Tx channel. The number of Tx channels and adjacent channels can be modified as well as the
band class. The bandwidth and power of the Tx channel and the bandwidth, spacing
and power of the adjacent and alternate channels are displayed in the Result Summary.
89User Manual 1176.8539.02 ─ 04
Page 90

R&S®FPS-K82/-K83
Channel Power ACLR measurements are performed as in the Spectrum application
with the following predefined settings according to CDMA2000 specifications (adjacent
channel leakage ratio).
Table 6-2: Predefined settings for CDMA2000 ACLR Channel Power measurements
Setting Default value
Bandclass 0: 800 MHz Cellular
Number of adjacent channels 2
For further details about the ACLR measurements, refer to "Measuring Channel Power
and Adjacent-Channel Power" in the R&S FPS User Manual.
To restore adapted measurement parameters, the following parameters are saved on
exiting and are restored on re-entering this measurement:
●
●
●
●
●
●
Configuration
RF Measurements
Reference level and reference level offset
RBW, VBW
Sweep time
Span
Number of adjacent channels
Fast ACLR mode
The main measurement menus for the RF measurements are identical to the Spectrum
application. However, for ACLR and SEM measurements in CDMA2000 applications,
an additional softkey is available to select the required bandclass.
Bandclass
The bandclass defines the frequency band used for ACLR and SEM measurements. It
also determines the corresponding limits and ACLR channel settings according to the
CDMA2000 standard.
For an overview of supported bandclasses and their usage, see Chapter A.3, "Refer-
ence: Supported Bandclasses", on page 231.
Remote command:
CONFigure:CDPower[:BTS]:BCLass|BANDclass on page 169
6.3.3 Spectrum Emission Mask
Access: "Overview" > "Select Measurement" > "Spectrum Emission Mask"
The Spectrum Emission Mask measurement shows the quality of the measured signal.
It compares the power values in the frequency range near the carrier against a spectral
mask that is defined by the CDMA2000 specifications. The limits depend on the
selected bandclass. In this way, the performance of the DUT can be tested and the
emissions and their distance to the limit be identified.
Note that the CDMA2000 standard does not distinguish between spurious and spectral
emissions.
90User Manual 1176.8539.02 ─ 04
Page 91

R&S®FPS-K82/-K83
The Result Summary contains a peak list with the values for the largest spectral emissions including their frequency and power.
The CDMA2000 applications perform the SEM measurement as in the Spectrum application with the following settings:
Table 6-3: Predefined settings for CDMA2000 SEM measurements
Bandclass 0: 800 MHz Cellular
Span -4 MHz to +1.98 MHz
Number of ranges 5
Fast SEM ON
Sweep time 100 ms
Number of power classes 3
Power reference type Channel power
For further details about the Spectrum Emission Mask measurements, refer to "Spectrum Emission Mask Measurement" in the R&S FPS User Manual.
Configuration
RF Measurements
Changing the RBW and the VBW is restricted due to the definition of the limits by the
standard.
To restore adapted measurement parameters, the following parameters are saved on
exiting and are restored on re-entering this measurement:
●
Reference level and reference level offset
●
Sweep time
●
Span
The main measurement menus for the RF measurements are identical to the Spectrum
application. However, for ACLR and SEM measurements, an additional softkey is
available to select the required bandclass.
Bandclass
The bandclass defines the frequency band used for ACLR and SEM measurements. It
also determines the corresponding limits and ACLR channel settings according to the
CDMA2000 standard.
For an overview of supported bandclasses and their usage, see Chapter A.3, "Refer-
ence: Supported Bandclasses", on page 231.
Remote command:
CONFigure:CDPower[:BTS]:BCLass|BANDclass on page 169
6.3.4 Occupied Bandwidth
Access: "Overview" > "Select Measurement" > "OBW"
91User Manual 1176.8539.02 ─ 04
Page 92

R&S®FPS-K82/-K83
The Occupied Bandwidth measurement is performed as in the Spectrum application
with default settings.
Table 6-4: Predefined settings for CDMA2000 OBW measurements
Setting Default value
% Power Bandwidth 99 %
Channel bandwidth 1.2288 MHz
The Occupied Bandwidth measurement determines the bandwidth that the signal occupies. The occupied bandwidth is defined as the bandwidth in which – in default settings
- 99 % of the total signal power is found. The percentage of the signal power to be
included in the bandwidth measurement can be changed.
For further details about the Occupied Bandwidth measurements, refer to "Measuring
the Occupied Bandwidth" in the R&S FPS User Manual.
To restore adapted measurement parameters, the following parameters are saved on
exiting and are restored on re-entering this measurement:
●
●
●
●
Configuration
RF Measurements
Reference level and reference level offset
RBW, VBW
Sweep time
Span
6.3.5 CCDF
Access: "Overview" > "Select Measurement" > "CCDF"
The CCDF measurement determines the distribution of the signal amplitudes (complementary cumulative distribution function). The CCDF and the Crest factor are displayed. For the purposes of this measurement, a signal section of user-definable
length is recorded continuously in zero span, and the distribution of the signal amplitudes is evaluated.
The measurement is useful to determine errors of linear amplifiers. The crest factor is
defined as the ratio of the peak power and the mean power. The Result Summary displays the number of included samples, the mean and peak power and the crest factor.
The CCDF measurement is performed as in the Spectrum application with the following settings:
Table 6-5: Predefined settings for CDMA2000 CCDF measurements
CCDF Active on trace 1
Analysis bandwidth 10 MHz
Number of samples 62500
VBW 5 MHz
For further details about the CCDF measurements, refer to "Statistical Measurements"
in the R&S FPS User Manual.
92User Manual 1176.8539.02 ─ 04
Page 93

R&S®FPS-K82/-K83
To restore adapted measurement parameters, the following parameters are saved on
exiting and are restored on re-entering this measurement:
●
●
●
Configuration
RF Measurements
Reference level and reference level offset
Analysis bandwidth
Number of samples
93User Manual 1176.8539.02 ─ 04
Page 94

R&S®FPS-K82/-K83
7 Analysis
Access: "Overview" > "Analysis"
The remote commands required to perform these tasks are described in Chap-
ter 11.10, "General Analysis", on page 203.
Analyzing RF Measurements
General result analysis settings concerning the trace, markers, lines etc. for RF measurements are identical to the analysis functions in the Spectrum application. Only
some special marker functions and spectrograms are not available in the CDMA2000
applications.
For details, see the "General Measurement Analysis and Display" chapter in the
R&S FPS User Manual.
● Code Domain Analysis Settings..............................................................................94
● Evaluation Range....................................................................................................96
● Traces..................................................................................................................... 98
● Markers................................................................................................................... 99
Analysis
Code Domain Analysis Settings
7.1 Code Domain Analysis Settings
Access: "Overview" > "Analysis" > "Code Domain Settings" tab
Some evaluations provide further settings for the results. The settings for CDA measurements are described here.
94User Manual 1176.8539.02 ─ 04
Page 95

R&S®FPS-K82/-K83
Base Spreading Factor................................................................................................. 95
Compensate IQ Offset.................................................................................................. 95
Timing and phase offset calculation .............................................................................95
Code Power Display......................................................................................................95
Pilot Power Display (MS application only).....................................................................95
Power Reference.......................................................................................................... 96
Code Display Order.......................................................................................................96
Base Spreading Factor
Changes the base spreading factor, which also changes the scale for code-based
result displays. If you set the base spreading factor too low (e.g. to 64 for channels with
a base spreading factor of 128 = code class 7), an alias power is displayed in the Code
Domain Power and Code Domain Error Power diagrams.
For more information, see Chapter 4.3, "Code Display and Sort Order", on page 38.
Remote command:
[SENSe:]CDPower:SFACtor on page 168
Compensate IQ Offset
If enabled, the I/Q offset is eliminated from the measured signal. This is useful to
deduct a DC offset to the baseband caused by the DUT, thus improving the EVM.
Note, however, that for EVM measurements according to standard, compensation
must be disabled.
Remote command:
[SENSe:]CDPower:NORMalize on page 166
Analysis
Code Domain Analysis Settings
Timing and phase offset calculation
Activates or deactivates the timing and phase offset calculation of the channels to the
pilot channel. If deactivated, or if more than 50 active channels are in the signal, the
calculation does not take place and dashes are displayed instead of values as results.
Remote command:
[SENSe:]CDPower:TPMeas on page 168
Code Power Display
For "Code Domain Power" evaluation:
Defines whether the absolute power or the power relative to the chosen reference (in
BTS application: relative to total power) is displayed.
Remote command:
[SENSe:]CDPower:PDISplay on page 167
Pilot Power Display (MS application only)
For "Code Domain Power" evaluation in the MS application only:
Defines whether the absolute power or the power relative to the chosen reference is
displayed for the pilot channel.
Remote command:
[SENSe:]CDPower:PPReference on page 167
95User Manual 1176.8539.02 ─ 04
Page 96

R&S®FPS-K82/-K83
Power Reference
For "Code Domain Power" evaluation in the MS application only:
Defines the reference for relative power display.
"Total"
"PICH"
Remote command:
[SENSe:]CDPower:PREFerence on page 167
Code Display Order
Defines the sorting of the channels for the Code Domain Power and Code Domain
Error result displays.
For further details on the code order, refer to Chapter 4.3, "Code Display and Sort
Order", on page 38 and Chapter A.2, "Reference: Code Tables", on page 228.
"Hadamard"
"Bit-Reverse"
Remote command:
[SENSe:]CDPower:ORDer on page 166
Analysis
Evaluation Range
Relative to the total signal power
Relative to the power of the PICH
By default, the codes are sorted in Hadamard order, i.e. in ascending
order.
The power of each code is displayed; there is no visible distinction
between channels. If a channel covers several codes, the display
shows the individual power of each code.
Bundles the channels with concentrated codes, i.e. all codes of a
channel are next to one another. Thus you can see the total power of
a concentrated channel.
7.2 Evaluation Range
Access: "Overview" > "Analysis" > "Evaluation Range" tab
The evaluation range defines which channel (Code Number), PCG or set is analyzed in
the result display.
For CDMA2000 MS measurements, the branch to be analyzed can also be defined.
Code Number................................................................................................................97
Power Control Group.................................................................................................... 97
Set to Analyze...............................................................................................................97
Branch (MS application only)........................................................................................ 97
96User Manual 1176.8539.02 ─ 04
Page 97

R&S®FPS-K82/-K83
Code Number
Selects a code for the following evaluations (see also Chapter 3.1.2, "Evaluation Meth-
ods for Code Domain Analysis", on page 16):
●
●
●
●
●
●
●
●
●
The specified code is selected and marked in red.
For details on how specific codes are displayed see Chapter 4.3, "Code Display and
Sort Order", on page 38.
Remote command:
[SENSe:]CDPower:CODE on page 164
Analysis
Evaluation Range
Bitstream
Code Domain Power
Code Domain Error Power
Peak Code Domain Error
Power vs PCG
Power vs Symbol
Result Summary
Symbol Constellation
Symbol EVM
Power Control Group
Selects a PCG for the following evaluations:
●
Bitstream
●
Channel Table
●
Code Domain Error Power
●
Code Domain Power
●
Composite Constellation
●
Peak Code Domain Error
●
Power vs PCG
●
Power vs Symbol
●
Result Summary
●
Symbol Constellation
●
Symbol EVM
Remote command:
[SENSe:]CDPower:SLOT on page 165
Set to Analyze
Selects a specific set for further analysis. The value range is between 0 and "Number
of Sets" on page 76 – 1.
Remote command:
[SENSe:]CDPower:SET on page 165
Branch (MS application only)
Switches between the evaluation of the I and the Q branch in MS measurements.
This affects the following evaluations:
●
Code Domain Power
●
Code Domain Error Power
●
Peak Code Domain Error
●
Power vs PCG
97User Manual 1176.8539.02 ─ 04
Page 98

R&S®FPS-K82/-K83
●
Remote command:
[SENSe:]CDPower:MAPPing on page 165
Analysis
Traces
Result Summary
7.3 Traces
Access: "Overview" > "Analysis" > "Trace"
Or: TRACE > "Trace Config"
The trace settings determine how the measured data is analyzed and displayed on the
screen.
In CDA evaluations, only one trace can be active in each diagram at any time.
Window-specific configuration
The settings in this dialog box are specific to the selected window. To configure the
settings for a different window, select the window outside the displayed dialog box, or
select the window from the "Specifics for" selection list in the dialog box.
Trace Mode
Defines the update mode for subsequent traces.
"Clear/ Write"
Overwrite mode (default): the trace is overwritten by each measurement.
"Max Hold"
The maximum value is determined over several measurements and
displayed. The R&S FPS saves each trace point in the trace memory
only if the new value is greater than the previous one.
"Min Hold"
The minimum value is determined from several measurements and
displayed. The R&S FPS saves each trace point in the trace memory
only if the new value is lower than the previous one.
98User Manual 1176.8539.02 ─ 04
Page 99

R&S®FPS-K82/-K83
Analysis
Markers
"Average"
"View"
"Blank"
Remote command:
DISPlay[:WINDow<n>]:TRACe<t>:MODE on page 204
7.4 Markers
Access: "Overview" > "Analysis" > "Marker"
Or: MKR
Markers help you analyze your measurement results by determining particular values
in the diagram. Thus you can extract numeric values from a graphical display.
Markers in Code Domain Analysis measurements
In Code Domain Analysis measurements, the markers are set to individual symbols,
codes, slots or channels, depending on the result display. Thus you can use the markers to identify individual codes, for example.
The average is formed over several measurements.
The Sweep/Average Count determines the number of averaging procedures.
The current contents of the trace memory are frozen and displayed.
Removes the selected trace from the display.
● Individual Marker Settings.......................................................................................99
● General Marker Settings....................................................................................... 101
● Marker Search Settings.........................................................................................102
● Marker Positioning Functions................................................................................103
7.4.1 Individual Marker Settings
Access: "Overview" > "Analysis" > "Marker" > "Markers"
Or: MKR > "Marker Config"
In CDA evaluations, up to four markers can be activated in each diagram at any time.
99User Manual 1176.8539.02 ─ 04
Page 100

R&S®FPS-K82/-K83
Analysis
Markers
Selected Marker .........................................................................................................100
Marker State ...............................................................................................................100
X-value........................................................................................................................100
Marker Type ...............................................................................................................101
All Marker Off ............................................................................................................. 101
Selected Marker
Marker name. The marker which is currently selected for editing is highlighted orange.
Remote command:
Marker selected via suffix <m> in remote commands.
Marker State
Activates or deactivates the marker in the diagram.
Remote command:
CALCulate<n>:MARKer<m>[:STATe] on page 206
CALCulate<n>:DELTamarker<m>[:STATe] on page 207
X-value
Defines the position of the marker on the x-axis (channel, slot, symbol, depending on
evaluation).
Remote command:
CALCulate<n>:DELTamarker<m>:X on page 207
CALCulate<n>:MARKer<m>:X on page 206
100User Manual 1176.8539.02 ─ 04
 Loading...