

Page 1

R&S®FPS-K76/K77
TD-SCDMA Measurements Options
User Manual
(;ÚèM2)
1176.9029.02 ─ 04
User Manual
Test & Measurement
Page 2

This manual applies to the following R&S®FPS models with firmware version 1.50 and higher:
●
R&S®FPS4 (1319.2008K04)
●
R&S®FPS7 (1319.2008K07)
●
R&S®FPS13 (1319.2008K13)
●
R&S®FPS30 (1319.2008K30)
●
R&S®FPS40 (1319.2008K40)
The following firmware options are described:
●
R&S FPS-K76 (1321.4379.02)
●
R&S FPS-K77 (1321.4385.02)
The software contained in this product uses several valuable open source software packages. For information, see the "Open
Source Acknowledgment" on the user documentation CD-ROM (included in delivery).
Rohde & Schwarz would like to thank the open source community for their valuable contribution to embedded computing.
© 2017 Rohde & Schwarz GmbH & Co. KG
Mühldorfstr. 15, 81671 München, Germany
Phone: +49 89 41 29 - 0
Fax: +49 89 41 29 12 164
Email: info@rohde-schwarz.com
Internet: www.rohde-schwarz.com
Subject to change – Data without tolerance limits is not binding.
R&S® is a registered trademark of Rohde & Schwarz GmbH & Co. KG.
Trade names are trademarks of their owners.
The following abbreviations are used throughout this manual: R&S®FPS is abbreviated as R&S FPS. "R&S FPS-K76 and R&S FPSK77" are abbreviated as "R&S FPS-K76/-K77".
Page 3

R&S®FPS-K76/K77
Contents
1 Preface.................................................................................................... 5
1.1 Typographical Conventions.........................................................................................5
2 Welcome to the TD-SCDMA Applications............................................6
2.1 Starting the TD-SCDMA Application............................................................................6
2.2 Understanding the Display Information......................................................................7
3 Measurements and Result Display.......................................................9
3.1 Code Domain Analysis................................................................................................. 9
3.2 Frequency and Time Domain Measurements...........................................................24
4 Measurement Basics........................................................................... 34
4.1 Short Introduction to TD-SCDMA.............................................................................. 34
Contents
4.2 Frames, Subframes and Slots....................................................................................34
4.3 Channels and Codes...................................................................................................36
4.4 Data Fields and Midambles........................................................................................ 39
4.5 CDA Measurements in MSRA Operating Mode........................................................ 40
5 I/Q Data Import and Export..................................................................42
5.1 Import/Export Functions............................................................................................ 42
6 Configuration........................................................................................45
6.1 Result Display Configuration.....................................................................................45
6.2 Code Domain Analysis............................................................................................... 46
6.3 Frequency and Time Domain Measurements...........................................................75
7 Analysis................................................................................................ 85
7.1 Evaluation Range........................................................................................................ 85
7.2 Code Domain Analysis Settings................................................................................ 86
7.3 Traces...........................................................................................................................88
7.4 Markers........................................................................................................................ 89
8 Optimizing and Troubleshooting the Measurement......................... 95
8.1 Error Messages........................................................................................................... 95
9 How to Perform Measurements in TD-SCDMA Applications........... 96
3User Manual 1176.9029.02 ─ 04
Page 4

R&S®FPS-K76/K77
10 Remote Commands for TD-SCDMA Measurements....................... 101
10.1 Introduction............................................................................................................... 101
10.2 Common Suffixes......................................................................................................106
10.3 Activating the TD-SCDMA Applications..................................................................106
10.4 Selecting a Measurement......................................................................................... 110
10.5 Configuring Code Domain Analysis........................................................................111
10.6 Configuring Frequency and Time Domain Measurements................................... 141
10.7 Configuring the Result Display................................................................................143
10.8 Starting a Measurement........................................................................................... 152
10.9 Retrieving Results.....................................................................................................156
10.10 Analysis..................................................................................................................... 173
10.11 Importing and Exporting I/Q Data and Results...................................................... 183
10.12 Configuring the Slave Application Data Range (MSRA mode only).....................185
Contents
10.13 Status Registers........................................................................................................187
10.14 Deprecated Commands............................................................................................ 190
10.15 Programming Examples (TD-SCDMA BTS)............................................................ 192
11 I/Q Data File Format (iq-tar)...............................................................202
11.1 I/Q Parameter XML File Specification......................................................................203
11.2 I/Q Data Binary File................................................................................................... 206
List of Remote Commands (TD-SCDMA)......................................... 208
Index....................................................................................................212
4User Manual 1176.9029.02 ─ 04
Page 5

R&S®FPS-K76/K77
1 Preface
Preface
Typographical Conventions
1.1 Typographical Conventions
The following text markers are used throughout this documentation:
Convention Description
"Graphical user interface elements"
KEYS Key names are written in capital letters.
File names, commands,
program code
Input Input to be entered by the user is displayed in italics.
Links Links that you can click are displayed in blue font.
"References" References to other parts of the documentation are enclosed by quota-
All names of graphical user interface elements on the screen, such as
dialog boxes, menus, options, buttons, and softkeys are enclosed by
quotation marks.
File names, commands, coding samples and screen output are distinguished by their font.
tion marks.
5User Manual 1176.9029.02 ─ 04
Page 6

R&S®FPS-K76/K77
2 Welcome to the TD-SCDMA Applications
The TD-SCDMA applications add functionality to the R&S FPS to perform code domain
analysis or power measurements according to the TD-SCDMA standard.
R&S FPS-K76 performs Base Transceiver Station (BTS) measurements (for downlink
signals).
In particular, the TD-SCDMA applications feature:
●
●
●
●
This user manual contains a description of the functionality that the application provides, including remote control operation.
Welcome to the TD-SCDMA Applications
Starting the TD-SCDMA Application
Code domain analysis, providing results like code domain power, EVM, peak code
domain error etc.
Various power measurements
Spectrum Emission Mask measurements
Statistical (CCDF) evaluation
Installation
You can find detailed installation instructions in the R&S FPS Getting Started manual
or in the Release Notes.
2.1 Starting the TD-SCDMA Application
The TD-SCDMA measurements require a special application on the R&S FPS.
To activate the TD-SCDMA applications
► Select the MODE key.
A dialog box opens that contains all operating modes and applications currently
available on your R&S FPS.
A Code Domain Analysis measurement is started immediately with the default settings.
It can be configured in the TD-SCDMA "Overview" dialog box, which is displayed when
you select the "Overview" softkey from any menu (see Chapter 6.2.1, "Configuration
Overview", on page 47).
Multiple Measurement Channels and Sequencer Function
When you activate an application, a new measurement channel is created which determines the measurement settings for that application. The same application can be activated with different measurement settings by creating several channels for the same
application.
Only one measurement can be performed at any time, namely the one in the currently
active channel. However, in order to perform the configured measurements consecutively, a Sequencer function is provided.
6User Manual 1176.9029.02 ─ 04
Page 7

R&S®FPS-K76/K77
If activated, the measurements configured in the currently active channels are performed one after the other in the order of the tabs. The currently active measurement is
indicated by a symbol in the tab label. The result displays of the individual channels
are updated in the tabs (including the "MultiView") as the measurements are performed. Sequential operation itself is independent of the currently displayed tab.
For details on the Sequencer function see the R&S FPS User Manual.
Welcome to the TD-SCDMA Applications
Understanding the Display Information
2.2 Understanding the Display Information
The following figure shows a measurement diagram during a TD-SCDMA BTS measurement. All different information areas are labeled. They are explained in more detail
in the following sections.
1
= Channel bar for firmware and measurement settings
2+3 = Window title bar with diagram-specific (trace) information
4 = Diagram area
5 = Diagram footer with diagram-specific information
6 = Instrument status bar with error messages, progress bar and date/time display
MSRA operating mode
In MSRA operating mode, additional tabs and elements are available. A colored background of the screen behind the measurement channel tabs indicates that you are in
MSRA operating mode.
For details on the MSRA operating mode see the R&S FPS MSRA User Manual.
Channel bar information
In TD-SCDMA applications, when performing Code Domain Analysis, the R&S FPS
screen display deviates from the Spectrum application. For Frequency and time
7User Manual 1176.9029.02 ─ 04
Page 8

R&S®FPS-K76/K77
domain measurements, the familiar settings are displayed (see the R&S FPS Getting
Started manual).
Welcome to the TD-SCDMA Applications
Understanding the Display Information
Table 2-1: Hardware settings displayed in the channel bar in TD-SCDMA applications for Code
Ref Level Reference level
Att Mechanical and electronic RF attenuation
Freq Center frequency for the RF signal
Channel Channel number (code number and spreading factor)
Slot Slot of the (CPICH) channel
Code Power Power result mode:
Symbol Rate Symbol rate of the current channel
Domain Analysis
●
Absolute
●
Relative to total power of the data parts of the signal
Window title bar information
For each diagram, the header provides the following information:
Figure 2-1: Window title bar information in TD-SCDMA applications
1 = Window number
2 = Window type
3 = Trace color
4 = Trace number
5 = Detector
Diagram footer information
For most graphical evaluations the diagram footer (beneath the diagram) contains scaling information for the x-axis, where applicable:
●
Start slot/symbol/code
●
slot/symbol/code per division
●
Stop slot/symbol/code
Status bar information
Global instrument settings, the instrument status and any irregularities are indicated in
the status bar beneath the diagram. Furthermore, the progress of the current operation
is displayed in the status bar.
8User Manual 1176.9029.02 ─ 04
Page 9

R&S®FPS-K76/K77
3 Measurements and Result Display
The TD-SCDMA applications provide several different measurements for signals
according to the TD-SCDMA standard. The main and default measurement is Code
Domain Analysis. In addition to the code domain power measurements specified by the
TD-SCDMA standard, the TD-SCDMA applications offer measurements with predefined settings in the frequency and time domain, e.g. channel power or power vs time
measurements.
Evaluation methods
The captured and processed data for each measurement can be evaluated with various different methods. All evaluation methods available for the selected TD-SCDMA
measurement are displayed in the evaluation bar in SmartGrid mode.
Evaluation range
You can restrict evaluation to a specific channel, frame or slot, depending on the evaluation method. See Chapter 7.1, "Evaluation Range", on page 85.
Measurements and Result Display
Code Domain Analysis
● Code Domain Analysis..............................................................................................9
● Frequency and Time Domain Measurements.........................................................24
3.1 Code Domain Analysis
Access: "Overview" > "Select Measurement" > "Code Domain Analyzer"
The Code Domain Analysis measurement provides various evaluation methods and
result diagrams.
A signal section containing at least two TD-SCDMA subframes is recorded for analysis
and then searched through to find the start of the first subframe. If a subframe start is
found in the signal, the code domain power analysis is performed for the selected slot.
The different evaluations are calculated from the captured I/Q data set. Therefore it is
not necessary to start a new measurement to change the evaluation.
The TD-SCDMA applications provide the peak code domain error measurement and
composite EVM specified by the TD-SCDMA standard, as well as the code domain
power measurement of assigned and unassigned codes. The power can be displayed
either for all channels in one slot, or for one channel in all slots. The composite constellation diagram of the entire signal can also be displayed. In addition, the symbols
demodulated in a slot, their power, and the determined bits or the symbol EVM can be
displayed for an active channel.
The power of a channel is always measured in relation to its symbol rate within the
code domain. It can be displayed either as absolute values or relative to the total signal
(data parts only). By default, the power relative to the total signal is displayed.
The composite EVM, peak code domain error and composite constellation measurements are also always referenced to the total signal.
9User Manual 1176.9029.02 ─ 04
Page 10

R&S®FPS-K76/K77
Remote command:
CONF:CDP[:BTS]:MEAS CDP, see CONFigure:CDPower:MEASurement
on page 110
● Code Domain Parameters.......................................................................................10
● Evaluation Methods for Code Domain Analysis......................................................11
● CDA Measurements in MSRA Operating Mode......................................................24
Measurements and Result Display
Code Domain Analysis
3.1.1 Code Domain Parameters
Two different types of measurement results are determined and displayed in the Result
Summary: global results and channel results (for the selected channel).
The number of the slot and channel (code) at which the measurement is performed is
indicated globally for the measurement in the channel bar.
The spreading code of the selected channel is indicated with the channel number in
the channel bar and above the channel-specific results in the Result Summary.
In the Channel Table, the analysis results for all (active) channels are displayed individually.
Table 3-1: General and slot-specific code domain power results in the Result Summary
Parameter Description
Chip Rate Error The chip rate error in ppm. A large chip rate error results in symbol errors and, there-
fore, in possible synchronization errors for code domain measurements. This measurement result is also valid if the application could not synchronize to the TDSCDMA signal.
Trigger to Frame The time difference between the beginning of the recorded signal section to the start
of the first slot.
For triggered measurements, this difference is identical with the time difference of
frame trigger (+ trigger offset) and the start of the first slot. If synchronization of the
analyzer and input signal fails, the value of "Trigger to Frame" is not significant.
For non-triggered measurements, no result is available.
P Data Average power of the slot's data parts (total and for each data part)
P Midamble Power of the slot's midamble
Carrier Freq Error The frequency error relative to the center frequency of the analyzer. The absolute fre-
quency error is the sum of the analyzer and DUT frequency error. The specified value
is averaged for one slot (see also "Synchronization fails" on page 95)
IQ Offset DC offset of the signal in the selected slot in %
IQ Imbalance I/Q imbalance of signals in the selected slot in %
Active Channels The number of active channels detected in the signal in the selected slot. Both the
detected data channels and the control channels are considered active channels.
RHO Quality parameter RHO for each slot.
According to the TD-SCDMA standard, Rho is the normalized, correlated power
between the measured and the ideally generated reference signal.
10User Manual 1176.9029.02 ─ 04
Page 11

R&S®FPS-K76/K77
The channel-specific results are displayed in the Result Summary, the Channel Table,
or both.
Table 3-2: Channel-specific code domain power results
Measurements and Result Display
Code Domain Analysis
Parameter Description
Average RCDE Average Relative Code Domain Error over all channels. The Average RCDE is calcu-
lated according to release 8 of the standard.
Composite EVM The error vector magnitude (EVM) over the total signal in the selected slot. The EVM
is the root of the ratio of the mean error power to the power of an ideally generated
reference signal.
See also "Composite EVM" on page 16
Pk CDE (15 ksps) The Peak Code Domain Error projects the difference between the measured signal
and the ideal reference signal onto the spreading factor in the selected slot (see
"Peak Code Domain Error" on page 18). The symbol rate, from which the spreading
factor can be determined, is indicated in brackets.
Parameter Description
Channel Type Detected type of channel (see Table 4-4)
Ch.SF Channel number including the spreading factor (in the form <Channel>.<SF>).
SymRate[ksps] Symbol rate at which the data in the channel is transmitted (in ksps)
Symbol EVM RMS and peak EVM values per symbol (see "Symbol EVM" on page 22)
Mod Modulation type (QPSK, 8PSK, 16QAM or 64QAM)
Power [dBm] Channel power, absolute
Power [dB] Channel power, relative to total power of the data parts of the signal
MA.shift Midamble shift
For channels, this is the shift of the associated midamble if a common or default midamble assignment is detected (see Chapter 4.4, "Data Fields and Midambles",
on page 39)
ΔMid1/2 The power offset between the midamble and the sum power of its channels in data
part 1 or 2, respectively.
The TD-SCDMA specifications require that the midamble and its channels must have
the same power. These parameters show if a common or default midamble assignment is detected (see Chapter 4.4, "Data Fields and Midambles", on page 39).
3.1.2 Evaluation Methods for Code Domain Analysis
Access: "Overview" > "Display Config"
The captured I/Q data can be evaluated using various different methods without having
to start a new measurement. All evaluation methods available for the selected TDSCDMA measurement are displayed in the evaluation bar in SmartGrid mode.
The selected evaluation also affects the results of the trace data query (see Chap-
ter 10.9.3, "Measurement Results for TRACe<n>[:DATA]? TRACE<n>", on page 165).
11User Manual 1176.9029.02 ─ 04
Page 12

R&S®FPS-K76/K77
Bitstream.......................................................................................................................12
Channel Table...............................................................................................................12
Code Domain Power.....................................................................................................14
Code Domain Error Power............................................................................................14
Composite Constellation............................................................................................... 15
Composite EVM............................................................................................................ 16
Mag Error vs Chip......................................................................................................... 17
Marker Table ................................................................................................................18
Peak Code Domain Error..............................................................................................18
Phase Error vs Chip......................................................................................................19
Power vs Slot................................................................................................................ 20
Power vs Symbol.......................................................................................................... 21
Result Summary............................................................................................................21
Symbol Constellation.................................................................................................... 22
Symbol EVM................................................................................................................. 22
Symbol Magnitude Error............................................................................................... 23
Symbol Phase Error......................................................................................................23
Measurements and Result Display
Code Domain Analysis
└ Channel Table Configuration.......................................................................... 13
Bitstream
The Bitstream evaluation displays the demodulated bits of a selected channel for a
given slot.
Figure 3-1: Bitstream display for TD-SCDMA BTS measurements
Depending on the spreading factor (symbol rate) of the channel, a slot can contain a
minimum of 44 and a maximum of 704 symbols. Depending on the modulation type, a
symbol consists of 2 to 6 bits (see Table 4-8).
TIP: Select a specific symbol using the MKR key while the display is focused. If you
enter a number, the marker jumps to the selected symbol, which is highlighted by a
blue circle.
Remote command:
LAY:ADD? '1',RIGH, BITS, see LAYout:ADD[:WINDow]? on page 145
TRACe<n>[:DATA]? on page 161
Channel Table
The Channel Table evaluation displays the detected channels and the results of the
code domain power measurement. The measurement evaluates the total signal over
the selected slot. The Channel Table can contain a maximum of 16 entries, which corresponds to the 16 codes that can be assigned for a spreading factor of 16.
12User Manual 1176.9029.02 ─ 04
Page 13

R&S®FPS-K76/K77
The sort order of the table is configurable (see "Channel Table Sort Order"
on page 87). It can be sorted:
●
Figure 3-2: Channel Table display for TD-SCDMA BTS measurements
By default, only active channels are included in the display; to include inactive channels, see "Channel Table Configuration" on page 13. Inactive channels are marked
with dashes in the "Channel Type", "SymRate" and "Modulation" columns.
For details on the displayed results, see Table 3-2.
Remote command:
LAY:ADD? '1',RIGH, CTABle, see LAYout:ADD[:WINDow]? on page 145
TRACe<n>[:DATA]? on page 161
Measurements and Result Display
Code Domain Analysis
By code number, starting with midambles, then control channels, then data chan-
nels
By midamble, where all channels are listed below the midamble they belong to
Channel Table Configuration ← Channel Table
You can configure which parameters are displayed in the Channel Table by selecting
the table header. A "Table Configuration" dialog box is displayed in which you can
select the columns to be displayed.
By default, only active channels are displayed. To display all channels, including the
inactive ones, enable the "Show Inactive Channels" option.
For details on the displayed results , see Table 3-2.
13User Manual 1176.9029.02 ─ 04
Page 14
R&S®FPS-K76/K77
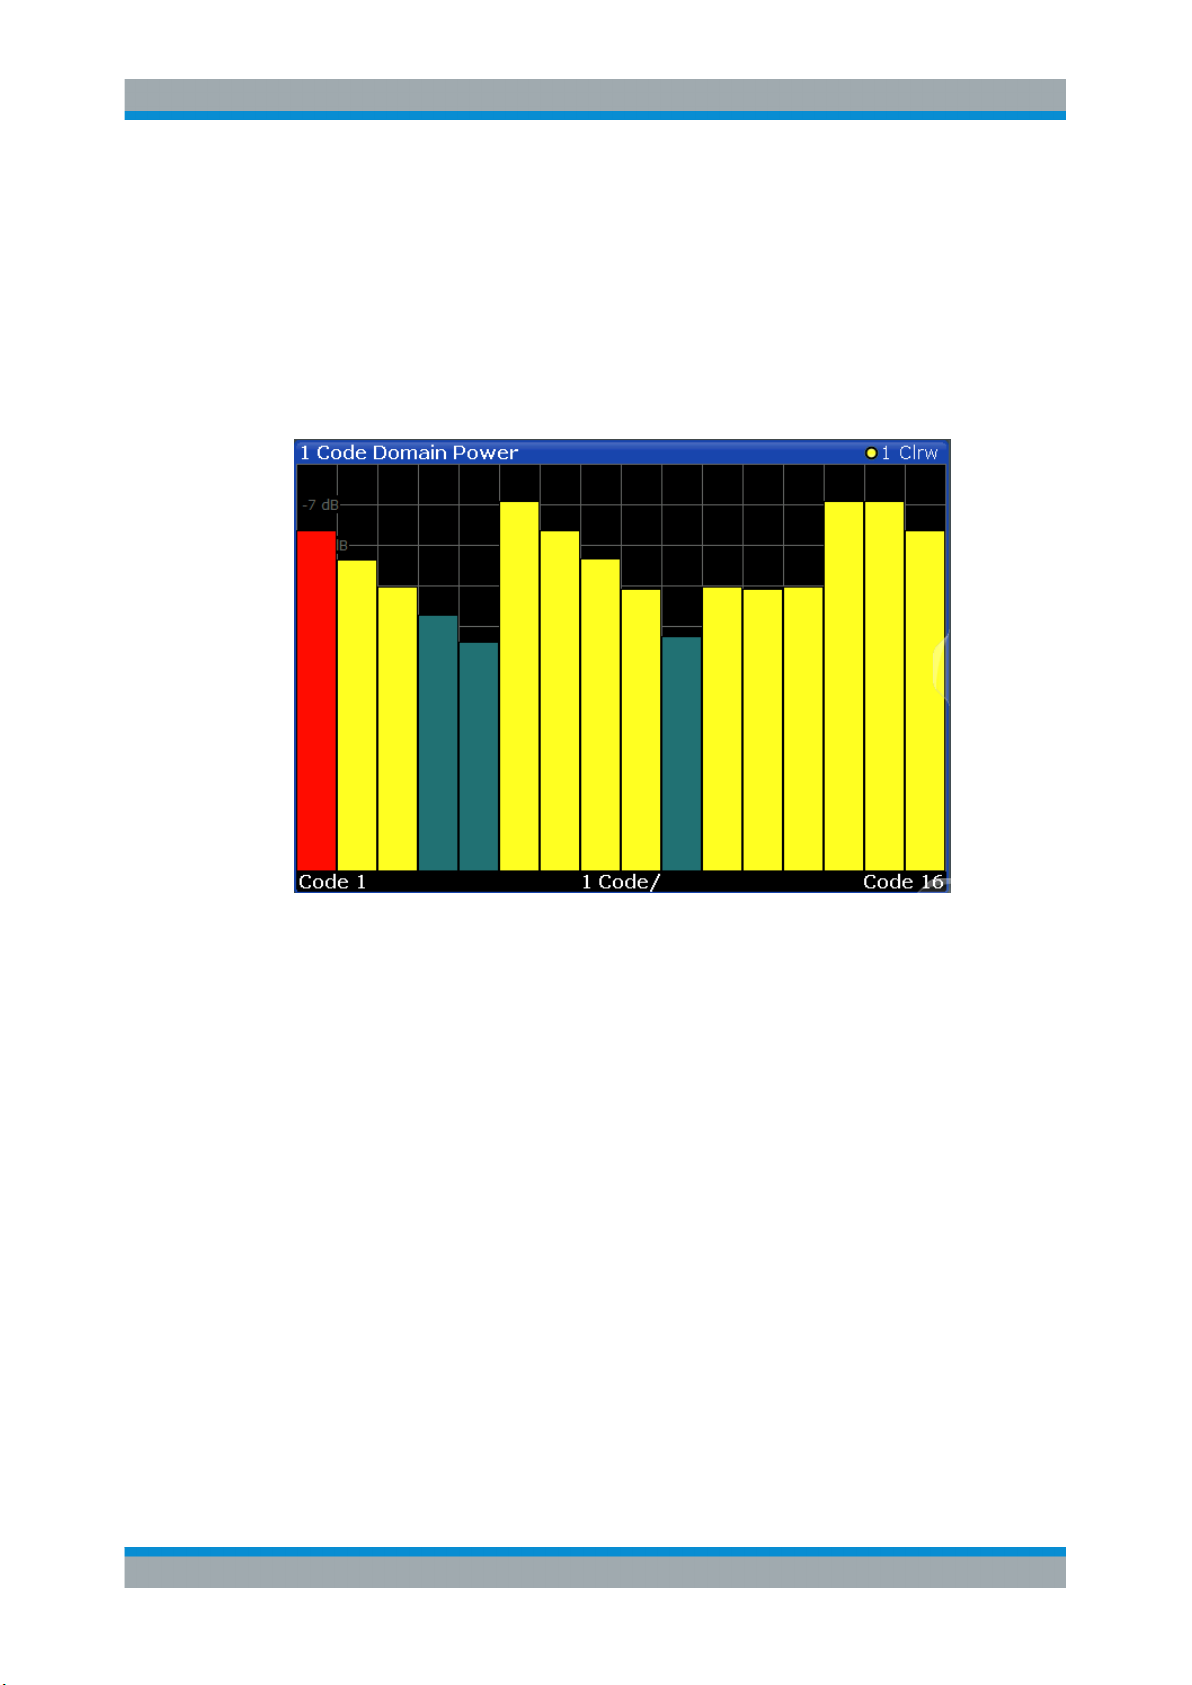
Code Domain Power
The Code Domain Power evaluation shows the power of all possible codes in the
selected slot in the total signal. Channel detection is based on a power threshold (see
Chapter 4.3, "Channels and Codes", on page 36). Thus, it is important that all codes
have a similar power level (no more than 1.5 dB difference to the average power in the
slot). Thus, the scaling of the code domain power is relative to the average power of
the data parts in the specified slot in the total signal by default. The x-axis shows the
possible codes from 0 to the highest spreading factor. Due to the circumstance that the
power is regulated from slot to slot, the result power can differ between different slots.
Measurements and Result Display
Code Domain Analysis
The codes are displayed using the following colors:
●
Yellow: detected channels
●
Red: selected channel (if a channel is made up of more than one code, all codes
that belong to the channel are red)
●
Green: no channel detected
Remote command:
LAY:ADD? '1',RIGH, CDPower, see LAYout:ADD[:WINDow]? on page 145
CALC:MARK:FUNC:CDP:RES? CDP, see CALCulate<n>:MARKer:FUNCtion:
CDPower:RESult? on page 157
TRACe<n>[:DATA]? on page 161
Code Domain Error Power
The Code Domain Error Power is the difference in power between the measured and
an ideally generated reference signal. The number of codes corresponds to the
spreading factor. The y-axis shows the error power for each code. Since it is an error
power (as opposed to the measured power), both active and inactive channels can be
analyzed at a glance.
14User Manual 1176.9029.02 ─ 04
Page 15

R&S®FPS-K76/K77
Measurements and Result Display
Code Domain Analysis
Figure 3-3: Code Domain Error Power Display for TD-SCDMA BTS measurements
The codes are displayed using the following colors:
●
Yellow: detected channels
●
Red: selected channel (if a channel is made up of more than one code, all codes
that belong to the channel are red)
●
Green: no channel detected
Remote command:
LAY:ADD? '1',RIGH, CDEPower, see LAYout:ADD[:WINDow]? on page 145
TRACe<n>[:DATA]? on page 161
Composite Constellation
In the Composite Constellation result display, the constellation points of the 864 chips
are displayed for the specified slot. This data is determined inside the DSP even before
the channel search. Thus, it is not possible to assign constellation points to channels.
The constellation points are displayed normalized with respect to the total power.
Note: The red circle indicates the value "1"
15User Manual 1176.9029.02 ─ 04
Page 16

R&S®FPS-K76/K77
Figure 3-4: Composite Constellation display for TD-SCDMA BTS measurements
Remote command:
LAY:ADD? '1',RIGH, CCONst, see LAYout:ADD[:WINDow]? on page 145
TRACe<n>[:DATA]? on page 161
Measurements and Result Display
Code Domain Analysis
Composite EVM
The Composite EVM evaluation determines the error vector magnitude (EVM) over the
total signal. The EVM is the root of the ratio of the mean error power to the power of an
ideally generated reference signal. To calculate the mean error power, the root mean
square average of the real and imaginary parts of the signal is used. The EVM is
shown in %. This evaluation is useful to determine the modulation accuracy.
Figure 3-5: Composite EVM display for TD-SCDMA BTS measurements
The result display shows the composite EVM values per slot.
The slots are displayed according to the detected channels using the following colors:
●
Yellow: active channel
●
Red: selected channel (if a channel is made up of more than one code, all codes
that belong to the channel are red)
16User Manual 1176.9029.02 ─ 04
Page 17

R&S®FPS-K76/K77
●
Only the channels detected as being active are used to generate the ideal reference
signal. Due to low power, for example, a channel may not be detected as being active.
In this case, the difference between the test signal and the reference signal - and
therefore the composite EVM - is very large.
Distortions also occur if unassigned codes are wrongly given the status of "active channel". To obtain reliable measurement results, select an adequate channel threshold.
Remote command:
LAY:ADD? '1',RIGH, CEVM, see LAYout:ADD[:WINDow]? on page 145
TRACe<n>[:DATA]? on page 161
Mag Error vs Chip
The Magnitude Error versus chip display shows the magnitude error for all chips of the
selected slot.
The magnitude error is calculated as the difference of the magnitude of the received
signal to the magnitude of the reference signal. The reference signal is estimated from
the channel configuration of all active channels. The magnitude error is related to the
square root of the mean power of reference signal and given in percent.
Measurements and Result Display
Code Domain Analysis
None: no active channels
Where:
MAG
k
s
k
x
k
k Index number of the evaluated chip
N Number of chips at each CPICH slot
n Index number for mean power calculation of reference signal
Figure 3-6: Magnitude Error vs Chip display for TD-SCDMA BTS measurements
Magnitude error of chip number k
Complex chip value of received signal
Complex chip value of reference signal
17User Manual 1176.9029.02 ─ 04
Page 18

R&S®FPS-K76/K77
Remote command:
LAY:ADD? '1',RIGH, MECHip, see LAYout:ADD[:WINDow]? on page 145
TRACe<n>[:DATA]? TRACE<1...4>
Marker Table
Displays a table with the current marker values for the active markers.
This table is displayed automatically if configured accordingly (see " Marker Table Dis-
play " on page 92).
Remote command:
LAY:ADD? '1',RIGH, MTAB, see LAYout:ADD[:WINDow]? on page 145
Results:
CALCulate<n>:MARKer<m>:X on page 175
CALCulate<n>:MARKer<m>:Y? on page 172
Measurements and Result Display
Code Domain Analysis
Peak Code Domain Error
The Peak Code Domain Error is defined as the maximum value for the Code Domain
Error for all codes.
In line with the TD-SCDMA specifications, the error is calculated:
●
Between the measurement signal and the ideal reference signal
●
For a given slot
●
For each active code
●
For any of the supported spreading codes
For inactive slots (containing no active channels), no results are available as no refer-
ence power is available.
Figure 3-7: Peak Code Domain Error display for TD-SCDMA BTS measurements
The result display shows the peak error values per slot.
The slots are displayed according to the detected channels using the following colors:
●
Yellow: active channel
18User Manual 1176.9029.02 ─ 04
Page 19

R&S®FPS-K76/K77
●
●
Only the channels detected as being active are used to generate the ideal reference
signal. If a channel is not detected as being active, e.g. due to low power, the difference between the test signal and the reference signal is too large. The result display
therefore shows a peak code domain error that is too high for all slots.
Distortions also occur if unassigned codes are wrongly given the status of "active channel". To obtain reliable measurement results, select an adequate channel threshold.
Remote command:
LAY:ADD? '1',RIGH, PCDerror, see LAYout:ADD[:WINDow]? on page 145
TRACe<n>[:DATA]? on page 161
Phase Error vs Chip
Phase Error vs Chip activates the phase error versus chip display. The phase error is
displayed for all chips of the selected slot.
The phase error is calculated by the difference of the phase of received signal and
phase of reference signal. The reference signal is estimated from the channel configuration of all active channels. The phase error is given in degrees in a range of +180° to
-180°.
Measurements and Result Display
Code Domain Analysis
Red: selected channel (if a channel is made up of more than one code, all codes
that belong to the channel are red)
None: no active channels
Figure 3-8: Calculating the magnitude, phase and vector error per chip
Where:
PHI
k
s
k
x
k
k Index number of the evaluated chip
Phase error of chip number k
Complex chip value of received signal
Complex chip value of reference signal
19User Manual 1176.9029.02 ─ 04
Page 20

R&S®FPS-K76/K77
Remote command:
LAY:ADD? '1',RIGH, PECHip, see LAYout:ADD[:WINDow]? on page 145
TRACe<n>[:DATA]? TRACE<1...4>
Measurements and Result Display
Code Domain Analysis
N Number of chips at each CPICH slot
φ(x) Phase calculation of a complex value
Power vs Slot
The Power vs Slot evaluation displays the power of the selected channel for each slot.
The power is displayed either absolute or relative to the total power of the data parts of
the signal. The measurement evaluates a single channel over all slots.
Figure 3-9: Power vs Slot Display for TD-SCDMA BTS measurements
The slots are displayed according to the detected channels using the following colors:
●
Yellow: active channel
●
Green: channel with alias power (power results from channels with a different code
class)
●
Cyan: inactive channel
●
Red: selected channel (if a channel is made up of more than one code, all codes
that belong to the channel are red)
20User Manual 1176.9029.02 ─ 04
Page 21

R&S®FPS-K76/K77
Remote command:
LAY:ADD? '1',RIGH, PSLot, see LAYout:ADD[:WINDow]? on page 145
TRACe<n>[:DATA]? on page 161
Power vs Symbol
The Power vs Symbol evaluation shows the power measured for each symbol in the
selected channel and the selected slot. The power is not averaged here.
Measurements and Result Display
Code Domain Analysis
Figure 3-10: Power vs Symbol display for TD-SCDMA BTS measurements
Depending on the spreading factor (symbol rate) of the channel, a slot can contain a
minimum of 44 and a maximum of 704 symbols (see Table 4-8).
Remote command:
LAY:ADD? '1',RIGH, PSYMbol, see LAYout:ADD[:WINDow]? on page 145
TRACe<n>[:DATA]? on page 161
Result Summary
The Result Summary evaluation displays a list of measurement results on the screen.
For details , see Chapter 3.1.1, "Code Domain Parameters", on page 10.
Figure 3-11: Result Summary display for TD-SCDMA BTS measurements
Remote command:
LAY:ADD? '1',RIGH, RSUMmary, see LAYout:ADD[:WINDow]? on page 145
TRACe<n>[:DATA]? on page 161
CALCulate<n>:MARKer:FUNCtion:CDPower:RESult? on page 157
21User Manual 1176.9029.02 ─ 04
Page 22

R&S®FPS-K76/K77
Symbol Constellation
The Symbol Constellation evaluation shows all modulated symbols of the selected
channel and the selected slot.
Note: The red circle indicates the value "1"
Measurements and Result Display
Code Domain Analysis
Figure 3-12: Symbol Constellation display for TD-SCDMA BTS measurements
Remote command:
LAY:ADD? '1',RIGH, SCONst, see LAYout:ADD[:WINDow]? on page 145
TRACe<n>[:DATA]? on page 161
Symbol EVM
The Symbol EVM evaluation shows the error between the measured signal and the
ideal reference signal in percent for the selected channel and the selected slot. A trace
over all symbols of a slot is drawn. The number of symbols depends on the symbol
rate (or spreading factor) of the channel (see Table 4-8).
Figure 3-13: Symbol EVM display for TD-SCDMA BTS measurements
22User Manual 1176.9029.02 ─ 04
Page 23

R&S®FPS-K76/K77
Remote command:
LAY:ADD? '1',RIGH, SEVM, see LAYout:ADD[:WINDow]? on page 145
TRACe<n>[:DATA]? on page 161
Symbol Magnitude Error
The Symbol Magnitude Error is calculated analogous to symbol EVM. The result is one
symbol magnitude error value for each symbol of the slot of a special channel. Positive
values of symbol magnitude error indicate a symbol magnitude that is larger than the
expected ideal value. Negative symbol magnitude errors indicate a symbol magnitude
that is less than the expected ideal value. The symbol magnitude error is the difference
between the magnitude of the received symbol and that of the reference symbol, related to the magnitude of the reference symbol.
Measurements and Result Display
Code Domain Analysis
Figure 3-14: Symbol Magnitude Error display for TD-SCDMA BTS measurements
Remote command:
LAY:ADD? '1',RIGH, SMERror, see LAYout:ADD[:WINDow]? on page 145
TRACe<n>[:DATA]? TRACE<1...4>
Symbol Phase Error
The Symbol Phase Error is calculated analogous to symbol EVM. The result is one
symbol phase error value for each symbol of the slot of a special channel. Positive values of symbol phase error indicate a symbol phase that is larger than the expected
ideal value. Negative symbol phase errors indicate a symbol phase that is less than the
expected ideal value.
Figure 3-15: Symbol Phase Error display for TD-SCDMA BTS measurements
23User Manual 1176.9029.02 ─ 04
Page 24

R&S®FPS-K76/K77
Remote command:
LAY:ADD? '1',RIGH, SPERror, see LAYout:ADD[:WINDow]? on page 145
TRACe<n>[:DATA]? TRACE<1...4>
Measurements and Result Display
Frequency and Time Domain Measurements
3.1.3 CDA Measurements in MSRA Operating Mode
The TD-SCDMA BTS application can also be used to analyze data in MSRA operating
mode.
In MSRA operating mode, only the MSRA Master actually captures data; the MSRA
applications receive an extract of the captured data for analysis, referred to as the
application data. The application data range is indicated in the MSRA Master by vertical blue lines.
However, the individual result displays of the application need not analyze the complete data range. The data range that is actually analyzed by the individual result display is referred to as the analysis interval.
In the TD-SCDMA BTS application, the analysis interval is automatically determined. It
depends on the selected channel/ slot/ frame to analyze, which is defined for the evaluation range, and on the result display. The currently used analysis interval (in seconds,
related to capture buffer start) is indicated in the window header for each result display.
For details on the MSRA operating mode, see the R&S FPS MSRA User Manual.
3.2 Frequency and Time Domain Measurements
Access: "Overview" > "Select Measurement"
In addition to the Code Domain Analysis measurements, the TD-SCDMA applications
also provide some frequency and time domain measurements as defined in the TDSCDMA standard. Frequency and time domain measurements are identical to the corresponding measurements in the base unit, but configured according to the requirements of the TD-SCDMA standard.
For details on these measurements, see the R&S FPS User Manual.
MSRA operating mode
Frequency and time domain measurements are not available in MSRA operating
mode.
For details on the MSRA operating mode, see the R&S FPS MSRA User Manual.
3.2.1 Measurement Types and Results in the Frequency and Time Domain
Access: "Overview" > Select Measurement
24User Manual 1176.9029.02 ─ 04
Page 25

R&S®FPS-K76/K77
The TD-SCDMA applications provide the following frequency and time domain measurements:
Power vs Time.............................................................................................................. 25
Power............................................................................................................................27
Channel Power ACLR...................................................................................................27
Spectrum Emission Mask..............................................................................................28
Occupied Bandwidth..................................................................................................... 29
CCDF............................................................................................................................ 30
Power vs Time
Access: "Overview" > "Select Measurement" > "Power vs Time"
The Power vs Time measurement checks the signal power in the time domain against
a transmission power mask defined by the TD-SCDMA specification ("transmit
ON/OFF power time mask"). This measurement is meant to ensure that each burst
remains within a tight power range, i.e. rises and falls very quickly.
For downlink measurements, the power in the slots reserved for the uplink transmission must quickly fall to the low value. It must then quickly rise to high again in the slots
for downlink transmission. Thus, the slots of interest in downlink Power vs Time measurements are slot 1 to the slot indicated by the Switching Point, in which the OFF
power is checked.
Measurements and Result Display
Frequency and Time Domain Measurements
Figure 3-16: Power vs Time diagram for TD-SCDMA BTS application
In the TD-SCDMA UE application, it is assumed that only one uplink device is
checked during one measurement. Furthermore, it is assumed that each uplink device
uses only a single slot for transmission. Thus, for uplink measurements, only one slot
is checked against the transmit mask. Since the TD-SCDMA UE application has no
information which slot is being used, it assumes the first slot in which a burst is detected to be slot 1, the first slot for uplink transmission. In this slot, the power must quickly
rise to the high value, and quickly fall back to low at the end. Thus, the slot of interest
in uplink Power vs Time measurements is slot 1, which cannot be changed, and in
which the ON power is checked.
25User Manual 1176.9029.02 ─ 04
Page 26

R&S®FPS-K76/K77
Figure 3-17: Power vs Time diagram for TD-SCDMA UE application
To perform the power check, the TD-SCDMA application must synchronize the transmit mask to the current signal, as the mask is defined relative to a slot start.
The application measures the power in the defined number of subframes in the time
domain and calculates the average power in the slots of interest. It then compares the
averaged power of the signal against the mask for allowed transmission power.
The mask consists of four defined intervals:
●
●
●
●
Note: For UE measurements, the ON power is checked, thus the mask is defined for
the following intervals:
●
●
●
●
As a result, the power vs time trace is displayed. The result of the limit check (Pass/
Fail) is also indicated in the diagram.
The numeric results are provided in the List Evaluation result display (see "List Evalua-
tion" on page 32).
For details, see Chapter 6.3.1, "Power vs Time", on page 76.
Remote command:
CONF:CDP[:BTS]:MEAS PVT, see CONFigure:CDPower:MEASurement
on page 110
Querying results:
TRAC:DATA? TRACE1, see TRACe<n>[:DATA]? on page 161
CALCulate<n>:LIMit<k>:FAIL? on page 170
CONFigure:CDPower[:BTS]:PVTime:LIST:RESult? on page 159
Measurements and Result Display
Frequency and Time Domain Measurements
Before the burst
During fall time
During the low time
During the rise time
Before the burst
During the rise time
During the high time
During fall time
26User Manual 1176.9029.02 ─ 04
Page 27

R&S®FPS-K76/K77
Power
Access: "Overview" > "Select Measurement" > "Power"
The Power measurement determines the TD-SCDMA signal channel power. The
R&S FPS measures the signal power in a single channel with a bandwidth of
1.2288 MHz. The results are based on the root mean square.
Measurements and Result Display
Frequency and Time Domain Measurements
Figure 3-18: Signal channel power measurement in TD-SCDMA BTS application
For details, see Chapter 6.3.2, "Signal Channel Power Measurements", on page 79.
Remote command:
CONF:CDP[:BTS]:MEAS POW, see CONFigure:CDPower:MEASurement
on page 110
Querying results: CALC:MARK:FUNC:POW:RES? CPOW, see CALCulate<n>:
MARKer<m>:FUNCtion:POWer<sb>:RESult? on page 170
CALC:MARK:FUNC:POW:RES? ACP, see CALCulate<n>:MARKer<m>:FUNCtion:
POWer<sb>:RESult? on page 170
Channel Power ACLR
Access: "Overview" > "Select Measurement" > "Channel Power ACLR"
Channel Power ACLR performs an adjacent channel power measurement in the
default setting according to TD-SCDMA specifications (adjacent channel leakage
ratio).
The measurement range can be adapted to a slot range of the current TD-SCDMA signal.
The R&S FPS measures the channel power and the relative power of the adjacent
channels and of the alternate channels. The results are displayed below the diagram.
27User Manual 1176.9029.02 ─ 04
Page 28

R&S®FPS-K76/K77
Figure 3-19: ACLR measurement in TD-SCDMA BTS application
For details, see Chapter 6.3.3, "Channel Power (ACLR) Measurements", on page 80.
Remote command:
CONF:CDP[:BTS]:MEAS ACLR, see CONFigure:CDPower:MEASurement
on page 110
Querying results:
CALC:MARK:FUNC:POW:RES? ACP, see CALCulate<n>:MARKer<m>:FUNCtion:
POWer<sb>:RESult? on page 170
CALC:MARK:FUNC:POW:RES? ACP, see CALCulate<n>:MARKer<m>:FUNCtion:
POWer<sb>:RESult? on page 170
Measurements and Result Display
Frequency and Time Domain Measurements
Spectrum Emission Mask
Access: "Overview" > "Select Measurement" > "Spectrum Emission Mask"
The Spectrum Emission Mask measurement determines the power of the TD-SCDMA
signal in defined offsets from the carrier and compares the power values with a spectral mask specified by TD-SCDMA.
For details, see Chapter 6.3.4, "Spectrum Emission Mask", on page 81.
28User Manual 1176.9029.02 ─ 04
Page 29

R&S®FPS-K76/K77
Figure 3-20: SEM measurement results for TD-SCDMA BTS measurement
Remote command:
CONF:CDP[:BTS]:MEAS ESP, see CONFigure:CDPower:MEASurement
on page 110
Querying results:
CALC:MARK:FUNC:POW:RES? CPOW, see CALCulate<n>:MARKer<m>:FUNCtion:
POWer<sb>:RESult? on page 170
CALC:MARK:FUNC:POW:RES? ACP, see CALCulate<n>:MARKer<m>:FUNCtion:
POWer<sb>:RESult? on page 170
CALCulate<n>:LIMit<k>:FAIL? on page 170
Measurements and Result Display
Frequency and Time Domain Measurements
Occupied Bandwidth
Access: "Overview" > "Select Measurement" > "OBW"
The Occupied Bandwidth measurement determines the bandwidth that the signal occupies.
The occupied bandwidth is defined as the bandwidth in which – in default settings 99 % of the total signal power is found. The percentage of the signal power to be included in the bandwidth measurement can be changed.
The occupied bandwidth (Occ BW) and the frequency markers are displayed in the
marker table.
29User Manual 1176.9029.02 ─ 04
Page 30

R&S®FPS-K76/K77
Figure 3-21: Occupied bandwidth measurement in TD-SCDMA BTS application
For details, see Chapter 6.3.5, "Occupied Bandwidth", on page 82.
Remote command:
CONF:CDP[:BTS]:MEAS OBAN, see CONFigure:CDPower:MEASurement
on page 110
Querying results:
CALC:MARK:FUNC:POW:RES? OBW, see CALCulate<n>:MARKer<m>:FUNCtion:
POWer<sb>:RESult? on page 170
CALC:MARK:FUNC:POW:RES? ACP, see CALCulate<n>:MARKer<m>:FUNCtion:
POWer<sb>:RESult? on page 170
Measurements and Result Display
Frequency and Time Domain Measurements
CCDF
Access: "Overview" > "Select Measurement" > "CCDF"
The CCDF measurement determines the distribution of the signal amplitudes (complementary cumulative distribution function). The CCDF and the Crest factor are displayed. For the purposes of this measurement, a signal section of user-definable
length is recorded continuously in the zero span, and the distribution of the signal
amplitudes is evaluated.
For details, see Chapter 6.3.6, "CCDF", on page 83.
30User Manual 1176.9029.02 ─ 04
Page 31

R&S®FPS-K76/K77
Figure 3-22: CCDF measurement results for TD-SCDMA BTS measurements
Remote command:
CONF:CDP[:BTS]:MEAS CCDF, see CONFigure:CDPower:MEASurement
on page 110
Querying results:
CALCulate<n>:STATistics:RESult<t>? on page 172
Measurements and Result Display
Frequency and Time Domain Measurements
3.2.2 Evaluation Methods for Frequency and Time Measurements
Access: "Overview" > "Display Config"
The evaluation methods for frequency and time domain measurements are identical to
those in the Spectrum application.
Diagram ........................................................................................................................31
List Evaluation...............................................................................................................32
Result Summary ...........................................................................................................32
Marker Table ................................................................................................................33
Marker Peak List .......................................................................................................... 33
Diagram
Displays a basic level vs. frequency or level vs. time diagram of the measured data to
evaluate the results graphically. This is the default evaluation method. Which data is
displayed in the diagram depends on the "Trace" settings. Scaling for the y-axis can be
configured.
31User Manual 1176.9029.02 ─ 04
Page 32

R&S®FPS-K76/K77
Remote command:
LAY:ADD? '1',RIGH, DIAG, see LAYout:ADD[:WINDow]? on page 145
Results:
List Evaluation
The list evaluation provides the numerical results for the Power vs Time measurement.
Measurements and Result Display
Frequency and Time Domain Measurements
The List Evaluation displays the following information:
Column Description
Start / Stop Start and stop time of the individual time intervals of the Emission
Envelope Mask (in ns)
Avg Average power measured in mask interval
Max Maximum power measured in mask interval
Time @ MaxPower The exact point in time when the maximum power occurred
For details, see Chapter 6.3.1, "Power vs Time", on page 76.
Remote command:
LAY:ADD? '1',RIGH, LEV, see LAYout:ADD[:WINDow]? on page 145
Result Summary
Result summaries provide the results of specific measurement functions in a table for
numerical evaluation. The contents of the result summary vary depending on the
selected measurement function. See the description of the individual measurement
functions for details.
32User Manual 1176.9029.02 ─ 04
Page 33

R&S®FPS-K76/K77
Remote command:
LAY:ADD? '1',RIGH, RSUM, see LAYout:ADD[:WINDow]? on page 145
Marker Table
Displays a table with the current marker values for the active markers.
This table is displayed automatically if configured accordingly (see " Marker Table Dis-
play " on page 92).
Remote command:
LAY:ADD? '1',RIGH, MTAB, see LAYout:ADD[:WINDow]? on page 145
Results:
CALCulate<n>:MARKer<m>:X on page 175
CALCulate<n>:MARKer<m>:Y? on page 172
Marker Peak List
The marker peak list determines the frequencies and levels of peaks in the spectrum or
time domain. How many peaks are displayed can be defined, as well as the sort order.
In addition, the detected peaks can be indicated in the diagram. The peak list can also
be exported to a file for analysis in an external application.
Measurements and Result Display
Frequency and Time Domain Measurements
Remote command:
LAY:ADD? '1',RIGH, PEAK, see LAYout:ADD[:WINDow]? on page 145
Results:
CALCulate<n>:MARKer<m>:X on page 175
CALCulate<n>:MARKer<m>:Y? on page 172
33User Manual 1176.9029.02 ─ 04
Page 34

R&S®FPS-K76/K77
4 Measurement Basics
Some background knowledge on basic terms and principles used in TD-SCDMA measurements is provided here for a better understanding of the required configuration settings.
Measurement Basics
Frames, Subframes and Slots
4.1 Short Introduction to TD-SCDMA
Many communication standards, such as WCDMA or cdma2000, distribute the data
from different users to different frequencies within a specific band (FDD mode). As
opposed to these standards, TD-SCDMA distributes the data in time (TDD mode). Furthermore, the mentioned FDD-based standards require two distinct frequency bands
for uplink (to the base station) and downlink (from the base station) communication.
Whereas TD-SCDMA can adjust the number of time slots (and thus the data rate) used
for downlink or uplink dynamically, according to the current traffic requirements. The
available time slots can be distributed flexibly either to several users, or to a single
user requiring a higher data rate. This is a benefit especially when transmitting Internet
data, as usually more data is downloaded than uploaded.
Distributing the data in time also means the TD-SCDMA standard can use the same
carrier frequency for both uplink and downlink.
4.2 Frames, Subframes and Slots
The structure of a typical TD-SCDMA signal is shown in Figure 4-1.
A TD-SCDMA signal is divided into frames with a length of 10 ms each. The frames
are further divided into two subframes, with a length of 5 ms each. For the physical
communication layer, mostly the subframes are of interest.
Each subframe consists of seven slots, named TS0 to TS6. Furthermore, a "Downlink
Pilot Time Slot" (DwPTS) and an "Uplink Pilot Time Slot" (UpPTS), which are required
to transmit synchronization codes. Between the two synchronization areas, a guard
period of 75 µs is inserted. Each slot has a length of 0.675 ms.
The first slot (TS0) of a subframe is always reserved for downlink, the second slot
(TS1) is always reserved for uplink. The switching point indicates the time after which
subsequent slots are available for downlink again. The system is informed about the
current location of the switching point by higher layers.
34User Manual 1176.9029.02 ─ 04
Page 35

R&S®FPS-K76/K77
Measurement Basics
Frames, Subframes and Slots
Figure 4-1: TD-SCDMA signal structure
Synchronization
The individual channels in the input signal must be synchronized to detect timing offsets in the slot spacings. To do so, either slot 0 (BTS mode) or slot 1 (UE mode), or the
"Downlink Pilot Time Slot" (DwPTS) or "Uplink Pilot Time Slot" (UpPTS) can be used.
In UE mode, if the UpPTS is used for synchronization, you must define the SYNC-UL
code to be used. This code depends on the used scrambling code as indicated in the
following table.
Table 4-1: Possible SYNC-UL codes depending on scrambling code
Code Group Scrambling Code Sync -UL Code
Group 1 0 to 3 0 to 7
Group 2 4 to 7 8 to 15
... ... ...
Group 32 124 to 127 248 to 255
35User Manual 1176.9029.02 ─ 04
Page 36

R&S®FPS-K76/K77
Measurement Basics
Channels and Codes
4.3 Channels and Codes
Within each time slot, up to 16 code channels can be transmitted. Each channel is
spread over one to 16 codes (also referred to as channelization codes), depending on
the code class of the channel. The code class specifies the spreading factor of the
channel and thus the number of possible channels per slot.
Table 4-2: Relationship between code class, channels and spreading factor
Code class Spreading factor = No. channels per slot
0 1
1 2
2 4
3 8
4 16
Chips
The user data is spread to code channels across the available bandwidth using the
spreading factor before transmission. The spread bits are referred to as chips. Each
slot consists of 864 chips. The chips are transferred at a rate of 1.28 Megachips per
second (Mcps).
Active and inactive codes/slots
During code domain analysis, the power in the selected slot in the captured subframes
is measured to detect active channels. If the total power in the slot does not exceed a
threshold, the slot is considered to be inactive. Otherwise, the slot is analyzed to detect
channels.
To do so, the data in the slot is unscrambled according to the defined scrambling code
and carrier (= center) frequency. Then, all possible spreading sequences are applied to
the unscrambled data, defining the individual channels. Each despread channel whose
power exceeds the channel threshold is considered to be active. The reference signal
is then generated according to the active channels only.
If the power threshold for inactive channels is not set correctly, power from supposedly
inactive channels contributes to the peak code domain error, leading to false results.
To determine the correct threshold, the Code Domain Power evaluation is a useful
instrument (see "Code Domain Power" on page 14).
4.3.1 Special Channels
To control the data transmission between the sender and the receiver, specific symbols must be included in the transmitted data. This data is included in special data
channels defined by the 3GPP standard which use fixed codes in the code domain.
Thus, the receiver can easily them.
36User Manual 1176.9029.02 ─ 04
Page 37

R&S®FPS-K76/K77
Table 4-3: Special channels in TD-SCDMA signals
Measurement Basics
Channels and Codes
Name Description Slot No. Spreading factor
(SF)
P-CCPCH1 Primary common
control physical
channel 1
P-CCPCH2 Primary common
control physical
channel 2
0 16 1
0 16 2
Code No. (1...SF)
Other special control channels do not have a fixed code, but are identified by higher
layers.
The user data is contained in the Dedicated Physical Channel (DPCH).
The detected type of the channel is indicated in the Channel Table evaluation according to the following assignment:
Table 4-4: Available channel types in TD-SCDMA signals
No. Channel type
0 Inactive
1 Midamble
2 DPCH (user data)
4.3.2 Channel Characteristics
The spreading factor used by a channel determines the data rate. Based on a subframe length of 5 ms, the bits per slot can be calculated.
The modulation used to transmit the user data determines how many bits are required
for each symbol, and thus the maximum number of symbols per slot. Thus, the symbol
rate depends on the used modulation and the data rate. The following tables show the
relationships:
Table 4-5: Number of symbols per slot depending on spreading factor
Spreading factor Number of symbols
16 44
8 88
4 176
2 352
1 704
37User Manual 1176.9029.02 ─ 04
Page 38

R&S®FPS-K76/K77
Table 4-6: Number of bits per symbol depending on modulation
Table 4-7: Number of bits per slot depending on modulation and spreading factor
Measurement Basics
Channels and Codes
Modulation Number of bits per symbol
QPSK 2
8PSK 3
16QAM 4
64QAM 6
SF Modulation
QPSK 8PSK 16QAM 64QAM
Number of bits
16 88 132 176 264
8 176 264 352 528
4 352 528 704 1056
2 704 1056 1408 2112
1 1408 2112 2816 4224
Table 4-8: Channel parameters and their dependencies
Spreading Factor
1 704 1408 281.6 2112 422.4 2816 563.2 4224 844.8
2 352 704 140.8 1056 211.2 1408 281.6 2112 422.4
4 176 352 70.4 528 105.6 704 140.8 1056 211.2
8 88 176 35.2 264 52.8 352 70.4 528 105.6
16 44 88 17.6 132 26.4 176 35.2 264 52.8
Symbols /
Slot
QPSK 8PSK 16QAM 64QAM
Bits per
Slot
ksps Bits per
slot
ksps Bits per
slot
ksps Bits per
slot
ksps
Channel notation
Channels are generally indicated by their channel number and spreading factor (in the
form <Channel>.<SF>).
Selected codes and channels
In the result displays that refer to channels, the currently selected channel is highlighted in the diagram. You select a channel by entering a channel number and spreading
factor in the "Evaluation Range" settings.
The specified channel is selected and marked in red in the corresponding result displays, if active. If no spreading factor is specified, the spreading factor 16 is assumed.
For inactive (unused) channels, the code based on the spreading factor 16 is highlighted.
38User Manual 1176.9029.02 ─ 04
Page 39

R&S®FPS-K76/K77
Example: Enter 4.8
Channel 4 is marked at spreading factor 8 (35.2 ksps) if the channel is active, otherwise code 7 at spreading factor 16.
Measurement Basics
Data Fields and Midambles
4.4 Data Fields and Midambles
Each slot consists of 864 chips, of which 704 are used to transmit data. The data is
divided into two data fields with 352 chips each. The midamble (consisting of the
remaining 144 chips) is located between the two data fields. A guard period of 16 chips
completes the slot.
Figure 4-2: TD-SCDMA slot structure
Midamble shifts
The midamble is a known symbol sequence which can be used to synchronize the signal in the slot, and to distinguish the data from individual users in a single slot. Different
users can be distinguished by their different time shifts of the same basic midamble
sequence. For each midamble shift, the known symbol sequence is rotated cyclically
by a defined number of chips. The maximum number of possible midamble shifts
defines the maximum number of possible users in a single slot.
Each user is thus identified by a particular time slot and a particular code on a particular carrier frequency.
Midamble assignment
A midamble is assigned to each code channel by the transmission side. Different methods of assigning midambles to code channels are available.
●
Default midamble assignment
Specific midambles are assigned to each channelization code according to a standard-specific rule
●
User-specific midamble assignment
Each code channel is assigned an individual midamble code; higher communication layers must determine which midamble belongs to which channelization code
●
Common midamble assignment
All code channels share a common midamble
39User Manual 1176.9029.02 ─ 04
Page 40

R&S®FPS-K76/K77
The midamble to be inserted between the data fields in a slot is generated by superimposing the individual midambles of the codes.
The TD-SCDMA specifications require that the power of the midamble and the power
of the data fields for a single slot must be identical. When using the default midamble
assignment, this means that each individual midamble is transmitted with the same
power as its assigned channelization code. For common midamble assignment, this
means the (single) midamble is transmitted with the same power as the data fields. For
user-specific assignment, the individual midambles are not known at this stage.
The parameters ΔMid1/2 in the Channel Table results show the power offset of the
midamble to the data fields 1 or 2 for each channel (see Table 3-2).
Measurement Basics
CDA Measurements in MSRA Operating Mode
4.5 CDA Measurements in MSRA Operating Mode
The TD-SCDMA BTS application can also be used to analyze data in MSRA operating
mode.
In MSRA operating mode, only the MSRA Master actually captures data; the MSRA
applications receive an extract of the captured data for analysis, referred to as the
application data. For the TD-SCDMA BTS application in MSRA operating mode, the
application data range is defined by the same settings used to define the signal capture in Signal and Spectrum Analyzer mode. In addition, a capture offset can be
defined, i.e. an offset from the start of the captured data to the start of the analysis
interval for the TD-SCDMA BTS measurement.
Data coverage for each active application
Generally, if a signal contains multiple data channels for multiple standards, separate
applications are used to analyze each data channel. Thus, it is of interest to know
which application is analyzing which data channel. The MSRA Master display indicates
the data covered by each application, restricted to the channel bandwidth used by the
corresponding standard (for TD-SCDMA: 1.6 MHz), by vertical blue lines labeled with
the application name.
Analysis interval
However, the individual result displays of the application need not analyze the complete data range. The data range that is actually analyzed by the individual result display is referred to as the analysis interval.
In the TD-SCDMA BTS application, the analysis interval is determined automatically. It
depends on the selected channel/ slot / set to analyze, which is defined for the evaluation range, and on the result display. The analysis interval cannot be edited directly in
the TD-SCDMA BTS application, but is changed automatically when you change the
evaluation range.
40User Manual 1176.9029.02 ─ 04
Page 41

R&S®FPS-K76/K77
Analysis line
A frequent question when analyzing multi-standard signals is how each data channel is
correlated (in time) to others. Thus, an analysis line has been introduced. The analysis
line is a common time marker for all MSRA slave applications. It can be positioned in
any MSRA slave application or the MSRA Master and is then adjusted in all other slave
applications. Thus, you can easily analyze the results at a specific time in the measurement in all slave applications and determine correlations.
If the marked point in time is contained in the analysis interval of the slave application,
the line is indicated in all time-based result displays, such as time, symbol, slot or bit
diagrams. By default, the analysis line is displayed, however, it can be hidden from
view manually. In all result displays, the "AL" label in the window title bar indicates
whether the analysis line lies within the analysis interval or not:
●
●
●
Measurement Basics
CDA Measurements in MSRA Operating Mode
orange "AL": the line lies within the interval
white "AL": the line lies within the interval, but is not displayed (hidden)
no "AL": the line lies outside the interval
For details on the MSRA operating mode, see the R&S FPS MSRA User Manual.
41User Manual 1176.9029.02 ─ 04
Page 42

R&S®FPS-K76/K77
5 I/Q Data Import and Export
Baseband signals mostly occur as so-called complex baseband signals, i.e. a signal
representation that consists of two channels; the in phase (I) and the quadrature (Q)
channel. Such signals are referred to as I/Q signals. The complete modulation information and even distortion that originates from the RF, IF or baseband domains can be
analyzed in the I/Q baseband.
Importing and exporting I/Q signals is useful for various applications:
●
●
As opposed to storing trace data, which may be averaged or restricted to peak values,
I/Q data is stored as it was captured, without further processing. The data is stored as
complex values in 32-bit floating-point format. Multi-channel data is not supported. The
I/Q data is stored in a format with the file extension .iq.tar.
I/Q Data Import and Export
Import/Export Functions
Generating and saving I/Q signals in an RF or baseband signal generator or in
external software tools to analyze them with the R&S FPS later
Capturing and saving I/Q signals with an RF or baseband signal analyzer to analyze them with the R&S FPS or an external software tool later
For a detailed description see the R&S FPS I/Q Analyzer and I/Q Input User Manual.
An application note on converting Rohde & Schwarz I/Q data files is available from the
Rohde & Schwarz website:
1EF85: Converting R&S I/Q data files
Export only in MSRA mode
In MSRA mode, I/Q data can only be exported to other applications; I/Q data cannot be
imported to the MSRA Master or any MSRA applications.
● Import/Export Functions..........................................................................................42
5.1 Import/Export Functions
Access: "Save" / "Open" icon in the toolbar > "Import" / "Export"
The R&S FPS provides various evaluation methods for the results of the performed
measurements. However, you may want to evaluate the data with further, external
applications. In this case, you can export the measurement data to a standard format
file (ASCII or XML). Some of the data stored in these formats can also be re-imported
to the R&S FPS for further evaluation later, for example in other applications.
The following data types can be exported (depending on the application):
●
Trace data
●
Table results, such as result summaries, marker peak lists etc.
42User Manual 1176.9029.02 ─ 04
Page 43

R&S®FPS-K76/K77
I/Q data can only be imported and exported in applications that process I/Q data, such
as the I/Q Analyzer or optional applications.
See the corresponding user manuals for those applications for details.
These functions are only available if no measurement is running.
In particular, if Continuous Sweep / Run Cont is active, the import/export functions are
not available.
Import ...........................................................................................................................43
Export ...........................................................................................................................43
Import
Access: "Save/Recall" > Import
Provides functions to import data.
Importing I/Q data is not possible in MSRA operating mode.
I/Q Data Import and Export
Import/Export Functions
└ I/Q Import .......................................................................................................43
└ I/Q Export .......................................................................................................43
I/Q Import ← Import
Opens a file selection dialog box to select an import file that contains I/Q data. This
function is only available in single sweep mode and only in applications that process
I/Q data, such as the I/Q Analyzer or optional applications.
Note that the I/Q data must have a specific format as described in the R&S FPS I/Q
Analyzer and I/Q Input User Manual.
Input from I/Q data files is imported as it was stored, including any correction factors,
for example from transducers or SnP files. Any currently configured correction factors
at the time of import, however, are not applied.
Remote command:
MMEMory:LOAD:IQ:STATe on page 183
Export
Access: "Save/Recall" > Export
Opens a submenu to configure data export.
I/Q Export ← Export
Opens a file selection dialog box to define an export file name to which the I/Q data is
stored. This function is only available in single sweep mode.
Note: MSRA operating mode. Importing I/Q data is not possible in MSRA operating
mode.
Note: Storing large amounts of I/Q data (several Gigabytes) can exceed the available
(internal) storage space on the R&S FPS. In this case, it can be necessary to use an
external storage medium.
Note: Secure user mode.
43User Manual 1176.9029.02 ─ 04
Page 44

R&S®FPS-K76/K77
In secure user mode, settings that are stored on the instrument are stored to volatile
memory, which is restricted to 256 MB. Thus, a "memory limit reached" error can occur
although the hard disk indicates that storage space is still available.
To store data permanently, select an external storage location such as a USB memory
device.
For details, see "Protecting Data Using the Secure User Mode" in the "Data Management" section of the R&S FPS User Manual.
Remote command:
MMEMory:STORe<n>:IQ:STATe on page 184
MMEMory:STORe<n>:IQ:COMMent on page 183
I/Q Data Import and Export
Import/Export Functions
44User Manual 1176.9029.02 ─ 04
Page 45

R&S®FPS-K76/K77
6 Configuration
The TD-SCDMA applications provide several different measurements for signals
according to the TD-SCDMA application. The main and default measurement is Code
Domain Analysis. In addition to the code domain power measurements specified by the
TD-SCDMA standard, the TD-SCDMA options offer measurements with predefined
settings in the frequency and time domain, e.g. channel power or power vs time measurements.
Only one measurement type can be configured per channel; however, several channels with TD-SCDMA applications can be configured in parallel on the R&S FPS. Thus,
you can configure one channel for a Code Domain Analysis, for example, and another
for a Time Alignment Error or Power measurement for the same input signal. Then you
can use the Sequencer to perform all measurements consecutively and switch through
the results easily, or monitor all results at the same time in the "MultiView" tab.
For details on the Sequencer function see the R&S FPS User Manual.
Selecting the measurement type
Configuration
Result Display Configuration
When you activate an TD-SCDMA application, Code Domain Analysis of the input signal is started automatically. However, the TD-SCDMA applications also provide other
measurement types.
► To select a different measurement type, do one of the following:
● Select the "Overview" softkey. In the "Overview", select the "Select Measurement" button. Select the required measurement.
● Press the MEAS key. In the "Select Measurement" dialog box, select the
required measurement.
● Result Display Configuration...................................................................................45
● Code Domain Analysis............................................................................................46
● Frequency and Time Domain Measurements.........................................................75
6.1 Result Display Configuration
The captured signal can be displayed using various evaluation methods. All evaluation
methods available for TD-SCDMA applications are displayed in the evaluation bar in
SmartGrid mode when you do one of the following:
●
Select the
●
Select the "Display" button in the "Overview".
●
Press the MEAS key.
●
Select the "Display Config" softkey in any TD-SCDMA menu.
"SmartGrid" icon from the toolbar.
Up to 16 evaluation methods can be displayed simultaneously in separate windows.
The TD-SCDMA evaluation methods are described in Chapter 3.1.2, "Evaluation Meth-
ods for Code Domain Analysis", on page 11.
45User Manual 1176.9029.02 ─ 04
Page 46

R&S®FPS-K76/K77
To close the SmartGrid mode and restore the previous softkey menu select the
"Close" icon in the righthand corner of the toolbar, or press any key.
For details on working with the SmartGrid see the R&S FPS Getting Started manual.
Configuration
Code Domain Analysis
6.2 Code Domain Analysis
Access: MODE > "TD-SCDMA BTS"/"TD-SCDMA UE"
TD-SCDMA measurements require special applications on the R&S FPS.
When you activate a TD-SCDMA application the first time, a set of parameters is
passed on from the currently active application:
●
Center frequency and frequency offset
●
Reference level and reference level offset
●
Attenuation
After initial setup, the parameters for the measurement channel are stored upon exiting
and restored upon re-entering the channel. Thus, you can switch between applications
quickly and easily.
When you activate a TD-SCDMA application, Code Domain Analysis of the input signal
is started automatically with the default configuration. The "Code Domain Analyzer"
menu is displayed and provides access to the most important configuration functions.
The "Span", "Bandwidth", "Lines", and "Marker Functions" menus are not available for
Code Domain Analysis in TD-SCDMA applications.
Code Domain Analysis can be configured easily in the "Overview" dialog box, which is
displayed when you select the "Overview" softkey from any menu.
Importing and Exporting I/Q Data
Access: , "Save/Recall" menu > "Import I/Q"/ "Export I/Q"
The TD-SCDMA applications can not only measure the TD-SCDMA I/Q data to be
evaluated. They can also import I/Q data, provided it has the correct format. Furthermore, the evaluated I/Q data from the TD-SCDMA applications can be exported for further analysis in external applications.
For details on importing and exporting I/Q data, see the R&S FPS User Manual.
6.2.1 Configuration Overview.................................................................................................47
6.2.2 Data Input and Output Settings.....................................................................................49
6.2.2.1 Input Source Settings....................................................................................................49
46User Manual 1176.9029.02 ─ 04
Page 47

R&S®FPS-K76/K77
6.2.2.2 Output Settings............................................................................................................. 51
6.2.3 Frontend Settings..........................................................................................................52
6.2.3.1 Amplitude Settings........................................................................................................ 52
6.2.3.2 Y-Axis Scaling...............................................................................................................55
6.2.3.3 Frequency Settings....................................................................................................... 55
6.2.4 Trigger Settings.............................................................................................................57
6.2.5 Signal Capture (Data Acquisition).................................................................................62
6.2.6 Application Data (MSRA) ............................................................................................. 64
6.2.7 Synchronization.............................................................................................................64
6.2.8 Channel Detection.........................................................................................................66
6.2.8.1 General Channel Detection Settings.............................................................................66
6.2.8.2 Channel Table Management.........................................................................................68
6.2.8.3 Channel Table Settings and Functions......................................................................... 69
Configuration
Code Domain Analysis
6.2.8.4 Channel Details.............................................................................................................71
6.2.9 Sweep Settings............................................................................................................. 72
6.2.10 Automatic Settings........................................................................................................ 73
6.2.1 Configuration Overview
Access: all menus
Throughout the measurement channel configuration, an overview of the most important
currently defined settings is provided in the "Overview".
47User Manual 1176.9029.02 ─ 04
Page 48

R&S®FPS-K76/K77
In addition to the main measurement settings, the "Overview" provides quick access to
the main settings dialog boxes. Thus, you can easily configure an entire measurement
channel from input over processing to evaluation by stepping through the dialog boxes
as indicated in the "Overview".
The available settings and functions in the "Overview" vary depending on the currently
selected measurement. For frequency and time domain measurements, see Chap-
ter 6.3, "Frequency and Time Domain Measurements", on page 75.
For Code Domain Analysis measurements, the "Overview" provides quick access to
the following configuration dialog boxes (listed in the recommended order of processing):
The "Signal Description" button indicated in the "Overview" is not required for TDSCDMA measurements.
1. "Select Measurement"
Configuration
Code Domain Analysis
See Chapter 3, "Measurements and Result Display", on page 9
2. "Input/ Frontend"
See Chapter 6.2.2, "Data Input and Output Settings", on page 49
3. (Optionally:) "Trigger"
See Chapter 6.2.4, "Trigger Settings", on page 57
4. "Signal Capture"
See Chapter 6.2.5, "Signal Capture (Data Acquisition)", on page 62
5. "Synchronization"
See Chapter 6.2.7, "Synchronization", on page 64
6. "Channel Detection"
See Chapter 6.2.8, "Channel Detection", on page 66
7. "Analysis"
See Chapter 7, "Analysis", on page 85
8. "Display Configuration"
See Chapter 6.1, "Result Display Configuration", on page 45
To configure settings
► Select any button in the "Overview" to open the corresponding dialog box.
Select a setting in the channel bar (at the top of the measurement channel tab) to
change a specific setting.
Preset Channel
Select the "Preset Channel" button in the lower left-hand corner of the "Overview" to
restore all measurement settings in the current channel to their default values.
48User Manual 1176.9029.02 ─ 04
Page 49

R&S®FPS-K76/K77
Do not confuse the "Preset Channel" button with the PRESET key, which restores the
entire instrument to its default values and thus closes all channels on the R&S FPS
(except for the default channel)!
Remote command:
SYSTem:PRESet:CHANnel[:EXEC] on page 110
Select Measurement
Selects a different measurement to be performed.
See Chapter 3, "Measurements and Result Display", on page 9.
Specifics for
The channel may contain several windows for different results. Thus, the settings indicated in the "Overview" and configured in the dialog boxes vary depending on the
selected window.
Select an active window from the "Specifics for" selection list that is displayed in the
"Overview" and in all window-specific configuration dialog boxes.
The "Overview" and dialog boxes are updated to indicate the settings for the selected
window.
Configuration
Code Domain Analysis
6.2.2 Data Input and Output Settings
Access: INPUT / OUTPUT
The R&S FPS can analyze signals from different input sources and provide various
types of output (such as noise or trigger signals).
● Input Source Settings..............................................................................................49
● Output Settings....................................................................................................... 51
6.2.2.1 Input Source Settings
Access: "Overview" > "Input/Frontend" > "Input Source"
The input source determines which data the R&S FPS will analyze.
The default input source for the R&S FPS is "Radio Frequency" , i.e. the signal at the
RF INPUT connector of the R&S FPS. If no additional options are installed, this is the
only available input source.
● Radio Frequency Input............................................................................................49
Radio Frequency Input
Access: "Overview" > "Input/Frontend" > "Input Source" > "Radio Frequency"
49User Manual 1176.9029.02 ─ 04
Page 50

R&S®FPS-K76/K77
Radio Frequency State ................................................................................................ 50
Input Coupling ..............................................................................................................50
Impedance ................................................................................................................... 50
YIG-Preselector ............................................................................................................50
Radio Frequency State
Activates input from the RF INPUT connector.
Remote command:
INPut:SELect on page 113
Configuration
Code Domain Analysis
Input Coupling
The RF input of the R&S FPS can be coupled by alternating current (AC) or direct current (DC).
AC coupling blocks any DC voltage from the input signal. This is the default setting to
prevent damage to the instrument. Very low frequencies in the input signal may be distorted.
However, some specifications require DC coupling. In this case, you must protect the
instrument from damaging DC input voltages manually. For details, refer to the data
sheet.
Remote command:
INPut:COUPling on page 112
Impedance
For some measurements, the reference impedance for the measured levels of the
R&S FPS can be set to 50 Ω or 75 Ω.
Select 75 Ω if the 50 Ω input impedance is transformed to a higher impedance using a
75 Ω adapter of the RAZ type. (That corresponds to 25Ω in series to the input impedance of the instrument.) The correction value in this case is 1.76 dB = 10 log (75Ω/
50Ω).
This value also affects the unit conversion (see " Reference Level " on page 52).
Remote command:
INPut:IMPedance on page 113
YIG-Preselector
Activates or deactivates the YIG-preselector, if available on the R&S FPS.
50User Manual 1176.9029.02 ─ 04
Page 51

R&S®FPS-K76/K77
An internal YIG-preselector at the input of the R&S FPS ensures that image frequencies are rejected. However, this is only possible for a restricted bandwidth. To use the
maximum bandwidth for signal analysis you can deactivate the YIG-preselector at the
input of the R&S FPS, which can lead to image-frequency display.
Note that the YIG-preselector is active only on frequencies greater than 8 GHz. Therefore, switching the YIG-preselector on or off has no effect if the frequency is below that
value.
Remote command:
INPut:FILTer:YIG[:STATe] on page 112
Configuration
Code Domain Analysis
6.2.2.2 Output Settings
Access: INPUT/OUTPUT > "Output"
The R&S FPS can provide output to special connectors for other devices.
For details on connectors, refer to the R&S FPS Getting Started manual, "Front / Rear
Panel View" chapters.
How to provide trigger signals as output is described in detail in the R&S FPS User
Manual.
Noise Source Control....................................................................................................51
Noise Source Control
The R&S FPS provides a connector (NOISE SOURCE CONTROL) with a 28 V voltage
supply for an external noise source. By switching the supply voltage for an external
noise source on or off in the firmware, you can activate or deactivate the device as
required.
External noise sources are useful when you are measuring power levels that fall below
the noise floor of the R&S FPS itself, for example when measuring the noise level of an
amplifier.
51User Manual 1176.9029.02 ─ 04
Page 52

R&S®FPS-K76/K77
In this case, you can first connect an external noise source (whose noise power level is
known in advance) to the R&S FPS and measure the total noise power. From this
value you can determine the noise power of the R&S FPS. Then when you measure
the power level of the actual DUT, you can deduct the known noise level from the total
power to obtain the power level of the DUT.
Remote command:
DIAGnostic:SERVice:NSOurce on page 113
Configuration
Code Domain Analysis
6.2.3 Frontend Settings
Access: "Overview" > "Input / Frontend"
Frequency, amplitude and y-axis scaling settings represent the "frontend" of the measurement setup.
● Amplitude Settings.................................................................................................. 52
● Y-Axis Scaling.........................................................................................................55
● Frequency Settings................................................................................................. 55
6.2.3.1 Amplitude Settings
Access: "Overview" > "Input/Frontend" > "Amplitude"
Amplitude settings determine how the R&S FPS must process or display the expected
input power levels.
Reference Level ...........................................................................................................52
└ Shifting the Display ( Offset ).......................................................................... 53
└ Unit .................................................................................................................53
└ Setting the Reference Level Automatically ( Auto Level )...............................53
RF Attenuation ............................................................................................................. 53
└ Attenuation Mode / Value ...............................................................................53
Using Electronic Attenuation ........................................................................................54
Input Settings ............................................................................................................... 54
└ Preamplifier (option B22/B24).........................................................................54
Reference Level
Defines the expected maximum reference level. Signal levels above this value may not
be measured correctly. This is indicated by an "IF Overload" status display.
The reference level can also be used to scale power diagrams; the reference level is
then used as the maximum on the y-axis.
Since the hardware of the R&S FPS is adapted according to this value, it is recommended that you set the reference level close above the expected maximum signal level.
Thus you ensure an optimum measurement (no compression, good signal-to-noise
ratio).
Remote command:
DISPlay[:WINDow<n>]:TRACe<t>:Y[:SCALe]:RLEVel on page 117
52User Manual 1176.9029.02 ─ 04
Page 53

R&S®FPS-K76/K77
Shifting the Display ( Offset ) ← Reference Level
Defines an arithmetic level offset. This offset is added to the measured level. In some
result displays, the scaling of the y-axis is changed accordingly.
Define an offset if the signal is attenuated or amplified before it is fed into the R&S FPS
so the application shows correct power results. All displayed power level results are
shifted by this value.
The setting range is ±200 dB in 0.01 dB steps.
Note, however, that the internal reference level (used to adjust the hardware settings to
the expected signal) ignores any "Reference Level Offset" . Thus, it is important to
keep in mind the actual power level the R&S FPS must handle. Do not rely on the displayed reference level (internal reference level = displayed reference level - offset).
Remote command:
DISPlay[:WINDow<n>]:TRACe<t>:Y[:SCALe]:RLEVel:OFFSet on page 118
Unit ← Reference Level
For CDA measurements, do not change the unit, as this would lead to useless results.
Configuration
Code Domain Analysis
Setting the Reference Level Automatically ( Auto Level ) ← Reference Level
Automatically determines a reference level which ensures that no overload occurs at
the R&S FPS for the current input data. At the same time, the internal attenuators are
adjusted so the signal-to-noise ratio is optimized, while signal compression and clipping are minimized.
To determine the required reference level, a level measurement is performed on the
R&S FPS.
If necessary, you can optimize the reference level further. Decrease the attenuation
level manually to the lowest possible value before an overload occurs, then decrease
the reference level in the same way.
You can change the measurement time for the level measurement if necessary (see "
Changing the Automatic Measurement Time ( Meastime Manual )" on page 75).
Remote command:
[SENSe:]ADJust:LEVel on page 138
RF Attenuation
Defines the attenuation applied to the RF input of the R&S FPS.
Attenuation Mode / Value ← RF Attenuation
The RF attenuation can be set automatically as a function of the selected reference
level (Auto mode). This ensures that no overload occurs at the RF INPUT connector
for the current reference level. It is the default setting.
By default and when no (optional) electronic attenuation is available, mechanical
attenuation is applied.
In "Manual" mode, you can set the RF attenuation in 1 dB steps (down to 0 dB). Other
entries are rounded to the next integer value. The range is specified in the data sheet.
If the defined reference level cannot be set for the defined RF attenuation, the reference level is adjusted accordingly and the warning "limit reached" is displayed.
53User Manual 1176.9029.02 ─ 04
Page 54

R&S®FPS-K76/K77
NOTICE! Risk of hardware damage due to high power levels. When decreasing the
attenuation manually, ensure that the power level does not exceed the maximum level
allowed at the RF input, as an overload may lead to hardware damage.
Remote command:
INPut:ATTenuation on page 119
INPut:ATTenuation:AUTO on page 120
Using Electronic Attenuation
If the (optional) Electronic Attenuation hardware is installed on the R&S FPS, you can
also activate an electronic attenuator.
In "Auto" mode, the settings are defined automatically; in "Manual" mode, you can
define the mechanical and electronic attenuation separately.
Note: Electronic attenuation is not available for stop frequencies (or center frequencies
in zero span) above 7 GHz.
In "Auto" mode, RF attenuation is provided by the electronic attenuator as much as
possible to reduce the amount of mechanical switching required. Mechanical attenuation may provide a better signal-to-noise ratio, however.
When you switch off electronic attenuation, the RF attenuation is automatically set to
the same mode (auto/manual) as the electronic attenuation was set to. Thus, the RF
attenuation can be set to automatic mode, and the full attenuation is provided by the
mechanical attenuator, if possible.
The electronic attenuation can be varied in 1 dB steps. If the electronic attenuation is
on, the mechanical attenuation can be varied in 5 dB steps. Other entries are rounded
to the next lower integer value.
If the defined reference level cannot be set for the given attenuation, the reference
level is adjusted accordingly and the warning "limit reached" is displayed in the status
bar.
Remote command:
INPut:EATT:STATe on page 121
INPut:EATT:AUTO on page 120
INPut:EATT on page 120
Configuration
Code Domain Analysis
Input Settings
Some input settings affect the measured amplitude of the signal, as well.
The parameters "Input Coupling" and "Impedance" are identical to those in the "Input"
settings.
Preamplifier (option B22/B24) ← Input Settings
Switches the preamplifier on and off. If activated, the input signal is amplified by 20 dB.
If option R&S FPS-B22 is installed, the preamplifier is only active below 7 GHz.
If option R&S FPS-B24 is installed, the preamplifier is active for all frequencies.
Remote command:
INPut:GAIN:STATe on page 119
54User Manual 1176.9029.02 ─ 04
Page 55

R&S®FPS-K76/K77
Configuration
Code Domain Analysis
6.2.3.2 Y-Axis Scaling
Access: "Overview" > "Input/Frontend" > "Scale"
Or: AMPT > "Scale Config"
The vertical axis scaling is configurable. In Code Domain Analysis, the y-axis usually
displays the measured power levels.
Y-Maximum, Y-Minimum...............................................................................................55
Auto Scale Once .......................................................................................................... 55
Restore Scale (Window)............................................................................................... 55
Y-Maximum, Y-Minimum
Defines the amplitude range to be displayed on the y-axis of the evaluation diagrams.
Remote command:
DISPlay[:WINDow<n>]:TRACe<t>:Y[:SCALe]:MAXimum on page 116
DISPlay[:WINDow<n>]:TRACe<t>:Y[:SCALe]:MINimum on page 117
Auto Scale Once
Automatically determines the optimal range and reference level position to be displayed for the current measurement settings.
The display is only set once; it is not adapted further if the measurement settings are
changed again.
Remote command:
DISPlay[:WINDow<n>]:TRACe<t>:Y[:SCALe]:AUTO ONCE on page 116
Restore Scale (Window)
Restores the default scale settings in the currently selected window.
6.2.3.3 Frequency Settings
Access: "Overview" > "Input/Frontend" > "Frequency"
55User Manual 1176.9029.02 ─ 04
Page 56

R&S®FPS-K76/K77
Center Frequency ........................................................................................................ 56
Center Frequency Stepsize ..........................................................................................56
Frequency Offset ..........................................................................................................56
Configuration
Code Domain Analysis
Center Frequency
Defines the center frequency of the signal in Hertz.
The allowed range of values for the center frequency depends on the frequency span.
span > 0: span
f
and span
max
/2 ≤ f
min
depend on the instrument and are specified in the data sheet.
min
center
≤ f
max
– span
min
/2
Remote command:
[SENSe:]FREQuency:CENTer on page 114
Center Frequency Stepsize
Defines the step size by which the center frequency is increased or decreased using
the arrow keys.
When you use the rotary knob the center frequency changes in steps of only 1/10 of
the span.
The step size can be coupled to another value or it can be manually set to a fixed
value.
This setting is available for frequency and time domain measurements.
"= Center"
Sets the step size to the value of the center frequency. The used
value is indicated in the "Value" field.
"Manual"
Defines a fixed step size for the center frequency. Enter the step size
in the "Value" field.
Remote command:
[SENSe:]FREQuency:CENTer:STEP on page 115
Frequency Offset
Shifts the displayed frequency range along the x-axis by the defined offset.
56User Manual 1176.9029.02 ─ 04
Page 57

R&S®FPS-K76/K77
This parameter has no effect on the instrument's hardware, or on the captured data or
on data processing. It is simply a manipulation of the final results in which absolute frequency values are displayed. Thus, the x-axis of a spectrum display is shifted by a
constant offset if it shows absolute frequencies, but not if it shows frequencies relative
to the signal's center frequency.
A frequency offset can be used to correct the display of a signal that is slightly distorted
by the measurement setup, for example.
The allowed values range from -100 GHz to 100 GHz. The default setting is 0 Hz.
Note: In MSRA mode, this function is only available for the MSRA Master.
Remote command:
[SENSe:]FREQuency:OFFSet on page 115
Configuration
Code Domain Analysis
6.2.4 Trigger Settings
Access: "Overview" > "Trigger"
Trigger settings determine when the input signal is measured.
External triggers from one of the TRIGGER INPUT/OUTPUT connectors on the
R&S FPS are configured in a separate tab of the dialog box.
57User Manual 1176.9029.02 ─ 04
Page 58

R&S®FPS-K76/K77
For step-by-step instructions on configuring triggered measurements, see the main
R&S FPS User Manual.
Trigger Source.............................................................................................................. 58
Trigger 2........................................................................................................................60
Configuration
Code Domain Analysis
└ Trigger Source................................................................................................ 58
└ Free Run ..............................................................................................58
└ External Trigger 1/2.............................................................................. 58
└ IF Power .............................................................................................. 59
└ Trigger Level ..................................................................................................59
└ Trigger Offset .................................................................................................59
└ Slope ..............................................................................................................59
└ Hysteresis ...................................................................................................... 60
└ Trigger Holdoff ............................................................................................... 60
└ Capture Offset ................................................................................................60
└ Output Type ................................................................................................... 61
└ Level .................................................................................................... 61
└ Pulse Length ........................................................................................61
└ Send Trigger ........................................................................................62
Trigger Source
The trigger settings define the beginning of a measurement.
Trigger Source ← Trigger Source
Defines the trigger source. If a trigger source other than "Free Run" is set, "TRG" is
displayed in the channel bar and the trigger source is indicated.
Remote command:
TRIGger[:SEQuence]:SOURce on page 123
Free Run ← Trigger Source ← Trigger Source
No trigger source is considered. Data acquisition is started manually or automatically
and continues until stopped explicitly.
Remote command:
TRIG:SOUR IMM, see TRIGger[:SEQuence]:SOURce on page 123
External Trigger 1/2 ← Trigger Source ← Trigger Source
Data acquisition starts when the TTL signal fed into the specified input connector
meets or exceeds the specified trigger level.
(See " Trigger Level " on page 59).
Note: The "External Trigger 1" softkey automatically selects the trigger signal from the
TRG IN connector.
For details, see the "Instrument Tour" chapter in the R&S FPS Getting Started manual.
"External Trigger 1"
Trigger signal from the TRG IN connector.
58User Manual 1176.9029.02 ─ 04
Page 59

R&S®FPS-K76/K77
"External Trigger 2"
Remote command:
TRIG:SOUR EXT, TRIG:SOUR EXT2
See TRIGger[:SEQuence]:SOURce on page 123
IF Power ← Trigger Source ← Trigger Source
The R&S FPS starts capturing data as soon as the trigger level is exceeded around the
third intermediate frequency.
For frequency sweeps, the third IF represents the start frequency. The trigger bandwidth at the third IF depends on the RBW and sweep type.
For measurements on a fixed frequency (e.g. zero span or I/Q measurements), the
third IF represents the center frequency.
This trigger source is only available for RF input.
This trigger source is available for frequency and time domain measurements only.
The available trigger levels depend on the RF attenuation and preamplification. A refer-
ence level offset, if defined, is also considered.
For details on available trigger levels and trigger bandwidths, see the data sheet.
Remote command:
TRIG:SOUR IFP, see TRIGger[:SEQuence]:SOURce on page 123
Configuration
Code Domain Analysis
Trigger signal from the TRG AUX connector.
Note: Connector must be configured for "Input" in the "Output" configuration
(See the R&S FPS User Manual).
Trigger Level ← Trigger Source
Defines the trigger level for the specified trigger source.
For details on supported trigger levels, see the data sheet.
Remote command:
TRIGger[:SEQuence]:LEVel[:EXTernal<port>] on page 122
Trigger Offset ← Trigger Source
Defines the time offset between the trigger event and the start of the measurement.
Offset > 0: Start of the measurement is delayed
Offset < 0: Measurement starts earlier (pretrigger)
Remote command:
TRIGger[:SEQuence]:HOLDoff[:TIME] on page 121
Slope ← Trigger Source
For all trigger sources except time, you can define whether triggering occurs when the
signal rises to the trigger level or falls down to it.
Remote command:
TRIGger[:SEQuence]:SLOPe on page 123
59User Manual 1176.9029.02 ─ 04
Page 60

R&S®FPS-K76/K77
Hysteresis ← Trigger Source
Defines the distance in dB to the trigger level that the trigger source must exceed
before a trigger event occurs. Setting a hysteresis avoids unwanted trigger events
caused by noise oscillation around the trigger level.
This setting is only available for "IF Power" trigger sources. The range of the value is
between 3 dB and 50 dB with a step width of 1 dB.
This setting is available for frequency and time domain measurements only.
Remote command:
TRIGger[:SEQuence]:IFPower:HYSTeresis on page 122
Trigger Holdoff ← Trigger Source
Defines the minimum time (in seconds) that must pass between two trigger events.
Trigger events that occur during the holdoff time are ignored.
This softkey is available for frequency and time domain measurements only.
Remote command:
TRIGger[:SEQuence]:IFPower:HOLDoff on page 122
Configuration
Code Domain Analysis
Capture Offset ← Trigger Source
This setting is only available for slave applications in MSRA operating mode. It has a
similar effect as the trigger offset in other measurements: it defines the time offset
between the capture buffer start and the start of the extracted slave application data.
In MSRA mode, the offset must be a positive value, as the capture buffer starts at the
trigger time = 0.
For details on the MSRA operating mode, see the R&S FPS MSRA User Manual.
Remote command:
[SENSe:]MSRA:CAPTure:OFFSet on page 187
Trigger 2
Defines the usage of the variable TRIGGER AUX connector on the rear panel.
(Trigger 1 is INPUT only.)
60User Manual 1176.9029.02 ─ 04
Page 61

R&S®FPS-K76/K77
Note: Providing trigger signals as output is described in detail in the R&S FPS User
Manual.
"Input"
"Output"
Remote command:
OUTPut:TRIGger<port>:DIRection on page 124
Output Type ← Trigger 2
Type of signal to be sent to the output
"Device Trig-
gered"
"Trigger
Armed"
"User Defined"
Remote command:
OUTPut:TRIGger<port>:OTYPe on page 125
Configuration
Code Domain Analysis
The signal at the connector is used as an external trigger source by
the R&S FPS. Trigger input parameters are available in the "Trigger"
dialog box.
The R&S FPS sends a trigger signal to the output connector to be
used by connected devices.
Further trigger parameters are available for the connector.
(Default) Sends a trigger when the R&S FPS triggers.
Sends a (high level) trigger when the R&S FPS is in "Ready for trigger" state.
This state is indicated by a status bit in the STATus:OPERation register (bit 5).
Sends a trigger when you select the "Send Trigger" button.
In this case, further parameters are available for the output signal.
Level ← Output Type ← Trigger 2
Defines whether a high (1) or low (0) constant signal is sent to the trigger output connector.
The trigger pulse level is always opposite to the constant signal level defined here. For
example, for "Level = High", a constant high signal is output to the connector until you
select the Send Trigger function. Then, a low pulse is provided.
Remote command:
OUTPut:TRIGger<port>:LEVel on page 124
Pulse Length ← Output Type ← Trigger 2
Defines the duration of the pulse (pulse width) sent as a trigger to the output connector.
Remote command:
OUTPut:TRIGger<port>:PULSe:LENGth on page 125
61User Manual 1176.9029.02 ─ 04
Page 62

R&S®FPS-K76/K77
Send Trigger ← Output Type ← Trigger 2
Sends a user-defined trigger to the output connector immediately.
Note that the trigger pulse level is always opposite to the constant signal level defined
by the output Level setting. For example, for "Level" = "High", a constant high signal is
output to the connector until you select the "Send Trigger" function. Then, a low pulse
is sent.
Which pulse level will be sent is indicated by a graphic on the button.
Remote command:
OUTPut:TRIGger<port>:PULSe:IMMediate on page 125
Configuration
Code Domain Analysis
6.2.5 Signal Capture (Data Acquisition)
Access: "Overview" > "Signal Capture"
How much and how data is captured from the input signal are defined in the "Signal
Capture" settings.
MSRA operating mode
In MSRA operating mode, only the MSRA Master channel actually captures data from
the input signal. The data acquisition settings for the TD-SCDMA BTS application in
MSRA mode define the application data extract. See Chapter 6.2.6, "Application
Data (MSRA) ", on page 64.
For details on the MSRA operating mode, see the R&S FPS MSRA User Manual.
Sample Rate................................................................................................................. 63
Swap I/Q....................................................................................................................... 63
RRC Filter State............................................................................................................63
62User Manual 1176.9029.02 ─ 04
Page 63

R&S®FPS-K76/K77
Set Count...................................................................................................................... 63
Set to Analyze...............................................................................................................63
Number of Slots to Capture...........................................................................................63
Sample Rate
The sample rate is always 2 MHz (indicated for reference only).
Swap I/Q
Inverts the sign of the signal's Q-branch. The default setting is OFF.
Remote command:
[SENSe:]CDPower:QINVert on page 191
RRC Filter State
Selects if a root raised cosine (RRC) receiver filter is used or not. This feature is useful
if the RRC filter is implemented in the device under test (DUT).
"ON"
"OFF"
Remote command:
[SENSe:]CDPower:FILTer[:STATe] on page 126
Configuration
Code Domain Analysis
If an unfiltered signal is received (normal case), the RRC filter should
be used to get a correct signal demodulation. (Default settings)
If a filtered signal is received, the RRC filter should not be used to get
a correct signal demodulation. This is the case if the DUT filters the
signal.
Set Count
Defines the number of consecutive sets to be captured and stored in the instrument's
I/Q memory. One set consists of 63 slots. The R&S FPS can capture from 1 to 4500
sets.
Remote command:
[SENSe:]CDPower:SET:COUNt on page 127
Set to Analyze
Selects a specific set for further analysis. The value range depends on the Set Count
and is between 0 and [Set Count-1].
Remote command:
[SENSe:]CDPower:SET on page 139
Number of Slots to Capture
Defines the number of slots to capture.
Note: if the Set Count is larger than 1, the number of slots to capture is automatically
set to the maximum of 64.
Remote command:
[SENSe:]CDPower:IQLength on page 126
63User Manual 1176.9029.02 ─ 04
Page 64

R&S®FPS-K76/K77
Configuration
Code Domain Analysis
6.2.6 Application Data (MSRA)
For the TD-SCDMA BTS application in MSRA operating mode, the application data
range is defined by the same settings used to define the signal capturing in Signal and
Spectrum Analyzer mode (see Chapter 6.2.5, "Signal Capture (Data Acquisition)",
on page 62.
In addition, a capture offset can be defined, i.e. an offset from the start of the captured
data to the start of the analysis interval for the TD-SCDMA BTS measurement (see "
Capture Offset " on page 60).
The analysis interval cannot be edited manually. It is determined automatically
according to the selected channel, slot or set to analyze which is defined for the evaluation range, depending on the result display. Note that the set/slot/channel is analyzed
within the application data.
For details, see Chapter 4.5, "CDA Measurements in MSRA Operating Mode",
on page 40.
6.2.7 Synchronization
Access: "Overview" > "Synchronization"
The individual channels in the input signal need to be synchronized to detect timing offsets in the slot spacings. These settings are described here.
Scrambling Code...........................................................................................................64
SYNC-UL Code (UE only).............................................................................................65
MA Shift Cell / Number of Users................................................................................... 65
Time Reference (BTS mode)........................................................................................ 65
Time Reference (UE mode).......................................................................................... 65
Sync To.........................................................................................................................65
Rotate code channel to associated midamble.............................................................. 66
Scrambling Code
Sets the Scrambling Code of the base station. Possible values are between 0 and 127
and have to be entered as decimals.
Remote command:
[SENSe:]CDPower:SCODe on page 128
64User Manual 1176.9029.02 ─ 04
Page 65

R&S®FPS-K76/K77
SYNC-UL Code (UE only)
Defines the code used for synchronization on the UpPTS (see "Time Reference (UE
mode)" on page 65).
Remote command:
[SENSe:]CDPower:SULC on page 129
MA Shift Cell / Number of Users
Sets the maximum number of usable midamble shifts (= number of users) on the base
station. Possible values are in the range from 2 to 16 in steps of 2 midamble shifts.
If you use a predefined channel table, this value is replaced by that of the channel
table.
For details see Chapter 4.4, "Data Fields and Midambles", on page 39.
Remote command:
[SENSe:]CDPower:MSHift on page 128
Time Reference (BTS mode)
Defines which slot is used as a time reference for synchronization.
"DwPTS"
"Slot 0"
Remote command:
[SENSe:]CDPower:TREF on page 130
Configuration
Code Domain Analysis
Uses the Downlink Pilot Time Slot (DwPTS) as a time reference (see
also Chapter 4.2, "Frames, Subframes and Slots", on page 34)
Uses slot 0 as a time reference.
Time Reference (UE mode)
Defines which slot is used as a time reference for synchronization.
"UpPTS"
"Slot 1"
Remote command:
[SENSe:]CDPower:TREF on page 130
Sync To
Defines the phase reference. For a successful synchronization, the selected slot must
contain at least one data channel with sufficient power.
(Not available for Power vs Time measurements.)
"P-CCPCH"
Uses the Uplink Pilot Time Slot (UpPTS) as a time reference (see
also Chapter 4.2, "Frames, Subframes and Slots", on page 34)
Uses slot 1 as a time reference.
(BTS application only)
By default, the R&S FPS TD-SCDMA BTS application determines the
phase reference for all downlink data slots from the downlink pilot
channel (P-CCPCH) in slot 0. For some measurements like beamforming or repeater measurements, it might be necessary to apply different phase offsets to each time slot. In these timeslots, using the PCCPCH as phase reference leads to rotated constellation diagrams
and poor EVM results.
65User Manual 1176.9029.02 ─ 04
Page 66

R&S®FPS-K76/K77
Configuration
Code Domain Analysis
"Code Channel"
(UE application only)
The R&S FPS TD-SCDMA UE determines the phase reference from
the channel of the selected slot. This is useful when synchronization
fails in poor SNR environments.
For channel synchronization, at least one of the channels must be
QPSK or 8PSK modulated.
"Midamble"
The R&S FPS TD-SCDMA application determines the phase reference from the midamble of the selected slot. With this method, the
data slots can be phase rotated to each other and a degradation of
the EVM results can be avoided.
Remote command:
[SENSe:]CDPower:STSLot on page 128
UE application: [SENSe:]CDPower:STSLot:MODE on page 129
Rotate code channel to associated midamble
(Not available for Power vs Time measurements.)
By default, the R&S FPSTD-SCDMA application determines one phase reference for
all midambles and channels of a data slot. If this option is enabled, phase rotations
between the channels are allowed. Each channel gets its own phase reference from
the associated midamble according to section AA.2 of the standard document 3GPP
TS 25.221. If the associated midamble is missing, the common phase reference is
used for this channel.
Remote command:
[SENSe:]CDPower:STSLot:ROTate on page 129
6.2.8 Channel Detection
Access: "Overview" > "Channel Detection"
The channel detection settings determine which channels are found in the input signal.
● General Channel Detection Settings.......................................................................66
● Channel Table Management...................................................................................68
● Channel Table Settings and Functions................................................................... 69
● Channel Details.......................................................................................................71
6.2.8.1 General Channel Detection Settings
Access: "Overview" > "Channel Detection"
66User Manual 1176.9029.02 ─ 04
Page 67

R&S®FPS-K76/K77
Configuration
Code Domain Analysis
Figure 6-1: Channel detection configuration for TD-SCDMA BTS application
Inactive Channel Threshold ......................................................................................... 67
Max Modulation.............................................................................................................67
Using Predefined Channel Tables................................................................................ 68
Inactive Channel Threshold
Defines the minimum power that a single channel must have compared to the total signal to be recognized as an active channel.
Remote command:
[SENSe:]CDPower:ICTReshold on page 131
Max Modulation
Defines the highest modulation to be considered in the automatic channel search. In
low SNR environments, it may be necessary to limit the channel search to lower modulations than 64QAM. The following types are available:
67User Manual 1176.9029.02 ─ 04
Page 68

R&S®FPS-K76/K77
●
●
●
●
Remote command:
[SENSe:]CDPower:MMAX on page 131
Using Predefined Channel Tables
Defines the channel search mode.
"Predefined"
"Autosearch"
Remote command:
CONFigure:CDPower:CTABle[:STATe] on page 133
Configuration
Code Domain Analysis
QPSK
8PSK
16QAM
64QAM
Compares the input signal to the predefined channel table selected in
the "Predefined Tables" list.
Detects channels automatically based on the active predefined channel table.
6.2.8.2 Channel Table Management
Access: "Overview" > "Channel Detection" > "Predefined Channel Tables"
Predefined Tables.........................................................................................................68
Selecting a Table.......................................................................................................... 68
Creating a New Table................................................................................................... 68
Editing a Table.............................................................................................................. 69
Copying a Table............................................................................................................69
Deleting a Table............................................................................................................69
Predefined Tables
The list shows all available channel tables and marks the currently used table with a
checkmark. The currently focused table is highlighted blue.
Remote command:
BTS measurements:
CONFigure:CDPower:CTABle:CATalog? on page 131
Selecting a Table
Selects the channel table currently focused in the "Predefined Tables" list and compares it to the measured signal to detect channels.
Remote command:
CONFigure:CDPower:CTABle:SELect on page 133
Creating a New Table
Creates a new channel table. See Chapter 6.2.8.4, "Channel Details", on page 71.
For step-by-step instructions on creating a new channel table, see "To define or edit a
channel table" on page 97.
68User Manual 1176.9029.02 ─ 04
Page 69

R&S®FPS-K76/K77
Editing a Table
You can edit existing channel table definitions. The details of the selected channel are
displayed in the "Channel Table" dialog box. See Chapter 6.2.8.4, "Channel Details",
on page 71.
Copying a Table
Copies an existing channel table definition. The details of the selected channel are displayed in the "Channel Table" dialog box. See Chapter 6.2.8.4, "Channel Details",
on page 71.
Remote command:
CONFigure:CDPower:CTABle:COPY on page 132
Deleting a Table
Deletes the currently selected channel table after a message is confirmed.
Remote command:
CONFigure:CDPower:CTABle:DELete on page 132
Configuration
Code Domain Analysis
6.2.8.3 Channel Table Settings and Functions
Access: "Overview" > "Channel Detection" > "Predefined Channel Tables" > "New"/
"Copy"/ "Edit"
Some general settings and functions are available when configuring a predefined
channel table.
Name.............................................................................................................................69
Comment.......................................................................................................................69
MA Shifts Cell................................................................................................................70
Adding a Channel..........................................................................................................70
Deleting a Channel........................................................................................................70
Creating a New Channel Table from the Measured Signal (Measure Table)............... 70
Sorting the Table by Midamble..................................................................................... 70
Sorting the Table by Code............................................................................................ 70
Selecting the Slot to Evaluate....................................................................................... 70
Cancelling Configuration...............................................................................................70
Saving the Table........................................................................................................... 70
Name
Name of the channel table that is displayed in the "Predefined Channel Tables" list.
Remote command:
CONFigure:CDPower:CTABle:NAME on page 134
Comment
Optional description of the channel table.
Remote command:
CONFigure:CDPower:CTABle:COMMent on page 133
69User Manual 1176.9029.02 ─ 04
Page 70

R&S®FPS-K76/K77
MA Shifts Cell
Defines the maximum number of midamble shifts (i.e. the maximum number of users)
in a single cell for channel detection using the predefined table.
This value replaces the global value defined by "MA Shift Cell / Number of Users"
on page 65.
For details, see Chapter 4.4, "Data Fields and Midambles", on page 39.
Remote command:
CONFigure:CDPower:CTABle:MSHift on page 135
Adding a Channel
Inserts a new row in the channel table to define another channel.
Deleting a Channel
Deletes the currently selected channel from the table.
Creating a New Channel Table from the Measured Signal (Measure Table)
Creates a completely new channel table according to the current measurement data.
Remote command:
CONFigure:CDPower:MEASurement on page 110
Configuration
Code Domain Analysis
Sorting the Table by Midamble
(BTS application only):
Sorting by midamble means that after each midamble, the corresponding code is listed. The R&S FPS automatically distinguishes between common and default midamble
assignment. The assignment of code to midamble is specified in the TD-SCDMA standard.
If neither a common, nor a default midamble assignment is found, sorting is in code
order.
For details, see Chapter 4.4, "Data Fields and Midambles", on page 39.
Sorting the Table by Code
The midambles are sorted according to their midamble shifts. Active and inactive channels are projected to a spreading factor of 16 and sorted according to their code numbers.
Selecting the Slot to Evaluate
The application analyzes a single slot over the total signal to detect channels. Which
slot to analyze is defined here.
The values in the "Channel Detection" settings and in the "Evaluation Range" settings
are identical.
Cancelling Configuration
Closes the "Channel Table" dialog box without saving the changes.
Saving the Table
Saves the changes to the table and closes the "Channel Table" dialog box.
70User Manual 1176.9029.02 ─ 04
Page 71

R&S®FPS-K76/K77
Configuration
Code Domain Analysis
6.2.8.4 Channel Details
Access: "Overview" > "Channel Detection" > "Predefined Channel Tables" > "New"/
"Copy"/ "Edit" > "Add Channel"
To edit channel settings, select the corresponding cell in the table and enter the new
value. Gray cells are read-only and cannot be edited.
Channel Type................................................................................................................71
Channel Number (Ch. SF)............................................................................................ 71
Symbol Rate..................................................................................................................71
Modulation.....................................................................................................................72
Midamble Shift.............................................................................................................. 72
State..............................................................................................................................72
Domain Conflict.............................................................................................................72
Channel Type
Type of channel. For a list of possible channel types, see Chapter 4.3.1, "Special
Channels", on page 36.
Remote command:
CONFigure:CDPower:CTABle:DATA on page 134
Channel Number (Ch. SF)
Channel number, defined by code and spreading factor
Remote command:
CONFigure:CDPower:CTABle:DATA on page 134
Symbol Rate
Symbol rate at which the channel is transmitted.
71User Manual 1176.9029.02 ─ 04
Page 72

R&S®FPS-K76/K77
(Read-only; for reference purposes)
For an overview of possible symbol rates depending on the modulation type and other
parameters, see Table 4-8.
Modulation
The modulation type.
For an overview of possible modulation types and other parameters, see Table 4-8.
Midamble Shift
For channels, this is the shift of the associated midamble if a common or default midamble assignment is detected.
For details, see Chapter 4.4, "Data Fields and Midambles", on page 39.
Remote command:
CONFigure:CDPower:CTABle:MSHift on page 135
State
Indicates the channel state. Codes that are not assigned are marked as inactive channels (OFF).
Remote command:
CONFigure:CDPower:CTABle:DATA on page 134
Configuration
Code Domain Analysis
Domain Conflict
Indicates a code domain conflict between channel definitions (e.g. overlapping channels or conflicting channel codes).
6.2.9 Sweep Settings
Access: SWEEP
The sweep settings define how the data is measured.
Continuous Sweep / Run Cont .....................................................................................72
Single Sweep / Run Single ...........................................................................................73
Continue Single Sweep ................................................................................................73
Refresh (MSRA only).................................................................................................... 73
Sweep/Average Count ................................................................................................. 73
Continuous Sweep / Run Cont
After triggering, starts the measurement and repeats it continuously until stopped.
While the measurement is running, the "Continuous Sweep" softkey and the RUN
CONT key are highlighted. The running measurement can be aborted by selecting the
highlighted softkey or key again. The results are not deleted until a new measurement
is started.
Note: Sequencer. If the Sequencer is active, the "Continuous Sweep" softkey only
controls the sweep mode for the currently selected channel. However, the sweep mode
only takes effect the next time the Sequencer activates that channel, and only for a
channel-defined sequence. In this case, a channel in continuous sweep mode is swept
repeatedly.
72User Manual 1176.9029.02 ─ 04
Page 73

R&S®FPS-K76/K77
Furthermore, the RUN CONT key controls the Sequencer, not individual sweeps. RUN
CONT starts the Sequencer in continuous mode.
Remote command:
INITiate<n>:CONTinuous on page 153
Single Sweep / Run Single
While the measurement is running, the "Single Sweep" softkey and the RUN SINGLE
key are highlighted. The running measurement can be aborted by selecting the highlighted softkey or key again.
Remote command:
INITiate<n>[:IMMediate] on page 154
Continue Single Sweep
While the measurement is running, the "Continue Single Sweep" softkey and the RUN
SINGLE key are highlighted. The running measurement can be aborted by selecting
the highlighted softkey or key again.
Remote command:
INITiate<n>:CONMeas on page 153
Configuration
Code Domain Analysis
Refresh (MSRA only)
This function is only available if the Sequencer is deactivated and only for MSRA slave
applications.
The data in the capture buffer is re-evaluated by the currently active slave application
only. The results for any other slave applications remain unchanged.
This is useful, for example, after evaluation changes have been made or if a new
sweep was performed from another slave application; in this case, only that slave
application is updated automatically after data acquisition.
Note: To update all active slave applications at once, use the "Refresh All" function in
the "Sequencer" menu.
Remote command:
INITiate<n>:REFResh on page 186
Sweep/Average Count
Defines the number of measurements to be performed in the single sweep mode. Values from 0 to 200000 are allowed. If the values 0 or 1 are set, one measurement is
performed.
The sweep count is applied to all the traces in all diagrams.
Remote command:
[SENSe:]SWEep:COUNt on page 136
6.2.10 Automatic Settings
Access: AUTO SET
The R&S FPS TD-SCDMA Measurements application can adjust some settings automatically according to the current measurement settings. To do so, a measurement is
73User Manual 1176.9029.02 ─ 04
Page 74

R&S®FPS-K76/K77
performed. The duration of this measurement can be defined automatically or manually.
MSRA operating mode
In MSRA operating mode, the following automatic settings are not available, as they
require a new data acquisition. However, TD-SCDMA applications cannot acquire data
in MSRA operating mode.
Adjusting all Determinable Settings Automatically ( Auto All )...................................... 74
Setting the Reference Level Automatically ( Auto Level ).............................................74
Auto Scale Window.......................................................................................................75
Auto Scale All................................................................................................................75
Restore Scale (Window)............................................................................................... 75
Resetting the Automatic Measurement Time ( Meastime Auto )...................................75
Changing the Automatic Measurement Time ( Meastime Manual ).............................. 75
Upper Level Hysteresis ................................................................................................75
Lower Level Hysteresis ................................................................................................75
Configuration
Code Domain Analysis
Adjusting all Determinable Settings Automatically ( Auto All )
Activates all automatic adjustment functions for the current measurement settings.
This includes:
●
Auto Level
●
"Auto Scale All" on page 75
Note: MSRA operating modes. In MSRA operating mode, this function is only available
for the MSRA Master, not the applications.
Remote command:
[SENSe:]ADJust:ALL on page 137
Setting the Reference Level Automatically ( Auto Level )
Automatically determines a reference level which ensures that no overload occurs at
the R&S FPS for the current input data. At the same time, the internal attenuators are
adjusted so the signal-to-noise ratio is optimized, while signal compression and clipping are minimized.
To determine the required reference level, a level measurement is performed on the
R&S FPS.
If necessary, you can optimize the reference level further. Decrease the attenuation
level manually to the lowest possible value before an overload occurs, then decrease
the reference level in the same way.
You can change the measurement time for the level measurement if necessary (see "
Changing the Automatic Measurement Time ( Meastime Manual )" on page 75).
Remote command:
[SENSe:]ADJust:LEVel on page 138
74User Manual 1176.9029.02 ─ 04
Page 75

R&S®FPS-K76/K77
Auto Scale Window
Automatically determines the optimal range and reference level position to be displayed for the current measurement settings in the currently selected window. No new
measurement is performed.
Auto Scale All
Automatically determines the optimal range and reference level position to be displayed for the current measurement settings in all displayed diagrams. No new measurement is performed.
Restore Scale (Window)
Restores the default scale settings in the currently selected window.
Resetting the Automatic Measurement Time ( Meastime Auto )
Resets the measurement duration for automatic settings to the default value.
Remote command:
[SENSe:]ADJust:CONFigure[:LEVel]:DURation:MODE on page 137
Configuration
Frequency and Time Domain Measurements
Changing the Automatic Measurement Time ( Meastime Manual )
This function allows you to change the measurement duration for automatic setting
adjustments. Enter the value in seconds.
Remote command:
[SENSe:]ADJust:CONFigure[:LEVel]:DURation:MODE on page 137
[SENSe:]ADJust:CONFigure[:LEVel]:DURation on page 137
Upper Level Hysteresis
When the reference level is adjusted automatically using the Auto Level function, the
internal attenuators and the preamplifier are also adjusted. To avoid frequent adaptation due to small changes in the input signal, you can define a hysteresis. This setting
defines an upper threshold the signal must exceed (compared to the last measurement) before the reference level is adapted automatically.
Remote command:
[SENSe:]ADJust:CONFigure:HYSTeresis:UPPer on page 138
Lower Level Hysteresis
When the reference level is adjusted automatically using the Auto Level function, the
internal attenuators and the preamplifier are also adjusted. To avoid frequent adaptation due to small changes in the input signal, you can define a hysteresis. This setting
defines a lower threshold the signal must fall below (compared to the last measurement) before the reference level is adapted automatically.
Remote command:
[SENSe:]ADJust:CONFigure:HYSTeresis:LOWer on page 138
6.3 Frequency and Time Domain Measurements
Access: "Overview" > "Select Measurement"
75User Manual 1176.9029.02 ─ 04
Page 76

R&S®FPS-K76/K77
When you activate a TD-SCDMA application, Code Domain Analysis of the input signal
is started automatically. However, the TD-SCDMA applications also provide various
frequency and time domain measurement types.
The main measurement configuration menus for the RF measurements are identical to
the Spectrum application.
For details refer to "General Measurement Configuration" in the R&S FPS User Manual.
The measurement-specific settings for the following measurements are available in the
"Analysis" dialog box (via the "Overview").
● Power vs Time........................................................................................................ 76
● Signal Channel Power Measurements....................................................................79
● Channel Power (ACLR) Measurements..................................................................80
● Spectrum Emission Mask........................................................................................81
● Occupied Bandwidth............................................................................................... 82
● CCDF...................................................................................................................... 83
Configuration
Frequency and Time Domain Measurements
6.3.1 Power vs Time
Access: "Overview" > "Select Measurement" > "Power vs Time"
The Power vs Time measurement checks the signal power against a transmission
power mask defined by the TD-SCDMA specification.
● Default Settings for PvT Measurements................................................................. 76
● PvT Configuration Overview................................................................................... 77
● PvT Measurement Settings.....................................................................................78
6.3.1.1 Default Settings for PvT Measurements
By default, the following settings are used for a Power vs Time measurement in the
TD-SCDMA BTS application:
Parameter Default Value
Span Zero Span
Sweep Time 2.4 ms
RBW 1.28 MHz
VBW 10 MHz
Trace Mode Average
Switching point
(BTS application only):
Number of subframes 100
3
76User Manual 1176.9029.02 ─ 04
Page 77

R&S®FPS-K76/K77
Configuration
Frequency and Time Domain Measurements
6.3.1.2 PvT Configuration Overview
For Power vs Time measurements, the "Overview" provides quick access to the following configuration dialog boxes (listed in the recommended order of processing):
The "Signal Description", "Signal Capture" and "Channel Detection" buttons indicated
in the "Overview" are not available for TD-SCDMA Power vs Time measurements.
1. "Select Measurement"
See Chapter 3, "Measurements and Result Display", on page 9
2. "Input/ Frontend"
See Chapter 6.2.2, "Data Input and Output Settings", on page 49
3. (Optionally:) "Trigger"
See Chapter 6.2.4, "Trigger Settings", on page 57
4. "Synchronization"
See Chapter 6.2.7, "Synchronization", on page 64
5. "Analysis"
See Chapter 7, "Analysis", on page 85
6. "Display Configuration"
See Chapter 6.1, "Result Display Configuration", on page 45
The "Span", "Lines", and "Marker Functions" menus are not available for Power vs
Time measurements in TD-SCDMA applications.
To configure settings
► Select any button in the "Overview" to open the corresponding dialog box.
Select a setting in the channel bar (at the top of the measurement channel tab) to
change a specific setting.
Preset Channel
Select the "Preset Channel" button in the lower left-hand corner of the "Overview" to
restore all measurement settings in the current channel to their default values.
Do not confuse the "Preset Channel" button with the PRESET key, which restores the
entire instrument to its default values and thus closes all channels on the R&S FPS
(except for the default channel)!
Remote command:
SYSTem:PRESet:CHANnel[:EXEC] on page 110
Select Measurement
Selects a different measurement to be performed.
See Chapter 3, "Measurements and Result Display", on page 9.
77User Manual 1176.9029.02 ─ 04
Page 78

R&S®FPS-K76/K77
Specifics for
The channel may contain several windows for different results. Thus, the settings indicated in the "Overview" and configured in the dialog boxes vary depending on the
selected window.
Select an active window from the "Specifics for" selection list that is displayed in the
"Overview" and in all window-specific configuration dialog boxes.
The "Overview" and dialog boxes are updated to indicate the settings for the selected
window.
Configuration
Frequency and Time Domain Measurements
6.3.1.3 PvT Measurement Settings
The following settings and functions are specific to the Power vs Time measurement in
the TD-SCDMA applications. They are available from the "Power vs Time" menu,
which is displayed when you press the MEAS CONFIG key.
Switching Point..............................................................................................................78
Start Meas.....................................................................................................................78
No of Subframes........................................................................................................... 78
Adapting the Measurement to the Current Signal.........................................................79
└ Start Slot / Stop Slot........................................................................................79
└ Auto Level & Time...........................................................................................79
Switching Point
(BTS application only):
The switching point defines the border between uplink slots and downlink slots and is
between 1 and 6.
In downlink Power vs Time measurements, the slots of interest are defined as the
range from slot 1 to the slot indicated by the "Switching Point".
In the TD-SCDMA UE application, the slot of interest is slot 1, which cannot be
changed. Thus, the switching point is irrelevant.
Remote command:
CONFigure:CDPower[:BTS]:PVTime:SPOint on page 142
Start Meas
Starts measuring the power for the defined number of subframes (same effect as
pressing the RUN SINGLE key).
Remote command:
INIT:CONT OFF, see INITiate<n>:CONTinuous on page 153
INITiate<n>[:IMMediate] on page 154
No of Subframes
Defines the number of subframes that the R&S FPS includes in the measurement. The
results of the Power vs Time measurement are based on the average of the number of
the subframes. This setting is identical to the " Sweep/Average Count " on page 73.
Remote command:
CONFigure:CDPower[:BTS]:PVTime:SFRames on page 142
78User Manual 1176.9029.02 ─ 04
Page 79

R&S®FPS-K76/K77
Adapting the Measurement to the Current Signal
You can adapt the measurement range to the current TD-SCDMA signal.
Start Slot / Stop Slot ← Adapting the Measurement to the Current Signal
(BTS application only):
Defines the measurement range for Channel Power measurements as a range of
slots in the current TD-SCDMA signal, e.g. the downlink slots 4 to 6, for a "Switching
Point" = 3.
Remote command:
[SENSe:]POWer:ACHannel:SLOT:STARt on page 143
[SENSe:]POWer:ACHannel:SLOT:STOP on page 143
Auto Level & Time ← Adapting the Measurement to the Current Signal
Automatically adjusts the reference level and the trigger offset to subframe start to their
optimum levels for the current signal. This prevents overloading the R&S FPS.
When this function is activated, current measurements are aborted and resumed after
the automatic level detection is finished.
Remote command:
[SENSe:]POWer:ACHannel:AUTO:LTIMe on page 142
Configuration
Frequency and Time Domain Measurements
6.3.2 Signal Channel Power Measurements
Access: "Overview" > "Select Measurement" > "Power"
The Power measurement determines the TD-SCDMA signal channel power in a single
channel with a bandwidth of 1.2288 MHz.
In order to determine the signal power, the TD-SCDMA application performs a Channel
Power measurement as in the Spectrum application with the following settings:
Table 6-1: Predefined settings for TD-SCDMA Signal Channel Power measurements
Standard TD SCDMA FWD
(UE: TD SCDMA REV)
Number of adjacent channels 0
Frequency span 3 MHz
Measurement bandwidth 1.6 MHz
The main measurement menus and the configuration "Overview" for the RF measurements are identical to the Spectrum application. However, an additional function is provided to adapt the Power measurement to the current TD-SCDMA signal.
Adapting the Measurement to the Current Signal
You can adapt the measurement range to the current TD-SCDMA signal.
Start Slot / Stop Slot ← Adapting the Measurement to the Current Signal
(BTS application only):
79User Manual 1176.9029.02 ─ 04
Page 80

R&S®FPS-K76/K77
Defines the measurement range for Channel Power measurements as a range of
slots in the current TD-SCDMA signal, e.g. the downlink slots 4 to 6, for a "Switching
Point" = 3.
Remote command:
[SENSe:]POWer:ACHannel:SLOT:STARt on page 143
[SENSe:]POWer:ACHannel:SLOT:STOP on page 143
Auto Level & Time ← Adapting the Measurement to the Current Signal
Automatically adjusts the reference level and the trigger offset to subframe start to their
optimum levels for the current signal. This prevents overloading the R&S FPS.
When this function is activated, current measurements are aborted and resumed after
the automatic level detection is finished.
Remote command:
[SENSe:]POWer:ACHannel:AUTO:LTIMe on page 142
Configuration
Frequency and Time Domain Measurements
6.3.3 Channel Power (ACLR) Measurements
Access: "Overview" > "Select Measurement" > "Channel Power ACLR"
Channel Power ACLR measurements are performed as in the Spectrum application
with the following predefined settings according to TD-SCDMA specifications (adjacent
channel leakage ratio).
Table 6-2: Predefined settings for TD-SCDMA ACLR Channel Power measurements
Standard TD SCDMA FWD
(UE: TD SCDMA REV)
Number of adjacent channels 2
For further details about the ACLR measurements refer to "Measuring Channel Power
and Adjacent-Channel Power" in the R&S FPS User Manual.
To restore adapted measurement parameters, the following parameters are saved on
exiting and are restored on re-entering this measurement:
●
Reference level and reference level offset
●
RBW, VBW
●
Sweep time
●
Span
●
Number of adjacent channels
●
Fast ACLR mode
The main measurement menus and the configuration "Overview" for the RF measurements are identical to the Spectrum application. However, an additional function is provided to adapt the ACLR measurement to the current TD-SCDMA signal.
Adapting the Measurement to the Current Signal.........................................................81
└ Start Slot / Stop Slot........................................................................................81
└ Auto Level & Time...........................................................................................81
80User Manual 1176.9029.02 ─ 04
Page 81

R&S®FPS-K76/K77
Adapting the Measurement to the Current Signal
You can adapt the measurement range to the current TD-SCDMA signal.
Start Slot / Stop Slot ← Adapting the Measurement to the Current Signal
(BTS application only):
Defines the measurement range for Channel Power measurements as a range of
slots in the current TD-SCDMA signal, e.g. the downlink slots 4 to 6, for a "Switching
Point" = 3.
Remote command:
[SENSe:]POWer:ACHannel:SLOT:STARt on page 143
[SENSe:]POWer:ACHannel:SLOT:STOP on page 143
Auto Level & Time ← Adapting the Measurement to the Current Signal
Automatically adjusts the reference level and the trigger offset to subframe start to their
optimum levels for the current signal. This prevents overloading the R&S FPS.
When this function is activated, current measurements are aborted and resumed after
the automatic level detection is finished.
Remote command:
[SENSe:]POWer:ACHannel:AUTO:LTIMe on page 142
Configuration
Frequency and Time Domain Measurements
6.3.4 Spectrum Emission Mask
Access: "Overview" > "Select Measurement" > "Spectrum Emission Mask"
The Spectrum Emission Mask measurement determines the power of the TD-SCDMA
signal in defined offsets from the carrier and compares the power values with a spectral mask specified by TD-SCDMA.
For further details about the Spectrum Emission Mask measurements refer to "Spectrum Emission Mask Measurement" in the R&S FPS User Manual.
The TD-SCDMA applications perform the SEM measurement as in the Spectrum application with the following settings:
Table 6-3: Predefined settings for TD-SCDMA SEM measurements
Span +/- 4 MHz
Number of ranges 9
Fast SEM ON
Number of power classes 1
Channel bandwidth 1.28 MHz
Power reference type Channel power
Detector RMS
Changing the RBW and the VBW is restricted due to the definition of the limits by the
standard.
81User Manual 1176.9029.02 ─ 04
Page 82

R&S®FPS-K76/K77
To restore adapted measurement parameters, the following parameters are saved on
exiting and are restored on re-entering this measurement:
●
●
●
The main measurement menus and the configuration "Overview" for the RF measurements are identical to the Spectrum application. However, an additional function is provided to adapt the SEM measurement to the current TD-SCDMA signal.
Adapting the Measurement to the Current Signal
You can adapt the measurement range to the current TD-SCDMA signal.
Start Slot / Stop Slot ← Adapting the Measurement to the Current Signal
(BTS application only):
Defines the measurement range for Channel Power measurements as a range of
slots in the current TD-SCDMA signal, e.g. the downlink slots 4 to 6, for a "Switching
Point" = 3.
Remote command:
[SENSe:]POWer:ACHannel:SLOT:STARt on page 143
[SENSe:]POWer:ACHannel:SLOT:STOP on page 143
Configuration
Frequency and Time Domain Measurements
Reference level and reference level offset
Sweep time
Span
Auto Level & Time ← Adapting the Measurement to the Current Signal
Automatically adjusts the reference level and the trigger offset to subframe start to their
optimum levels for the current signal. This prevents overloading the R&S FPS.
When this function is activated, current measurements are aborted and resumed after
the automatic level detection is finished.
Remote command:
[SENSe:]POWer:ACHannel:AUTO:LTIMe on page 142
6.3.5 Occupied Bandwidth
Access: "Overview" > "Select Measurement" > "OBW"
The Occupied Bandwidth measurement determines the bandwidth that the signal occupies. The occupied bandwidth is defined as the bandwidth in which – in default settings
- 99 % of the total signal power is to be found. The percentage of the signal power to
be included in the bandwidth measurement can be changed.
The Occupied Bandwidth measurement is performed as in the Spectrum application
with the following predefined settings according to TD-SCDMA specifications:
Table 6-4: Predefined settings for TD-SCDMA OBW measurements
Setting Default value
% Power Bandwidth 99 %
Channel bandwidth 1.28 MHz
Sweep Time 676 ms
82User Manual 1176.9029.02 ─ 04
Page 83

R&S®FPS-K76/K77
For further details about the Occupied Bandwidth measurements refer to "Measuring
the Occupied Bandwidth" in the R&S FPS User Manual.
To restore adapted measurement parameters, the following parameters are saved on
exiting and are restored on re-entering this measurement:
●
●
●
●
Configuration
Frequency and Time Domain Measurements
Setting Default value
RBW 30 kHz
VBW 300 kHz
Detector RMS
Trigger Gated, IF power
Reference level and reference level offset
RBW, VBW
Sweep time
Span
The main measurement menus and the configuration "Overview" for the RF measurements are identical to the Spectrum application. However, an additional function is provided to adapt the OBW measurement to the current TD-SCDMA signal.
Adapting the Measurement to the Current Signal
You can adapt the measurement range to the current TD-SCDMA signal.
Start Slot / Stop Slot ← Adapting the Measurement to the Current Signal
(BTS application only):
Defines the measurement range for Channel Power measurements as a range of
slots in the current TD-SCDMA signal, e.g. the downlink slots 4 to 6, for a "Switching
Point" = 3.
Remote command:
[SENSe:]POWer:ACHannel:SLOT:STARt on page 143
[SENSe:]POWer:ACHannel:SLOT:STOP on page 143
Auto Level & Time ← Adapting the Measurement to the Current Signal
Automatically adjusts the reference level and the trigger offset to subframe start to their
optimum levels for the current signal. This prevents overloading the R&S FPS.
When this function is activated, current measurements are aborted and resumed after
the automatic level detection is finished.
Remote command:
[SENSe:]POWer:ACHannel:AUTO:LTIMe on page 142
6.3.6 CCDF
Access: "Overview" > "Select Measurement" > "CCDF"
The CCDF measurement determines the distribution of the signal amplitudes (complementary cumulative distribution function).
83User Manual 1176.9029.02 ─ 04
Page 84

R&S®FPS-K76/K77
The CCDF measurement is performed as in the Spectrum application with the following settings:
Table 6-5: Predefined settings for TD-SCDMA CCDF measurements
For further details about the CCDF measurements refer to "Statistical Measurements"
in the R&S FPS User Manual.
To restore adapted measurement parameters, the following parameters are saved on
exiting and are restored on re-entering this measurement:
●
●
●
Configuration
Frequency and Time Domain Measurements
CCDF Active on trace 1
Analysis bandwidth 10 MHz
Number of samples 500000
Detector Sample
Reference level and reference level offset
Analysis bandwidth
Number of samples
The main measurement menus and the configuration "Overview" for the RF measurements are identical to the Spectrum application. However, an additional function is provided to adapt the CCDF measurement to the current TD-SCDMA signal.
Adapting the Measurement to the Current Signal
You can adapt the measurement range to the current TD-SCDMA signal.
Start Slot / Stop Slot ← Adapting the Measurement to the Current Signal
(BTS application only):
Defines the measurement range for Channel Power measurements as a range of
slots in the current TD-SCDMA signal, e.g. the downlink slots 4 to 6, for a "Switching
Point" = 3.
Remote command:
[SENSe:]POWer:ACHannel:SLOT:STARt on page 143
[SENSe:]POWer:ACHannel:SLOT:STOP on page 143
Auto Level & Time ← Adapting the Measurement to the Current Signal
Automatically adjusts the reference level and the trigger offset to subframe start to their
optimum levels for the current signal. This prevents overloading the R&S FPS.
When this function is activated, current measurements are aborted and resumed after
the automatic level detection is finished.
Remote command:
[SENSe:]POWer:ACHannel:AUTO:LTIMe on page 142
84User Manual 1176.9029.02 ─ 04
Page 85

R&S®FPS-K76/K77
7 Analysis
Access: "Overview" > "Analysis"
Analysis of RF Measurements
General result analysis settings concerning the trace, markers, lines etc. for RF measurements are almost identical to the analysis functions in the Spectrum application.
Only some special marker functions are not available in TD-SCDMA applications.
For details, see the "Common Analysis and Display Functions" chapter in the
R&S FPS User Manual.
The remote commands required to perform these tasks are described in Chap-
ter 10.10, "Analysis", on page 173.
● Evaluation Range....................................................................................................85
● Code Domain Analysis Settings..............................................................................86
● Traces..................................................................................................................... 88
● Markers................................................................................................................... 89
Analysis
Evaluation Range
7.1 Evaluation Range
Access: "Overview" > "Analysis" > "Evaluation Range" tab
The evaluation range defines which channel, slot or set is evaluated in the result display.
Channel (Code) Number...............................................................................................85
Slot Number.................................................................................................................. 86
Set to Analyze...............................................................................................................86
Channel (Code) Number
Selects a channel for the following evaluations:
●
Bitstream
●
Power vs Slot
●
Power vs Symbol
●
Result Summary
●
Symbol Constellation
85User Manual 1176.9029.02 ─ 04
Page 86

R&S®FPS-K76/K77
●
Enter a code number and spreading factor, separated by a decimal point.
The specified channel is selected and marked in red in the corresponding result dis-
plays, if active. If no spreading factor is specified, the code based on the spreading factor 16 is marked. For unused channels, the code resulting from the conversion is
marked.
Example: Enter 4.8
Channel 4 is marked at spreading factor 8 (35.2 ksps) if the channel is active, other-
wise code 7 at spreading factor 16.
Remote command:
[SENSe:]CDPower:CODE on page 139
Slot Number
Selects the slot for evaluation. This affects channel detection as well as the following
evaluations (see also Chapter 3.1.2, "Evaluation Methods for Code Domain Analysis",
on page 11):
●
●
●
●
●
●
●
●
●
●
Remote command:
[SENSe:]CDPower:SLOT on page 139
Analysis
Code Domain Analysis Settings
Symbol EVM
Bitstream
Channel Table
Code Domain Power
Code Domain Error Power
Result Summary
Composite Constellation
Power vs Symbol
Result Summary
Symbol Constellation
Symbol EVM
Set to Analyze
Selects a specific set for further analysis. The value range depends on the Set Count
and is between 0 and [Set Count-1].
Remote command:
[SENSe:]CDPower:SET on page 139
7.2 Code Domain Analysis Settings
Access: "Overview" > "Analysis" > "Code Domain Settings" tab
Some evaluations provide further settings for the results.
86User Manual 1176.9029.02 ─ 04
Page 87

R&S®FPS-K76/K77
Analysis
Code Domain Analysis Settings
Figure 7-1: Code Domain Settings (BTS mode)
Compensate IQ Offset.................................................................................................. 87
Code Power Display......................................................................................................87
Channel Table Sort Order.............................................................................................87
Show DwPTS Results (BTS mode)...............................................................................88
Show UpPTS Results (UE mode)................................................................................. 88
Compensate IQ Offset
If enabled, the I/Q offset is eliminated from the measured signal. This is useful to
deduct a DC offset to the baseband caused by the DUT, thus improving the EVM.
Note, however, that for EVM measurements according to standard, compensation
must be disabled.
Remote command:
[SENSe:]CDPower:NORMalize on page 140
Code Power Display
For "Code Domain Power" evaluation:
Defines whether the absolute power or the power relative to the total power of the data
parts of the signal is displayed.
Remote command:
[SENSe:]CDPower:PDISplay on page 140
Channel Table Sort Order
You can sort channels in the Channel Table result display in two ways:
"Code Order"
First, all midambles are listed, then all control channels and last all
data channels
The midambles are sorted according to their midamble shifts. Active
and inactive channels are projected to a spreading factor of 16 and
sorted according to their code numbers.
87User Manual 1176.9029.02 ─ 04
Page 88

R&S®FPS-K76/K77
Analysis
Traces
"Midamble
Order"
All control and data channels are assigned to the midambles they
belong to; the midambles are in ascending order
The TD-SCDMA application automatically distinguishes between
common and default midamble allocation. If neither a common nor a
default midamble allocation is found, sorting is in code order.
The allocation of code to midamble is specified in the TD-SCDMA
standard. (See also Chapter 4.4, "Data Fields and Midambles",
on page 39).
Remote command:
CONFigure:CDPower:CTABle:ORDer on page 140
Show DwPTS Results (BTS mode)
Displays additional information on the "Downlink Pilot Time Slot" (DwPTS, see also
Chapter 4.2, "Frames, Subframes and Slots", on page 34) in the Result Summary.
Remote command:
[SENSe:]CDPower:PTS on page 141
Show UpPTS Results (UE mode)
Displays additional information on the "Uplink Pilot Time Slot" (UpPTS, see also Chap-
ter 4.2, "Frames, Subframes and Slots", on page 34) in the Result Summary.
Remote command:
[SENSe:]CDPower:PTS on page 141
7.3 Traces
Access: "Overview" > "Analysis" > "Trace"
Or: TRACE > "Trace Config"
The trace settings determine how the measured data is analyzed and displayed on the
screen.
88User Manual 1176.9029.02 ─ 04
Page 89

R&S®FPS-K76/K77
In CDA evaluations, only one trace can be active in each diagram at any time.
Window-specific configuration
The settings in this dialog box are specific to the selected window. To configure the
settings for a different window, select the window outside the displayed dialog box, or
select the window from the "Specifics for" selection list in the dialog box.
Trace Mode
Defines the update mode for subsequent traces.
"Clear/ Write"
"Max Hold"
"Min Hold"
"Average"
"View"
"Blank"
Remote command:
DISPlay[:WINDow<n>]:TRACe<t>:MODE on page 173
Analysis
Markers
Overwrite mode (default): the trace is overwritten by each measurement.
The maximum value is determined over several measurements and
displayed. The R&S FPS saves each trace point in the trace memory
only if the new value is greater than the previous one.
The minimum value is determined from several measurements and
displayed. The R&S FPS saves each trace point in the trace memory
only if the new value is lower than the previous one.
The average is formed over several measurements.
The current contents of the trace memory are frozen and displayed.
Removes the selected trace from the display.
7.4 Markers
Access: "Overview" > "Analysis" > "Marker"
Or: MKR
Markers help you analyze your measurement results by determining particular values
in the diagram. Thus you can extract numeric values from a graphical display.
Markers in Code Domain Analysis measurements
In Code Domain Analysis measurements, the markers are set to individual symbols,
codes, slots or channels, depending on the result display. Thus you can use the markers to identify individual codes, for example.
● Individual Marker Settings.......................................................................................90
● General Marker Settings......................................................................................... 91
● Marker Search Settings...........................................................................................92
● Marker Positioning Functions..................................................................................93
89User Manual 1176.9029.02 ─ 04
Page 90

R&S®FPS-K76/K77
Analysis
Markers
7.4.1 Individual Marker Settings
Access: "Overview" > "Analysis" > "Marker" > "Markers"
Or: MKR > "Marker Config"
In CDA evaluations, up to four markers can be activated in each diagram at any time.
Selected Marker ...........................................................................................................90
Marker State .................................................................................................................90
X-value..........................................................................................................................91
Marker Type .................................................................................................................91
All Marker Off ............................................................................................................... 91
Selected Marker
Marker name. The marker which is currently selected for editing is highlighted orange.
Remote command:
Marker selected via suffix <m> in remote commands.
Marker State
Activates or deactivates the marker in the diagram.
Remote command:
CALCulate<n>:MARKer<m>[:STATe] on page 175
CALCulate<n>:DELTamarker<m>[:STATe] on page 176
90User Manual 1176.9029.02 ─ 04
Page 91

R&S®FPS-K76/K77
X-value
Defines the position of the marker on the x-axis (channel, slot, symbol, depending on
evaluation).
Remote command:
CALCulate<n>:DELTamarker<m>:X on page 176
CALCulate<n>:MARKer<m>:X on page 175
Marker Type
Toggles the marker type.
The type for marker 1 is always "Normal" , the type for delta marker 1 is always
"Delta" . These types cannot be changed.
Note: If normal marker 1 is the active marker, switching the "Mkr Type" activates an
additional delta marker 1. For any other marker, switching the marker type does not
activate an additional marker, it only switches the type of the selected marker.
"Normal"
"Delta"
Remote command:
CALCulate<n>:MARKer<m>[:STATe] on page 175
CALCulate<n>:DELTamarker<m>[:STATe] on page 176
Analysis
Markers
A normal marker indicates the absolute value at the defined position
in the diagram.
A delta marker defines the value of the marker relative to the specified reference marker (marker 1 by default).
All Marker Off
Deactivates all markers in one step.
Remote command:
CALCulate<n>:MARKer<m>:AOFF on page 175
7.4.2 General Marker Settings
Access: "Overview" > "Analysis" > "Marker" > "Marker Settings"
Or: MKR > "Marker Config" > "Marker Settings" tab
91User Manual 1176.9029.02 ─ 04
Page 92

R&S®FPS-K76/K77
Analysis
Markers
Marker Table Display
Defines how the marker information is displayed.
"On"
Displays the marker information in a table in a separate area beneath
the diagram.
"Off"
No separate marker table is displayed.
The marker information is displayed within the diagram area.
"Auto"
(Default) If more than two markers are active, the marker table is displayed automatically.
The marker information for up to two markers is displayed in the diagram area.
Remote command:
DISPlay[:WINDow<n>]:MTABle on page 178
7.4.3 Marker Search Settings
Access: "Overview" > "Analysis" > "Marker" > "Search"
Access: MKR -> > "Search Config"
Several functions are available to set the marker to a specific position very quickly and
easily. In order to determine the required marker position, searches can be performed.
The search results are affected by special settings.
92User Manual 1176.9029.02 ─ 04
Page 93

R&S®FPS-K76/K77
Analysis
Markers
Search Mode for Next Peak .........................................................................................93
Search Mode for Next Peak
Selects the search mode for the next peak search.
"Left"
Determines the next maximum/minimum to the left of the current
peak.
"Absolute"
Determines the next maximum/minimum to either side of the current
peak.
"Right"
Determines the next maximum/minimum to the right of the current
peak.
Remote command:
Chapter 10.10.2.3, "Positioning the Marker", on page 178
7.4.4 Marker Positioning Functions
Access: MKR ->
The following functions set the currently selected marker to the result of a peak search.
Markers in Code Domain Analysis measurements
In Code Domain Analysis measurements, the markers are set to individual symbols,
codes, slots or channels, depending on the result display. Thus you can use the markers to identify individual codes, for example.
93User Manual 1176.9029.02 ─ 04
Page 94

R&S®FPS-K76/K77
Search Next Peak ........................................................................................................ 94
Search Next Minimum ..................................................................................................94
Peak Search .................................................................................................................94
Search Minimum .......................................................................................................... 94
Search Next Peak
Sets the selected marker/delta marker to the next (lower) maximum of the assigned
trace. If no marker is active, marker 1 is activated.
Remote command:
CALCulate<n>:MARKer<m>:MAXimum:NEXT on page 179
CALCulate<n>:MARKer<m>:MAXimum:RIGHt on page 179
CALCulate<n>:MARKer<m>:MAXimum:LEFT on page 178
CALCulate<n>:DELTamarker<m>:MAXimum:NEXT on page 181
CALCulate<n>:DELTamarker<m>:MAXimum:RIGHt on page 182
CALCulate<n>:DELTamarker<m>:MAXimum:LEFT on page 181
Search Next Minimum
Sets the selected marker/delta marker to the next (higher) minimum of the selected
trace. If no marker is active, marker 1 is activated.
Remote command:
CALCulate<n>:MARKer<m>:MINimum:NEXT on page 180
CALCulate<n>:MARKer<m>:MINimum:LEFT on page 179
CALCulate<n>:MARKer<m>:MINimum:RIGHt on page 180
CALCulate<n>:DELTamarker<m>:MINimum:NEXT on page 182
CALCulate<n>:DELTamarker<m>:MINimum:LEFT on page 182
CALCulate<n>:DELTamarker<m>:MINimum:RIGHt on page 183
Analysis
Markers
Peak Search
Sets the selected marker/delta marker to the maximum of the trace. If no marker is
active, marker 1 is activated.
Remote command:
CALCulate<n>:MARKer<m>:MAXimum[:PEAK] on page 179
CALCulate<n>:DELTamarker<m>:MAXimum[:PEAK] on page 181
Search Minimum
Sets the selected marker/delta marker to the minimum of the trace. If no marker is
active, marker 1 is activated.
Remote command:
CALCulate<n>:MARKer<m>:MINimum[:PEAK] on page 180
CALCulate<n>:DELTamarker<m>:MINimum[:PEAK] on page 182
94User Manual 1176.9029.02 ─ 04
Page 95

R&S®FPS-K76/K77
8 Optimizing and Troubleshooting the Mea-
surement
If the results do not meet your expectations, try the following methods to optimize the
measurement:
Synchronization fails
●
●
●
●
●
Optimizing and Troubleshooting the Measurement
Error Messages
Check the frequency.
Check the reference level.
When using an external trigger, check whether an external trigger is being sent to
the R&S FPS.
Check the carrier frequency error (see Chapter 3.1.1, "Code Domain Parame-
ters", on page 10)
Frequency differences between the transmitter and receiver of more than 1.0 kHz
impair synchronization of the Code Domain Power measurement. If at all possible,
the transmitter and the receiver should be synchronized.
Check the chip rate error. A large chip rate error results in symbol errors and,
therefore, in possible synchronization errors for code domain measurements.
EVM and Error results are too high
Only the channels detected as being active are used to generate the ideal reference
signal. If a channel is not detected as being active, e.g. on account of low power, the
difference between the test signal and the reference signal and therefore the (composite) EVM and code domain errors are very large.
Distortions also occur if unassigned codes are wrongly given the status of "active channel". To obtain reliable measurement results, select an adequate channel threshold.
8.1 Error Messages
Error messages are entered in the error/event queue of the status reporting system in
the remote control mode and can be queried with the command SYSTem:ERRor?.
A short explanation of the device-specific error messages for the TD-SCDMA applications is given below.
Status bar message Description
Sync not found This message is displayed if synchronization is not possible.
Possible causes are that frequency, level, scrambling code,
Invert Q values are set incorrectly, or the input signal is invalid.
95User Manual 1176.9029.02 ─ 04
Page 96

R&S®FPS-K76/K77
9 How to Perform Measurements in TD-
SCDMA Applications
The following step-by-step instructions demonstrate how to perform measurements
with the TD-SCDMA applications.
The following tasks are described:
●
●
●
●
●
To perform Code Domain Analysis
1. Press the MODE key and select the "TD-SCDMA BTS" applications for base sta-
How to Perform Measurements in TD-SCDMA Applications
To perform Code Domain Analysis
To define or edit a channel table
To perform a Power vs Time check
To perform an RF measurement
To select the application data for MSRA measurements
tion tests, or "TD-SCDMA UE" for user equipment tests.
Code Domain Analysis of the input signal is performed by default.
2. Select the "Overview" softkey to display the "Overview" for Code Domain Analysis.
3. Select the "Input/Frontend" button and then the "Frequency" tab to define the input
signal's center frequency.
4. Select the "Amplitude" tab to define the reference level and other settings concerning the expected power levels.
5. Optionally, in the "Overview", select the "Trigger" button and define a trigger for
data acquisition, for example an external trigger to start capturing data only when a
useful signal is transmitted.
6. Select the "Signal Capture" button and define the acquisition parameters for the
input signal, i.e. how many sets and slots are to be captured.
In MSRA mode, define the application data instead, see "To select the application
data for MSRA measurements" on page 99.
7. Select the "Synchronization" button and define the channel synchronization settings, i.e. the maximum number of users and the scrambling code to be expected
in the input signal.
8. Select the "Channel Detection" button and define how the individual channels are
to be detected within the input signal. If necessary, define a channel table as
described in "To define or edit a channel table" on page 97.
9. Select the "Display Config" button and select the evaluation methods that are of
interest to you.
Arrange them on the display to suit your preferences.
10. Exit the SmartGrid mode and select the "Overview" softkey to display the "Overview" again.
96User Manual 1176.9029.02 ─ 04
Page 97

R&S®FPS-K76/K77
11. Select the "Analysis" button in the "Overview" to configure how the data is evalu-
12. Start a new measurement with the defined settings.
How to Perform Measurements in TD-SCDMA Applications
ated in the individual result displays.
● Select the channel, slot and set to be evaluated.
● Configure specific settings for the selected evaluation method(s).
● Optionally, configure the trace to display the average over a series of measure-
ments. If necessary, increase the "Sweep/Average Count" in the "Sweep Config" dialog box.
● Configure markers and delta markers to determine deviations and offsets within
the results, e.g. when comparing errors or peaks.
In MSRA mode you may want to stop the continuous measurement mode by the
Sequencer and perform a single data acquisition:
a)
Select the Sequencer icon (
b) Set the Sequencer state to "OFF".
c) Press the RUN SINGLE key.
) from the toolbar.
To define or edit a channel table
Channel tables contain a list of channels to be detected and their specific parameters.
You can create user-defined and edit pre-defined channel tables.
1. Select the "Channel Detection" softkey from the main "Code Domain Analyzer"
menu to open the "Channel Detection" dialog box.
2. To define a new channel table, select the "New" button next to the "Predefined
Tables" list.
To edit an existing channel table:
a) Select the existing channel table in the "Predefined Tables" list.
b) Select the "Edit" button next to the "Predefined Tables" list.
3. In the "Channel Table" dialog box, define a name and, optionally, a comment that
describes the channel table. The comment is displayed when you set the focus on
the table in the "Predefined Tables" list.
4. Define the maximum number of users ("MA Shifts Cell") to be used for the channel
table.
5. Define the channels to be detected using one of the following methods:
Select the "Measure Table" button to create a table that consists of the channels
detected in the currently measured signal.
Or:
a) Select the "Add Channel" button to insert a row for a new channel below the
currently selected row in the channel table.
b) Define the channel specifications required for detection.
6. Select the "Save Table" button to store the channel table.
The table is stored and the dialog box is closed. The new channel table is included
in the "Predefined Tables" list in the "Channel Detection" dialog box.
97User Manual 1176.9029.02 ─ 04
Page 98

R&S®FPS-K76/K77
7. To activate the use of the new channel table:
To perform a Power vs Time check
The Power vs Time measurement checks the signal power in the time domain against
a transmission power mask defined by the TD-SCDMA specification (for details see
"Power vs Time" on page 25).
1. Press the MODE key and select the "TD-SCDMA BTS" applications for base sta-
2. Switch to the Power vs Time measurement:
How to Perform Measurements in TD-SCDMA Applications
a) Select the table in the "Predefined Tables" list.
b) Select the "Select" button.
A checkmark is displayed next to the selected table.
c) Toggle the "Use Predefined Channel Table" setting to "Predefined".
d) Close the dialog box.
e) Start a new measurement.
tion tests, or "TD-SCDMA UE" for user equipment tests.
Code Domain Analysis of the input signal is performed by default.
a) Press the MEAS key.
b) In the "Select Measurement" dialog box, select the "Power vs Time" button.
3. For downlink measurements (BTS application) only:
Select the "Switching Point" softkey to define the slot which separates the uplink
from the downlink data. Only the slots for downlink data are measured and
checked against the transmission power mask.
(For uplink measurements, the application always measures slot 1, thus the switching point is irrelevant.)
4. For downlink measurements (BTS application):
Select the "Auto Level & Time" softkey to adjust the reference level and the trigger
offset to subframe start to their optimum levels for the current signal.
For uplink measurements, select the "Adapt to Signal" softkey and then the "Auto
Level & Time" button to adjust the reference level and the trigger offset to subframe
start automatically.
5. Select the "No. of Subframes" softkey to define how many slots are taken into consideration for the Power vs Time results.
6. Optionally, press the TRIGGER key and define a trigger for the measurement, for
example an external trigger to start measuring only when a useful signal is transmitted.
7. Select the "Start Meas" softkey or press the RUN SINGLE key to start a new measurement.
The Power vs Time diagram is displayed, averaged over the defined number of
subframes. The result of the limit check against the transmission power mask is
also indicated.
98User Manual 1176.9029.02 ─ 04
Page 99

R&S®FPS-K76/K77
8. To display the numerical results, select the "Display Config" softkey and drag the
To perform an RF measurement
1. Press the MODE key and select the "TD-SCDMA BTS" applications for base sta-
2. Select the RF measurement:
3. If necessary, adapt the settings as described for the individual measurements in
4. Select the "Display Config" button and select the evaluation methods that are of
How to Perform Measurements in TD-SCDMA Applications
"Evaluation List" result to the display.
tion tests, or "TD-SCDMA UE" for user equipment tests.
Code Domain Analysis of the input signal is performed by default.
a) Press the MEAS key.
b) In the "Select Measurement" dialog box, select the required measurement.
The selected measurement is activated with the default settings for TD-SCDMA
mode immediately.
the R&S FPS User Manual.
interest to you.
Arrange them on the display to suit your preferences.
5. Exit the SmartGrid mode and select the "Overview" softkey to display the "Overview" again.
6. Select the "Analysis" button in the "Overview" to make use of the advanced analysis functions in the result displays.
● Configure a trace to display the average over a series of sweeps; if necessary,
increase the "Sweep Count" in the "Sweep" settings.
● Configure markers and delta markers to determine deviations and offsets within
the evaluated signal.
● Use special marker functions to calculate noise or a peak list.
● Configure a limit check to detect excessive deviations.
7. Optionally, export the trace data of the graphical evaluation results to a file.
a) In the "Traces" tab of the "Analysis" dialog box, switch to the "Trace Export"
tab.
b) Select "Export Trace to ASCII File".
c) Define a file name and storage location and select "OK".
To select the application data for MSRA measurements
In multi-standard radio analysis you can analyze the data captured by the MSRA Master in the TD-SCDMA BTS application. Assuming you have detected a suspect area of
the captured data in another application, you would now like to analyze the same data
in the TD-SCDMA BTS application.
1. Select the "Overview" softkey to display the "Overview" for Code Domain Analysis.
2. Select the "Signal Capture" button.
99User Manual 1176.9029.02 ─ 04
Page 100

R&S®FPS-K76/K77
3. Define the application data range as the "Capture Length (Slots)".
4. Define the starting point of the application data as the "Capture offset". The offset
5. The analysis interval is automatically determined according to the selected chan-
6. If the Sequencer is off, select the "Refresh" softkey in the "Sweep" menu to update
How to Perform Measurements in TD-SCDMA Applications
is calculated according to the following formula:
<capture offset> = <starting point for application> - <starting point in capture buffer>
nel, slot or set to analyze (defined for the evaluation range), depending on the
result display. Note that the set/slot/channel is analyzed within the application data.
If the analysis interval does not yet show the required area of the capture buffer,
move through the sets/slots/channels in the evaluation range or correct the application data range.
the result displays for the changed application data.
100User Manual 1176.9029.02 ─ 04
 Loading...