

Page 1
R&S®FPS-K30
Noise Figure Measurements
User Manual
(;Úâï2)
1176849702
Version 04
Page 2

This manual applies to the following R&S®FPS models with firmware version 1.70 and higher:
●
R&S®FPS4 (1319.2008K04)
●
R&S®FPS7 (1319.2008K07)
●
R&S®FPS13 (1319.2008K13)
●
R&S®FPS30 (1319.2008K30)
●
R&S®FPS40 (1319.2008K40)
The following firmware options are described:
●
R&S FPS-K30 (1321.4104.02)
© 2021 Rohde & Schwarz GmbH & Co. KG
Mühldorfstr. 15, 81671 München, Germany
Phone: +49 89 41 29 - 0
Email: info@rohde-schwarz.com
Internet: www.rohde-schwarz.com
Subject to change – data without tolerance limits is not binding.
R&S® is a registered trademark of Rohde & Schwarz GmbH & Co. KG.
Trade names are trademarks of the owners.
1176.8497.02 | Version 04 | R&S®FPS-K30
The following abbreviations are used throughout this manual: R&S®FPS is abbreviated as R&S FPS.
Page 3

R&S®FPS-K30
1.1 Typographical Conventions......................................................................................... 7
2.1 Starting the Noise Application.....................................................................................8
2.2 Understanding the Display Information......................................................................9
4.1 Tuning Modes.............................................................................................................. 21
4.1.1 Swept Measurements................................................................................................... 22
4.1.2 Frequency Table Measurements...................................................................................22
Contents
Contents
1 Preface.................................................................................................... 7
2 Welcome to the Noise Figure Measurement Application................... 8
3 Measurements and Result Displays...................................................12
4 Measurement Basics........................................................................... 21
4.1.3 Single Frequency Measurements................................................................................. 22
4.2 Measurement Modes...................................................................................................23
4.3 DUT Types....................................................................................................................25
4.3.1 Measurements on Linear DUTs (Direct Measurement).................................................25
4.3.2 Measurements on Frequency Converting DUTs........................................................... 25
4.4 External Generator Control........................................................................................ 26
4.5 Image Frequency Rejection....................................................................................... 28
4.6 Calibration (2nd Stage Correction)............................................................................30
4.7 Separating Signals by Selecting an Appropriate Resolution Bandwidth.............. 33
4.8 Analyzing Several Traces - Trace Mode.................................................................... 34
4.9 Using Markers............................................................................................................. 35
5 Configuration........................................................................................38
5.1 Configuration Overview..............................................................................................38
5.2 Defining the Measurement Frequency...................................................................... 40
5.2.1 Defining a Frequency Set..............................................................................................40
5.2.2 Configuring Single Frequency Measurements.............................................................. 43
5.2.3 Using a Frequency Table.............................................................................................. 44
5.3 Selecting DUT Characteristics...................................................................................45
5.4 Configuring the Noise Source................................................................................... 47
5.4.1 Defining the Noise Source Characteristics....................................................................47
3User Manual 1176.8497.02 ─ 04
Page 4

R&S®FPS-K30
5.4.2 Using an ENR or Temperature Table............................................................................ 50
5.5 Configuring Additional Loss......................................................................................52
5.5.1 Defining Loss................................................................................................................ 53
5.5.2 Using a Loss Table........................................................................................................55
5.6 Configuring the Analyzer........................................................................................... 58
5.7 Using the Uncertainty Calculator.............................................................................. 61
5.7.1 Configuring Noise Source Characteristics.................................................................... 62
5.7.2 Configuring DUT Characteristics...................................................................................64
5.7.3 Configuring Analyzer Characteristics............................................................................ 65
5.7.4 Guidelines and Results................................................................................................. 66
5.8 Performing Measurements.........................................................................................67
5.9 Configuring Inputs and Outputs of the R&S FPS.....................................................68
5.9.1 Radio Frequency (RF) Input..........................................................................................68
Contents
5.9.2 External Generator........................................................................................................69
6 Analysis................................................................................................ 74
6.1 Configuring the Display..............................................................................................74
6.1.1 Configuring Graphical Results...................................................................................... 74
6.1.2 Configuring Numerical Results......................................................................................76
6.2 Working with Traces................................................................................................... 77
6.3 Using Markers............................................................................................................. 79
6.3.1 Marker Configuration.....................................................................................................79
6.3.2 Marker Positioning........................................................................................................ 81
6.4 Limit Line Settings and Functions............................................................................ 83
6.4.1 Limit Line Management.................................................................................................83
6.4.2 Limit Line Details...........................................................................................................85
7 Remote Control Commands for Noise Figure Measurements.........88
7.1 Common Suffixes........................................................................................................89
7.2 Introduction................................................................................................................. 89
7.2.1 Conventions used in Descriptions.................................................................................89
7.2.2 Long and Short Form.................................................................................................... 90
7.2.3 Numeric Suffixes........................................................................................................... 90
7.2.4 Optional Keywords........................................................................................................ 91
7.2.5 Alternative Keywords.................................................................................................... 91
4User Manual 1176.8497.02 ─ 04
Page 5

R&S®FPS-K30
7.2.6 SCPI Parameters.......................................................................................................... 91
7.3 Controlling the Noise Figure Measurement Channel.............................................. 94
7.4 Working with Windows in the Display.......................................................................98
7.5 General Window Commands....................................................................................104
7.6 Retrieving Measurement Results............................................................................ 105
7.7 Defining the Measurement Frequency.................................................................... 106
7.8 Selecting DUT Characteristics................................................................................. 111
7.9 Configuring the Noise Source..................................................................................113
7.10 Configuring Additional Loss....................................................................................120
7.11 Configuring the Analyzer......................................................................................... 127
7.12 Using the Uncertainty Calculator............................................................................ 132
7.13 Performing Measurements.......................................................................................142
7.14 Configuring the Inputs and Outputs........................................................................147
Contents
7.14.1 Radio Frequency (RF) Input........................................................................................147
7.14.2 External Generator......................................................................................................148
7.15 Configuring the Display............................................................................................151
7.16 Working with Traces................................................................................................. 155
7.17 Working with Limit Lines..........................................................................................160
7.17.1 Defining General Characteristics of a Limit Line......................................................... 161
7.17.2 Defining Horizontal Data Points.................................................................................. 162
7.17.3 Controlling Lower Limit Lines...................................................................................... 163
7.17.4 Controlling Upper Limit Lines...................................................................................... 165
7.17.5 Managing Limit Lines.................................................................................................. 166
7.17.6 Controlling Limit Checks............................................................................................. 167
7.18 Working with Markers...............................................................................................169
7.18.1 Using Markers............................................................................................................. 170
7.18.2 Using Delta Markers....................................................................................................172
7.18.3 Configuring Markers....................................................................................................175
7.18.4 Positioning Markers.....................................................................................................176
7.18.5 Positioning Delta Markers........................................................................................... 178
7.19 Using the Status Register........................................................................................ 180
7.19.1 Status Registers for Noise Figure Measurements...................................................... 181
7.20 Deprecated Remote Commands for Noise Figure Measurements....................... 187
5User Manual 1176.8497.02 ─ 04
Page 6

R&S®FPS-K30
7.21 Programming Example: Measuring a Noise Figure............................................... 188
A Reference: Frequency Table File Format.........................................189
Contents
Annex.................................................................................................. 189
List of Remote Commands (Noise Figure)...................................... 190
Index....................................................................................................195
6User Manual 1176.8497.02 ─ 04
Page 7
R&S®FPS-K30
1 Preface
1.1 Typographical Conventions
Preface
Typographical Conventions
The following text markers are used throughout this documentation:
Convention Description
"Graphical user interface elements"
[Keys] Key and knob names are enclosed by square brackets.
Filenames, commands,
program code
Input Input to be entered by the user is displayed in italics.
Links Links that you can click are displayed in blue font.
"References" References to other parts of the documentation are enclosed by quota-
All names of graphical user interface elements on the screen, such as
dialog boxes, menus, options, buttons, and softkeys are enclosed by
quotation marks.
Filenames, commands, coding samples and screen output are distinguished by their font.
tion marks.
7User Manual 1176.8497.02 ─ 04
Page 8

R&S®FPS-K30
2 Welcome to the Noise Figure Measurement
Welcome to the Noise Figure Measurement Application
Starting the Noise Application
Application
The R&S FPS-K30 is a firmware application that adds functionality to perform noise figure measurements to the R&S FPS.
Noise Source Control
The Noise Source Control connector on the R&S FPS is a prerequisite for the R&S
FPS Noise Figure measurements application.
This user manual contains a description of the functionality that the application provides, including remote control operation.
Functions that are not discussed in this manual are the same as in the Spectrum application and are described in the R&S FPS user manual. The latest versions of the manuals are available for download at the product homepage.
http://www.rohde-schwarz.com/product/FPS.html.
Installation
Find detailed installing instructions in the getting started or the release notes of the
R&S FPS.
● Starting the Noise Application...................................................................................8
● Understanding the Display Information.....................................................................9
2.1 Starting the Noise Application
The noise figure measurement application adds a new type of measurement to the
R&S FPS.
Manual operation via an external monitor and mouse
Although the R&S FPS does not have a built-in display, it is possible to operate it interactively in manual mode. To do so, use the graphical user interface and connect an
external monitor and a mouse.
It is recommended that you use the manual mode initially to get familiar with the instrument and its functions before using it in pure remote mode. Thus, this document
describes in detail how to operate the instrument manually using an external monitor
and mouse. The remote commands are described in the second part of the document.
For details on manual operation, see the R&S FPS getting started manual.
To activate the R&S FPS Noise Figure measurements application
1. Select the [MODE] key.
8User Manual 1176.8497.02 ─ 04
Page 9

R&S®FPS-K30
Welcome to the Noise Figure Measurement Application
Understanding the Display Information
A dialog box opens that contains all operating modes and applications currently
available on your R&S FPS.
2. Select the "Noise Figure" item.
The R&S FPS opens a new measurement channel for the noise figure measurement application.
All settings specific to noise figure measurements are in their default state.
Multiple Channels and Sequencer Function
When you activate an application, a new channel is created which determines the
measurement settings for that application ( "Channel" ). The same application can be
activated with different measurement settings by creating several "Channel" s for the
same application.
The number of channels that can be configured at the same time depends on the available memory on the instrument.
Only one measurement can be performed at any time, namely the one in the currently
active channel. However, to perform the configured measurements consecutively, a
Sequencer function is provided.
If activated, the measurements configured in the currently defined "Channel" s are performed one after the other in the order of the tabs. The currently active measurement is
indicated by a
The result displays of the individual channels are updated in the tabs (as well as the
"MultiView" ) as the measurements are performed. Sequential operation itself is independent of the currently displayed tab.
For details on the Sequencer function, see the R&S FPS user manual.
symbol in the tab label.
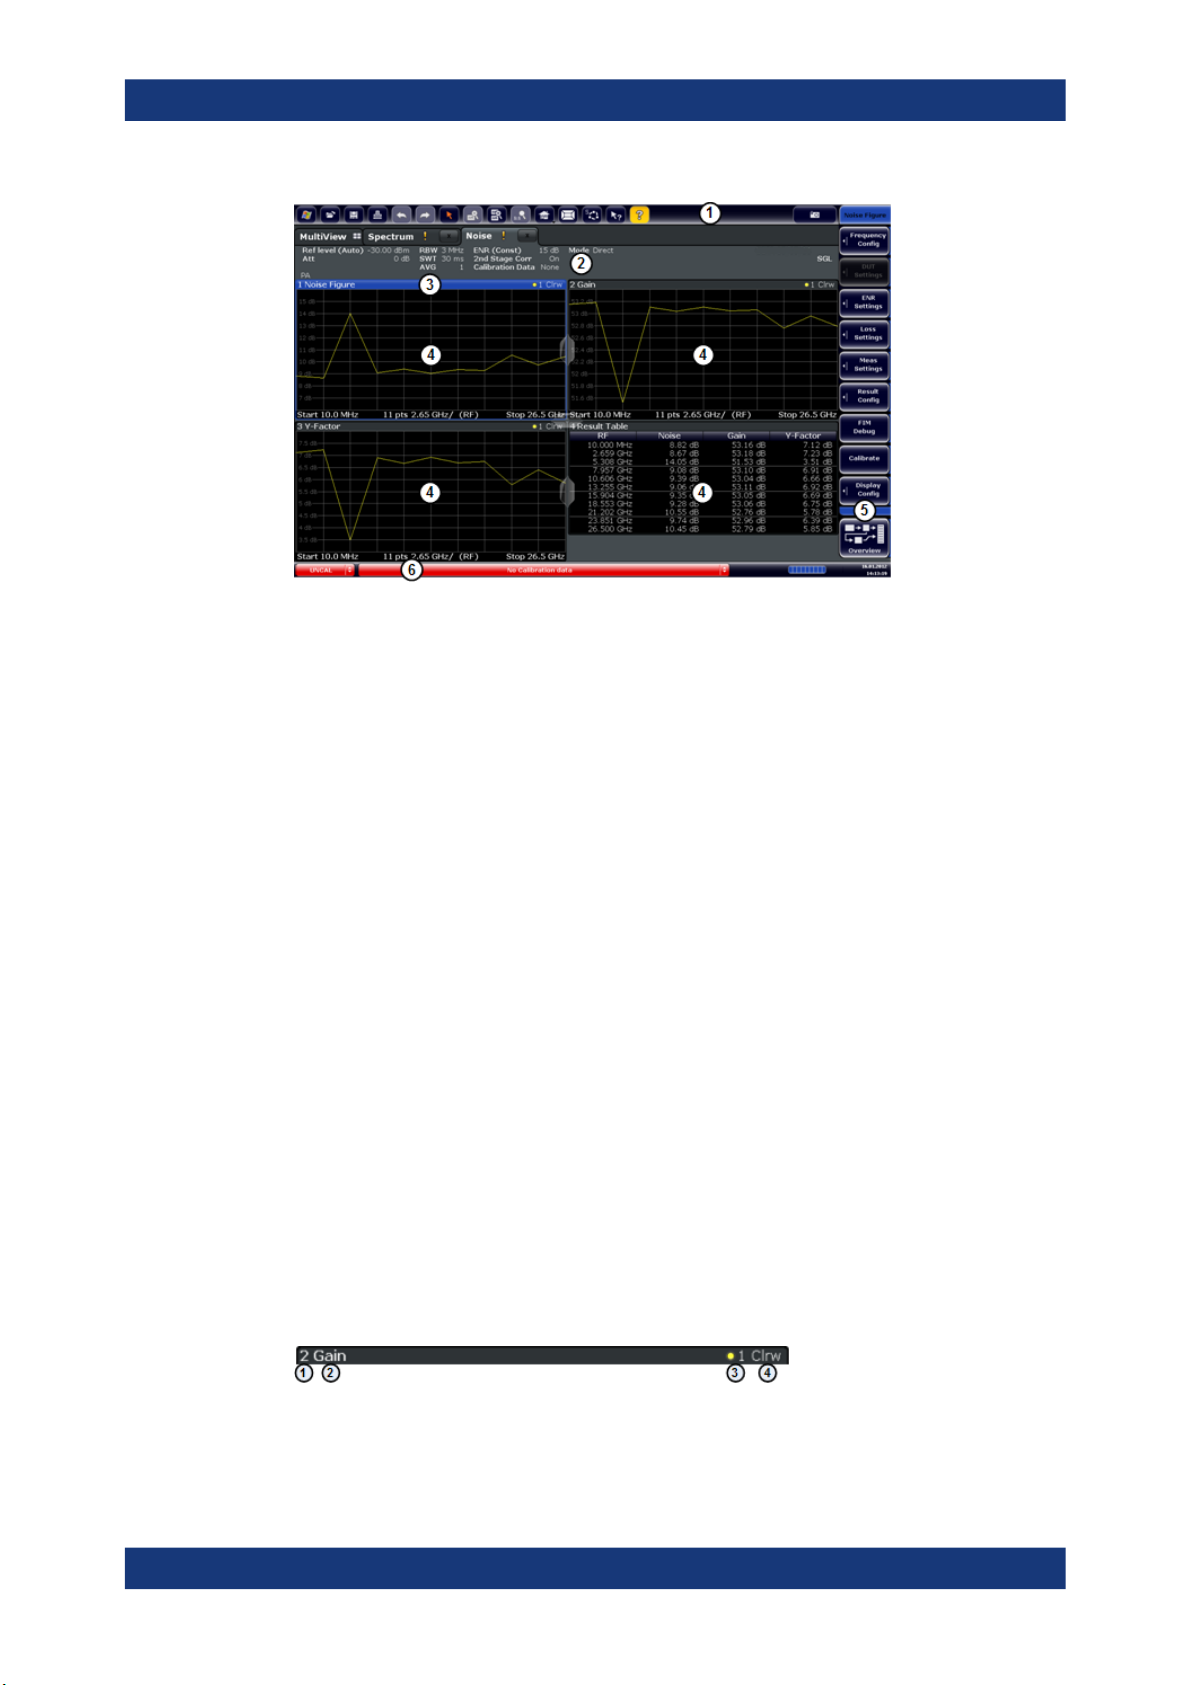
2.2 Understanding the Display Information
The following figure shows the display as it looks for noise figure measurements. All
different information areas are labeled. They are explained in more detail in the following sections.
9User Manual 1176.8497.02 ─ 04
Page 10
R&S®FPS-K30
Welcome to the Noise Figure Measurement Application
Understanding the Display Information
Figure 2-1: Screen layout of the noise figure measurement application
1 = Toolbar
2 = Channel bar
3 = Diagram header
4 = Result display
5 = Softkey bar
6 = Status bar
Channel bar information
In the R&S FPS Noise Figure measurements application, the R&S FPS shows the following settings:
Ref Level Reference level of the R&S FPS.
Att Attenuation of the R&S FPS.
RBW Resolution bandwidth
SWT Sweep time
AVG Number of averages
ENR Excess noise ratio
2nd Stage Corr State of the 2nd stage correction.
Calibration Data Date and time of the current calibration data.
Mode Currently selected measurement mode.
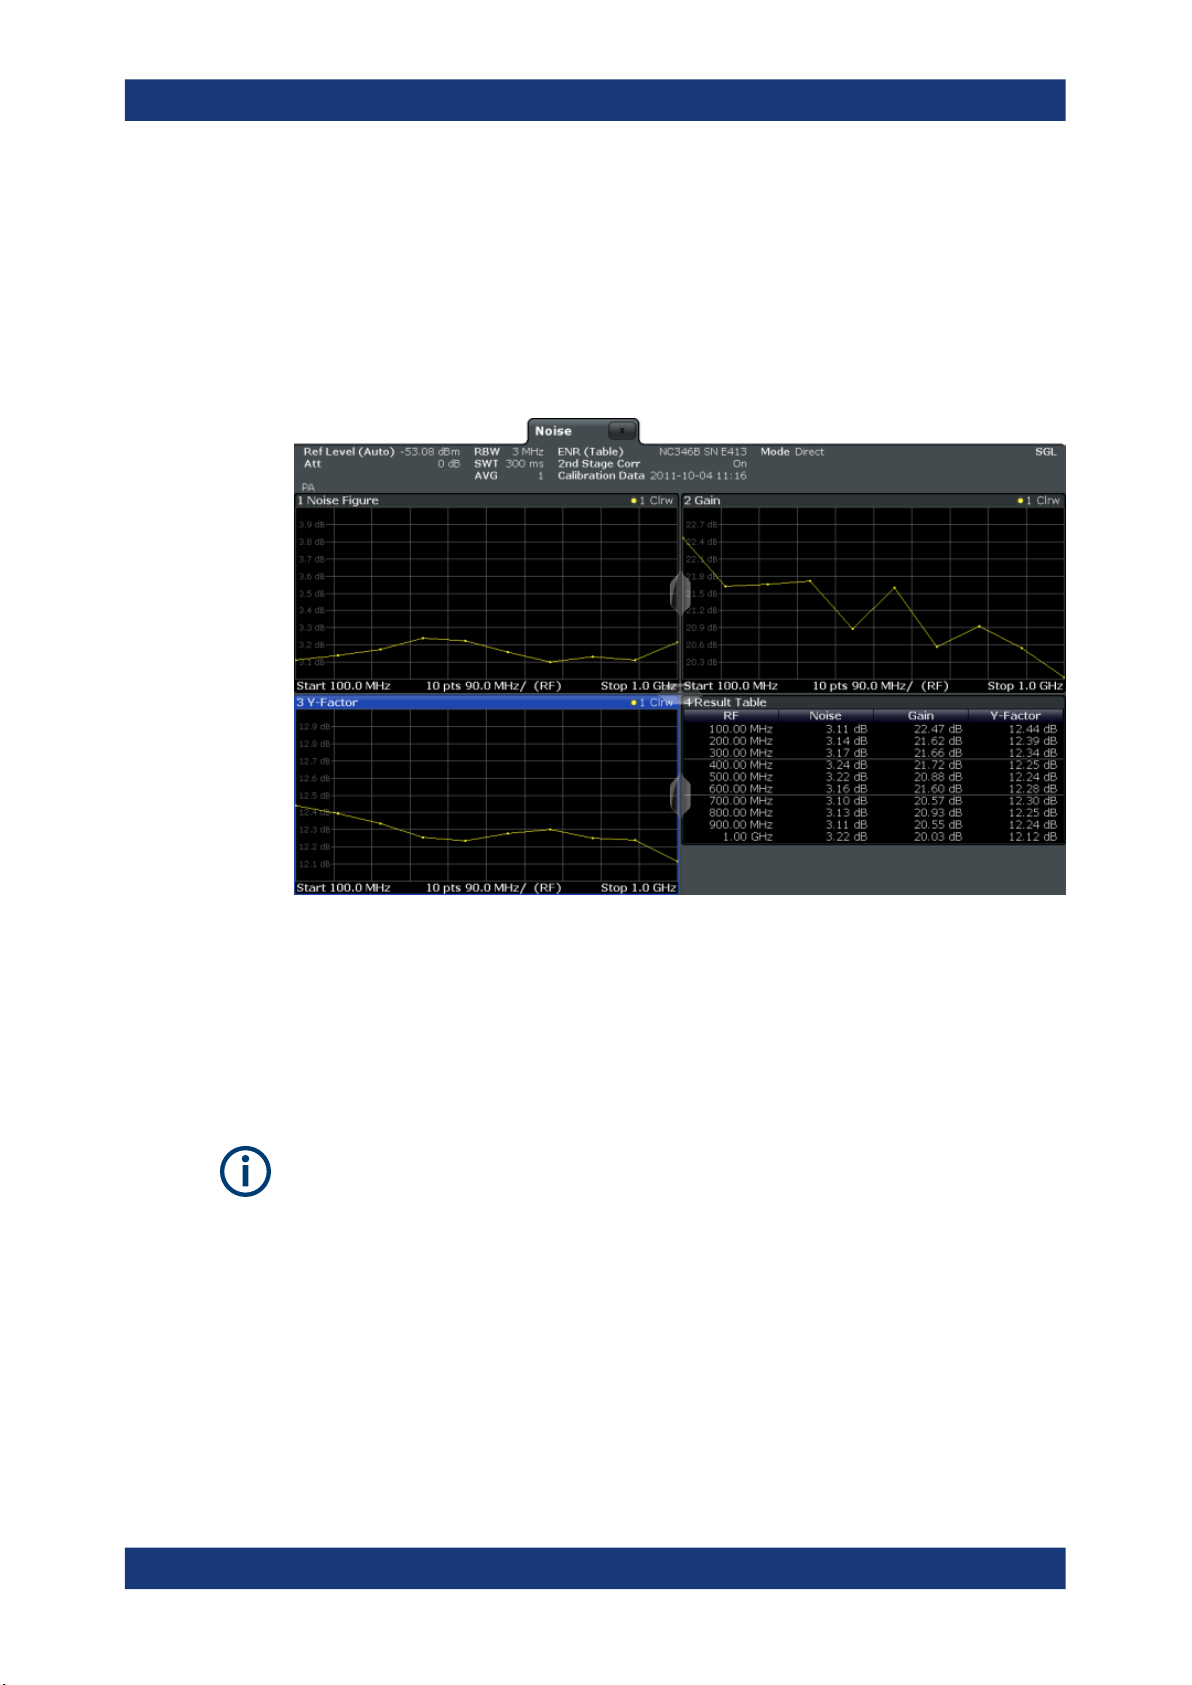
Window title bar information
For each diagram, the header provides the following information:
Figure 2-2: Window title bar information for the R&S FPS Noise Figure measurements application
10User Manual 1176.8497.02 ─ 04
Page 11

R&S®FPS-K30
Welcome to the Noise Figure Measurement Application
Understanding the Display Information
1 = Window number
2 = Window type
3 = Trace color and number
4 = Trace mode
Status bar information
Global instrument settings, the instrument status and any irregularities are indicated in
the status bar beneath the diagram. Furthermore, the progress of the current operation
is displayed in the status bar.
Risk of damaging the instrument
Make sure not to overload the input mixer during calibration and the measurement. An
overload condition can damage or destroy the input mixer.
If an overload condition occurs, the R&S FPS shows a corresponding message in the
status line ("RF OVLD" or "IF OVLD").
To avoid an overload during calibration or measurement, do one or more of the following:
●
Check and adjust the DUT gain settings
●
Check and adjust the ENR settings
●
Increase the reference level.
11User Manual 1176.8497.02 ─ 04
Page 12
R&S®FPS-K30
3 Measurements and Result Displays
Measurements and Result Displays
The R&S FPS-K30 measures the noise figure of a DUT and displays the results graphically and numerically. Each graphical result display shows the noise figure from a different perspective. In the default configuration, the application shows the noise figure
of the DUT, the gain of the DUT and the corresponding y-factor. In addition, it shows
the numerical results of the measurement.
The scale of the horizontal axis depends on the tuning mode.
Frequency list and swept measurements
In all graphical result displays, the horizontal axis represents the frequency. The displayed frequency is either the RF (radio frequency) or the IF (intermediate frequency).
The range depends on the frequency set you have currently defined. Because the
application only measures selected frequencies, it connects the results to draw a trace.
Negative noise figure and noise temperature
From a physical point of view, the noise figure and the noise temperature levels have a
positive range (including zero).
Due to the mathematical operations the application performs, the results can be negative. Sometimes this happens due to incorrect calibration or variance of measurement
values.
Single frequency measurements
In all graphical result displays, the horizontal axis represents a chronological order of
measurement results for the frequency you are testing. The axis has no unit, but is
made up out of several index values that represent time. Each index value represents
12User Manual 1176.8497.02 ─ 04
Page 13

R&S®FPS-K30
out
in
SNR
SNR
Figure Noise
Measurements and Result Displays
one measurement point and therefore one measurement on the single frequency you
are analyzing. The size of the index (and thus number of results) depends on the number of (Measurement) Points that you have defined. Because the application only
measures at certain points in time, it connects the results to draw a trace.
The right diagram border represents the present (index = 0), values to the left represent past measurement results (index = -<x>). As soon as the application finishes a
single measurement, the measurement points are moved to the left, the new result is
added on the right. All other measurement points are moved down one position with
the most obsolete result falling out of the diagram (like in the roll mode of an oscilloscope).
Selecting the result display
►
Select the
icon in the toolbar or press the [MEAS] key.
The application enters the SmartGrid configuration mode.
For more information on the SmartGrid functionality, see the R&S FPS Getting
Started.
Noise Figure..................................................................................................................13
Gain...............................................................................................................................14
Noise Temperature........................................................................................................14
Y-Factor.........................................................................................................................15
ENR Measured..............................................................................................................16
Power (Hot)...................................................................................................................17
Power (Cold)................................................................................................................. 17
Cal Y-Factor.................................................................................................................. 18
Cal Power (Hot).............................................................................................................18
Cal Power (Cold)...........................................................................................................19
Result Table.................................................................................................................. 19
Current Values...............................................................................................................20
Marker Table................................................................................................................. 20
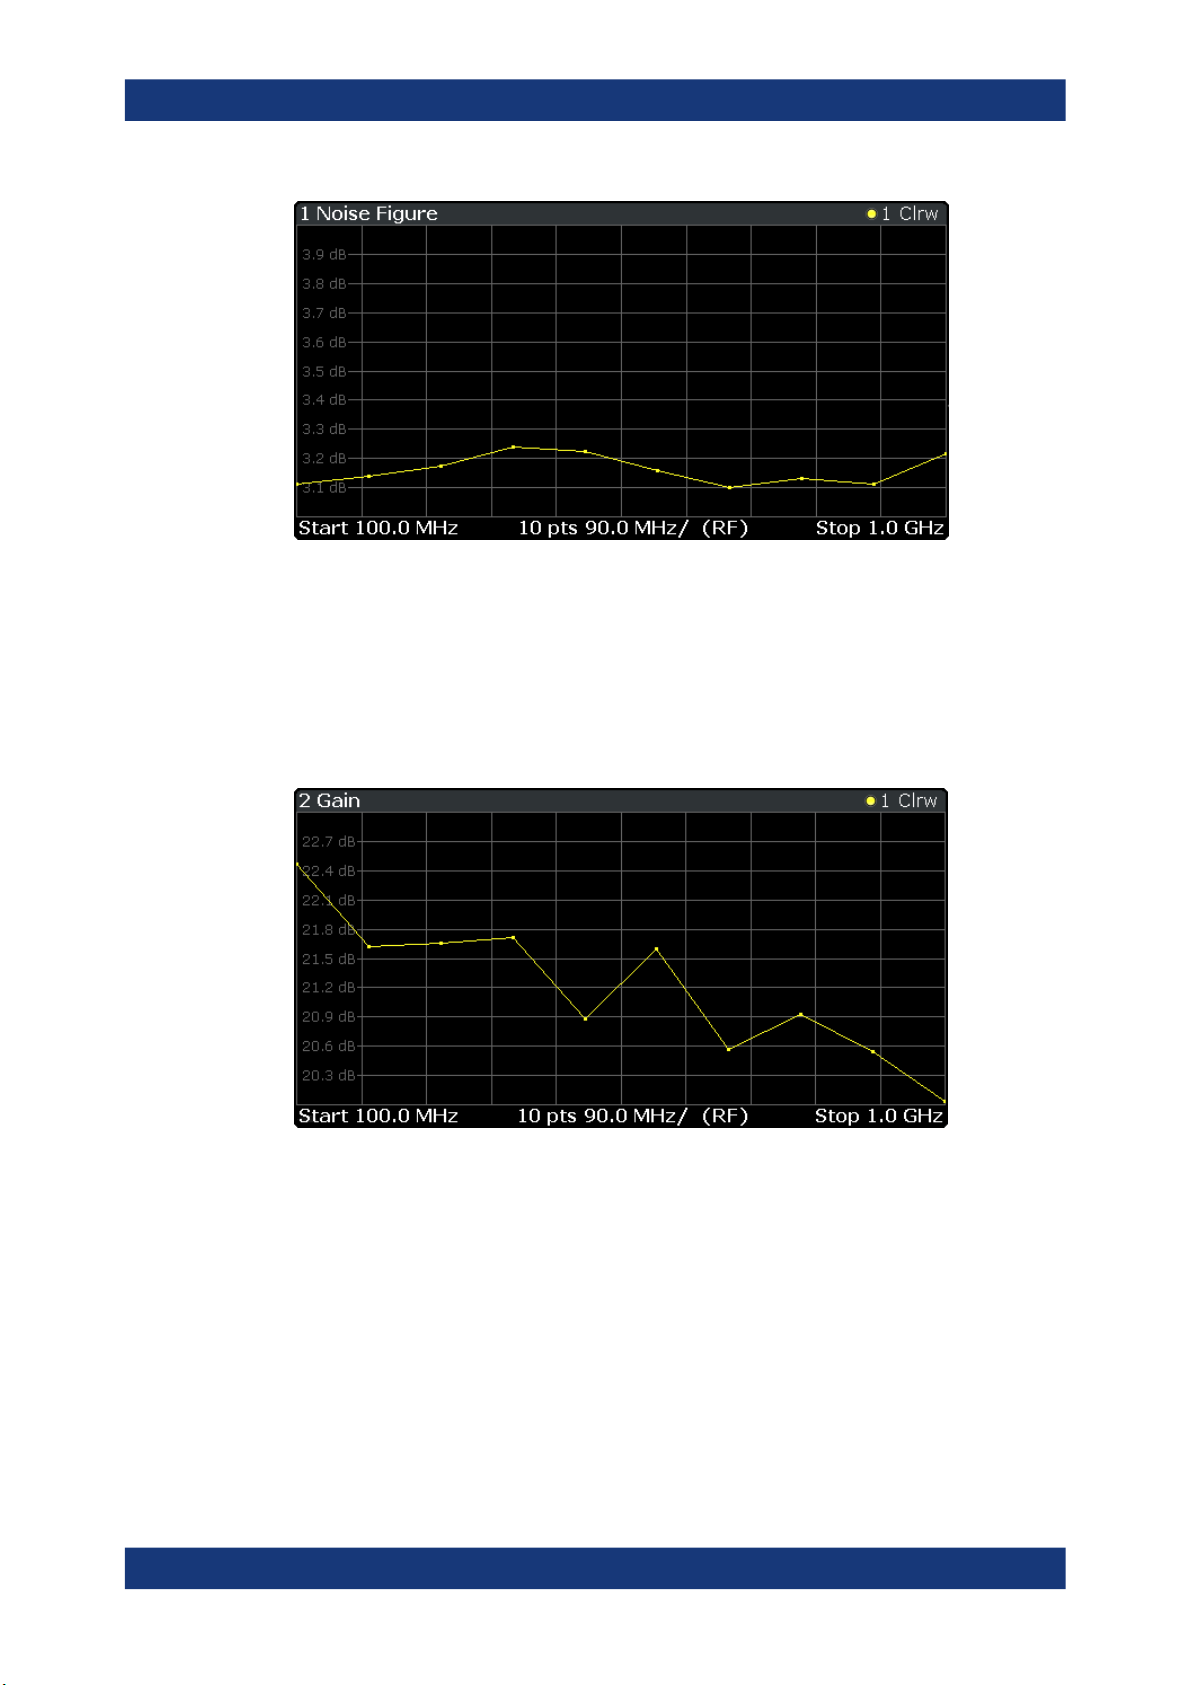
Noise Figure
Shows the noise figure of the DUT.
The noise figure is the ratio of the signal-to-noise ratio at the DUT input to the signal-
to-noise ratio at the DUT output.
The vertical axis shows the level of the noise figure in dB. The scale depends on the
settings in the "Display Configuration" dialog box.
13User Manual 1176.8497.02 ─ 04
Page 14
R&S®FPS-K30
Measurements and Result Displays
Remote command:
LAY:ADD:WIND? '2',RIGH,NOIS see LAYout:ADD[:WINDow]? on page 98
Results:TRACe<t>[:DATA]? <Trace>,NOISe
Gain
Shows the gain characteristics of the DUT.
The vertical axis shows the level of the gain in dB. The scale depends on the settings
in the "Display Configuration" dialog box.
Remote command:
LAY:ADD:WIND? '2',RIGH,GAIN see LAYout:ADD[:WINDow]? on page 98
Results:TRACe<t>[:DATA]? <Trace>,GAIN
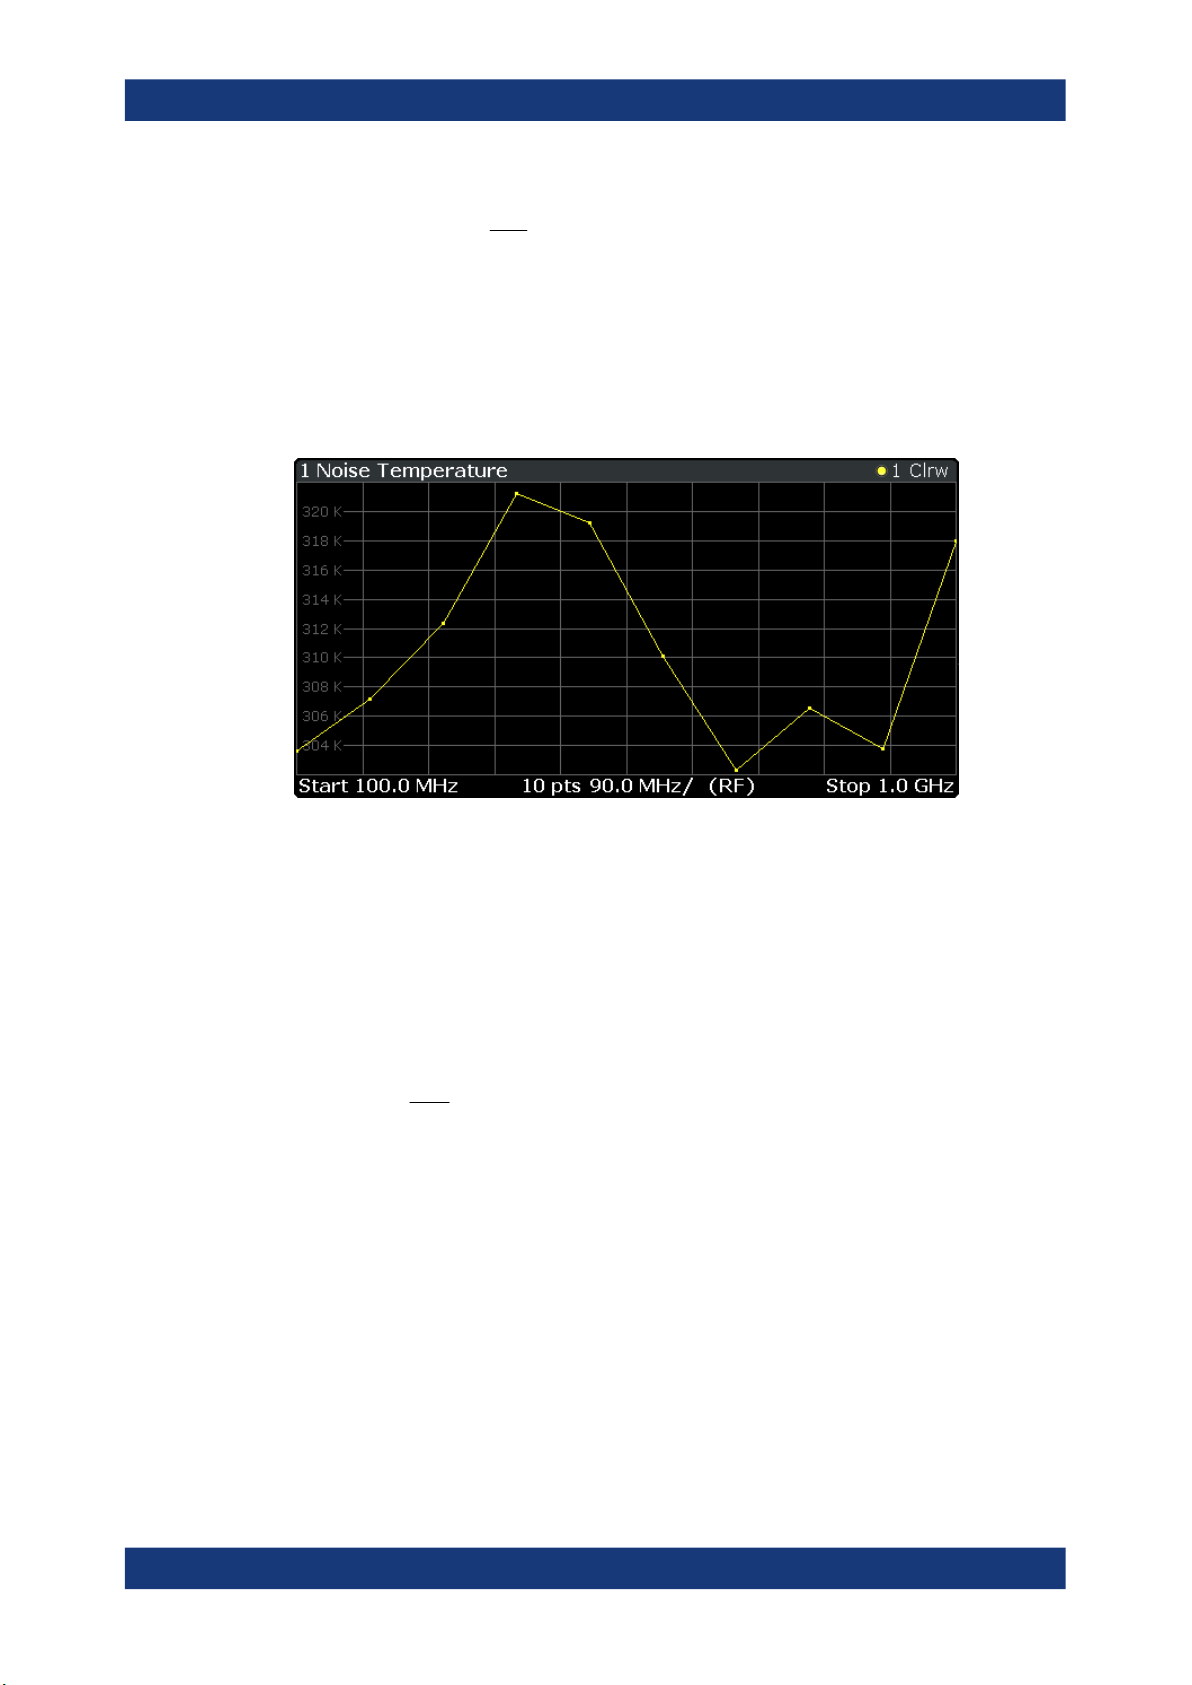
Noise Temperature
Shows the noise temperature characteristics of the DUT.
14User Manual 1176.8497.02 ─ 04
Page 15
R&S®FPS-K30
constant Boltzmannk
BandwidthB
PowerP
with
eTemperatur Noise
kB
P
off source noise with[dB] power Noise
on source noise with[dB] power Noise
with
FactorY
off
on
off
on
N
N
N
N
Measurements and Result Displays
The vertical axis shows the noise temperature in Kelvin. The scale depends on the settings in the "Display Configuration" dialog box.
Remote command:
LAY:ADD:WIND? '2',RIGH,TEMP see LAYout:ADD[:WINDow]? on page 98
Results: TRACe<t>[:DATA]? <Trace>,TEMPerature
Y-Factor
Shows the ratio of the hot and the cold power of the DUT.
The Y-factor indicates the quality of measurement tolerances and uncertainties. To get
the result, the application measures the DUT power with the noise source turned on
(hot power) and the noise source turned off (cold power).
The vertical axis shows the linear relation. The scale depends on the settings in the
"Display Configuration" dialog box.
15User Manual 1176.8497.02 ─ 04
Page 16

R&S®FPS-K30
Measurements and Result Displays
Remote command:
LAY:ADD:WIND? '2',RIGH,YFAC see LAYout:ADD[:WINDow]? on page 98
Results: TRACe<t>[:DATA]? <Trace>,YFACtor
ENR Measured
Shows the results of the ENR measurement.
To measure the ENR of a noise source, first attach a noise source with known ENR to
the device, enter the ENR of this noise source to the calibration ENR table and calibrate using this one. Then, attach the unknown noise source to the device and perform
a measurement ("Run Single") with this one. The graph shown in the ENR Measured
display and the results for ENR Measured in the Result Summary will be the ENR of
the noise source at the measured frequencies. The vertical axis shows the level of the
measured ENR in dB. The scale depends on the settings in the "Display Configuration"
dialog box.
16User Manual 1176.8497.02 ─ 04
Page 17

R&S®FPS-K30
Measurements and Result Displays
Remote command:
LAY:ADD:WIND? '2',RIGH,ENR see LAYout:ADD[:WINDow]? on page 98
Results: TRACe<t>[:DATA]? <Trace>,ENR
Power (Hot)
Shows the absolute power characteristics at the instrument input. The noise source is
turned on.
The vertical axis shows the power in dBm. The scale depends on the settings in the
"Display Configuration" dialog box.
Remote command:
LAY:ADD:WIND? '2',RIGH,PHOT see LAYout:ADD[:WINDow]? on page 98
Results: TRACe<t>[:DATA]? <Trace>,PHOT
Power (Cold)
Shows the absolute power characteristics at the instrument input. The noise source is
turned off.
The vertical axis shows the power in dBm. The scale depends on the settings in the
"Display Configuration" dialog box.
17User Manual 1176.8497.02 ─ 04
Page 18
R&S®FPS-K30
off source noise with[dB] power Noise
on source noise with[dB] power Noise
with
FactorY
off
on
off
on
N
N
N
N
Measurements and Result Displays
Remote command:
LAY:ADD:WIND? '2',RIGH,PCOL see LAYout:ADD[:WINDow]? on page 98
Results: TRACe<t>[:DATA]? <Trace>,PCOLd
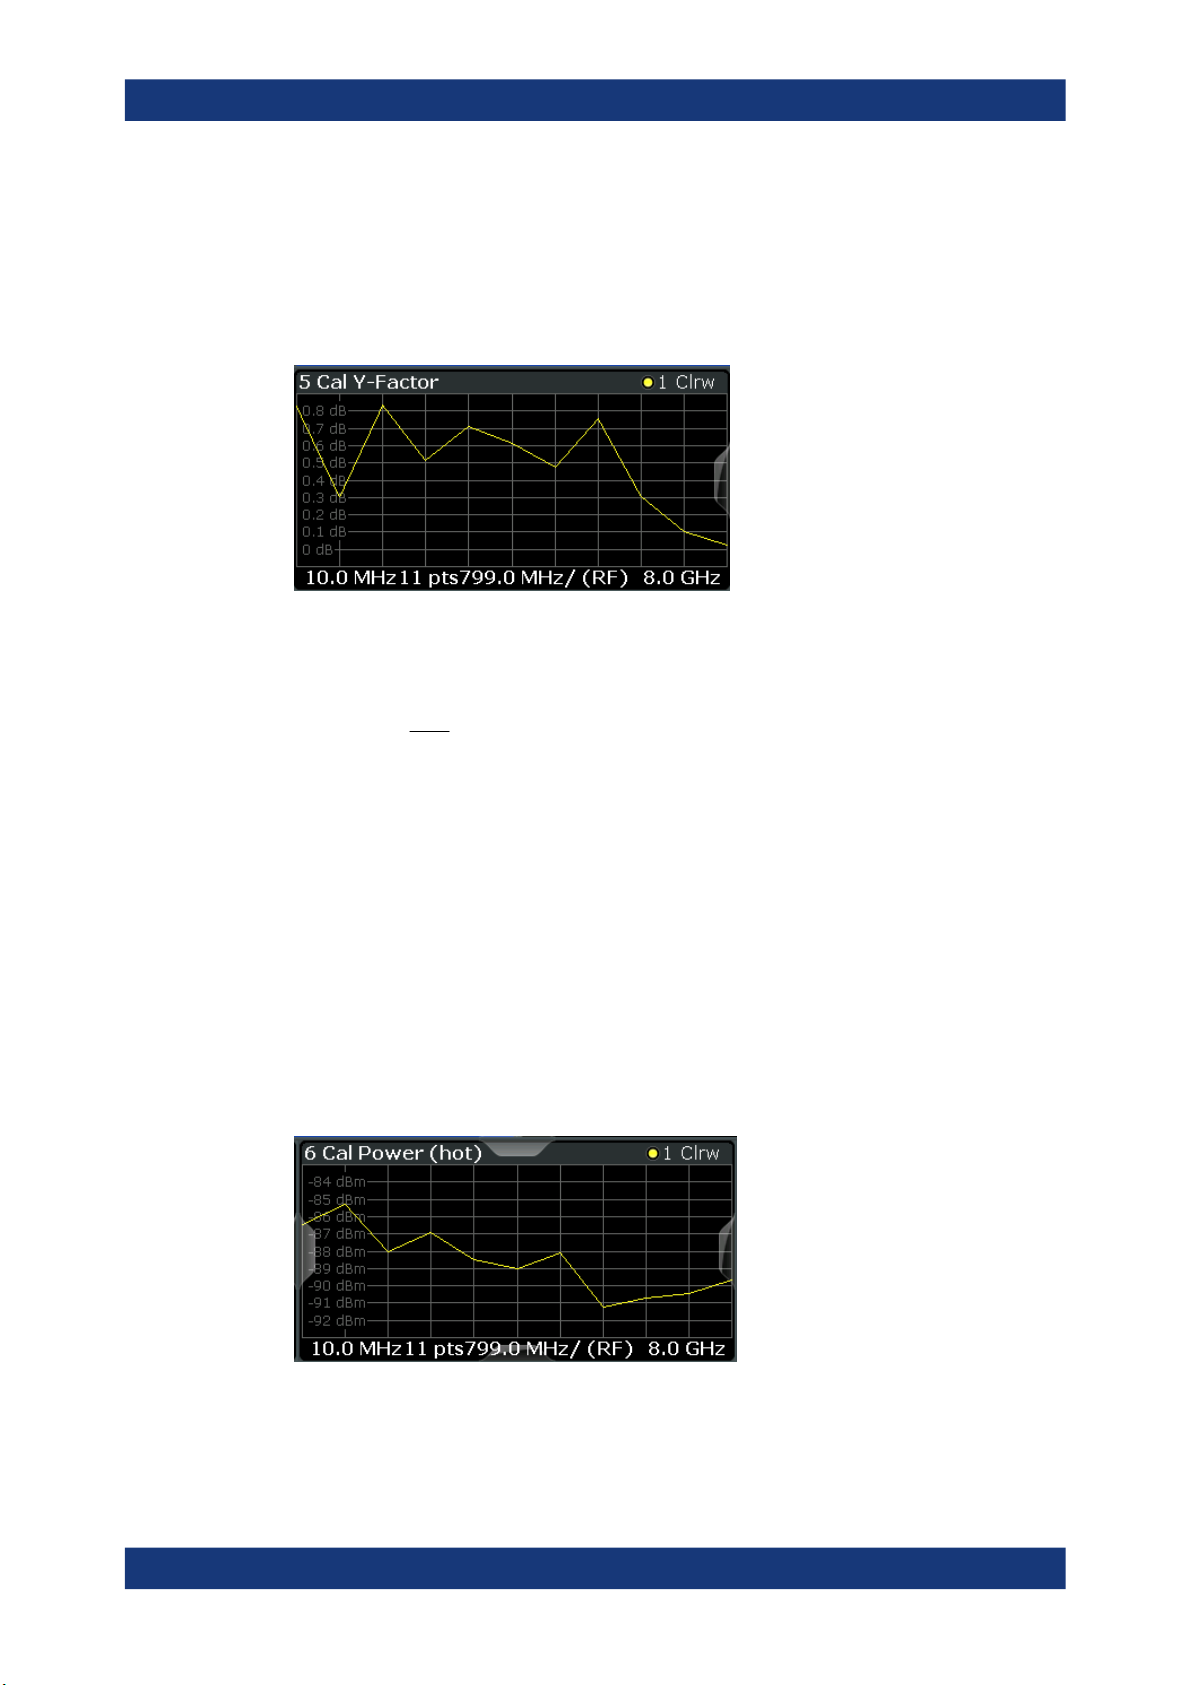
Cal Y-Factor
Shows the ratio of the hot and the cold power measured during calibration.
The Y-factor indicates the quality of measurement tolerances and uncertainties. To get
the result, the application measures the power with the noise source turned on (hot
power) and the noise source turned off (cold power), but without the DUT inserted.
The vertical axis shows the linear relation. The scale depends on the settings in the
"Display Configuration" dialog box.
Remote command:
LAY:ADD:WIND? '2',RIGH,CYF see LAYout:ADD[:WINDow]? on page 98
Results: TRACe<t>[:DATA]? <Trace>,CYFactor
Cal Power (Hot)
Shows the absolute power characteristics at the instrument input during the calibration
measurement. The noise source is turned on, the DUT is not inserted.
The vertical axis shows the power in dBm. The scale depends on the settings in the
"Display Configuration" dialog box.
18User Manual 1176.8497.02 ─ 04
Page 19

R&S®FPS-K30
Measurements and Result Displays
Remote command:
LAY:ADD:WIND? '2',RIGH,CPH see LAYout:ADD[:WINDow]? on page 98
Results: TRACe<t>[:DATA]? <Trace>,CPHot
Cal Power (Cold)
Shows the absolute power characteristics at the instrument input during the calibration
measurement. The noise source is turned off, the DUT is not inserted.
The vertical axis shows the power in dBm. The scale depends on the settings in the
"Display Configuration" dialog box.
Remote command:
LAY:ADD:WIND? '2',RIGH,CPC see LAYout:ADD[:WINDow]? on page 98
Results: TRACe<t>[:DATA]? <Trace>,CPCold
Result Table
Shows the measurement results in numerical form in a table.
The contents of the table depend on the "Display Settings". By default it shows the
noise figure, gain and y-factor results. Each row represents one measurement point.
Each column represents one result type. The first column shows the measurement frequency.
If you display the uncertainty result, it is displayed in the "Noise" column next to the
Noise Figure result. Note that the uncertainty is displayed only after you have turned
on the uncertainty calculation and also include the result in the display.
The result table shows either the RF or the IF, depending on your selection.
For more information, see Chapter 6.1.2, "Configuring Numerical Results",
on page 76.
Remote command:
LAY:ADD:WIND? '2',RIGH,RES see LAYout:ADD[:WINDow]? on page 98
Results: TRACe<n>[:DATA]? on page 105
Table items: DISPlay[:WINDow<n>]:TABLe:ITEM on page 151
19User Manual 1176.8497.02 ─ 04
Page 20
R&S®FPS-K30
Measurements and Result Displays
Current Values
Shows the result at the current measurement point.
The contents of the "Current" result display are updated as soon as a new measure-
ment point is analyzed.
The result types shown in the table depend on the "Display Settings". By default it
shows the results for the Noise Figure, Gain and Y-Factor result type. Each row represents one result type. The first column shows the result type, the second column
shows the result.
For more information, see Chapter 6.1.2, "Configuring Numerical Results",
on page 76.
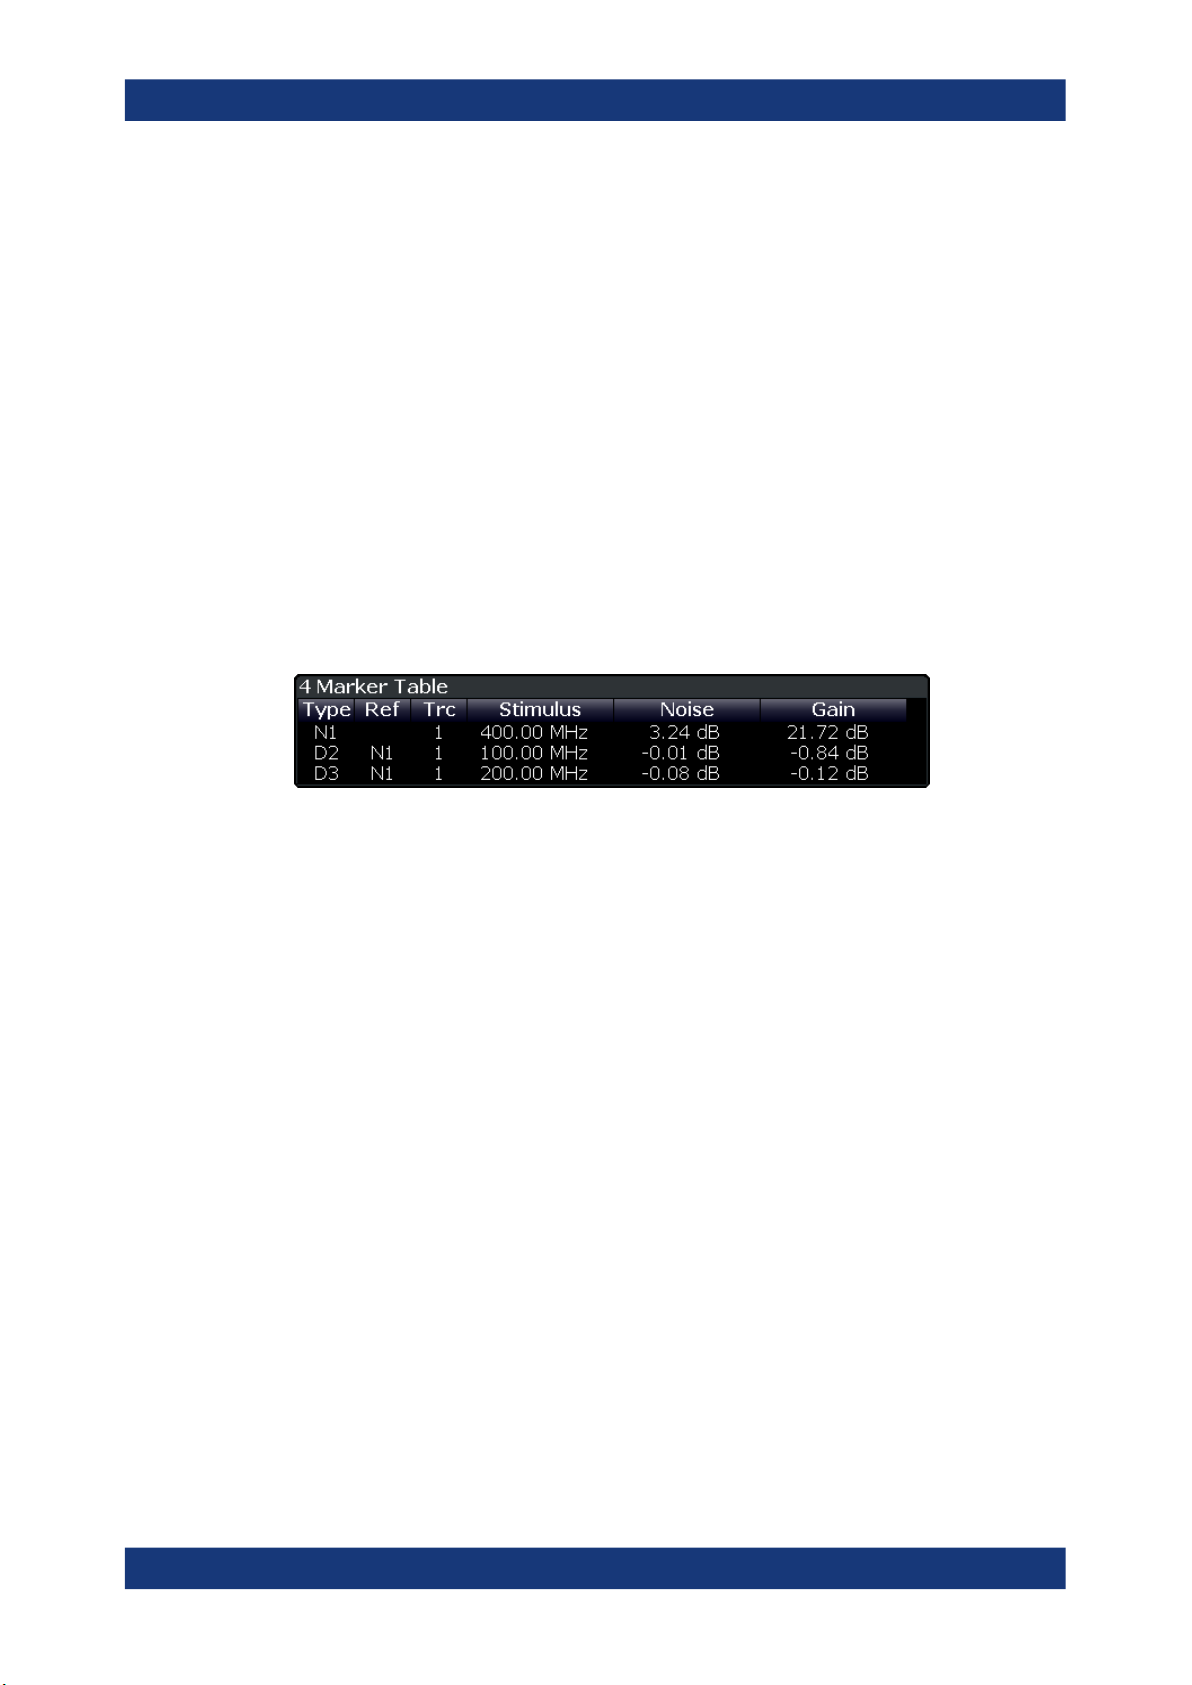
Marker Table
Shows the marker characteristics in numerical form in a table.
The size of the table depends on the number of active markers and the way you have
configured the table in the "Result Config" dialog box. For more information, see Chap-
ter 6.3, "Using Markers", on page 79 and Chapter 6.1.2, "Configuring Numerical
Results", on page 76.
The first four columns of the table are fix.
●
Type
Shows the marker type. 'M' represents a normal marker, 'D' represents a delta
marker.
●
Ref
Shows the reference marker for relative delta markers.
●
Trc
Shows the trace that the marker is positioned on.
●
X-value
Shows the horizontal position (frequency) of the marker.
For normal markers, the position is an absolute value. The position of delta markers is relative to another marker.
●
<Result>
Shows the measurement result at the marker position.
For normal markers, the result is an absolute value. Results for delta markers are
relative to another marker.
Remote command:
LAY:ADD:WIND? '2',RIGH,MTAB see LAYout:ADD[:WINDow]? on page 98
Results:
CALCulate<n>:MARKer<m>:Y? on page 171
CALCulate<n>:DELTamarker<m>:Y? on page 174
20User Manual 1176.8497.02 ─ 04
Page 21
R&S®FPS-K30
4 Measurement Basics
Measurement Basics
Tuning Modes
The measurement basics contain background information on the terminology and principles of noise figure measurements.
Noise figure measurements determine the noise that a device under test (DUT) adds to
a signal as that signal passes through the DUT.
● Tuning Modes......................................................................................................... 21
● Measurement Modes.............................................................................................. 23
● DUT Types..............................................................................................................25
● External Generator Control..................................................................................... 26
● Image Frequency Rejection.................................................................................... 28
● Calibration (2nd Stage Correction)..........................................................................30
● Separating Signals by Selecting an Appropriate Resolution Bandwidth.................33
● Analyzing Several Traces - Trace Mode................................................................. 34
● Using Markers.........................................................................................................35
4.1 Tuning Modes
Basically, the application calculates the noise figure of a DUT based on the characteristics of the DUT that have been measured and a noise source whose properties are
known. Therefore, the Noise Source Control connector on the R&S FPS is a prerequisite for the R&S FPS Noise Figure measurements application.
In addition to the noise characteristics of a DUT, the application is also able to determine several more DUT characteristics like its gain or its noise temperature characteristics.
Noise
source +28V
Noise
Source
The application provides several measurement modes or tuning modes.
● Swept Measurements............................................................................................. 22
● Frequency Table Measurements.............................................................................22
● Single Frequency Measurements........................................................................... 22
RF Input
DUT
21User Manual 1176.8497.02 ─ 04
Page 22

R&S®FPS-K30
4.1.1 Swept Measurements
Measurement Basics
Tuning Modes
The sweep tuning mode performs measurements on a set of discrete frequencies
based on the frequency parameters. Each measurement analyzes the noise characteristics of the corresponding frequency or measurement point.
For swept measurements, the application automatically determines the measurement
frequencies and combines them in a frequency list.
Such a frequency set is the result of the frequency and span information that you have
provided. The frequency and span information is made up out of the center frequency,
the span, the start and the stop frequency. In combination with the measurement points
or the frequency table step size, the application calculates the contents of the frequency table.
The center frequency is the frequency in the center of the frequency band you are
measuring. Thus, it is defined either by the span, or the start and stop frequencies.
The measurement points is the number of entries in a frequency list and thus the
number of measurements that the application performs during a noise figure measurement.
The stepsize defines the distance between two measurement points. It is constant for
all measurement points.
If the stepsize is larger than the distance between start and stop frequency, the frequency table consists of the start and stop frequencies only.
4.1.2 Frequency Table Measurements
The frequency table tuning mode also performs measurements on a set of frequencies based on the contents of a frequency list. Each measurement analyzes the noise
characteristics of the corresponding frequency.
Compared to a swept measurement, you can customize the contents of the frequency
list. Thus, you can add frequencies that are independent of the frequency stepsize and
the number of measurement points.
4.1.3 Single Frequency Measurements
The single frequency tuning mode performs one or several consecutive measurements on a single frequency. You can perform the measurement on any frequency that
is supported by the hardware you are using.
Single frequency measurements are a way to facilitate manual adjustments for noise
figure measurements. They also allow you to get an idea about how the noise figure at
a particular frequency change over time.
Note that sweep lists or frequency tables are not considered in this measurement
mode.
22User Manual 1176.8497.02 ─ 04
Page 23

R&S®FPS-K30
4.2 Measurement Modes
Measurement Basics
Measurement Modes
Single frequency measurement results
For single frequency measurements, the same set of graphical result displays is available as for frequency list measurements (Noise Figure, Gain etc.). Note, however, that
the x-axis has no unit, but shows a series of results taken for a single frequency. The
number of displayed results depends on the number of measurement points you have
defined.
For more information, see Chapter 3, "Measurements and Result Displays",
on page 12.
In addition, you can also view the results in the Result Table in numerical form.
Single frequency measurements are not available when you are using a resistor as a
noise source.
In some cases, the Power (Hot) and Power (Cold) results require two different noise
sources with different temperature characteristics (cold and hot). Measurements with a
resistor noise source are such a case.
Usually, noise sources with diode characteristics are used for Noise Figure measurements. These noise sources have two states, on and off. When they are supplied with
power (state = on), the application measures the hot power, when they are not supplied
with power (state = off), it measures the cold power. Turning the noise source on and
off is automatically done by the application, so that you can get the hot and cold power
characteristics in a single step.
This automatic measurement mode is the default measurement mode of the R&S
FPS Noise Figure measurements application.
A resistor noise source, however, requires two resistors, one hot and one cold. You
have to substitute the hot resistor by the cold resistor to measure first the hot and then
the cold power. For these cases, the application provides a manual measurement
mode. This measurement mode is automatically selected when you select a "Noise
Source" on page 48 with resistor characteristics, but is not restricted to those cases.
The manual measurement mode is available for measurements and the calibration
stage.
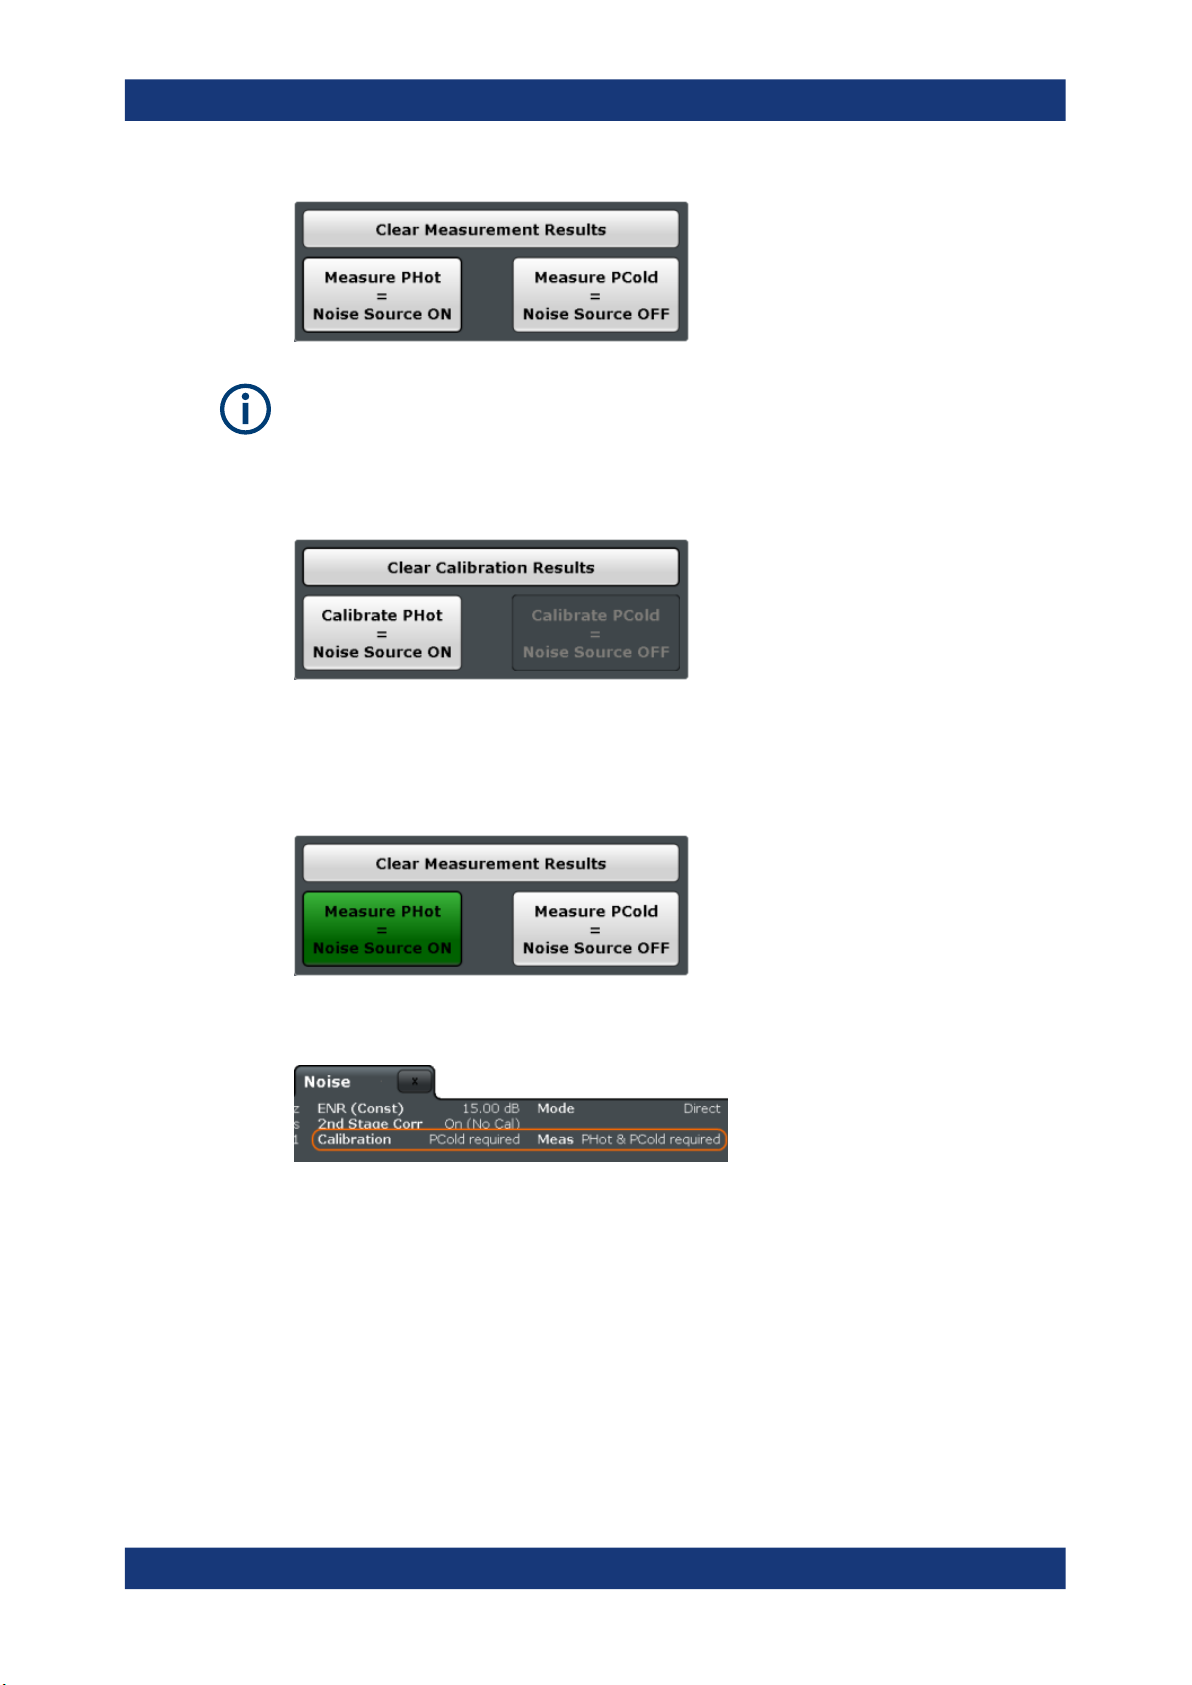
Performing a manual measurement
In manual measurement mode, you have to measure (or calibrate) the hot and cold
power characteristics of the DUT separately. When you start the measurement, the
application opens a dialog box that allows you to select the type of measurement to
perform next.
23User Manual 1176.8497.02 ─ 04
Page 24
R&S®FPS-K30
Measurement Basics
Measurement Modes
Recommended order of measurements
Note that it is recommended that you begin with the hot power measurement.
Furthermore, calibration always begins with the hot power measurement.
In case the hot power has to be measured first, the cold power measurement is
unavailable:
When the first measurement is done, you can change the test setup by connecting the
other resistor. Then start the second measurement.
In the dialog box, the measurement stage that is already done is labeled green.
In addition, the application shows the missing calibration and measurement steps in
the channel bar.
Clearing results
To replace the previous calibration or measurement results, clear the currently stored
data using the "Clear Calibration Results" or "Clear Measurement Results" function.
24User Manual 1176.8497.02 ─ 04
Page 25
R&S®FPS-K30
4.3 DUT Types
Measurement Basics
DUT Types
Returning to automatic measurement mode
When you are in automatic measurement mode and select a noise source with resistor
characteristics, the application automatically selects the manual measurement mode.
When you are in manual measurement mode and select a noise source with diode
characteristics, you have to select the automatic measurement mode deliberately in
the "Sweep" menu.
Noise figure measurements are possible on DUTs with a wide variety of characteristics.
The DUT characteristics not only affect the test setup, but also determine the way the
application populates the frequency list for swept measurements.
The R&S FPS Noise Figure measurements application supports measurements on
DUTs that work on a fixed frequency as well as measurements on frequency-converting DUTs.
● Measurements on Linear DUTs (Direct Measurement)...........................................25
● Measurements on Frequency Converting DUTs..................................................... 25
4.3.1 Measurements on Linear DUTs (Direct Measurement)
For a linear DUT, the RF frequency remains the same between its input and output.
For measurements on such DUTs, it is sufficient to measure the signal's RF frequency
without any additional equipment (like a local oscillator). A typical linear DUT is an
amplifier, for example.
The test setup for measurements on such DUTs usually consists of the noise source,
the DUT and an analyzer. If necessary, the measurement also considers loss that
occurs somewhere in the measurement path.
For linear DUTs, the contents and layout of the "Overview" dialog box represents the
configuration of a typical test setup.
4.3.2 Measurements on Frequency Converting DUTs
A frequency converting DUT converts the RF frequency to an intermediate frequency
(IF) using the local oscillator (LO). A frequency-converting DUT either converts the RF
frequency to a lower IF (down-conversion) or a higher IF (up-conversion).
The conversion process requires a local oscillator in the test setup. You can generate
the LO signal in two ways.
●
An external generator controlled by the analyzer via IEC bus.
25User Manual 1176.8497.02 ─ 04
Page 26

R&S®FPS-K30
Measurement Basics
External Generator Control
●
A VCO controlled by a voltage source.
If you have selected a frequency-converting DUT measurement mode, the layout of the
"Overview" dialog box adds the local oscillator to the test setup.
The local oscillator can have a fixed or a variable frequency. If the LO frequency is
fixed, the intermediate frequency (IF) resulting from the conversion process is variable
(depending on the input signal). If the LO frequency is variable, the IF has to be fixed.
The R&S FPS Noise Figure measurements application provides measurement for both
measurement scenarios.
Fixed intermediate frequency
If you select one of the fixed IF measurement modes, the IF is the same for all entries
in the frequency list. The LO frequency for each entry is variable and is the result of the
equation the selected mode is based on.
●
fRF - fIF for up-converters
●
fRF + fIF for down-converters
The fixed IF measurement modes are, for example, useful for measurements on mixers.
Note that fixed IF measurements are only possible if the R&S FPS is equipped with the
optional External Generator Control hardware. For more information, see Chapter 4.4,
"External Generator Control", on page 26.
Fixed LO frequency
If you select one of the fixed LO measurement modes, the LO frequency is the same
for all entries in the frequency list. The IF frequency for each entry is variable and is the
result of the equation the selected mode is based on.
●
fRF + fLO for up-converters
●
fRF - fLO for down-converters
The fixed LO measurement modes are, for example, required for measurements on
satellite converters.
4.4 External Generator Control
To perform fixed IF measurements with the R&S FPS Noise Figure measurements
application, you have to install the optional External Generator Control hardware. This
option allows you to control an external generator and the type of signal it generates.
26User Manual 1176.8497.02 ─ 04
Page 27

R&S®FPS-K30
Measurement Basics
External Generator Control
The typical measurement setup for such measurements includes the R&S FPS equipped with the optional R&S FPS Noise Figure measurements application, a signal generator and the DUT. The signal generator is controlled via the LAN connection.
To enhance the measurement accuracy, it is recommended to use a common reference frequency for both R&S FPS and signal generator in the measurement setup.
If you have no 10 MHz reference frequency on hand, you can use the internal reference signal of the R&S FPS or signal generator. For more information, see the documentation of the R&S FPS or the signal generator.
Signal generator support
The R&S FPS-B10 supports various signal generators. A list is available in the user
interface (see Generator Type ) and in the documentation of the R&S FPS.
Note that you have to select the generator specifically for the R&S FPS Noise Figure
measurements application. It does not inherit the generator settings from other applications.
It is also possible to add new signal generators to that list. To do so, you have to copy
a custom signal generator setup file with the file extension .gen to the R&S FPS. The
setup file defines the frequency and power ranges supported by the generator, as well
as information required for communication. You can use a setup file of the signal generators already supported as a template. After you copy it to the R&S FPS, the new
generator model is added to the dropdown menu.
The existing setup files can be displayed in an editor in read-only mode directly from
the Interface Configuration dialog box.
Make sure to adhere to the required syntax and commands and only change the values of the parameters. Errors are only detected and displayed when you try to use the
custom generator.
Error and status messages
The following status and error messages can occur during external generator control.
Message Description
"Ext. Generator TCPIP Handshake Error!" / Connection to the generator is not possible, e.g. due to a
cable damage or loose connection or wrong address.
"Ext. Generator Limits Exceeded!" The allowed frequency or power ranges for the generator
were exceeded.
"Reverse Sweep via min. Ext. Generator Frequency!"
"Ext. Generator File Syntax Error!" Syntax error in the generator setup file.
"Ext. Generator Command Error!" Missing or wrong command in the generator setup file.
"Ext. Generator Visa Error!!" Error with Visa driver provided with installation (very
Reverse sweep is performed; frequencies are reduced to
the minimum frequency, then increased again.
unlikely).
27User Manual 1176.8497.02 ─ 04
Page 28
R&S®FPS-K30
Measurement Basics
Image Frequency Rejection
Risk of damage to the instrument
To allow for highest sensitivity during the measurement, the R&S FPS Noise Figure
measurements application automatically sets the input attenuation to 0 dB.
Because this configuration minimizes the overrange reserve, make sure that the signal
you apply does not cause an overload condition. In particular, consider the LO feedthrough. An overload condition can damage or destroy the input mixer.
The R&S FPS shows a corresponding message in the status line if an overload occurs
("RF OVLD" or "IF OVLD").
To avoid an overload, do one of the following:
●
Reduce the LO feedthrough of the mixer device.
●
Increase the reference level.
4.5 Image Frequency Rejection
Frequency converting DUTs convert a radio frequency (RF) to an intermediate frequency (IF). The IF is lower than the RF for down-converting DUTs, and higher than
the RF for up-converting DUTs.
In a basic test setup, the image frequency of the RF signal is also converted to the IF.
Depending on the DUT, this effect can be wanted or even necessary, or not. To avoid
measurement errors of the noise figure and gain of up to 3 dB, make sure to use the
appropriate measurement configuration.
Basically, you can distinguish between single sideband (SSB) mixers, double sideband
(DSB) mixers, and mixers that partly suppress a sideband. If a sideband is not needed
or only partly needed, you can reject the image frequency. If you do so, the application
activates a filter that suppresses the image frequency to a certain extent.
The following illustrations help you configure the measurement correctly.
For more information on how to configure image rejection, see "Image Rejection"
on page 46.
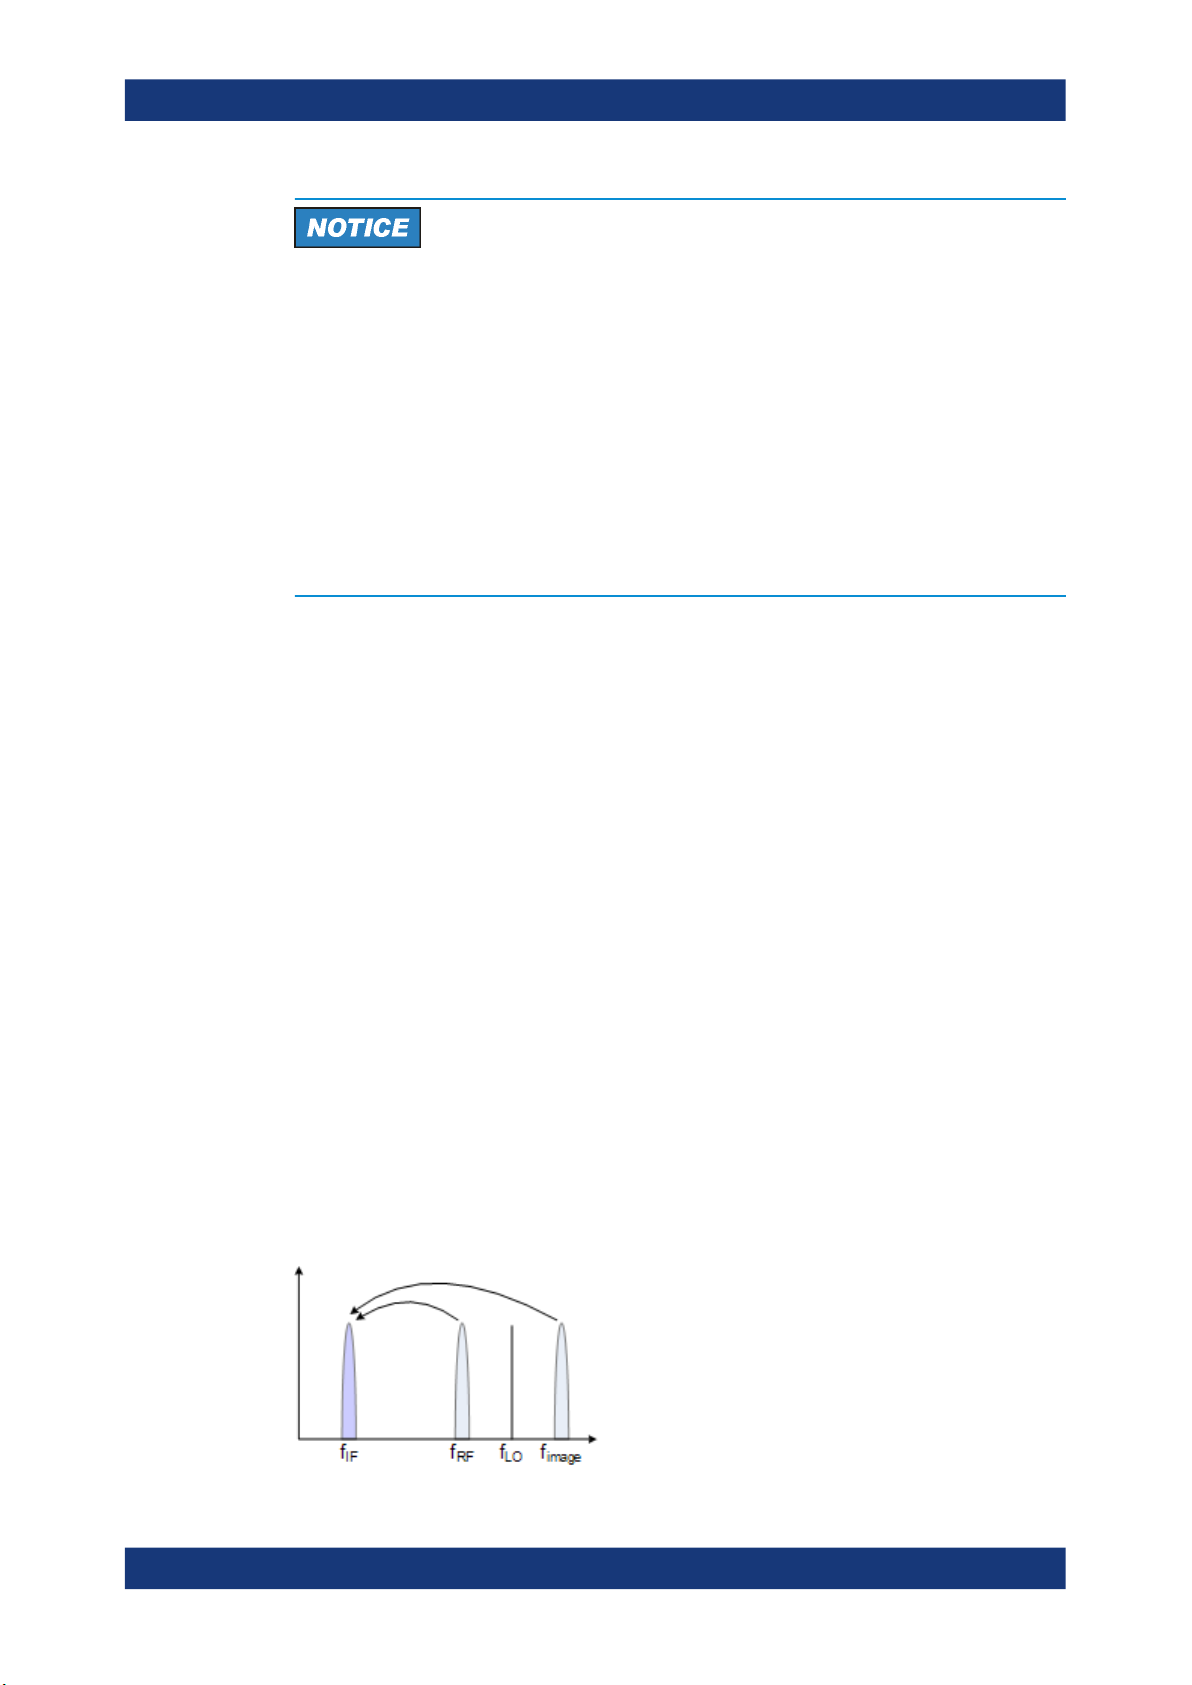
Double sideband measurements
Double sideband mixers use both sidebands to the same extent. Both RF and image
frequency are converted. In that case, turn off image rejection.
28User Manual 1176.8497.02 ─ 04
Page 29
R&S®FPS-K30
Measurement Basics
Image Frequency Rejection
fLO= frequency of the local oscillator
fIF= intermediate frequency = fRF ± f
fRF= lower sideband = fLO - f
f
= upper sideband = fLO + f
image
LO
IF
IF
If image rejection is on, the results have a 3 dB error. That means noise figure results
are 3 dB lower than they should be. Gain results are 3 dB higher.
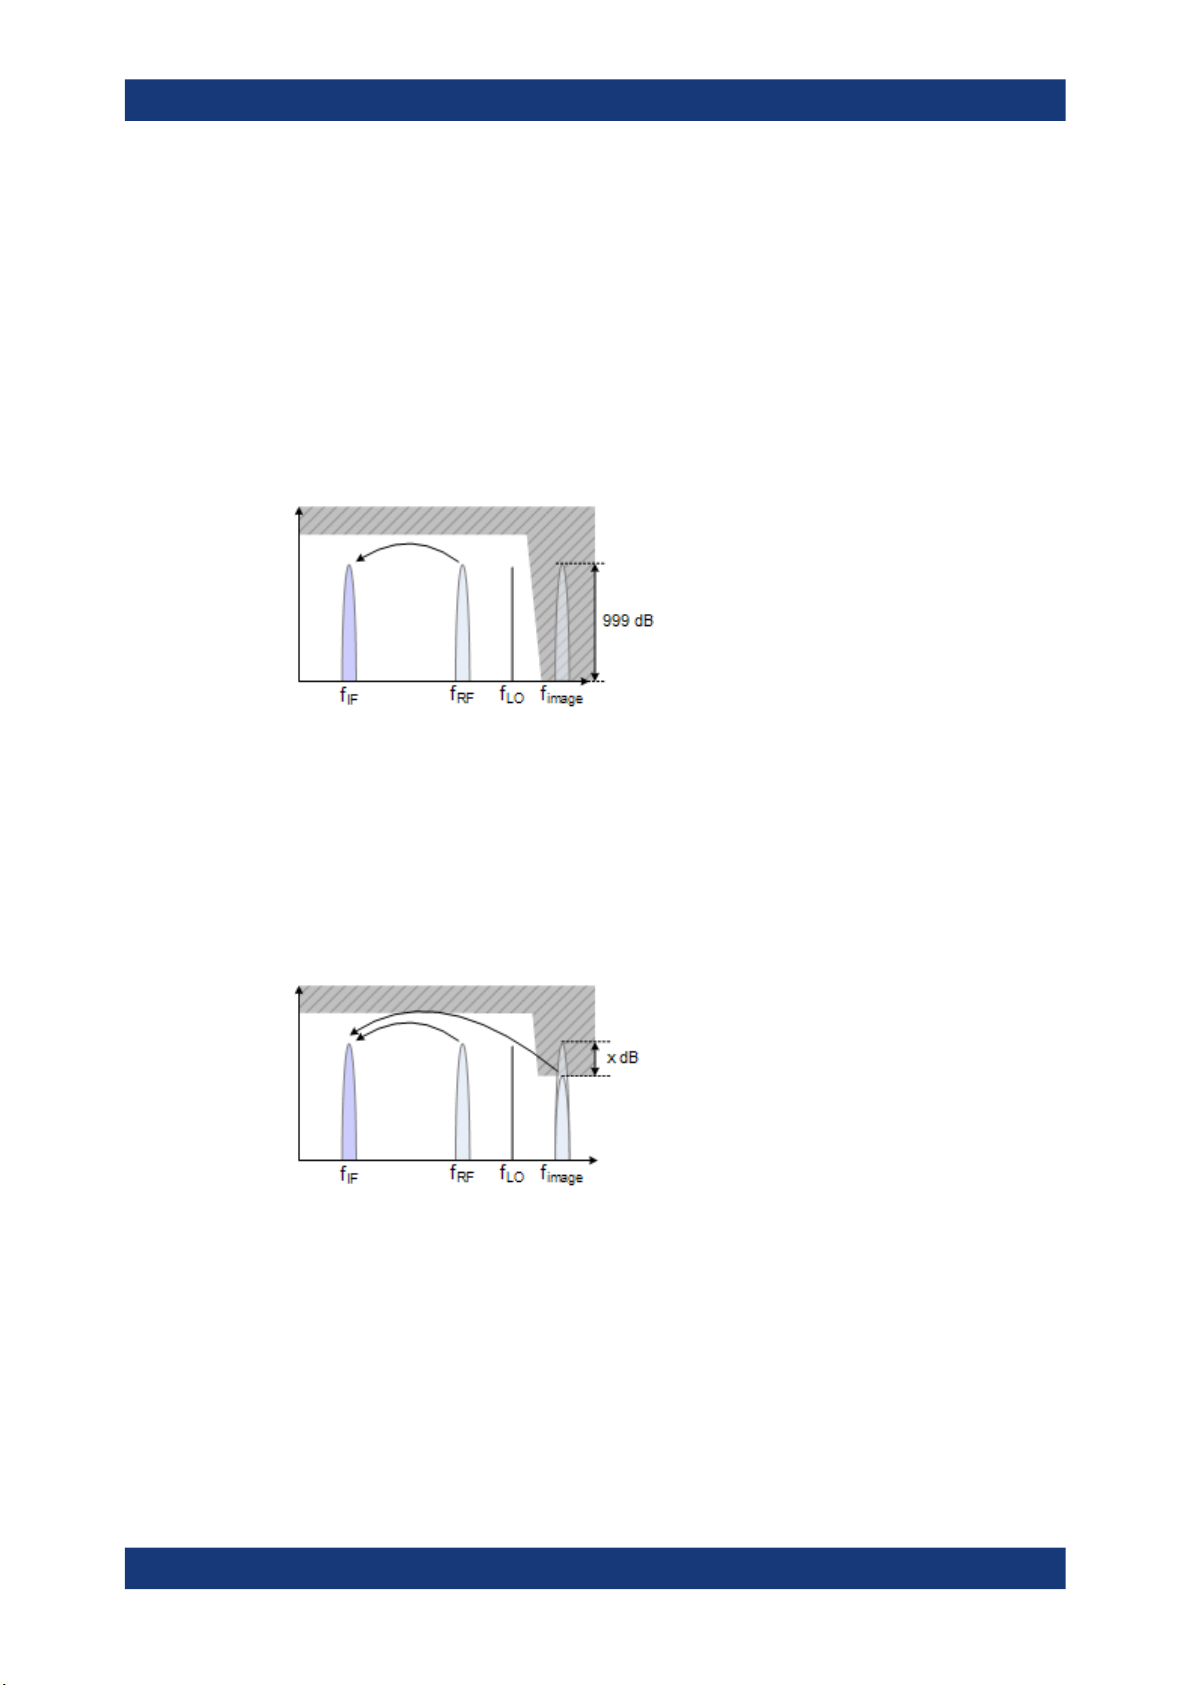
Single sideband measurements
Single sideband mixers use a single sideband only. In that case, you have to suppress
the sideband that is not required. If you do so, the measurement is like on an amplifier.
To suppress a sideband completely, it is best to set the image rejection to the maximum amount possible (999.99 dB).
Partial sideband suppression
For measurements on mixers with a low image frequency rejection, there are two test
scenarios.
●
Mixers whose image rejection is known.
●
Mixers whose image rejection is unknown.
For mixers whose image rejection is known, define the magnitude of image rejection in
dB as accurately as possible. Otherwise, measurement results (noise figure and gain)
deviate between 0 dB to 3 dB.
If you do not know the image rejection characteristics of a mixer, use a custom test
setup including an additional filter. You also have to know the gain characteristics of the
DUT.
29User Manual 1176.8497.02 ─ 04
Page 30

R&S®FPS-K30
Measurement Basics
Calibration (2nd Stage Correction)
(1) = Test setup for calibration
(2) = Test setup for noise figure measurement
In the test setup shown above, a lowpass filter prevents unwanted noise from being fed
in at the image frequency.
Depending on the position of the frequency bands, you might need a highpass or
bandpass filter for the RF frequency instead of the lowpass filter. The important point is
that unwanted noise is not converted by a further receive path of the mixer. The
unwanted noise at the receive frequency must not be reduced. The insertion loss must
be considered, if applicable.
With this test setup, the measurement on a mixer without sideband suppression is the
same as SSB measurements.
To take the characteristics of the filter into account, include the insertion loss of the filter at the RF. To consider the actual filter suppression at the image frequency, include
the actual attenuation for the image rejection.
Harmonics mixer measurement
For a harmonics mixer, the input signals are not only converted to the IF by the wanted
harmonic. The harmonic of the LO signal produced in the mixer is also converted.
Often, the mixer even features a lower conversion loss for unwanted harmonics. For
measurements on this type of mixer, you have to use a bandpass filter. The filter
ensures that there is only noise at the desired frequency at the input of the DUT. This
measurement is similar to measurements on a mixer with an average sideband suppression.
4.6 Calibration (2nd Stage Correction)
The calibration procedure of the application measures the inherent noise of the
R&S FPS you are using. Performing calibration is therefore recommended, as it increases the accuracy of measurement results. The results get more accurate because the
application takes the inherent noise of the analyzer into account while it calculates the
results.
Calibration for noise figure measurements is also known as 2nd stage correction. This
term is used because in a typical noise figure test setup, the DUT represents the first
stage and the analyzer the second stage in the test setup.
30User Manual 1176.8497.02 ─ 04
Page 31

R&S®FPS-K30
Measurement Basics
Calibration (2nd Stage Correction)
The 2nd stage correction is a calibration that is specific to noise figure measurements.
It is independent of the overall calibration state of the analyzer and does not calibrate
the analyzer.
For successful calibration, you need additional equipment.
●
Noise source
The noise source is like a calibration standard. It provides a reference with known
noise characteristics that allows the application to determine the inherent noise of
the analyzer you are using.
During the calibration, the application measures the inherent noise characteristics of
the analyzer at the set of measurement frequencies.
Thus, the 2nd stage correction is valid for a particular instrument configuration, the
room temperature and the instrument temperature. As long as this configuration stays
the same, calibration data remains valid.
Calibrating single frequency measurements
Like for all other measurements of the R&S FPS Noise Figure measurements application, perform a calibration before a single frequency measurement for increased accuracy.
There is an easy way to calibrate single frequency measurements, if you already calibrated the application for swept or list measurements. If the single frequency is part of
the frequency list, the measurement is already calibrated for that frequency and no further steps are necessary. The application recalls the last calibration values when you
switch back to sweep mode or frequency table mode.
Only if you use a single frequency that is not part of the frequency list, you must calibrate this frequency point first.
●
Interpolation
If you change the frequency, while the frequency span stays the same or is
reduced, the application interpolates the correction data for the new measurement
points. A new calibration is not required.
However, measurements based on interpolated data can result in an increased
measurement uncertainty. Highly accurate measurements that are conform to the
values specified in the data sheet are only possible at calibrated measurement
points.
Note that useful interpolation is possible only if essential calibration parameters
(e.g. impedance or attenuation) change only slightly. This is the case if the distance
between the original calibration points is sufficiently small.
If the span increases compared to the span during calibration, a new calibration is
necessary.
If the application interpolates the calibration data, it shows a corresponding label in
the channel bar and a warning message in the status bar.
●
Invalid calibration
If you change one of the amplitude parameters (e.g. the attenuation), calibration is
labeled invalid. In that case, calibration is not accurate, because the settings are
not in line with the settings at the time the R&S FPS has been calibrated. If calibra-
31User Manual 1176.8497.02 ─ 04
Page 32

R&S®FPS-K30
Measurement Basics
Calibration (2nd Stage Correction)
tion is invalid, repeat the calibration or restore the settings as they were during the
calibration.
Saving calibration data
If you save the current configuration or measurement results to a data set, calibration
data is part of that data set.
For more information on saving and restoring data sets, see the "Storing and Recalling
Instrument Settings and Measurement Data" chapter in the R&S FPS user manual.
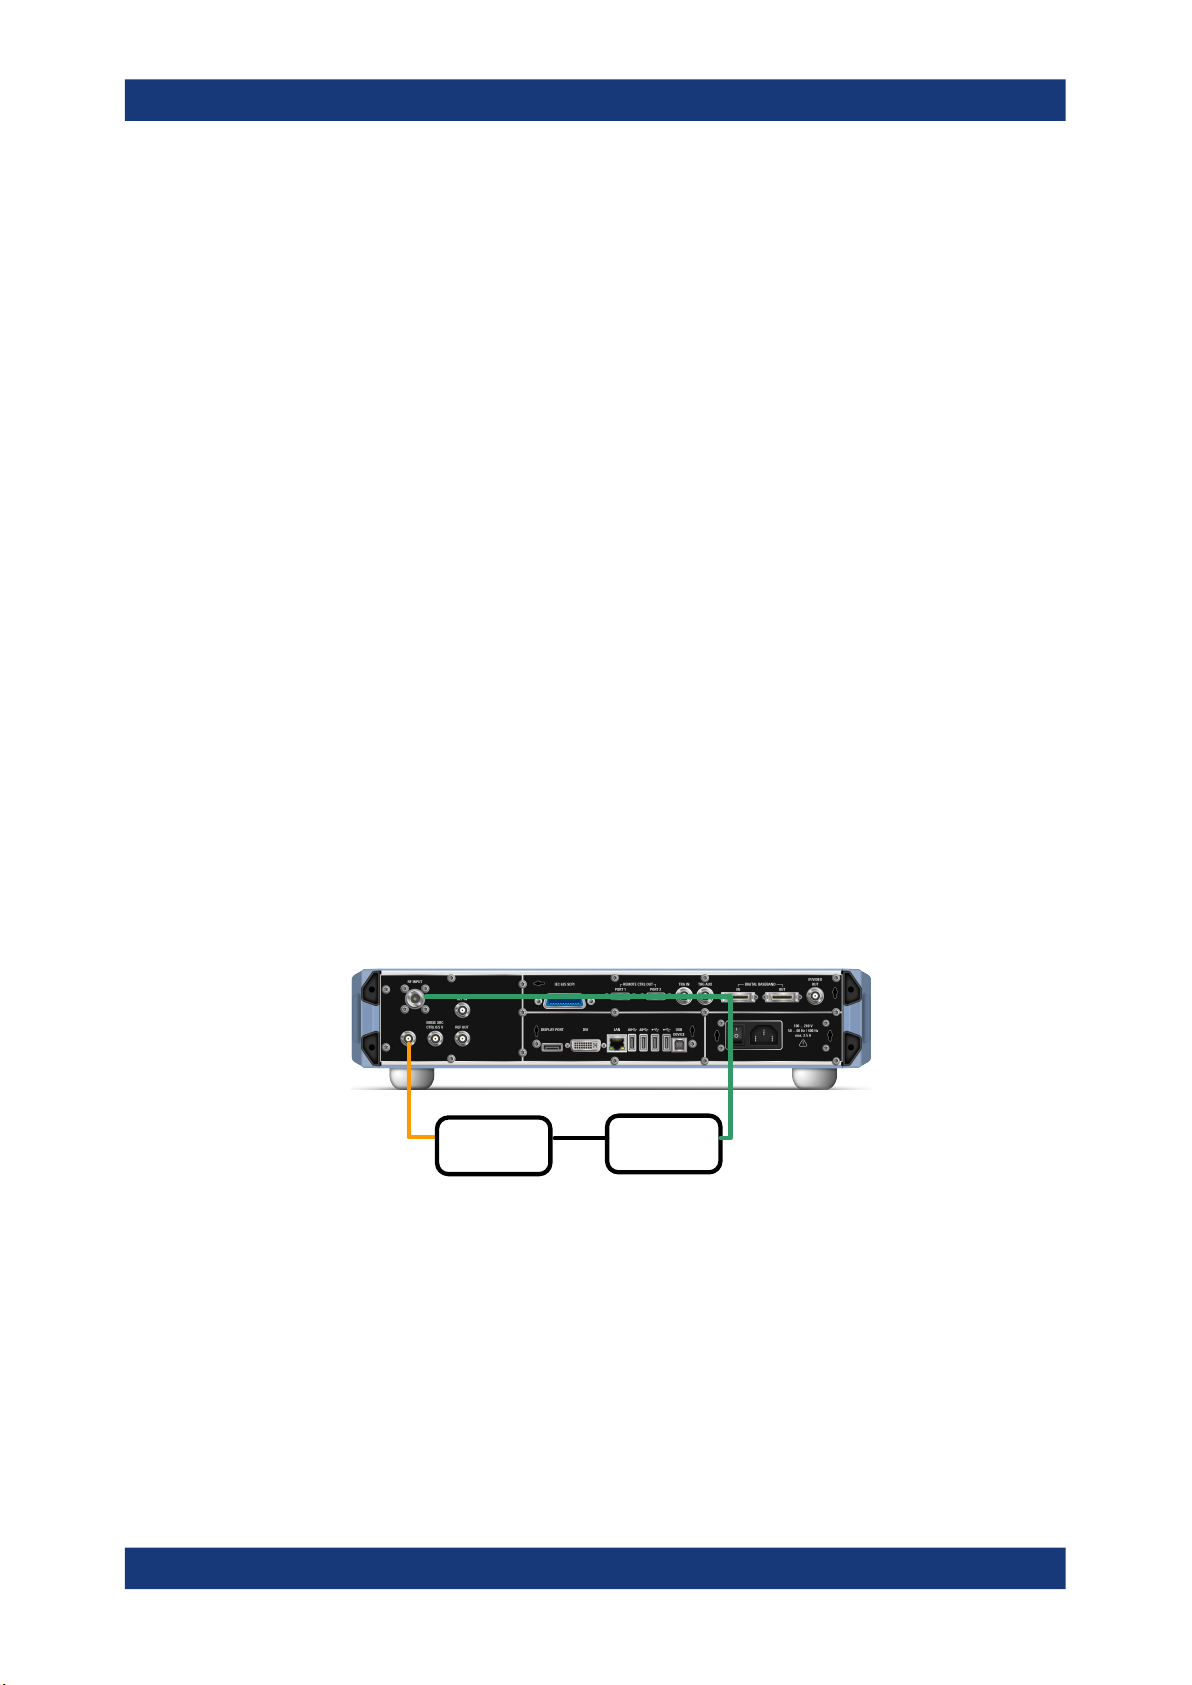
The picture below shows a typical calibration setup that includes a noise source.
Noise
source +28V
RF Input
Noise
Source
Figure 4-1: Noise figure calibration setup
1. Connect the noise source directly and without a cable to the RF input of the analyzer.
2. Connect the noise source to the +28 V voltage supply (Noise Source Control connector) on the back of the R&S FPS.
To connect the noise source to the voltage supply, you need a coaxial cable.
After you have set up calibration, there are several ways to start calibration.
●
In the "Noise Overview" dialog box, press the "Calibrate" button.
●
In the "Sweep" menu, press the "Calibrate" softkey.
Calibration Save
If the user has performed a valid calibration on the instrument, the calibration results
can be saved by using the "Calibration Save" button in the "Export" dialog. This provides the possibility to use once stored calibration results at a later point.
Remote command:
[SENSe:]CORRection:SAVE on page 129
Calibration Recall
32User Manual 1176.8497.02 ─ 04
Page 33

R&S®FPS-K30
Measurement Basics
Separating Signals by Selecting an Appropriate Resolution Bandwidth
Calibration results that have been stored once on the instrument can be recalled by
using the "Calibration Recall" button in the "Import" dialog.
To achieve a valid calibration by importing a saved one, all parameters of R&S FPSK30 must match exactly to the ones that have been used for the calibration. At the
import of a calibration, a preview dialog is shown which contains all relevant parameters of the calibration to be imported and an indication (green / red) if they match to the
current instrument and option settings. Only if the calibration context summary is
green, the calibration import can be done. If the calibration context summary is red,
importing the calibration results would lead to an invalid calibration status for the current settings. Thus the calibration results cannot be imported in this case. If the calibration context summary is green but some of the individual entries are red (i.e. they differ
from the current settings), the calibration results still can be imported. The import will
then overwrite the red marked settings with the ones from the stored calibration to
ensure the settings match.
Remote command:
[SENSe:]CORRection:RECall on page 128
4.7 Separating Signals by Selecting an Appropriate Resolution Bandwidth
The resolution bandwidth defines the 3 dB bandwidth of the resolution filter to be used.
An RF sinusoidal signal is displayed according to the passband characteristic of the
resolution filter (RBW), i.e. the signal display reflects the shape of the filter.
The highest sensitivity is obtained at the smallest bandwidth (1 Hz). If the bandwidth is
increased, the reduction in sensitivity is proportional to the change in bandwidth.
Increasing the bandwidth by a factor of 3 increases the displayed noise by approx. 5
33User Manual 1176.8497.02 ─ 04
Page 34

R&S®FPS-K30
4.8 Analyzing Several Traces - Trace Mode
Measurement Basics
Analyzing Several Traces - Trace Mode
dB (4.77 dB precisely). If the bandwidth is increased by a factor of 10, the displayed
noise increases by a factor of 10, i.e. 10 dB.
The higher spectral resolution with smaller bandwidths is won by longer sweep times
for the same span. The sweep time has to allow the resolution filters to settle during a
sweep at all signal levels and frequencies to be displayed.
If the RBW is too large, signal parts that are very far away (e.g. from a different signal)
are considered in the measurement and distort the results. The displayed noise increases.
If the RBW is too small, the measurement time increases.
The trace mode determines the way the data is processed and displayed. The application provides the following trace modes.
Table 4-1: Overview of available trace modes
Trace Mode Description
Blank Hides the selected trace.
Clear Write Overwrite mode: the trace is overwritten by each sweep. This is the default setting.
View The current contents of the trace memory are frozen and displayed.
Each time the trace mode is changed, the selected trace memory is cleared.
The default trace mode for the first trace is Clear/Write. For trace 2-4, the default trace
mode is "Blank". If you require another mode, you have to set it manually.
As you can have up to four traces simultaneously, you can compare the results with
different measurement configurations. For example, freeze a trace and use it as a reference trace.
34User Manual 1176.8497.02 ─ 04
Page 35

R&S®FPS-K30
4.9 Using Markers
Measurement Basics
Using Markers
If you change the scaling of the y-axis, the R&S FPS automatically adapts the trace
data to the changed display range. Thus, you can perform an amplitude zoom after the
measurement to show details of the trace.
Markers are used to mark points on traces, to read out the results of a particular measurement point or compare results of different traces. The noise application provides
four markers.
When you activate a marker, the application automatically positions it on the first measurement point (left border of the diagram) of trace 1, regardless of how many traces
are active. A marker is always positioned on the same horizontal position in all active
measurement windows. If you change the position of a marker in one window, the
application adjusts the position of that marker in all other measurement windows. Thus,
the marker results for a specific marker are always for the same frequency, which
makes it easier to compare results.
Markers in single frequency mode
When you use a marker for single frequency measurements, the marker is positioned
on a particular index value and not a particular measurement point. This means that
during continuous measurements, the marker remains on the index value you have put
it on. It does not move down the line with the results.
To move a marker, you can use several methods.
●
Enter a particular measurement frequency in the input field that opens when you
activate a marker.
●
Move the marker around with the rotary knob or the cursor keys.
●
Drag the marker to a new position using the mouse pointer.
All markers can be used either as normal markers or delta markers. A normal marker
indicates the absolute signal value at the defined position in the diagram. A delta
marker indicates the value of the marker relative to the specified reference marker (by
default marker 1).
35User Manual 1176.8497.02 ─ 04
Page 36

R&S®FPS-K30
Measurement Basics
Using Markers
The application always positions the marker on the trace with the lowest number that is
in Clear/Write trace mode. To set the marker on another trace, use the "Marker to
Trace" function. With this function, you can also position a marker on a trace that is in
"View" trace mode, e.g. to compare measurement results. Note that at least one active
marker has to be a normal marker.
The application shows the results at the marker position directly in the diagram area
(up to two markers) or in the marker table (if you use more than two markers).
Marker information in diagram area
By default, the results of the last two markers or delta markers that were activated are
displayed in the diagram area.
The following information is displayed there:
●
The marker type (M for normal, D for delta, or special function name)
●
The marker number (1 to 4)
36User Manual 1176.8497.02 ─ 04
Page 37

R&S®FPS-K30
Measurement Basics
Using Markers
●
The assigned trace number in square brackets [ ]
●
The marker value on the y-axis
●
The marker position on the x-axis
Marker information in marker table
In addition to the marker information displayed within the diagram area, a marker table
can be displayed in a separate window. For more information on the contents of the
marker table, see "Marker Table" on page 20.
37User Manual 1176.8497.02 ─ 04
Page 38

R&S®FPS-K30
5 Configuration
Configuration
Configuration Overview
Noise figure measurements require a special application on the R&S FPS, which you
activate using the [MODE] key.
The Noise Source Control connector on the R&S FPS is also a prerequisite for the
R&S FPS Noise Figure measurements application. Without this connector, no measurement can be performed.
When you activate a measurement channel in the R&S FPS Noise Figure measurements application, a measurement for the input signal is defined with the default configuration. The "Noise Figure" menu is displayed and provides access to the most
important configuration functions.
Unavailable hardkeys
Note that the [AMPT], [AUTO SET], [BW], [TRIG] and [MKR FUNC] keys have no contents and no function in the R&S FPS Noise Figure measurements application.
● Configuration Overview...........................................................................................38
● Defining the Measurement Frequency....................................................................40
● Selecting DUT Characteristics................................................................................ 45
● Configuring the Noise Source................................................................................. 47
● Configuring Additional Loss.................................................................................... 52
● Configuring the Analyzer.........................................................................................58
● Using the Uncertainty Calculator.............................................................................61
● Performing Measurements......................................................................................67
● Configuring Inputs and Outputs of the R&S FPS....................................................68
5.1 Configuration Overview
Throughout the measurement channel configuration, an overview of the most important
currently defined settings is provided in the "Overview". The "Overview" is displayed
when you select the "Overview" icon, which is available at the bottom of all softkey
menus.
38User Manual 1176.8497.02 ─ 04
Page 39

R&S®FPS-K30
Configuration
Configuration Overview
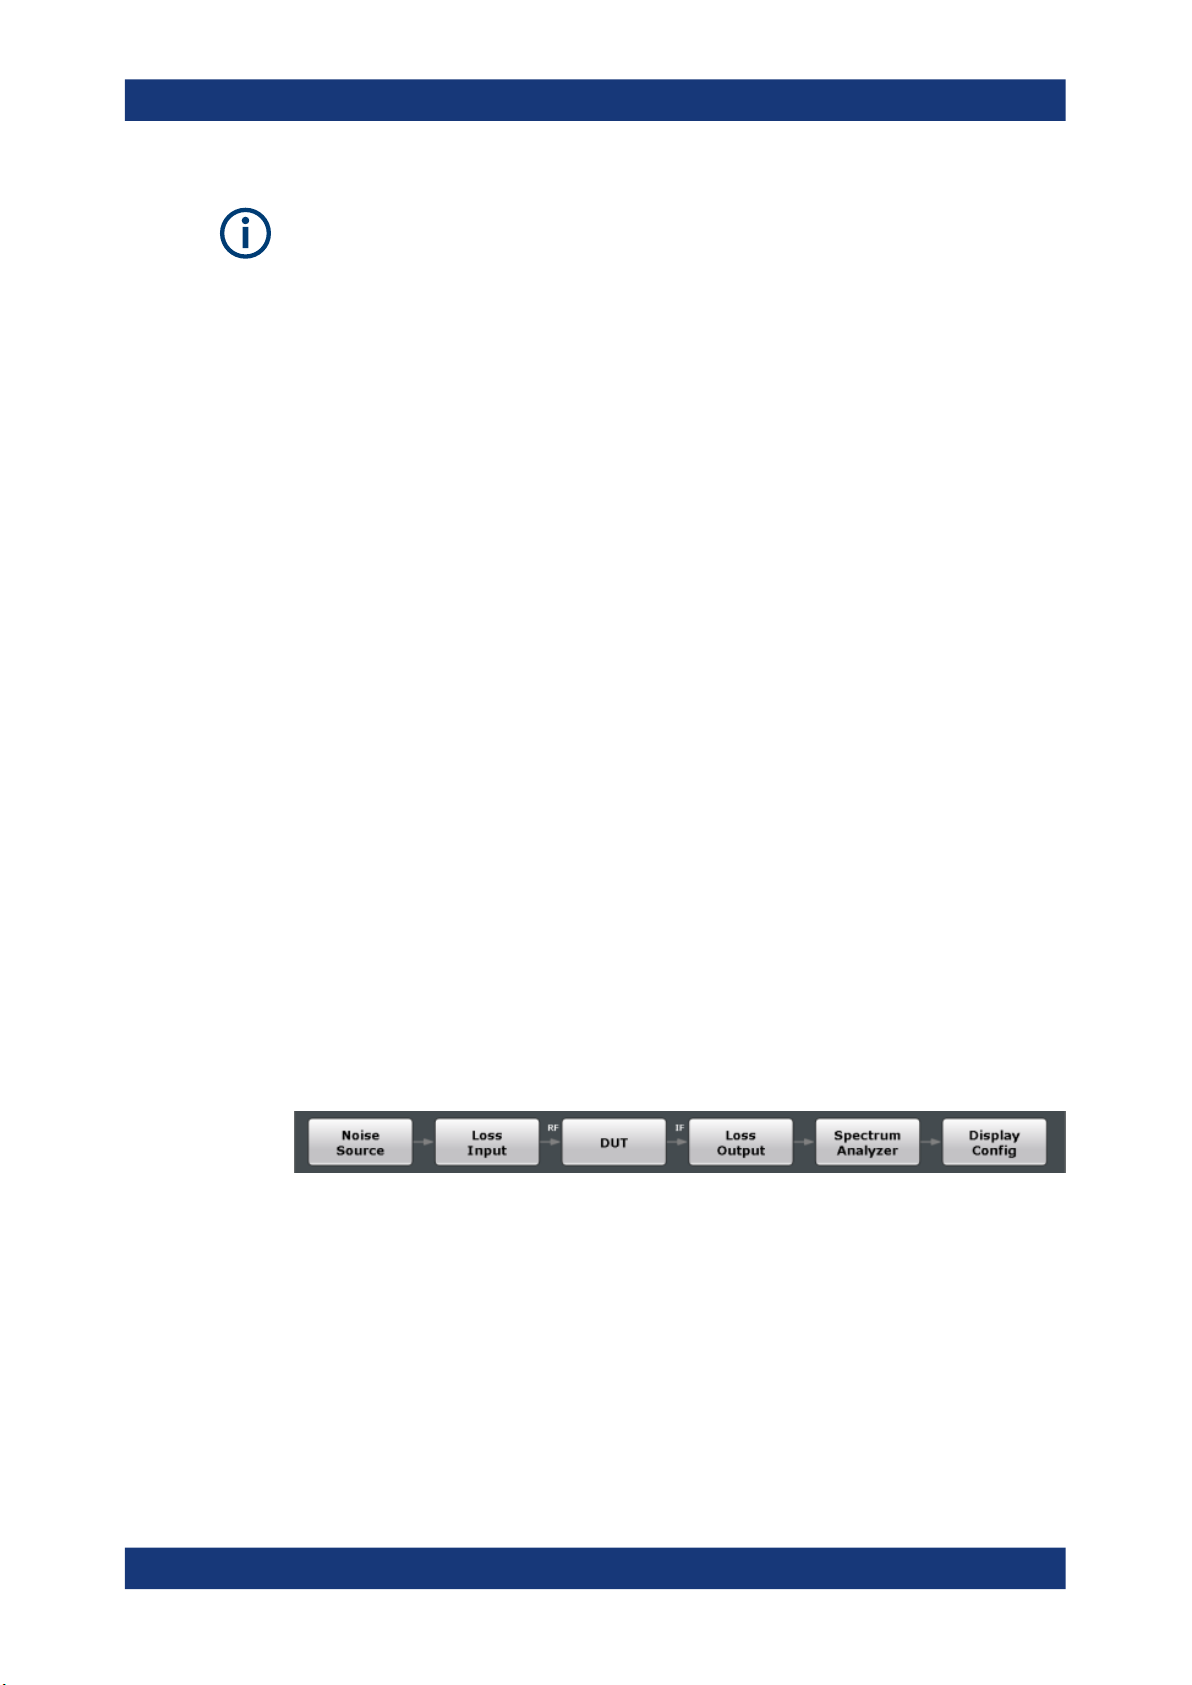
In addition to the main measurement settings, the "Overview" provides quick access to
the main settings dialog boxes. The individual configuration steps are displayed in the
order of the data flow. Thus, you can easily configure an entire measurement channel
from input over processing to output and analysis by stepping through the dialog boxes
as indicated in the "Overview".
In particular, the "Overview" provides quick access to the following configuration dialog
boxes (listed in the recommended order of processing):
To perform a calibration
1. Noise Source
See Chapter 5.4, "Configuring the Noise Source", on page 47.
2. Spectrum Analyzer
See Chapter 5.6, "Configuring the Analyzer", on page 58.
3. Calibration
See "Calibrate" on page 68
To perform a measurement
1. Noise Source
See Chapter 5.4, "Configuring the Noise Source", on page 47.
2. Input and output losses
See Chapter 5.5, "Configuring Additional Loss", on page 52.
3. DUT configuration
See Chapter 5.3, "Selecting DUT Characteristics", on page 45
4. Spectrum Analyzer
See Chapter 5.6, "Configuring the Analyzer", on page 58.
5. Display Configuration
See Chapter 6.1, "Configuring the Display", on page 74
39User Manual 1176.8497.02 ─ 04
Page 40

R&S®FPS-K30
Configuration
Defining the Measurement Frequency
To configure settings
► Select any button in the "Overview" to open the corresponding dialog box.
Select a setting in the channel bar (at the top of the measurement channel tab) to
change a specific setting.
Preset Channel
Select the "Preset Channel" button in the lower left-hand corner of the "Overview" to
restore all measurement settings in the current channel to their default values.
Do not confuse the "Preset Channel" button with the [Preset] key, which restores the
entire instrument to its default values and thus closes all channels on the R&S FPS
(except for the default channel)!
Remote command:
SYSTem:PRESet:CHANnel[:EXEC] on page 97
Specific Settings for
The channel may contain several windows for different results. Thus, the settings indicated in the "Overview" and configured in the dialog boxes vary depending on the
selected window.
Select an active window from the "Specific Settings for" selection list that is displayed
in the "Overview" and in all window-specific configuration dialog boxes.
The "Overview" and dialog boxes are updated to indicate the settings for the selected
window.
5.2 Defining the Measurement Frequency
● Defining a Frequency Set........................................................................................40
● Configuring Single Frequency Measurements........................................................43
● Using a Frequency Table........................................................................................ 44
5.2.1 Defining a Frequency Set
Access: "Overview" > "DUT" > "Frequency Config"
These settings define the frequency characteristics for the measurement.
The information in this tab is also the basis for an automatic population of the frequency table. All parameters of this dialog are interdependent. If you change one
parameter, at least one other parameter is changed by the application.
If you change a frequency set, perform a new calibration to ensure accurate results.
40User Manual 1176.8497.02 ─ 04
Page 41

R&S®FPS-K30
Configuration
Defining the Measurement Frequency
Preamplifier
If a preamplifier is used, make sure the defined (and possibly upconverted) IF frequencies for the measurement stay below the maximum frequency the preamplifier supports. For the R&S FPS-B22 option, the maximum frequency is 7 GHz. However, the
preamplifier can be activated or deactivated individually for different tuning modes. For
example, for a sweep mode which requires a span above 7 GHz it is deactivated, while
for a single frequency measurement at 1 GHz it can be activated.
Tuning Mode................................................................................................................. 41
Center........................................................................................................................... 42
Span..............................................................................................................................42
Start and Stop Frequency............................................................................................. 42
(Measurement) Points...................................................................................................42
Step...............................................................................................................................42
Tuning Mode
Selects the tuning or measurement mode.
For more information, see Chapter 4.1, "Tuning Modes", on page 21.
Tuning mode selection is also available via softkeys ("Sweep Mode", "Frequency Table
Mode", "Single Frequency Mode") in the "Sweep" menu.
Note: A preamplifier can be activated or deactivated individually for different tuning
modes. When you switch tuning modes, the defined preamplifier state is adapted.
"Sweep"
"Frequency
Table"
"Single Frequency"
Remote command:
Frequency sweep measurement:
[SENSe:]CONFigure:LIST:CONTinuous on page 107
[SENSe:]CONFigure:LIST:SINGle on page 107
INITiate<n>[:IMMediate] on page 144
Single frequency measurement:
[SENSe:]CONFigure:FREQuency:CONTinuous on page 107
[SENSe:]CONFigure:FREQuency:SINGle on page 107
INITiate<n>[:IMMediate] on page 144
The measurement is based on an automatically generated frequency
set.
The measurement is based on a customized frequency table.
For more information, see Chapter 5.2.3, "Using a Frequency Table",
on page 44.
The measurement measures a single frequency only.
For more information, see Chapter 5.2.2, "Configuring Single Fre-
quency Measurements", on page 43.
41User Manual 1176.8497.02 ─ 04
Page 42

R&S®FPS-K30
Configuration
Defining the Measurement Frequency
Center
Defines the center of the measurement frequency range.
If you change the center frequency, the application changes the start and stop fre-
quency according to the span you have set.
The "Center" setting is also available via the [FREQ] key.
Remote command:
Frequency list measurement:
[SENSe:]FREQuency:CENTer on page 108
Single frequency measurement:
[SENSe:]FREQuency:SINGle on page 109
Span
Defines the measurement span.
If you change the span, the application changes the start frequency, the stop frequency
and the stepsize according to the center frequency and the measurement points.
The "Span" setting is also available via the [SPAN] key.
Remote command:
[SENSe:]FREQuency:SPAN on page 109
Start and Stop Frequency
Defines the start and stop frequencies.
If you change the start or stop frequency, the application changes the center frequency,
the span and the measurement points according to the new values and the stepsize.
The "Start" and "Stop" settings are also available via the [FREQ] key.
Remote command:
Start frequency:
[SENSe:]FREQuency:STARt on page 110
Stop frequency:
[SENSe:]FREQuency:STOP on page 110
(Measurement) Points
Defines the measurement points.
For frequency list measurements, the number of measurement points corresponds to
the number of entries in the frequency table. The number of points displayed in the
graphical results is also the same.
If you change the measurement points, the application changes the stepsize according
to the span.
The "Points" setting is also available via the [SPAN] key.
Remote command:
[SENSe:]FREQuency:POINts on page 109
Step
Defines the frequency step size in the frequency table.
The stepsize corresponds to the distance between two consecutive measurement
points.
42User Manual 1176.8497.02 ─ 04
Page 43

R&S®FPS-K30
5.2.2 Configuring Single Frequency Measurements
Configuration
Defining the Measurement Frequency
If you change the stepsize, the application changes the measurement point according
to the span.
The "Stepsize" setting is also available via the [FREQ] key.
Remote command:
[SENSe:]FREQuency:STEP on page 110
Access: "Overview" > "DUT" > "Frequency Config" > "Tuning Mode: Single Frequency"
These settings define the frequency characteristics for the measurement.
If you change the frequency, perform a new calibration to ensure accurate results.
Single (Frequency)........................................................................................................43
Coupled to Sweep List.................................................................................................. 43
(Measurement) Points...................................................................................................44
Single (Frequency)
Defines the frequency that the single frequency measurement is performed on.
The "Single" setting is also available via the [FREQ] key.
Remote command:
[SENSe:]FREQuency:SINGle on page 109
Coupled to Sweep List
Couples or decouples frequency selection to the contents of a sweep list.
If you couple the frequency to the sweep list, the application allows you to select only
the frequencies currently part of the frequency list. If you enter another frequency, the
application automatically selects the nearest frequency of the frequency list. If the frequency list has been calibrated previously, calibration remains valid for those frequencies when you change the tuning mode.
If you turn off the coupling, you can define any frequency for single frequency measurements. Note, however, that you have to calibrate the measurement for that frequency.
Remote command:
[SENSe:]FREQuency:SINGle:COUPled on page 109
43User Manual 1176.8497.02 ─ 04
Page 44

R&S®FPS-K30
5.2.3 Using a Frequency Table
Configuration
Defining the Measurement Frequency
(Measurement) Points
Defines the number of measurement points for single frequency measurements.
For single frequency measurements, the number of measurement points corresponds
to the number of measurements (index values) performed on a single frequency.
For more information, see "Single frequency measurements" on page 12.
The "Points" setting is also available via the [SPAN] key.
Remote command:
[SENSe:]FREQuency:POINts on page 109
Access: "Overview" > "DUT" > "Frequency Config" > "Frequency Table"
The "Frequency Table" tab in the "Frequency Settings" dialog box contains functionality
to manage the measurement frequencies.
The application populates the table according to the information you entered in the
"Frequency Config" tab when you select "Populate Table".
Note that changes to the frequency table take effect only if you select the "Frequency
Table" tuning mode.
Frequency Table............................................................................................................44
Clear Table....................................................................................................................45
Populate Table.............................................................................................................. 45
Insert............................................................................................................................. 45
Delete............................................................................................................................45
Import / Export...............................................................................................................45
Frequency Table
Shows the current measurement points.
The table is made up of one column that represents the measurement frequency. Each
frequency corresponds to one measurement point. The length of the table is variable
(up to a maximum of 1201 points).
When you perform measurements in "Sweep" or "Single Frequency" tuning mode, the
contents of the table have no effect on the measurement.
44User Manual 1176.8497.02 ─ 04
Page 45

R&S®FPS-K30
Configuration
Selecting DUT Characteristics
When you select a table entry in "Frequency Table" tuning mode, you can edit it or add
a new frequency below the selected frequency. A new frequency has to be higher than
the last table entry and lower than the next table entry.
Clear Table
Deletes the contents of the table.
Populate Table
Populates or restores the measurement frequencies based on the center frequency,
the start and stop frequencies, the span, the stepsize and the number of measurement
points.
Remote command:
[SENSe:]FREQuency:TABLe:DATA on page 108
[SENSe:]FREQuency:LIST:DATA on page 108
Insert
Inserts a new measurement point above the one you have selected.
Delete
Deletes the currently selected measurement point.
Import / Export
Opens a dialog box to select a frequency table to import or export.
An import copies the frequency table into the default frequency table directory. An
export copies the table to a location outside the default frequency table directory, e.g. a
memory stick. The file extension has to be *.freq.
For details on the required file format, see Chapter A, "Reference: Frequency Table
File Format", on page 189.
5.3 Selecting DUT Characteristics
Access: "Overview" > "DUT" > "DUT Settings"
The "DUT" button opens a dialog box to configure the characteristics of the DUT you
are testing. The dialog box contains a schematic overview of the DUT input and output
characteristics and the way it is integrated into the test setup.
45User Manual 1176.8497.02 ─ 04
Page 46

R&S®FPS-K30
Configuration
Selecting DUT Characteristics
Mode............................................................................................................................. 46
LO Fixed........................................................................................................................46
IF Fixed......................................................................................................................... 46
Image Rejection............................................................................................................ 46
Mode
Selects the measurement mode.
The required measurement mode depends on the type of DUT you are testing. For
more information, see Chapter 4.3, "DUT Types", on page 25.
Note: For upconverting measurements, if a preamplifier is used, make sure the upcon-
verted frequencies for the measurement stay below the maximum frequency the preamplifier supports.
Remote command:
DUT type: [SENSe:]CONFigure:MODE:DUT on page 112
LO type: [SENSe:]CONFigure:MODE:SYSTem:LO on page 111
LO Fixed
Defines a fixed LO frequency for measurements on frequency-converting DUTs with a
fixed LO.
After you have defined the LO frequency, the application updates the frequency list
accordingly.
The "LO" setting is also available via the [FREQ] key.
Remote command:
[SENSe:]CONFigure:MODE:SYSTem:LO:FREQuency on page 112
IF Fixed
Defines a fixed intermediary frequency (IF) for measurements on frequency-converting
DUTs with a fixed IF.
After you have defined the intermediary frequency, the application updates the frequency list accordingly.
The "IF" setting is also available via the [FREQ] key.
Remote command:
[SENSe:]CONFigure:MODE:SYSTem:IF:FREQuency on page 111
Image Rejection
Turns image rejection of the DUT on and off.
If you set an image rejection of 0 dB, the image frequency passes completely. If you
set a high image rejection (up to 999.99 dB), the image frequency is suppressed completely. For DUTs that have a partial image rejection, define the amount of suppression.
For more information, see Chapter 4.5, "Image Frequency Rejection", on page 28.
Remote command:
[SENSe:]CORRection:IREJection on page 112
46User Manual 1176.8497.02 ─ 04
Page 47

R&S®FPS-K30
5.4 Configuring the Noise Source
5.4.1 Defining the Noise Source Characteristics
Configuration
Configuring the Noise Source
The noise source characteristics are used to calculate the effective noise temperature
of the noise source. The more accurate the specified characteristics of the noise
source you are using, the more accurate the measurement results. The noise source
characteristics must be supplied by its manufacturer.
● Defining the Noise Source Characteristics..............................................................47
● Using an ENR or Temperature Table...................................................................... 50
Access: "Overview" > "Noise Source" > "ENR / Temp Settings"
The noise characteristics of noise sources with diode characteristics are usually
defined by their ENR (Excess Noise Ratio). The noise characteristics of noise sources
with resistor characteristics are defined by their noise (or ambient) temperatures (T
and T
cold
). T
is typically at a very low temperature of liquid nitrogen or liquid helium.
cold
hot
Both noise source types can have different ENR values during the calibration and the
measurement stage. You can use either the same type of noise source for both calibration and measurement, or use different types of noise sources for calibration and measurement.
Noise Source.................................................................................................................48
Measurement................................................................................................................ 48
Common Noise Source.................................................................................................49
Calibration.....................................................................................................................49
Temperature..................................................................................................................49
47User Manual 1176.8497.02 ─ 04
Page 48

R&S®FPS-K30
Configuration
Configuring the Noise Source
Noise Source
Access: "Overview" > "Noise Source" > "ENR / Temp Settings" > "Noise Source"
You can select the type of noise source and its characteristics independently for the
Calibration and the Measurement.
"Diode"
Selects a noise source with diode characteristics. The frequency
characteristics of the noise source are defined by the Excess Noise
ratio (ENR).
"Resistor"
Selects a test setup that uses two resistors which act as a noise
source. One of the resistors has a low noise or ambient temperature
(a cold resistor), the other has a high noise or ambient temperature (a
hot resistor). The noise characteristics of the resistor are defined by
its noise temperatures T
and T
hot
cold
.
When you select the resistor noise source, the application automatically starts the manual measurement mode, which is indicated in a
message at the bottom of the dialog box.
Remote command:
Measurement: [SENSe:]CORRection:ENR[:MEASurement]:TYPE on page 119
Calibration: [SENSe:]CORRection:ENR:CALibration:TYPE on page 115
Measurement
Selects the source of the ENR or temperature values.
The frequency characteristics can be approximated by a constant or be based on an
ENR or temperature table.
If the ENR or temperature is a constant, the same values are used for all frequencies
in the frequency table. If you have selected a constant ENR, you have to define its
magnitude in the input field next to the radio button. If you have selected a constant
temperature, you have to define the temperatures of the resistor in the input fields next
to the radio button. T
temperature; T
cold
is the temperature of a resistor with a low noise or ambient
hot
is the temperature of a resistor with a high noise or ambient temper-
ature.
If the noise characteristics are based on a table, the ENR level and temperatures typi-
cally depend on the measurement frequency. You can select an existing table from the
dropdown menu next to the radio button, if it is active. For more information on ENR
and temperature tables, see Chapter 5.4.2, "Using an ENR or Temperature Table",
on page 50.
When "Common Noise Source" is on, the ENR is used for both measurement and calibration.
Remote command:
ENR mode: [SENSe:]CORRection:ENR[:MEASurement]:MODE on page 118
Constant ENR: [SENSe:]CORRection:ENR[:MEASurement]:SPOT on page 118
Select table:[SENSe:]CORRection:ENR[:MEASurement]:TABLe:SELect
on page 117
Constant temperature: [SENSe:]CORRection:ENR[:MEASurement]:SPOT:COLD
on page 119
Constant temperature: [SENSe:]CORRection:ENR[:MEASurement]:SPOT:HOT
on page 119
48User Manual 1176.8497.02 ─ 04
Page 49

R&S®FPS-K30
Configuration
Configuring the Noise Source
Common Noise Source
Turns the use of a common ENR on and off.
Common ENRs have the same characteristics for the measurement and calibration. If
you turn off common ENR, you can define an additional ENR to be used during calibration.
Define additional ENR for measurements on frequency converting DUTs, if one noise
source does not cover the frequency range at the DUT input (RF) and for calibration
(IF).
Remote command:
[SENSe:]CORRection:ENR:COMMon on page 116
Calibration
Selects the source of the ENR or temperature values used during calibration.
The frequency characteristics can be a constant or be based on an ENR or tempera-
ture table.
If the ENR or temperature is a constant, the same value is used for all frequencies in
the frequency table. If you have selected a constant ENR, you can also define its value
in the input field next to the radio button. If you have selected a constant temperature,
you have to define the temperatures of the resistor in the input fields next to the radio
button. T
T
is the temperature of a resistor with a high noise or ambient temperature.
cold
is the temperature of a resistor with a low noise or ambient temperature;
hot
If the noise source characteristics are based on a table, the ENR level and temperature
depend on the measurement frequency. In that case, the values are interpolated to the
measurement points. You can select a table from the dropdown menu next to the radio
button, if it is active. For more information on ENR tables, see Chapter 5.4.2, "Using an
ENR or Temperature Table", on page 50.
The calibration settings are available if the "Common Noise Source" is off.
Remote command:
ENR mode:[SENSe:]CORRection:ENR:CALibration:MODE on page 114
Constant ENR: [SENSe:]CORRection:ENR:CALibration:SPOT on page 114
Select table: [SENSe:]CORRection:ENR:CALibration:TABLe:SELect
on page 115
Constant temperature: [SENSe:]CORRection:ENR:CALibration:SPOT:COLD
on page 113
Constant temperature: [SENSe:]CORRection:ENR:CALibration:SPOT:HOT
on page 114
Temperature
Defines the absolute room temperature in degree Celsius or Fahrenheit.
The room temperature is required for the calculation of the real ENR of the noise
source, because an ENR table is based on a temperature of 290K.
To change the unit of the temperature from Celsius to Fahrenheit, change the date for-
mat from "DE" to "US" in the "General" display settings.
●
Press the [SETUP] key.
●
Select "Display".
●
Select the "General" tab.
49User Manual 1176.8497.02 ─ 04
Page 50

R&S®FPS-K30
5.4.2 Using an ENR or Temperature Table
Configuration
Configuring the Noise Source
●
Select "DE" for Celsius or "US" for Fahrenheit.
Note: If you define the temperature via remote control, the unit is degree Kelvin.
Remote command:
[SENSe:]CORRection:TEMPerature on page 120
Access: "Overview" > "Noise Source" > "Table Settings"
The "Table Settings" tab in the "ENR/TEMP Settings" dialog box contains the functionality to create and edit ENR or temperature tables.
ENR or temperature tables contain the noise source characteristics for particular frequencies. If the table does not contain ENR or temperature values for one of the measurement frequencies, the application interpolates between the values.
The "Table Settings" tab contains a list of ENR and temperature tables currently available on the R&S FPS and shows the table currently in use if the "ENR/TEMP Settings"
are enabled.
In addition, the tab contains functionality to create new tables and modify existing
ones.
Noise Source.................................................................................................................50
New...............................................................................................................................50
Edit................................................................................................................................51
Delete............................................................................................................................51
Copy To.........................................................................................................................51
Import / Export Table.....................................................................................................51
Edit Table...................................................................................................................... 51
Noise Source
Selects the type of noise source you are using for the measurement. The type of noise
source selected in the "ENR/TEMP Settings" > "Noise Source" dialog is adopted automatically.
The noise source type affects the data type that the table contains. For a "Noise
Diode", the table contains the ENR values of the noise source you are using. For a
"Resistor", the table contains the noise temperatures of the resistors (T
and T
hot
cold
).
For more information on the noise source types, see "Noise Source" on page 48.
Remote command:
[SENSe:]CORRection:ENR[:MEASurement]:TYPE on page 119
New
Opens the Edit Table dialog box to create a new table.
The contents of the dialog box are empty.
Remote command:
Table selection: [SENSe:]CORRection:ENR:CALibration:TABLe:SELect
on page 115
and:[SENSe:]CORRection:ENR[:MEASurement]:TABLe:SELect on page 117
50User Manual 1176.8497.02 ─ 04
Page 51

R&S®FPS-K30
Configuration
Configuring the Noise Source
Diode: [SENSe:]CORRection:ENR[:MEASurement]:TABLe[:DATA]
on page 116
Resistor: [SENSe:]CORRection:ENR[:MEASurement]:TABLe:TEMPerature[:
DATA] on page 117
Edit
Opens the Edit Table dialog box to modify the selected table.
Remote command:
Table selection: [SENSe:]CORRection:ENR[:MEASurement]:TABLe:SELect
on page 117
and: [SENSe:]CORRection:ENR[:MEASurement]:TABLe:SELect on page 117
Diode: [SENSe:]CORRection:ENR[:MEASurement]:TABLe[:DATA]
on page 116
Resistor: [SENSe:]CORRection:ENR[:MEASurement]:TABLe:TEMPerature[:
DATA] on page 117
Delete
Deletes the selected table.
Remote command:
Diode: [SENSe:]CORRection:ENR[:MEASurement]:TABLe:DELete
on page 116
Resistor:[SENSe:]CORRection:ENR[:MEASurement]:TABLe:TEMPerature:
DELete on page 117
Copy To
Opens the Edit Table dialog box to modify the selected table and save it under a new
name.
Import / Export Table
Opens a dialog box to select a table to import or export.
An import copies the ENR or temperature table into the default table directory. An
export copies the table to a location outside the default table directory, for example a
memory stick. The file extension has to be *.enr.
Edit Table
Defines the noise source characteristics or the loss characteristics of additional measurement equipment.
The noise source and loss tables are made up of up to 1201 data points. A data point
consists of a frequency and its corresponding ENR, temperature or loss value. The
ENR and temperature values must be supplied by the manufacturer of the noise
source or resistor. The loss characteristics of measurement equipment must also be
supplied by the manufacturer.
51User Manual 1176.8497.02 ─ 04
Page 52

R&S®FPS-K30
Configuration
Configuring Additional Loss
"Name"
"Comment"
"Frequency"
"Value"
Name of the ENR, temperature or loss table.
Comment for the ENR, temperature or loss table.
Frequency of a particular ENR, temperature or loss value.
ENR value or loss in dB.
For a resistor, the characteristics of the resistor are defined by the
noise temperatures T
and T
hot
instead of a single value. The unit in
cold
that case is Kelvin (degrees).
"Clear Table"
Deletes the contents of the table (frequencies and values) or the loss
table.
"Insert"
"Delete"
"Save"
"Cancel"
Inserts a new data point above the selected one.
Deletes the selected data point.
Saves the able.
Exits the "Edit Table" dialog box and returns to the result diagram.
Remote command:
Edit ENR table: [SENSe:]CORRection:ENR[:MEASurement]:TABLe[:DATA]
on page 116
Edit temperature table: [SENSe:]CORRection:ENR[:MEASurement]:TABLe:
TEMPerature[:DATA] on page 117
Edit input loss table: [SENSe:]CORRection:LOSS:INPut:TABLe[:DATA]
on page 123
Edit output loss table: [SENSe:]CORRection:LOSS:OUTPut:TABLe[:DATA]
on page 126
5.5 Configuring Additional Loss
These settings configure the loss characteristics of additional equipment in the test
setup, such as cables or attenuators at the DUT input or output. The characteristics of
such equipment must be supplied by the manufacturer.
Note that loss is only considered during the measurement and not during calibration
because the noise source is connected directly to the analyzer input.
52User Manual 1176.8497.02 ─ 04
Page 53

R&S®FPS-K30
5.5.1 Defining Loss
Configuration
Configuring Additional Loss
Treatment of losses in resistor noise sources
For resistor noise sources, it is not possible to change the loss characteristics.
When you change back to using a diode as a noise source, the previous loss settings
are not restored. In that case, store loss settings in a loss table for later use.
● Defining Loss.......................................................................................................... 53
● Using a Loss Table..................................................................................................55
Access: "Overview" > "Loss Input" / "Loss Output" > "Loss Settings"
The "Loss Settings" tab in the "Loss Settings" dialog box contains settings to define the
loss characteristics of miscellaneous equipment in the test setup.
You can define the loss characteristics of the signal path to the DUT input and the signal path from the DUT output to the analyzer.
53User Manual 1176.8497.02 ─ 04
Page 54

R&S®FPS-K30
Configuration
Configuring Additional Loss
Furthermore, you can define the loss characteristics of the signal path from the noise
source directly to the analyzer for the calibration measurement.
Input Loss......................................................................................................................54
Output Loss...................................................................................................................54
Calibration Loss............................................................................................................ 55
Input Loss
Defines losses between the noise source and the DUT input.
The input loss is the sum of all losses caused by the measurement equipment. The
loss can be constant or based on a loss table.
If the loss is constant, the same loss is used for all frequencies in the frequency table.
If you have selected a constant loss, you can also define its value in the input field next
to the radio button.
If the loss is based on a table, the loss values are interpolated to the measurement frequencies. You can select a table from the dropdown menu next to the radio button, if it
is active. For more information on loss tables, see Chapter 5.5.2, "Using a Loss Table",
on page 55.
The specified temperature at the time of measurement can be considered in the loss
calculation.
Remote command:
Loss mode:
[SENSe:]CORRection:LOSS:INPut:MODE on page 123
Constant loss:
[SENSe:]CORRection:LOSS:INPut:SPOT on page 123
Select loss table:
[SENSe:]CORRection:LOSS:INPut:TABLe:SELect on page 124
Temperature:
[SENSe:]CORRection:LOSS:INPut:TEMPerature on page 125
Output Loss
Selects the loss between the DUT output and the RF input of the analyzer.
The output loss is the sum of all losses caused by the measurement equipment (e.g.
connectors, cables or attenuators). The loss can be constant or be based on a loss
table.
If the loss is constant, the same loss is used for all frequencies in the frequency table.
If you have selected a constant loss, you can also define its value in the input field next
to the radio button.
If the loss is based on a table, the loss values are interpolated to the measurement frequencies. You can select a table from the dropdown menu next to the radio button, if it
is active. For more information on loss tables, see Chapter 5.5.2, "Using a Loss Table",
on page 55.
54User Manual 1176.8497.02 ─ 04
Page 55

R&S®FPS-K30
Configuration
Configuring Additional Loss
The current temperature at the time of measurement can be considered in the loss calculation.
Remote command:
Loss mode:
[SENSe:]CORRection:LOSS:OUTPut:MODE on page 125
Constant loss:
[SENSe:]CORRection:LOSS:OUTPut:SPOT on page 125
Select loss table:
[SENSe:]CORRection:LOSS:OUTPut:TABLe:SELect on page 126
Temperature:
[SENSe:]CORRection:LOSS:OUTPut:TEMPerature on page 127
Calibration Loss
Selects the loss between the noise source and the RF input of the analyzer for the calibration measurement.
The loss is the sum of all losses caused by the measurement equipment (e.g. connectors, cables or attenuators). The loss can be constant or be based on a loss table.
If the loss is constant, the same loss is used for all frequencies in the frequency table.
If you have selected a constant loss, you can also define its value in the input field next
to the radio button.
If the loss is based on a table, the loss values are interpolated to the measurement frequencies. You can select a table from the dropdown menu next to the radio button, if it
is active. For more information on loss tables, see Chapter 5.5.2, "Using a Loss Table",
on page 55.
The current temperature at the time of measurement can be considered in the loss calculation.
Remote command:
Loss mode:
[SENSe:]CORRection:LOSS:CALibration:MODE on page 121
Constant loss:
[SENSe:]CORRection:LOSS:CALibration:SPOT on page 121
Select loss table:
[SENSe:]CORRection:LOSS:CALibration:TABLe:SELect on page 122
Temperature:
[SENSe:]CORRection:LOSS:CALibration:TEMPerature on page 123
5.5.2 Using a Loss Table
Access: "Overview" > "Loss Input" / "Loss Output" > "Table Settings"
The "Table Settings" tab in the "Loss Settings" dialog box contains the functionality to
create and edit loss tables.
55User Manual 1176.8497.02 ─ 04
Page 56

R&S®FPS-K30
Configuration
Configuring Additional Loss
Loss tables contain the loss characteristics of additional frequency-dependent equipment in the test setup. If you are using a loss table, the loss values can be different on
each frequency that is measured. If the table does not contain a loss for one of the
measurement frequencies, the application interpolates between values.
The "Table Settings" tab contains a list of loss tables currently available on the
R&S FPS. It shows the table currently selected in the "Loss Settings" tab.
In addition, the tab contains functionality to create new tables and modify existing
ones.
56User Manual 1176.8497.02 ─ 04
Page 57

R&S®FPS-K30
Configuration
Configuring Additional Loss
New...............................................................................................................................57
Edit................................................................................................................................57
Delete............................................................................................................................57
Copy To.........................................................................................................................57
Import / Export Table.....................................................................................................57
New
Opens the Edit Table dialog box to create a new loss table.
The contents of the dialog box are empty.
Remote command:
Create input loss table:
[SENSe:]CORRection:LOSS:INPut:TABLe[:DATA] on page 123
Create output loss table:
[SENSe:]CORRection:LOSS:OUTPut:TABLe[:DATA] on page 126
Create calibration loss table:
[SENSe:]CORRection:LOSS:CALibration:TABLe[:DATA] on page 122
Edit
Opens the Edit Table dialog box to modify the selected table.
Remote command:
Edit input loss table:
[SENSe:]CORRection:LOSS:INPut:TABLe[:DATA] on page 123
Edit output loss table:
[SENSe:]CORRection:LOSS:OUTPut:TABLe[:DATA] on page 126
Edit calibration loss table:
[SENSe:]CORRection:LOSS:CALibration:TABLe[:DATA] on page 122
Delete
Deletes the selected table.
Remote command:
Delete input loss table:
[SENSe:]CORRection:LOSS:INPut:TABLe:DELete on page 124
Delete output loss table:
[SENSe:]CORRection:LOSS:OUTPut:TABLe:DELete on page 126
Delete calibration loss table:
[SENSe:]CORRection:LOSS:CALibration:TABLe:DELete on page 121
Copy To
Opens the Edit Table dialog box to modify the selected table and save it under a new
name.
Import / Export Table
Opens a dialog box to select a loss table to import or export.
An import copies the loss table into the default loss table directory. An export copies
the table to a location outside the default loss table directory, e.g. a memory stick. The
file extension has to be *.loss.
57User Manual 1176.8497.02 ─ 04
Page 58

R&S®FPS-K30
5.6 Configuring the Analyzer
Configuration
Configuring the Analyzer
Access: "Overview" > "Spectrum Analyzer"
Or: [MEAS CONFIG] > "Meas Settings"
The measurement settings include parameters related to the second stage correction
measurement.
2nd Stage Correction.................................................................................................... 58
Resolution Bandwidth (RBW)........................................................................................58
Sweep Time.................................................................................................................. 59
Settling Time................................................................................................................. 59
Average.........................................................................................................................59
Ref Level.......................................................................................................................59
Auto Level Range..........................................................................................................60
RF Attenuation.............................................................................................................. 60
Preamplifier (option B22/B24).......................................................................................60
2nd Stage Correction
Turns 2nd stage correction on and off.
If enabled, the application uses the calibration data to compensate for the inherent
noise of the analyzer when calculating the measurement results.
If disabled, the application does not correct the measurement results, even if a valid
calibration has been performed. Note that correction data is not deleted if you turn off
the 2nd stage correction.
For more information, see Chapter 4.6, "Calibration (2nd Stage Correction)",
on page 30.
Remote command:
State: [SENSe:]CORRection[:STATe] on page 128
Calibration measurement selection:[SENSe:]CONFigure:CORRection
on page 127
Resolution Bandwidth (RBW)
Defines the resolution bandwidth for the measurement.
For more information on the resolution bandwidth, see Chapter 4.7, "Separating Sig-
nals by Selecting an Appropriate Resolution Bandwidth", on page 33.
58User Manual 1176.8497.02 ─ 04
Page 59

R&S®FPS-K30
Configuration
Configuring the Analyzer
Remote command:
[SENSe:]BANDwidth[:RESolution] on page 127
Sweep Time
Defines the sweep time for the measurement.
The sweep time is the time it takes the analyzer to perform a measurement at one
measurement frequency.
Note that noise figure measurements perform two measurements during one sweep.
One with the noise source turned on, one with the noise source turned off.
Remote command:
[SENSe:]SWEep:TIME on page 130
Settling Time
Defines the settling time of the DUT and the noise source.
Most noise sources need a certain amount of time to settle after you turn them on.
Low-frequency DUTs can require a certain time until their coupling capacitors have
been charged or discharged. Both are defined as the settling time. For details on the
settling time, refer to the datasheet of the noise source.
Remote command:
SYSTem:CONFigure:DUT:STIMe on page 132
Average
Defines the number of measurements that are used to average the results.
The more measurements you include in the averaging, the more accurate and stable
the results are. However, accuracy and stability come at the price of measurement
speed.
Remote command:
[SENSe:]SWEep:COUNt on page 129
Ref Level
Turns automatic determination of the reference level on and off.
The reference level is the power level the R&S FPS expects at the RF input. Keep in
mind that the noise signal has a high crest factor. To avoid an instrument overload, set
the reference level to the peak envelope power of the noise signal, not to the mean
power.
Set the reference level to approximately 5 dB to 15 dB above the noise display that
occurs with the DUT connected and the noise source activated.
To get the best dynamic range, set the reference level as low as possible. At the same
time, make sure that the maximum signal level does not exceed the reference level. If
it does, it can overload the RF and IF stages of the analyzer, regardless of the signal
power. Measurement results can deteriorate.
Note that the signal level at the A/D converter can be stronger than the level the
R&S FPS displays because the resolution bandwidths are implemented digitally after
the A/D converter.
59User Manual 1176.8497.02 ─ 04
Page 60

R&S®FPS-K30
Configuration
Configuring the Analyzer
If automatic detection of the reference level is on, the application performs a measurement to determine the ideal reference level. The time of this measurement depends on
the state of the "2nd Stage Correction".
●
"2nd Stage Correction" is enabled
The application determines the reference level before the calibration starts. The
reference level is based on several test measurements on the start frequency.
For more information, see "Auto Level Range" on page 60.
●
"2nd Stage Correction" is disabled
The application determines the reference level before the measurement begins.
The reference level is based on the measurement of the first frequency that is
measured. After this measurement is done, the application resumes the measurement.
If manual selection of the reference level is on, you can define the reference level in
the corresponding input field.
Note: Reference level. Even for DUTs with a high-ripple frequency response it can be
useful to define the reference level manually. Determining the reference level automatically does not always result in optimal settings.
Remote command:
Manual reference level:
DISPlay[:WINDow<n>]:TRACe<t>:Y[:SCALe]:RLEVel on page 130
Automatic reference level:
DISPlay[:WINDow<n>]:TRACe<t>:Y[:SCALe]:RLEVel:AUTO on page 130
Auto Level Range
Defines the maximum expected gain of the DUT.
The application uses the auto level range to determine the reference level automati-
cally if the 2nd stage correction is on.
Make sure the range does not exceed the actual gain of the DUT by more than 10 dB.
Remote command:
SYSTem:CONFigure:DUT:GAIN on page 132
RF Attenuation
Defines the RF attenuation of the analyzer.
The attenuation is applied to the signal at the RF input.
Attenuation affects the quality of the noise figure measurement results. For a low noise
figure of the analyzer (and thus more accurate measurement results), keep the attenuation as low as possible. No attenuation is best. However, some high-power DUTs
require attenuation to avoid an overload of the analyzer. An attenuation of 10 dB provides a better input VSWR of the analyzer, but results in a deteriorating noise figure.
Remote command:
INPut<ip>:ATTenuation on page 131
Preamplifier (option B22/B24)
Switches the preamplifier on and off. If activated, the input signal is amplified by 20 dB.
If option R&S FPS-B22 is installed, the preamplifier is only active below 7 GHz.
If option R&S FPS-B24 is installed, the preamplifier is active for all frequencies.
60User Manual 1176.8497.02 ─ 04
Page 61

R&S®FPS-K30
5.7 Using the Uncertainty Calculator
Configuration
Using the Uncertainty Calculator
Make sure that the used preamplifier covers all (possibly upconverted) frequencies to
be measured during the noise figure measurement. The frequencies can vary depending on the Tuning Mode. For example, a sweep mode can require a span above
7 GHz, while a single frequency stays below. Thus, the preamplifier can be activated or
deactivated individually for different tuning modes. When you switch tuning modes, the
defined preamplifier state is adapted.
Remote command:
INPut:GAIN:STATe on page 131
Access: [MEAS CONFIG] > "Uncertainty Calculation"
Noise figure measurements are subject to uncertainty. The noise figure measurement
is meaningless if the measurement uncertainty is too large. Knowing the uncertainty of
the noise figure measurement adds value especially when comparing measurement
results.
Note that the noise figure uncertainty is not calculated for frequencies above 67 GHz
because input VSWR values are not specified.
61User Manual 1176.8497.02 ─ 04
Page 62

R&S®FPS-K30
Configuration
Using the Uncertainty Calculator
Uncertainty values and systematic error recognition
Note that the uncertainty calculation only takes systematic measurement inaccuracies
into account.
The most significant inaccuracies are:
●
Uncertainties of the noise source and the analyzer
●
Input and output matching
●
Noise figure and gain of the DUT
●
Noise figure of the analyzer
The accuracy of the measurement can also be affected by insufficient repeatability during calibration or measurement.
The repeatability is mainly affected by:
●
Signal-to-noise ratio during calibration and measurement
●
Measurement time (if it is too short)
●
Environmental conditions (e.g. a change in the temperature between measurements)
●
Mechanical stability of the test setup
For more background information on noise figure measurement uncertainty, refer to the
application note "The Y-Factor Technique for Noise Figure Measurement" available for
download on the Rohde & Schwarz homepage (http://www.rohde-schwarz.com/en/
applications/the-y-factor-technique-for-noise-figure-measurements-applicationnote_56280-15484.html).
In addition to the parameters described here, the application also considers several
parameters from the general measurement configuration when calculating the uncertainty.
●
Measurement mode
●
2nd Stage Correction
If 2nd stage correction is on, but no calibration data is available, uncertainty is calculated without the 2nd stage correction data.
●
Internal preamplification
●
RF Attenuation
●
Temperature
●
ENR values
5.7.1 Configuring Noise Source Characteristics
Access: [MEAS CONFIG] > "Uncertainty Calculation"
The Uncertainty Calculator supports individual characteristics for a noise source used
during calibration and the measurement.
If you are using a Common ENR, the application assumes that the Output Match and
ENR Uncert(ainty) are the same during calibration and measurement. Only the "Mea-
surement Noise Source" parameters are displayed.
62User Manual 1176.8497.02 ─ 04
Page 63

R&S®FPS-K30
Configuration
Using the Uncertainty Calculator
If you are using a different noise source during calibration and measurement, the
Uncertainty Calculator adds an Output Match and ENR Uncert(ainty) required for
uncertainty calculation during calibration.
Note that you have to turn off the Common Noise Source if you have to define the values of the noise source used during calibration.
Common Source for Meas and Cal...............................................................................63
Output Match.................................................................................................................63
ENR Uncert(ainty).........................................................................................................63
Temperature Uncert(ainty)............................................................................................ 63
Common Source for Meas and Cal
Controls the way the application calculates the uncertainty for the noise source.
Turn on the switch when you use the same noise source during calibration and mea-
surement. Only one set of fields to define the noise source characteristics is available.
The application calculates the uncertainty according to the values you have entered in
there.
Turn the switch off when you use different noise sources during calibration and measurement. The application shows an additional set of fields to define the noise source
characteristics. The uncertainty calculation also includes these values.
The switch is available if you have turned on Common Noise Source.
Remote command:
CALCulate<n>:UNCertainty:COMMon on page 133
Output Match
Defines the output match of the noise source you are using.
You can define the output match either as the VSWR or as the return loss (RL).
Refer to the datasheet of the noise source for these values.
Remote command:
CALCulate<n>:UNCertainty:MATCh:SOURce:CALibration:RL on page 139
CALCulate<n>:UNCertainty:MATCh:SOURce:RL on page 139
CALCulate<n>:UNCertainty:MATCh:SOURce:CALibration[:VSWR]
on page 139
CALCulate<n>:UNCertainty:MATCh:SOURce:CALibration:RL on page 139
ENR Uncert(ainty)
Defines the uncertainty of the excess noise ratio of the noise source you are using.
Refer to the datasheet of the noise source for this value.
Available for noise sources with diode characteristics.
Remote command:
CALCulate<n>:UNCertainty:ENR:UNCertainty on page 136
CALCulate<n>:UNCertainty:ENR:CALibration:UNCertainty on page 135
Temperature Uncert(ainty)
Defines the uncertainty of the hot and cold temperatures of the noise source you are
using.
63User Manual 1176.8497.02 ─ 04
Page 64

R&S®FPS-K30
5.7.2 Configuring DUT Characteristics
Configuration
Using the Uncertainty Calculator
Refer to the datasheet of the noise source for these values.
Available for resistor noise sources.
Remote command:
CALCulate<n>:UNCertainty:ENR:UNCertainty:COLD on page 136
CALCulate<n>:UNCertainty:ENR:CALibration:UNCertainty:HOT
on page 135
CALCulate<n>:UNCertainty:ENR:CALibration:UNCertainty:COLD
on page 135
CALCulate<n>:UNCertainty:ENR:CALibration:UNCertainty:HOT
on page 135
Access: [MEAS CONFIG] > "Uncertainty Calculation"
Input / Output Match......................................................................................................64
Use Measurement Values............................................................................................. 64
Input / Output Match
Defines the match at the DUT input and output.
You can define the match either as the VSWR or as the return loss (RL). If you define
the VSWR or the return loss, the application automatically calculates the other.
If these values are not defined in the DUT datasheet, determine these values, for
example, with a network analyzer.
Remote command:
CALCulate<n>:UNCertainty:MATCh:DUT:IN[:VSWR] on page 137
CALCulate<n>:UNCertainty:MATCh:DUT:IN:RL on page 137
CALCulate<n>:UNCertainty:MATCh:DUT:OUT[:VSWR] on page 138
CALCulate<n>:UNCertainty:MATCh:DUT:OUT:RL on page 138
Use Measurement Values
Turns automatic determination of the DUT characteristics used for the uncertainty calculation on and off.
If on, the application calculates the uncertainty with the DUT characteristics (noise figure, gain and frequency) resulting from the noise figure measurement. For this method,
the application calculates the uncertainty for each measurement point (or frequency)
based on the noise figure and gain results of the last measurement.
If you have selected automatic determination of the DUT characteristics, the application does not show a result in the "NF Uncertainty +/-" field in the dialog box. Instead,
to view the uncertainty at all measurement points, use the "Result Table".
If off, define the gain, noise figure and frequency of the DUT manually for a single frequency. With this manual determination of the DUT characteristics, the application only
calculates the uncertainty for that frequency and shows the result in the "NF Uncertainty +/-" field in the dialog box.
●
Noise Figure of the DUT
●
Gain of the DUT
64User Manual 1176.8497.02 ─ 04
Page 65

R&S®FPS-K30
5.7.3 Configuring Analyzer Characteristics
Configuration
Using the Uncertainty Calculator
●
Frequency of the DUT
Remote command:
Control automatic DUT characteristics determination:
CALCulate<n>:UNCertainty[:RESult]? on page 141
Manual definition of DUT characteristics:
CALCulate<n>:UNCertainty:DATA:NOISe on page 134
CALCulate<n>:UNCertainty:DATA:GAIN on page 134
CALCulate<n>:UNCertainty:DATA:FREQuency on page 133
Access: [MEAS CONFIG] > "Uncertainty Calculation"
For the analyzer characteristics, the application always uses the data specified in the
datasheet of the R&S FPS model you are using. Thus, it is not possible to change or
adjust the analyzer characteristics in any way. The uncertainty calculation takes several analyzer characteristics into account, of which the following are shown as readonly fields in the user interface.
●
SA Input Match: Input match (VSWR or return loss) of the analyzer
●
SA NF Uncert: Noise figure uncertainty of the analyzer
●
SA Gain Uncert: Gain uncertainty of the analyzer
●
SA NF: Noise figure of the analyzer
However, if you are using an external preamplifier in the test setup, you have to specify
its characteristics to get a valid uncertainty result.
Remote commands:
CALCulate<n>:UNCertainty:SANalyzer:GAIN:UNCertainty? on page 141
CALCulate<n>:UNCertainty:SANalyzer:NOISe:UNCertainty? on page 142
External Preamplifier (Ext PA).......................................................................................65
└ Preamplifier noise figure (PA NF)................................................................... 65
└ Preamplifier Gain (PA Gain)............................................................................66
└ Net spectrum analyzer noise figure (Net SA NF)............................................66
External Preamplifier (Ext PA)
If enabled, the application automatically calculates and updates the analyzer characteristics based on the characteristics of the external preamplifier defined here.
Refer to the datasheet of the preamplifier you are using for the values you have to
enter.
Remote command:
CALCulate<n>:UNCertainty:PREamp:STATe on page 141
Preamplifier noise figure (PA NF) ← External Preamplifier (Ext PA)
Defines the noise figure of the preamplifier.
65User Manual 1176.8497.02 ─ 04
Page 66

R&S®FPS-K30
5.7.4 Guidelines and Results
Configuration
Using the Uncertainty Calculator
Remote command:
CALCulate<n>:UNCertainty:PREamp:NOISe on page 140
Preamplifier Gain (PA Gain) ← External Preamplifier (Ext PA)
Defines the gain of the preamplifier.
Remote command:
CALCulate<n>:UNCertainty:PREamp:GAIN on page 140
Net spectrum analyzer noise figure (Net SA NF) ← External Preamplifier (Ext PA)
Shows the noise figure of the analyzer.
If you are using an external preamplifier, the application calculates the noise figure of
the analyzer including the noise figure of the preamplifier and shows the result here.
If you do not use an external preamplifier, this value is the same as the noise figure of
the analyzer shown in the "SA NF" field.
Access: [MEAS CONFIG] > "Uncertainty Calculation"
The lower part of the dialog box contains measurement guidelines that provide information on the quality of measurement and the actual noise figure uncertainty.
Guidelines
The guidelines are an indicator of the quality of the measurement and an indicator the
repeatability of the measurement.
The three guidelines are:
●
Make sure that the noise figure of the DUT and the gain of the DUT is greater than
the noise figure of the analyzer plus 1 dB.
●
Make sure that the ENR of the noise source is greater than the noise figure of the
DUT plus 5 dB.
●
Make sure that the ENR of the noise source is greater than the noise figure of the
analyzer plus 3 dB.
A short form of these guidelines is indicated in the "Uncertainty Calculation" dialog box.
The dialog box also indicates if the guidelines have been met or not by a colored dot.
●
Green light
●
Yellow light
●
Red light : guideline condition not met.
: guideline condition met.
: guideline condition not met, but within 1 dB of being met.
Note that the guidelines have no effect on the actual uncertainty that has been calculated and that they are only considered for measurements with 2nd Stage Correction.
Uncertainty
The "Uncertainty" result is shown only if you define the noise figure and gain characteristics of the DUT manually on a single frequency. In that case, the uncertainty shown in
66User Manual 1176.8497.02 ─ 04
Page 67

R&S®FPS-K30
5.8 Performing Measurements
Configuration
Performing Measurements
the "Uncertainty Calculation" dialog box is valid only for the DUT frequency you have
defined.
The "Measurement Offset" evaluates the internal noise of the R&S FPS that is added
to the noise figure results. The measurement offset result is displayed when 2nd stage
correction is turned off. When you turn on 2nd stage correction, the internal noise is
automatically removed from the uncertainty results, so the measurement offset is not
shown.
If you are using the noise figure and gain that has been determined during a measurement, the uncertainty is displayed only in the result table.
For more information, see "Use Measurement Values" on page 64.
SCPI command:
CALCulate<n>:UNCertainty[:RESult]? on page 141
Access: [SWEEP]
Access (calibration): "Overview" > "Calibrate"
This chapter contains all functionality necessary to control and perform noise figure
measurements.
Continuous Sweep / Run Cont .....................................................................................67
Single Sweep / Run Single ...........................................................................................67
Calibrate........................................................................................................................68
Sweep Time.................................................................................................................. 68
Meas Mode (Auto Manual)............................................................................................68
Continuous Sweep / Run Cont
Initiates a measurement and repeats it continuously until stopped. If necessary, the
application automatically determines the reference level before starting the actual measurement.
While the measurement is running, the "Continuous Sweep" softkey and the [RUN
CONT] key are highlighted. The running measurement can be aborted by selecting the
highlighted softkey or key again. The results are not deleted until a new measurement
is started.
Note: Sequencer. Furthermore, the [RUN CONT] key controls the Sequencer, not individual sweeps. [RUN CONT] starts the Sequencer in continuous mode.
For details on the Sequencer, see the R&S FPS User Manual.
Remote command:
INITiate<n>:CONTinuous on page 143
Single Sweep / Run Single
Initiates a single measurement. The measurement is finished after all frequencies in
the frequency list have been measured. If necessary, the application automatically
determines the reference level before starting the actual measurement.
67User Manual 1176.8497.02 ─ 04
Page 68

R&S®FPS-K30
Configuration
Configuring Inputs and Outputs of the R&S
While the measurement is running, the "Single Sweep" softkey and the [RUN SINGLE]
key are highlighted. The running measurement can be aborted by selecting the highlighted softkey or key again.
Remote command:
INITiate<n>[:IMMediate] on page 144
Calibrate
Initiates a calibration measurement.
For interpolation purposes, R&S FPS-K30 will internally add addiitonal measurement
points at the band switching frequencies. This may increase the time needed to complete the calibration.
For more information see Chapter 4.6, "Calibration (2nd Stage Correction)",
on page 30.
Remote command:
INITiate<n>[:IMMediate] on page 144
when [SENSe:]CONFigure:CORRection is on.
Sweep Time
Defines the sweep time.
For more information see "Sweep Time" on page 59.
FPS
Meas Mode (Auto Manual)
Selects the measurement mode for the hot and cold power measurements.
For more information about the measurement modes see Chapter 4.2, "Measurement
Modes", on page 23.
In manual measurement mode, the application opens a dialog box when you start a
measurement. For more information about its contents see "Performing a manual mea-
surement" on page 23.
Remote command:
[SENSe:]CONFigure:CONTrol on page 145
[SENSe:]CONFigure:MEASurement on page 146
5.9 Configuring Inputs and Outputs of the R&S FPS
The following input settings are available for the R&S FPS Noise Figure measurements
application on the R&S FPS.
● Radio Frequency (RF) Input....................................................................................68
● External Generator..................................................................................................69
5.9.1 Radio Frequency (RF) Input
Access: [INPUT/OUTPUT] > "Input Source Config" > "Input Source" > "Radio Fre-
quency"
68User Manual 1176.8497.02 ─ 04
Page 69

R&S®FPS-K30
Configuration
Configuring Inputs and Outputs of the R&S
The RF input is the default input of the R&S FPS.
Input Coupling ..............................................................................................................69
Impedance ................................................................................................................... 69
YIG-Preselector ............................................................................................................69
Input Coupling
The RF input of the R&S FPS can be coupled by alternating current (AC) or direct current (DC).
AC coupling blocks any DC voltage from the input signal. This is the default setting to
prevent damage to the instrument. Very low frequencies in the input signal may be distorted.
However, some specifications require DC coupling. In this case, you must protect the
instrument from damaging DC input voltages manually. For details, refer to the data
sheet.
Remote command:
INPut<ip>:COUPling on page 147
Impedance
For some measurements, the reference impedance for the measured levels of the
R&S FPS can be set to 50 Ω or 75 Ω.
FPS
Select 75 Ω if the 50 Ω input impedance is transformed to a higher impedance using a
75 Ω adapter of the RAZ type. (That corresponds to 25Ω in series to the input impedance of the instrument.) The correction value in this case is 1.76 dB = 10 log (75Ω/
50Ω).
Remote command:
INPut<ip>:IMPedance on page 147
YIG-Preselector
Enables or disables the YIG-preselector, if available on the R&S FPS.
An internal YIG-preselector at the input of the R&S FPS ensures that image frequen-
cies are rejected. However, this is only possible for a restricted bandwidth. To use the
maximum bandwidth for signal analysis you can disable the YIG-preselector at the
input of the R&S FPS, which can lead to image-frequency display.
Note that the YIG-preselector is active only on frequencies greater than 8 GHz. Therefore, switching the YIG-preselector on or off has no effect if the frequency is below that
value.
Remote command:
INPut<ip>:FILTer:YIG[:STATe] on page 148
5.9.2 External Generator
Access: [INPUT/OUTPUT] > "Input Source Config" > "External Generator"
● Interface Configuration Settings..............................................................................70
● Measurement Configuration....................................................................................71
69User Manual 1176.8497.02 ─ 04
Page 70

R&S®FPS-K30
Configuration
5.9.2.1 Interface Configuration Settings
Access: "Overview" > "Local Oscillator" > "External Generator" > "Measurement Con-
figuration"
Generator Type ............................................................................................................70
Interface ....................................................................................................................... 70
TCPIP Address / Computer Name ...............................................................................70
Reference .....................................................................................................................71
Edit Generator Setup File .............................................................................................71
Frequency Min / Frequency Max ..................................................................................71
Level Min / Level Max .................................................................................................. 71
Configuring Inputs and Outputs of the R&S
FPS
Generator Type
Selects the generator type and thus defines the generator setup file to use.
Remote command:
SYSTem:COMMunicate:RDEVice:GENerator<gen>:TYPE on page 149
Interface
Type of interface connection used.
For details on which signal generators support which interfaces, see the documenta-
tion of the corresponding signal generator.
●
TCP/IP
Remote command:
SYSTem:COMMunicate:RDEVice:GENerator<gen>:INTerface on page 150
TCPIP Address / Computer Name
TCP/IP address of the signal generator
Remote command:
SYSTem:COMMunicate:TCPip:RDEVice:GENerator<gen>:ADDRess
on page 150
70User Manual 1176.8497.02 ─ 04
Page 71

R&S®FPS-K30
Configuration
Configuring Inputs and Outputs of the R&S
Reference
Selects the internal R&S FPS or an external frequency reference to synchronize the
R&S FPS with the generator (default: internal).
Remote command:
SOURce<si>:EXTernal<gen>:ROSCillator[:SOURce] on page 149
Edit Generator Setup File
Displays the setup file for the currently selected Generator Type in read-only mode in
an editor.
Although the existing setup files are displayed in read-only mode in the editor, they can
be saved under a different name (using "File > SaveAs").
For more information, see Chapter 4.4, "External Generator Control", on page 26.
Frequency Min / Frequency Max
For reference only: Lower and upper frequency limit for the generator.
Level Min / Level Max
For reference only: Lower and upper power limit for the generator.
FPS
5.9.2.2 Measurement Configuration
Access: "Overview" > "Local Oscillator" > "External Generator" > "Measurement Con-
figuration"
Automatic Control..........................................................................................................71
Init Before Meas............................................................................................................72
Auto Switch Off..............................................................................................................72
Source Power................................................................................................................72
Frequency Coupling......................................................................................................73
Init External Generator..................................................................................................73
Automatic Control
Turns automatic control of the external generator on and off.
71User Manual 1176.8497.02 ─ 04
Page 72

R&S®FPS-K30
Configuration
Configuring Inputs and Outputs of the R&S
If on, the application controls the configuration of the external generator during measurements by transmitting the required remote commands. The connection is established automatically before a measurement if Init Before Meas is on. To establish the
connection manually at any time, use the Init External Generator function.
Otherwise, you have to control the generator manually. The application assumes that
the generator is configured correctly for the measurement. The remote connection to
the generator is automatically terminated.
Turn on automatic control to perform Fixed IF measurements with the LO frequency
tuned to the current measurement (RF) frequency. Manual control is recommended
only for measurements whose generator settings remain the same during the measurement.
Remote command:
SYSTem:CONFigure:GENerator:CONTrol:STATe on page 150
Init Before Meas
Turns automatic transmission of the external generator configuration on and off.
If enabled, the application transmits a sequence of remote commands that configures
the generator and turns on its RF output before each measurement. Thus, the generator runs with the required configuration and can still receive remote control commands
during a measurement. Automatic initialization requires a slightly longer measurement
time because of the time required to transmit the commands and configure the generator.
If disabled, you have to initialize the generator manually with Init External Generator.
Note that you have to establish the connection before you can perform a measurement
with the external generator.
Remote command:
SYSTem:CONFigure:GENerator:INITialise:AUTO on page 150
FPS
Auto Switch Off
Turns automatic deactivation of the generator's RF output on and off.
If enabled, the application transmits a sequence of remote commands to turn off the
RF output of the generator when a measurement is over. A measurement is over after
a single sweep or if the measurement is aborted. The sequence of commands also
ends the remote control session.
If disabled, you have to turn off the RF output and remote control session manually.
Note that when you close the R&S FPS Noise Figure measurements application, the
generator's RF output is turned off and the remote session is terminated.
Remote command:
SYSTem:CONFigure:GENerator:SWITch:AUTO on page 151
Source Power
Defines the output power of the external generator.
The range depends on the generator you are using and is defined in its data sheet.
Remote command:
SOURce<si>:EXTernal<gen>:POWer[:LEVel] on page 149
72User Manual 1176.8497.02 ─ 04
Page 73

R&S®FPS-K30
21 Offset
rDenominato
Numerator
Offsetff
LOGenera tor
Configuration
Configuring Inputs and Outputs of the R&S FPS
Frequency Coupling
Defines frequency correction characteristics.
The generator frequency is calculated as follows.
With:
●
f
Generator
●
fLO= frequency of the analyzer's LO
●
f
offset<1>
●
f
offset<2>
Use the factors and offsets to compensate one or more components in the test setup
which change the frequency between the generator and the DUT. Make sure, however,
that the result does not exceed the frequency range of the generator.
The application calculates the resulting start and stop frequency based on the values
you apply and displays them below the equation.
Remote command:
SOURce:EXTernal:FREQuency[:FACTor]:DENominator on page 148
SOURce:EXTernal:FREQuency[:FACTor]:NUMerator on page 148
SOURce:EXTernal:FREQuency:OFFSet<of> on page 148
= generator frequency
= offset frequency of the analyzer
= offset frequency of other components
Init External Generator
Establishes a connection to generator and turns on its RF output.
You can establish the connection automatically before a measurement if Init Before
Meas is on.
Note that you have to establish the connection before you can perform a measurement
with the external generator.
Remote command:
SYSTem:CONFigure:GENerator:INITialise[:IMMediate] on page 151
73User Manual 1176.8497.02 ─ 04
Page 74

R&S®FPS-K30
6 Analysis
6.1 Configuring the Display
Analysis
Configuring the Display
This chapter contains all settings and parameters that the application provides to analyze and evaluate measurement results.
● Configuring the Display...........................................................................................74
● Working with Traces................................................................................................77
● Using Markers.........................................................................................................79
● Limit Line Settings and Functions........................................................................... 83
Access: [MEAS CONFIG] > "Result Config"
Display configuration settings configure the way the results are displayed in the diagram.
The contents depend on whether you want to configure a graphical result display or a
numerical result display.
Specifics for
The settings you make apply to the results you have selected in the "Specifics for"
dropdown menu. If more than one window is active, "Specifics for" also puts the focus
on the corresponding window.
● Configuring Graphical Results................................................................................ 74
● Configuring Numerical Results................................................................................76
6.1.1 Configuring Graphical Results
Access: [MEAS CONFIG] > "Result Config" > "Graph"
When configuring graphical results, the dialog box contains functionality to scale and
set up the diagram axes.
74User Manual 1176.8497.02 ─ 04
Page 75

R&S®FPS-K30
Analysis
Configuring the Display
Y-Axis............................................................................................................................ 75
Auto Scale / Min / Max.................................................................................................. 75
Symbols........................................................................................................................ 75
Uncertainty....................................................................................................................75
X-Axis............................................................................................................................76
Y-Axis
Selects the result display and thus the scaling of the vertical axis.
For more information, see Chapter 3, "Measurements and Result Displays",
on page 12.
Auto Scale / Min / Max
Turns automatic scaling of the vertical axis on and off.
If on, the application optimizes the scaling of the vertical axis after each measurement
for ideal viewing of the results.
If off, you can define the scaling manually. The "Min" and "Max" input fields become
available. These two input fields define the values at the top and bottom of the vertical
axis.
Remote command:
Automatic scaling:
DISPlay[:WINDow<n>]:TRACe<t>:Y[:SCALe]:AUTO on page 154
Manual minimum value:
DISPlay[:WINDow<n>]:TRACe<t>:Y[:SCALe]:BOTTom on page 153
Manual maximum value
DISPlay[:WINDow<n>]:TRACe<t>:Y[:SCALe]:TOP on page 154
Symbols
Turns symbols that represent a measurement point on the trace on and off.
Remote command:
DISPlay[:WINDow<n>]:TRACe<t>:SYMBols on page 152
Uncertainty
Displays an additional trace indicating the measured trace values ± the uncertainty values determined by the uncertainty calculator. Thus, you obtain a range of minimum
and maximum result values. This trace is only useful for noise figure measurements.
75User Manual 1176.8497.02 ─ 04
Page 76

R&S®FPS-K30
Analysis
Configuring the Display
Remote command:
DISPlay[:WINDow<n>]:TRACe<t>:UNCertainty on page 152
X-Axis
Selects the frequency data that is displayed on the x-axis.
For measurements on frequency converting DUTs with a variable intermediate fre-
quency, you can display either the RF frequency or the IF frequency.
Note that a change of the x-axis scale applies to all result displays, and also deter-
mines which value is output for trace export.
The "Frequency Axis" scale is also available via the [FREQ] key.
Remote command:
DISPlay[:WINDow<n>]:TRACe<t>:X[:SCALe] on page 153
6.1.2 Configuring Numerical Results
When configuring numerical results, the dialog box selects the type of results you want
to display in the result table. The results in the table are based on a particular trace
that you can select in the corresponding input field.
You can add an aspect of the measurement by placing a checkmark in front of the corresponding result on and remove it by removing the checkmark.
For more information on each result, see Chapter 3, "Measurements and Result Dis-
plays", on page 12.
76User Manual 1176.8497.02 ─ 04
Page 77

R&S®FPS-K30
6.2 Working with Traces
Analysis
Working with Traces
Remote command:
DISPlay[:WINDow<n>]:TABLe:ITEM on page 151
Access (trace configuration): [TRACE] > "Trace Config" > "Traces"
Access (trace export): [TRACE] > "Trace Config" > "Trace / Data Export"
Access (copy trace): [TRACE] > "Trace Config" > "Trace Copy"
A trace is the graphical representation of a set of measurement results in a diagram.
Each measurement window that contains graphical results supports up to four individual traces. Each trace has a different color. Trace settings determine how the measured data is analyzed and displayed on the screen. The trace information, including a
color map and trace mode is summarized in the diagram header.
Traces........................................................................................................................... 77
Smoothing ....................................................................................................................77
Preset Traces................................................................................................................78
Trace Export..................................................................................................................78
└ Export all Traces and all Table Results ..........................................................78
└ Include Instrument & Measurement Settings .................................................78
└ Trace to Export .............................................................................................. 78
└ Decimal Separator ......................................................................................... 78
└ Export Trace to ASCII File ............................................................................. 78
Copy Trace ...................................................................................................................79
Traces
The "Trace 1 to 4" softkeys open the "Traces" tab of the "Trace Configuration" dialog
box.
The "Traces" tab contains functionality to configure a trace.
"Trace Selec-
tion"
"Trace Mode"
Remote command:
Trace mode:
DISPlay[:WINDow<n>]:TRACe<t>:MODE on page 155
Smoothing
If enabled, the trace is smoothed by the specified value (between 1 % and 50 %). The
smoothing value is defined as a percentage of the display width. The larger the
smoothing value, the greater the smoothing effect.
The "Trace 1" to "Trace 4" buttons select a trace. If a trace is
selected, it is highlighted orange.
Note that you cannot select a trace if its trace mode is "Blank".
Selects the trace mode for the corresponding trace.
For more information, see Chapter 4, "Measurement Basics",
on page 21.
77User Manual 1176.8497.02 ─ 04
Page 78

R&S®FPS-K30
Analysis
Working with Traces
Remote command:
DISPlay[:WINDow<n>][:SUBWindow<w>]:TRACe<t>:SMOothing[:STATe]
on page 157
DISPlay[:WINDow<n>][:SUBWindow<w>]:TRACe<t>:SMOothing:APERture
on page 156
Preset Traces
Restores the default configuration for all traces in a window.
Trace Export
The "Trace Export" tab contains functionality to export trace data.
Export all Traces and all Table Results ← Trace Export
Selects all displayed traces and result tables (e.g. Result Summary, marker table etc.)
in the current application for export to an ASCII file.
Alternatively, you can select one specific trace only for export (see Trace to Export ).
The results are output in the same order as they are displayed on the screen: window
by window, trace by trace, and table row by table row.
Remote command:
FORMat:DEXPort:TRACes on page 159
Include Instrument & Measurement Settings ← Trace Export
Includes additional instrument and measurement settings in the header of the export
file for result data.
Remote command:
FORMat:DEXPort:HEADer on page 158
Trace to Export ← Trace Export
Defines an individual trace to be exported to a file.
This setting is not available if Export all Traces and all Table Results is selected.
Decimal Separator ← Trace Export
Defines the decimal separator for floating-point numerals for the data export/import
files. Evaluation programs require different separators in different languages.
Remote command:
FORMat:DEXPort:DSEParator on page 158
Export Trace to ASCII File ← Trace Export
Opens a file selection dialog box and saves the selected trace in ASCII format (.dat)
to the specified file and directory.
The results are output in the same order as they are displayed on the screen: window
by window, trace by trace, and table row by table row.
The column headers are provided as the first row. Whether the frequency value represents the RF or IF frequency depends on the X-Axis setting.
Remote command:
MMEMory:STORe<n>:TRACe on page 159
78User Manual 1176.8497.02 ─ 04
Page 79

R&S®FPS-K30
6.3 Using Markers
Analysis
Using Markers
Copy Trace
Access: "Overview" > "Analysis" > "Traces" > "Copy Trace"
Or: [TRACE] > "Copy Trace"
Copies trace data to another trace.
The first group of buttons (labeled "Trace 1" to "Trace 4" ) selects the source trace. The
second group of buttons (labeled "Copy to Trace 1" to "Copy to Trace 4" ) selects the
destination.
Remote command:
TRACe<n>:COPY on page 159
Markers help you to read out measurement results for particular frequencies or mark a
particular point on a trace. The noise figure application features four markers. Markers
in the noise figure application are linked. If you use more than one measurement window and activate a marker in one window, it also appears in all other measurement
windows on the same horizontal position.
● Marker Configuration...............................................................................................79
● Marker Positioning.................................................................................................. 81
6.3.1 Marker Configuration
Access (marker configuration): [MKR] > "Marker Config" > "Marker"
Access (marker settings): [MKR] > "Marker Config" > "Marker Settings"
The "Marker Configuration" dialog box and the "Marker" menu contain all functionality
necessary to control markers.
The "Marker Configuration" dialog box consists of two tabs.
The "Markers" tab contains functionality to define characteristics for each marker.
The "Marker Settings" tab contains general marker functionality.
79User Manual 1176.8497.02 ─ 04
Page 80

R&S®FPS-K30
Analysis
Using Markers
Marker (1...4).................................................................................................................80
Marker Type .................................................................................................................80
Marker to Trace.............................................................................................................80
All Markers Off ..............................................................................................................80
Marker Config................................................................................................................80
Marker Table Display ....................................................................................................81
Marker Info ...................................................................................................................81
Marker (1...4)
Selects or turns the corresponding marker on and off.
Turning on a marker also opens an input field to define the horizontal position of the
marker.
By default, the first marker you turn on is a normal marker, all others are delta markers.
Marker Type
Toggles the marker type.
The type for marker 1 is always "Normal" , the type for delta marker 1 is always
"Delta" . These types cannot be changed.
Note: If normal marker 1 is the active marker, switching the "Mkr Type" activates an
additional delta marker 1. For any other marker, switching the marker type does not
activate an additional marker, it only switches the type of the selected marker.
"Normal"
"Delta"
Remote command:
CALCulate<n>:MARKer<m>[:STATe] on page 170
CALCulate<n>:DELTamarker<m>[:STATe] on page 173
Marker to Trace
Opens an input field to assign the marker to a particular trace if you are using more
than one trace.
All Markers Off
Deactivates all markers in one step.
Remote command:
CALCulate<n>:MARKer<m>:AOFF on page 170
A normal marker indicates the absolute value at the defined position
in the diagram.
A delta marker defines the value of the marker relative to the speci-
fied reference marker (marker 1 by default).
Marker Config
Opens the "Marker Configuration" dialog box.
80User Manual 1176.8497.02 ─ 04
Page 81

R&S®FPS-K30
Analysis
Using Markers
The "Marker Configuration" dialog box contains all marker functions necessary to set
up the four markers supported by the application.
●
Selected
Highlights the currently selected marker.
●
State
Turns a marker on and off.
●
X-value
Defines the marker position on the horizontal axis.
●
Type
Selects the marker type. For more information see " Marker Type " on page 80.
●
Trace
Selects the trace the marker is positioned on.
Marker Table Display
Defines how the marker information is displayed.
"On"
"Off"
Remote command:
DISPlay[:WINDow<n>]:MTABle on page 175
Displays the marker information in a table in a separate area beneath
the diagram.
No separate marker table is displayed.
If Marker Info is active, the marker information is displayed within the
diagram area.
Marker Info
Turns the marker information displayed in the diagram on and off.
Remote command:
DISPlay[:WINDow<n>]:MINFo[:STATe] on page 175
6.3.2 Marker Positioning
If you are using more than one measurement window, the application performs the
peak search in the currently selected measurement window. The currently selected
measurement window has a blue border. Because the markers are linked in the noise
figure application, the frequency position of the marker in the other window is updated
accordingly, even if it means that the marker is on a peak in one window only.
Select Marker <x>.........................................................................................................82
Peak Search .................................................................................................................82
Search Next Peak ........................................................................................................ 82
81User Manual 1176.8497.02 ─ 04
Page 82

R&S®FPS-K30
Analysis
Using Markers
Search Minimum .......................................................................................................... 82
Search Next Minimum ..................................................................................................83
Marker to Single Frequency..........................................................................................83
Select Marker <x>
Opens a dialog box to select and activate or deactivate one or more markers.
The number in the softkey label (<x>) shows the number of the currently selected
marker.
Remote command:
Marker selected via suffix <m> in remote commands.
Peak Search
Sets the selected marker/delta marker to the maximum of the trace. If no marker is
active, marker 1 is activated.
Remote command:
CALCulate<n>:MARKer<m>:MAXimum[:PEAK] on page 177
CALCulate<n>:DELTamarker<m>:MAXimum[:PEAK] on page 179
Search Next Peak
Sets the selected marker/delta marker to the next (lower) maximum of the assigned
trace. If no marker is active, marker 1 is activated.
Remote command:
CALCulate<n>:MARKer<m>:MAXimum:NEXT on page 176
CALCulate<n>:MARKer<m>:MAXimum:RIGHt on page 177
CALCulate<n>:MARKer<m>:MAXimum:LEFT on page 176
CALCulate<n>:DELTamarker<m>:MAXimum:NEXT on page 179
CALCulate<n>:DELTamarker<m>:MAXimum:RIGHt on page 179
CALCulate<n>:DELTamarker<m>:MAXimum:LEFT on page 178
Search Minimum
Sets the selected marker/delta marker to the minimum of the trace. If no marker is
active, marker 1 is activated.
82User Manual 1176.8497.02 ─ 04
Page 83

R&S®FPS-K30
Analysis
Limit Line Settings and Functions
Remote command:
CALCulate<n>:MARKer<m>:MINimum[:PEAK] on page 178
CALCulate<n>:DELTamarker<m>:MINimum[:PEAK] on page 180
Search Next Minimum
Sets the selected marker/delta marker to the next (higher) minimum of the selected
trace. If no marker is active, marker 1 is activated.
Remote command:
CALCulate<n>:MARKer<m>:MINimum:NEXT on page 177
CALCulate<n>:MARKer<m>:MINimum:LEFT on page 177
CALCulate<n>:MARKer<m>:MINimum:RIGHt on page 178
CALCulate<n>:DELTamarker<m>:MINimum:NEXT on page 180
CALCulate<n>:DELTamarker<m>:MINimum:LEFT on page 179
CALCulate<n>:DELTamarker<m>:MINimum:RIGHt on page 180
Marker to Single Frequency
Starts a single frequency measurement on the current marker position.
When you use this function, the application changes the tuning mode and automati-
cally adjusts the single frequency to that of the current marker position.
For more information see Chapter 4.1.3, "Single Frequency Measurements",
on page 22.
6.4 Limit Line Settings and Functions
Access: [LINES]
The noise figure measurement application supports up to eight active limit lines in each
active measurement window.
Stored limit line settings
When storing and recalling limit line settings, consider the information provided in the
Data Management chapter of the R&S FPS User Manual.
● Limit Line Management...........................................................................................83
● Limit Line Details.....................................................................................................85
6.4.1 Limit Line Management
Access: "Overview" > "Analysis" > "Lines" > "Limit Lines"
or: [LINES] > "Line Config" > "Limit Lines"
For the limit line overview, the R&S FPS searches for all stored limit lines with the file
extension .LIN in the limits subfolder of the main installation folder. The overview
allows you to determine which limit lines are available and can be used for the current
measurement.
83User Manual 1176.8497.02 ─ 04
Page 84

R&S®FPS-K30
Analysis
Limit Line Settings and Functions
For details on settings for individual lines see Chapter 6.4.2, "Limit Line Details",
on page 85.
Name ............................................................................................................................84
Unit ...............................................................................................................................84
Compatibility .................................................................................................................84
Visibility ........................................................................................................................ 84
Traces to be Checked ..................................................................................................84
Comment ......................................................................................................................84
Show Compatible Limit Lines .......................................................................................84
Show Lines for Noise ................................................................................................... 85
Create New Line .......................................................................................................... 85
Edit Line ....................................................................................................................... 85
Copy Line .....................................................................................................................85
Delete Line ...................................................................................................................85
Disable All Lines ...........................................................................................................85
Name
The name of the stored limit line.
Unit
The unit in which the y-values of the data points of the limit line are defined.
Compatibility
Indicates whether the limit line definition is compatible with the current measurement
settings.
Visibility
Displays or hides the limit line in the diagram. Up to 8 limit lines can be visible at the
same time. Inactive limit lines can also be displayed in the diagram.
Remote command:
CALCulate<n>:LIMit<li>:LOWer:STATe on page 164
CALCulate<n>:LIMit<li>:UPPer:STATe on page 165
CALCulate<n>:LIMit<li>:ACTive? on page 166
Traces to be Checked
Defines which traces are automatically checked for conformance with the limit lines. As
soon as a trace to be checked is defined, the assigned limit line is active. One limit line
can be activated for several traces simultaneously. If any of the "Traces to be
Checked" violate any of the active limit lines, a message is indicated in the diagram.
Remote command:
CALCulate<n>:LIMit<li>:TRACe<t>:CHECk on page 169
Comment
An optional description of the limit line.
Show Compatible Limit Lines
Defines which of the stored limit lines are included in the overview.
84User Manual 1176.8497.02 ─ 04
Page 85

R&S®FPS-K30
Analysis
Limit Line Settings and Functions
If active, only limit lines that are compatible to the result display currently in focus are
displayed.
Show Lines for Noise
If activated (default), only limit lines created for noise figure measurements are displayed. Otherwise, all limit lines are displayed.
Create New Line
Creates a new limit line.
Edit Line
Edit an existing limit line configuration.
Copy Line
Copy the selected limit line configuration to create a new line.
Remote command:
CALCulate<n>:LIMit<li>:COPY on page 166
Delete Line
Delete the selected limit line configuration.
Remote command:
CALCulate<n>:LIMit<li>:DELete on page 167
Disable All Lines
Disable all limit lines in one step.
Remote command:
CALCulate<n>:LIMit<li>:STATe on page 168
6.4.2 Limit Line Details
Access: "Overview" > "Analysis" > "Lines" > "Limit Lines" > "New" / "Edit" / "Copy To"
or: [LINES] > "Line Config" > "Limit Lines" > "New" / "Edit" / "Copy To"
85User Manual 1176.8497.02 ─ 04
Page 86

R&S®FPS-K30
Analysis
Limit Line Settings and Functions
Name ............................................................................................................................86
Comment ......................................................................................................................86
Y-Axis ........................................................................................................................... 86
Data Points ...................................................................................................................86
Insert Value .................................................................................................................. 87
Delete Value .................................................................................................................87
Shift x ........................................................................................................................... 87
Shift y ........................................................................................................................... 87
Save .............................................................................................................................87
Name
Defines the limit line name. All names must be compatible with Windows conventions
for file names. The limit line data is stored under this name (with a .LIN extension).
Remote command:
CALCulate<n>:LIMit<li>:NAME on page 161
Comment
Defines an optional comment for the limit line.
Remote command:
CALCulate<n>:LIMit<li>:COMMent on page 161
Y-Axis
Describes the vertical axis on which the data points of the limit line are defined.
You can select the type of limit line (upper or lower) for each type of result. From that
information, the application sets the level unit and y-axis scaling. Both are then fix
parameters because the unit depends on the result and the scaling is always absolute
in case of noise figure measurements.
Data Points
Each limit line is defined by a minimum of 2 and a maximum of 200 data points. Each
data point is defined by its position (x-axis) and value (y-value). Data points must be
defined in ascending order. The same position can have two different values.
86User Manual 1176.8497.02 ─ 04
Page 87

R&S®FPS-K30
Analysis
Limit Line Settings and Functions
Remote command:
CALCulate<n>:LIMit<li>:CONTrol[:DATA] on page 162
CALCulate<n>:LIMit<li>:LOWer[:DATA] on page 163
CALCulate<n>:LIMit<li>:UPPer[:DATA] on page 165
Insert Value
Inserts a data point in the limit line above the selected one in the "Edit Limit Line" dialog box.
Delete Value
Deletes the selected data point in the "Edit Limit Line" dialog box.
Shift x
Shifts the x-value of each data point horizontally by the defined shift width.
Remote command:
CALCulate<n>:LIMit<li>:CONTrol:SHIFt on page 163
Shift y
Shifts the y-value of each data point vertically by the defined shift width.
Remote command:
CALCulate<n>:LIMit<li>:LOWer:SHIFt on page 164
CALCulate<n>:LIMit<li>:UPPer:SHIFt on page 165
Save
Saves the currently edited limit line under the name defined in the "Name" field.
87User Manual 1176.8497.02 ─ 04
Page 88

R&S®FPS-K30
7 Remote Control Commands for Noise Fig-
Remote Control Commands for Noise Figure Measurements
ure Measurements
The following remote control commands are required to configure and perform noise
figure measurements in a remote environment. The R&S FPS must already be set up
for remote operation in a network as described in the base unit manual.
Common functionality
Note that basic tasks that are also performed in the base unit in the same way are not
described here. For a description of such tasks, see the R&S FPS User Manual.
In particular, this includes:
●
Managing Settings and Results, i.e. storing and loading settings and result data.
●
Basic instrument configuration, e.g. checking the system configuration, customizing
the screen layout, or configuring networks and remote operation.
●
Using the common status registers (specific status registers for Pulse measurements are not used).
Channel-specific commands
Apart from a few general commands on the R&S FPS, most commands refer to the
currently active channel. Thus, always remember to activate a Noise Figure channel
before starting a remote program for a noise figure measurement.
● Common Suffixes....................................................................................................89
● Introduction............................................................................................................. 89
● Controlling the Noise Figure Measurement Channel.............................................. 94
● Working with Windows in the Display..................................................................... 98
● General Window Commands................................................................................ 104
● Retrieving Measurement Results..........................................................................105
● Defining the Measurement Frequency..................................................................106
● Selecting DUT Characteristics...............................................................................111
● Configuring the Noise Source............................................................................... 113
● Configuring Additional Loss.................................................................................. 120
● Configuring the Analyzer.......................................................................................127
● Using the Uncertainty Calculator...........................................................................132
● Performing Measurements....................................................................................142
● Configuring the Inputs and Outputs...................................................................... 147
● Configuring the Display.........................................................................................151
● Working with Traces..............................................................................................155
● Working with Limit Lines....................................................................................... 160
● Working with Markers............................................................................................169
● Using the Status Register..................................................................................... 180
● Deprecated Remote Commands for Noise Figure Measurements....................... 187
● Programming Example: Measuring a Noise Figure.............................................. 188
88User Manual 1176.8497.02 ─ 04
Page 89

R&S®FPS-K30
7.1 Common Suffixes
Remote Control Commands for Noise Figure Measurements
Introduction
In the R&S FPS Noise Figure measurements application, the following common suffixes are used in remote commands:
Table 7-1: Common suffixes used in remote commands in the R&S FPS Noise Figure measurements
Suffix Value range Description
<m> 1 to 4 Marker
<n> 1 to 16 Window (in the currently selected channel)
<t> 1 to 4 Trace
<li> 1 to 8 Limit line
application
7.2 Introduction
Commands are program messages that a controller (e.g. a PC) sends to the instrument or software. They operate its functions ('setting commands' or 'events') and
request information ('query commands'). Some commands can only be used in one
way, others work in two ways (setting and query). If not indicated otherwise, the commands can be used for settings and queries.
The syntax of a SCPI command consists of a header and, in most cases, one or more
parameters. To use a command as a query, you have to append a question mark after
the last header element, even if the command contains a parameter.
A header contains one or more keywords, separated by a colon. Header and parameters are separated by a "white space" (ASCII code 0 to 9, 11 to 32 decimal, e.g. blank).
If there is more than one parameter for a command, these are separated by a comma
from one another.
Only the most important characteristics that you need to know when working with SCPI
commands are described here. For a more complete description, refer to the User
Manual of the R&S FPS.
Remote command examples
Note that some remote command examples mentioned in this general introduction may
not be supported by this particular application.
7.2.1 Conventions used in Descriptions
Note the following conventions used in the remote command descriptions:
●
Command usage
If not specified otherwise, commands can be used both for setting and for querying
parameters.
89User Manual 1176.8497.02 ─ 04
Page 90

R&S®FPS-K30
Remote Control Commands for Noise Figure Measurements
Introduction
If a command can be used for setting or querying only, or if it initiates an event, the
usage is stated explicitly.
●
Parameter usage
If not specified otherwise, a parameter can be used to set a value and it is the
result of a query.
Parameters required only for setting are indicated as Setting parameters.
Parameters required only to refine a query are indicated as Query parameters.
Parameters that are only returned as the result of a query are indicated as Return
values.
●
Conformity
Commands that are taken from the SCPI standard are indicated as SCPI confirmed. All commands used by the R&S FPS follow the SCPI syntax rules.
●
Asynchronous commands
A command which does not automatically finish executing before the next command starts executing (overlapping command) is indicated as an Asynchronous
command.
●
Reset values (*RST)
Default parameter values that are used directly after resetting the instrument (*RST
command) are indicated as *RST values, if available.
●
Default unit
The default unit is used for numeric values if no other unit is provided with the
parameter.
●
Manual operation
If the result of a remote command can also be achieved in manual operation, a link
to the description is inserted.
7.2.2 Long and Short Form
The keywords have a long and a short form. You can use either the long or the short
form, but no other abbreviations of the keywords.
The short form is emphasized in upper case letters. Note however, that this emphasis
only serves the purpose to distinguish the short from the long form in the manual. For
the instrument, the case does not matter.
Example:
SENSe:FREQuency:CENTer is the same as SENS:FREQ:CENT.
7.2.3 Numeric Suffixes
Some keywords have a numeric suffix if the command can be applied to multiple
instances of an object. In that case, the suffix selects a particular instance (e.g. a measurement window).
Numeric suffixes are indicated by angular brackets (<n>) next to the keyword.
If you don't quote a suffix for keywords that support one, a 1 is assumed.
90User Manual 1176.8497.02 ─ 04
Page 91

R&S®FPS-K30
7.2.4 Optional Keywords
Remote Control Commands for Noise Figure Measurements
Introduction
Example:
DISPlay[:WINDow<1...4>]:ZOOM:STATe enables the zoom in a particular measurement window, selected by the suffix at WINDow.
DISPlay:WINDow4:ZOOM:STATe ON refers to window 4.
Some keywords are optional and are only part of the syntax because of SCPI compliance. You can include them in the header or not.
Note that if an optional keyword has a numeric suffix and you need to use the suffix,
you have to include the optional keyword. Otherwise, the suffix of the missing keyword
is assumed to be the value 1.
Optional keywords are emphasized with square brackets.
Example:
Without a numeric suffix in the optional keyword:
[SENSe:]FREQuency:CENTer is the same as FREQuency:CENTer
With a numeric suffix in the optional keyword:
DISPlay[:WINDow<1...4>]:ZOOM:STATe
DISPlay:ZOOM:STATe ON enables the zoom in window 1 (no suffix).
DISPlay:WINDow4:ZOOM:STATe ON enables the zoom in window 4.
7.2.5 Alternative Keywords
A vertical stroke indicates alternatives for a specific keyword. You can use both keywords to the same effect.
Example:
[SENSe:]BANDwidth|BWIDth[:RESolution]
In the short form without optional keywords, BAND 1MHZ would have the same effect
as BWID 1MHZ.
7.2.6 SCPI Parameters
Many commands feature one or more parameters.
If a command supports more than one parameter, these are separated by a comma.
Example:
LAYout:ADD:WINDow Spectrum,LEFT,MTABle
Parameters may have different forms of values.
91User Manual 1176.8497.02 ─ 04
Page 92

R&S®FPS-K30
7.2.6.1 Numeric Values
Remote Control Commands for Noise Figure Measurements
Introduction
● Numeric Values....................................................................................................... 92
● Boolean...................................................................................................................93
● Character Data........................................................................................................93
● Character Strings.................................................................................................... 93
● Block Data...............................................................................................................93
Numeric values can be entered in any form, i.e. with sign, decimal point or exponent. In
case of physical quantities, you can also add the unit. If the unit is missing, the command uses the basic unit.
Example:
With unit: SENSe:FREQuency:CENTer 1GHZ
Without unit: SENSe:FREQuency:CENTer 1E9 would also set a frequency of 1 GHz.
Values exceeding the resolution of the instrument are rounded up or down.
If the number you have entered is not supported (e.g. in case of discrete steps), the
command returns an error.
Instead of a number, you can also set numeric values with a text parameter in special
cases.
●
MIN/MAX
Defines the minimum or maximum numeric value that is supported.
●
DEF
Defines the default value.
●
UP/DOWN
Increases or decreases the numeric value by one step. The step size depends on
the setting. In some cases you can customize the step size with a corresponding
command.
Querying numeric values
When you query numeric values, the system returns a number. In case of physical
quantities, it applies the basic unit (e.g. Hz in case of frequencies). The number of digits after the decimal point depends on the type of numeric value.
Example:
Setting: SENSe:FREQuency:CENTer 1GHZ
Query: SENSe:FREQuency:CENTer? would return 1E9
In some cases, numeric values may be returned as text.
●
INF/NINF
Infinity or negative infinity. Represents the numeric values 9.9E37 or -9.9E37.
●
NAN
92User Manual 1176.8497.02 ─ 04
Page 93

R&S®FPS-K30
7.2.6.2 Boolean
Remote Control Commands for Noise Figure Measurements
Introduction
Not a number. Represents the numeric value 9.91E37. NAN is returned in case of
errors.
Boolean parameters represent two states. The "ON" state (logically true) is represented by "ON" or a numeric value 1. The "OFF" state (logically untrue) is represented by
"OFF" or the numeric value 0.
Querying Boolean parameters
When you query Boolean parameters, the system returns either the value 1 ("ON") or
the value 0 ("OFF").
Example:
Setting: DISPlay:WINDow:ZOOM:STATe ON
Query: DISPlay:WINDow:ZOOM:STATe? would return 1
7.2.6.3 Character Data
Character data follows the syntactic rules of keywords. You can enter text using a short
or a long form. For more information see Chapter 7.2.2, "Long and Short Form",
on page 90.
Querying text parameters
When you query text parameters, the system returns its short form.
Example:
Setting: SENSe:BANDwidth:RESolution:TYPE NORMal
Query: SENSe:BANDwidth:RESolution:TYPE? would return NORM
7.2.6.4 Character Strings
Strings are alphanumeric characters. They have to be in straight quotation marks. You
can use a single quotation mark ( ' ) or a double quotation mark ( " ).
Example:
INSTRument:DELete 'Spectrum'
7.2.6.5 Block Data
Block data is a format which is suitable for the transmission of large amounts of data.
The ASCII character # introduces the data block. The next number indicates how many
of the following digits describe the length of the data block. In the example the 4 following digits indicate the length to be 5168 bytes. The data bytes follow. During the transmission of these data bytes all end or other control signs are ignored until all bytes are
93User Manual 1176.8497.02 ─ 04
Page 94

R&S®FPS-K30
7.3 Controlling the Noise Figure Measurement Channel
Remote Control Commands for Noise Figure Measurements
Controlling the Noise Figure Measurement Channel
transmitted. #0 specifies a data block of indefinite length. The use of the indefinite format requires an NL^END message to terminate the data block. This format is useful
when the length of the transmission is not known or if speed or other considerations
prevent segmentation of the data into blocks of definite length.
The following commands are necessary to control the measurement channel.
INSTrument:CREate:DUPLicate........................................................................................ 94
INSTrument:CREate[:NEW].............................................................................................. 94
INSTrument:CREate:REPLace..........................................................................................95
INSTrument:DELete......................................................................................................... 95
INSTrument:LIST?........................................................................................................... 95
INSTrument:REName.......................................................................................................96
INSTrument[:SELect]........................................................................................................97
SYSTem:PRESet:CHANnel[:EXEC]................................................................................... 97
INSTrument:CREate:DUPLicate
This command duplicates the currently selected channel, i.e creates a new channel of
the same type and with the identical measurement settings. The name of the new
channel is the same as the copied channel, extended by a consecutive number (e.g.
"IQAnalyzer" -> "IQAnalyzer 2").
The channel to be duplicated must be selected first using the INST:SEL command.
Example:
INST:SEL 'IQAnalyzer'
INST:CRE:DUPL
Duplicates the channel named 'IQAnalyzer' and creates a new
channel named 'IQAnalyzer2'.
Usage: Event
INSTrument:CREate[:NEW] <ChannelType>, <ChannelName>
This command adds an additional measurement channel. You can configure up to 10
measurement channels at the same time (depending on available memory).
Parameters:
<ChannelType> Channel type of the new channel.
For a list of available channel types see INSTrument:LIST?
on page 95.
<ChannelName> String containing the name of the channel.
Note that you can not assign an existing channel name to a new
channel; this will cause an error.
Example:
INST:CRE SAN, 'Spectrum 2'
Adds an additional spectrum display named "Spectrum 2".
94User Manual 1176.8497.02 ─ 04
Page 95

R&S®FPS-K30
Remote Control Commands for Noise Figure Measurements
Controlling the Noise Figure Measurement Channel
INSTrument:CREate:REPLace <ChannelName1>,<ChannelType>,<ChannelName2>
This command replaces a channel with another one.
Setting parameters:
<ChannelName1> String containing the name of the channel you want to replace.
<ChannelType> Channel type of the new channel.
For a list of available channel types see INSTrument:LIST?
on page 95.
<ChannelName2> String containing the name of the new channel.
Note: If the specified name for a new channel already exists, the
default name, extended by a sequential number, is used for the
new channel (see INSTrument:LIST? on page 95).
Channel names can have a maximum of 31 characters, and
must be compatible with the Windows conventions for file
names. In particular, they must not contain special characters
such as ":", "*", "?".
Example:
Usage: Setting only
INSTrument:DELete <ChannelName>
This command deletes a channel.
If you delete the last channel, the default "Spectrum" channel is activated.
Setting parameters:
<ChannelName> String containing the name of the channel you want to delete.
Example:
Usage: Setting only
INSTrument:LIST?
This command queries all active channels. This is useful in order to obtain the names
of the existing channels, which are required in order to replace or delete the channels.
INST:CRE:REPL 'IQAnalyzer2',IQ,'IQAnalyzer'
Replaces the channel named "IQAnalyzer2" by a new channel of
type "IQ Analyzer" named "IQAnalyzer".
A channel must exist in order to be able delete it.
INST:DEL 'IQAnalyzer4'
Deletes the channel with the name 'IQAnalyzer4'.
Return values:
<ChannelType>,
<ChannelName>
For each channel, the command returns the channel type and
channel name (see tables below).
Tip: to change the channel name, use the INSTrument:
REName command.
95User Manual 1176.8497.02 ─ 04
Page 96

R&S®FPS-K30
Remote Control Commands for Noise Figure Measurements
Controlling the Noise Figure Measurement Channel
Example:
INST:LIST?
Result for 3 channels:
'ADEM','Analog Demod','IQ','IQ
Analyzer','IQ','IQ Analyzer2'
Usage: Query only
Table 7-2: Available channel types and default channel names in Signal and Spectrum Analyzer mode
Application <ChannelType>
parameter
Spectrum SANALYZER Spectrum
1xEV-DO BTS (R&S FPS-K84) BDO 1xEV-DO BTS
1xEV-DO MS (R&S FPS-K85) MDO 1xEV-DO MS
3GPP FDD BTS (R&S FPS-K72) BWCD 3G FDD BTS
3GPP FDD UE (R&S FPS-K73) MWCD 3G FDD UE
Analog Modulation Analysis (R&S FPS-K7) ADEM Analog Demod
cdma2000 BTS (R&S FPS-K82) BC2K CDMA2000 BTS
cdma2000 MS (R&S FPS-K83) MC2K CDMA2000 MS
GSM (R&S FPS-K10) GSM GSM
I/Q Analyzer IQ IQ Analyzer
Default Channel name*)
LTE (R&S FPS-K10x) LTE LTE
NB-IoT (R&S FPS-K106) NIOT NB-IoT
Noise (R&S FPS-K30) NOISE Noise
5G NR (R&S FPS-K144) NR5G 5G NR
Phase Noise (R&S FPS-K40) PNOISE Phase Noise
TD-SCDMA BTS (R&S FPS-K76) BTDS TD-SCDMA BTS
TD-SCDMA UE (R&S FPS-K77) MTDS TD-SCDMA UE
Verizon 5GTF Measurement Application (V5GTF,
R&S FPS-K118)
VSA (R&S FPS-K70) DDEM VSA
WLAN (R&S FPS-K91) WLAN WLAN
*) If the specified name for a new channel already exists, the default name, extended by a sequential number, is used for the new channel.
V5GT V5GT
INSTrument:REName <ChannelName1>, <ChannelName2>
This command renames a channel.
Setting parameters:
<ChannelName1> String containing the name of the channel you want to rename.
96User Manual 1176.8497.02 ─ 04
Page 97

R&S®FPS-K30
Remote Control Commands for Noise Figure Measurements
Controlling the Noise Figure Measurement Channel
<ChannelName2> String containing the new channel name.
Note that you cannot assign an existing channel name to a new
channel; this will cause an error.
Channel names can have a maximum of 31 characters, and
must be compatible with the Windows conventions for file
names. In particular, they must not contain special characters
such as ":", "*", "?".
Example:
Usage: Setting only
INSTrument[:SELect] <ChannelType> | <ChannelName>
This command activates a new channel with the defined channel type, or selects an
existing channel with the specified name.
Also see
●
INSTrument:CREate[:NEW] on page 94
Parameters:
<ChannelType> Channel type of the new channel.
<ChannelName> String containing the name of the channel.
Example:
INST:REN 'IQAnalyzer2','IQAnalyzer3'
Renames the channel with the name 'IQAnalyzer2' to 'IQAnalyzer3'.
For a list of available channel types see INSTrument:LIST?
on page 95.
INST IQ
Activates a channel for the I/Q Analyzer application (evaluation
mode).
INST 'MyIQSpectrum'
Selects the channel named 'MyIQSpectrum' (for example before
executing further commands for that channel).
SYSTem:PRESet:CHANnel[:EXEC]
This command restores the default instrument settings in the current channel.
Use INST:SEL to select the channel.
Example:
Usage: Event
Manual operation: See "Preset Channel" on page 40
INST:SEL 'Spectrum2'
Selects the channel for "Spectrum2".
SYST:PRES:CHAN:EXEC
Restores the factory default settings to the "Spectrum2"channel.
97User Manual 1176.8497.02 ─ 04
Page 98

R&S®FPS-K30
7.4 Working with Windows in the Display
Remote Control Commands for Noise Figure Measurements
Working with Windows in the Display
The following commands are required to change the evaluation type and rearrange the
screen layout for a channel as you do using the SmartGrid in manual operation. Since
the available evaluation types depend on the selected application, some parameters
for the following commands also depend on the selected channel.
Note that the suffix <n> always refers to the window in the currently selected channel.
LAYout:ADD[:WINDow]?...................................................................................................98
LAYout:CATalog[:WINDow]?..............................................................................................99
LAYout:IDENtify[:WINDow]?............................................................................................100
LAYout:REMove[:WINDow]............................................................................................. 100
LAYout:REPLace[:WINDow]............................................................................................100
LAYout:SPLitter..............................................................................................................101
LAYout:WINDow<n>:ADD?............................................................................................. 102
LAYout:WINDow<n>:IDENtify?........................................................................................ 103
LAYout:WINDow<n>:REMove..........................................................................................103
LAYout:WINDow<n>:REPLace........................................................................................ 103
LAYout:ADD[:WINDow]? <WindowName>,<Direction>,<WindowType>
This command adds a window to the display in the active channel.
This command is always used as a query so that you immediately obtain the name of
the new window as a result.
To replace an existing window, use the LAYout:REPLace[:WINDow] command.
Query parameters:
<WindowName> String containing the name of the existing window the new win-
dow is inserted next to.
By default, the name of a window is the same as its index. To
determine the name and index of all active windows, use the
LAYout:CATalog[:WINDow]? query.
<Direction> LEFT | RIGHt | ABOVe | BELow
Direction the new window is added relative to the existing window.
<WindowType> text value
Type of result display (evaluation method) you want to add.
See the table below for available parameter values.
Return values:
<NewWindowName> When adding a new window, the command returns its name (by
default the same as its number) as a result.
Example:
LAY:ADD? '1',LEFT,MTAB
Result:
'2'
Adds a new window named '2' with a marker table to the left of
window 1.
98User Manual 1176.8497.02 ─ 04
Page 99

R&S®FPS-K30
Remote Control Commands for Noise Figure Measurements
Working with Windows in the Display
Usage: Query only
Manual operation: See "Noise Figure" on page 13
See "Gain" on page 14
See "Noise Temperature" on page 14
See "Y-Factor" on page 15
See "ENR Measured" on page 16
See "Power (Hot)" on page 17
See "Power (Cold)" on page 17
See "Cal Y-Factor" on page 18
See "Cal Power (Hot)" on page 18
See "Cal Power (Cold)" on page 19
See "Result Table" on page 19
See "Marker Table" on page 20
Table 7-3: <WindowType> parameter values for Noise Figure application
Parameter value Window type
CPCold Cal Power (Cold)
CPHot Cal Power (Hot)
CYFactor Cal Y-Factor
ENR ENR Measured
GAIN Gain result display
MTABle Marker table
NOISe Noise figure result display
PCOLd Power cold result display
PHOT Power hot result display
RESults Result table
TEMPerature Noise temperature result display
YFACtor Y-Factor result display
LAYout:CATalog[:WINDow]?
This command queries the name and index of all active windows in the active channel
from top left to bottom right. The result is a comma-separated list of values for each
window, with the syntax:
<WindowName_1>,<WindowIndex_1>..<WindowName_n>,<WindowIndex_n>
Return values:
<WindowName> string
Name of the window.
In the default state, the name of the window is its index.
<WindowIndex> numeric value
Index of the window.
99User Manual 1176.8497.02 ─ 04
Page 100

R&S®FPS-K30
Remote Control Commands for Noise Figure Measurements
Working with Windows in the Display
Example:
Usage: Query only
LAYout:IDENtify[:WINDow]? <WindowName>
This command queries the index of a particular display window in the active channel.
Note: to query the name of a particular window, use the LAYout:WINDow<n>:
IDENtify? query.
Query parameters:
<WindowName> String containing the name of a window.
Return values:
<WindowIndex> Index number of the window.
Example:
LAY:CAT?
Result:
'2',2,'1',1
Two windows are displayed, named '2' (at the top or left), and '1'
(at the bottom or right).
LAY:WIND:IDEN? '2'
Queries the index of the result display named '2'.
Response:
2
Usage: Query only
LAYout:REMove[:WINDow] <WindowName>
This command removes a window from the display in the active channel.
Setting parameters:
<WindowName> String containing the name of the window. In the default state,
the name of the window is its index.
Example:
Usage: Setting only
LAYout:REPLace[:WINDow] <WindowName>,<WindowType>
This command replaces the window type (for example from "Diagram" to "Result Summary") of an already existing window in the active channel while keeping its position,
index and window name.
To add a new window, use the LAYout:ADD[:WINDow]? command.
Setting parameters:
<WindowName> String containing the name of the existing window.
LAY:REM '2'
Removes the result display in the window named '2'.
By default, the name of a window is the same as its index. To
determine the name and index of all active windows in the active
channel, use the LAYout:CATalog[:WINDow]? query.
100User Manual 1176.8497.02 ─ 04
 Loading...