

Page 1
R&S®FPL1-K70
Vector Signal Analysis
User Manual
(;ÜëË2)
1178936102
User Manual
Version 02
Page 2

This manual applies to the following R&S®FPL1000 models with firmware version 1.30 and higher:
●
R&S®FPL1003 (1304.0004K03) - FPL1000 with maximum frequency 3 GHz
●
R&S®FPL1007 (1304.0004K07) - FPL1000 with maximum frequency 7.5 GHz
The following firmware options are described:
●
R&S FPL1000-K70 (1323.1748.02)
●
R&S FPL1000-K70P (1323.1631.02)
●
R&S FPL1000-K70M (1323.1625.02)
© 2019 Rohde & Schwarz GmbH & Co. KG
Mühldorfstr. 15, 81671 München, Germany
Phone: +49 89 41 29 - 0
Fax: +49 89 41 29 12 164
Email: info@rohde-schwarz.com
Internet: www.rohde-schwarz.com
Subject to change – Data without tolerance limits is not binding.
R&S® is a registered trademark of Rohde & Schwarz GmbH & Co. KG.
Trade names are trademarks of the owners.
1178.9361.02 | Version 02 | R&S®FPL1-K70
Throughout this manual, products from Rohde & Schwarz are indicated without the ® symbol, e.g. R&S®FPL1000 is indicated as
R&S FPL1000.
Page 3

R&S®FPL1-K70
1 Preface.................................................................................................... 7
1.1 Documentation Overview............................................................................................. 7
1.2 Conventions Used in the Documentation...................................................................9
2 Welcome to the Vector Signal Analysis Application.........................11
2.1 Introduction to Vector Signal Analysis..................................................................... 12
2.2 Starting the VSA Application..................................................................................... 12
2.3 Understanding the Display Information....................................................................13
3 Measurements and Result Displays...................................................16
3.1 Evaluation Data Sources in VSA............................................................................... 16
3.2 Result Types in VSA....................................................................................................20
Contents
Contents
3.3 Predefined Display Configuration............................................................................. 59
3.4 Common Parameters in VSA..................................................................................... 60
4 Measurement Basics........................................................................... 63
4.1 Filters and Bandwidths during Signal Processing.................................................. 63
4.2 Sample Rate, Symbol Rate and I/Q Bandwidth........................................................ 70
4.3 Symbol Mapping......................................................................................................... 73
4.4 Overview of the Demodulation Process................................................................. 105
4.5 Signal Model, Estimation and Modulation Errors.................................................. 119
4.6 Measurement Ranges............................................................................................... 136
4.7 Display Points Vs Estimation Points Per Symbol..................................................141
4.8 Capture Buffer Display............................................................................................. 142
4.9 Known Data Files - Dependencies and Restrictions............................................. 142
4.10 Known Data from PRBS Generators....................................................................... 144
4.11 Multi-Modulation Analysis (R&S FPL1000-K70M)..................................................146
5 Configuration......................................................................................153
5.1 Configuration Overview............................................................................................153
5.2 Configuration According to Digital Standards.......................................................157
5.3 Signal Description.....................................................................................................159
5.4 Input, Output and Frontend Settings.......................................................................177
5.5 Signal Capture...........................................................................................................191
3User Manual 1178.9361.02 ─ 02
Page 4

R&S®FPL1-K70
5.6 Burst and Pattern Configuration............................................................................. 199
5.7 Result Range Configuration.....................................................................................209
5.8 Demodulation Settings............................................................................................. 211
5.9 Measurement Filter Settings.................................................................................... 220
5.10 Evaluation Range Configuration............................................................................. 222
5.11 Adjusting Settings Automatically............................................................................223
5.12 Restoring Factory Settings for Vector Signal Analysis.........................................225
6 Analysis.............................................................................................. 227
6.1 Trace Settings............................................................................................................227
6.2 Trace Export Settings............................................................................................... 230
6.3 Markers...................................................................................................................... 232
6.4 Limit and Display Lines............................................................................................ 237
Contents
6.5 Display and Window Configuration.........................................................................241
7 I/Q Data Import and Export................................................................246
7.1 Import/Export Functions.......................................................................................... 246
7.2 How to Export and Import I/Q Data..........................................................................248
8 How to Perform Vector Signal Analysis...........................................251
8.1 How to Perform VSA According to Digital Standards........................................... 251
8.2 How to Perform Customized VSA Measurements................................................. 253
8.3 How to Analyze the Measured Data.........................................................................265
9 Measurement Examples.................................................................... 272
9.1 Connecting the Transmitter and Analyzer..............................................................272
9.2 Measurement Example 1: Continuous QPSK Signal............................................. 273
9.3 Measurement Example 2: Burst GSM EDGE Signals............................................ 280
10 Troubleshooting the Measurement.................................................. 289
10.1 Flow Chart for Troubleshooting...............................................................................289
10.2 Explanation of Status Bar Messages...................................................................... 291
10.3 Frequently Asked Questions................................................................................... 300
10.4 Collecting Information for Support..........................................................................310
11 Remote Commands for VSA............................................................. 312
11.1 Introduction............................................................................................................... 312
4User Manual 1178.9361.02 ─ 02
Page 5

R&S®FPL1-K70
11.2 Common Suffixes......................................................................................................317
11.3 Activating Vector Signal Analysis........................................................................... 317
11.4 Digital Standards.......................................................................................................321
11.5 Configuring VSA....................................................................................................... 323
11.6 Performing a Measurement......................................................................................398
11.7 Analysis..................................................................................................................... 402
11.8 Configuring the Result Display................................................................................425
11.9 Retrieving Results.....................................................................................................439
11.10 Importing and Exporting I/Q Data and Results...................................................... 463
11.11 Status Reporting System......................................................................................... 464
11.12 Deprecated Commands............................................................................................475
11.13 Programming Examples...........................................................................................476
Contents
Annex.................................................................................................. 485
A Abbreviations..................................................................................... 485
B Predefined Standards and Settings................................................. 486
C Predefined Measurement and Tx Filters.......................................... 494
C.1 Transmit Filters......................................................................................................... 494
C.2 Measurement Filters................................................................................................. 495
C.3 Typical Combinations of Tx and Measurement Filters.......................................... 496
D ASCII File Export Format for VSA Data............................................497
E Known Data File Syntax Description................................................499
F Formulae.............................................................................................501
F.1 Trace-based Evaluations.......................................................................................... 501
F.2 Result Summary Evaluations...................................................................................503
F.3 Statistical Evaluations for the Result Summary.................................................... 506
F.4 Trace Averaging........................................................................................................ 507
F.5 Analytically Calculated Filters................................................................................. 507
F.6 Standard-Specific Filters.......................................................................................... 508
G I/Q Data File Format (iq-tar)...............................................................515
G.1 I/Q Parameter XML File Specification......................................................................516
5User Manual 1178.9361.02 ─ 02
Page 6

R&S®FPL1-K70
G.2 I/Q Data Binary File................................................................................................... 519
Contents
List of Remote Commands (VSA).....................................................521
Index....................................................................................................532
6User Manual 1178.9361.02 ─ 02
Page 7

R&S®FPL1-K70
1 Preface
1.1 Documentation Overview
1.1.1 Getting Started Manual
Preface
Documentation Overview
This chapter provides safety-related information, an overview of the user documentation and the conventions used in the documentation.
This section provides an overview of the R&S FPL1000 user documentation. Unless
specified otherwise, you find the documents on the R&S FPL1000 product page at:
www.rohde-schwarz.com/manual/FPL1000
Introduces the R&S FPL1000 and describes how to set up and start working with the
product. Includes basic operations, typical measurement examples, and general information, e.g. safety instructions, etc.
A printed version is delivered with the instrument. A PDF version is available for download on the Internet.
1.1.2 User Manuals and Help
Separate user manuals are provided for the base unit and the firmware applications:
●
Base unit manual
Contains the description of all instrument modes and functions. It also provides an
introduction to remote control, a complete description of the remote control commands with programming examples, and information on maintenance, instrument
interfaces and error messages. Includes the contents of the getting started manual.
●
Firmware application manual
Contains the description of the specific functions of a firmware application, including remote control commands. Basic information on operating the R&S FPL1000 is
not included.
The contents of the user manuals are available as help in the R&S FPL1000. The help
offers quick, context-sensitive access to the complete information for the base unit and
the firmware applications.
All user manuals are also available for download or for immediate display on the Internet.
7User Manual 1178.9361.02 ─ 02
Page 8

R&S®FPL1-K70
1.1.3 Service Manual
1.1.4 Instrument Security Procedures
1.1.5 Basic Safety Instructions
Preface
Documentation Overview
Describes the performance test for checking the rated specifications, module replacement and repair, firmware update, troubleshooting and fault elimination, and contains
mechanical drawings and spare part lists.
The service manual is available for registered users on the global Rohde & Schwarz
information system (GLORIS):
https://gloris.rohde-schwarz.com
Deals with security issues when working with the R&S FPL1000 in secure areas. It is
available for download on the Internet.
Contains safety instructions, operating conditions and further important information.
The printed document is delivered with the instrument.
1.1.6 Data Sheets and Brochures
The data sheet contains the technical specifications of the R&S FPL1000. It also lists
the firmware applications and their order numbers, and optional accessories.
The brochure provides an overview of the instrument and deals with the specific characteristics.
See www.rohde-schwarz.com/brochure-datasheet/FPL1000
1.1.7 Release Notes and Open Source Acknowledgment (OSA)
The release notes list new features, improvements and known issues of the current
firmware version, and describe the firmware installation.
The open source acknowledgment document provides verbatim license texts of the
used open source software.
See www.rohde-schwarz.com/firmware/FPL1000
1.1.8 Application Notes, Application Cards, White Papers, etc.
These documents deal with special applications or background information on particular topics.
See www.rohde-schwarz.com/application/FPL1000
8User Manual 1178.9361.02 ─ 02
Page 9
R&S®FPL1-K70
1.1.9 Calibration Certificate
1.2 Conventions Used in the Documentation
1.2.1 Typographical Conventions
Preface
Conventions Used in the Documentation
The document is available on https://gloris.rohde-schwarz.com/calcert. You need the
device ID of your instrument, which you can find on a label on the rear panel.
The following text markers are used throughout this documentation:
Convention Description
"Graphical user interface elements"
[Keys] Key and knob names are enclosed by square brackets.
Filenames, commands,
program code
Input Input to be entered by the user is displayed in italics.
Links Links that you can click are displayed in blue font.
"References" References to other parts of the documentation are enclosed by quota-
All names of graphical user interface elements on the screen, such as
dialog boxes, menus, options, buttons, and softkeys are enclosed by
quotation marks.
Filenames, commands, coding samples and screen output are distinguished by their font.
tion marks.
1.2.2 Conventions for Procedure Descriptions
When operating the instrument, several alternative methods may be available to perform the same task. In this case, the procedure using the touchscreen is described.
Any elements that can be activated by touching can also be clicked using an additionally connected mouse. The alternative procedure using the keys on the instrument or
the on-screen keyboard is only described if it deviates from the standard operating procedures.
The term "select" may refer to any of the described methods, i.e. using a finger on the
touchscreen, a mouse pointer in the display, or a key on the instrument or on a keyboard.
1.2.3 Notes on Screenshots
When describing the functions of the product, we use sample screenshots. These
screenshots are meant to illustrate as many as possible of the provided functions and
possible interdependencies between parameters. The shown values may not represent
realistic usage scenarios.
9User Manual 1178.9361.02 ─ 02
Page 10

R&S®FPL1-K70
Preface
Conventions Used in the Documentation
The screenshots usually show a fully equipped product, that is: with all options installed. Thus, some functions shown in the screenshots may not be available in your particular product configuration.
10User Manual 1178.9361.02 ─ 02
Page 11

R&S®FPL1-K70
2 Welcome to the Vector Signal Analysis
Welcome to the Vector Signal Analysis Application
Application
The R&S FPL1-K70 is a firmware application that adds functionality to perform Vector
Signal Analysis (VSA) to the R&S FPL1000.
The R&S FPL1000 VSA application performs vector and scalar measurements on digitally modulated single-carrier signals. To perform the measurements it converts RF signals into the complex baseband. The R&S FPL1000 VSA application can also use the
optional Digital Baseband interface or the optional Analog Baseband interface to analyze I/Q signals already delivered to the complex baseband. Use of an optional external mixer is also supported.
The R&S FPL1000 VSA application features:
●
Flexible modulation analysis from MSK to 1024QAM
●
Numerous standard-specific default settings
●
Various graphical, numerical and statistical evaluations and result displays
●
Spectrum analyses of the measurement and error signal
●
Flexible burst search for the analysis of complex signal combinations, short bursts
or signal mix
This user manual contains a description of the functionality that the application provides, including remote control operation.
Functions that are not discussed in this manual are the same as in the Spectrum application and are described in the R&S FPL1000 User Manual. The latest version is available for download at the product homepage
http://www.rohde-schwarz.com/product/FPL1000.html.
Additional information
Several application notes discussing vector signal analysis using the R&S FPL1000
VSA application are available from the Rohde & Schwarz website:
1EF93: Modulation Accuracy Measurements of DVB-S2 and DVB-S2X Signals
1EF55: EVM Measurements for ZigBee signals in the 2.4 GHz band
1MA171: How to use Rohde & Schwarz Instruments in MATLAB
Installation
You can find detailed installation instructions in the R&S FPL1000 Getting Started manual or in the Release Notes.
● Introduction to Vector Signal Analysis.....................................................................12
● Starting the VSA Application...................................................................................12
● Understanding the Display Information...................................................................13
11User Manual 1178.9361.02 ─ 02
Page 12
R&S®FPL1-K70
2.1 Introduction to Vector Signal Analysis
Welcome to the Vector Signal Analysis Application
Starting the VSA Application
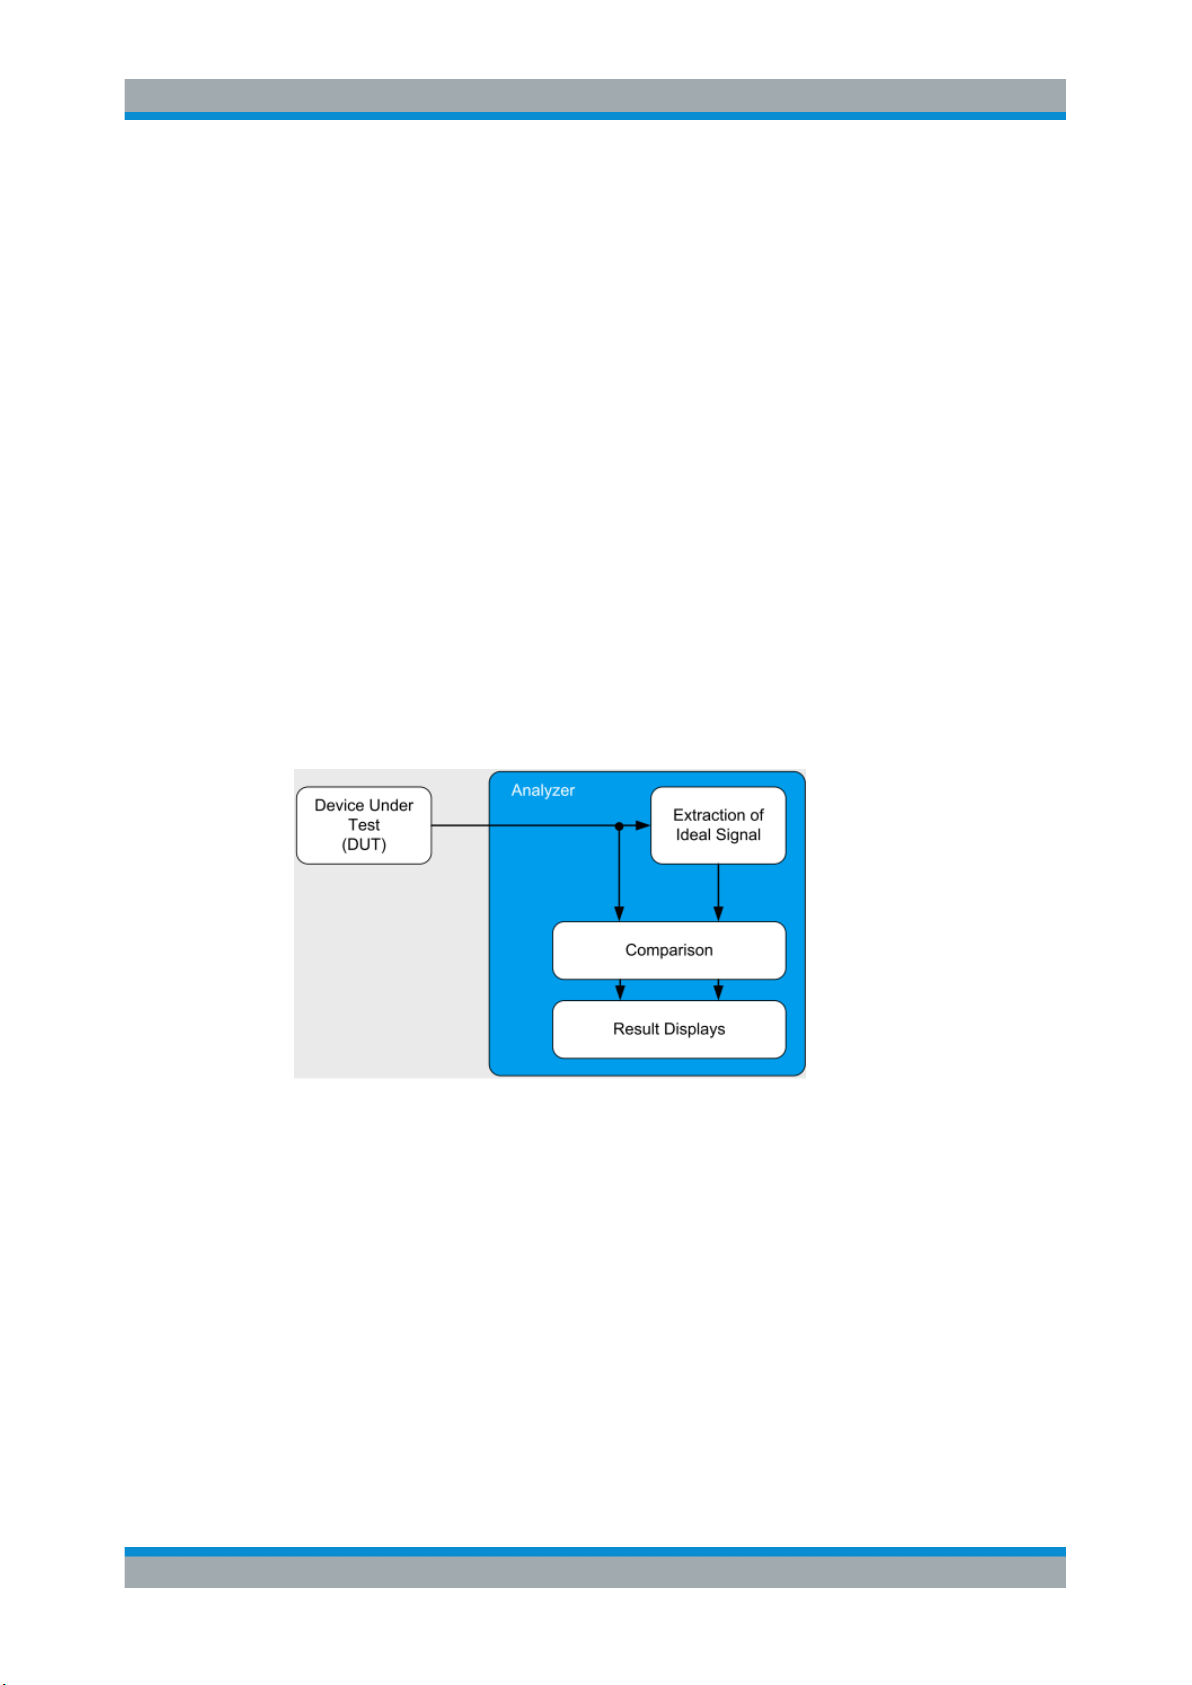
The goal of vector signal analysis is to determine the quality of the signal that is transmitted by the device under test (DUT) by comparing it against an ideal signal. The DUT
is usually connected with the analyzer via a cable. The key task of the analyzer is to
determine the ideal signal. Hence, the analyzer aims to reconstruct the ideal signal
from the measured signal that is transmitted by the DUT. This ideal signal is commonly
referred to as the reference signal, while the signal from the DUT is called the mea-
surement signal.
After extracting the reference signal, the R&S FPL1000 VSA application compares the
measurement signal and the reference signal, and the results of this comparison are
displayed.
Example:
The most common vector signal analysis measurement is the EVM (Error Vector Magnitude) measurement. Here, the complex baseband reference signal is subtracted from
the complex baseband measurement signal. The magnitude of this error vector represents the EVM value. The EVM has the advantage that it "summarizes" all potential
errors and distortions in one single value. If the EVM value is low, the signal quality of
the DUT is high.
Figure 2-1: Simplified schema of vector signal analysis
2.2 Starting the VSA Application
The VSA application adds a new application to the R&S FPL1000.
To activate the VSA application
1. Select the [MODE] key.
A dialog box opens that contains all operating modes and applications currently
available on your R&S FPL1000.
2. Select the "VSA" item.
12User Manual 1178.9361.02 ─ 02
Page 13

R&S®FPL1-K70
Welcome to the Vector Signal Analysis Application
Understanding the Display Information
The R&S FPL1000 opens a new measurement channel for the VSA application.
The measurement is started immediately with the default settings. It can be configured
in the VSA "Overview" dialog box, which is displayed when you select the "Overview"
softkey from any menu (see Chapter 5.1, "Configuration Overview", on page 153).
Multiple Measurement Channels and Sequencer Function
When you activate an application, a new measurement channel is created which determines the measurement settings for that application. The same application can be activated with different measurement settings by creating several channels for the same
application.
The number of channels that can be configured at the same time depends on the available memory on the instrument.
Only one measurement can be performed at any time, namely the one in the currently
active channel. However, in order to perform the configured measurements consecutively, a Sequencer function is provided.
If activated, the measurements configured in the currently active channels are performed one after the other in the order of the tabs. The currently active measurement is
indicated by a
are updated in the tabs (as well as the "MultiView") as the measurements are performed. Sequential operation itself is independent of the currently displayed tab.
For details on the Sequencer function see the R&S FPL1000 User Manual.
symbol in the tab label. The result displays of the individual channels
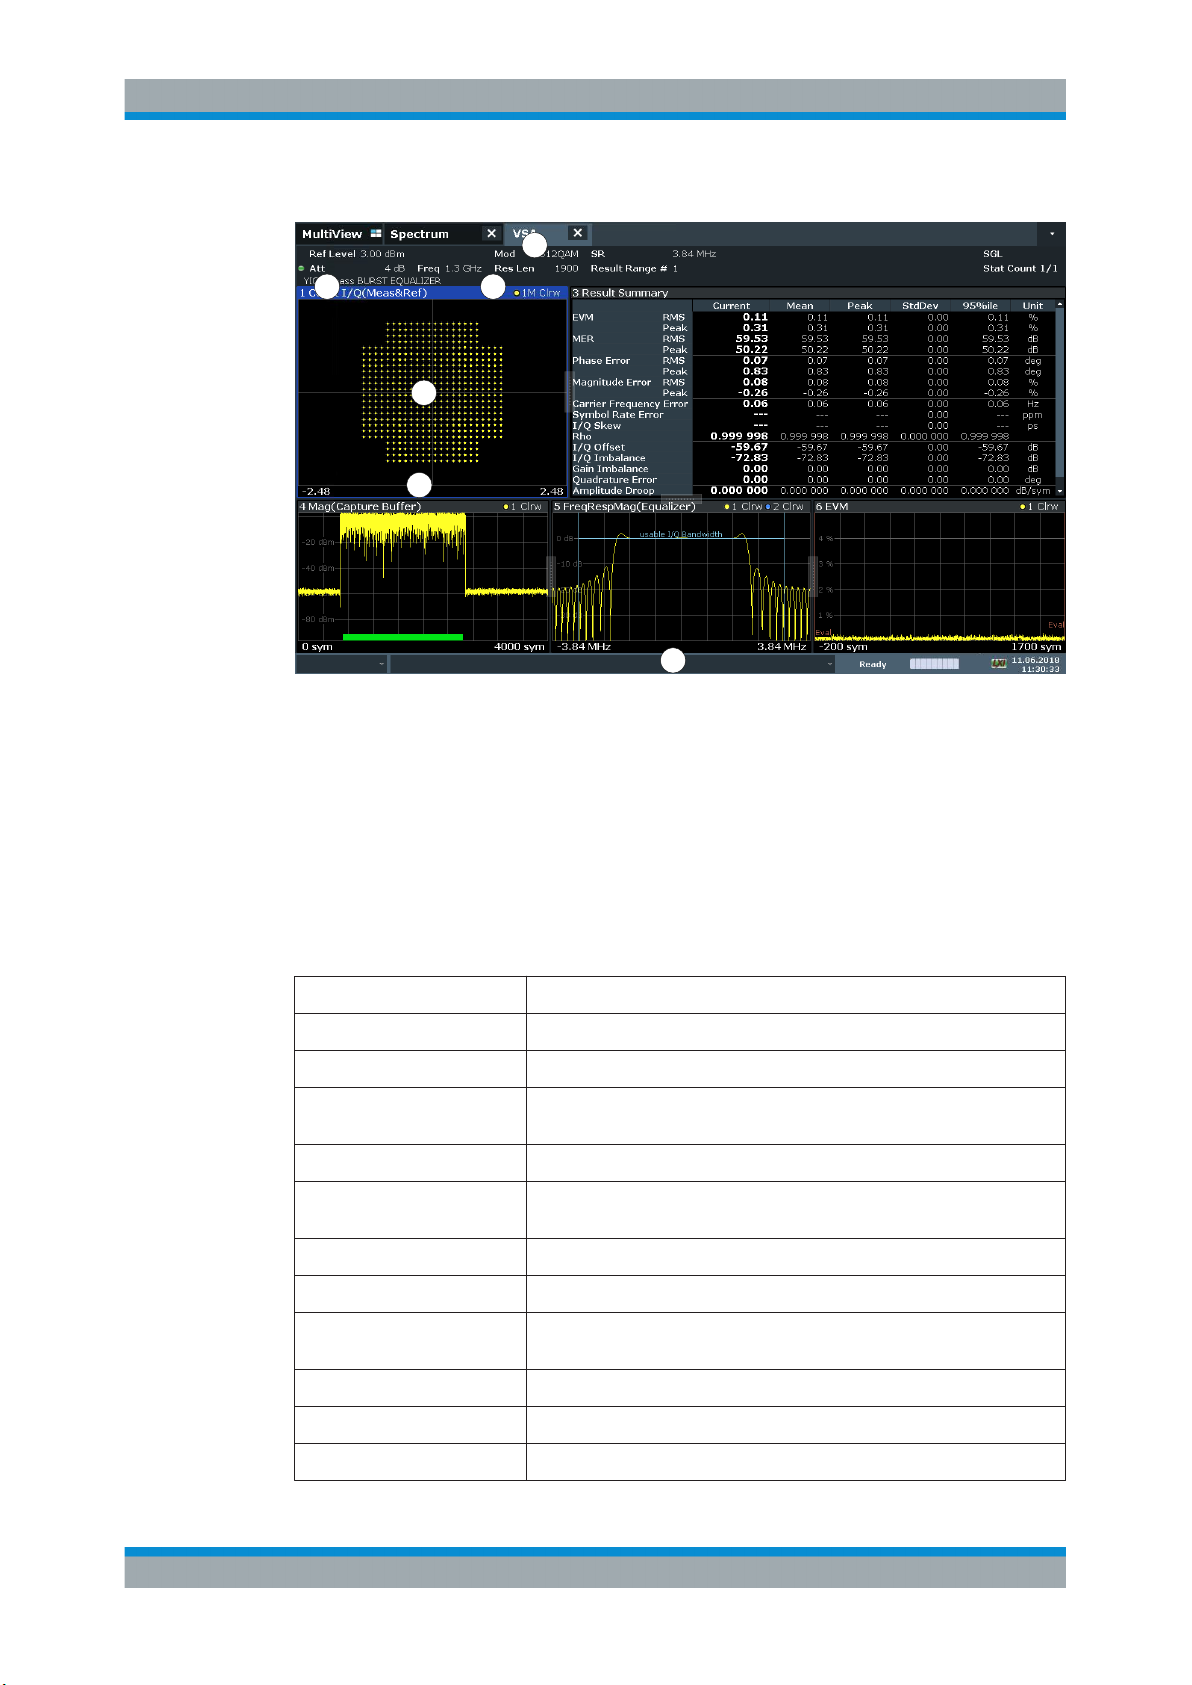
2.3 Understanding the Display Information
The following figure shows a measurement diagram during analyzer operation. All different information areas are labeled. They are explained in more detail in the following
sections.
13User Manual 1178.9361.02 ─ 02
Page 14
R&S®FPL1-K70
Welcome to the Vector Signal Analysis Application
Understanding the Display Information
1
2 3
4
5
6
1 = Channel bar for firmware and measurement settings
2+3 = Window title bar with diagram-specific (trace) information
4 = Diagram area
5 = Diagram footer with diagram-specific information, depending on measurement application
6 = Instrument status bar with error messages, progress bar and date/time display
Channel bar information
In VSA application, the R&S FPL1000 shows the following settings:
Table 2-1: Information displayed in the channel bar in VSA application
Ref Level Reference level
Offset Reference level offset (if not 0)
Freq Center frequency for the RF signal
Std Selected measurement standard or, if no standard selected, modulation
type or loaded user-defined modulation file
Res Len Result Length
Cap Len Capture Length (instead of result length for capture buffer display), see
"Capture Length Settings" on page 193
SR Symbol Rate
Att Mechanical and electronic RF attenuation
Input Input type of the signal source, see Chapter 5.4.1, "Input Settings",
on page 177
Burst Burst search active (see "Enabling Burst Searches" on page 200)
Pattern Pattern search active (see "Enabling Pattern Searches" on page 203)
Equalizer Equalizer active (see "Equalizer Settings" on page 214)
14User Manual 1178.9361.02 ─ 02
Page 15
R&S®FPL1-K70
Welcome to the Vector Signal Analysis Application
Understanding the Display Information
Stat Count Statistics count for averaging and other statistical operations, see "Statis-
tic Count" on page 198; cannot be edited directly
Capt Count Capture count; the current number of captures performed if several cap-
tures are necessary to obtain the number of results defined by "Statistics
Count"; cannot be edited directly
SGL The sweep is set to single sweep mode.
In addition, the channel bar also displays information on instrument settings that affect
the measurement results even though this is not immediately apparent from the display
of the measured values (e.g. transducer or trigger settings). This information is displayed only when applicable for the current measurement. For details see the
R&S FPL1000 Getting Started manual.
Window title bar information
For each diagram, the header provides the following information:
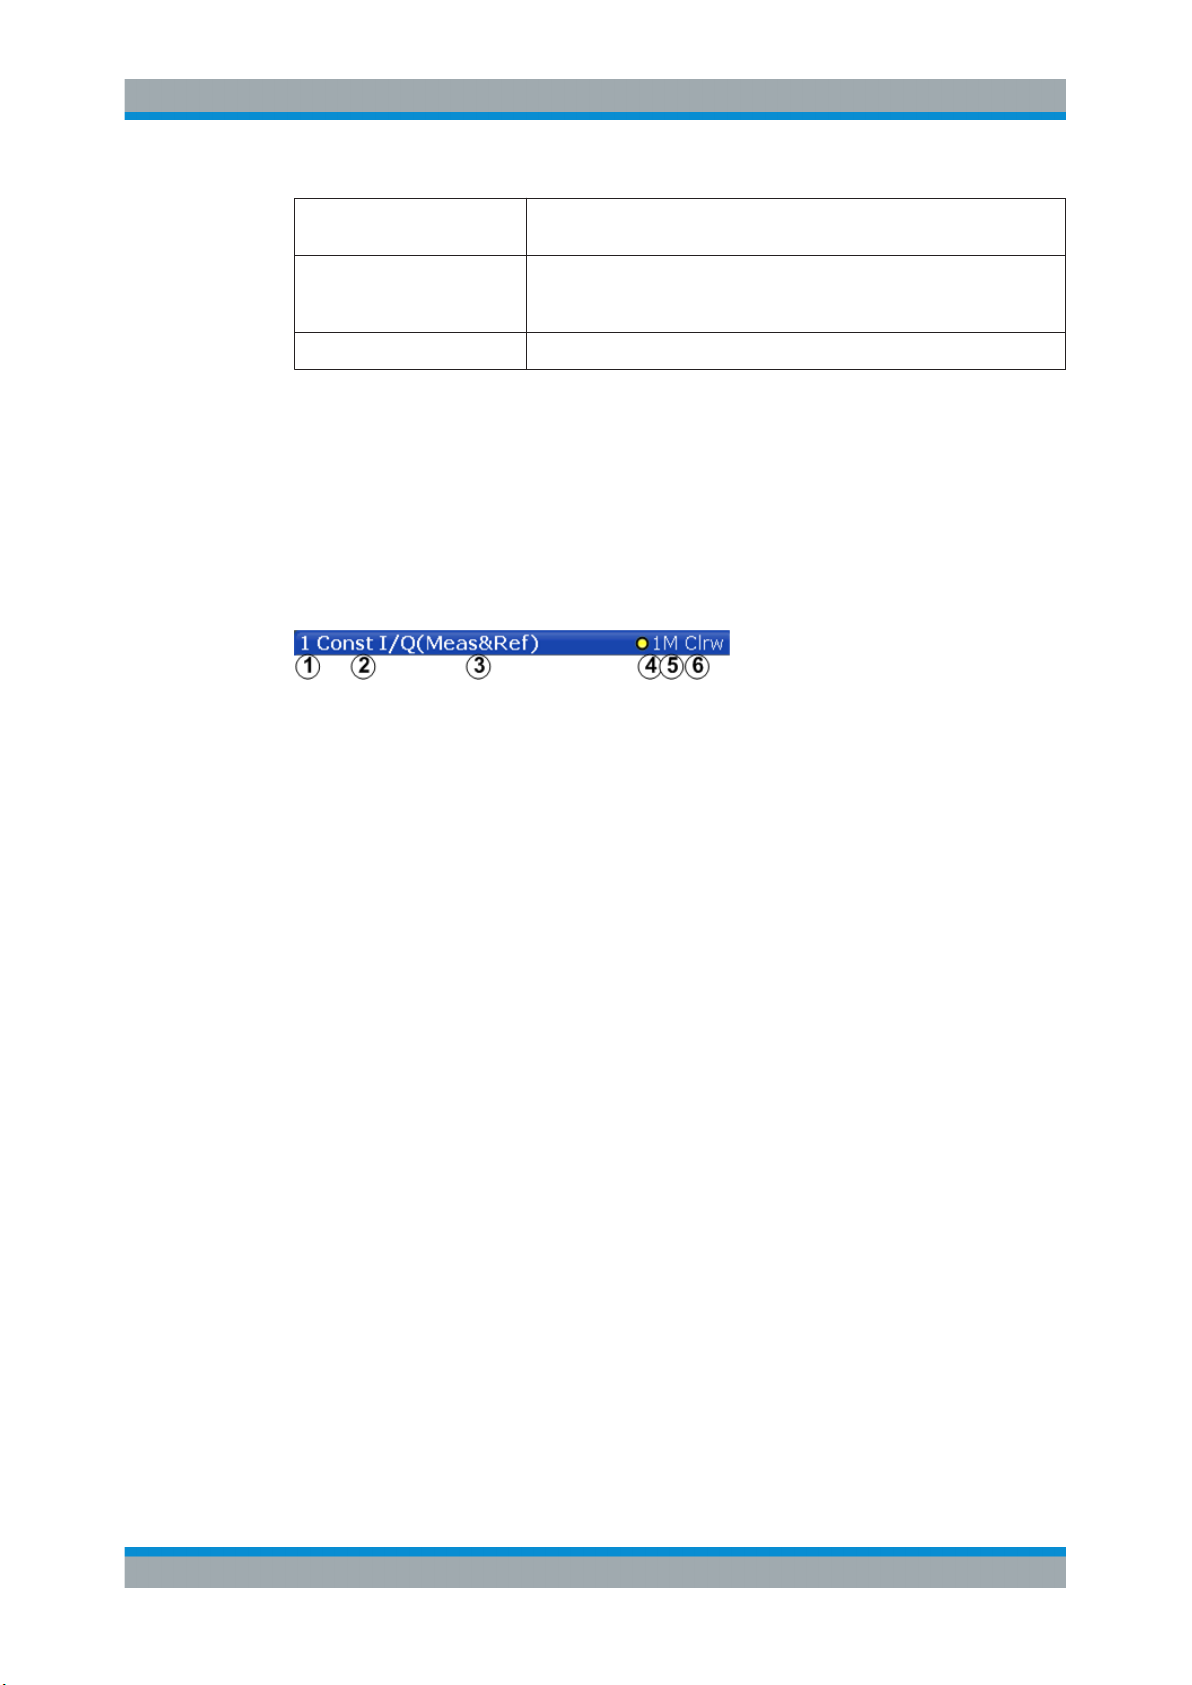
Figure 2-2: Window title bar information in VSA application
1 = Window name
2 = Result type
3 = Data source type
4 = Trace color
5 = Displayed signal for Meas&Ref or multi data source: M (Meas), R (Ref), C (Capture buffer), E (Error)
6 = Trace mode
Diagram area
The diagram area displays the results according to the selected result displays (see
Chapter 3, "Measurements and Result Displays", on page 16).
Diagram footer information
The diagram footer (beneath the diagram) contains the start and stop symbols or time
of the evaluation range.
Status bar information
Global instrument settings, the instrument status and any irregularities are indicated in
the status bar beneath the diagram. Furthermore, the progress of the current operation
is displayed in the status bar.
15User Manual 1178.9361.02 ─ 02
Page 16
R&S®FPL1-K70
3 Measurements and Result Displays
Measurements and Result Displays
Evaluation Data Sources in VSA
Various different result displays for VSA measurements are available. Which result
types are available depends on the selected data source. You can define which part of
the measured signal is to be evaluated and displayed.
The determined result and evaluation ranges are included in the result displays (where
useful) to visualize the basis of the displayed values and traces.
For background information on the result and evaluation ranges see Chapter 4.6,
"Measurement Ranges", on page 136.)
● Evaluation Data Sources in VSA.............................................................................16
● Result Types in VSA............................................................................................... 20
● Predefined Display Configuration............................................................................59
● Common Parameters in VSA..................................................................................60
3.1 Evaluation Data Sources in VSA
All data sources for evaluation available for VSA are displayed in the evaluation bar in
SmartGrid mode.
The data source determines which result types are available (see Table 3-1). For
details on selecting the data source for evaluation see Chapter 6.5, "Display and Win-
dow Configuration", on page 241.
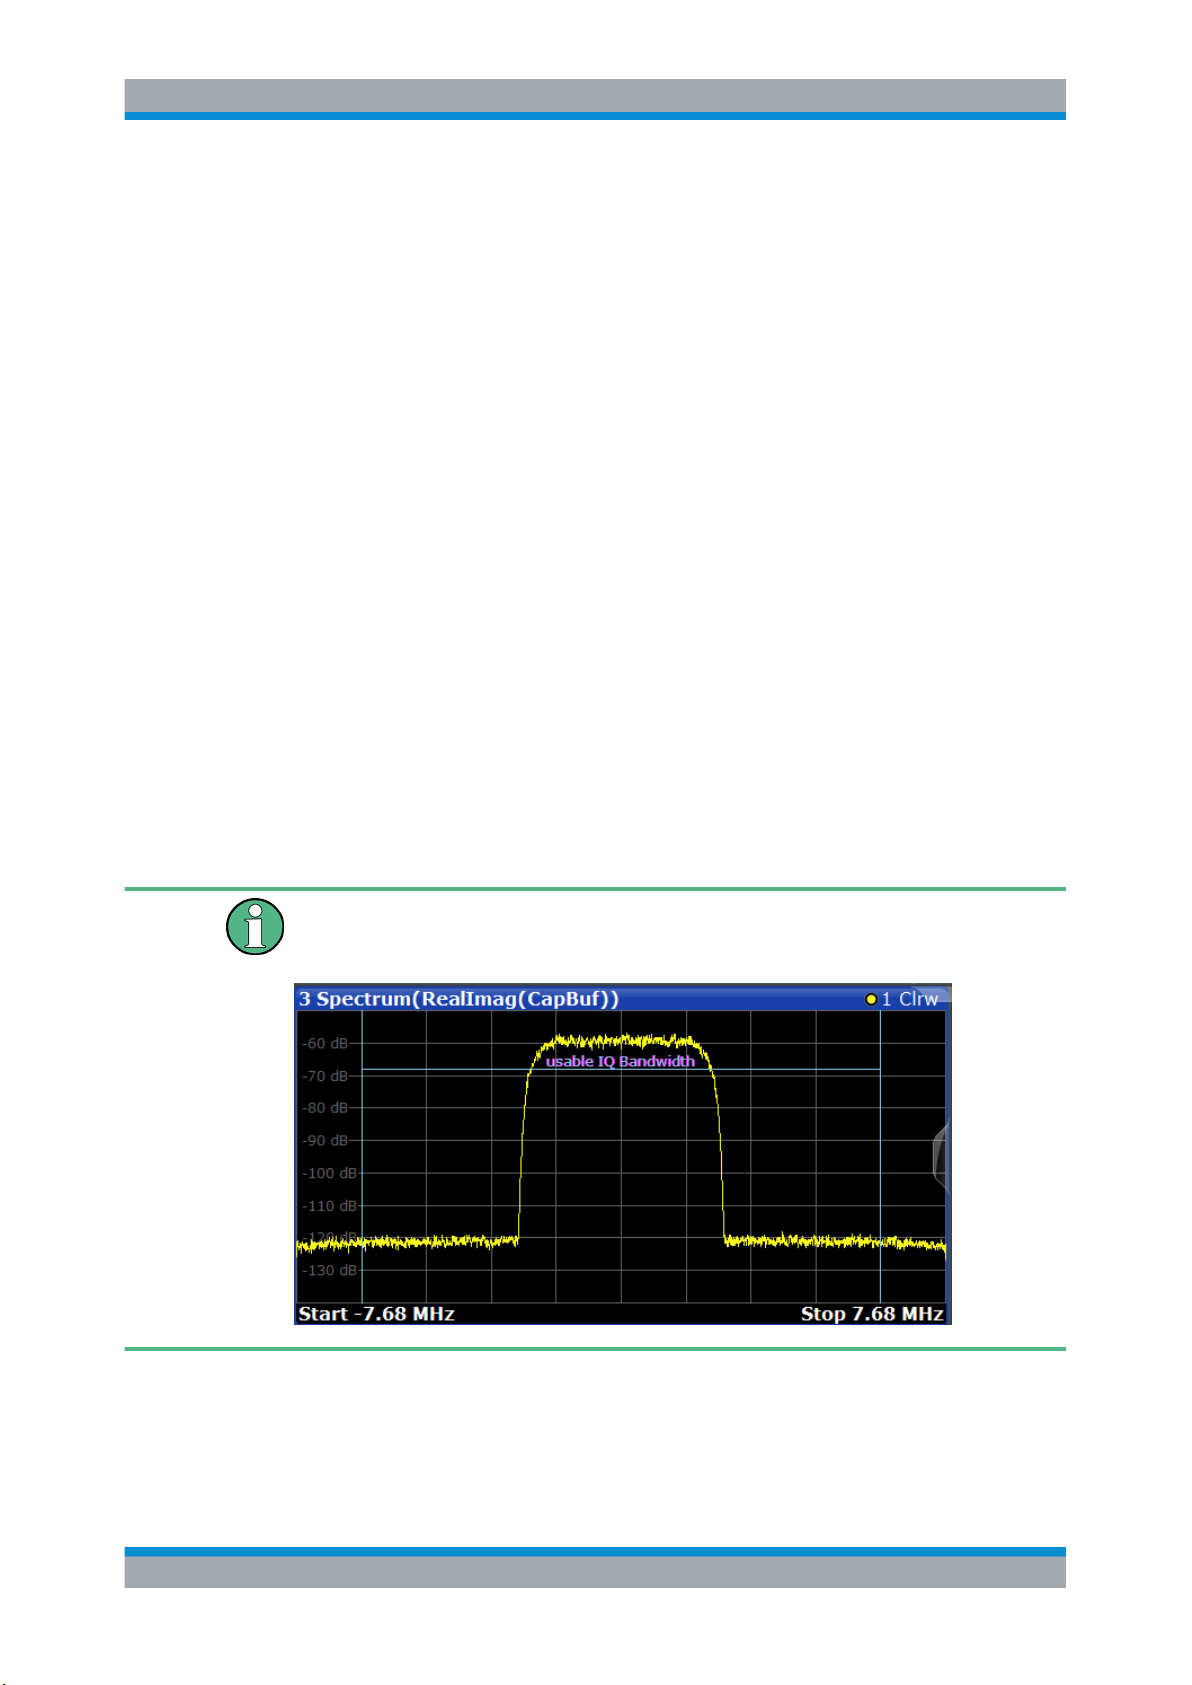
In diagrams in the frequency domain (Spectrum transformation, see "Result Type
Transformation" on page 243) the usable I/Q bandwidth is indicated by vertical blue
lines.
Capture Buffer...............................................................................................................17
Measurement & Reference Signal................................................................................ 17
Symbols........................................................................................................................ 18
Error Vector...................................................................................................................18
16User Manual 1178.9361.02 ─ 02
Page 17
R&S®FPL1-K70
Measurements and Result Displays
Evaluation Data Sources in VSA
Modulation Errors..........................................................................................................18
Modulation Accuracy.....................................................................................................19
Equalizer....................................................................................................................... 19
Multi Source.................................................................................................................. 19
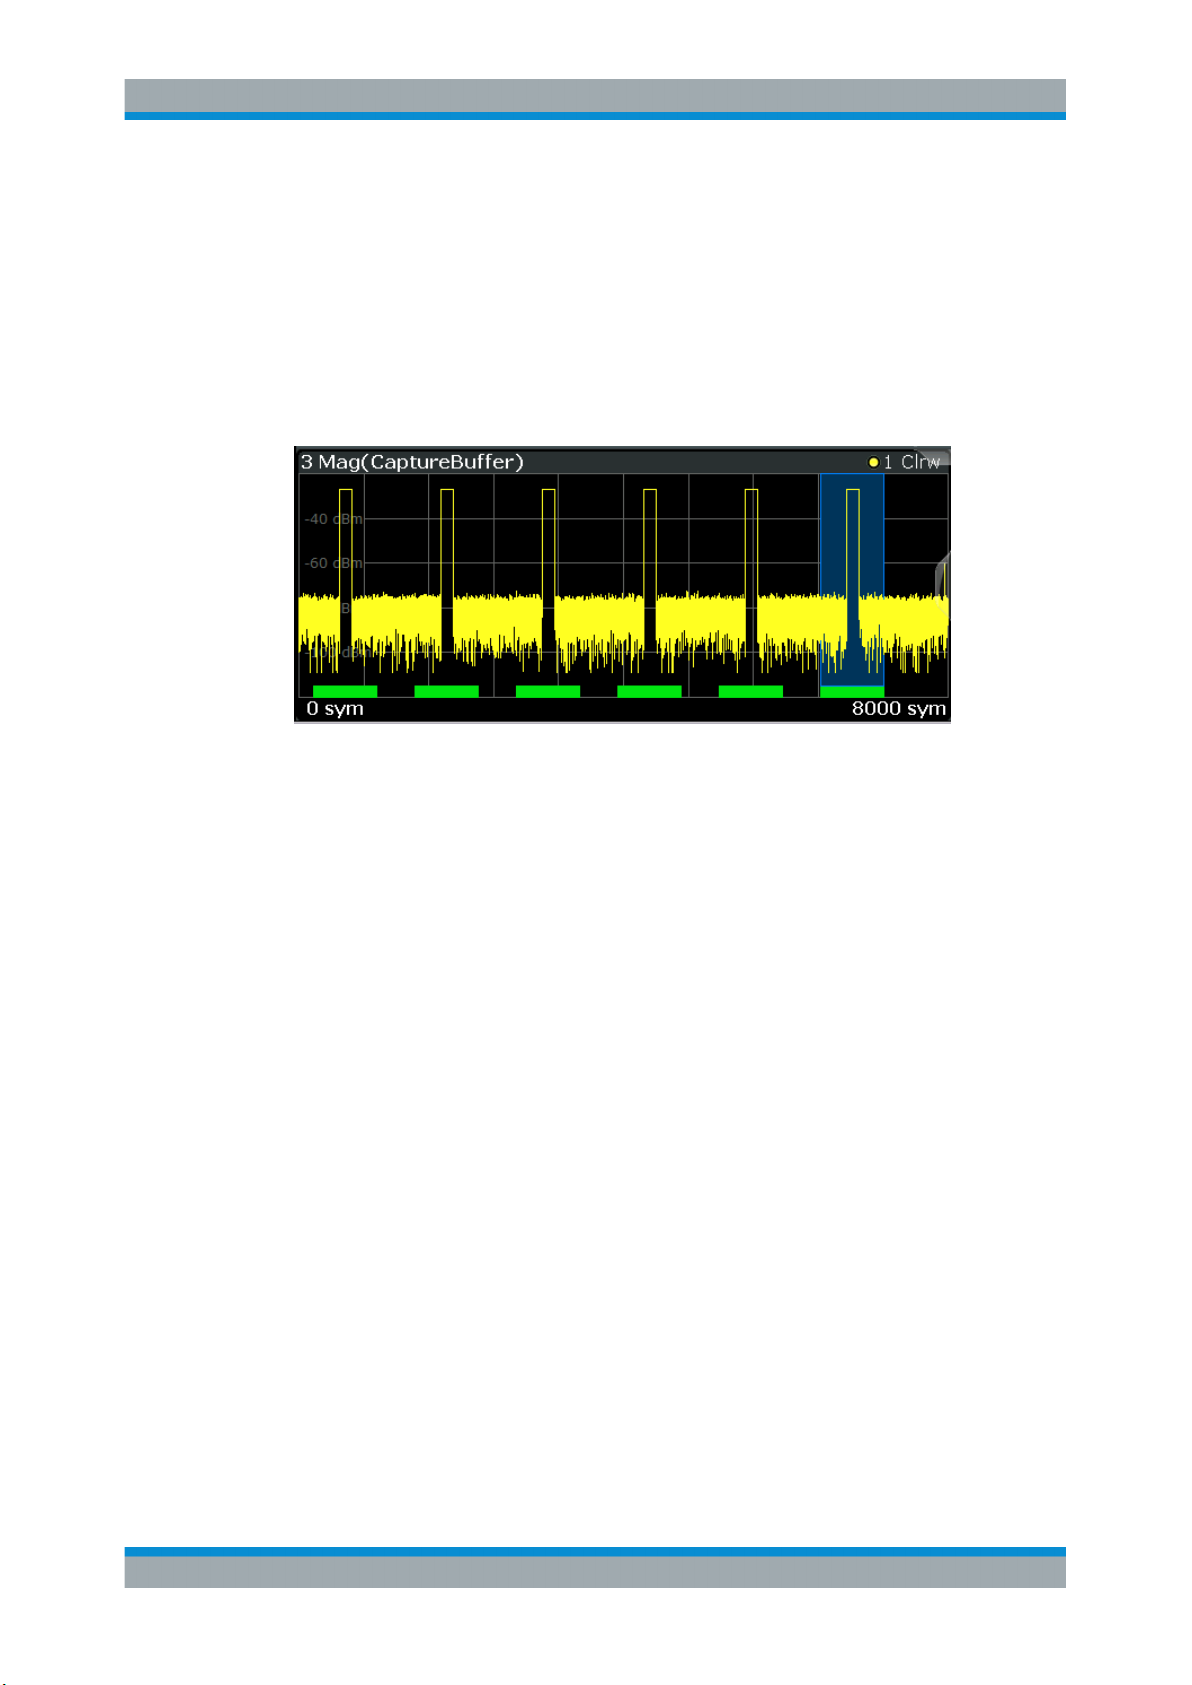
Capture Buffer
Displays the captured I/Q data.
In capture buffer result diagrams the result ranges are indicated by green bars along
the time axis. The currently displayed result range is indicated by a blue bar.
Figure 3-1: Result ranges for a burst signal
Note: You can use the capture buffer display to navigate through the available result
ranges (using Select Result Rng function), and analyze the individual result ranges in
separate windows.
Once the sweep has stopped, you can change the position of the result range quickly
and easily by dragging the blue bar representing the result range to a different position
in the capture buffer.
The default result type is "Magnitude Absolute".
The following result types are available:
●
Chapter 3.2.21, "Magnitude Absolute", on page 42
●
Chapter 3.2.27, "Real/Imag (I/Q)", on page 48
●
Chapter 3.2.11, "Frequency Absolute", on page 32
●
Chapter 3.2.33, "Vector I/Q", on page 58
Remote command:
LAY:ADD? '1',BEL,TCAP(see LAYout:ADD[:WINDow]? on page 426)
Measurement & Reference Signal
The measurement signal or the ideal reference signal (or both)
The default result type is "Magnitude Relative".
The following result types are available:
●
Chapter 3.2.21, "Magnitude Absolute", on page 42
●
Chapter 3.2.22, "Magnitude Relative", on page 43
●
Chapter 3.2.25, "Phase Wrap", on page 46
●
Chapter 3.2.26, "Phase Unwrap", on page 47
●
Chapter 3.2.11, "Frequency Absolute", on page 32
●
Chapter 3.2.12, "Frequency Relative", on page 34
17User Manual 1178.9361.02 ─ 02
Page 18

R&S®FPL1-K70
Measurements and Result Displays
Evaluation Data Sources in VSA
●
Chapter 3.2.27, "Real/Imag (I/Q)", on page 48
●
Chapter 3.2.10, "Eye Diagram Real (I)", on page 31
●
Chapter 3.2.9, "Eye Diagram Imag (Q)", on page 30
●
Chapter 3.2.8, "Eye Diagram Frequency", on page 30
●
Chapter 3.2.5, "Constellation I/Q", on page 26
●
Chapter 3.2.33, "Vector I/Q", on page 58
●
Chapter 3.2.4, "Constellation Frequency", on page 25
●
Chapter 3.2.32, "Vector Frequency", on page 57
Remote command:
LAY:ADD? '1',BEL,REF(see LAYout:ADD[:WINDow]? on page 426)
Symbols
The detected symbols (i.e. the detected bits) displayed in a table;
The default result type is a hexadecimal symbol table.
Other formats for the symbol table are available, but no other result types (see Chap-
ter 3.2.31, "Symbol Table", on page 56).
Remote command:
LAY:ADD? '1',BEL, SYMB(see LAYout:ADD[:WINDow]? on page 426)
Error Vector
The modulated difference between the complex measurement signal and the complex
reference signal:
Modulation (measurement signal - reference signal)
For example: EVM = Mag(meas - ref)
The default result type is "EVM".
The following result types are available:
●
Chapter 3.2.7, "Error Vector Magnitude (EVM)", on page 29
●
Chapter 3.2.27, "Real/Imag (I/Q)", on page 48
●
Chapter 3.2.33, "Vector I/Q", on page 58
Remote command:
LAY:ADD? '1',BEL,EVEC(see LAYout:ADD[:WINDow]? on page 426)
Modulation Errors
The difference between the modulated complex samples in the measurement and the
modulated reference signal:
Modulation (measurement signal) - Modulation (reference signal)
For example: Magnitude Error = Mag(meas) - Mag(ref)
The default result type is "Magnitude Error".
The following result types are available:
●
Chapter 3.2.21, "Magnitude Absolute", on page 42
●
Chapter 3.2.24, "Phase Error", on page 45
●
Chapter 3.2.13, "Frequency Error Absolute", on page 35
●
Chapter 3.2.14, "Frequency Error Relative", on page 36
Remote command:
LAY:ADD? '1',BEL,MERR(see LAYout:ADD[:WINDow]? on page 426)
18User Manual 1178.9361.02 ─ 02
Page 19
R&S®FPL1-K70
Measurements and Result Displays
Evaluation Data Sources in VSA
Modulation Accuracy
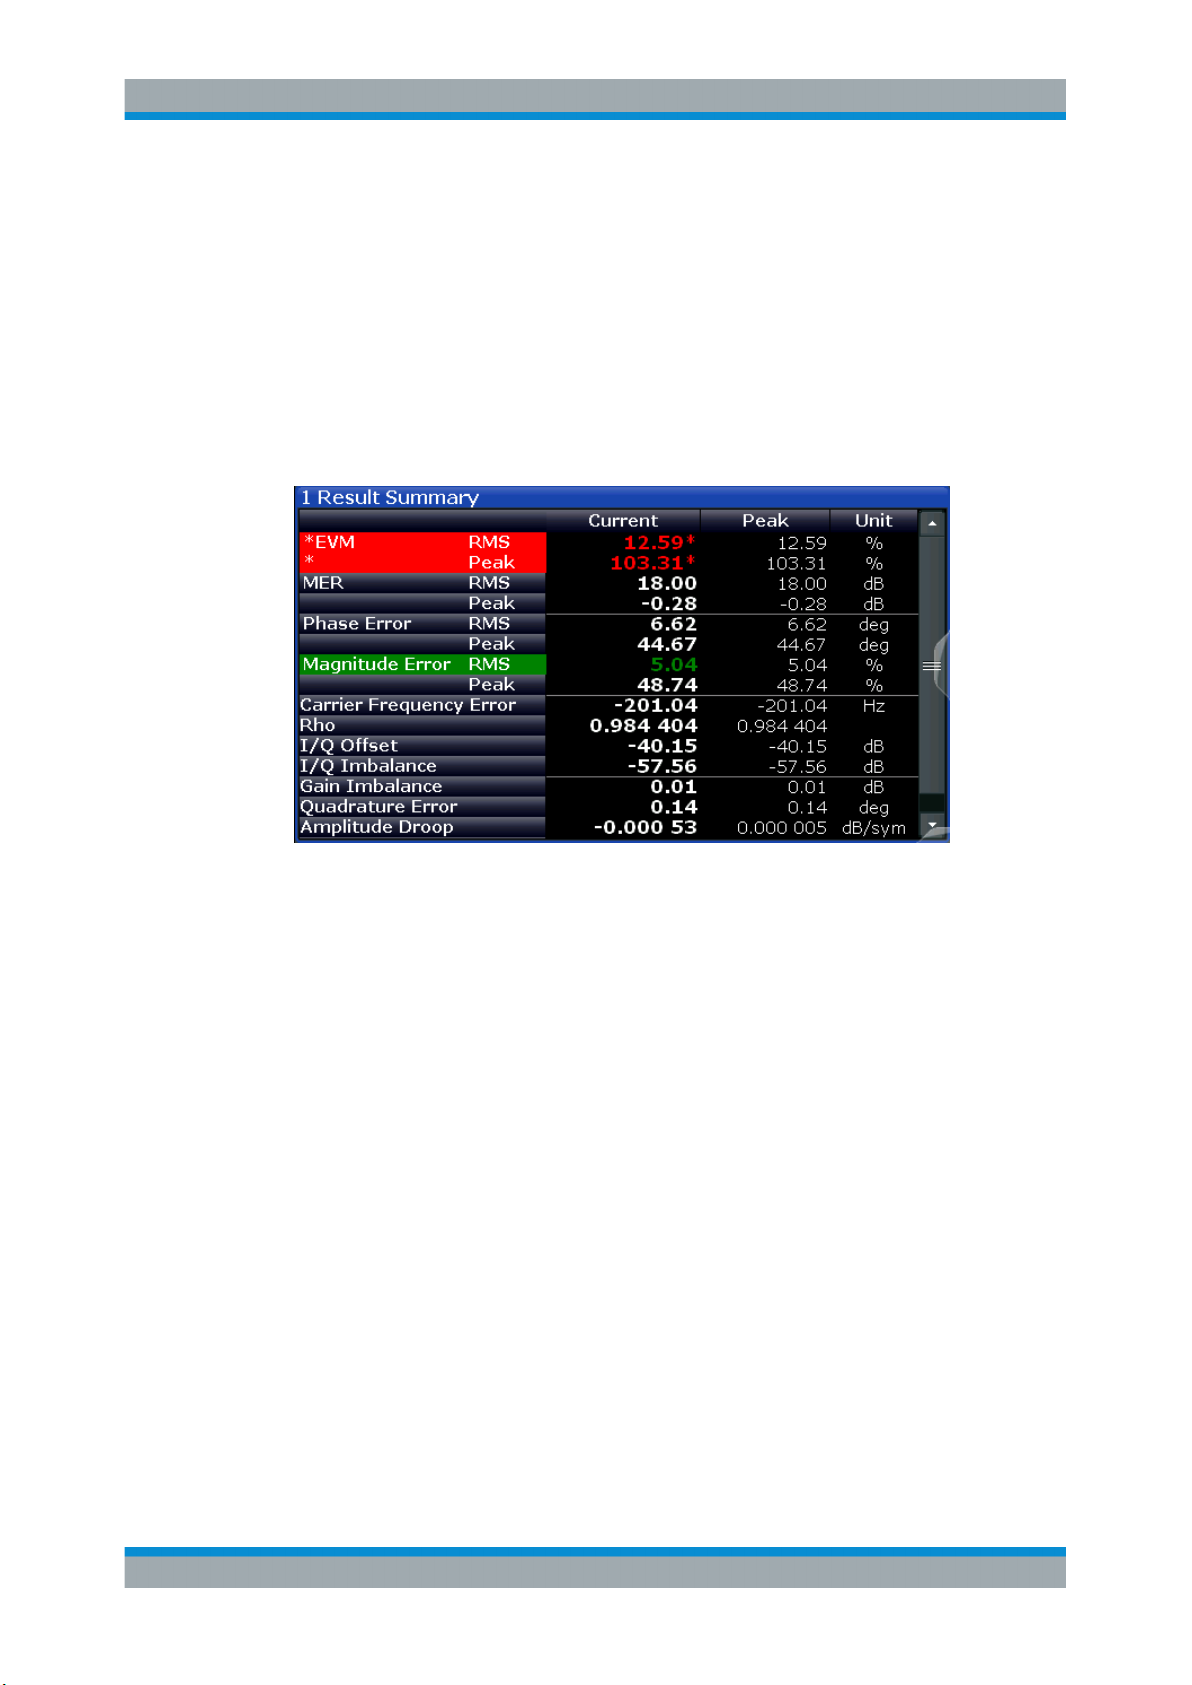
Parameters that characterize the accuracy of modulation.
The default result type is "Result Summary".
The following result types are available:
●
Chapter 3.2.28, "Result Summary", on page 49
●
Chapter 3.2.1, "Bit Error Rate (BER)", on page 22
The results of a modulation accuracy measurement can be checked for violation of
defined limits automatically. If limit check is activated and the measured values exceed
the limits, those values are indicated in red in the result summary table. If limit check is
activated and no values exceed the limits, the checked values are indicated in green.
Remote command:
LAY:ADD? '1',BEL,MACC(see LAYout:ADD[:WINDow]? on page 426)
Equalizer
Filter characteristics of the equalizer used to compensate for channel distortion and
parameters of the distortion itself.
The following result types are available:
●
Chapter 3.2.18, "Impulse Response Magnitude", on page 40
●
Chapter 3.2.19, "Impulse Response Phase", on page 41
●
Chapter 3.2.20, "Impulse Response Real/Imag", on page 41
●
Chapter 3.2.16, "Frequency Response Magnitude", on page 38
●
Chapter 3.2.17, "Frequency Response Phase", on page 39
●
Chapter 3.2.15, "Frequency Response Group Delay", on page 37
●
Chapter 3.2.3, "Channel Frequency Response Magnitude", on page 25
●
Chapter 3.2.2, "Channel Frequency Response Group Delay", on page 24
The default result type is "Frequency Response Magnitude".
Remote command:
LAY:ADD? '1',BEL,EQU(see LAYout:ADD[:WINDow]? on page 426)
Multi Source
Combines two data sources in one diagram, with (initially) one trace for each data
source. This allows you to compare the errors to the captured or measured data
directly in the diagram.
19User Manual 1178.9361.02 ─ 02
Page 20
R&S®FPL1-K70
3.2 Result Types in VSA
Measurements and Result Displays
Result Types in VSA
Furthermore, for carrier-in-carrier measurements, this data source makes both carriers
visible.
The default result type is "Spec (Meas+Error)".
The following result types are available:
●
Chapter 3.2.29, "Spectrum (Capture Buffer + Error)", on page 53
●
Chapter 3.2.30, "Spectrum (Measurement + Error)", on page 55
Remote command:
LAY:ADD? '1',RIGH,MCOM, see LAYout:ADD[:WINDow]? on page 426
The available result types for a window depend on the selected evaluation data source.
The SCPI parameters in the following table refer to the CALC:FORM command, see
CALCulate<n>:FORMat on page 435.
Table 3-1: Available result types depending on data source
Evaluation Data
Source
Capture Buffer Magnitude Absolute MAGNitude
Meas & Ref Signal Magnitude Absolute MAGNitude
Result Type SCPI Parameter
Real/Imag (I/Q) RIMag
Frequency Absolute FREQuency
Vector I/Q COMP
Magnitude Relative MAGNitude
Phase Wrap PHASe
Phase Unwrap UPHase
Frequency Absolute FREQuency
Frequency Relative FREQuency
Real/Imag (I/Q) RIMag
Eye Diagram Real (I) IEYE
Eye Diagram Imag (Q) QEYE
Eye Diagram Frequency FEYE
Constellation I/Q CONS
Constellation I/Q (Rotated) RCON
Vector I/Q COMP
Constellation Frequency CONF
20User Manual 1178.9361.02 ─ 02
Page 21
R&S®FPL1-K70
Measurements and Result Displays
Result Types in VSA
Evaluation Data
Source
Symbols Binary -
Error Vector EVM MAGNitude
Modulation Errors Magnitude Error MAGNitude
Modulation Accuracy Bit Error Rate BERate
Equalizer Impulse Response Magnitude MAGNitude
Result Type SCPI Parameter
Vector Frequency COVF
Octal -
Decimal -
Hexadecimal -
Real/Imag (I/Q) RIMag
Vector I/Q COMP
Phase Error PHASe
Frequency Error Absolute FREQuency
Frequency Error Relative FREQuency
Result Summary RSUM
Impulse Response Phase UPHase
Impulse Response Real/Image RIMag
Frequency Response Magnitude MAGNitude
Frequency Response Phase UPHase
Frequency Response Group Delay GDELay
Channel Frequency Response Magnitude
Channel Frequency Response Group
Delay
Multi Source Spectrum (Real/Imag) (Capture buffer
+ Error)
Spectrum (Real/Imag) (Measurement
+ Error)
MAGNitude
GDELay
RIMag (query only)
RIMag (query only)
For details on selecting the data source and result types for evaluation see Chap-
ter 6.5, "Display and Window Configuration", on page 241.
Remote command:
CALCulate<n>:FORMat on page 435
● Bit Error Rate (BER)................................................................................................22
● Channel Frequency Response Group Delay.......................................................... 24
● Channel Frequency Response Magnitude..............................................................25
21User Manual 1178.9361.02 ─ 02
Page 22

R&S®FPL1-K70
Measurements and Result Displays
Result Types in VSA
● Constellation Frequency......................................................................................... 25
● Constellation I/Q......................................................................................................26
● Constellation I/Q (Rotated)......................................................................................28
● Error Vector Magnitude (EVM)................................................................................29
● Eye Diagram Frequency......................................................................................... 30
● Eye Diagram Imag (Q)............................................................................................ 30
● Eye Diagram Real (I)...............................................................................................31
● Frequency Absolute................................................................................................ 32
● Frequency Relative................................................................................................. 34
● Frequency Error Absolute....................................................................................... 35
● Frequency Error Relative........................................................................................ 36
● Frequency Response Group Delay.........................................................................37
● Frequency Response Magnitude............................................................................ 38
● Frequency Response Phase...................................................................................39
● Impulse Response Magnitude.................................................................................40
● Impulse Response Phase....................................................................................... 41
● Impulse Response Real/Imag.................................................................................41
● Magnitude Absolute................................................................................................ 42
● Magnitude Relative................................................................................................. 43
● Magnitude Error...................................................................................................... 44
● Phase Error.............................................................................................................45
● Phase Wrap............................................................................................................ 46
● Phase Unwrap.........................................................................................................47
● Real/Imag (I/Q)........................................................................................................48
● Result Summary......................................................................................................49
● Spectrum (Capture Buffer + Error)..........................................................................53
● Spectrum (Measurement + Error)........................................................................... 55
● Symbol Table...........................................................................................................56
● Vector Frequency....................................................................................................57
● Vector I/Q................................................................................................................58
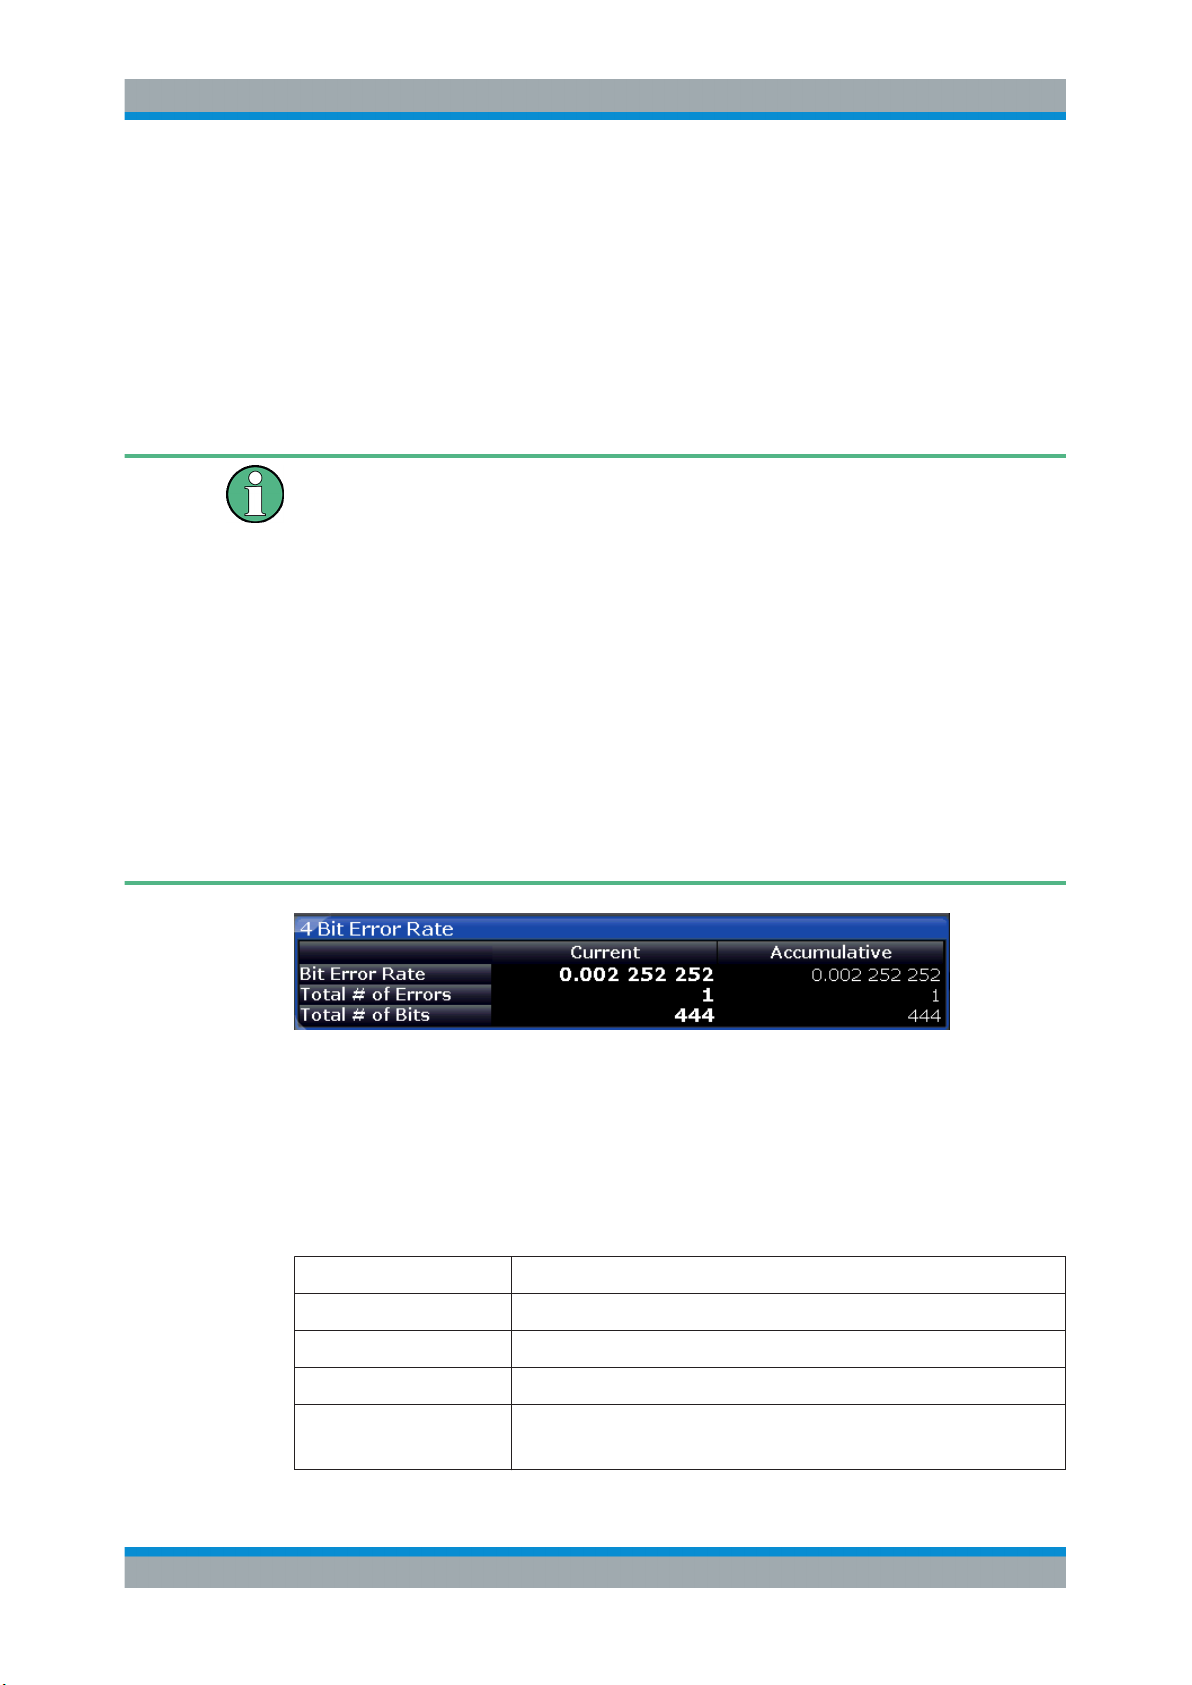
3.2.1 Bit Error Rate (BER)
A bit error rate (BER) measurement compares the transmitted bits with the determined
symbol decision bits:
BER = error bits / number of analyzed bits
As a prerequisite for this measurement, the VSA application must know which bit
sequences are correct, i.e. which bit sequences may occur. This knowledge must be
provided as a list of possible data sequences in xml format, which is loaded in the VSA
application (see Chapter 4.9, "Known Data Files - Dependencies and Restrictions",
on page 142).
Auxiliary tool to create Known Data files
An auxiliary tool to create Known Data files from data that is already available in the
R&S FPL1000 VSA application is provided in the instrument free of charge.
See Chapter 8.2.4.2, "How to Create Known Data Files", on page 262.
22User Manual 1178.9361.02 ─ 02
Page 23
R&S®FPL1-K70
Measurements and Result Displays
Result Types in VSA
Alternatively, for data generated by a pseudo-random bit sequence (PRBS) generator,
you can specify the algorithm used to generate the data, so the R&S FPL1000 VSA
application knows which sequences may occur. This function requires the
R&S FPL1000-K70P option. See Chapter 4.10, "Known Data from PRBS Generators",
on page 144.
If known data is specified in the application, the BER result display is available for the
following source types:
●
Modulation Accuracy
Note that this measurement may take some time, as each symbol decision must be
compared to the possible data sequences one by one.
The BER measurement is an indicator for the quality of the demodulated signal. High
BER values indicate problems such as:
●
inadequate demodulation settings
●
poor quality in the source data
●
false or missing sequences in the Known Data file
●
result range alignment leads to a mismatch of the input data with the defined
sequences
A BER value of 0.5 means that for at least one measurement no matching sequence
was found.
See also Chapter 4.4.3, "Demodulation and Symbol Decisions", on page 111 and the
application sheet R&S®FSW-K70 Measuring the BER and the EVM for Signals with
Low SNR on the Rohde & Schwarz Internet site.
The following information is provided in the BER result display:
●
Bit Error Rate: error bits / number of analyzed bits
●
Total # of Errors: number of detected bit errors (known data compared to symbol
decisions)
●
Total # of Bits: number of analyzed bits
For each of these results, the following values are provided:
BER Result Description
Current Value for current result range
Minimum Minimum "Current" value during the current measurement
Maximum Maximum "Current" value during the current measurement
Accumulative Total value over several measurements;
for BER: Total # of Errors / Total # of Bits (similar to average function)
23User Manual 1178.9361.02 ─ 02
Page 24
R&S®FPL1-K70
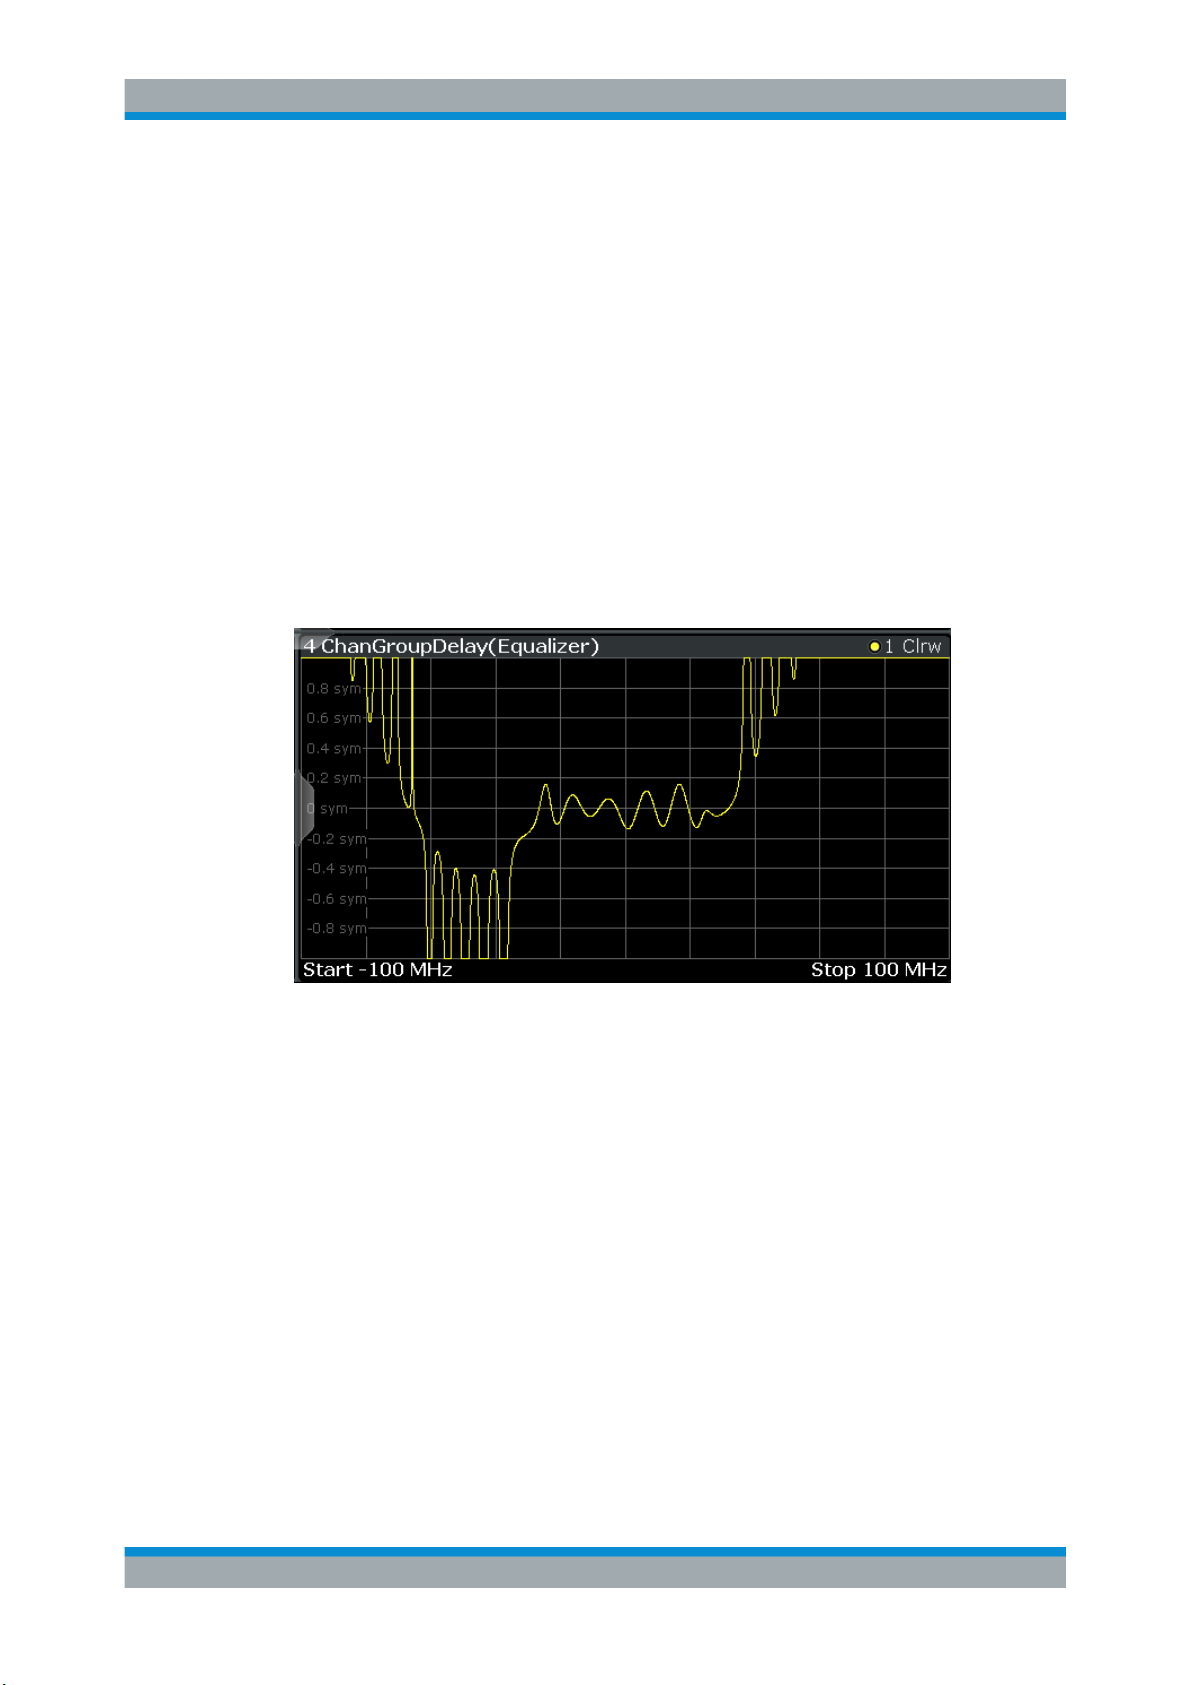
3.2.2 Channel Frequency Response Group Delay
Measurements and Result Displays
Result Types in VSA
Remote commands:
LAY:ADD? '1',BEL,MACC
to define the required source type (see LAYout:ADD[:WINDow]? on page 426)
CALC:FORM BER
to define the result type (see CALCulate<n>:FORMat on page 435)
CALC:BER?
to query the results (see CALCulate<n>:BERate on page 449)
The Frequency Response Group Delay of the channel is the derivation of phase over
frequency for the original input signal. It is a measure of phase distortion.
Remote commands:
LAY:ADD? '1',BEL,EQU
to define the required source type (see LAYout:ADD[:WINDow]? on page 426)
CALC:FEED 'XFR:DDEM:IRAT'
to define the channel frequency response result type (see CALCulate<n>:FEED
on page 434)
CALC:FORM GDEL
to define the group delay result type (see CALCulate<n>:FORMat on page 435)
TRAC:DATA? TRACE1
to query the trace results (see TRACe<n>[:DATA]? TRACE<n> and Chapter 11.9.2.6,
"Equalizer", on page 448)
24User Manual 1178.9361.02 ─ 02
Page 25
R&S®FPL1-K70
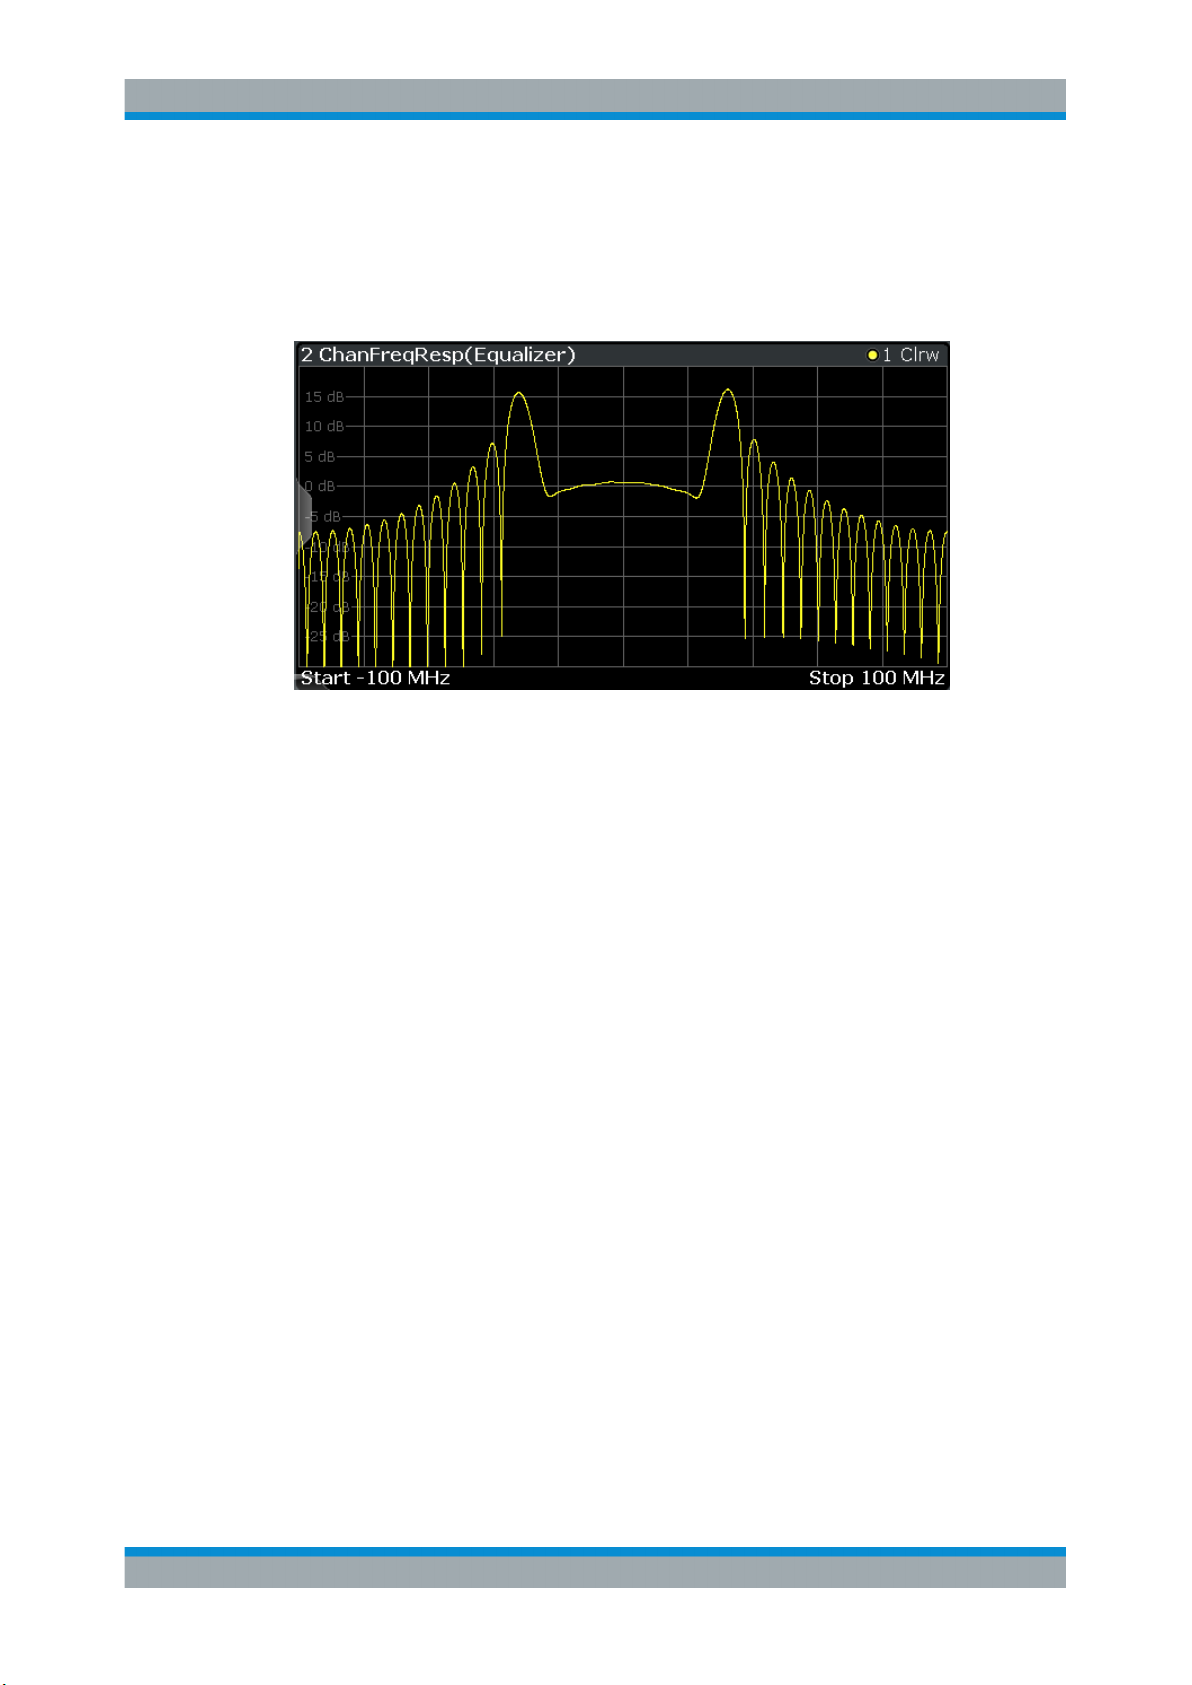
3.2.3 Channel Frequency Response Magnitude
Measurements and Result Displays
Result Types in VSA
The frequency response magnitude of the channel indicates which distortions occurred
during transmission of the input signal. It is only determined if the equalizer is activated.
The bandwidth for which the channel transfer function can be estimated is not only limited by the usable I/Q bandwidth, but also by the bandwidth of the analyzed input signal. Areas with low reception power, e.g. at the filter edges, may suffer from less accurate estimation results.
Remote commands:
LAY:ADD? '1',BEL,EQU
to define the required source type (see LAYout:ADD[:WINDow]? on page 426)
CALC:FEED 'XFR:DDEM:IRAT'
to define the channel frequency response result type (see CALCulate<n>:FEED
on page 434)
CALC:FORM MAGN
to define the magnitude result type (see CALCulate<n>:FORMat on page 435)
TRAC:DATA? TRACE1
to query the trace results (see TRACe<n>[:DATA]? TRACE<n> and Chapter 11.9.2.6,
"Equalizer", on page 448)
3.2.4 Constellation Frequency
The instantaneous frequency of the source signal (without inter-symbol interference)
as an X/Y plot; only the symbol decision instants are drawn and not connected.
Available for source types:
●
Meas & Ref Signal
25User Manual 1178.9361.02 ─ 02
Page 26
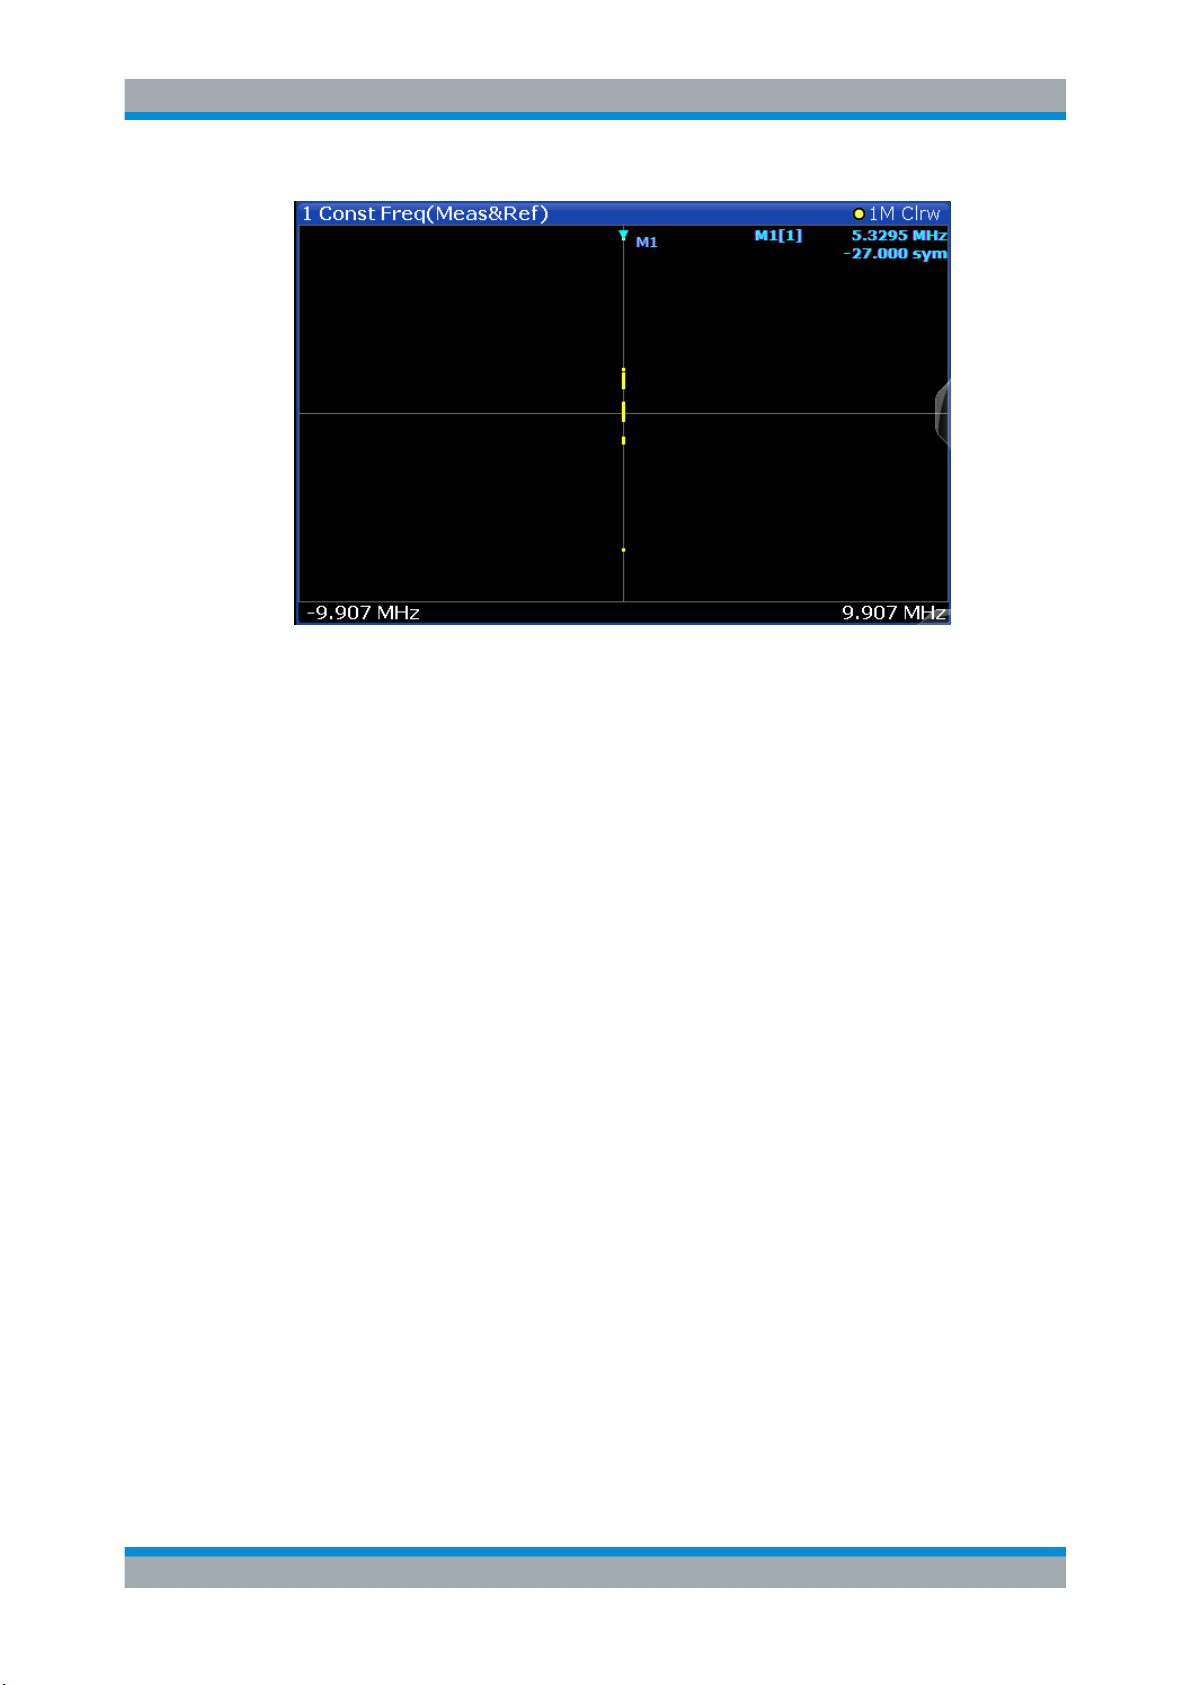
R&S®FPL1-K70
Measurements and Result Displays
Result Types in VSA
Figure 3-2: Result display "Constellation Frequency"
Remote commands:
LAY:ADD? '1',BEL,MEAS
to define the required source type (see LAYout:ADD[:WINDow]? on page 426)
CALC:FORM CONF
to define the result type (see CALCulate<n>:FORMat on page 435)
TRAC:DATA? TRACE1
to query the trace results (see TRACe<n>[:DATA]? TRACE<n> and Chapter 11.9.2.3,
"Polar Diagrams", on page 446)
3.2.5 Constellation I/Q
The complex source signal (without inter-symbol interference) as an X/Y plot; only the
(de-rotated) symbol decision instants are drawn and not connected
Available for source types:
●
Meas & Ref Signal
26User Manual 1178.9361.02 ─ 02
Page 27
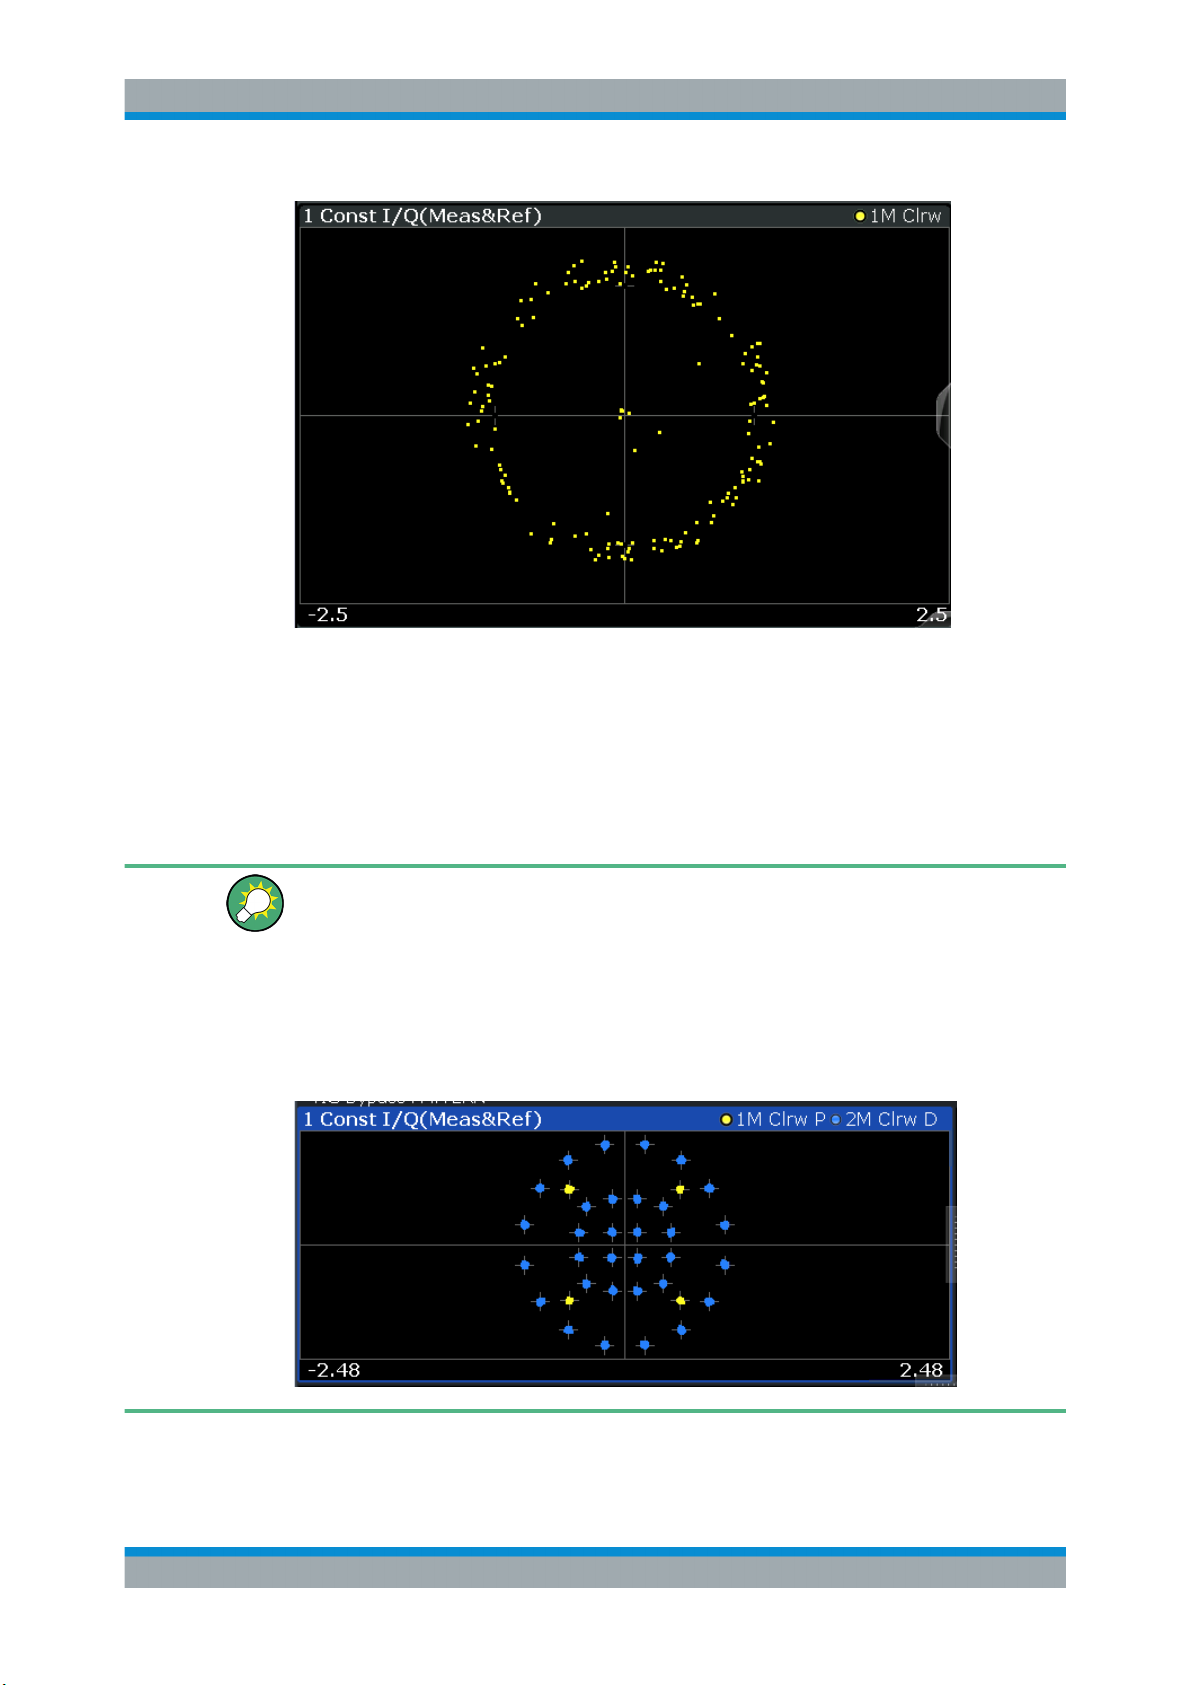
R&S®FPL1-K70
Measurements and Result Displays
Result Types in VSA
Figure 3-3: Constellation I/Q diagram for QPSK modulated signal
Markers in the Constellation diagram
Using markers you can detect individual constellation points for a specific symbol.
When you activate a marker in the Constellation diagram, its position is defined by the
symbol the point belongs to, while the marker result indicates the I and Q values of the
point.
Constellation for subframe or symbol types in multi-modulation signals
For signals with a user-defined frame structure (see Chapter 4.11, "Multi-Modulation
Analysis (R&S FPL1000-K70M)", on page 146), the constellation diagram displays all
symbols in the entire frame by default. However, if you restrict the evaluation range to
the symbols of a particular subframe, only those constellation points are displayed (see
Chapter 5.10, "Evaluation Range Configuration", on page 222).
You can alo define different colored traces for different symbol types (see Chapter 6.1,
"Trace Settings", on page 227).
27User Manual 1178.9361.02 ─ 02
Page 28
R&S®FPL1-K70
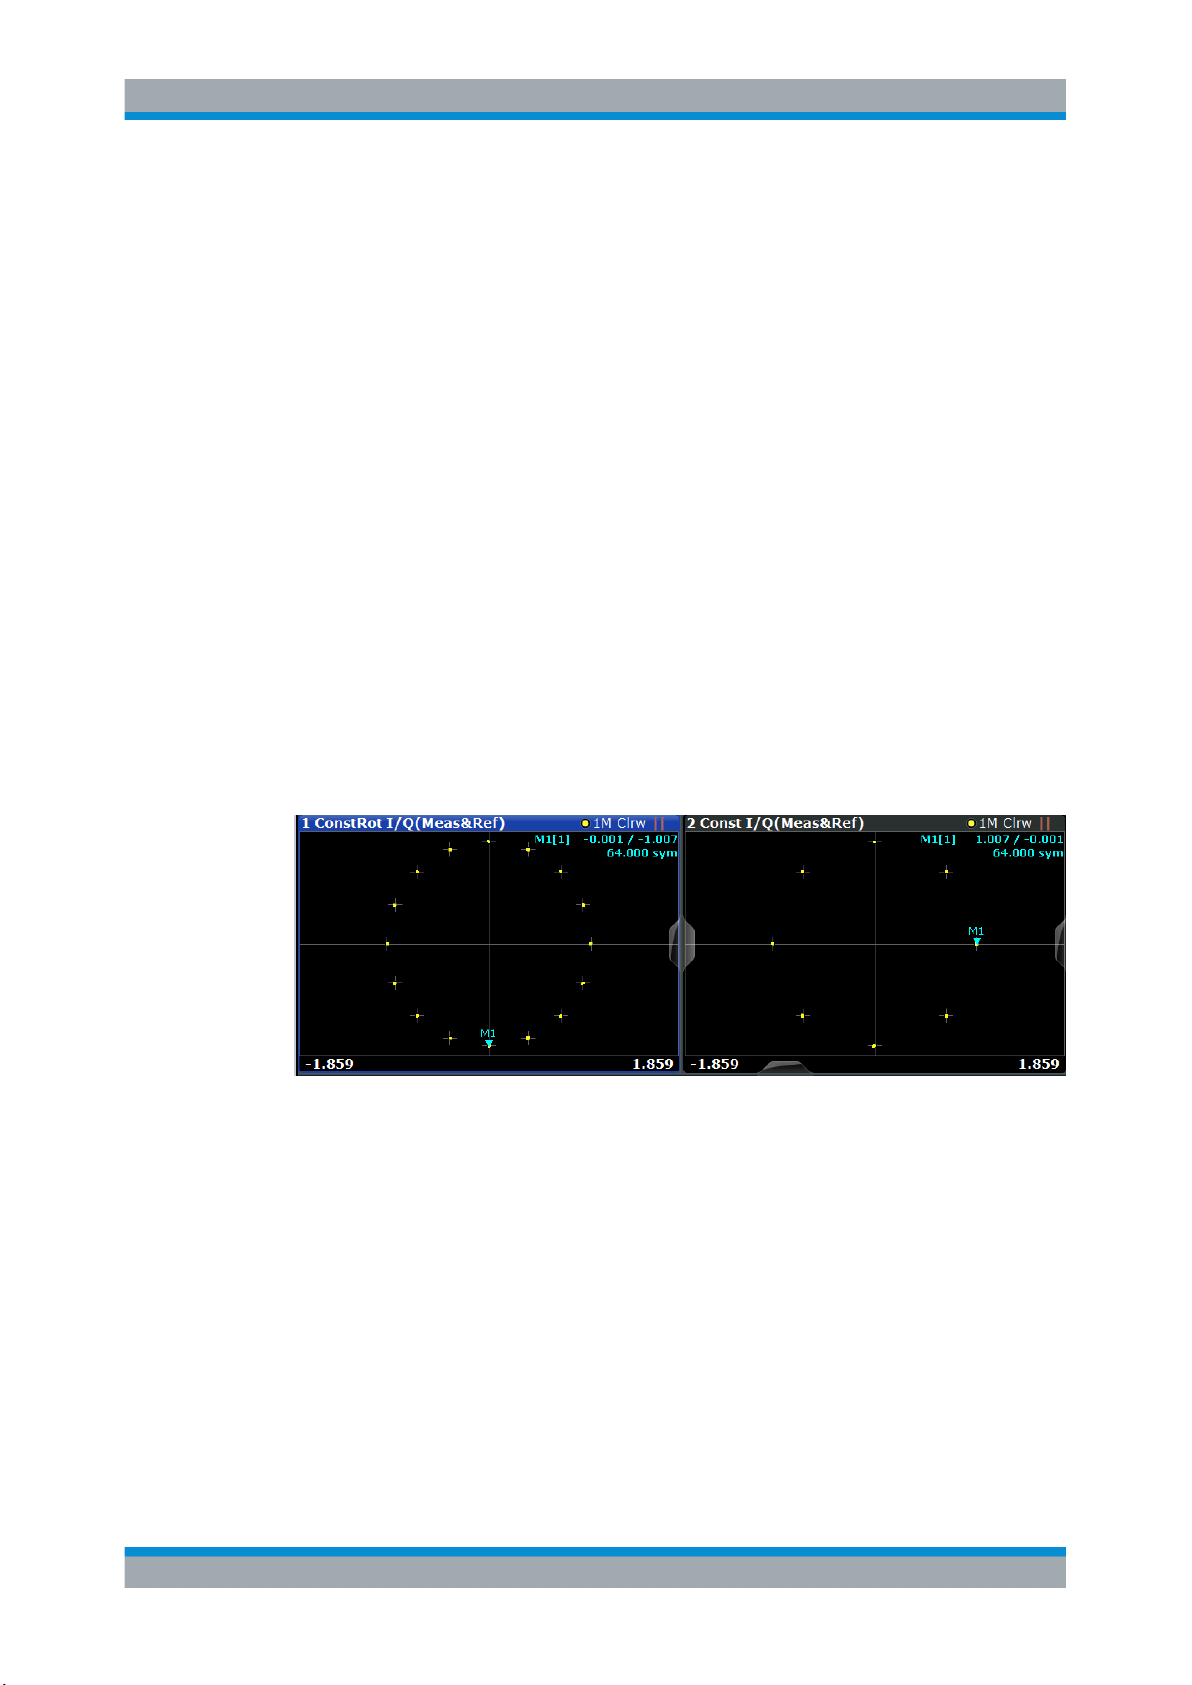
3.2.6 Constellation I/Q (Rotated)
Measurements and Result Displays
Result Types in VSA
Remote commands:
LAY:ADD? '1',BEL,MEAS
to define the required source type (see LAYout:ADD[:WINDow]? on page 426)
CALC:FORM CONS
to define the result type (see CALCulate<n>:FORMat on page 435)
TRAC:DATA? TRACE1
to query the trace results (see TRACe<n>[:DATA]? TRACE<n> and Chapter 11.9.2.3,
"Polar Diagrams", on page 446)
CALCulate<n>:MARKer<m>:Y on page 408, to query the marker I/Q values
The complex source signal as an X/Y plot; As opposed to the common Constellation
I/Q display, the symbol decision instants, including the rotated ones, are drawn and not
connected.
Available for source types:
●
Meas & Ref Signal
This result type is only available for signals with a rotating modulation.
Figure 3-4: Result display "Constellation I/Q (Rotated)" vs. common "Constellation I/Q" for 3
8-8PSK modulation
Remote commands:
LAY:ADD? '1',BEL,MEAS
to define the required source type (see LAYout:ADD[:WINDow]? on page 426)
CALC:FORM RCON
π
/
to define the result type (see CALCulate<n>:FORMat on page 435)
TRAC:DATA? TRACE1
to query the trace results (see TRACe<n>[:DATA]? TRACE<n> and Chapter 11.9.2.3,
"Polar Diagrams", on page 446)
28User Manual 1178.9361.02 ─ 02
Page 29
R&S®FPL1-K70
C
tEV
tEVM
k
TkREF
K
C
2
1
periods symbol ofduration T
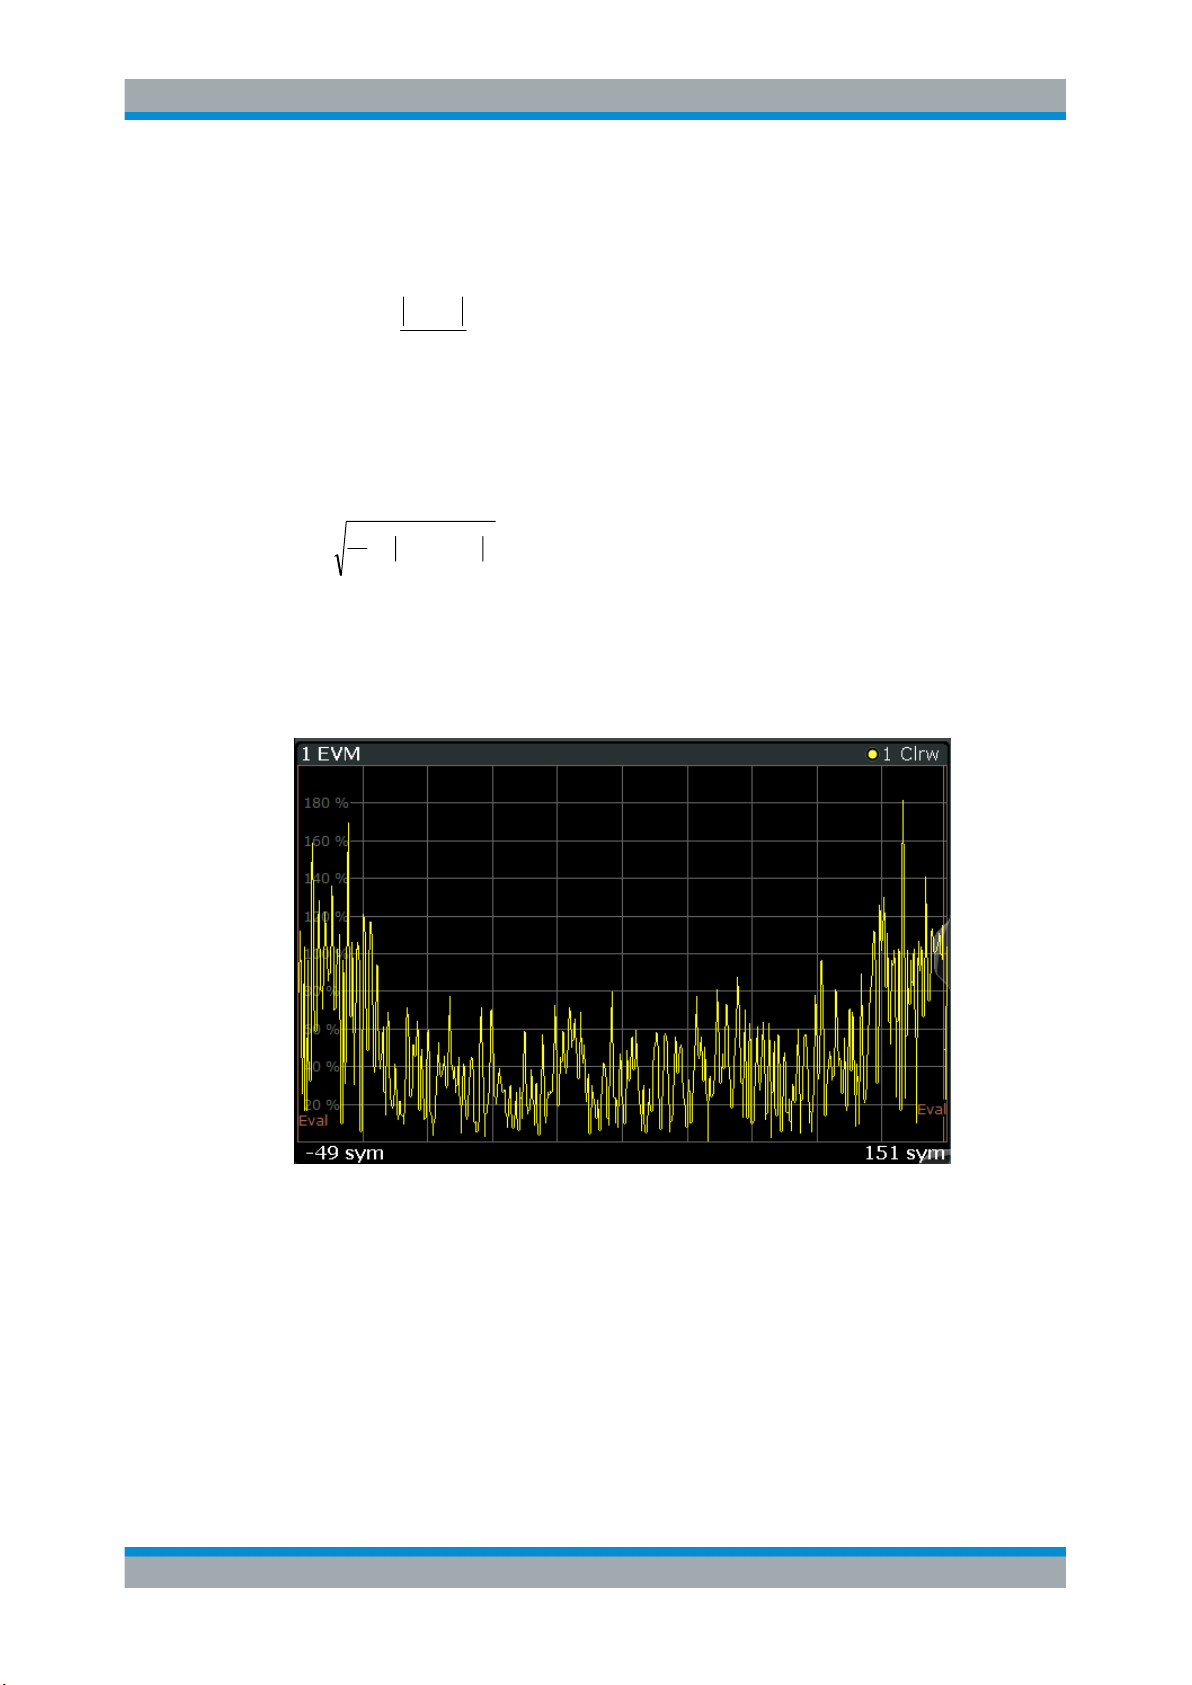
3.2.7 Error Vector Magnitude (EVM)
Measurements and Result Displays
Result Types in VSA
Displays the error vector magnitude as a function of symbols or time.
with t=n·TD and TD=the duration of one sampling period at the sample rate defined by
the display points per symbol parameter (see "Display Points/Sym" on page 243).
The normalization constant C is chosen according to the EVM normalization. By
default C² is the mean power of the reference signal.
and
Note that k=0.5·n·T for Offset QPSK with inactive Offset EVM.
Figure 3-5: Result display "Error Vector Magnitude"
Available for source types:
●
Error Vector
Remote commands:
LAY:ADD? '1',BEL,EVEC
to define the required source type (see LAYout:ADD[:WINDow]? on page 426)
CALC:FORM MAGN
29User Manual 1178.9361.02 ─ 02
Page 30

R&S®FPL1-K70
3.2.8 Eye Diagram Frequency
Measurements and Result Displays
Result Types in VSA
to define the result type (see CALCulate<n>:FORMat on page 435)
TRAC:DATA? TRACE1
to query the trace results (see TRACe<n>[:DATA]? TRACE<n> and Chapter 11.9.2.2,
"Cartesian Diagrams", on page 446)
The eye diagram of the currently measured frequencies and/or the reference signal.
The time span of the data depends on the evaluation range (capture buffer).
Available for source types:
●
Meas & Ref Signal
Display lines are available in eye diagrams which allow you to determine the size of the
eye, see also Chapter 8.3.2, "How to Measure the Size of an Eye", on page 269.
Remote commands:
LAY:ADD? '1',BEL,MEAS
to define the required source type (see LAYout:ADD[:WINDow]? on page 426)
CALC:FORM FEYE
to define the result type (see CALCulate<n>:FORMat on page 435)
TRAC:DATA? TRACE1
to query the trace results (see TRACe<n>[:DATA]? TRACE<n> and Chapter 11.9.2.2,
"Cartesian Diagrams", on page 446)
Chapter 11.7.3, "Configuring Display Lines for Eye Diagrams", on page 416
3.2.9 Eye Diagram Imag (Q)
The eye pattern of the quadrature (Q) channel; the x-axis range is from -1 to +1 symbols (MSK: -2 to +2)
Available for source types:
●
Meas & Ref Signal
30User Manual 1178.9361.02 ─ 02
Page 31

R&S®FPL1-K70
Measurements and Result Displays
Result Types in VSA
Figure 3-6: Result display "Eye Diagram Imag (Q)"
Display lines are available in eye diagrams which allow you to determine the size of the
eye, see also Chapter 8.3.2, "How to Measure the Size of an Eye", on page 269.
Remote commands:
LAY:ADD? '1',BEL,MEAS
to define the required source type (see LAYout:ADD[:WINDow]? on page 426)
CALC:FORM QEYE
to define the result type (see CALCulate<n>:FORMat on page 435)
TRAC:DATA? TRACE1
to query the trace results (see TRACe<n>[:DATA]? TRACE<n> and Chapter 11.9.2.2,
"Cartesian Diagrams", on page 446)
Chapter 11.7.3, "Configuring Display Lines for Eye Diagrams", on page 416
3.2.10 Eye Diagram Real (I)
The eye pattern of the inphase (I) channel; the x-axis value range is from -1 to +1 symbols (MSK: -2 to +2)
Available for source types:
●
Meas & Ref Signal
31User Manual 1178.9361.02 ─ 02
Page 32

R&S®FPL1-K70
Measurements and Result Displays
Result Types in VSA
Figure 3-7: Result display "Eye Diagram Real (I)"
Display lines are available in eye diagrams which allow you to determine the size of the
eye, see also Chapter 8.3.2, "How to Measure the Size of an Eye", on page 269.
Remote commands:
LAY:ADD? '1',BEL,MEAS
to define the required source type (see LAYout:ADD[:WINDow]? on page 426)
CALC:FORM IEYE
to define the result type (see CALCulate<n>:FORMat on page 435)
TRAC:DATA? TRACE1
to query the trace results (see TRACe<n>[:DATA]? TRACE<n> and Chapter 11.9.2.2,
"Cartesian Diagrams", on page 446)
Chapter 11.7.3, "Configuring Display Lines for Eye Diagrams", on page 416
3.2.11 Frequency Absolute
The instantaneous frequency of the signal source; the absolute value is displayed in
Hz.
Available for source types:
●
Meas & Ref Signal
●
Capture Buffer
32User Manual 1178.9361.02 ─ 02
Page 33

R&S®FPL1-K70
tMEAS
dt
d
tFREQ
MEAS
2
1
tCapt
dt
d
tFREQ
CAPT
2
1
.
Measurements and Result Displays
Result Types in VSA
Figure 3-8: Frequency Absolute result display
Meas&Ref signal:
with t=n·TD and TD=the duration of one sampling period at the sample rate defined by
the display points per symbol parameter (see "Display Points/Sym" on page 243).
Capture buffer:
When evaluating the capture buffer, the absolute frequency is derived from the measured phase, with TD=the duration of one sampling period at the sample rate (see
"Sample Rate" on page 193).
Note that this result display is based on an individual capture buffer range. If more than
256 000 samples are captured, overlapping ranges with a size of 256 000 each are
created. Only one range at a time can be displayed in the Frequency Absolute result
display. For details see Chapter 4.8, "Capture Buffer Display", on page 142.
This measurement is mainly of interest when using the MSK or FSK modulation, but
can also be used for the PSK/QAM modulations. However, since these modulations
can have transitions through zero in the I/Q plane, in this case you might notice uncritical spikes. This is due to the fact that the phase of zero (or a complex value close to
zero) is of limited significance, but still influences the result of the instantaneous frequency measurement.
33User Manual 1178.9361.02 ─ 02
Page 34

R&S®FPL1-K70
tMEAS
dt
d
tFREQ
MEAS
2
1
3.2.12 Frequency Relative
Measurements and Result Displays
Result Types in VSA
Remote commands:
LAY:ADD? '1',BEL,MEAS
to define the required source type (see LAYout:ADD[:WINDow]? on page 426)
CALC:FORM FREQ
to define the result type (see CALCulate<n>:FORMat on page 435)
TRAC:DATA? TRACE1
to query the trace results (see TRACe<n>[:DATA]? TRACE<n> and Chapter 11.9.2.1,
"Capture Buffer Results", on page 446/Chapter 11.9.2.2, "Cartesian Diagrams",
on page 446)
The instantaneous frequency of the signal source.
The results are normalized to the symbol rate (PSK and QAM modulated signals), the
estimated FSK deviation (FSK modulated signals) or one quarter of the symbol rate
(MSK modulated signals).
with t=n·TD and TD=the duration of one sampling period at the sample rate defined by
the display points per symbol parameter (see "Display Points/Sym" on page 243).
This measurement is mainly of interest when using the MSK or FSK modulation, but
can also be used for the PSK/QAM modulations. See also the note for Chapter 3.2.11,
"Frequency Absolute", on page 32.
Available for source types:
●
Meas & Ref Signal
Figure 3-9: Result display "Frequency Relative"
34User Manual 1178.9361.02 ─ 02
Page 35

R&S®FPL1-K70
tFREQtFREQtERRFREQ
REFMEAS
_
3.2.13 Frequency Error Absolute
Measurements and Result Displays
Result Types in VSA
Remote commands:
LAY:ADD? '1',BEL,MEAS
to define the required source type (see LAYout:ADD[:WINDow]? on page 426)
CALC:FORM FREQ
to define the result type (see CALCulate<n>:FORMat on page 435)
DISP:TRAC:Y:MODE REL
to define relative values (see DISPlay[:WINDow<n>][:SUBWindow<w>]:
TRACe<t>:Y[:SCALe]:MODE on page 439)
TRAC:DATA? TRACE1
to query the trace results (see TRACe<n>[:DATA]? TRACE<n> and Chapter 11.9.2.2,
"Cartesian Diagrams", on page 446)
Displays the error of the instantaneous frequency in Hz of the measurement signal with
respect to the reference signal as a function of symbols over time.
with t=n·TD and TD=the duration of one sampling period at the sample rate defined by
the display points per symbol parameter (see "Display Points/Sym" on page 243).
Note that this measurement does not consider a possible carrier frequency offset. This
has already been compensated for in the measurement signal.
This measurement is mainly of interest when using the MSK or FSK modulation, but
can also be used for the PSK/QAM modulations. However, since these modulations
can have transitions through zero in the I/Q plane, in this case you might notice uncritical spikes. This is due to the fact that the phase of zero (or a complex value close to
zero) has in fact limited significance, but still influences the result of the current frequency measurement.
35User Manual 1178.9361.02 ─ 02
Page 36

R&S®FPL1-K70
tFREQtFREQtERRFREQ
REFMEAS
_
Measurements and Result Displays
Result Types in VSA
Figure 3-10: Result display "Frequency Error Absolute"
Available for source types:
●
Modulation Errors
Remote commands:
LAY:ADD? '1',BEL,MERR
to define the required source type (see LAYout:ADD[:WINDow]? on page 426)
CALC:FORM FREQ
to define the result type (see CALCulate<n>:FORMat on page 435)
TRAC:DATA? TRACE1
to query the trace results (see TRACe<n>[:DATA]? TRACE<n> and Chapter 11.9.2.2,
"Cartesian Diagrams", on page 446)
3.2.14 Frequency Error Relative
Displays the error of the instantaneous frequency of the measurement signal with
respect to the reference signal as a function of symbols over time.
The results are normalized to the symbol rate (PSK and QAM modulated signals), the
estimated FSK deviation (FSK modulated signals) or one quarter of the symbol rate
(MSK modulated signals).
with t=n·TD and TD=the duration of one sampling period at the sample rate defined by
the display points per symbol parameter (see "Display Points/Sym" on page 243).
36User Manual 1178.9361.02 ─ 02
Page 37

R&S®FPL1-K70
Measurements and Result Displays
Result Types in VSA
This measurement is mainly of interest when using the MSK or FSK modulation, but
can also be used for the PSK/QAM modulations. See also the note for Chapter 3.2.13,
"Frequency Error Absolute", on page 35.
Figure 3-11: Result display "Frequency Error Relative"
Available for source types:
●
Modulation Errors
Remote commands:
LAY:ADD? '1',BEL,MERR
to define the required source type (see LAYout:ADD[:WINDow]? on page 426)
CALC:FORM FREQ
to define the result type (see CALCulate<n>:FORMat on page 435)
DISP:TRAC:Y:MODE REL
to define relative values (see DISPlay[:WINDow<n>][:SUBWindow<w>]:
TRACe<t>:Y[:SCALe]:MODE on page 439)
TRAC:DATA? TRACE1
to query the trace results (see TRACe<n>[:DATA]? TRACE<n> and Chapter 11.9.2.2,
"Cartesian Diagrams", on page 446)
3.2.15 Frequency Response Group Delay
The Frequency Response Group Delay of the equalizer is the derivation of phase over
frequency. It is a measure of phase distortion.
37User Manual 1178.9361.02 ─ 02
Page 38

R&S®FPL1-K70
Available for source types:
●
Equalizer
Remote commands:
Measurements and Result Displays
Result Types in VSA
LAY:ADD? '1',BEL,EQU
to define the required source type (see LAYout:ADD[:WINDow]? on page 426)
CALC:FEED 'XFR:DDEM:RAT'
to define the frequency response result type (see CALCulate<n>:FEED
on page 434)
CALC:FORM GDEL
to define the group delay result type (see CALCulate<n>:FORMat on page 435)
TRAC:DATA? TRACE1
to query the trace results (see TRACe<n>[:DATA]? TRACE<n> and Chapter 11.9.2.6,
"Equalizer", on page 448)
3.2.16 Frequency Response Magnitude
Magnitude of the frequency response of the current equalizer. Note that the frequency
response of the equalizer is not a pure inverted function of the channel response, as
both functions are calculated independently. The frequency response is calculated by
determining an optimal EVM for the input signal.
38User Manual 1178.9361.02 ─ 02
Page 39

R&S®FPL1-K70
Available for source types:
●
Equalizer
Remote commands:
Measurements and Result Displays
Result Types in VSA
LAY:ADD? '1',BEL,EQU
to define the required source type (see LAYout:ADD[:WINDow]? on page 426)
CALC:FEED 'XFR:DDEM:RAT'
to define the frequency response result type (see CALCulate<n>:FEED
on page 434)
CALC:FORM MAGN
to define the magnitude result type (see CALCulate<n>:FORMat on page 435)
TRAC:DATA? TRACE1
to query the trace results (see TRACe<n>[:DATA]? TRACE<n> and Chapter 11.9.2.6,
"Equalizer", on page 448)
3.2.17 Frequency Response Phase
Phase of the frequency response of the current equalizer.
Available for source types:
●
Equalizer
Remote commands:
LAY:ADD? '1',BEL,EQU
to define the required source type (see LAYout:ADD[:WINDow]? on page 426)
CALC:FEED 'XFR:DDEM:RAT'
to define the frequency response result type (see CALCulate<n>:FEED
on page 434)
39User Manual 1178.9361.02 ─ 02
Page 40

R&S®FPL1-K70
3.2.18 Impulse Response Magnitude
Measurements and Result Displays
Result Types in VSA
CALC:FORM UPH
to define the unwrapped phase result type (see CALCulate<n>:FORMat
on page 435)
TRAC:DATA? TRACE1
to query the trace results (see TRACe<n>[:DATA]? TRACE<n> and Chapter 11.9.2.6,
"Equalizer", on page 448)
The Impulse Response Magnitude shows the magnitude of the equalizer filter in the
time domain.
Available for source types:
●
Equalizer
Remote commands:
LAY:ADD? '1',BEL,EQU
to define the required source type (see LAYout:ADD[:WINDow]? on page 426)
CALC:FEED 'XTIM:DDEM:IMP'
to define the impulse response result type (see CALCulate<n>:FEED on page 434)
CALC:FORM MAGN
to define the magnitude result type (see CALCulate<n>:FORMat on page 435)
TRAC:DATA? TRACE1
to query the trace results (see TRACe<n>[:DATA]? TRACE<n> and Chapter 11.9.2.6,
"Equalizer", on page 448)
40User Manual 1178.9361.02 ─ 02
Page 41

R&S®FPL1-K70
3.2.19 Impulse Response Phase
Measurements and Result Displays
Result Types in VSA
The Impulse Response Phase shows the phase of the equalizer coefficients in the time
domain.
Available for source types:
●
Equalizer
Remote commands:
LAY:ADD? '1',BEL,EQU
to define the required source type (see LAYout:ADD[:WINDow]? on page 426)
CALC:FEED 'XTIM:DDEM:IMP'
to define the impulse response result type (see CALCulate<n>:FEED on page 434)
CALC:FORM UPH
to define the phase result type (see CALCulate<n>:FORMat on page 435)
TRAC:DATA? TRACE1
to query the trace results (see TRACe<n>[:DATA]? TRACE<n> and Chapter 11.9.2.6,
"Equalizer", on page 448)
3.2.20 Impulse Response Real/Imag
The Real/Imag diagram of the impulse response is a stem diagram. It displays the filter
characteristics in the time domain for both the I and the Q branches individually. Using
this information the equalizer is uniquely characterized and can be recreated by other
applications.
41User Manual 1178.9361.02 ─ 02
Page 42

R&S®FPL1-K70
tMEAStMag
MEAS
Measurements and Result Displays
Result Types in VSA
Available for source types:
●
Equalizer
Remote commands:
LAY:ADD? '1',BEL,EQU
to define the required source type (see LAYout:ADD[:WINDow]? on page 426)
CALC:FEED 'XTIM:DDEM:IMP'
to define the impulse response result type (see CALCulate<n>:FEED on page 434)
CALC:FORM RIM
to define the real/image result type (see CALCulate<n>:FORMat on page 435)
TRAC:DATA? TRACE1
to query the trace results (see TRACe<n>[:DATA]? TRACE<n> and Chapter 11.9.2.6,
"Equalizer", on page 448)
3.2.21 Magnitude Absolute
Magnitude of the source signal in an individual capture buffer range (max. 256 000
samples).
If more than 256 000 samples are captured, overlapping result ranges with a size of
256 000 samples each are created. Only one range at a time can be displayed in the
Magnitude Absolute result display.
To scroll through the samples in different ranges, use the "Sweep > Select Result Rng"
function or - directly after a sweep - turn the rotary knob. When you scroll in the diagram, the right edge of the current range or the selected result range is displayed in
the center of the next range, if possible.
Note that trace modes that calculate results for several sweeps (Average, MinHold,
MaxHold) are applied to the individual ranges and thus may not provide useful results
in this result display.
For more information on result ranges see Chapter 4.8, "Capture Buffer Display",
on page 142.
In the Magnitude Absolute result display, the actual signal amplitude is displayed:
42User Manual 1178.9361.02 ─ 02
Page 43

R&S®FPL1-K70
Measurements and Result Displays
Result Types in VSA
with t=n·TD and
TD=the duration of one sampling period at the defined sample rate defined by the display points per symbol parameter (see "Display Points/Sym" on page 243)
Available for source types:
●
Capture Buffer
●
Meas & Ref Signal
(Displays the actual signal amplitude for the selected evaluation range)
Figure 3-12: Result display "Magnitude Absolute" for capture buffer data
Remote commands:
LAY:ADD? '1',BEL,CBUF
To define the required source type (see LAYout:ADD[:WINDow]? on page 426)
CALC:FORM MAGN
To define the result type (see CALCulate<n>:FORMat on page 435)
TRAC:DATA? TRACE1
To query the trace results (see TRACe<n>[:DATA]? TRACE<n> and Chap-
ter 11.9.2.1, "Capture Buffer Results", on page 446)
To query the start of the result range:
[SENSe:]DDEMod:SEARch:MBURst:STARt[:SYMBols]? on page 443
[SENSe:]DDEMod:SEARch:MBURst:STARt:SAMPles? on page 443
3.2.22 Magnitude Relative
Magnitude of the source signal; the signal amplitude is scaled to the ideal reference
signal
Available for source types:
●
Meas & Ref Signal
43User Manual 1178.9361.02 ─ 02
Page 44

R&S®FPL1-K70
tMAGtMAGtERRMAG
REFMEAS
_
Measurements and Result Displays
Result Types in VSA
Figure 3-13: Result display "Magnitude Relative"
Remote commands:
LAY:ADD? '1',BEL,MEAS
to define the required source type (see LAYout:ADD[:WINDow]? on page 426)
CALC:FORM MAGN
to define the result type (see CALCulate<n>:FORMat on page 435)
DISP:TRAC:Y:MODE REL
to define relative values (see DISPlay[:WINDow<n>][:SUBWindow<w>]:
TRACe<t>:Y[:SCALe]:MODE on page 439)
TRAC:DATA? TRACE1
to query the trace results (see TRACe<n>[:DATA]? TRACE<n> and Chapter 11.9.2.2,
"Cartesian Diagrams", on page 446)
3.2.23 Magnitude Error
Displays the magnitude error of the measurement signal with respect to the reference
signal (as a function of symbols over time)
with t=n·TD and TD=the duration of one sampling period at the sample rate defined by
the display points per symbol parameter (see "Display Points/Sym" on page 243).
44User Manual 1178.9361.02 ─ 02
Page 45

R&S®FPL1-K70
tPHASEtPHASEtERRPHASE
REFMEAS
_
Measurements and Result Displays
Result Types in VSA
Figure 3-14: Result display "Magnitude Error"
Available for source types:
●
Modulation Errors
Remote commands:
LAY:ADD? '1',BEL,MERR
to define the required source type (see LAYout:ADD[:WINDow]? on page 426)
CALC:FORM MAGN
to define the result type (see CALCulate<n>:FORMat on page 435)
TRAC:DATA? TRACE1
to query the trace results (see TRACe<n>[:DATA]? TRACE<n> and Chapter 11.9.2.2,
"Cartesian Diagrams", on page 446)
3.2.24 Phase Error
Displays the phase error of the measurement signal with respect to the reference signal as a function of symbols over time.
with t=n·TD and TD=the duration of one sampling period at the sample rate defined by
the display points per symbol parameter (see "Display Points/Sym" on page 243).
45User Manual 1178.9361.02 ─ 02
Page 46

R&S®FPL1-K70
tMEAStPhase
MEAS
Measurements and Result Displays
Result Types in VSA
Figure 3-15: Result display "Phase Error"
Available for source types:
●
Modulation Errors
Remote commands:
LAY:ADD? '1',BEL,MERR
to define the required source type (see LAYout:ADD[:WINDow]? on page 426)
CALC:FORM PHAS
to define the result type (see CALCulate<n>:FORMat on page 435)
TRAC:DATA? TRACE1
to query the trace results (see TRACe<n>[:DATA]? TRACE<n> and Chapter 11.9.2.2,
"Cartesian Diagrams", on page 446)
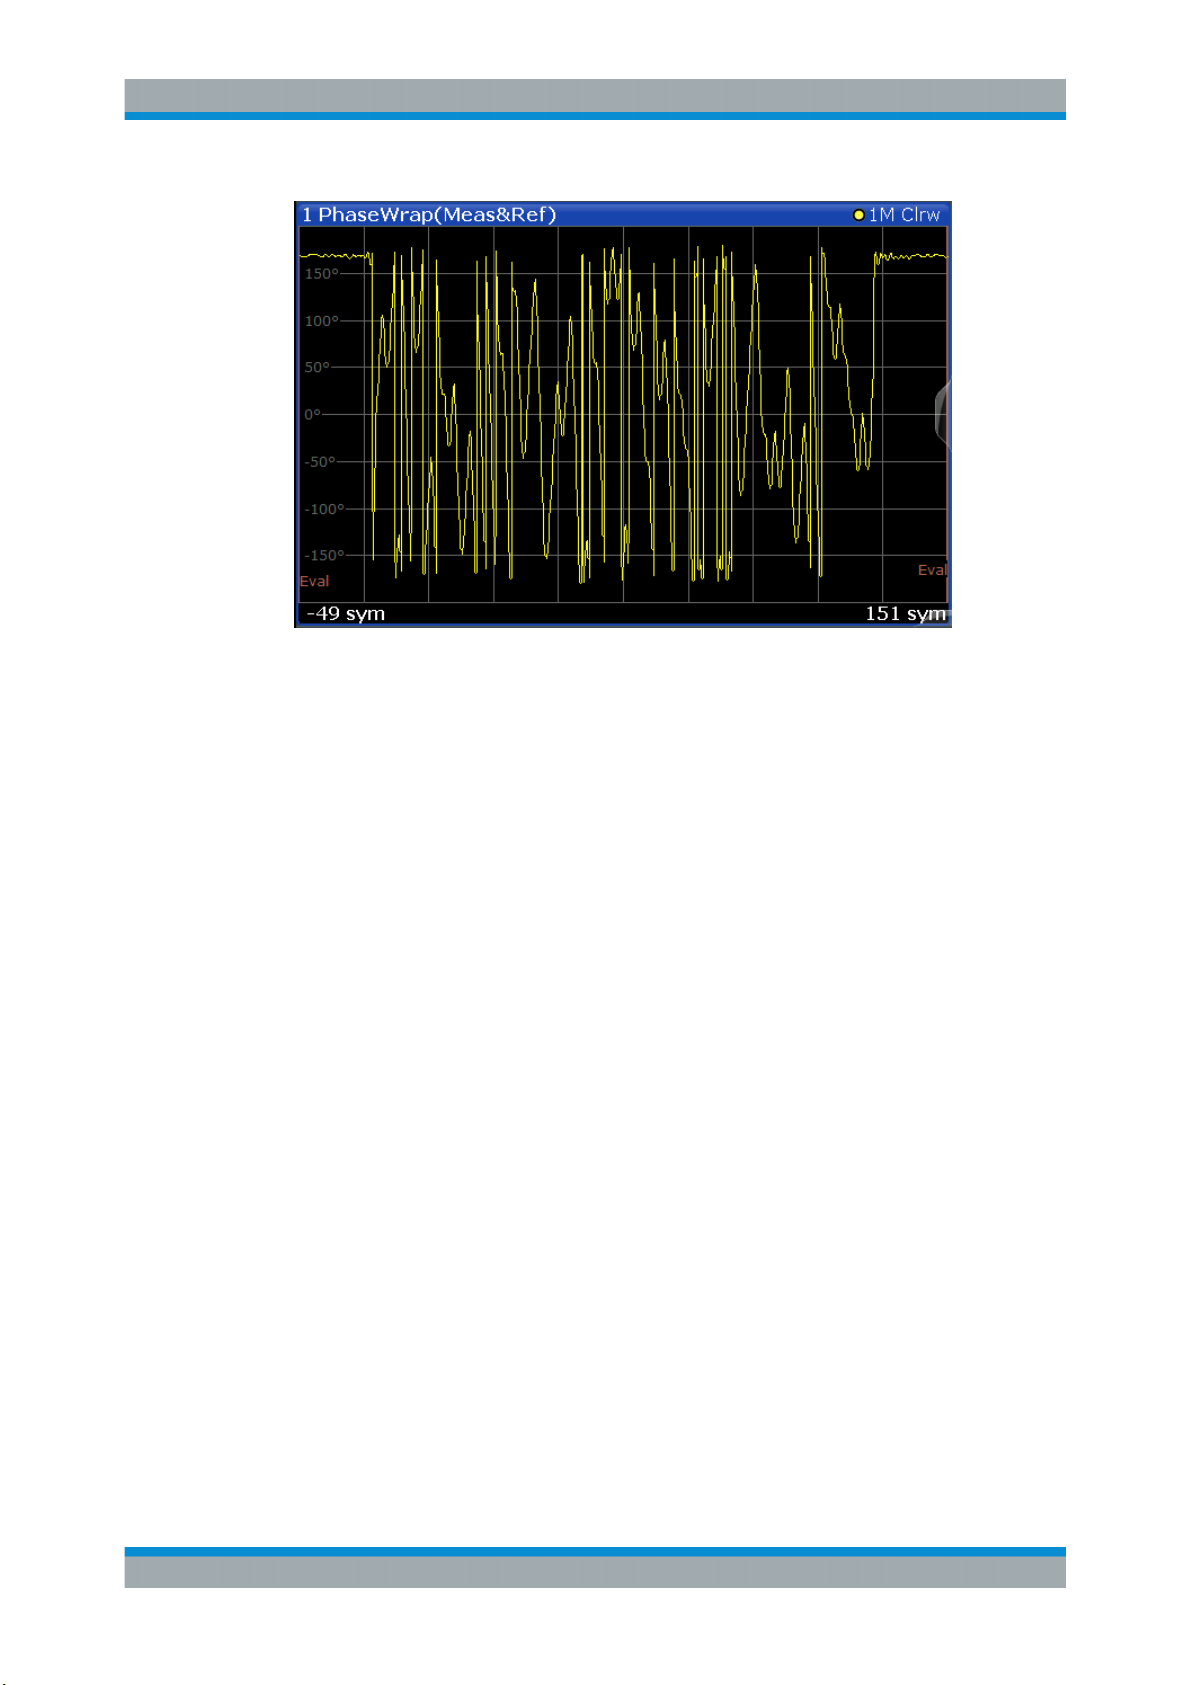
3.2.25 Phase Wrap
The phase or argument of the signal; the display is limited to the phase value range of
[-180°, 180°]
with t=n·TD and TD=the duration of one sampling period at the sample rate defined by
the display points per symbol parameter (see "Display Points/Sym" on page 243).
Available for source types:
●
Meas & Ref Signal
46User Manual 1178.9361.02 ─ 02
Page 47
R&S®FPL1-K70
Measurements and Result Displays
Result Types in VSA
Figure 3-16: Result display "Phase Wrap"
Remote commands:
LAY:ADD? '1',BEL,REF
to define the required source type (see LAYout:ADD[:WINDow]? on page 426)
CALC:FORM PHASe
to define the result type (see CALCulate<n>:FORMat on page 435)
TRAC:DATA? TRACE1
to query the trace results (see TRACe<n>[:DATA]? TRACE<n> and Chapter 11.9.2.2,
"Cartesian Diagrams", on page 446)
3.2.26 Phase Unwrap
The phase of the signal; the display is not limited to [-180°, 180°].
Available for source types:
●
Meas & Ref Signal
47User Manual 1178.9361.02 ─ 02
Page 48

R&S®FPL1-K70
Measurements and Result Displays
Result Types in VSA
Figure 3-17: Result display "Phase Unwrap"
Remote commands:
LAY:ADD? '1',BEL,MEAS
to define the required source type (see LAYout:ADD[:WINDow]? on page 426)
CALC:FORM UPHase
to define the result type (see CALCulate<n>:FORMat on page 435)
TRAC:DATA? TRACE1
to query the trace results (see TRACe<n>[:DATA]? TRACE<n> and Chapter 11.9.2.2,
"Cartesian Diagrams", on page 446)
3.2.27 Real/Imag (I/Q)
Real and imaginary part of the measurement or reference signal in separate measurement diagrams; the x-axis (scaled in time units or symbols) is identical for both diagrams.
Available for source types:
●
Capture Buffer
●
Meas & Ref Signal
●
Error Vector
48User Manual 1178.9361.02 ─ 02
Page 49

R&S®FPL1-K70
Measurements and Result Displays
Result Types in VSA
Figure 3-18: Result display "Real/Imag (I/Q)"
Capture buffer display
Note that this result display is based on an individual capture buffer range. If more than
256 000 samples are captured, overlapping ranges with a size of 256 000 each are
created. Only one range at a time can be displayed in the Real/Imag result display. For
details see Chapter 4.8, "Capture Buffer Display", on page 142.
The scaling of the capture buffer depends on the input source:
●
Scaling is relative to the current reference level for RF input.
●
Scaling is relative to the full scale level for I/Q input.
Remote commands:
LAY:ADD? '1',BEL,MEAS
to define the required source type (see LAYout:ADD[:WINDow]? on page 426)
CALC:FORM RIMag
to define the result type (see CALCulate<n>:FORMat on page 435)
TRAC:DATA? TRACE1
to query the trace results (see TRACe<n>[:DATA]? TRACE<n> and Chapter 11.9.2.2,
"Cartesian Diagrams", on page 446)
3.2.28 Result Summary
The Modulation Accuracy results in a table. For details on the parameters see Chap-
ter 3.4, "Common Parameters in VSA", on page 60.
Basis of evaluation
The majority of the values that are displayed in the Result Summary are calculated
over the "Evaluation Range" (see Chapter 5.10, "Evaluation Range Configuration",
on page 222). They are evaluated according to the setting of the Display Points/Sym
parameter. For example, if "Display Points/Symbol" is "1", only the symbol instants
contribute to the result displayed in the result summary.
49User Manual 1178.9361.02 ─ 02
Page 50

R&S®FPL1-K70
Measurements and Result Displays
Result Types in VSA
Table 3-2: Results calculated over the evaluation range
PSK, MSK, QAM FSK
EVM Frequency Error
MER Magnitude Error
Phase Error Power
Magnitude Error
Rho
Power
The following results that are based on internal estimation algorithms (see Chapter 4.5,
"Signal Model, Estimation and Modulation Errors", on page 119) are calculated over
the "Estimation range" (see also Chapter 4.5.1.2, "Estimation", on page 121).
Table 3-3: Results calculated over the estimation range
PSK, MSK, QAM FSK
Carrier Frequency Error FSK Deviation Error
Symbol Rate Error
I/Q Skew
I/Q Offset FSK Measurement Deviation
I/Q Imbalance Carrier Frequency Error
Gain Imbalance Carrier Frequency Drift
Quadrature Error
Amplitude Droop
Current value
In the "Current" column, the value evaluation for the current evaluation is displayed.
For example, the EVM Peak value in the current sweep corresponds to the peak of the
trace values within the evaluation range for the current sweep (as indicated by marker
1 in Figure 3-19).
50User Manual 1178.9361.02 ─ 02
Page 51

R&S®FPL1-K70
Measurements and Result Displays
Result Types in VSA
Figure 3-19: Example for result summary with current EVM peak value marked
If you want to compare the trace values to the results of the Result Summary, make
sure to match the displayed points per symbol of the trace and of the Result Summary.
Refer to "Display Points/Sym" on page 243 for details.
Mean value
In the "Mean" column, the linear mean of the values that are in the "Current" column is
displayed. Note that if the values are in a logarithmic representation, e.g. the I/Q Offset, the linear values are averaged.
Peak value
In the "Peak" column, the maximum value that occurred during several evaluations is
displayed. Note that when the value can be positive and negative, e.g. the phase error,
the maximum absolute value (maintaining its sign) is displayed. The peak value of Rho
51User Manual 1178.9361.02 ─ 02
Page 52

R&S®FPL1-K70
Measurements and Result Displays
Result Types in VSA
is handled differently, since its minimum value represents the worst case. In that case,
the minimum value is displayed.
Standard Deviation
The value for the standard deviation is calculated on the linear values and then converted to the displayed unit.
95-percentile
The 95-percentile value is based on the distribution of the current values. Since the
phase error and the magnitude error can usually be assumed to be distributed around
zero, the 95-Percentile for these values is calculated based on their absolute values.
Again, the Rho value is handled differently. Here, the 5-Percentile is displayed, since
the lowest Rho value represents the worst case.
Remote commands:
LAY:ADD? '1',BEL, MACC
To define the required source type (see LAYout:ADD[:WINDow]? on page 426)
CALC:FORM RSUM
To define the result type (see CALCulate<n>:FORMat on page 435)
TRAC:DATA? TRACE1
To query the trace results (see TRACe<n>[:DATA] on page 444 and Chap-
ter 11.9.2.5, "Result Summary", on page 447)
CALC:MARK:FUNC:DDEM:STAT:<parameter>
To query individual parameter values (see Chapter 11.9.3, "Retrieving Parameter Val-
ues", on page 448
Result Summary - Individual Results
The Result Summary can display either all or only a single modulation accuracy
parameter. Only the most important parameters can be displayed individually, namely
those for which modulation accuracy limits can be defined (see "Limit Value"
on page 240).
Individual results are selected for display by tapping the Result Summary table header
(only once - a double-tap maximizes the result summary window). A "Table Configuration" dialog box is displayed in which you can select the parameter to be displayed.
Individual results are selected for display by clicking in the Result Summary table
header (only once - a double-click maximizes the result summary window). A "Table
Configuration" dialog box is displayed in which you can select the parameter to be displayed.
52User Manual 1178.9361.02 ─ 02
Page 53

R&S®FPL1-K70
Measurements and Result Displays
Result Types in VSA
By default, all parameters are displayed. If you select a specific parameter, the Result
Summary display is replaced by the individual result display.
Figure 3-20: Result display for individual value in Result Summary
In addition to the current measurement value, the statistical results (see Chap-
ter 3.2.28, "Result Summary", on page 49) and the peak limit value (see "Limit Value"
on page 240) for the selected parameter are displayed.
For details on the displayed results see Chapter 3.4, "Common Parameters in VSA",
on page 60.
Remote command:
DISPlay[:WINDow<n>]:ITEM[:LINE][:VALue] on page 437
3.2.29 Spectrum (Capture Buffer + Error)
This display combines two diagrams in one. The first trace displays the spectrum of the
real/image data in the capture buffer. The second trace displays the spectrum of the
53User Manual 1178.9361.02 ─ 02
Page 54

R&S®FPL1-K70
Measurements and Result Displays
Result Types in VSA
real/image data of the error. Optionally, the data source of the traces can be switched.
Which source is currently displayed for which trace is indicated in the window title bar.
(See also Figure 2-2).
Carrier-in-carrier signals
For carrier-in-carrier measurements, this result display makes both carriers visible. The
following example shows two superimposed QPSK signals: one with a symbol rate of
10 MHz (the analyzed signal, yellow), one with a symbol rate of 3 MHz, whose spectrum becomes visible in the error trace (blue).
Figure 3-21: Example of a carrier-in-carrier signal in a multi source result display.
Similarly, the "Spectrum (Measurement + Error)" result display can be used to reveal
carrier-in-carrier signals.
Remote commands:
LAY:ADD? '1',BEL,MCOM
to define the required source type (see LAYout:ADD[:WINDow]? on page 426)
CALC:FEED 'XTIM:DDEM:TCAP:ERR'
54User Manual 1178.9361.02 ─ 02
Page 55

R&S®FPL1-K70
3.2.30 Spectrum (Measurement + Error)
Measurements and Result Displays
Result Types in VSA
to define the result type (see CALCulate<n>:FEED on page 434)
CALC:TRAC TCAP; CALC:TRAC2:ERR
to define trace1 to be based on the capture buffer data and trace 2 on the error
(default, see CALCulate<n>:TRACe<t>[:VALue] on page 403)
TRAC:DATA? TRACE1
to query the trace results for capture buffer data (see TRACe<n>[:DATA]?
TRACE<n> and Chapter 11.9.2.4, "Symbols", on page 447)
TRAC:DATA? TRACE2
to query the trace results for error data
This display combines two diagrams in one. The first trace displays the spectrum of the
real/image data from the measured signal. The second trace displays the spectrum of
the real/image data of the error. Optionally, the data source of the traces can be
switched. Which source is currently displayed for which trace is indicated in the window
title bar.
(See also Figure 2-2).
Remote commands:
LAY:ADD? '1',BEL,MCOM
to define the required source type (see LAYout:ADD[:WINDow]? on page 426)
CALC:FEED 'XTIM:DDEM:MEAS:ERR'
to define the result type (see CALCulate<n>:FEED on page 434)
CALC:TRAC MEAS; CALC:TRAC2:ERR
55User Manual 1178.9361.02 ─ 02
Page 56

R&S®FPL1-K70
3.2.31 Symbol Table
Measurements and Result Displays
Result Types in VSA
to define trace1 to be based on the measurement data and trace 2 on the error
(default, see CALCulate<n>:TRACe<t>[:VALue] on page 403)
TRAC:DATA? TRACE1
to query the trace results for measurement data (see TRACe<n>[:DATA]?
TRACE<n> and Chapter 11.9.2.4, "Symbols", on page 447)
TRAC:DATA? TRACE2
to query the trace results for error data
Symbol numbers are displayed as a table. Each symbol is represented by an entry in
the table. The symbols can be displayed in binary, octal, hexadecimal or decimal format. Selected symbols (using markers) are highlighted by a blue frame.
Example:
Figure 3-22: Result display for "Symbols" in hexadecimal mode
The evaluation range is indicated by red brackets.
If a pattern search is active, a found pattern is indicated by a green background in the
symbol table. If, during demodulation, individual symbols do not match the pattern after
all, these symbols are indicated by red values.
If known data is loaded as a reference, symbols which do not match this data are also
indicated by a red frame.
56User Manual 1178.9361.02 ─ 02
Page 57

R&S®FPL1-K70
Measurements and Result Displays
Result Types in VSA
Figure 3-23: Symbol errors in the symbol table
Tip: If you assume a signal has a pattern, but do not know it in advance, you can identify it using the symbol table. Measure the signal and check for a pattern in the symbol
table. Then you can copy the symbols from the symbol table to the pattern definition for
subsequent measurements (see "Import Symbols" on page 208).
Remote commands:
To define the required source type (see LAYout:ADD[:WINDow]? on page 426):
LAY:ADD? '1',BEL, 'XTIM:DDEM:SYMB'
To define the symbol format:
CALCulate<n>:FORMat on page 435
To query the results (see TRACe<n>[:DATA] on page 444 and Chapter 11.9.2.4,
"Symbols", on page 447):
Symbols:
TRAC:DATA? TRACe1TRAC:DATA? STR
Symbol errors:
TRAC:DATA? MSTR
Pattern errors:
TRAC:DATA? PSTR
3.2.32 Vector Frequency
The instantaneous frequency of the source signal as an X/Y plot; all available samples
(as defined by the display points per symbol parameter (see "Display Points/Sym"
on page 243)) are drawn and connected.
Available for source types:
●
Meas & Ref Signal
57User Manual 1178.9361.02 ─ 02
Page 58

R&S®FPL1-K70
Measurements and Result Displays
Result Types in VSA
Figure 3-24: Result display for "Vector Frequency"
Remote commands:
LAY:ADD? '1',BEL,MEAS
to define the required source type (see LAYout:ADD[:WINDow]? on page 426)
CALC:FORM COVF
to define the result type (see CALCulate<n>:FORMat on page 435)
TRAC:DATA? TRACE1
to query the trace results (see TRACe<n>[:DATA]? TRACE<n> and Chapter 11.9.2.3,
"Polar Diagrams", on page 446)
3.2.33 Vector I/Q
The complex source signal as an X/Y plot; all available samples (as defined by the display points per symbol parameter, see "Display Points/Sym" on page 243) are drawn
and connected.
The scaling of the capture buffer depends on the input source:
●
Scaling is relative to the current reference level for RF input.
●
Scaling is relative to the full scale level for I/Q input.
Available for source types:
●
Capture Buffer
●
Meas & Ref Signal
●
Error Vector
Capture buffer display
Note that this result display is based on an individual capture buffer range. If more than
256 000 samples are captured, overlapping ranges with a size of 256 000 each are
created. Only one range at a time can be displayed in the Vector I/Q result display. For
details see Chapter 4.8, "Capture Buffer Display", on page 142.
58User Manual 1178.9361.02 ─ 02
Page 59

R&S®FPL1-K70
Measurements and Result Displays
Predefined Display Configuration
Figure 3-25: Result display for "Vector I/Q"
Remote commands:
LAY:ADD? '1',BEL,MEAS
to define the required source type (see LAYout:ADD[:WINDow]? on page 426)
CALC:FORM COMP
to define the result type (see CALCulate<n>:FORMat on page 435)
TRAC:DATA? TRACE1
to query the trace results (see TRACe<n>[:DATA]? TRACE<n> and Chapter 11.9.2.3,
"Polar Diagrams", on page 446)
3.3 Predefined Display Configuration
Access: [MEAS] > "Predefined Display Config"
The R&S FPL1000 VSA application allows you to configure the screen layout very flexibly according to your specific measurement requirements. To get started, some typical
and useful display configurations are predefined. Select the required scenario and the
display is configured suitably.
59User Manual 1178.9361.02 ─ 02
Page 60

R&S®FPL1-K70
Measurements and Result Displays
Common Parameters in VSA
To store your personal typical screen layout, save your current measurement settings
(including the screen layout) as a standard.
See "To store settings as a standard file" on page 252.
Typical
Provides several result displays for the most frequently required results when measuring a known signal using a specific modulation.
Overview
Provides useful result displays to determine the relevant signal characteristics of an
unknown signal.
See also the application sheet R&S®FSW-K70 Analyzing Unknown Signals on the
Rohde & Schwarz Internet site.
Remote command:
[SENSe:]DDEMod:PRESet:CALC on page 433
3.4 Common Parameters in VSA
Depending on the modulation type you are using, different signal parameters are determined during vector signal analysis and displayed in the Result Summary.
Details concerning the calculation of individual parameters can be found in Chap-
ter 4.5, "Signal Model, Estimation and Modulation Errors", on page 119 and Chapter F,
"Formulae", on page 501.
60User Manual 1178.9361.02 ─ 02
Page 61
R&S®FPL1-K70
Measurements and Result Displays
Common Parameters in VSA
Table 3-4: Parameters for PSK, QAM and MSK modulation
Parameter Description SCPI Parameter
EVM - RMS/Peak Error Vector Magnitude, normalized to mean reference
power by default (see "Normalize EVM to" on page 217)
MER - RMS/Peak Modulation Error Ratio (MER) SNR
Phase Error - RMS/
Peak
Magnitude Error RMS/Peak
Carrier Frequency
Error
Symbol Rate Error Difference between the currently measured symbol rate and
I/Q Skew Constant time difference between the I and Q data, for
Rho
The phase difference between the measurement vector and
the reference vector
The average (RMS) and peak magnitude error in %. The
magnitude error is the difference of the measured magnitude
to the magnitude of the reference signal. The magnitude
error is normalized to the mean magnitude of the reference
signal.
The mean carrier frequency offset in Hz CFERror
the defined symbol rate in ppm.
(Only if compensation for SRE is activated, see Chap-
ter 5.8.1, "Demodulation - Compensation and Equalizer",
on page 211)
example due to different cable lengths
(Only if compensation for I/Q skew is activated, see Chap-
ter 5.8.1, "Demodulation - Compensation and Equalizer",
on page 211)
EVM
PERR
MERRor
SRER
IQSK
RHO
I/Q Offset Offset in the original input OOFFset
I/Q Imbalance Not for BPSK. IQIMbalance
Gain Imbalance Not for BPSK. GIMBalance
Quadrature Error Not for BPSK. QERRor
Amplitude Droop The decrease of the signal power over time in the transmitter ADRoop
Power The power of the measured signal MPOWer
Table 3-5: Parameters for FSK modulation only
Parameter Description SCPI parameter
Frequency Error - RMS/
Peak
FSK Deviation Error The deviation error of FSK modulated signals in Hz, i.e.
FSK Meas Deviation The estimated deviation of FSK modulated signals in Hz. FSK:MDEViation
FSK Ref Deviation The reference deviation you have set in Hz. FSK:RDEViation
Carrier Frequency Drift The mean carrier frequency drift in Hz per symbol. FSK:CFDRift
The average (RMS) and peak frequency error in %. The
frequency error is the difference of the measured frequency and the reference frequency. The frequency error
is normalized to the estimated FSK deviation.
the difference of the measured FSK deviation and the
user-defined FSK reference deviation.
FSK:DERRor
FDERror
61User Manual 1178.9361.02 ─ 02
Page 62

R&S®FPL1-K70
Measurements and Result Displays
Common Parameters in VSA
Remote command:
CALCulate<n>:MARKer<m>:FUNCtion:DDEMod:STATistic:<Parameter>?
62User Manual 1178.9361.02 ─ 02
Page 63

R&S®FPL1-K70
4 Measurement Basics
Measurement Basics
Filters and Bandwidths during Signal Processing
Some background knowledge on basic terms and principles used in VSA is provided
here for a better understanding of the required configuration settings.
For information on the basic processing of I/Q data in the R&S FPL1000, see the
R&S FPL1000 I/Q Analyzer User Manual.
● Filters and Bandwidths during Signal Processing...................................................63
● Sample Rate, Symbol Rate and I/Q Bandwidth...................................................... 70
● Symbol Mapping..................................................................................................... 73
● Overview of the Demodulation Process................................................................105
● Signal Model, Estimation and Modulation Errors.................................................. 119
● Measurement Ranges...........................................................................................136
● Display Points Vs Estimation Points Per Symbol..................................................141
● Capture Buffer Display..........................................................................................142
● Known Data Files - Dependencies and Restrictions.............................................142
● Known Data from PRBS Generators.....................................................................144
● Multi-Modulation Analysis (R&S FPL1000-K70M)................................................ 146
4.1 Filters and Bandwidths during Signal Processing
This section describes the used filters in vector signal analysis with an R&S FPL1000,
and the bandwidth after each filter.
The relevant filters for vector signal analysis are shown in Figure 4-1.
Figure 4-1: Block diagram of bandwidth-relevant filters for vector signal analysis
●
After the IF Filter (only for RF input operation): bandwidth = 12.8 MHz or 40 MHz,
depending on the Data Acquisition settings and the installed bandwidth options
●
After the digital hardware section:
The phase and amplitude distortions of the IF filter have been compensated for.
Usually, the I/Q data has a usable bandwidth of about:
63User Manual 1178.9361.02 ─ 02
Page 64

R&S®FPL1-K70
Measurement Basics
Filters and Bandwidths during Signal Processing
0.8 * sample rate
For details, refer to Chapter 4.1.1, "I/Q Bandwidth", on page 64.
The I/Q data sample rate and bandwidth are automatically adjusted to the set symbol rate. For most modulated signals, even the smallest allowed value for the sample rate leads to a sufficient I/Q data bandwidth. The whole spectrum of the input
signal is captured, but most adjacent channels and interferers are effectively suppressed. Only for very wide signals (FSK, no TX-filter used) it can be necessary to
try higher values for the sample rate (see Chapter 4.2, "Sample Rate, Symbol Rate
and I/Q Bandwidth", on page 70), increasing the I/Q bandwidth. The I/Q data
delivered to the DSP section has no considerable amplitude or phase distortion
and a suitable bandwidth.
The "Signal Capture" dialog box ("Data Acquisition" tab) shows the sample rate and
the usable I/Q bandwidth achieved for the current settings (see "Usable I/Q Bandwidth"
on page 193).
●
After the optional measurement filter:
Various measurement filters which have different bandwidths can filter the measurement signal and the reference signal.
The filters described above are the ones that directly affect the bandwidth of the captured I/Q data and the final measurement signal and reference signal. Note, however,
that several other filters are also involved in the DSP section but are not mentioned
above:
●
Receive filter to prevent ISI (intersymbol-interference)
●
Filters necessary for various estimators
●
Others
4.1.1 I/Q Bandwidth
The bandwidth of the I/Q data used as input for the vector signal analysis is filtered as
described in Chapter 4.1, "Filters and Bandwidths during Signal Processing",
on page 63. Its flat, usable bandwidth (no considerable amplitude or phase distortion)
depends on:
●
The used sample rate, which depends on:
– The defined "Symbol Rate" (see "Symbol Rate" on page 162)
– The defined "Sample Rate" parameter (see "Sample Rate" on page 193
●
The type of input used (digital baseband input, RF input, etc.)
For details on the maximum usable bandwidth, see Chapter 4.2, "Sample Rate, Sym-
bol Rate and I/Q Bandwidth", on page 70.
The sample rate and the usable I/Q bandwidth achieved for the current settings is displayed in the "Signal Capture" dialog, see Chapter 5.5.1, "Data Acquisition",
on page 192.
64User Manual 1178.9361.02 ─ 02
Page 65

R&S®FPL1-K70
4.1.2 Demodulation Bandwidth (Measurement Bandwidth)
4.1.3 Modulation and Demodulation Filters
Measurement Basics
Filters and Bandwidths during Signal Processing
Some modulation systems do not use a receive filter. In these cases, take special care
that no interference or adjacent channels occur within the demodulation bandwidth. Set
the "Sample rate" parameter to a low value (see "Sample Rate" on page 193).
Typical communication systems demand special receive or measurement filters (e.g.
root-raised cosine receive filter or EDGE measurement filter).
If no such filtering is performed, make sure neither interfering signals nor adjacent
channels fall within the demodulation bandwidth.
For demodulation, the analyzer requires sample points at which only information of the
current symbol and none of neighboring symbols is present (symbol points). These
points are also called ISI-free points (ISI = intersymbol interference). If the transmitter
does not provide an ISI-free signal after the transmit filter (TX filter), the analyzer can
filter the input signal using a receive filter or Rx filter. If the transmitter uses an RRC
(root-raised cosine) filter, the analyzer must also use an RRC filter to obtain ISI-free
points.
In many PSK systems, RRC filters are used as transmit, receive and measurement filters. To determine the I/Q modulation error, the measurement signal must be compared with the corresponding ideal signal. Therefore, the analyzer calculates a refer-
ence filter by convolving the coefficient of the transmit filter (Tx filter) and the meas
filter (see Figure 4-2).
When measuring unfiltered signals (e.g. to determine nonlinear signal distortions), no
measurement filter is switched into the signal path and the reference filter is identical
to the transmit filter (see Figure 4-2).
In the baseband block diagrams (see Figure 4-2), the system-theoretical transmitter
and analyzer filters are shown for PSK and QAM demodulation. For the sake of clearness, RF stages, IF filters and the filter stages of the digital hardware section are not
shown.
For a correct demodulation, the following filters have to be accurately specified for the
analyzer:
●
Transmit filter: filter characteristic of transmitter
●
Meas filter:
– PSK, QAM, UserQAM, MSK:
The I and the Q part of the measurement and the reference signal are filtered
with this filter.
– FSK:
The instantaneous frequency of the measurement reference signal is filtered.
In many applications, the measurement filter is identical to the receive filter.
65User Manual 1178.9361.02 ─ 02
Page 66

R&S®FPL1-K70
Measurement Basics
Filters and Bandwidths during Signal Processing
The receive filter (also referred to as an ISI filter) is configured internally depending on
the transmit filter. The goal is to produce intersymbol-interference-free points for the
demodulation.
The reference filter generates the ideal transmitted signal (after meas filtering). The
analyzer calculates the reference filter from the above filters (convolution operation
transmit filter * meas filter).
Typical combinations of Tx and Meas filters are shown in Table C-3; they can be set in
the R&S FPL1000 VSA application using "Meas filter = AUTO" (see "Using the Trans-
mit Filter as a Measurement Filter (Auto)" on page 221). For some filters, a roll-off fac-
tor is required:
Filter type Required parameters
RC (raised cosine) Alpha
RRC (root-raised
cosine)
Gaussian BT
Alpha
Typically the Alpha/BT value of the measurement filter is the same as the value of the
transmission filter.
4.1.4 Measurement Filters
The measurement filter can be used to filter the following two signals in the same way:
●
The measurement signal (after coarse frequency, phase and timing synchronization have been achieved)
●
The reference signal, i.e the I/Q symbols that have been determined in the demodulator and have already been filtered with the Transmit filter;
For FSK, the measurement filter filters the instantaneous frequency of the signal, not
the I/Q signal.
For MSK, PSK, QAM and User QAM the measurement filter filters the real part and
imaginary part of these signals (i.e. not the instantaneous frequency or magnitude of
the signal).
The R&S FPL1000 VSA application defines the error signal as the difference between
the reference signal and the measurement signal. Thus, the measurement filter also
shapes the spectrum of the error signal, which is used to calculate the EVM, for example.
In many applications, the measurement filter is the same as the RX filter. However,
unlike the measurement filter, the RX filter is not relevant for the measurement, but is
only required to create the reference signal optimally.
If possible, the RX filter and the transmit filter are chosen such that their combination
results in an Inter-Symbol Interference (ISI) free system (see Figure 4-2 and Fig-
ure 4-3).
66User Manual 1178.9361.02 ─ 02
Page 67

R&S®FPL1-K70
Measurement Basics
Filters and Bandwidths during Signal Processing
Figure 4-2: Measurement filter in the block diagram (MSK, PSK, QAM and UserQAM)
Figure 4-3: Modulator with Transmit filter in detail
As the measurement filters of the R&S FPL1000 VSA application have low-pass characteristics, they suppress high frequency distortion components in the Meas/Ref/Error
signal. The errors are weighted spectrally. Thus, turning off the measurement filter can
have an influence on the numeric and graphical error values. However, to measure
non-linear distortions, which usually produce high frequency components, switch off
the measurement filter.
67User Manual 1178.9361.02 ─ 02
Page 68

R&S®FPL1-K70
4.1.5 Customized Filters
Measurement Basics
Filters and Bandwidths during Signal Processing
Predefined measurement filters
The most frequently required measurement filters are provided by the R&S FPL1000
VSA application (see Chapter C.2, "Measurement Filters", on page 495).
The frequency response of the available standard-specific measurement filters is
shown in Chapter F.6.2, "Measurement Filter", on page 508.
The analytical filter types RC (raised cosine), RRC (root-raised cosine), GAUSSIAN,
and the most important standard-specific filters, are already integrated in the R&S
FPL1000 VSA application. In addition, it is possible to use user-defined measurement
and transmit filters. Customized filters are useful for the following purposes:
●
Developing new networks and modulation methods for which no filters are defined
yet
●
Measuring transmitter characteristics with slightly modified (e.g. shortened) transmitter filters
An external program ("FILTWIZ") is offered to convert user-defined filters. This program
generates filter files (*.vaf) which can be transferred to the analyzer with a USB
device, for example. The program can be downloaded together with a detailed description as a precompiled MATLAB® file (MATLAB pcode) on the Internet, at http://
www.rohde-schwarz.com (search term "FILTWIZ").
68User Manual 1178.9361.02 ─ 02
Page 69

R&S®FPL1-K70
Measurement Basics
Filters and Bandwidths during Signal Processing
Figure 4-4: FILTWIZ - filter tool for VSA
It is possible to load customized transmit filters and customized measurement filters. If
you select a customized transmit filter, the internal receive filter coefficients are calculated automatically right away.
Unlike the R&S FPL1000 VSA application, the R&S FSQ-K70 required you to transfer
a user-defined receive filter, as well.
If you upload a customized transmit filter and leave the measurement filter set to "automatic", the internally calculated receive filter is used as a measurement filter. Note that
this filter is not necessarily suitable for your specific signal. The filter is optimized such
that the intersymbol interference is low. Hence, you probably see a clear eye diagram
and a Vector I/Q diagram with a recognizable constellation. However, a filter that has
low intersymbol interference can lead to noise enhancement, which is commonly undesirable for a measurement filter.
To avoid noise enhancement, it is recommended that you do one of the following:
●
Design your own measurement filter and upload it as a user filter.
●
Select a suitable measurement filter from the list.
69User Manual 1178.9361.02 ─ 02
Page 70

R&S®FPL1-K70
4.2 Sample Rate, Symbol Rate and I/Q Bandwidth
Measurement Basics
Sample Rate, Symbol Rate and I/Q Bandwidth
Transferring filter files to the R&S FPL1000
You can transfer the (.vaf) filter files to the R&S FPL1000 using a USB memory
device.
The "Symbol Rate" defined in the "Signal Description" settings determines how many
symbols are captured and demodulated during a certain measurement time. However,
for each symbol more than one sample can be captured, so that the sample rate can
be higher than the symbol rate.
The "Sample Rate" parameter in the "Signal Capture" settings defines the number of
samples to capture per symbol. (Do not confuse this number with the estimation
points per symbol or display points per symbol, see Chapter 4.7, "Display Points Vs
Estimation Points Per Symbol", on page 141). The resulting sample rate (depending
on the "Symbol Rate") is indicated behind the parameter.
The number of samples to capture per symbol is commonly referred to as the "Cap-
ture Oversampling" value in Rohde & Schwarz signal and spectrum analyzers.
The resulting sample rate, also referred to as the user or output sample rate, is the rate
at which the I/Q data is demodulated and analyzed. The sample rate also affects the
demodulation (measurement) bandwidth. If the bandwidth is too narrow, the signal is
not displayed completely. If the bandwidth is too wide, interference from outside the
actual signal to be measured can distort the result. Thus, for signals with a large frequency spectrum (e.g. FSK modulated signals), a higher sample rate can be necessary.
(For further details, see Chapter 4.1, "Filters and Bandwidths during Signal Process-
ing", on page 63.)
For an indication of the required sample rate, view the "Real/Imag (I/Q)" display of the
capture buffer with a "Spectrum" transformation. If the complete signal is displayed
within the usable I/Q bandwidth, the selected value is suitable.
70User Manual 1178.9361.02 ─ 02
Page 71

R&S®FPL1-K70
Measurement Basics
Sample Rate, Symbol Rate and I/Q Bandwidth
Figure 4-5: Determining the I/Q bandwidth: Real/Imag (I/Q) display of the capture buffer with a spec-
If the signal is cut off
trum transformation
, increase the sample rate.
If the signal is too small, decrease the sample rate by changing one of the following
settings:
●
The "Symbol Rate" defined in the "Signal Description" settings
●
The "Sample Rate" in the "Data Acquisition" settings
As described above, the sample rate defines the number of samples to capture per
symbol. Thus, the maximum sample rate depends on the maximum number of symbols
to be captured (the symbol rate) and vice versa.
The maximum sample rate for the R&S FPL1000 is 100 MHz (see below). Thus, the
maximum symbol rate is:
Table 4-1: Maximum symbol rate depending on sample rate parameter
Sample rate parameter Max. symbol rate
2* symbol rate 50 Msymbols
4* symbol rate 25 Msymbols
8* symbol rate 12.5 Msymbols
16* symbol rate 6.25 Msymbols
32* symbol rate 3.125 Msymbols
64* symbol rate 1.5625 Msymbols
128* symbol rate 781.25 ksymbols
4.2.1 Sample Rate and Maximum Usable I/Q Bandwidth for RF Input
Definitions
●
Input sample rate (ISR): the sample rate of the useful data provided by the device
connected to the input of the R&S FPL1000
71User Manual 1178.9361.02 ─ 02
Page 72

R&S®FPL1-K70
Measurement Basics
Sample Rate, Symbol Rate and I/Q Bandwidth
●
(User, Output) Sample rate (SR): the user-defined sample rate (e.g. in the "Data
Acquisition" dialog box in the "I/Q Analyzer" application) which is used as the basis
for analysis or output
●
Usable I/Q (Analysis) bandwidth: the bandwidth range in which the signal
remains undistorted in regard to amplitude characteristic and group delay; this
range can be used for accurate analysis by the R&S FPL1000
●
Record length: Number of I/Q samples to capture during the specified measurement time; calculated as the measurement time multiplied by the sample rate
For the I/Q data acquisition, digital decimation filters are used internally in the
R&S FPL1000. The passband of these digital filters determines the maximum usable
I/Q bandwidth. In consequence, signals within the usable I/Q bandwidth (passband)
remain unchanged, while signals outside the usable I/Q bandwidth (passband) are
suppressed. Usually, the suppressed signals are noise, artifacts, and the second IF
side band. If frequencies of interest to you are also suppressed, try to increase the output sample rate, which increases the maximum usable I/Q bandwidth.
Bandwidth extension options
You can extend the maximum usable I/Q bandwidth provided by the R&S FPL1000 in
the basic installation by adding options. These options can either be included in the initial installation (B-options) or updated later (U-options). The maximum bandwidth provided by the individual option is indicated by its number, for example, B40 extends the
bandwidth to 40 MHz.
As a rule, the usable I/Q bandwidth is proportional to the output sample rate. Yet, when
the I/Q bandwidth reaches the bandwidth of the analog IF filter (at very high output
sample rates), the curve breaks.
● Relationship Between Sample Rate, Record Length and Usable I/Q Bandwidth... 72
4.2.1.1 Relationship Between Sample Rate, Record Length and Usable I/Q Bandwidth
Up to the maximum bandwidth, the following rule applies:
Usable I/Q bandwidth = 0.8 * Output sample rate
Regarding the record length, the following rule applies:
Record length = Measurement time * sample rate
The Figure 4-6 shows the maximum usable I/Q bandwidths depending on the output
sample rates.
72User Manual 1178.9361.02 ─ 02
Page 73

R&S®FPL1-K70
Measurement Basics
Symbol Mapping
Usable I/Q
bandwidth
[MHz]
40
35
30
25
20
15
12.8
10
5
Figure 4-6: Relationship between maximum usable I/Q bandwidth and output sample rate
RF-Input:
BW = 0.80 *
f
out
16
2010
30 40 50 60 70 80 90 100
With 40 MHz
bandwidth
ext. option
bandwidth
Output sample
rate f
Without
extension
[MHz]
out
4.3 Symbol Mapping
Mapping or symbol mapping means that symbol numbers are assigned to constellation
points or transitions in the I/Q plane (e.g. PSK and QAM).
In the analyzer, the mapping is required to decode the transmitted symbols from the
sampled I/Q or frequency/time data records.
The mappings for all standards used in the analyzer and for all employed modulation
modes are described in the following. Unless indicated otherwise, symbol numbers are
specified in hexadecimal form (MSB at the left).
● Phase Shift Keying (PSK)....................................................................................... 73
● Rotating PSK...........................................................................................................77
● Differential PSK.......................................................................................................79
● Rotating Differential PSK Modulation......................................................................81
● Offset QPSK............................................................................................................82
● Shaped Offset QPSK.............................................................................................. 84
● Frequency Shift Keying (FSK).................................................................................85
● Minimum Shift Keying (MSK).................................................................................. 90
● Quadrature Amplitude Modulation (QAM)...............................................................91
● ASK.......................................................................................................................102
● APSK.....................................................................................................................103
● User-defined Modulation.......................................................................................104
4.3.1 Phase Shift Keying (PSK)
With this type of modulation, the information is represented by the absolute phase
position of the received signal at the decision points. All transitions in the I/Q diagram
are possible. The complex constellation diagram is shown. The symbol numbers are
entered in the diagram according to the mapping rule.
73User Manual 1178.9361.02 ─ 02
Page 74

R&S®FPL1-K70
Measurement Basics
Symbol Mapping
BPSK (NATURAL, SMx)
0 1
Figure 4-7: Constellation diagram for BPSK including the symbol mapping
BPSK (NATURAL) is the BPSK mapping used by supported R&S SMx signal generators when using PRBS algorithms. See "Symbol mapping in accordance with the PRBS
generator" on page 146.
QPSK
2
3
Figure 4-8: Constellation diagram for QPSK including the symbol mapping for CDMA2000 FWD and
DVB S2
0
1
74User Manual 1178.9361.02 ─ 02
Page 75

R&S®FPL1-K70
Measurement Basics
Symbol Mapping
1
3
2
Figure 4-9: Constellation diagram for QPSK (GRAY) including the symbol mapping
2 3
0
0 1
Figure 4-10: Constellation diagram for QPSK (NATURAL, SMx) including the symbol mapping
QPSK (NATURAL) is the QPSK mapping used by supported R&S SMx signal generators when using PRBS algorithms. See "Symbol mapping in accordance with the PRBS
generator" on page 146.
75User Manual 1178.9361.02 ─ 02
Page 76

R&S®FPL1-K70
Measurement Basics
Symbol Mapping
1
3
2
Figure 4-11: Constellation diagram for QPSK including the symbol mapping for WCDMA
0
8PSK
3
1 2
6
7
0
4
5
Figure 4-12: Constellation diagram for 8PSK (GRAY) including the symbol mapping
2
3
4
5
6
Figure 4-13: Constellation diagram for 8PSK (NATURAL, SMx) including the symbol mapping
1
0
7
76User Manual 1178.9361.02 ─ 02
Page 77

R&S®FPL1-K70
Measurement Basics
Symbol Mapping
8PSK (NATURAL) is the 8PSK mapping used by supported R&S SMx signal generators when using PRBS algorithms. See "Symbol mapping in accordance with the PRBS
generator" on page 146.
4
6
3
Figure 4-14: Constellation diagram for 8PSK including the symbol mapping for DVB S2
4.3.2 Rotating PSK
A rotating PSK modulation is basically a PSK modulation in which additional phase
shifts occur. These phase shifts depend on the symbol number, e.g. for a π/4-QPSK,
the third symbol has an additional phase offset of (3-1)*π/4. This offset has the same
effect as a rotation of the basic system of coordinates by the offset angle after each
symbol.
The method is highly important in practical applications because it prevents signal transitions through the zeros in the I/Q plane. This reduces the dynamic range of the
modulated signal and the linearity requirements for the amplifier.
0
1 2
5
7
In practice, the method is used for 3π/8-8PSK, for example, and (in conjunction with
phase-differential coding) for π/4-DQPSK.
Symbol mapping
The logical constellation diagram for 3π/8-8PSK comprises 8 points that correspond to
the modulation level (see Figure 4-15). A counter-clockwise offset (rotation) of 3π/8 is
inserted after each symbol transition.
77User Manual 1178.9361.02 ─ 02
Page 78

R&S®FPL1-K70
Measurement Basics
Symbol Mapping
2
0
1
5 6
4
Figure 4-15: Constellation diagram for 3π/8 8PSK before rotation including the symbol mapping for
EDGE
3
7
Figure 4-16: I/Q symbol stream after 3π/8 rotation in I/Q plane if the symbol number "7" is transmitted
Figure 4-17: Constellation diagram for 3π/4 QPSK including the symbol mapping for EDGE
six times in a row
2
3
0
1
78User Manual 1178.9361.02 ─ 02
Page 79

R&S®FPL1-K70
Measurement Basics
Symbol Mapping
1
2
0
3
Figure 4-18: Constellation diagram for π/4 QPSK (Natural) including the symbol mapping
0 1
Figure 4-19: Constellation diagram for π/2 BPSK and -π/2 BPSK including the symbol mapping
4.3.3 Differential PSK
With differential PSK, the information is represented in the phase shift between two
consecutive decision points. The absolute position of the complex sample value at the
decision point does not carry information.
In the physical constellation diagram, the constellation points at the symbol decision
points obtained after ISI-free demodulation are shown (as with common PSK methods). This diagram corresponds to the display on the analyzer. The position of the constellation points is standard-specific. For example, some QPSK standards define the
constellation points on the diagonals, while other standards define the coordinate axes.
In Table 4-2, the symbols are assigned to phase shifts. The QPSK (INMARSAT) map-
ping corresponds to simple QPSK with phase-differential coding.
Tables Table 4-3 and Table 4-4 show two types of differential 8PSK modulation.
Differential coding according to VDL is shown in Table 4-5. It can be used for modula-
tion types with 3 bits/symbol, e.g. 8PSK.
79User Manual 1178.9361.02 ─ 02
Page 80

R&S®FPL1-K70
Measurement Basics
Symbol Mapping
Other types of modulation using differential coding method are described in Chap-
ter 4.3.4, "Rotating Differential PSK Modulation", on page 81.
Figure 4-20: Constellation diagram for DQPSK (INMARSAT and NATURAL) including the symbol map-
Table 4-2: DQPSK (INMARSAT)
Logical symbol mapping
Modulation symbol (binary indication: MSB, LSB) 00 01 10 11
Phase shift 0° -90° +90° 180°
Figure 4-21: Constellation diagram for D8PSK including the symbol mapping for APCO25, APCO25
ping
Phase 2, GRAY, NATURAL and TETRA
Table 4-3: D8PSK (NATURAL)
Logical symbol mapping
Modulation symbol (binary indication: MSB, LSB)
Phase shift 0° 45° 90° 135° 180° 225° 270° 315°
000 001 010 011 100 101 110 111
80User Manual 1178.9361.02 ─ 02
Page 81

R&S®FPL1-K70
Measurement Basics
Symbol Mapping
Table 4-4: D8PSK (GRAY)
Logical symbol mapping
Modulation symbol (binary indication: MSB, LSB)
Phase shift 0° 45° 135° 90° 270° 315° 225° 180°
Table 4-5: D8PSK (VDL)
Logical symbol mapping
Modulation symbol (binary indication: MSB, LSB)
Phase shift 0° 45° 135° 90° 315° 270° 180° 225°
000 001 010 011 100 101 110 111
000 001 010 011 100 101 110 111
4.3.4 Rotating Differential PSK Modulation
Phase-differential modulation is frequently combined with an additional phase shift
(e.g. π/4 DQPSK = π/4 phase shift modulation + differential modulated 4PSK).
The logical mapping diagram corresponds to the diagram for DPSK.
The physical constellation diagram shows the symbol decision points obtained after
ISI-free demodulation.
Figure 4-22: Constellation diagram for
2, NADC, NATURAL, PDC, PHS, TETRA and TFTS; the π/4 rotation is already compensated for
Table 4-6: π/4 DQPSK (NADC, PDC, PHS, TETRA)
Logical symbol mapping
Modulation symbol (binary indication: MSB, LSB) 00 01 10 11
Phase shift 0°+45° 90°+45° -90°+45° -180°+45°
π
/4 DQPSK including the symbol mapping for APCO25 Phase
81User Manual 1178.9361.02 ─ 02
Page 82

R&S®FPL1-K70
Measurement Basics
Symbol Mapping
Table 4-7: π/4 DQPSK (TFTS)
Logical symbol mapping
Modulation symbol (binary indication: MSB, LSB) 00 01 10 11
Phase shift -180°+45° 90°+45° -90°+45° 0°+45°
Table 4-8: π/4 DQPSK (Natural)
Logical symbol mapping
Modulation symbol (binary indication: MSB, LSB) 00 01 10 11
Phase shift 0°+45° 90°+45° -180°+45° -90°+45°
Table 4-9: π/4 DQPSK (APCO25 and APCO25Phase2)
Logical symbol mapping
Modulation symbol (binary indication: MSB, LSB) 00 01 10 11
Phase shift 0°+45° 90°+45° -90°+45° -180°+45°
Table 4-10: π/2 DBPSK
Logical symbol mapping
Modulation symbol (binary indication: MSB, LSB) 0 1
Phase shift 0°+90° -180°+90°
4.3.5 Offset QPSK
Offset QPSK differs from "normal" QPSK in the fact that the Q component is delayed
by half a symbol period against the I component in the time domain. Hence, the symbol
time instants of the I and the Q component do not coincide. The concept of Offset
QPSK is illustrated in the diagrams below.
82User Manual 1178.9361.02 ─ 02
Page 83

R&S®FPL1-K70
Measurement Basics
Symbol Mapping
Derivation of OQPSK
Table 4-11: I/Q diagram and constellation diagram
QPSK OQPSK (delayed Q component)
2
1
0
Inphase
-1
-2
0 1 2 3 4 5 6 7 8 9
2
1
re
0
Quadratu
-1
-2
0 1 2 3 4 5 6 7 8 9
Time
[symbols]
1
0
1
0
2
1
e
0
Inphas
-1
-2
0 1 2 3 4 5 6 7 8 9
2
1
e
0
Quadratur
-1
-2
0 1 2 3 4 5 6 7 8 9
Time
[symbols]
PSK vector diagram with alpha = 0.35 OQPSK vector diagram with alpha = 0.35
2
1
0
Quadrature
-1
2
1
0
Quadrature
-1
1
0
1
0
-2
-2 -1 0 1 2
Inphase
-2
-2 -1 0 1 2
Inphase
Offset QPSK reduces the dynamic range of the modulated signal (compared to "normal" QPSK) and, therefore, the demands on amplifier linearity by avoiding zero crossings.
A distinction is made in the analyzer display:
In the Vector I/Q result display of the measurement (or reference) signal, the time delay
is not compensated for. The display corresponds to the physical diagram shown in
(Table 4-11)
In the Constellation I/Q result display of the measurement (or reference) signal, the
time delay is compensated for. The display corresponds to the logical mapping as in
Figure 4-23.
83User Manual 1178.9361.02 ─ 02
Page 84

R&S®FPL1-K70
Measurement Basics
Symbol Mapping
OQPSK
2
3
Figure 4-23: Constellation diagram for OQPSK (GRAY) including the symbol mapping
0
1
0 1
2 3
Figure 4-24: Constellation diagram for OQPSK (NATURAL, SMx) including the symbol mapping
OQPSK (NATURAL) is the OQPSK mapping used by supported R&S SMx signal generators when using PRBS algorithms. See "Symbol mapping in accordance with the
PRBS generator" on page 146.
4.3.6 Shaped Offset QPSK
Shaped Offset QPSK is a constant envelope modulation whose phase at any instant in
time is either stationary or is moving at a rate of one-quarter of the bit rate. It can therefore also be interpreted as a ternary CPM.
84User Manual 1178.9361.02 ─ 02
Page 85

R&S®FPL1-K70
Measurement Basics
Symbol Mapping
2
3
Figure 4-25: Constellation diagram for Shaped Offset QPSK including the symbol mapping
0
1
4.3.7 Frequency Shift Keying (FSK)
To illustrate symbol mappings for FSK modulations, the symbol numbers are marked in
the logical mapping diagram versus the instantaneous frequency. An instantaneous
frequency of zero in the baseband corresponds to the input frequency of the analyzer.
2FSK (NATURAL)
With 2FSK, the symbol decision is made by a simple frequency discriminator:
Symbol
Numbers
1
Figure 4-26: Constellation diagram for 2FSK (NATURAL, SMx) including the logical symbol mapping
1
-1
0
2FSK (NATURAL) is the 2FSK mapping used by supported R&S SMx signal generators when using PRBS algorithms. See "Symbol mapping in accordance with the PRBS
generator" on page 146.
4FSK
With 4FSK, the symbol decision is made by a frequency discriminator with 3 decision
thresholds (-2/3; 0; +2/3) normalized to the FSK reference deviation.
85User Manual 1178.9361.02 ─ 02
Page 86

R&S®FPL1-K70
Measurement Basics
Symbol Mapping
13
Symbol
Numbers
1/3
2
-1/3
1
-10
Figure 4-27: Constellation diagram for 4FSK (NATURAL, SMx) including the logical symbol mapping
4FSK (NATURAL) is the 4FSK mapping used by supported R&S SMx signal generators when using PRBS algorithms. See "Symbol mapping in accordance with the PRBS
generator" on page 146.
12
Symbol
Numbers
1/3
3
-1/3
1
-10
Figure 4-28: Constellation diagram for 4FSK (GRAY) including the logical symbol mapping
86User Manual 1178.9361.02 ─ 02
Page 87

R&S®FPL1-K70
Symbol
Numbers
Measurement Basics
Symbol Mapping
11
1/3
0
-1/3
2
-13
Figure 4-29: Constellation diagram for 4FSK for APCO C4FM and APCO Phase 2 including the logical
symbol mapping
8FSK (NATURAL)
17
5/7
6
3/7
Symbol
Numbers
Figure 4-30: Constellation diagram for 8FSK (NATURAL) including the logical symbol mapping
5
1/74
-1/73
-3/7
2
-5/7
1
-10
87User Manual 1178.9361.02 ─ 02
Page 88

R&S®FPL1-K70
Measurement Basics
Symbol Mapping
16 FSK
Figure 4-31: Constellation diagram for 16FSK including the logical symbol mapping
88User Manual 1178.9361.02 ─ 02
Page 89

R&S®FPL1-K70
Measurement Basics
Symbol Mapping
32FSK
Figure 4-32: Constellation diagram for 32FSK including the logical symbol mapping
89User Manual 1178.9361.02 ─ 02
Page 90

R&S®FPL1-K70
Measurement Basics
Symbol Mapping
64FSK
Figure 4-33: Constellation diagram for 64FSK including the logical symbol mapping
4.3.8 Minimum Shift Keying (MSK)
MSK modulation causes modulation-dependent phase shifts of +/- 90° which can be
shown in a Constellation I/Q diagram. As with PSK, the phase positions are evaluated
during demodulation.
Table 4-12: MSK (NATURAL)
Logical symbol mapping
Modulation symbol (binary indication: MSB, LSB) 0 1
Phase shift -90° +90°
Table 4-13: MSK (GSM)
Logical symbol mapping
Modulation symbol (binary indication: MSB, LSB) 0 1
Phase shift +90° -90°
90User Manual 1178.9361.02 ─ 02
Page 91

R&S®FPL1-K70
Measurement Basics
Symbol Mapping
Figure 4-34: MSK (for GSM and NATURAL) and DMSK Constellation Diagram including the symbol
mapping
Similar to PSK, differential coding can also be used with MSK. In this case, too, the
information is represented by the transition of two consecutive symbols. The block diagram of the coder is shown below.
Figure 4-35: DMSK: differential encoder in the transmitter
d
input symbol {0;1} of differential encoder
i
d
input symbol delayed by the symbol period Ts
i-1
'
d
output symbol {0;1} of differential encoder
i
The logical symbol mapping is then performed on the XOR-coded bitstream d'.
4.3.9 Quadrature Amplitude Modulation (QAM)
With QAM, the information is represented by the signal amplitude and phase.
The symbols are arranged in a square constellation in the I/Q plane.
To ensure reliable demodulation, symbol numbers should be distributed evenly across
the symbol alphabet.
As a rule of thumb, the result length should correspond to at least 8 times the modulation order. For example, with 64 QAM, a result length of at least 8*64 = 512 symbols
should be used.
91User Manual 1178.9361.02 ─ 02
Page 92

R&S®FPL1-K70
Measurement Basics
Symbol Mapping
QAM Mappings
The following QAM mappings are obtained from the mapping of the first quadrant. The
subsequent quadrants are always rotated by π/2 and supplemented by a (GRAYcoded) prefix for each quadrant.
Table 4-14: Derivation of QAM mappings
In the following diagrams, the symbol mappings are indicated in hexadecimal and
binary form.
0 1 2 3
4 5 6 7
C D E F
8 9 A B
Figure 4-36: Constellation diagram for 16QAM (GRAY) including the logical symbol mapping (hexa-
decimal and binary)
0000 0001 0010 0011
0100 0101 0110 0111
1100 1101 1110 1111
1000 1001 1010 1011
92User Manual 1178.9361.02 ─ 02
Page 93

R&S®FPL1-K70
Measurement Basics
Symbol Mapping
B
A
E
F
Figure 4-37: Constellation diagram for 16QAM including the logical symbol mapping for EDGE (hexa-
B
A
9
8
C
D
decimal and binary)
9
8
1
0
4
5
2 3
0 1
3
2
6
7
1011
1010
1110
1111
1011
1010
1001
1000
1100
1101
1001
1000
0001
0000
0100
0101
0010 0011
0000 0001
0011
0010
0110
0111
C D
E F
Figure 4-38: Constellation diagram for 16QAM including the logical symbol mapping for DVB-C (hex-
adecimal and binary)
4
5
6
7
1100 1101
1110 1111
0100
0101
0110
0111
16QAM DVB-C is the 16QAM mapping used by supported R&S SMx signal generators
when using PRBS algorithms. See "Symbol mapping in accordance with the PRBS
generator" on page 146.
93User Manual 1178.9361.02 ─ 02
Page 94

R&S®FPL1-K70
17
13
06
02
10111
10011
Measurement Basics
Symbol Mapping
00010
00110
16
1B
1F
15
14
1A
04 05
11 12
00 01
10
08
18 19
09 0A
1C 1D
0B
1E
0C
0D
0F
07
03
0E
10110
11011
11111
10101
10100
11010
00100 00101
10001 10010
00000 00001
10000
01000
11000 11001
01001 01010
11100 11101
01011
11110
01100
01101
01111
00111
00011
01110
Figure 4-39: Constellation diagram for 32QAM including the logical symbol mapping for DVB-C (hex-
adecimal and binary)
32QAM DVB-C is the 32QAM mapping used by supported R&S
SMx signal generators
when using PRBS algorithms. See "Symbol mapping in accordance with the PRBS
generator" on page 146.
2C
2D
2E
2F
26
27
24
25
08 09
0A 0B
0C 0D
0E 0F
001000 001001
001100 001101
29
2B
28
2A
34 35
36 37
3E 3F
3C 3D
23
22
21
20
30 31
32 33
3A 3B
38 39
02 03
00 01
10
12
11
13
15
17
14
16
1A
1B
1F
1E
06 07
04 05
18
19
1D
1C
001010 001011
000010 000011
000000 000001
001110 001111
000110 000111
000100 000101
Figure 4-40: Constellation diagram for 64QAM including the logical symbol mapping for DVB-C (hex-
adecimal and binary); the binary form shows the upper right section of the diagram
only.
64QAM DVB-C is the 64QAM mapping used by supported R&S SMx signal generators
when using PRBS algorithms. See "Symbol mapping in accordance with the PRBS
generator" on page 146.
94User Manual 1178.9361.02 ─ 02
Page 95

R&S®FPL1-K70
Measurement Basics
Symbol Mapping
Figure 4-41: Constellation diagram for 64QAM including the logical symbol mapping for DOCSIS 3.0,
North American Cable Downstream according to ITU-T J.83-B (hexadecimal)
0011010 0011011
0011000 0011001
0010000 0010001
0010010 0010011
0000010 0000011
0000000 0000001
0001010 0001011
0001000 0001001
0010100 0010101
0010110 0010111
0000110 0000111
0000100 0000101
0011100 0011101
0011110 0011111
0001110 0001111
0001100 0001101
1A 1B
18 19
10 11
12 13
02 03
00 01
0A 0B
08 09
14 15
16 17
06 07
04 05
1C 1D
1E 1F
0E 0F
0C 0D
Figure 4-42: Constellation diagram for 128QAM (GRAY, SMx) including the logical symbol mapping
(hexadecimal and binary); the figure shows the upper right sections of the diagram
only
95User Manual 1178.9361.02 ─ 02
Page 96

R&S®FPL1-K70
Measurement Basics
Symbol Mapping
128QAM GRAY is the 128QAM mapping used by supported R&S SMx signal generators when using PRBS algorithms. See "Symbol mapping in accordance with the PRBS
generator" on page 146.
20 21
22 23
2A 2B
28 29
08 09
0A 0B
02 03
00
01
24 25
26 27
2E 2F
2C 2D
0C 0D
0E 0F
06 07
04 05
34 35
36 37
3E 3F
3C 3D
1C 1D
1E 1F
16 17
14 15
30 31
32 33
3A 3B
38 39
18 19
1A 1B
12 13
10 11
Figure 4-43: Constellation diagram for 256QAM (GRAY, SMx) including the logical symbol mapping
(hexadecimal); the figure shows the upper right section of the diagram only
256QAM GRAY is the 256QAM mapping used by supported R&S SMx signal generators when using PRBS algorithms. See "Symbol mapping in accordance with the PRBS
generator" on page 146.
96User Manual 1178.9361.02 ─ 02
Page 97

R&S®FPL1-K70
Measurement Basics
Symbol Mapping
Figure 4-44: Constellation diagram for 256QAM DOCSIS 3.0, North American Cable Downstream
according to ITU-T J.83-B, including the logical symbol mapping (hexadecimal)
Figure 4-45: Constellation diagram for 512QAM (NATURAL, SMx), including the logical symbol map-
ping (hexadecimal); the figure shows the upper right section of the diagram only
97User Manual 1178.9361.02 ─ 02
Page 98

R&S®FPL1-K70
Measurement Basics
Symbol Mapping
Figure 4-46: Constellation diagram for 1024QAM including the logical symbol mapping (hexadeci-
mal); the figure shows the upper right section of the diagram only
98User Manual 1178.9361.02 ─ 02
Page 99

R&S®FPL1-K70
Measurement Basics
Symbol Mapping
Figure 4-47: Constellation diagram for 1024QAM (GRAY, SMx) including the logical symbol mapping
(hexadecimal); the figure shows the upper right section of the diagram only
1024QAM GRAY is the 1024QAM mapping used by supported R&S SMx signal generators when using PRBS algorithms. See "Symbol mapping in accordance with the
PRBS generator" on page 146.
99User Manual 1178.9361.02 ─ 02
Page 100

R&S®FPL1-K70
Measurement Basics
Symbol Mapping
Figure 4-48: Constellation diagram for 2048QAM (NATURAL, SMx) including the logical symbol map-
ping (hexadecimal); the figure shows the upper right section of the diagram only
100User Manual 1178.9361.02 ─ 02
 Loading...