

Page 1
R&S®EVSF1000
VHF/UHF Nav/Flight Analyzer
User Manual
(;ÜÎ:2)
1178641002
User Manual
Version 06
Page 2

This document describes the following R&S EVSF1000 models with the firmware version 1.30 and later:
●
R&S EVSF1000 (1330.0008.02)
Furthermore, it covers the following options:
●
R&S EVSF1-B4 Slide-in option (1330.1404.02)
●
R&S EVSF1-Z1 Tray (1330.1410.02)
●
R&S EVSF1-Z2 Test adapter (1330.1427.02)
●
R&S EVSG-K1 ILS CRS/CLR Analysis (1329.9005.02)
●
R&S EVSG-K2 VOR Analysis (1329.9011.02)
●
R&S EVSG-K3 MB Analysis (1329.9028.02)
●
R&S EVSG-K4 GBAS Analysis (1329.9034.02)
●
R&S EVSG-K5 SCAT-I Analysis (1329.9040.02)
●
R&S EVSG-K6 COM Analysis (1329.9057.02)
●
R&S EVSG-K10 RF Spectrum Analysis (1329.9063.02)
●
R&S EVSG-K11 AF Spectrum Analysis (1329.9070.02)
●
R&S EVSG1-K25 I/Q Data Streaming (1329.9157.02)
© 2019 Rohde & Schwarz GmbH & Co. KG
Mühldorfstr. 15, 81671 München, Germany
Phone: +49 89 41 29 - 0
Fax: +49 89 41 29 12 164
Email: info@rohde-schwarz.com
Internet: www.rohde-schwarz.com
Subject to change – Data without tolerance limits is not binding.
R&S® is a registered trademark of Rohde & Schwarz GmbH & Co. KG.
Trade names are trademarks of the owners.
1178.6410.02 | Version 06 | R&S®EVSF1000
Throughout this manual, products from Rohde & Schwarz are indicated without the ® symbol , e.g. R&S®EVSF1000 is indicated as
R&S EVSF1000.
Page 3

R&S®EVSF1000
1 For Your Safety.......................................................................................5
2 Documentation Overview......................................................................6
3 Getting Started....................................................................................... 8
4 Measurements and Results.................................................................30
5 Configuring the Input Signal and Measurement Mode.....................33
6 Numeric Measurement Modes............................................................ 35
7 Graphic Measurement Modes.............................................................94
8 GBAS/SCAT-I Mode (Options R&S EVSG-K4/-K5)...........................114
Contents
Contents
9 Using Markers in the Graphical Displays........................................ 157
10 Data Management.............................................................................. 159
11 Common Instrument Settings...........................................................169
12 Remote Commands........................................................................... 184
Annex.................................................................................................. 302
A ILS Channel Frequency List..............................................................302
B VOR Channel Frequency List............................................................304
C References..........................................................................................306
D Format Description of GBAS and SCAT-I Data................................307
E Contacting Customer Support..........................................................313
List of Commands..............................................................................314
Index....................................................................................................324
3User Manual 1178.6410.02 ─ 06
Page 4

R&S®EVSF1000
Contents
4User Manual 1178.6410.02 ─ 06
Page 5

R&S®EVSF1000
1 For Your Safety
For Your Safety
Intended use
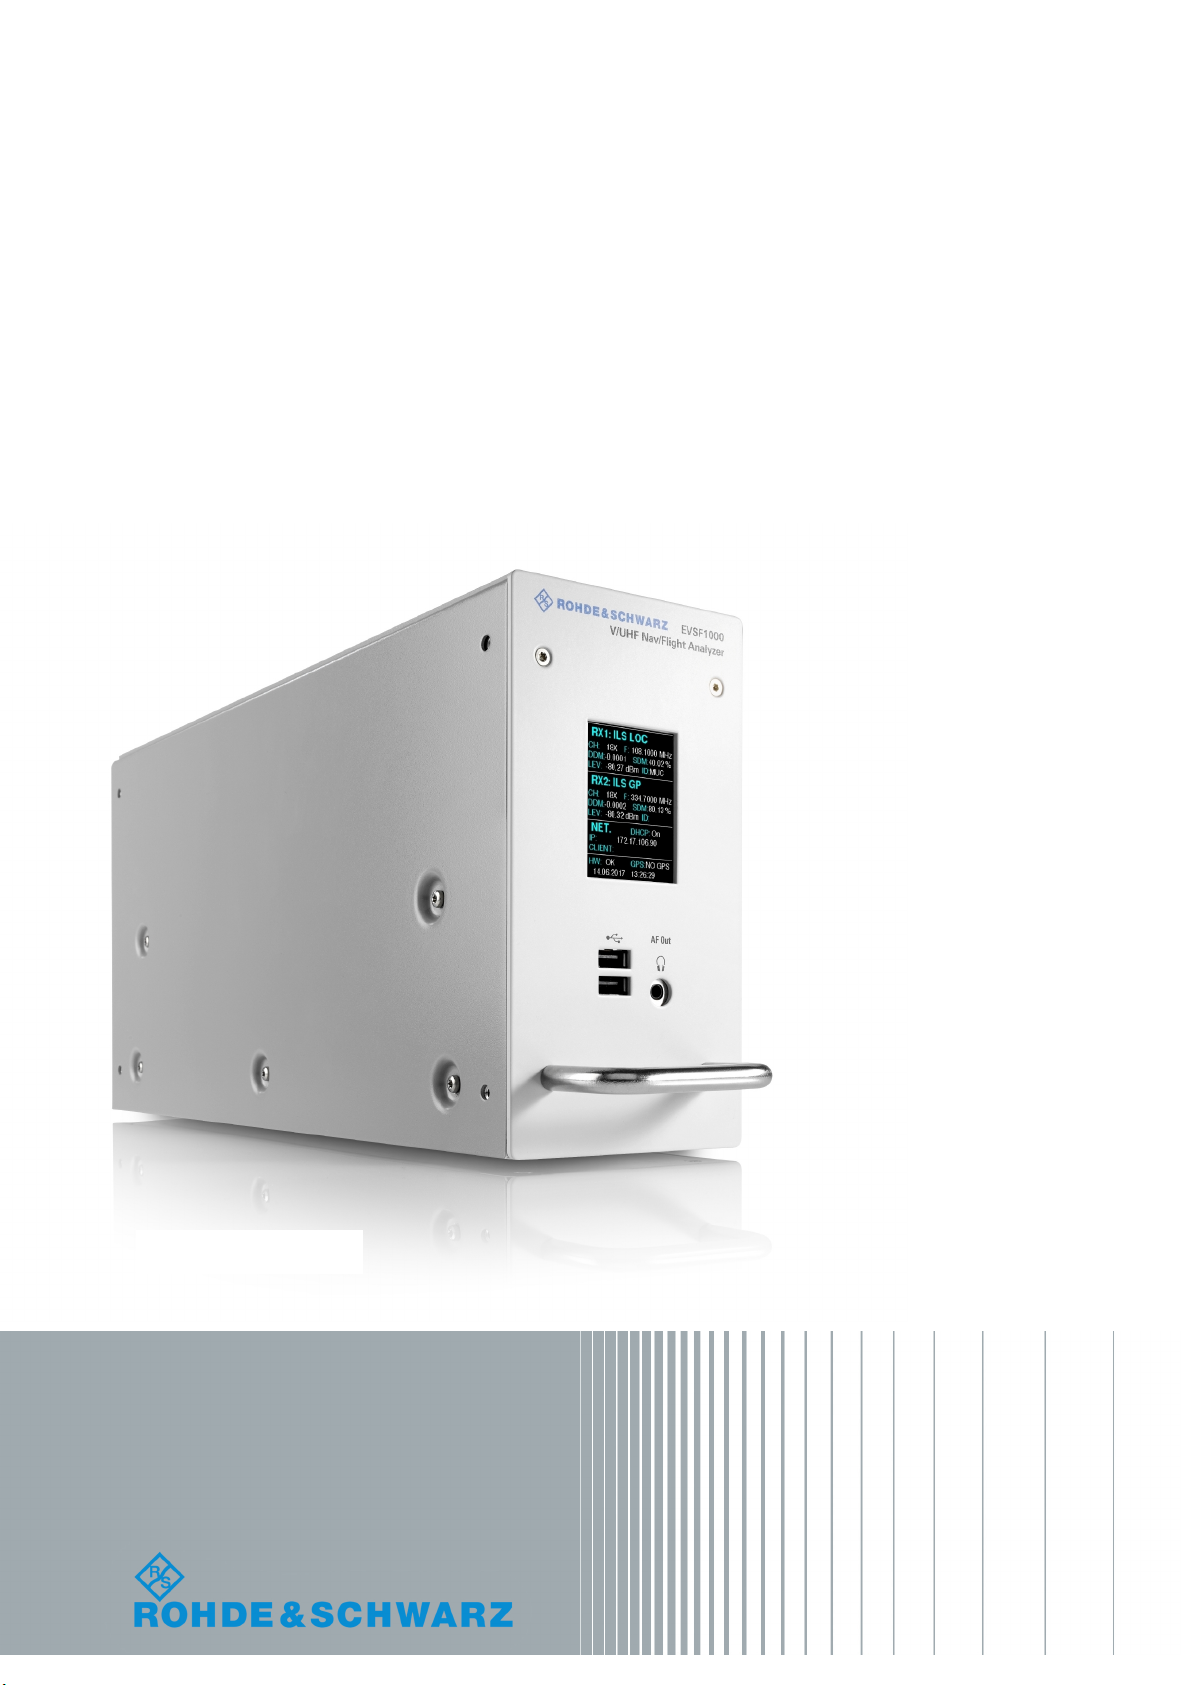
The R&S EVSF1000 is a level and modulation analyzer for installation in flight inspection aircraft. It performs measurements on ILS, VOR and marker beacon ground stations during startup, maintenance and servicing and analyzes ATC COM signals. The
instrument’s mechanical and electrical design and high sensitivity make it ideal for
state-of-the-art flight inspection. In addition, the R&S EVSF1000 performs specialized,
drone-based measurements on terrestrial navigation systems.
The product documentation helps you to use the R&S EVSF1000 safely and efficiently.
Follow the instructions provided here and in the "Basic Safety Instructions" brochure.
Keep the product documentation nearby and offer it to other users.
Where do I find safety information?
Safety information is part of the product documentation. It warns you about the potential dangers and gives instructions how to prevent personal injuries or damage caused
by dangerous situations. Safety information is provided as follows:
●
The printed "Basic Safety Instructions" brochure provides safety information in
many languages and is delivered with the R&S EVSF1000.
●
Throughout the documentation, safety instructions are provided when you need to
take care during setup or operation.
5User Manual 1178.6410.02 ─ 06
Page 6

R&S®EVSF1000
2 Documentation Overview
2.1 Getting Started Manual
2.2 User Manuals and Help
Documentation Overview
Data Sheets and Brochures
This section provides an overview of the R&S EVSF1000 user documentation. You find
it on the product page at:
www.rohde-schwarz.com/manual/EVSF1000
Introduces the R&S EVSF1000 and describes how to set up and start working with the
product. A printed version is delivered with the instrument.
Contains the description of all instrument modes and functions. It also provides an
introduction to remote control, a complete description of the remote control commands
with programming examples, and information on maintenance, instrument interfaces
and error messages. Includes the contents of the getting started manual.
The contents of the user manual are also available as online help on the
R&S EVSF1000.
2.3 Basic Safety Instructions
Contains safety instructions, operating conditions and further important information.
The printed document is delivered with the instrument.
2.4 Data Sheets and Brochures
The data sheet contains the technical specifications of the R&S EVSF1000. It also lists
the firmware applications and their order numbers, and optional accessories.
The brochure provides an overview of the instrument and deals with the specific characteristics.
See www.rohde-schwarz.com/brochure-datasheet/evsf/
6User Manual 1178.6410.02 ─ 06
Page 7

R&S®EVSF1000
2.5 Release Notes and Open Source Acknowledgment
Documentation Overview
Release Notes and Open Source Acknowledgment (OSA)
(OSA)
The release notes list new features, improvements and known issues of the current
firmware version, and describe the firmware installation.
The open source acknowledgment document provides verbatim license texts of the
used open source software.
See www.rohde-schwarz.com/software/EVSF1000.
7User Manual 1178.6410.02 ─ 06
Page 8
R&S®EVSF1000
3 Getting Started
3.1 Key Features
Getting Started
Preparing for Use
The R&S EVSF1000 offers the following key features:
●
Detailed analysis of ILS, VOR and Marker Beacon ground measurements (based
on ICAO Doc. 8071 and ICAO Annex 10)
●
Analysis of air traffic control (ATC) communications signals
●
High measurement rate, at 100 data records/s
●
Two identical signal processing units for parallel measurement of Localizer and Glidepath
●
Compact, robust design (ARINC 404)
●
Simple remote operation via standard interfaces
●
Software options for specific use cases
●
Integrated data recording
3.2 Preparing for Use
Risk of injury due to disregarding safety information
Observe the information on appropriate operating conditions provided in the data sheet
to prevent personal injury or damage to the instrument. Read and observe the basic
safety instructions provided with the instrument, in addition to the safety instructions in
the following sections. In particular:
●
Do not open the instrument casing.
Risk of injury due to falling instrument
Be careful when mounting or unmounting the instrument in a rack. If you do not mount
it correctly, as described in the documentation, the instrument can fall down and injure
you.
8User Manual 1178.6410.02 ─ 06
Page 9
R&S®EVSF1000
3.2.1 Unpacking and Checking the R&S EVSF1000
Getting Started
Preparing for Use
Risk of instrument damage due to inappropriate operating conditions
Specific operating conditions are required to ensure accurate measurements and to
avoid damage to the instrument. Observe the information on appropriate operating
conditions provided in the basic safety instructions and the instrument's data sheet.
Check the equipment for completeness using the delivery note and the accessory lists
for the various items. Check the instrument for any damage. If there is damage, immediately contact the carrier who delivered the instrument. Make sure not to discard the
box and packing material.
Packing material
Retain the original packing material. If the instrument needs to be transported or shipped later, you can use the material to protect the control elements and connectors.
Risk of instrument damage during transportation and shipment
Insufficient protection against mechanical and electrostatic effects during transportation
and shipment can damage the instrument.
●
Always make sure that sufficient mechanical and electrostatic protection is provided.
●
When shipping an instrument, use the original packaging. If it is not available, allow
for sufficient padding to prevent the instrument from moving around inside the box.
Pack the instrument in antistatic wrap to protect it from electrostatic charging.
●
Secure the instrument to prevent any movement and other mechanical effects during transportation.
Accessory list
The instrument comes with the following accessories:
●
AC/DC power supply with cable
●
XLR connection cable
●
Printed Getting Started manual
3.2.2 Setting Up the Instrument
The R&S EVSF1000 can be operated in a variety of places without detrimental effects
on its features. Even the movement caused by transportation or mobile use does not
impair its functioning.
9User Manual 1178.6410.02 ─ 06
Page 10
R&S®EVSF1000
3.2.2.1 Connecting the R&S EVSF1000 to the Board Power
Getting Started
Preparing for Use
Risk of instrument damage due to environmental conditions
The R&S EVSF1000 is designed to provide a protected environment for the measurement setup. However, observe the allowed environmental conditions concerning temperature, humidity and mechanical stress described in the R&S EVSF1000 data sheet
and the general safety instructions to avoid damage to the devices.
Ensure that the airflow perforations are unimpeded.
If your R&S EVSF1000 comes with the optional tray for rack installation, start with
Chapter 3.2.2.3, "Installing the R&S EVSF1000 in a Rack", on page 10.
The R&S EVSF1000 is connected to the board power (11 V DC to 32 V DC) of the
flight inspection plane or the drone.
The R&S EVSF1000 is inline with DO-160G, Section 16, Category A. (200 ms DC
power interruption without reboot of R&S EVSF1000 for a minimum of 20 V DC input.)
Risk of electric shock
Insufficient insulation and exceeding the current limitation of external power supplies
for safety extra-low DC voltage (SELV) can lead to electric shock.
Be sure to meet the requirements for reinforced/double insulation in accordance with
DIN/EN/IEC 61010 (UL 3111, CSA C22.2 No. 1010.1) or DIN/EN/IEC 60950 (UL 1950,
CSA C22.2 No. 950). Provide current limitation in accordance with DIN EN 61010-1
Appendix F2.1.
3.2.2.2 Connecting Devices for Signal Input and Output
1. Connect the RF input connector (RX 1 IN/RX 2 IN) with the receiving antenna (see
Chapter 3.3.2.4, "RX 1 In / RX 2 In", on page 18).
2. Connect any other required connectors for input or output, such as GPS or PPS
signals (see Chapter 3.3.1, "Front Panel", on page 14 and Chapter 3.3.2, "Rear
Panel", on page 16).
3.2.2.3 Installing the R&S EVSF1000 in a Rack
The R&S EVSF1000 is meant for use in a flight inspection plane or a drone. For a stable setup, you can connect the R&S EVSF1000 to an optional installation tray that you
insert in the flight inspection rack.
10User Manual 1178.6410.02 ─ 06
Page 11
R&S®EVSF1000
Getting Started
Preparing for Use
Using the connector plate, you can remove and replace the R&S EVSF1000 quickly
and easily. While the tray remains connected to the aircraft permanently, you can
remove the R&S EVSF1000 quickly and easily, without having to disconnect all cables
from the instrument individually.
This setup requires an R&S EVSF1000 with the following options:
●
Slide-in hardware (R&S EVSF1-B4)
●
Installation tray with connector (R&S EVSF1-Z1)
The 60 mm perforations allow you to mount external fans to the tray.
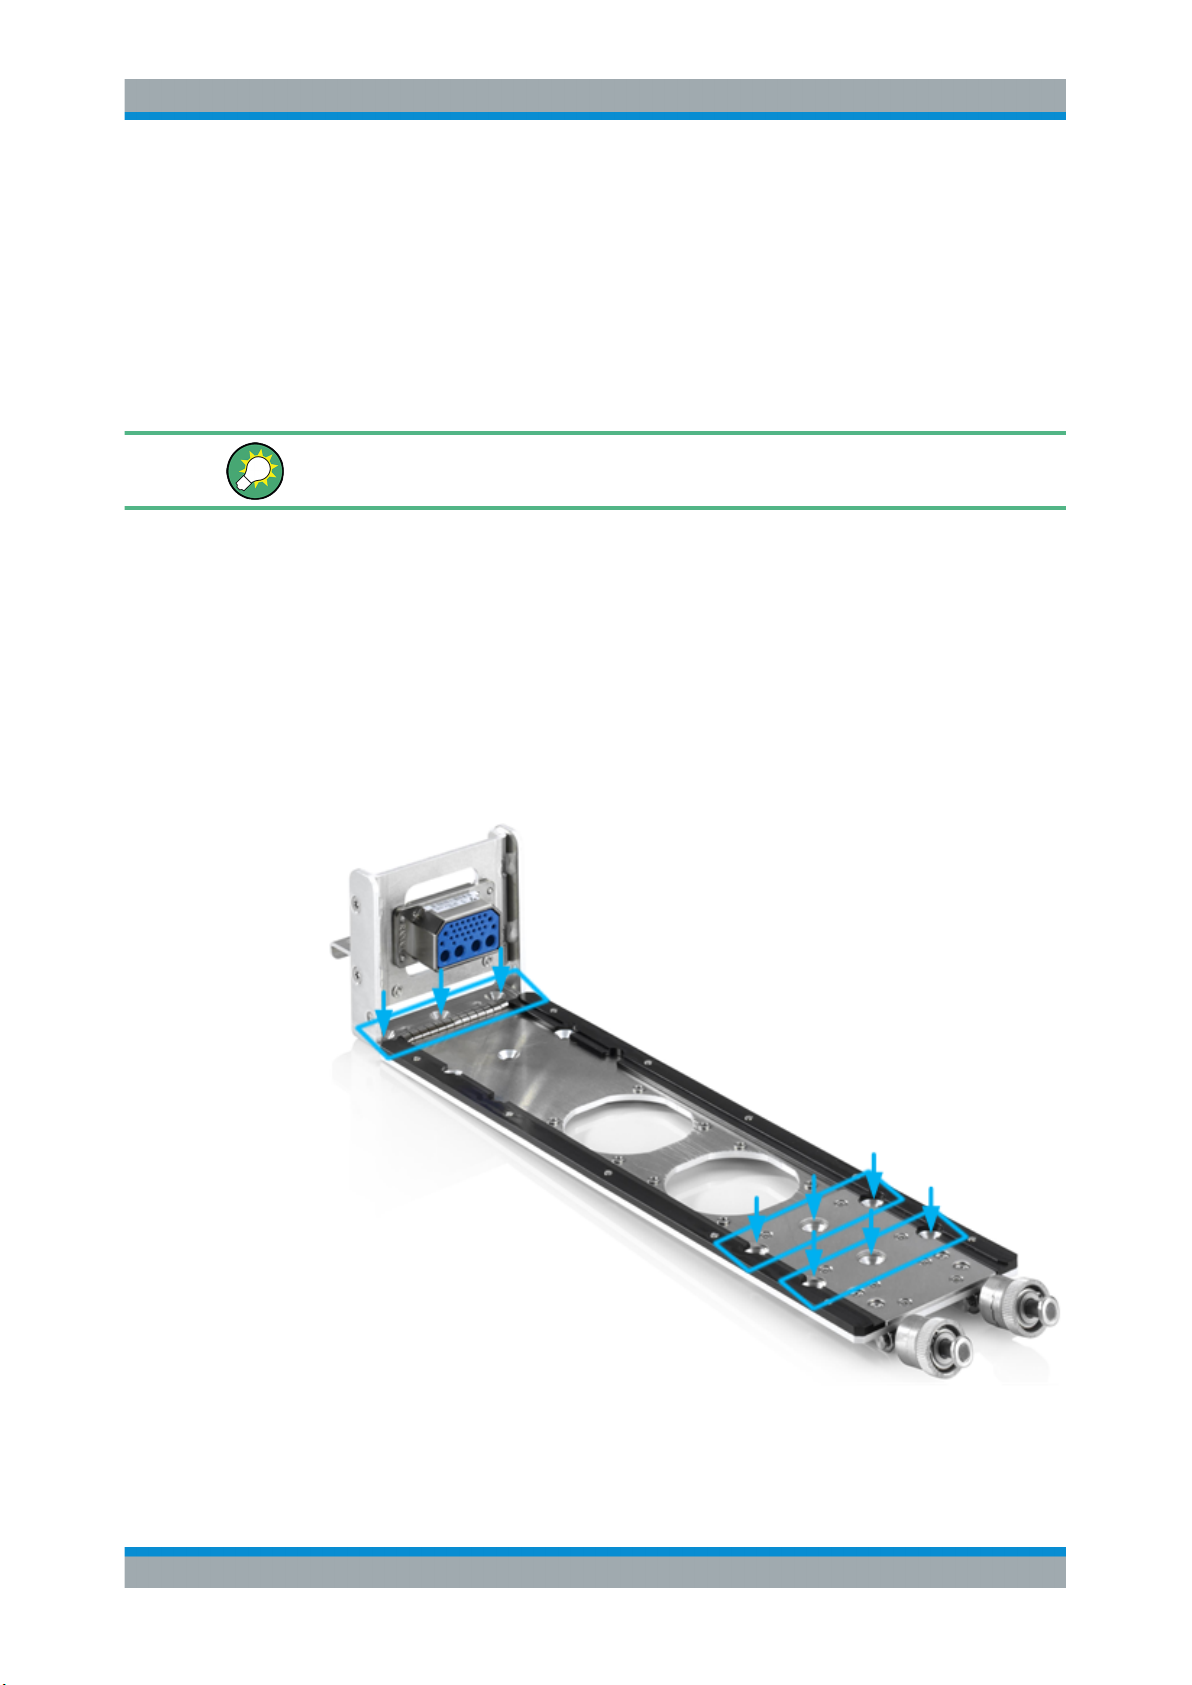
To mount the R&S EVSF1000 on an installation tray
WARNING! Risk of injury due to falling instrument. Be careful when mounting or
1.
unmounting the instrument in a rack. If the instrument falls down it can injure you.
Insert the installation tray into the flight inspection rack. Make sure it lies in the rack
straight and securely.
2. Fasten the tray in the rack by inserting 5 mm flattop screws from the top of the tray
through the rack. Fasten 3 screws through the perforations on the left, and 3
screws through one of the two rows on the right in Figure 3-1. Use only the indicated perforations for rack-mounting to ensure the mechanical strength of the tray.
Figure 3-1: Perforations for installation in the rack
11User Manual 1178.6410.02 ─ 06
Page 12
R&S®EVSF1000
Getting Started
Preparing for Use
3. Connect the ARINC connector of the tray to the board power supply and any other
devices required for signal input or output, such as the receiving antenna, the GPS
receiver, or the PPS signal.
For a description of the pin assignment, see Table 3-1.
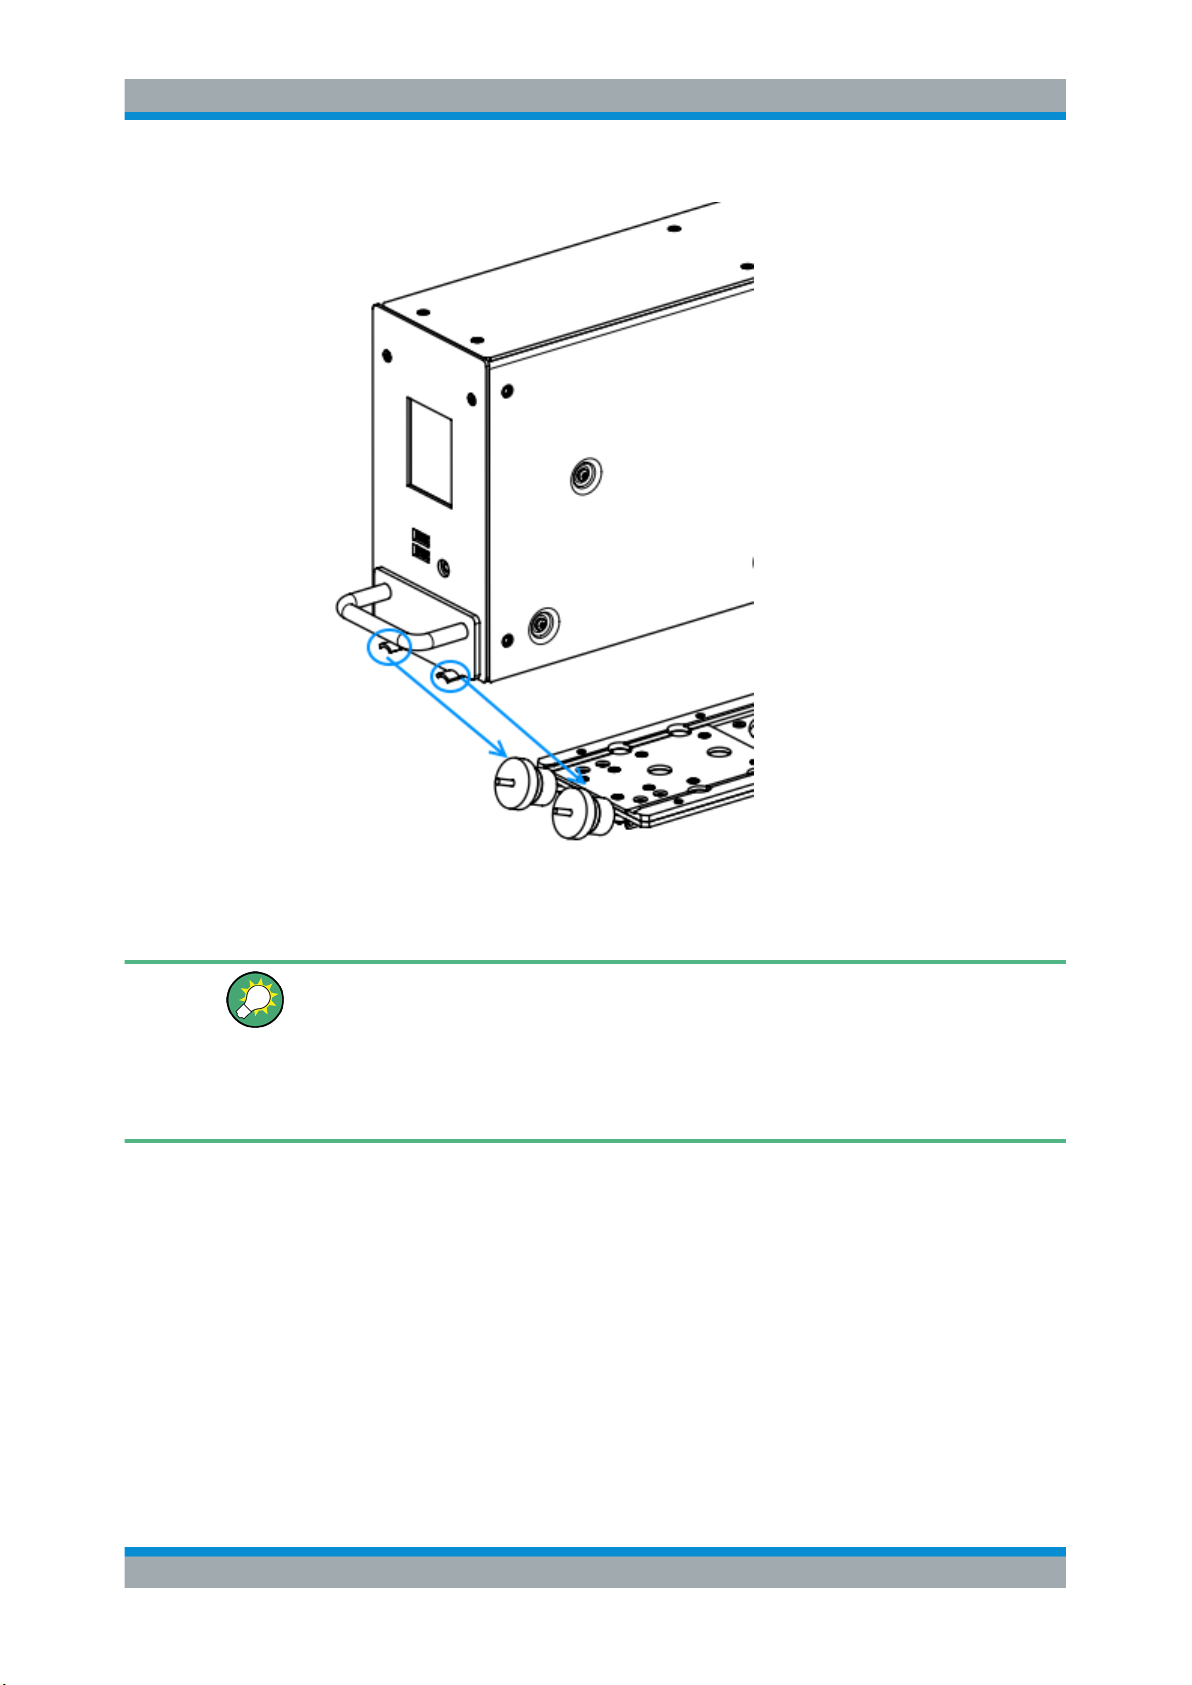
4. Place the bottom of the R&S EVSF1000 on top of the installation tray.
5. Insert the ARINC connector of the tray to the female connector on the
R&S EVSF1000.
6. Make sure the curved offsets of the metal plate on the instrument lay securely on
the knobs at the front of the tray.
12User Manual 1178.6410.02 ─ 06
Page 13
R&S®EVSF1000
Getting Started
Preparing for Use
7. Fasten the knobs on the tray manually by twisting them clock-wise.
The instrument is ready for operation.
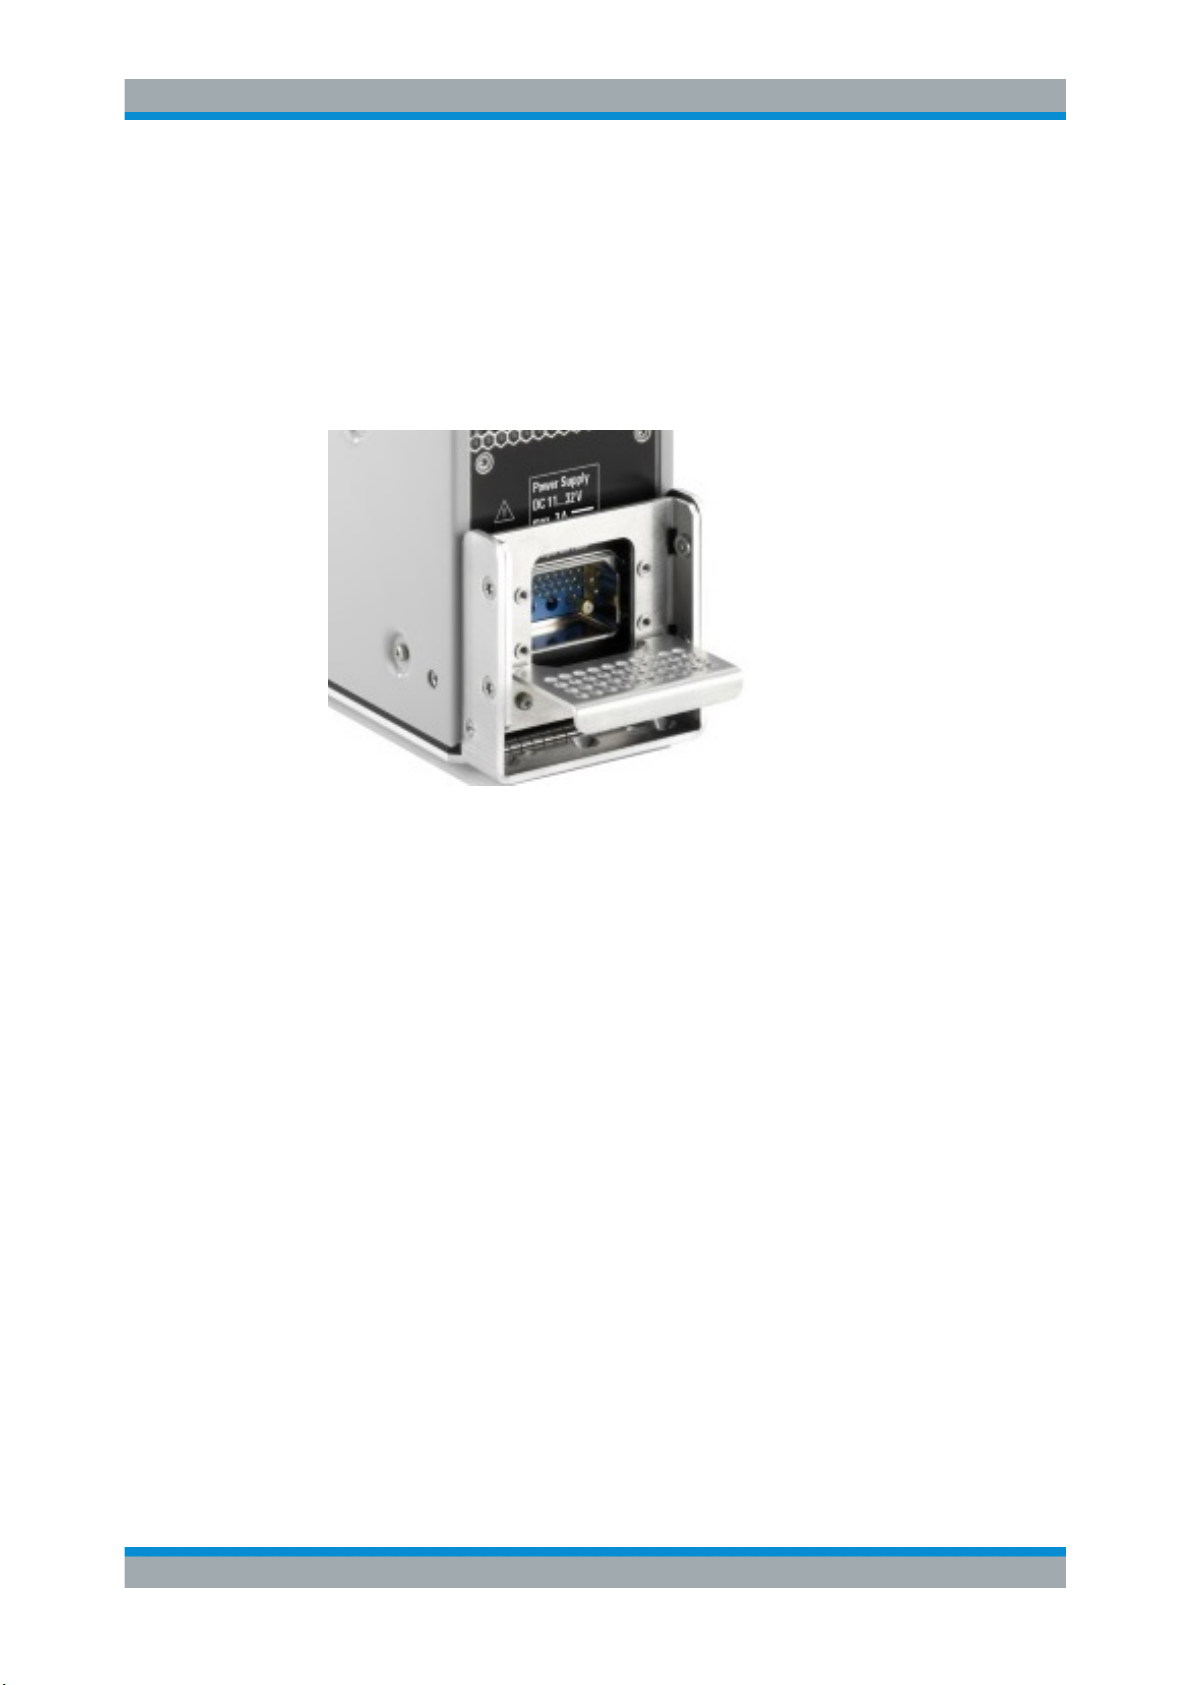
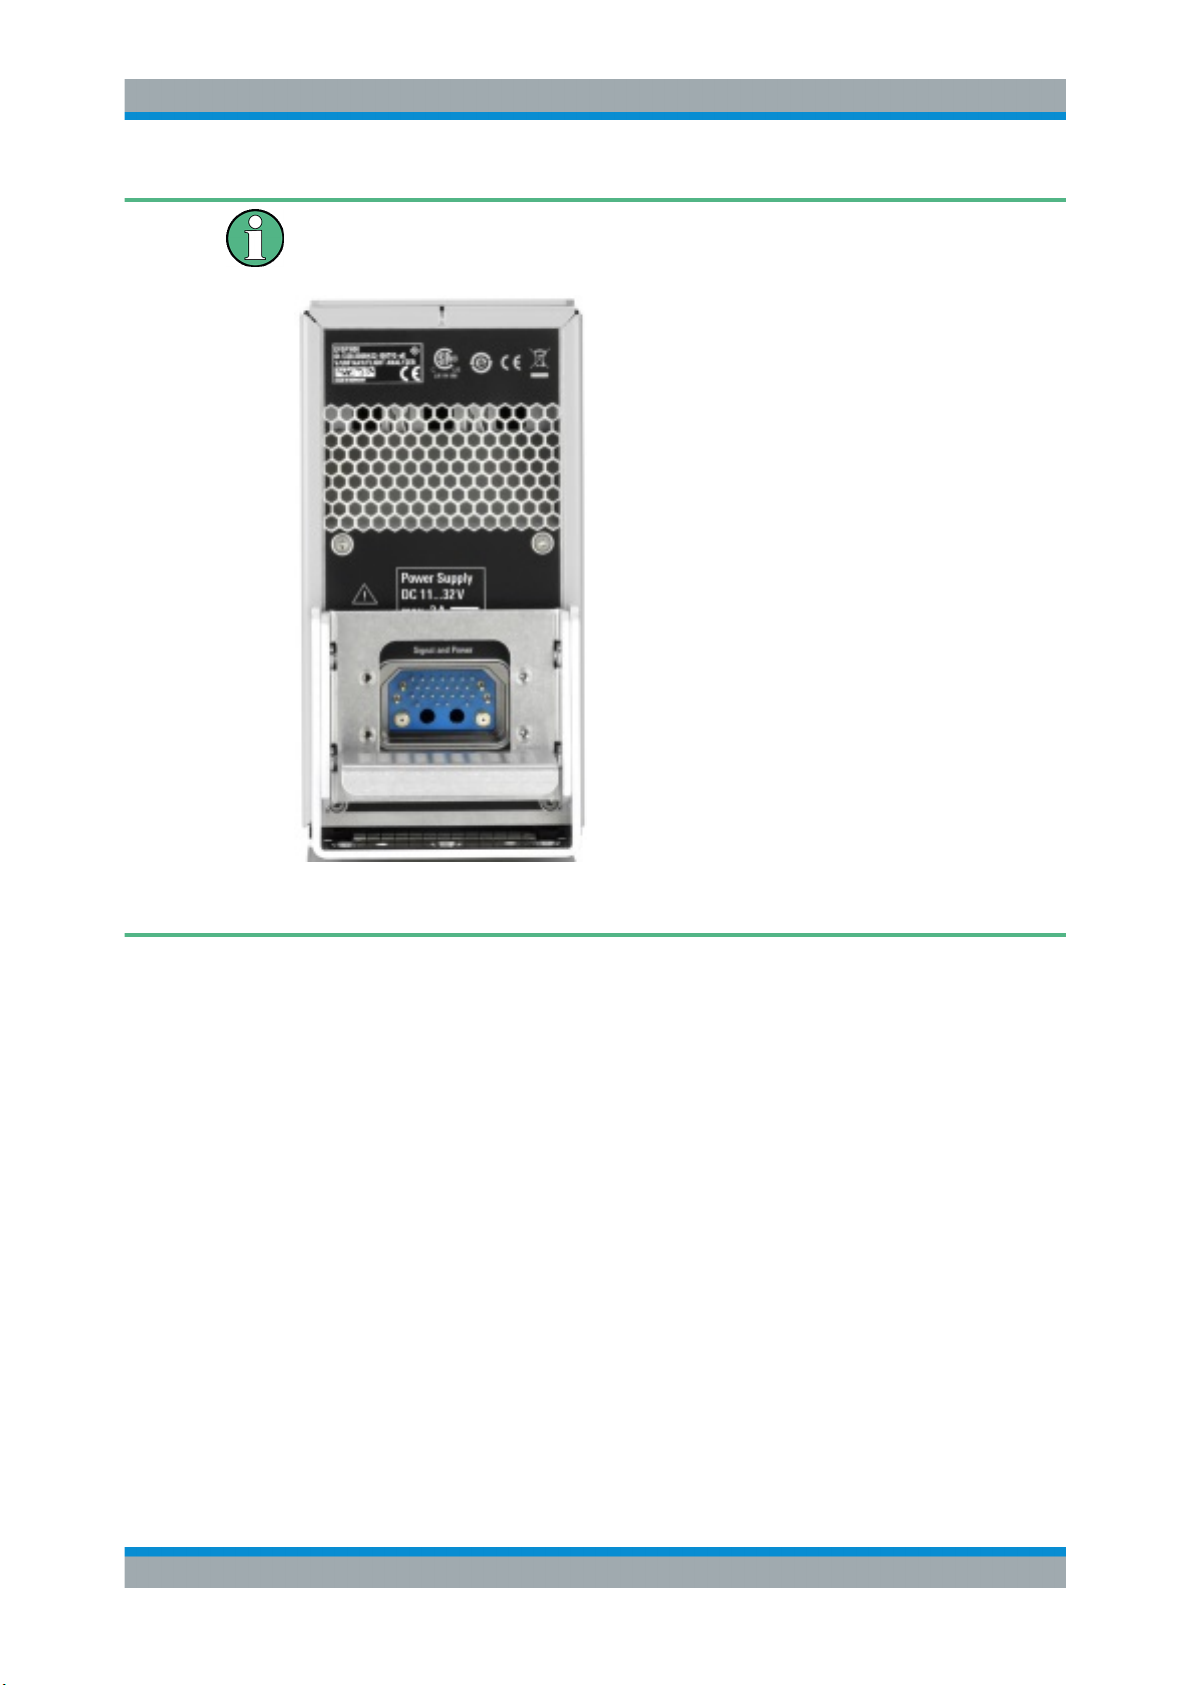
Service adapter
If you need to operate a R&S EVSF1000 with the slide-in hardware outside an aircraft,
you can use the optional service adapter (R&S EVSF1-Z2) to connect a power supply
and any other signal input and output devices. The service adapter combines an
ARINC connector as described in Figure 3-4 with the common connectors provided on
the rear panel of a conventional R&S EVSF1000.
3.2.3 Starting the R&S EVSF1000
After connecting the power supply, or the ARINC connector with an active power supply, R&S EVSF1000 starts immediately.
13User Manual 1178.6410.02 ─ 06
Page 14
R&S®EVSF1000
3.3 Instrument Tour
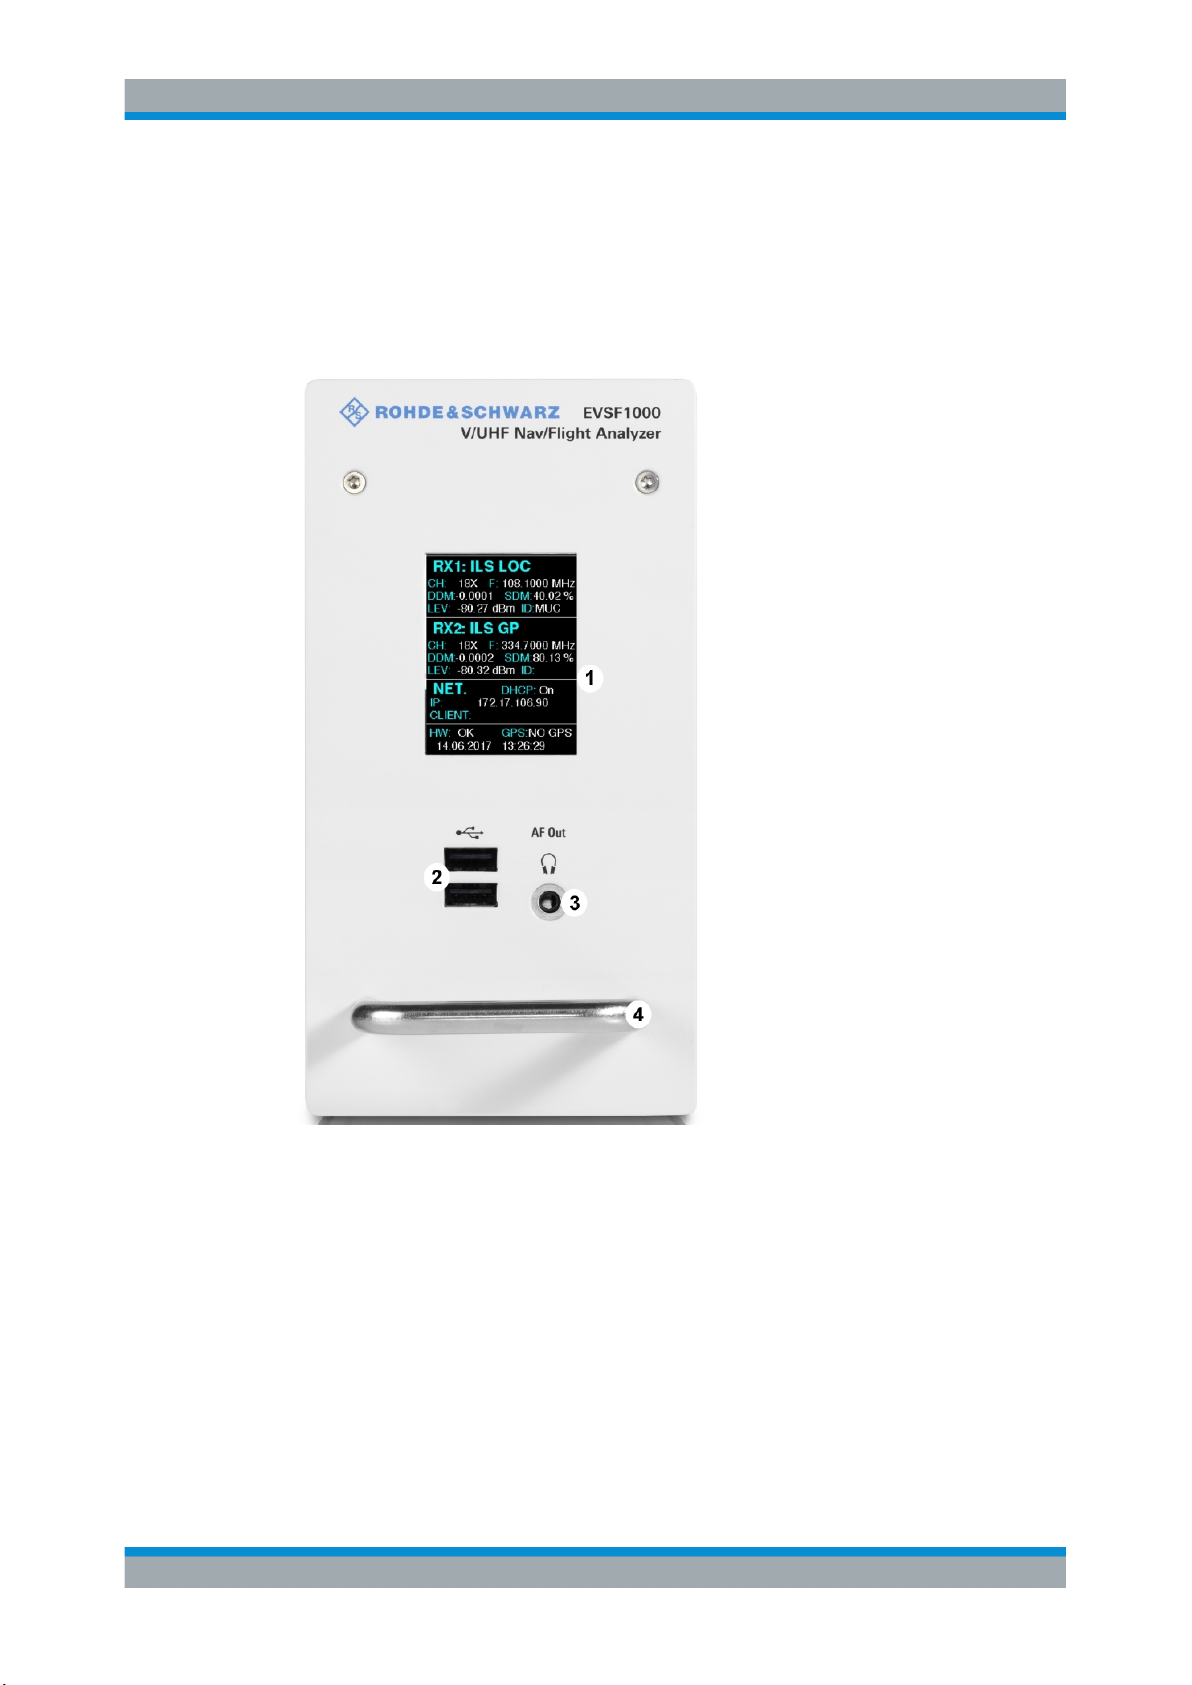
3.3.1 Front Panel
Getting Started
Instrument Tour
Figure 3-2: R&S EVSF1000 - Front panel view
1 = Display
2 = USB Connectors (2x)
3 = AF Out
4 = Carry Handle
3.3.1.1 Display
The display shows a basic set of measurement and configuration settings.
14User Manual 1178.6410.02 ─ 06
Page 15

R&S®EVSF1000
3.3.1.2 USB Connectors (2x)
3.3.1.3 AF Out
3.3.1.4 Carry Handle
Getting Started
Instrument Tour
The front panel provides two female USB connectors (USB-A, 2.0 standard) to connect
devices like a memory stick or a USB keyboard.
The memory stick is used to store and reload instrument settings, to perform software
updates and to export measurement data.
A standard USB keyboard is used to configure the basic TCP/IP parameters.
For details, see Chapter 3.4.1, "Basic Configuration and Status Display", on page 22.
Connection of a headset with a 3.5 mm jack plug into the AF OUT plug.
The carry handle is used to remove the R&S EVSF1000 from the flight inspection rack
in which the R&S EVSF1000 is mounted.
15User Manual 1178.6410.02 ─ 06
Page 16
R&S®EVSF1000
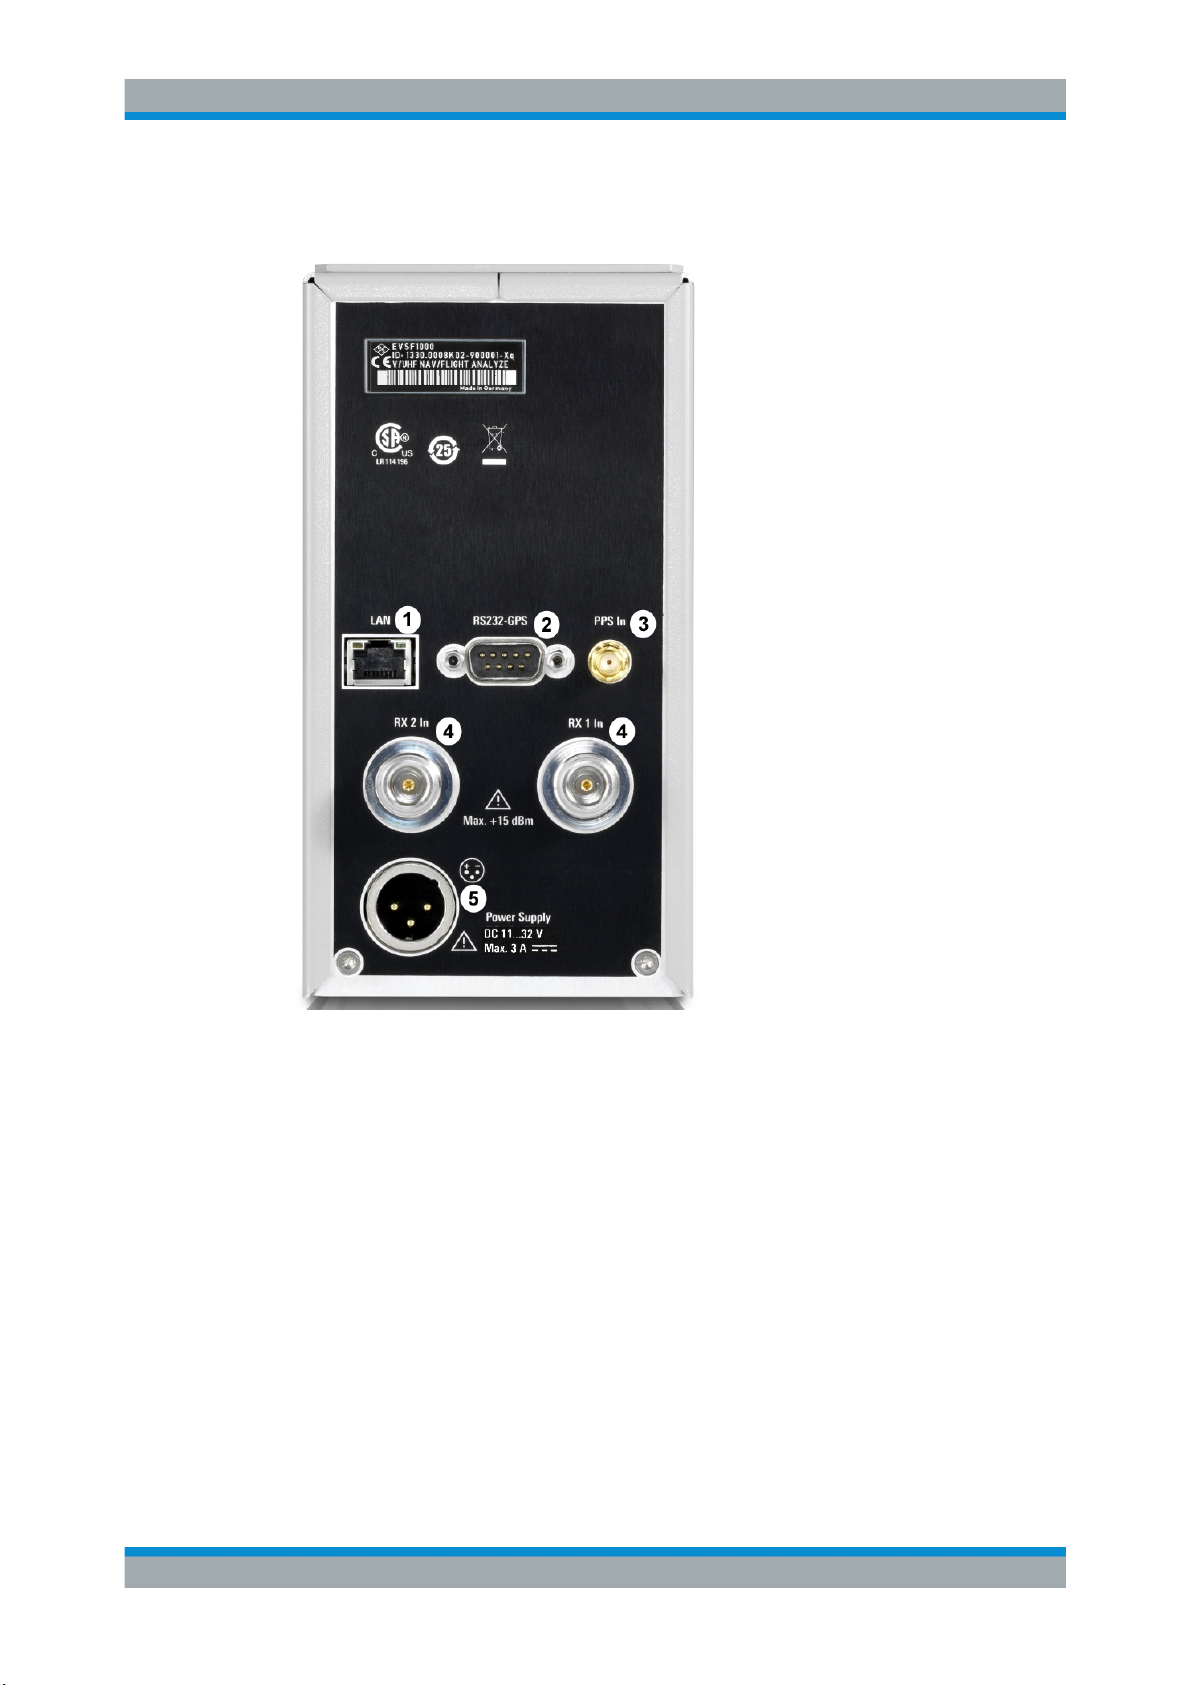
3.3.2 Rear Panel
Getting Started
Instrument Tour
Figure 3-3: R&S EVSF1000 - Rear panel view (basic model, without R&S EVSF1-B4 option)
1 = LAN
2 = RS-232 GPS
3 = PPS In
4 = RX 1 In / RX 2 In
5 = Power Supply
16User Manual 1178.6410.02 ─ 06
Page 17
R&S®EVSF1000
Getting Started
Instrument Tour
If the R&S EVSF1000 is provided with the optional slide-in hardware R&S EVSF1-B4
installed, the rear panel has an ARINC connector instead of the individual connectors.
See Chapter 3.3.2.6, "Optional ARINC Connector (R&S EVSF1-B4)", on page 18.
Figure 3-4: R&S EVSF1000 - Rear panel view with ARINC connector (slide-in option R&S EVSF1-B4)
For the specification of the following interfaces, see the R&S EVSF1000 data sheet.
● LAN (Ethernet)........................................................................................................ 17
● RS-232 GPS........................................................................................................... 18
● PPS In.....................................................................................................................18
● RX 1 In / RX 2 In..................................................................................................... 18
● Power Supply..........................................................................................................18
● Optional ARINC Connector (R&S EVSF1-B4)........................................................ 18
● LF In (Baseband Input, R&S EVSF1-B4 only)........................................................ 20
● Demod Out (Baseband Output, R&S EVSF1-B4 only)........................................... 20
● AF Out (R&S EVSF1-B4 only)................................................................................ 21
● Trigger In (R&S EVSF1-B4 only)............................................................................ 21
● IP-Address Select (R&S EVSF1-B4 only)...............................................................21
3.3.2.1 LAN (Ethernet)
Operate the R&S EVSF1000 remotely using the LAN connection (Fast Ethernet). The
LAN connection can also be used to stream measurement data (TCP port 8000; for I/Q
data: 8001 (RX1) or 8002 (RX2)). The data transfer rate is 100 Mbit/s.
17User Manual 1178.6410.02 ─ 06
Page 18

R&S®EVSF1000
3.3.2.2 RS-232 GPS
3.3.2.3 PPS In
Getting Started
Instrument Tour
With a VNC Viewer session, hardkey and softkey tasks of R&S EVSF1000 can be performed via shortcuts on a remote keyboard.
For details about remote control, see Chapter 12, "Remote Commands", on page 184.
Connect a GPS receiver to the GPS RS-232 port (9-pin Sub-D plug), or if R&S EVSF1B4 is installed, to the ARINC connector (see Chapter 3.3.2.6, "Optional ARINC Con-
nector (R&S EVSF1-B4)", on page 18). The NMEA protocol data is read in and dis-
played in GPS mode.
Connect a PPS signal of an external GPS device to the PPS input, or if R&S EVSF1B4 is installed, to the ARINC connector (see Chapter 3.3.2.6, "Optional ARINC Con-
nector (R&S EVSF1-B4)", on page 18) for precise synchronization.
3.3.2.4 RX 1 In / RX 2 In
Connect the receiving antenna (max. +15 dBm) corresponding to the frequency range
to the RX-inputs, or if R&S EVSF1-B4 is installed, to the ARINC connector (see Chap-
ter 3.3.2.6, "Optional ARINC Connector (R&S EVSF1-B4)", on page 18). The RF-
inputs are designed as N-plugs.
3.3.2.5 Power Supply
Connect an external DC power source (11 V DC to 32 V DC) to the power supply connection (POWER SUPPLY, XLR plug), or if R&S EVSF1-B4 is installed, to the ARINC
connector (see Chapter 3.3.2.6, "Optional ARINC Connector (R&S EVSF1-B4)",
on page 18).
3.3.2.6 Optional ARINC Connector (R&S EVSF1-B4)
Optionally, the R&S EVSF1000 can be provided with an ARINC connector on the rear
panel instead of the individual connectors in the standard model (see Figure 3-4). This
connector allows you to easily slide the R&S EVSF1000 out of a flight inspection rack
without having to disconnect all cables from the instrument individually.
The ARINC connector provides connections to all input and output provided by connectors on the standard R&S EVSF1000, as well as some additional signals.
18User Manual 1178.6410.02 ─ 06
Page 19
R&S®EVSF1000
Getting Started
Instrument Tour
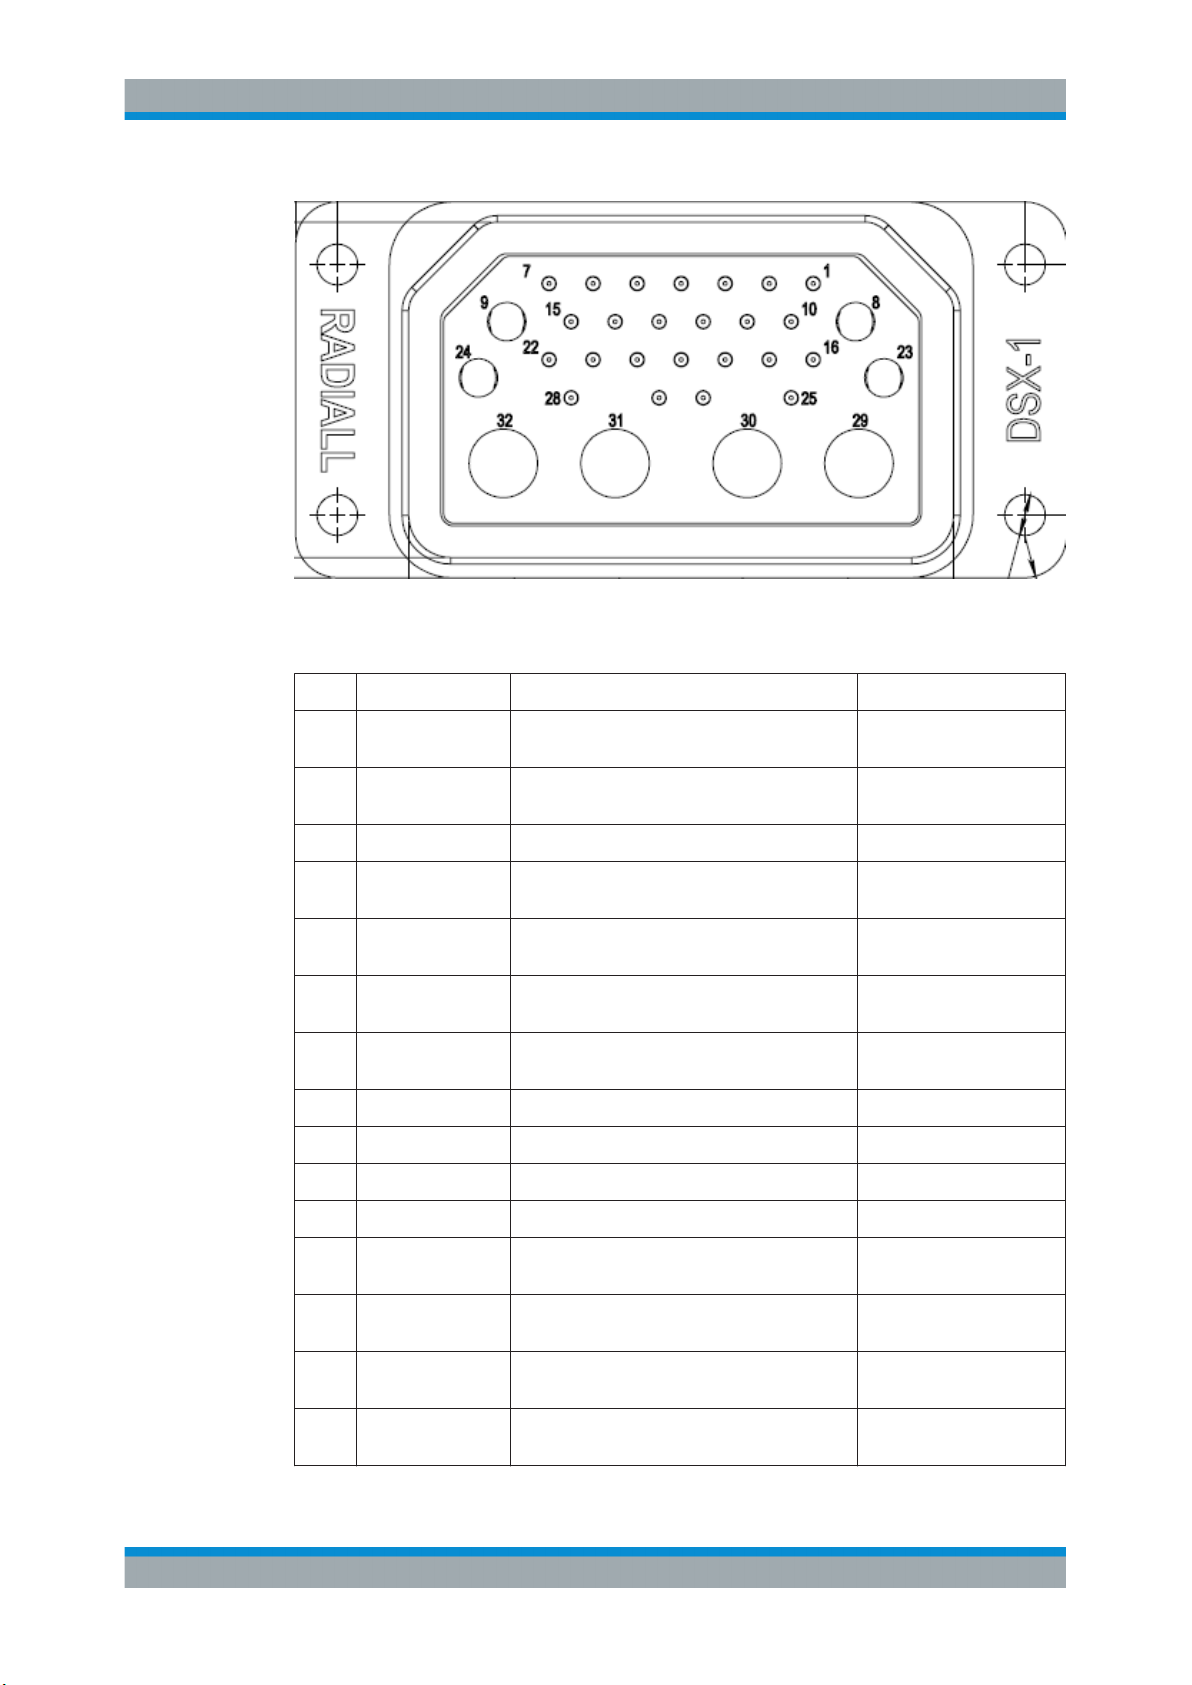
Figure 3-5: Pin assignment of ARINC connector
Table 3-1: Pin assignment of ARINC connector
Pin Signal Description Cable type
1 SPEAKER+/
AUDIO
2 SPEAKER-/
AUDIO_GND
3 ADR_SEL_IN IP-Address-Select single, AWG 20-24
4 ETH_DO- LAN (Ethernet) 4x2 twisted paired, AWG
5 ETH_DI- LAN (Ethernet) 4x2 twisted paired, AWG
6 USB_VBUS USB 5V 2x2 twisted paired, AWG
7 USB_D+ USB Data+ 2x2 twisted paired, AWG
8 V_DCIN_GND Power single, AWG 16-20
9 V_DCIN_+28V Power single, AWG 16-20
10 GND Signal GND single, AWG 20-24
11 TRIGGER_IN Trigger-Input single, AWG 20-24
12 ETH_DO+ LAN (Ethernet) 4x2 twisted paired, AWG
Speaker/Audio Out (AF Out) single, AWG 20-24
Speaker/Audio GND (AF Out) single, AWG 20-24
20-24
20-24
20-24
20-24
20-24
13 ETH_DI+ LAN (Ethernet) 4x2 twisted paired, AWG
20-24
14 USB_GND USB GND 2x2 twisted paired, AWG
20-24
15 USB_D- USB Data- 2x2 twisted paired, AWG
20-24
19User Manual 1178.6410.02 ─ 06
Page 20

R&S®EVSF1000
Getting Started
Instrument Tour
Pin Signal Description Cable type
16 BB-OUT Baseband-Output (Demod Out) RG 316, AWG 20-24
17 GND Signal GND single, AWG 20-24
18 PPS_IN PPS-IN RG 316, AWG 20-24
19 GPS_5V_SUPPLY GPS RX/ANT-Supply single, AWG 20-24
20 GPS_CTS RS232-GPS single, AWG 20-24
21 GPS_RTS RS232-GPS single, AWG 20-24
22 GPS_TXD RS232-GPS single, AWG 20-24
23 V_DCIN_GND Power single AWG 16-20
24 V_DCIN_+28V Power single AWG 16-20
25 BB-IN Baseband-Input (LF-IN) single, AWG 20-24
26 GPS_GND RS232-GPS single, AWG 20-24
27 GPS_PPS_IN RS232-GPS PPS-IN single, AWG 20-24
28 GPS_RXD RS232-GPS single, AWG 20-24
29 RX1 (coaxial inlay) RX1 Antenna RG 223/ RG 142/ RG 400,
30 spare spare RG 223/ RG 142/ RG 400,
31 spare spare RG 223/ RG 142/ RG 400,
32 RX2 (coaxial inlay) RX2 Antenna RG 223/ RG 142/ RG 400,
3.3.2.7 LF In (Baseband Input, R&S EVSF1-B4 only)
Provides a baseband signal to the R&S EVSF1000 for further analysis of typical AF
parameters (when using the R&S EVSF1-Z2 service adapter, use the BNC connector,
50 Ω/20kΩ).
Only available as of firmware version 1.30.
3.3.2.8 Demod Out (Baseband Output, R&S EVSF1-B4 only)
Outputs a demodulated (baseband) signal for connected devices, for example an oscilloscope (when using the R&S EVSF1-Z2 service adapter, use the BNC connector, 50
Ω/20kΩ).
AWG 20-24
AWG 20-24
AWG 20-24
AWG 20-24
Only available as of firmware version 1.30.
20User Manual 1178.6410.02 ─ 06
Page 21

R&S®EVSF1000
3.3.2.9 AF Out (R&S EVSF1-B4 only)
3.3.2.10 Trigger In (R&S EVSF1-B4 only)
3.3.2.11 IP-Address Select (R&S EVSF1-B4 only)
Getting Started
Instrument Tour
Provides AF output to connected headphones or a loudspeaker (optimized for 8 Ω).
When using the R&S EVSF1-Z2 service adapter, audio output is sent to the speaker.
Only available as of firmware version 1.30.
Provides an external trigger for data recording (when using the R&S EVSF1-Z2 service
adapter, use the BNC connector, 50 Ω/20kΩ)
Only available as of firmware version 1.30.
Determines which of two possible IP addresses is used, to distinguish between two
instruments in a single rack.
(See "TCP/IP Address" on page 174).
If this pin is not connected, the address configured as "TCP/IP Address 1" is used.
If this pin is connected to ground, the address configured as "TCP/IP Address 2" is
used.
3.3.3 Accessories
Following accessories are available for rack installation:
●
Slide-in option (R&S EVSF1-B4)
Provides an ARINC connector on the rear panel of the R&S EVSF1000 which can
be connected to the rack tray (R&S EVSF1-Z1 with connector).
While the tray remains connected to the aircraft permanently, you can remove the
R&S EVSF1000 quickly and easily, without having to connect and disconnect the
instrument from the power supply and other devices.
●
Installation tray with connector plate (R&S EVSF1-Z1)
Allows you to mount the instrument in a flight inspection rack securely.
Using the connector plate, you can remove and replace the R&S EVSF1000
quickly and easily.
●
Service adapter (R&S EVSF1-Z2)
The service adapter combines an ARINC connector with the common connectors
provided on the rear panel of a conventional R&S EVSF1000. It allows you to connect a power supply and any other signal input and output devices to a
R&S EVSF1000 with the slide-in hardware outside an aircraft.
21User Manual 1178.6410.02 ─ 06
Page 22
R&S®EVSF1000
3.4 Operating Basics
3.4.1 Basic Configuration and Status Display
Getting Started
Operating Basics
The R&S EVSF1000 is designed for flight inspection and is thus optimized for remote
operation, via predefined commands. It does not have a graphical user interface for
manual interaction.
Nevertheless, the instrument can also be controlled manually, by simulating a user
interface on a remotely connected device, and using a connected keyboard. Basic
operation and status information is also available on a mini display directly on the
R&S EVSF1000.
In order to connect to the R&S EVSF1000 from a remote PC, you require connection
information, such as the IP address. It is also helpful to obtain the operating status of
the instrument before connecting to it. This basic information is displayed in the mini
display directly on the R&S EVSF1000.
Figure 3-6: R&S EVSF1000 mini display
The following information is displayed in the mini display.
22User Manual 1178.6410.02 ─ 06
Page 23

R&S®EVSF1000
Getting Started
Operating Basics
Measurement information for each receiver board (RX1/RX2)
In addition to the current measurement mode, measurement-specific information is
provided.
For example, for "ILS LOC" mode (see Chapter 6.1.3, "ILS Localizer and Glidepath
Measurements and Results", on page 37):
●
"CH": Receiver channel
●
"F": Receiver frequency
●
"DDM": ILS DDM
●
"SDM": ILS SDM
●
"LEV": Currently measured power level
●
"ID": Decoded ID of transmitter
For details on GBAS/SCAT-I measurement information in the status display, see Chap-
ter 8.2, "GBAS/SCAT-I Status Display", on page 119.
Network settings (NET)
See Chapter 11.3, "Network (Remote) Settings", on page 171
●
"DHCP": DHCP usage
●
"IP": IP address of the R&S EVSF1000
●
"CLIENT": IP address of connected client
Operating status of the R&S EVSF1000
See Chapter 11.5, "Instrument Configuration and Operating Status Settings",
on page 176
●
"HW": Hardware status("OK"/"ERROR")
●
"GPS": Availability of GPS signal
Current date and time
3.4.2 Basic Connection Settings
In order to operate the R&S EVSF1000 from a remote PC, you require connection
information.
By default, the R&S EVSF1000 is set to use the dynamic host configuration protocol
(DHCP), so the IP address is assigned automatically. The assigned IP address and
DHCP state of the R&S EVSF1000 is provided in the mini display on the front panel.
Use this IP address for the initial connection from a remote PC to the R&S EVSF1000.
To change the settings, see Chapter 11.3, "Network (Remote) Settings", on page 171.
23User Manual 1178.6410.02 ─ 06
Page 24
R&S®EVSF1000
3.4.3 Manual Operation from a VNC Viewer
3.4.3.1 Understanding the Display Information
Getting Started
Operating Basics
You can operate the R&S EVSF1000 manually from a connected PC using a keyboard.
Using a VNC viewer application , you simply connect to the instrument, defined by its
IP address. The display of the R&S EVSF1000 is shown on the control PC. The keys
and other graphical user interface elements are operated using associated keyboard
shortcuts on the connected keyboard.
The following figure shows a typical screen display on the R&S EVSF1000. All different
screen elements are labeled. They are explained in more detail in the following sections.
2
3
4
Figure 3-7: R&S EVSF1000 - GUI Overview
1
1 = Softkeys to edit settings and activate functions
2 = Measurement settings area (numeric modes only)
3 = Measurement result area
4 = Status bar
Softkeys
Softkeys are virtual function keys whose actual function is defined by the software,
depending on the currently selected measurement mode or key, or both.
24User Manual 1178.6410.02 ─ 06
Page 25
R&S®EVSF1000
Getting Started
Operating Basics
In some cases, more functions are available than softkeys can be displayed at the
same time. In this case, a second menu of functions is available, indicated by "1/2" and
"2/2" beneath the softkeys in the display. To switch between the two menus of softkey
functions, press the "More softkeys" key beneath the softkeys on the front panel of the
R&S EVSF1000.
Softkeys can perform a function directly, or open a dialog or submenu with further settings and functions. Some softkeys are directly associated with an input field in the
measurement settings area of the window. If the softkey shows a vertical blue line at
the edge, you can edit the value of the corresponding setting directly in the measurement settings area of the window. If the blue line is not shown, the setting is read-only.
To toggle between the edit mode and read-only mode, select the softkey again.
Figure 3-8: Softkey with an associated input field
Measurement settings and results area
During a measurement, the available settings are displayed at the top of the screen;
the measurement results at the bottom. If a general instrument setting or data management function is selected, the settings and information are displayed in the main part of
the screen.
Which settings and results are displayed depends on the current measurement or
instrument function. See the following chapters for details:
●
Chapter 4, "Measurements and Results", on page 30
●
Chapter 10, "Data Management", on page 159
●
Chapter 11, "Common Instrument Settings", on page 169
Status bar
The status bar at the bottom of the screen contains information on the operating status
of the instrument.
●
Current list of data recording and size of this list
(See Chapter 10.2, "Recording Measurement Data", on page 161)
●
Local or Remote Operation (see Chapter 3.4.4, "Remote Control", on page 29)
3.4.3.2 Keyboard Commands for Operation via a VNC Viewer
Keyboard Commands (VNC Viewer) shows the mapping between the keyboard short-
cuts and the interface elements on the R&S EVSF1000.
25User Manual 1178.6410.02 ─ 06
Page 26

R&S®EVSF1000
Getting Started
Operating Basics
Table 3-2: Keyboard Commands (VNC Viewer)
Keyboard Usage
y Preset
c Audio
v Display
b Help
n Setup
m Mode
z Undo
r Redo
PAGE UP Field right
PAGE DOWN Field left
x Screenshot
a Meas
s Config
F7 Softkey 7
F6 Softkey 6
F5 Softkey 5
F4 Softkey 4
F3 Softkey 3
F2 Softkey 2
F1 Softkey 1
k Trigger
l Single
ESC ESC
0 0
1 1
4 4
7 7
q CH/FREQ
d MTime
BACKSPACE Back
ENTER Enter
. .
26User Manual 1178.6410.02 ─ 06
Page 27
R&S®EVSF1000
Getting Started
Operating Basics
Keyboard Usage
2 2
5 5
8 8
w Ampt
F9 Hz
3 3
6 6
9 9
e BW (Bandwidth)
F10 kHz
F11 MHz
F12 GHz
p Record
i Marker
3.4.3.3 Changing Settings and Activating Functions
All functions available on the R&S EVSF1000 can be accessed using the keys on the
external keyboard. Some keys provide a softkey menu on the display with further functions and settings.
1. Select a key as described in Table 3-2 to activate a function directly, or to display a
softkey menu.
2. Select the key for the setting or function as required.
If necessary, select [F8] to switch to the second softkey menu.
The function is activated, or a new window is displayed to view or change specific
settings.
3. To set the focus on a specific setting in the displayed window, scroll through the
individual settings by pressing the Up and Down arrow keys.
4. Scroll through the available setting values by pressing the Up and Down arrow
keys, or enter a numeric or alphanumeric value as described in Chapter 3.4.3.4,
"Entering Data", on page 28.
27User Manual 1178.6410.02 ─ 06
Page 28

R&S®EVSF1000
3.4.3.4 Entering Data
Getting Started
Operating Basics
5. Confirm the new setting and remove the focus by pressing [ENTER].
You enter data in input fields using the external keyboard, as described in Table 3-2.
Entering numeric parameters
If a field requires numeric input, the keypad provides only numbers.
1. Enter the parameter value using the keypad, or change the currently used parameter value by pressing the Up or Down arrow keys.
2. After entering the numeric value via keypad, press the corresponding unit key.
The unit is added to the entry.
3. If the parameter does not require a unit, confirm the entered value by pressing
[ENTER] or any of the unit keys.
Entering numbers and (special) characters via the keypad
If a field requires alphanumeric input, use the keypad on theexternal keyboard. Every
alphanumeric key represents several characters and one number. The decimal point
key (.) represents special characters, and the sign key (-) toggles between capital and
small letters. For the assignment refer to Table 3-3.
1. Press the key once to enter the first possible value.
All characters available via this key are displayed.
2. To choose another value provided by this key, press the key again, until your
desired value is displayed.
3. With every key stroke, the next possible value of this key is displayed. If all possible values have been displayed, the series starts with the first value again. For
information on the series refer to Table 3-3.
4. To change from capital to small letters and vice versa, press the sign key (-).
5. When you have chosen the desired value, wait for 2 seconds (to use the same key
again), or start the next entry by pressing another key.
Entering a blank
► Press the "0" key and wait 2 seconds.
Correcting an entry
1. Using the arrow keys, move the cursor to the right of the entry you want to delete.
2. Press the [BACK] key.
The entry to the left of the cursor is deleted.
3. Enter your correction.
28User Manual 1178.6410.02 ─ 06
Page 29

R&S®EVSF1000
Getting Started
Operating Basics
Completing the entry
► Press [ENTER].
For numeric values, the default unit is appended to the numeric input.
To enter a value using a different unit, select the corresponding key.
Aborting the entry
► Press the [ESC] key.
The previous entry is restored.
Table 3-3: Keys for alphanumeric parameters
Key name
(upper inscription)
7 7 µ Ω ° € ¥ $ ¢
8 A B C 8 Ä ÆÅ Ç
9 D E F 9 É
4 G H I 4
5 J K L 5
6 M N O 6 Ň Ö
1 P Q R S 1
2 T U V 2 Ü
3 W X Y Z 3
0 <blank> 0 – @ + / \ < > = % &
. . * : _ , ; " ' ? ( ) #
– <toggles between capital and small letters>
3.4.4 Remote Control
Series of (special) characters and number provided
You can control the R&S EVSF1000, including data transfer, remotely from a PC using
the LAN connection (Fast Ethernet).
See Chapter 3.4.2, "Basic Connection Settings", on page 23.
Remote control is performed using predefined remote commands which are sent from
the control PC to the R&S EVSF1000. The R&S EVSF1000 can also return queried
data to the control PC.
For details on the available remote commands, see Chapter 12, "Remote Commands",
on page 184.
While in remote control, the R&S EVSF1000 display indicates "Remote" in the status
bar. During remote control, the instrument is locked for manual operation via VNC. To
return to manual operation, press [ESC].
29User Manual 1178.6410.02 ─ 06
Page 30
R&S®EVSF1000
4 Measurements and Results
Measurements and Results
The R&S EVSF1000 provides both numerical and graphical results, depending on the
current measurement task.
Different measurement tasks are performed in individual measurement modes, some
of which are optional. The individual measurement modes are described in detail in the
subsequent chapters of this documentation.
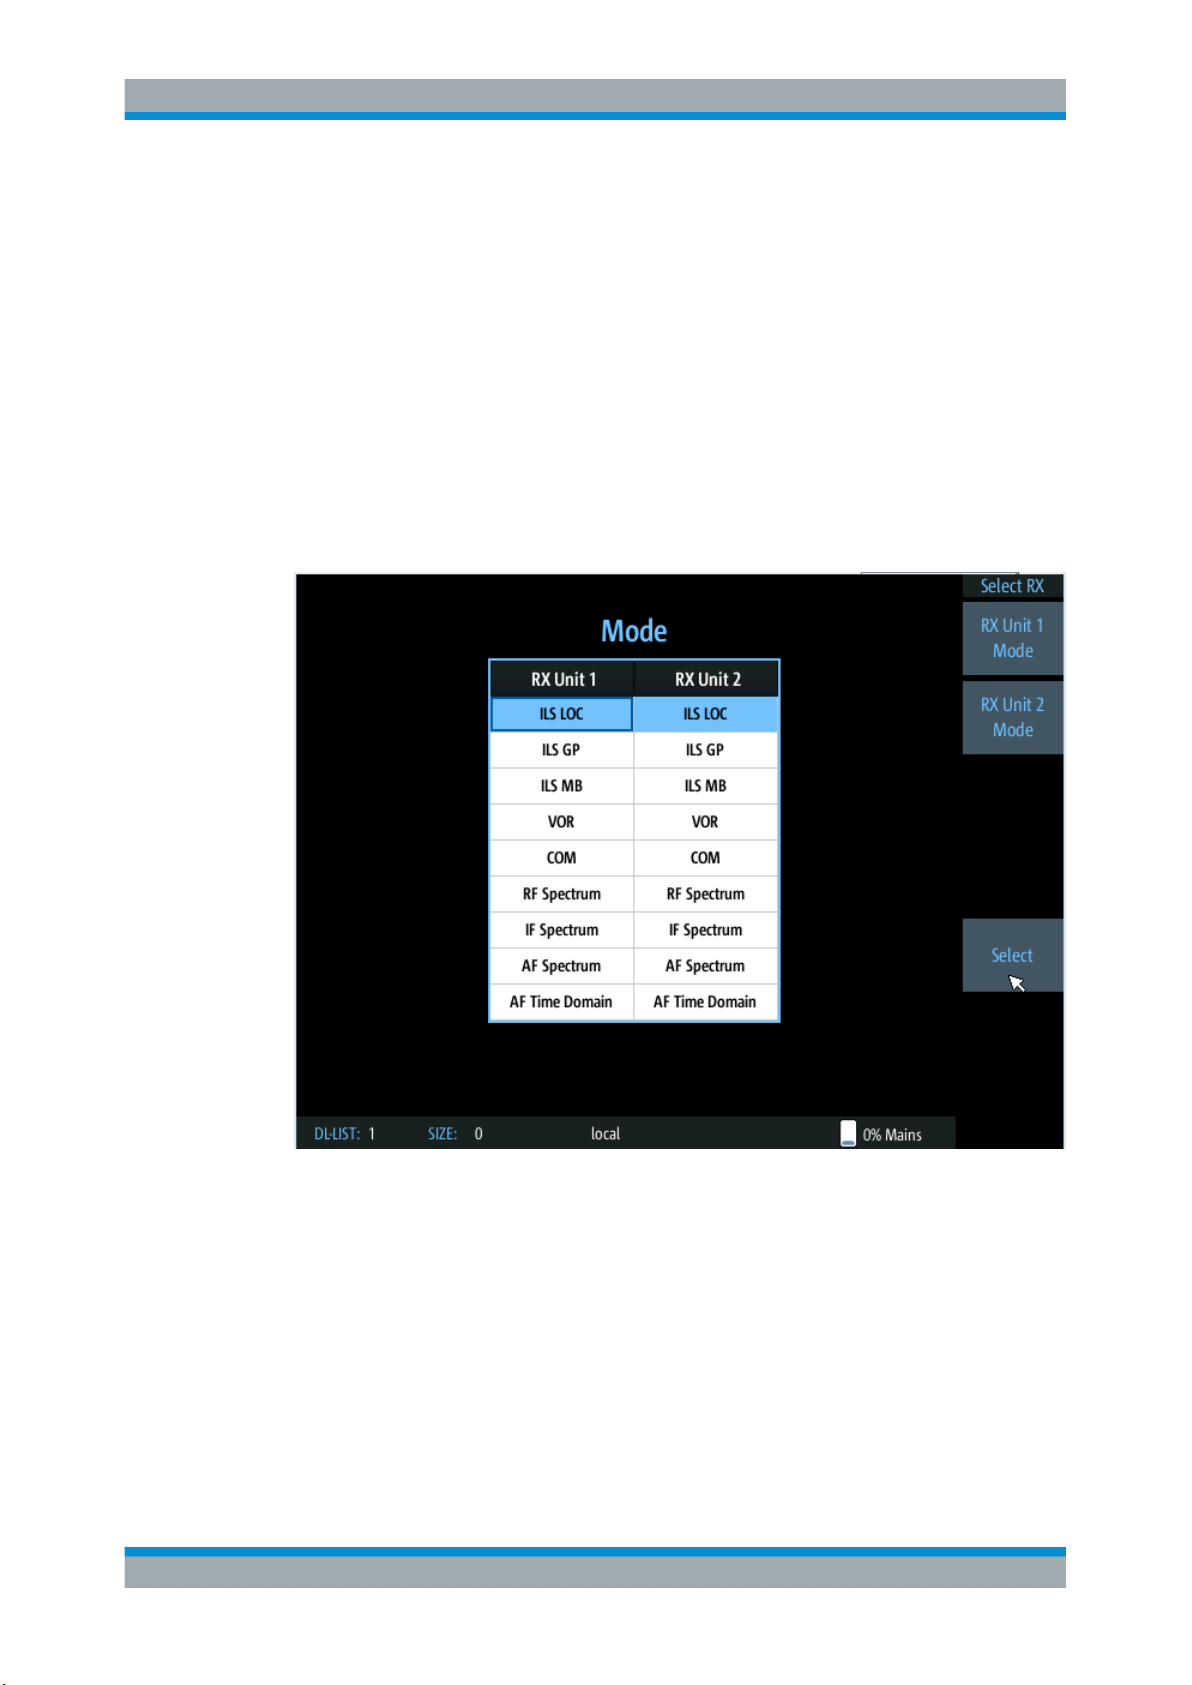
If an optional second receiver board (R&S EVSG-B2) is installed, each receiver board
can be configured to perform different measurement tasks. Thus, you can perform two
different measurements on the same input signal simultaneously. You must then select
the receiver board whose results are displayed in the display settings (see "RX Unit 1 /
RX Unit 2" on page 170).
Figure 4-1: Measurement mode selection
Measurement modes with numerical results
The following measurement modes provide numerical results:
●
ILS LOC mode - determines localizer signal parameters
●
ILS GP mode - determines glidepath signal parameters
●
ILS MB mode - determines marker beacon signal parameters
●
VOR mode (R&S EVSG-K2) - determines modulation and signal parameters, as
well as voice identifier parameters
30User Manual 1178.6410.02 ─ 06
Page 31

R&S®EVSF1000
Measurements and Results
●
COM (R&S EVSG-K6) - determines signal parameters from VHF/UHF communication channels
Measurement modes with graphical results
The following measurement modes provide graphical results:
●
RF Spectrum mode (R&S EVSG-K10) - displays the power vs. frequency diagram
(spectrum) for a variable frequency range of the input signal
●
IF Spectrum mode (R&S EVSG-K10) - displays an enlarged view of the spectrum
for a fixed frequency of the input signal
●
AF Spectrum mode (R&S EVSG-K11) - displays the spectrum of a demodulated
RF signal with AM components
●
AF Time Domain mode (R&S EVSG-K12) - displays the frequency vs. time diagram of the input signal, similar to an oscilloscope
Generally, each mode is configured individually. When you switch modes, the most
recently defined settings for that mode are applied.
However, graphical results can also be displayed directly from the measurement
modes with numeric results. In this case, the settings for the current mode are applied
to the graphical results.
Measurement modes with both numerical and graphical results
The following measurement modes provide both numerical and graphical results:
●
GBAS mode (R&S EVSG-K4/-K5) - displays measured and decoded information
from GBAS/SCAT-I sequences, frames, and slots, and graphical displays for individual slots
Remote commands to retrieve results:
GETMDEF on page 186
GETMEAS on page 185
GBAS:GETMDEF on page 263
GBAS:GETMEAS on page 264
Common Numerical Measurement Mode Settings
The following settings are displayed for most numerical measurement modes.
RX board (RX1 | RX2)...................................................................................................32
Measurement mode...................................................................................................... 32
Channel (CH)................................................................................................................ 32
Frequency (FREQ)........................................................................................................32
RF attenuation (Att).......................................................................................................32
Channel definition (1F/2F) - ILS LOC and ILS GP mode only...................................... 32
Level correction (Lev Corr)............................................................................................32
Bandwidth (IF BW)........................................................................................................32
Measurement time (MTime)..........................................................................................32
31User Manual 1178.6410.02 ─ 06
Page 32

R&S®EVSF1000
Measurements and Results
RX board (RX1 | RX2)
The currently active receiver board. See Chapter 5.2, "Receiver Board", on page 33.
Measurement mode
The currently active measurement mode on the active receiver board, e.g. "ILS LOC".
See Chapter 5.3, "Measurement Mode", on page 34.
Channel (CH)
The receiver frequency channel on the active receiver board according to the ICAO frequency list. See "Channel Frequency Configuration (CH FREQ)" on page 51.
Frequency (FREQ)
The measured frequency on the active receiver board. See "Channel Frequency Con-
figuration (CH FREQ)" on page 51.
RF attenuation (Att)
The used attenuation mode; see also "RF Mode" on page 53.
Channel definition (1F/2F) - ILS LOC and ILS GP mode only
The ILS Localizer and Glidepath measurements can detect both course and clearance
data simultaneously. Alternatively, the individual channels can be measured only, or
any one or two user-defined frequencies. By default, a wideband measurement is performed. The displayed measurement results depend on the selected channel and frequency configuration.
See Chapter 6.1.4.1, "Channel and Frequency Configuration", on page 49.
Level correction (Lev Corr)
The applied level correction by a transducer. See "Transducer Correction"
on page 53.
Bandwidth (IF BW)
Bandwidth on which the measurement is performed. Depends on the Channel defini-
tion (1F/2F) - ILS LOC and ILS GP mode only. See Chapter 6.1.4.3, "Bandwidth (BW)",
on page 53.
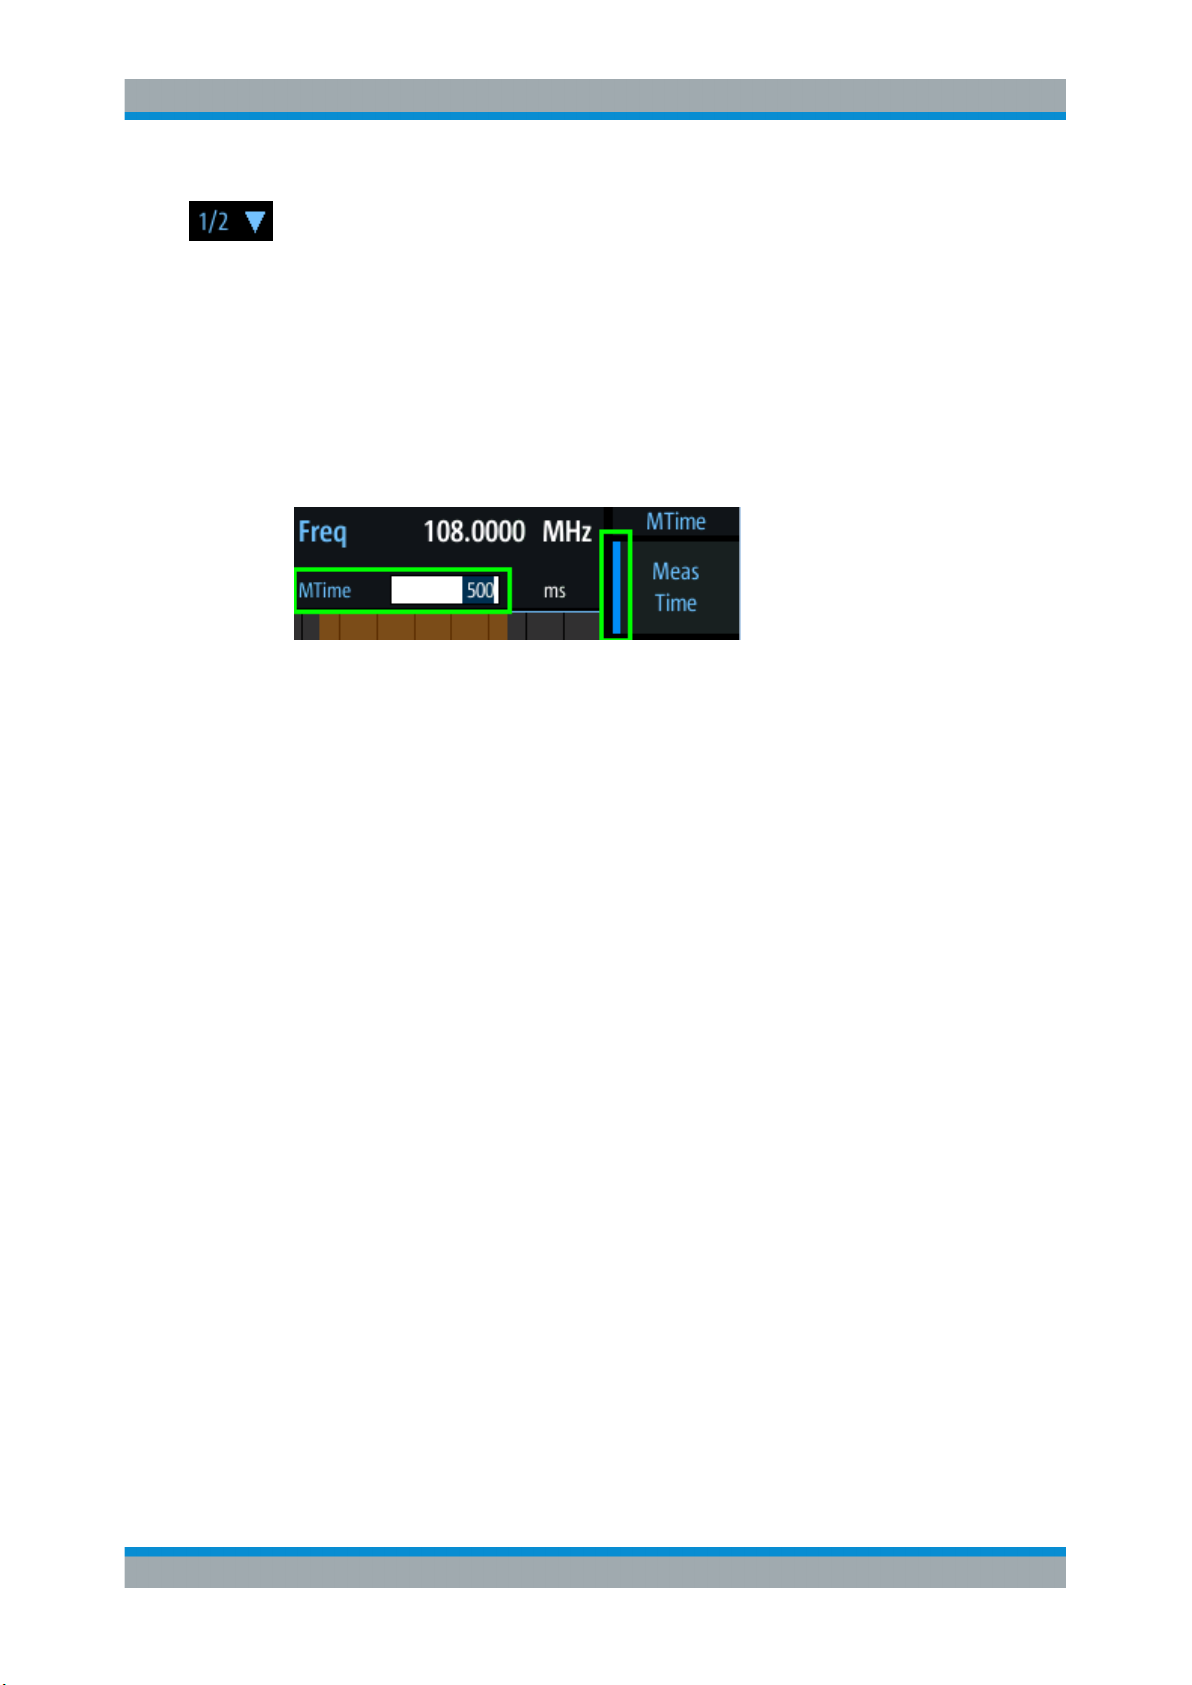
Measurement time (MTime)
The duration of a single measurement. See Chapter 6.1.4.4, "Setting the Measurement
Time (MTime)", on page 55.
32User Manual 1178.6410.02 ─ 06
Page 33

R&S®EVSF1000
5 Configuring the Input Signal and Measure-
5.1 Input Signal Settings
Configuring the Input Signal and Measurement Mode
Receiver Board
ment Mode
The following settings are common to all measurement modes. They define which data
is measured and how, and are indicated at the top of the measurement window.
● Input Signal Settings............................................................................................... 33
● Receiver Board....................................................................................................... 33
● Measurement Mode................................................................................................ 34
Access VNC: [n] > [F1]
The following settings configure the receiver signal to be measured by the
R&S EVSF1000.
Correction RX 1 In.........................................................................................................33
Correction RX 2 In.........................................................................................................33
Correction RX 1 In
Configures the correction of the RX 1 input signal (in dB).
This value is subtracted from all levels and compensates effects of upstream lines and
attenuators.
Correction RX 2 In
Configures the correction of the RX 2 input signal (in dB).
This value is subtracted from all levels and compensates effects of upstream lines and
attenuators.
5.2 Receiver Board
If a second receiver board is installed (requires the R&S EVSG-B1 option), each
receiver board can be configured to perform different measurement tasks.
33User Manual 1178.6410.02 ─ 06
Page 34

R&S®EVSF1000
5.3 Measurement Mode
Configuring the Input Signal and Measurement Mode
Measurement Mode
To select the receiver board via VNC
1. Press the [m] key on the remote keyboard.
2. Press the [PAGE UP] or [PAGE DOWN] keys to toggle between the "RX Unit 1"
and "RX Unit 2".
3. Press [Enter] to confirm the selection.
Remote command:
CH on page 189
The measurement mode determines the type of signal for which the measurement is
performed (see Chapter 4, "Measurements and Results", on page 30).
To select a measurement mode via VNC
1. Press the [m] key on the remote keyboard.
2. Select the required measurement mode using the arrow keys.
3. Press [Enter] to confirm the selection.
Remote commands:
MODE_LOC on page 210
MODE_GP on page 210
MODE_MB on page 233
MODE_VOR on page 240
MODE_COM on page 248
MODE_FSCAN on page 270
MODE_IFSPECT on page 275
MODE_FFT on page 279
MODE_SCOPE on page 285
34User Manual 1178.6410.02 ─ 06
Page 35

R&S®EVSF1000
6 Numeric Measurement Modes
6.1 ILS Localizer and ILS Glidepath (GP) Modes
Numeric Measurement Modes
ILS Localizer and ILS Glidepath (GP) Modes
● ILS Localizer and ILS Glidepath (GP) Modes......................................................... 35
● ILS Marker Beacon Mode (Option R&S EVSG-K3)................................................ 56
● VOR Mode (Option R&S EVSG-K2)....................................................................... 66
● COM Mode (Option R&S EVSG-K6).......................................................................84
Access VNC: [m] > Down arrow key
The ILS Localizer and Glidepath measurements demodulate the AM components of
the ILS signal and calculate characteristic parameters such as the modulation depth
and frequency or phase for specific components. Furthermore, an FFT is performed on
all components of the AF signal. The resulting AF spectrum allows you to measure the
required components and their distortions (harmonics).
Remote command:
MODE_LOC on page 210
MODE_GP on page 210
● Localizer Basics...................................................................................................... 35
● Glide Slope Basics..................................................................................................36
● ILS Localizer and Glidepath Measurements and Results....................................... 37
● ILS Localizer and Glidepath Configuration..............................................................48
6.1.1 Localizer Basics
The localizer transmitter is located near the end of the runway (nearest to the start of
the aircraft approach). Typically, horizontally aligned antennas transmit two intersecting
main beams beside one another at carrier frequencies between 108 MHz and
112 MHz. As seen from the approaching aircraft coming in for a landing, the left beam
is usually modulated at 90 Hz and the right beam at 150 Hz.
The information on position is provided after demodulation of the beam signals by evaluating the difference in depth of modulation (DDM).
DDM = m(x90) – m(x150)
The following scenarios are possible:
●
Predominance of the 90 Hz beam: the aircraft is too far to the left and must turn to
the right
●
Predominance of the 150 Hz beam: the aircraft is too far to the right and must turn
to the left
●
The signal strength from both beams is equal: the aircraft is in the center, on the
right course.
35User Manual 1178.6410.02 ─ 06
Page 36

R&S®EVSF1000
Numeric Measurement Modes
ILS Localizer and ILS Glidepath (GP) Modes
Course and clearance signals
The landing path is divided into the region further away from the runway, referred to as
the course, and the runway itself, referred to as the clearance. Localizers are positioned in both areas, however they transmit their ILS signals using different frequencies, one that must travel farther, one for close-up. The frequencies differ only in a few
kiloherz. The aircraft always receives both signals, and cannot (and need not) distinguish the two. However, for test purposes, it can be useful to measure the signals individually.
Morse code identification signal
The localizer not only allows the aircraft to determine its position, it also provides identification of the ILS transmitter. The localizer periodically transmits a Morse code at
1020 Hz which uniquely identifies the transmitter. The receiver thus knows the ILS is
operating correctly and that it is receiving the correct signal. The glide slope station
does not transmit an identification signal.
6.1.2 Glide Slope Basics
The following description is taken from the Rohde & Schwarz Application Note
1MA193: "Aeronautical radio navigation measurement solutions".
The glide slope transmitter is located near the end of the runway (nearest to the start of
the aircraft approach).
Figure 6-1: Approach navigation using instrument landing system (ILS)
36User Manual 1178.6410.02 ─ 06
Page 37

R&S®EVSF1000
Numeric Measurement Modes
ILS Localizer and ILS Glidepath (GP) Modes
Typically, vertically aligned antennas transmit two intersecting main beams on top of
one another at carrier frequencies between 329 MHz and 335 MHz. The top beam is
usually modulated at 90 Hz and the beam below at 150 Hz.
The information on position is provided after demodulation of the beam signals by evaluating the difference in depth of modulation (DDM). The following scenarios are possible:
●
Predominance of the 90 Hz beam: the aircraft is too high and must descend
●
Predominance of the 150 Hz beam: the aircraft is too low and needs to climb
●
The signal strength from both beams is equal: the aircraft is in the center, on the
right course.
If there is a predominance of the 90 Hz beam, then the aircraft is too high and must
descend. A predominant 150 Hz means that the aircraft is too low and needs to climb.
6.1.3 ILS Localizer and Glidepath Measurements and Results
A single receiver board in the R&S EVSF1000 can measure data at two different
receiver frequencies at the same time. Therefore, the ILS Localizer and Glidepath
measurements can detect both course and clearance data simultaneously, and display
the individual results. Alternatively, the individual channels can be measured only, or
any one or two user-defined frequencies. By default, a wideband measurement is performed to obtain an initial overview of the input signal and determine the basic signal
characteristics. The displayed measurement results depend on the selected channel
and frequency configuration.
Due to the large amount of different signal parameters, the ILS Localizer and Glidepath
measurements provide multiple views for the measurement results.
37User Manual 1178.6410.02 ─ 06
Page 38

R&S®EVSF1000
Numeric Measurement Modes
ILS Localizer and ILS Glidepath (GP) Modes
You can display graphical results directly from the ILS Localizer or Glidepath mode by
selecting the softkey in the "Meas" menu. In this case, the settings for the current measurement are applied to the graphical results.
To return from the graphical results to the ILS Localizer or Glidepath mode, select
"Return" ([F8]).
For details on the graphical results, see:
●
Chapter 7.1, "RF Spectrum Mode (Option R&S EVSG-K10)", on page 94
●
Chapter 7.2, "IF Spectrum Mode (Option R&S EVSG-K10)", on page 98
●
Chapter 7.3, "AF Spectrum Mode (Option R&S EVSG-K11)", on page 103
●
Chapter 7.4, "AF Time Domain Mode (Option R&S EVSG-K12)", on page 108
Remote command:
VIEW_LLZ on page 216
● RF Level and Frequency Display............................................................................38
● IF Spectrum Preview...............................................................................................39
● ILS Localizer and Glidepath Main View.................................................................. 40
● ILS Localizer Distortion View.................................................................................. 42
● ILS Localizer ID Analysis View................................................................................45
● ILS Localizer Recording View................................................................................. 48
6.1.3.1 RF Level and Frequency Display
The measured RF power and frequency of the input signal is displayed both numerically and graphically.
Figure 6-2: RF level display
The following results are provided:
●
Numeric power level in dBm ("Lev")
For measurements on two frequencies: individual and sum power levels
●
Measured frequency offset to the nominal frequency in kHz
●
Numeric frequency offset of measured power
●
Bargraph indicating the power and a color-coded overload state, where:
– red: overload state, check message
– yellow: power approaching overload state
38User Manual 1178.6410.02 ─ 06
Page 39

R&S®EVSF1000
Numeric Measurement Modes
ILS Localizer and ILS Glidepath (GP) Modes
– green: power in a valid range
●
If applicable: overload messages
Overload messages
The following messages indicate an overload:
●
"RF Overload"
Overload of the input mixer or of the analog IF path.
●
"IF Overload"
Overload of the IF signal.
●
"ADC Overload"
The dynamic range of the AD-converter is exceeded (clipping).
A combination of these overloads is also possible.
In all cases, set the RF attenuation to normal or low distortion (for RF input), or reduce
the input level.
Remote commands to retrieve results:
LA? on page 186
FMEAS on page 246
RFCH on page 187
GET_MEASFREQ on page 252
GET_TX1_MEASFREQ on page 255
GET_TX2_MEASFREQ on page 257
GET_TX1_LEVEL on page 255
GET_TX2_LEVEL on page 256
6.1.3.2 IF Spectrum Preview
A preview of the measured spectrum (power level vs. frequency) for the IF (intermediate frequency) signal is provided. The center frequency is the nominal channel frequency. The frequency range shows the measured bandwidth. The power range is
selected such that the noise level remains visible.
Figure 6-3: IF spectrum preview
39User Manual 1178.6410.02 ─ 06
Page 40

R&S®EVSF1000
6.1.3.3 ILS Localizer and Glidepath Main View
Numeric Measurement Modes
ILS Localizer and ILS Glidepath (GP) Modes
This preview spectrum allows you to check if the current measurement settings are
appropriate, such as the bandwidth or frequency offsets. For a larger, more detailed
spectrum diagram, select one of the graphical Spectrum modes. If you switch to such a
mode directly from a numeric measurement mode, the current measurement settings
are applied to the spectrum automatically.
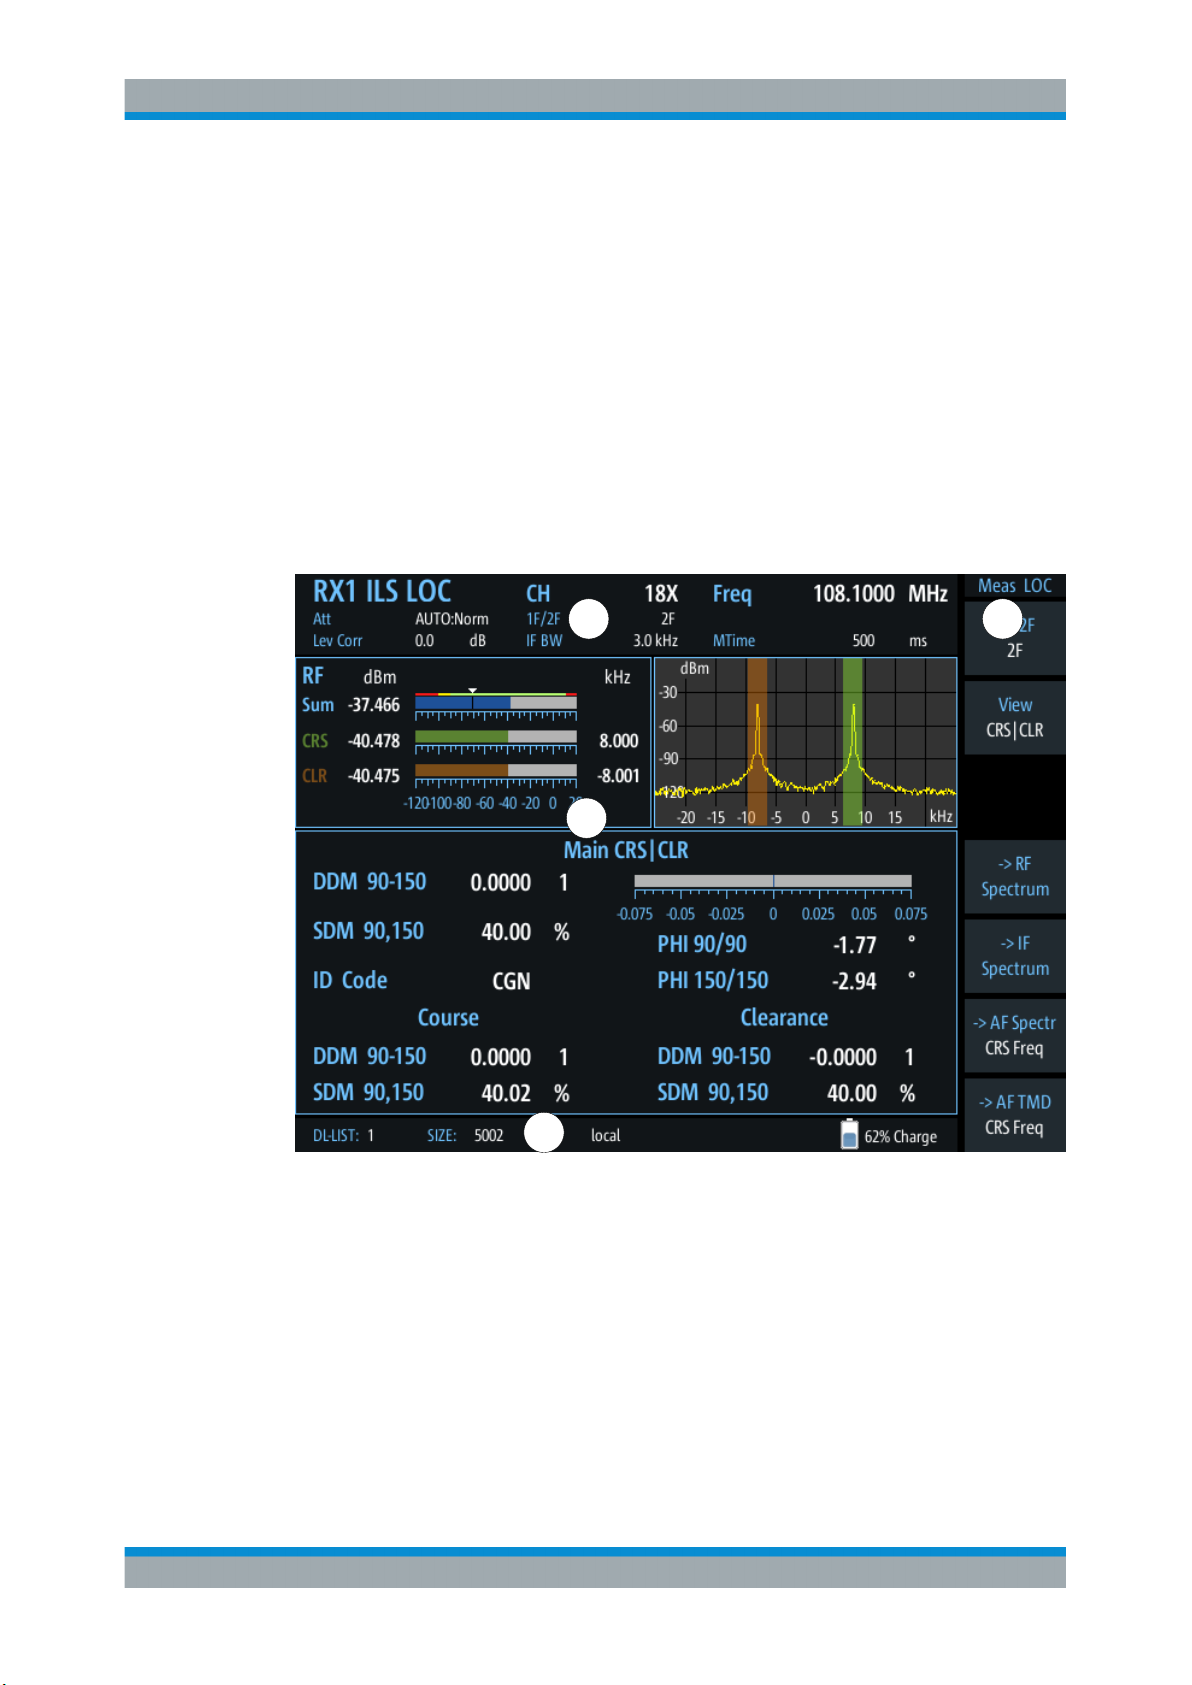
The ILS Localizer and Glidepath Main view provides the following results:
Figure 6-4: ILS Localizer Main view
40User Manual 1178.6410.02 ─ 06
Page 41

R&S®EVSF1000
Numeric Measurement Modes
ILS Localizer and ILS Glidepath (GP) Modes
Figure 6-5: ILS Glidepath Main view
DDM 90-150..................................................................................................................41
SDM 90,150.................................................................................................................. 41
AM 90 Hz...................................................................................................................... 42
Freq 90 Hz.................................................................................................................... 42
AM 150 Hz.................................................................................................................... 42
Freq 150 Hz.................................................................................................................. 42
ID Code.........................................................................................................................42
PHI 90/150.................................................................................................................... 42
DDM 90-150
Difference in depth of modulation (DDM) between 90 Hz and 150 Hz AM signal (m
– m
150 Hz
)
90 Hz
Note: The DDM value is also displayed graphically as a bargraph for quick evaluation.
Remote command:
DD0 on page 225
DD1 on page 225
DCLR on page 224
DCRS on page 224
SDM 90,150
Sum in Depth of Modulation (SDM); arithmetic sum of the modulation depth of the
90 Hz and the 150 Hz components without any influence of the phase between the
components.
41User Manual 1178.6410.02 ─ 06
Page 42

R&S®EVSF1000
Numeric Measurement Modes
ILS Localizer and ILS Glidepath (GP) Modes
Remote command:
SD0 on page 228
SD1 on page 228
SCLR on page 227
SCRS on page 228
AM 90 Hz
AM modulation depth of 90 Hz ILS component
Remote command:
AM2 on page 223
AM2CLR on page 223
AM2CRS on page 223
Freq 90 Hz
AF frequency of 90 Hz ILS component
Remote command:
AF2 on page 222
AM 150 Hz
AM modulation depth of 150 Hz ILS component
Remote command:
AM3 on page 223
AM3CLR on page 223
AM3CRS on page 224
Freq 150 Hz
AF frequency of 150 Hz ILS component
Remote command:
AF3 on page 222
ID Code
Morse-decoded ID with three or four letters.
Remote command:
AC8 on page 222
AC8 on page 244
PHI 90/150
Phase angle measurement between 90 Hz and 150 Hz AM signal (90 Hz = reference
signal); measurement range: ±60 degrees
Remote command:
PH on page 227
6.1.3.4 ILS Localizer Distortion View
The ILS Localizer Dist view comprises all measurement parameters for the determination of the distortion factors for the 90 Hz / 150 Hz signal components.
42User Manual 1178.6410.02 ─ 06
Page 43

R&S®EVSF1000
Numeric Measurement Modes
ILS Localizer and ILS Glidepath (GP) Modes
Figure 6-6: ILS Localizer Distortion view
AM 90 Hz...................................................................................................................... 43
K2 90 Hz....................................................................................................................... 43
K3 90 Hz....................................................................................................................... 44
K4 90 Hz....................................................................................................................... 44
THD 90 Hz.................................................................................................................... 44
Res. FM 90....................................................................................................................44
AM 150 Hz.................................................................................................................... 44
K2 150 Hz..................................................................................................................... 44
K3 150 Hz..................................................................................................................... 44
K4 150 Hz..................................................................................................................... 45
THD 150 Hz.................................................................................................................. 45
Res. FM 150..................................................................................................................45
AM (90+150)................................................................................................................. 45
AM 90 Hz
AM modulation depth of 90 Hz ILS component
Remote command:
AM2 on page 223
AM2CLR on page 223
AM2CRS on page 223
K2 90 Hz
Distortion 2nd order, 90 Hz signal
43User Manual 1178.6410.02 ─ 06
Page 44

R&S®EVSF1000
Numeric Measurement Modes
ILS Localizer and ILS Glidepath (GP) Modes
Remote command:
K2_90 on page 226
K3 90 Hz
Distortion 3rd order, 90 Hz signal
Remote command:
K3_90 on page 226
K4 90 Hz
Distortion 4th order, 90 Hz signal
Remote command:
K4_90 on page 226
THD 90 Hz
Total Harmonic Distortion (THD), 90 Hz signal
Remote command:
THD_90 on page 228
Res. FM 90
Residual frequency modulation for 90 Hz signal
Configure the filter to be used using "Res. FM Filt. (ILS only)" on page 54.
AM 150 Hz
AM modulation depth of 150 Hz ILS component
Remote command:
AM3 on page 223
AM3CLR on page 223
AM3CRS on page 224
K2 150 Hz
Relative amplitude of an AF signal's second harmonic, calculated as:
<amplitude of second harmonic> / <amplitude of fundamental>
For 90 Hz + 150 Hz:
<mean amplitude of second harmonics> / <mean amplitude of fundamentals>
Remote command:
K2_150 on page 225
K3 150 Hz
Relative amplitude of an AF signal's third harmonic, calculated as:
<amplitude of third harmonic> / <amplitude of fundamental>
For 90 Hz + 150 Hz:
<mean amplitude of third harmonics> / <mean amplitude of fundamentals>
Remote command:
K3_150 on page 226
44User Manual 1178.6410.02 ─ 06
Page 45

R&S®EVSF1000
Numeric Measurement Modes
ILS Localizer and ILS Glidepath (GP) Modes
K4 150 Hz
Relative amplitude of the fourth harmonic for the 150 Hz signal component
Remote command:
K4_150 on page 226
THD 150 Hz
Total Harmonic Distortion (THD) for the 150 Hz signal component
Remote command:
THD_150 on page 228
Res. FM 150
Residual frequency modulation for 150 Hz signal
AM (90+150)
Total AM modulation depth of the 90 Hz and the 150 Hz components, taking the phase
between the components into account.
6.1.3.5 ILS Localizer ID Analysis View
The ILS Localizer ID Analysis view provides the following results.
This view is not available for clearance (CLR) signals in two-frequency systems.
45User Manual 1178.6410.02 ─ 06
Page 46

R&S®EVSF1000
Numeric Measurement Modes
ILS Localizer and ILS Glidepath (GP) Modes
Figure 6-7: ID Analysis view
DDM 90-150..................................................................................................................46
Last ID...........................................................................................................................46
ID Code.........................................................................................................................47
ID Period....................................................................................................................... 47
Dot Length.....................................................................................................................47
Dash Length..................................................................................................................47
Dot-Dash Gap............................................................................................................... 47
Letter Gap..................................................................................................................... 47
ID AM............................................................................................................................ 47
ID Freq.......................................................................................................................... 47
DDM 90-150
Difference in depth of modulation (DDM) between 90 Hz and 150 Hz AM signal (m
– m
150 Hz
)
90 Hz
Note: The DDM value is also displayed graphically as a bargraph for quick evaluation.
Remote command:
DD0 on page 225
DD1 on page 225
DCLR on page 224
DCRS on page 224
Last ID
Time since last ID pulse was measured
46User Manual 1178.6410.02 ─ 06
Page 47

R&S®EVSF1000
Numeric Measurement Modes
ILS Localizer and ILS Glidepath (GP) Modes
Remote command:
LASTID_TIME on page 230
ID Code
Morse-decoded ID with three or four letters.
Remote command:
AC8 on page 222
AC8 on page 244
ID Period
Time between two measured ID pulses
Remote command:
ID_PERIOD on page 229
Dot Length
Length of time a dot is transmitted in the used Morse code in milliseconds.
Remote command:
ID_DOT_LENGTH on page 229
Dash Length
Length of time a dash is transmitted in the used Morse cod in milliseconds.
Remote command:
ID_DASH_LENGTH on page 229
Dot-Dash Gap
Length of time that passes between a transmitted dot and a dash in the used Morse
code in milliseconds.
Remote command:
ID_DOTDASH_GAP on page 229
Letter Gap
Length of time that passes between two transmitted letters in the used Morse code in
milliseconds.
Remote command:
ID_LETTER_GAP on page 229
ID AM
AM Modulation depth of identifier signal (default: 1020 Hz).
Remote command:
AM8 on page 224
AM8 on page 245
ID Freq
Frequency of the morse signal.
Remote command:
AF8 on page 223
AF8 on page 244
47User Manual 1178.6410.02 ─ 06
Page 48

R&S®EVSF1000
6.1.3.6 ILS Localizer Recording View
Numeric Measurement Modes
ILS Localizer and ILS Glidepath (GP) Modes
The Recording view displays the recorded data for ILS Localizer measurements from
the selected data list (see "List" on page 163). If available, the stored GPS data from
the GPS receiver is also displayed.
Which measurement results are stored is described in the remote commands, see
GETDATADEF on page 294.
The individual measurement results are described in the result views.
For details on data logging see Chapter 10.2, "Recording Measurement Data",
on page 161.
Remote commands to retrieve data:
GETDATADEF on page 294
GETDATASET on page 294
6.1.4 ILS Localizer and Glidepath Configuration
The following settings are available for the ILS Localizer and Glidepath measurements.
48User Manual 1178.6410.02 ─ 06
Page 49

R&S®EVSF1000
6.1.4.1 Channel and Frequency Configuration
Numeric Measurement Modes
ILS Localizer and ILS Glidepath (GP) Modes
Settings for recording, including trigger settings, are described in Chapter 10.2,
"Recording Measurement Data", on page 161.
● Channel and Frequency Configuration................................................................... 49
● Ampt........................................................................................................................52
● Bandwidth (BW)...................................................................................................... 53
● Setting the Measurement Time (MTime).................................................................55
● DDM and SDM Configuration..................................................................................55
The ILS Localizer and Glidepath measurements can detect both course and clearance
carriers simultaneously. Alternatively, the individual carriers can be measured only, or
any one or two user-defined frequencies. By default, a wideband measurement is performed. The available measurement settings depend on the selected channel and frequency configuration.
● Channel Setup........................................................................................................ 49
● Carrier Configuration (1F/2F Config).......................................................................50
● Channel Frequency Configuration (CH FREQ).......................................................51
Channel Setup
Access VNC: [m] > [F1]
1F/2F
Selects the number of frequencies or channels to be measured.
"1F"
"2F"
"2F CRS"
One frequency only is measured, namely the nominal frequency,
which is also the center frequency.
The nominal frequency is configured by the Channel Frequency Con-
figuration (CH FREQ) settings.
Two frequencies are measured at the same time. Which frequencies
are measured is configured by the Channel Frequency Configuration
(CH FREQ) settings.
The numeric results are calculated as the sum of both frequencies. In
the RF Level display, the individual carriers are also indicated. In the
RF Spectrum preview, both carriers are displayed.
Both the course and clearance frequencies are measured simultaneously. The results for both frequencies, as well as the sum of both,
are displayed in the RF Level display. Both frequencies are displayed
in the RF Spectrum preview. The numeric results are displayed for
the course frequency. To view the results for the clearance frequency,
switch to "2F CLR"
Note: Depending on the ILS system and the country, the course can
be the upper or lower frequency (see "Upper Freq" on page 51).
49User Manual 1178.6410.02 ─ 06
Page 50

R&S®EVSF1000
Numeric Measurement Modes
ILS Localizer and ILS Glidepath (GP) Modes
"2F CLR"
"Wide"
Remote command:
MEASMODE on page 230
Carrier Configuration (1F/2F Config)
Access VNC: [s] > "F1"
Configures the carriers and frequencies for measurements on a single or two frequencies (not wideband). Which settings are available depends on the "1F/2F" on page 49.
CRS/CLR Carr.............................................................................................................. 50
Course...........................................................................................................................50
Clearance......................................................................................................................51
1F Offset........................................................................................................................51
Find Carrier................................................................................................................... 51
Carrier Thresh...............................................................................................................51
Upper Freq....................................................................................................................51
Both the course and clearance frequencies are measured simultaneously. The results for both frequencies, as well as the sum of both,
are displayed in the RF Level display. Both frequencies are displayed
in the RF Spectrum preview. The numeric results are displayed for
the course frequency. To view the results for the course frequency,
switch to "2F CRS".
Note: Depending on the ILS system and the country, the course can
be the upper or lower frequency (see "Upper Freq" on page 51).
A wideband measurement is performed around the nominal frequency. The frequency range is defined by the BW Wide ).
CRS/CLR Carr
Defines whether the course and clearance carriers are determined automatically or
manually.
For automatic determination, both carriers are determined automatically and continuously during the entire measurement.
You can define a threshold (Carrier Thresh) by which the power level for a carrier must
change before the carrier frequency is adapted. The other settings that define the frequencies are disabled.
For manual determination, you must specify the frequencies as offsets to either direction of the nominal frequency.
Remote command:
LLZ_DEMFREQS_OFFSET_AUTOMAN on page 213
LLZ_DEMFREQS_OFFSET_LOWERFREQ on page 213
LLZ_DEMFREQS_OFFSET_UPPERFREQ on page 214
GS_DEMFREQS_OFFSET_AUTOMAN on page 219
GS_DEMFREQS_OFFSET_LOWERFREQ on page 219
GS_DEMFREQS_OFFSET_UPPERFREQ on page 220
Course
Defines the course carrier as a frequency offset from the nominal frequency.
50User Manual 1178.6410.02 ─ 06
Page 51

R&S®EVSF1000
Numeric Measurement Modes
ILS Localizer and ILS Glidepath (GP) Modes
Clearance
Defines the clearance carrier as a frequency offset from the nominal frequency in the
opposite direction to the course carrier.
1F Offset
For single frequency measurements only:
Defines an offset of the measured frequency to the nominal frequency.
Remote command:
LLZ_DEMFREQS_OFFSET_1F on page 213
GS_DEMFREQS_OFFSET_1F on page 219
Find Carrier
For manual carrier determination only:
Determines the carrier frequencies automatically, but only once. The frequencies do
not change automatically if the input signal changes.
Remote command:
LLZ_START_FINDCARRIER on page 214
GS_START_FINDCARRIER on page 220
Carrier Thresh
Defines a threshold for automatic carrier determination (once or continuously). The
measured power level at a frequency other than the current carrier must exceed this
level before the carrier frequency is adapted. This is useful for noisy or unstable signals so the carrier frequencies do not change unnecessarily often due to minor disturbances.
Remote command:
GS_CARRIER_THRESHOLD_DB on page 217
LLZ_CARRIER_THRESHOLD_DB on page 211
Upper Freq
The course and clearance carriers are defined as offsets to either side of the center
frequency. Which frequency is considered to be the course carrier - the upper or lower
frequency - depends on the used standard and the country it is used in. Thus, you can
swap the carrier definition if necessary.
Remote command:
SETUP:UNIT:UPPERFREQ on page 192
Channel Frequency Configuration (CH FREQ)
Access VNC: [q]
The channel frequency determines the nominal frequency at which the measurement is
performed. For some avionics standards, the channels are associated with specific frequencies. (See Chapter A, "ILS Channel Frequency List", on page 302 and Chapter B,
"VOR Channel Frequency List", on page 304.)
CH.................................................................................................................................52
Freq...............................................................................................................................52
Step Size.......................................................................................................................52
51User Manual 1178.6410.02 ─ 06
Page 52

R&S®EVSF1000
Numeric Measurement Modes
ILS Localizer and ILS Glidepath (GP) Modes
CH
Sets the receiver frequency channel on the active receiver board according to the
ICAO frequency list.
Remote command:
RFCH on page 187
Freq
Sets the nominal frequency for the measurement. By default, this frequency is also
assumed to be the center frequency for spectrum displays, unless an offset is defined.
For measurements on two frequencies, the frequencies are defined as offsets to this
nominal frequency.
Remote command:
RF on page 187
Step Size
Defines the frequency step size for the rotary knob when setting the frequency.
In many avionics signals, channels are assigned to frequencies with a fixed offset. By
setting the step size of the rotary knob to the fixed offset, you can easily scroll through
the signal's channel frequencies using the rotary knob. Thus, for example, you can
analyze the measurement results for one channel after the other simply by changing
the selected channel frequency with the rotary knob.
The default step size for ILS/VOR mode is 50 kHz.
Remote command:
GS_DEFAULT_FREQSTEP on page 218
6.1.4.2 Ampt
Access VNC: [w]
The following settings define the amplification for the input signal.
RF Att............................................................................................................................52
RF Mode....................................................................................................................... 53
Transducer Correction...................................................................................................53
RF Att
Determines how the attenuation of the RF signal is defined. The attenuation should be
adjusted such that the measured power level remains in the valid level range (indicated
by the green area of the bargraph, see Chapter 6.1.3.1, "RF Level and Frequency Dis-
play", on page 38). Note that the valid level range depends on the selected measure-
ment mode.
"Manual"
The RF attenuation mode is specified manually (see "RF Mode"
on page 53).
52User Manual 1178.6410.02 ─ 06
Page 53

R&S®EVSF1000
Numeric Measurement Modes
ILS Localizer and ILS Glidepath (GP) Modes
"Auto"
Remote command:
SETATTMODE on page 187
SCOPE_ATTMODE on page 285
FFT_ATTMODE on page 279
IFSPECT_ATTMODE on page 275
RF Mode
Defines the RF attenuation mode to be used.
"Low Noise"
"Norm"
"Low Dist"
Remote command:
SETATTMODE on page 187
FSCAN_ATTMODE on page 270
SCOPE_ATTMODE on page 285
FFT_ATTMODE on page 279
IFSPECT_ATTMODE on page 275
GBAS:ATTMODE on page 258
The RF attenuation mode is selected automatically.
The signal attenuation is selected automatically according to the signal strength.
This mode works best with clean signals. In difficult receiving conditions, the "Low Noise", "Normal" or "Low Distortion" modes can be
more stable.
When monitoring signals with mostly constant signal levels, it is also
recommended that you use the "Low Noise", "Normal" or "Low Distortion" mode.
If the R&S EVSF1000 has to adapt the attenuation frequently, indicated by a frequent clicking noise from the attenuator, spikes can occur
in the trace.
15 dB pre-amplification
Provides a high sensitivity. Suitable when scanning the area for distant signals.
0 dB
Provides a normal sensitivity.
15 dB attenuation
Provides a low sensitivity. Suitable when analyzing a nearby signal, to
avoid overload due to high-level signals.
Transducer Correction
Configures the level correction. The specified value is added to the measured power
levels to compensate for an inherent offset by the measurement setup, for example the
antenna.
6.1.4.3 Bandwidth (BW)
Access VNC: [e]
The bandwidth determines the frequency range for which the measurement is performed. Depending on the measurement mode, and whether a wideband or a specific
frequency is measured, different settings are available.
53User Manual 1178.6410.02 ─ 06
Page 54

R&S®EVSF1000
Numeric Measurement Modes
ILS Localizer and ILS Glidepath (GP) Modes
BW Wide
Specifies the filter bandwidth for wideband measurements.
Remote command:
LLZ_DEM_WIDE_BW on page 212
GS_DEM_WIDE_BW on page 218
BW 1F/2F
Specifies the filter bandwidth for measurements at one or two specific frequencies.
Figure 6-8: Bandwidth Settings - 1F/2F
Remote command:
LLZ_DEM_1F2F_BW on page 213
GS_DEM_1F2F_BW on page 218
BW Dist/ID
Specifies the filter bandwidth for distortion and ID measurements.
Remote command:
LLZ_DEM_ID_BW on page 212
Res. FM Filt. (ILS only)
Defines the filter type used to determine residual FM (see Chapter 6.1.3.4, "ILS Local-
izer Distortion View", on page 42).
"ICAO"
"Narrow"
Filter according to ICAO specification
Narrow filter; the DDM filters used to determine the 90 Hz/ 150 Hz
modulation values are used to avoid interference between the signals
54User Manual 1178.6410.02 ─ 06
Page 55

R&S®EVSF1000
6.1.4.4 Setting the Measurement Time (MTime)
Numeric Measurement Modes
ILS Localizer and ILS Glidepath (GP) Modes
Remote command:
FILTER_LLZ_RESIDFM on page 214
Access VNC: [d]
The measurement time determines the interval at which new measurement results are
displayed. Internally, values are captured every 100 ms, that is: 10 per second. (With
the High Measurement Rate option R&S EVSG-K22 installed, the internal capture rate
is 10 ms, that is: 100 per second.) If the defined measurement time is longer, the values captured internally in that interval are averaged and only the average value is displayed.
Note that the measurement time determines the minimum interval for values to be
stored during recording (see "Time" on page 164).
Enter the time in milliseconds.
Remote command:
MEASTIME on page 186
6.1.4.5 DDM and SDM Configuration
The following settings configure the DDM and SDM measurement results.
DDM Unit.......................................................................................................................55
SDM Unit.......................................................................................................................55
ILS Phase......................................................................................................................55
DDM Polarity.................................................................................................................56
DDM Bargr.................................................................................................................... 56
DDM Unit
Specifies the unit of the DDM display.
1 (dimensionless value) | % | μA
Remote command:
SETUP:UNIT:DDM on page 190
SDM Unit
Specifies the unit of the SDM display.
1 (dimensionless value) | % | μA
Remote command:
SETUP:UNIT:SDM on page 192
ILS Phase
Specifies the value range in the ILS phase.
Bipolar: -60 … +60° | Unipolar: 0 … 120°
55User Manual 1178.6410.02 ─ 06
Page 56

R&S®EVSF1000
Numeric Measurement Modes
ILS Marker Beacon Mode (Option R&S EVSG-K3)
Remote command:
SETUP:UNIT:ILSPHASE on page 191
DDM Polarity
Specifies the DDM polarity.
90−150 | 150−90
Remote command:
SETUP:UNIT:POLARITYDDM on page 191
DDM Bargr
Configures the scaling of the DDM bargraph.
0.075 | 0.150 | 0.400 (dimensionless)
Remote command:
SETUP:UNIT:BARGRAPH on page 190
6.2 ILS Marker Beacon Mode (Option R&S EVSG-K3)
Access VNC: [m] > Down arrow key
Remote command:
MODE_MB on page 233
● Basics on Marker Beacons..................................................................................... 56
● ILS Marker Beacon Measurements and Results.....................................................57
● Configuring ILS Marker Beacon Measurements..................................................... 63
6.2.1 Basics on Marker Beacons
Marker beacon (MB) receivers are used for a rough distance measurement. They are
available only for some ILS installations.
56User Manual 1178.6410.02 ─ 06
Page 57

R&S®EVSF1000
Numeric Measurement Modes
ILS Marker Beacon Mode (Option R&S
EVSG-K3)
Figure 6-9: Marker beacon placement with respect to runway
Marker beacon receivers decode audio and provide signaling output to identify one of
three marker beacons installed near the runway. They transmit a narrow beam width at
75 MHz carrier frequency in a vertical direction. Each of them has a different distinct
modulation code to allow the receiver to identify which one it is flying over.
Both visual (color of the marker beacon) and audio tone identification is supported for
determining which marker has been flown over. The audio/visual pairing of marker beacons is as follows:
●
Outer marker flashes BLUE in the cockpit at 400 Hz (“relaxed” tone).
●
Middle marker flashes AMBER in the cockpit at 1300 Hz (“hurried” tone).
●
Inner marker flashes WHITE in the cockpit at 3000 Hz (“urgent” tone).
6.2.2 ILS Marker Beacon Measurements and Results
The ILS Marker Beacon measurement provides multiple views for the measurement
results.
57User Manual 1178.6410.02 ─ 06
Page 58

R&S®EVSF1000
Numeric Measurement Modes
ILS Marker Beacon Mode (Option R&S
EVSG-K3)
You can display graphical results directly from the ILS Marker Beacon mode by selecting the softkey in the "Meas" menu. In this case, the settings for the current measurement are applied to the graphical results.
To return from the graphical results to the ILS Marker Beacon mode, select "Return"
([F8]).
For details on the graphical results, see:
●
Chapter 7.1, "RF Spectrum Mode (Option R&S EVSG-K10)", on page 94
●
Chapter 7.2, "IF Spectrum Mode (Option R&S EVSG-K10)", on page 98
●
Chapter 7.3, "AF Spectrum Mode (Option R&S EVSG-K11)", on page 103
●
Chapter 7.4, "AF Time Domain Mode (Option R&S EVSG-K12)", on page 108
Remote command:
VIEW_MB on page 235
● RF Level and Frequency Display............................................................................58
● IF Spectrum Preview...............................................................................................59
● ILS Marker Beacon Main View................................................................................60
● ILS Marker Beacon ID Analysis.............................................................................. 61
● ILS Marker Beacon Recording View....................................................................... 63
6.2.2.1 RF Level and Frequency Display
The measured RF power and frequency of the input signal is displayed both numerically and graphically.
Figure 6-10: RF level display
The following results are provided:
●
Numeric power level in dBm ("Lev")
For measurements on two frequencies: individual and sum power levels
●
Measured frequency offset to the nominal frequency in kHz
●
Numeric frequency offset of measured power
●
Bargraph indicating the power and a color-coded overload state, where:
– red: overload state, check message
– yellow: power approaching overload state
– green: power in a valid range
58User Manual 1178.6410.02 ─ 06
Page 59

R&S®EVSF1000
Numeric Measurement Modes
ILS Marker Beacon Mode (Option R&S EVSG-K3)
●
If applicable: overload messages
Overload messages
The following messages indicate an overload:
●
"RF Overload"
Overload of the input mixer or of the analog IF path.
●
"IF Overload"
Overload of the IF signal.
●
"ADC Overload"
The dynamic range of the AD-converter is exceeded (clipping).
A combination of these overloads is also possible.
In all cases, set the RF attenuation to normal or low distortion (for RF input), or reduce
the input level.
Remote commands to retrieve results:
LA? on page 186
FMEAS on page 246
RFCH on page 187
GET_MEASFREQ on page 252
GET_TX1_MEASFREQ on page 255
GET_TX2_MEASFREQ on page 257
GET_TX1_LEVEL on page 255
GET_TX2_LEVEL on page 256
6.2.2.2 IF Spectrum Preview
A preview of the measured spectrum (power level vs. frequency) for the IF (intermediate frequency) signal is provided. The center frequency is the nominal channel frequency. The frequency range shows the measured bandwidth. The power range is
selected such that the noise level remains visible.
Figure 6-11: IF spectrum preview
59User Manual 1178.6410.02 ─ 06
Page 60

R&S®EVSF1000
Numeric Measurement Modes
This preview spectrum allows you to check if the current measurement settings are
appropriate, such as the bandwidth or frequency offsets. For a larger, more detailed
spectrum diagram, select one of the graphical Spectrum modes. If you switch to such a
mode directly from a numeric measurement mode, the current measurement settings
are applied to the spectrum automatically.
6.2.2.3 ILS Marker Beacon Main View
The ILS Marker Beacon Main view provides the following results:
ILS Marker Beacon Mode (Option R&S
EVSG-K3)
AM 400 Hz.................................................................................................................... 60
Freq 400 Hz.................................................................................................................. 60
AM 1300 Hz.................................................................................................................. 61
Freq 1300 Hz................................................................................................................ 61
AM 3000 Hz.................................................................................................................. 61
Freq 3000 Hz................................................................................................................ 61
AM 400 Hz
AM modulation depth of the 400-Hz component
Remote command:
AM6 on page 236
Freq 400 Hz
Measured frequency of the 400-Hz component
Remote command:
AF6 on page 236
60User Manual 1178.6410.02 ─ 06
Page 61

R&S®EVSF1000
Numeric Measurement Modes
ILS Marker Beacon Mode (Option R&S EVSG-K3)
AM 1300 Hz
AM modulation depth of the 1300-Hz component
Remote command:
AM5 on page 236
Freq 1300 Hz
Measured frequency of the 1300-Hz component
Remote command:
AF5 on page 236
AM 3000 Hz
AM modulation depth of the 3000-Hz component
Remote command:
AM4 on page 236
Freq 3000 Hz
Measured frequency of the 3000-Hz component
Remote command:
AF4 on page 235
6.2.2.4 ILS Marker Beacon ID Analysis
Displays the results of the marker beacon signal id analysis.
61User Manual 1178.6410.02 ─ 06
Page 62

R&S®EVSF1000
Numeric Measurement Modes
ILS Marker Beacon Mode (Option R&S
400 Hz Dash................................................................................................................. 62
400 Hz Gap...................................................................................................................62
1300 Hz Dash............................................................................................................... 62
1300 Hz Dot.................................................................................................................. 62
1300 Hz Gap.................................................................................................................62
3000 Hz Dot.................................................................................................................. 62
3000 Hz Gap.................................................................................................................62
400 Hz Dash
Displays the length of a dash for the outer marker (in ms).
Remote command:
ID_F400_DASHLEN on page 237
400 Hz Gap
Displays the gap between two dashes for the outer marker (in ms).
Remote command:
ID_F400_GAP on page 238
1300 Hz Dash
Displays the length of a dash for the middle marker (in ms).
Remote command:
ID_F1300_DASHLEN on page 237
EVSG-K3)
1300 Hz Dot
Displays the length of a dot for the middle marker (in ms).
Remote command:
ID_F1300_DOTLEN on page 237
1300 Hz Gap
Displays the gap between dot and dash for the middle marker (in ms).
Remote command:
ID_F1300_GAP on page 238
3000 Hz Dot
Displays the length of a dot for the inner marker (in ms).
Remote command:
ID_F3000_DOTLEN on page 238
3000 Hz Gap
Displays the gap between two dashes for the inner marker (in ms).
Remote command:
ID_F3000_GAP on page 238
62User Manual 1178.6410.02 ─ 06
Page 63

R&S®EVSF1000
Numeric Measurement Modes
ILS Marker Beacon Mode (Option R&S
6.2.2.5 ILS Marker Beacon Recording View
The Recording view displays the recorded data for ILS Localizer measurements from
the selected data list (see "List" on page 163). If available, the stored GPS data from
the GPS receiver is also displayed.
EVSG-K3)
Which measurement results are stored is described in the remote commands, see
GETDATADEF on page 294.
The individual measurement results are described in the other ILS Marker Beacon
result views.
For details on data logging see Chapter 10.2, "Recording Measurement Data",
on page 161.
6.2.3 Configuring ILS Marker Beacon Measurements
The following settings are available for the ILS Marker Beacon measurement.
Settings for recording, including trigger settings, are described in Chapter 10.2,
"Recording Measurement Data", on page 161.
63User Manual 1178.6410.02 ─ 06
Page 64

R&S®EVSF1000
6.2.3.1 Setting the Receiver Frequency
Numeric Measurement Modes
ILS Marker Beacon Mode (Option R&S EVSG-K3)
For the mapping of hard- and softkey commands to keyboard commands using VNC,
see Table 3-2.
● Setting the Receiver Frequency..............................................................................64
● Ampt........................................................................................................................64
● Setting the Measurement Time (MTime).................................................................65
Access VNC: [q]
The receiver frequency determines the nominal frequency at which the measurement
is performed.
Freq...............................................................................................................................64
Step Size.......................................................................................................................64
Freq
Sets the nominal frequency for the measurement.
Remote command:
RF on page 187
Step Size
Defines the frequency step size for the rotary knob when setting the frequency.
The default step size for ILS MB mode is 50 kHz.
6.2.3.2 Ampt
Access VNC: [w]
The following settings define the amplification for the input signal.
RF Att............................................................................................................................64
RF Mode....................................................................................................................... 65
Transducer Correction...................................................................................................65
RF Att
Determines how the attenuation of the RF signal is defined. The attenuation should be
adjusted such that the measured power level remains in the valid level range (indicated
by the green area of the bargraph, see Chapter 6.1.3.1, "RF Level and Frequency Dis-
play", on page 38). Note that the valid level range depends on the selected measure-
ment mode.
"Manual"
The RF attenuation mode is specified manually (see "RF Mode"
on page 53).
64User Manual 1178.6410.02 ─ 06
Page 65

R&S®EVSF1000
Numeric Measurement Modes
ILS Marker Beacon Mode (Option R&S
"Auto"
Remote command:
SETATTMODE on page 187
SCOPE_ATTMODE on page 285
FFT_ATTMODE on page 279
IFSPECT_ATTMODE on page 275
RF Mode
Defines the RF attenuation mode to be used.
"Low Noise"
"Norm"
"Low Dist"
Remote command:
SETATTMODE on page 187
FSCAN_ATTMODE on page 270
SCOPE_ATTMODE on page 285
FFT_ATTMODE on page 279
IFSPECT_ATTMODE on page 275
GBAS:ATTMODE on page 258
The RF attenuation mode is selected automatically.
The signal attenuation is selected automatically according to the signal strength.
This mode works best with clean signals. In difficult receiving conditions, the "Low Noise", "Normal" or "Low Distortion" modes can be
more stable.
When monitoring signals with mostly constant signal levels, it is also
recommended that you use the "Low Noise", "Normal" or "Low Distortion" mode.
If the R&S EVSF1000 has to adapt the attenuation frequently, indicated by a frequent clicking noise from the attenuator, spikes can occur
in the trace.
15 dB pre-amplification
Provides a high sensitivity. Suitable when scanning the area for distant signals.
0 dB
Provides a normal sensitivity.
15 dB attenuation
Provides a low sensitivity. Suitable when analyzing a nearby signal, to
avoid overload due to high-level signals.
EVSG-K3)
Transducer Correction
Configures the level correction. The specified value is added to the measured power
levels to compensate for an inherent offset by the measurement setup, for example the
antenna.
6.2.3.3 Setting the Measurement Time (MTime)
Access VNC: [d]
The measurement time determines the interval at which new measurement results are
displayed. Internally, values are captured every 100 ms, that is: 10 per second. (With
the High Measurement Rate option R&S EVSG-K22 installed, the internal capture rate
65User Manual 1178.6410.02 ─ 06
Page 66

R&S®EVSF1000
Numeric Measurement Modes
VOR Mode (Option R&S
is 10 ms, that is: 100 per second.) If the defined measurement time is longer, the values captured internally in that interval are averaged and only the average value is displayed.
Note that the measurement time determines the minimum interval for values to be
stored during recording (see "Time" on page 164).
Enter the time in milliseconds.
Remote command:
MEASTIME on page 186
6.3 VOR Mode (Option R&S EVSG-K2)
Access VNC: [m] > Down arrow key
If the VOR Mode option (R&S EVSG-K2) is installed, signals from VOR systems can
be analyzed with the R&S EVSF1000.
EVSG-K2)
Remote command:
MODE_VOR on page 240
6.3.1 VOR Basics
Some background knowledge on basic terms and principles used in VOR measurements is provided here for a better understanding of the required configuration settings.
6.3.1.1 VHF Omni Directional Radio Range (VOR)
Very high frequency (VHF) omnidirectional radio range (VOR) is a radio navigation system for short and medium distance navigation. The VOR radio navigation aid supplies
the aircraft with directional information, angle information relative to the magnetic north
from the site of the beacon. Thus, it helps aircraft to determine their position and stay
on course. The range covered by a VOR station is ideally a circle around the VOR station with a radius depending on the flight altitude.
A VOR system consists of a ground transmission station and a VOR receiver on board
the aircraft.
Ground transmitter
The transmitter stations operate at VHF frequencies of 108 MHz to 118 MHz, with the
code identification (COM/ID) transmitting on a modulation tone of 1.020 kHz. It emits
two types of signals:
●
An omnidirectional reference signal (REF) that can consist of two parts:
66User Manual 1178.6410.02 ─ 06
Page 67

R&S®EVSF1000
Numeric Measurement Modes
VOR Mode (Option R&S
EVSG-K2)
– 30 Hz frequency modulated (FM) sine wave on subcarrier 9.96 kHz from ampli-
tude modulation (AM) carrier
– 1020 Hz AM modulated sine wave Morse code
●
A directional positioning signal, variable (VAR): 30 Hz AM modulated sine waves
with variable phase shift
VOR receiver
The VOR receiver obtains the directional information by measuring the phase difference of two 30 Hz signals transmitted by the beacon. A conventional VOR station
transmits with a rotating antenna. From the rotation, a sine wave AM modulated signal
arises in the receiver, whose phase position depends on the present angle of rotation.
The rotation frequency of the antenna sets the modulation frequency at 30 Hz.
To determine the radial, the phase difference to a reference phase must be measured.
This reference phase must be independent of the rotation of the antenna. Thus, it is
modulated with a frequency deviation of 480 Hz in FM onto a secondary carrier with
9.96 kHz. It is then emitted over a separate antenna with a round characteristic.
Figure 6-12: Basics of the VOR phase angles (Φ) depending on the azimuth angle (Θ)
The frequency modulated secondary carrier for the reference phase is itself again
modulated in AM on the RF carrier of the VOR station. In addition to the signals necessary for navigation, a Morse code with 1020 Hz can be transmitted on the VOR carrier.
Also, speech in the usual AF from 300 Hz to 3.3 kHz can be transmitted. Often the
voice channel of a VOR station is used for the transmission of ATIS (Automatic Terminal Information Service) messages. The Morse code can be used to identify the VOR
station, similar to the "Morse code identification signal" on page 36 in the ILS signal.
The spectrum of a VOR signal is therefore composed of the carrier and three modulated components.
67User Manual 1178.6410.02 ─ 06
Page 68

R&S®EVSF1000
Numeric Measurement Modes
VOR Mode (Option R&S EVSG-K2)
Figure 6-13: Example of the VOR Spectrum
The identical modulation degree m = 0.3 for all three components was selected in
ICAO annex-10 [63] such that the total signal still contains 10% modulation reserve.
The carrier is therefore not suppressed at any time. The 9960 Hz reference carrier is
FM modulated with 480 Hz deviation. The VOR signal generation as under ICAO is
shown below.
Figure 6-14: Basics of the VOR signal generation
68User Manual 1178.6410.02 ─ 06
Page 69

R&S®EVSF1000
6.3.1.2 VOR Demodulator
Numeric Measurement Modes
VOR Mode (Option R&S EVSG-K2)
Figure 6-15: Block diagram of the VOR software demodulator
69User Manual 1178.6410.02 ─ 06
Page 70

R&S®EVSF1000
Numeric Measurement Modes
VOR Mode (Option R&S
EVSG-K2)
The VOR signal contains three AM modulated components that must be separated in a
first step:
●
Rotational signal (30 Hz)
●
Identification/voice part (300 Hz to 4 kHz)
●
FM modulated carrier (9960 Hz ± 700 Hz)
To obtain the AM depth, a lowpass filter must calculate the mean carrier power, while
suppressing all other signal components. The mean carrier power is then used to normalize the instantaneous magnitude of the I/Q signal. The result is the AM modulation
depth signal vs. time. The three AM components are separated using bandpass filters
covering the individual frequency ranges.
A Morse decoder detects and decodes the ON and OFF periods in the identifier signal.
The separated FM modulated carrier is passed through an FM demodulator. The FM
carrier frequency (nominal 9960 Hz) is calculated as the average output value of the
FM demodulator. To obtain the 30 Hz reference signal, the FM demodulator output is
filtered by the same narrow 30 Hz bandpass as the 30 Hz AM rotational component.
FM deviation is calculated using the estimated magnitude of the 30 Hz reference signal.
The azimuth is calculated as the phase difference of the 30 Hz reference signal and
the 30 Hz rotational signal.
VOR distortion
In the VOR software demodulator two kinds of signals are analyzed regarding distortions:
●
AM Distortion: The AM modulation depth vs time signal is processed by an FFT,
with a user-defined resolution bandwidth. The trace is displayed in the Modulation
Spectrum display. The K2, K3 and THD results of the AM components are calculated based on the FFT trace and the estimated modulation frequencies.
●
FM Distortion: The FM modulation depth vs time signal is processed by an FFT,
using a resolution bandwidth automatically set by the application. You cannot view
the resulting trace. The K2, K3 and THD results of the FM components are calculated based on the FFT trace and the estimated modulation frequencies.
AM Modulation Depth
To obtain the AM depth, a lowpass filter must calculate the mean carrier power, while
suppressing all other signal components. The mean carrier power is then used to normalize the instantaneous magnitude of the I/Q signal. The result is the AM modulation
depth signal versus time. It is then used to calculate the following AM modulation
depths:
●
Depth
●
Depth
●
DepthID: AM modulation depth of the identification/voice signal
: AM modulation depth of the FM carrier, typically at 9960 Hz
9960
: AM modulation depth of the 30 Hz rotational signal
AM30
70User Manual 1178.6410.02 ─ 06
Page 71

R&S®EVSF1000
Numeric Measurement Modes
VOR Mode (Option R&S
EVSG-K2)
FM Modulation Depth
The FM deviation Devia
(typically 480 Hz) is calculated by estimating the magni-
FM30
tude of the FM demodulated 30 Hz reference signal.
Azimuth (Phase Difference at 30 Hz)
The phases of both the 30 Hz FM and 30 Hz AM signal are estimated at exactly the
same time instant. The azimuth (Phase FM-AM) is calculated as the phase difference
between the two.
AF Frequencies
In the VOR demodulator the AF frequencies are calculated:
●
Freq
●
Freq
●
FreqID: voice / identification; From 300 Hz to 4 kHz, typically 1020 Hz
●
Freq
: 30 Hz Rotational-signal (AM)
AM30
: 30 Hz Reference-signal (FM)
FM30
: The carrier frequency of the FM carrier, typically 9960 Hz; Calculated as
9960
mean value of the FM demodulator output
6.3.1.3 Phase Notation in VOR Measurements
In VOR measurements, the phase can be provided using two different notations, indicated in the following illustration:
Figure 6-16: Phase notation in VOR measurements
Phase is always counted counter-clockwise, starting at the reference.
The reference depends on the selected notation:
●
FROM: North direction at the VOR beacon
71User Manual 1178.6410.02 ─ 06
Page 72

R&S®EVSF1000
Numeric Measurement Modes
VOR Mode (Option R&S EVSG-K2)
●
TO: North direction at the receiver/ aircraft
To convert one notation to the other, use the following equation:
PhaseTO = Phase
+ 180 deg
FROM
6.3.2 VOR Measurements and Results
The VOR measurement provides multiple views for the measurement results.
You can display graphical results directly from the VOR mode by selecting the softkey
in the "Meas" menu. In this case, the settings for the current measurement are applied
to the graphical results.
To return from the graphical results to the VOR mode, select "Return" ([F8]).
For details on the graphical results, see:
●
Chapter 7.1, "RF Spectrum Mode (Option R&S EVSG-K10)", on page 94
●
Chapter 7.2, "IF Spectrum Mode (Option R&S EVSG-K10)", on page 98
●
Chapter 7.3, "AF Spectrum Mode (Option R&S EVSG-K11)", on page 103
●
Chapter 7.4, "AF Time Domain Mode (Option R&S EVSG-K12)", on page 108
Remote command:
VIEW_VOR on page 240
● RF Level and Frequency Display............................................................................72
● IF Spectrum Preview...............................................................................................73
● VOR Main View.......................................................................................................74
● VOR Distortion View............................................................................................... 76
● VOR ID Analysis View.............................................................................................77
● VOR Recording View.............................................................................................. 79
6.3.2.1 RF Level and Frequency Display
The measured RF power and frequency of the input signal is displayed both numerically and graphically.
Figure 6-17: RF level display
72User Manual 1178.6410.02 ─ 06
Page 73

R&S®EVSF1000
Numeric Measurement Modes
VOR Mode (Option R&S
The following results are provided:
●
Numeric power level in dBm ("Lev")
For measurements on two frequencies: individual and sum power levels
●
Measured frequency offset to the nominal frequency in kHz
●
Numeric frequency offset of measured power
●
Bargraph indicating the power and a color-coded overload state, where:
– red: overload state, check message
– yellow: power approaching overload state
– green: power in a valid range
●
If applicable: overload messages
Overload messages
The following messages indicate an overload:
●
"RF Overload"
Overload of the input mixer or of the analog IF path.
●
"IF Overload"
Overload of the IF signal.
●
"ADC Overload"
The dynamic range of the AD-converter is exceeded (clipping).
EVSG-K2)
A combination of these overloads is also possible.
In all cases, set the RF attenuation to normal or low distortion (for RF input), or reduce
the input level.
Remote commands to retrieve results:
LA? on page 186
FMEAS on page 246
RFCH on page 187
GET_MEASFREQ on page 252
GET_TX1_MEASFREQ on page 255
GET_TX2_MEASFREQ on page 257
GET_TX1_LEVEL on page 255
GET_TX2_LEVEL on page 256
6.3.2.2 IF Spectrum Preview
A preview of the measured spectrum (power level vs. frequency) for the IF (intermediate frequency) signal is provided. The center frequency is the nominal channel frequency. The frequency range shows the measured bandwidth. The power range is
selected such that the noise level remains visible.
73User Manual 1178.6410.02 ─ 06
Page 74

R&S®EVSF1000
Numeric Measurement Modes
Figure 6-18: IF spectrum preview
This preview spectrum allows you to check if the current measurement settings are
appropriate, such as the bandwidth or frequency offsets. For a larger, more detailed
spectrum diagram, select one of the graphical Spectrum modes. If you switch to such a
mode directly from a numeric measurement mode, the current measurement settings
are applied to the spectrum automatically.
6.3.2.3 VOR Main View
VOR Mode (Option R&S
EVSG-K2)
Displays the main measurement results.
Bearing (from)............................................................................................................... 75
AM 30 Hz...................................................................................................................... 75
AM 9960 Hz.................................................................................................................. 75
FM-Deviation.................................................................................................................75
ID Code.........................................................................................................................75
74User Manual 1178.6410.02 ─ 06
Page 75

R&S®EVSF1000
Numeric Measurement Modes
VOR Mode (Option R&S
Voice AM.......................................................................................................................75
Freq 30 Hz.................................................................................................................... 75
Freq 9960 Hz................................................................................................................ 75
Freq FM30.....................................................................................................................76
FM Index....................................................................................................................... 76
Bearing (from)
Phase between both 30-Hz signals (direction of the R&S EVSF1000 in relation to the
ground station).
Remote command:
BE on page 245
AM 30 Hz
AM modulation depth of 30 Hz AM rotational signal
Remote command:
AM0 on page 244
AM 9960 Hz
AM modulation depth of 9.96 kHz subcarrier
EVSG-K2)
Remote command:
AM1 on page 245
FM-Deviation
FM frequency deviation of 30 Hz subcarrier
Remote command:
FM0 on page 245
ID Code
Morse-decoded ID with three or four letters.
Remote command:
AC8 on page 222
AC8 on page 244
Voice AM
AM-Modulation depth of the voice signal (in the range 300 Hz to 3000 Hz, identifier
notched).
Remote command:
AM9 on page 245
Freq 30 Hz
AF frequency of 30 Hz AM rotational signal
Remote command:
AF0 on page 244
Freq 9960 Hz
Mean carrier frequency of the FM modulated subcarrier, typically at 9.96 kHz
75User Manual 1178.6410.02 ─ 06
Page 76

R&S®EVSF1000
6.3.2.4 VOR Distortion View
Numeric Measurement Modes
VOR Mode (Option R&S EVSG-K2)
Remote command:
AF1 on page 244
Freq FM30
AF frequency of the 30 Hz reference signal
Remote command:
AF2 on page 244
FM Index
FM frequency deviation of 30 Hz subcarrier
Remote command:
FM1 on page 246
This view comprises all measurement parameters for the determination of the distortion factors in the VOR mode.
Subcarrier Harmonics................................................................................................... 76
Subcarrier AM Distortion...............................................................................................77
Subcarrier Harmonics
Measures the distortions (up to 5th order) of the subcarrier harmonics.
"K2"
"K3"
Distortion 2nd order
Distortion 3rd order
76User Manual 1178.6410.02 ─ 06
Page 77

R&S®EVSF1000
Numeric Measurement Modes
VOR Mode (Option R&S EVSG-K2)
"K4"
"K5"
Remote command:
SUBCARR_K2 on page 246
SUBCARR_K3 on page 246
SUBCARR_K4 on page 246
SUBCARR_K5 on page 246
Subcarrier AM Distortion
Measures the AM distortion of the subcarrier. During signal generation, different
unwanted AM components appear. Peak 1 and Peak 2 display the largest unwanted
components.
"Peak 1 Freq"
"Peak 1 AM"
"Peak 2 Freq"
"Peak 2 AM"
Remote command:
DIST_9960 on page 245
6.3.2.5 VOR ID Analysis View
Distortion 4th order
Distortion 5th order
Displays the frequency of an unwanted AM of a VOR signal.
Displays the amplitude of an unwanted AM of a VOR signal.
Displays the frequency of an unwanted AM of a VOR signal.
Displays the amplitude of an unwanted AM of a VOR signal.
Displays the results of a morse signal analysis (optional).
77User Manual 1178.6410.02 ─ 06
Page 78

R&S®EVSF1000
Numeric Measurement Modes
VOR Mode (Option R&S
Bearing (from)............................................................................................................... 78
Last ID...........................................................................................................................78
ID Code.........................................................................................................................78
ID Period....................................................................................................................... 78
Dot Length.....................................................................................................................78
Dash Length..................................................................................................................78
Dot-Dash Gap............................................................................................................... 78
Letter Gap..................................................................................................................... 79
ID AM............................................................................................................................ 79
ID Freq.......................................................................................................................... 79
Bearing (from)
Phase between both 30-Hz signals (direction of the R&S EVSF1000 in relation to the
ground station).
Remote command:
BE on page 245
Last ID
Time since last ID pulse was measured
Remote command:
LASTID_TIME on page 230
EVSG-K2)
ID Code
Morse-decoded ID with three or four letters.
Remote command:
AC8 on page 222
AC8 on page 244
ID Period
Time between two measured ID pulses
Remote command:
ID_PERIOD on page 229
Dot Length
Length of time a dot is transmitted in the used Morse code in milliseconds.
Remote command:
ID_DOT_LENGTH on page 229
Dash Length
Length of time a dash is transmitted in the used Morse cod in milliseconds.
Remote command:
ID_DASH_LENGTH on page 229
Dot-Dash Gap
Length of time that passes between a transmitted dot and a dash in the used Morse
code in milliseconds.
78User Manual 1178.6410.02 ─ 06
Page 79

R&S®EVSF1000
Numeric Measurement Modes
VOR Mode (Option R&S EVSG-K2)
Remote command:
ID_DOTDASH_GAP on page 229
Letter Gap
Length of time that passes between two transmitted letters in the used Morse code in
milliseconds.
Remote command:
ID_LETTER_GAP on page 229
ID AM
AM Modulation depth of identifier signal (default: 1020 Hz).
Remote command:
AM8 on page 224
AM8 on page 245
ID Freq
Frequency of the morse signal.
Remote command:
AF8 on page 223
AF8 on page 244
6.3.2.6 VOR Recording View
The Recording view displays the recorded data for VOR measurements from the
selected data list (see "List" on page 163). If available, the stored GPS data from the
GPS receiver is also displayed.
79User Manual 1178.6410.02 ─ 06
Page 80

R&S®EVSF1000
Numeric Measurement Modes
VOR Mode (Option R&S
EVSG-K2)
Which measurement results are stored is described in the remote commands, see
GETDATADEF on page 294.
The individual measurement results are described in the other result views.
For details on data logging see Chapter 10.2, "Recording Measurement Data",
on page 161.
Remote commands for retrieving results:
GETDATADEF on page 294
GETDATASET on page 294
6.3.3 Configuring VOR Measurements
The following settings are available for VOR measurements.
Settings for recording, including trigger settings, are described in Chapter 10.2,
"Recording Measurement Data", on page 161.
For the mapping of hard- and softkey commands to keyboard commands using VNC,
see Table 3-2.
80User Manual 1178.6410.02 ─ 06
Page 81

R&S®EVSF1000
Numeric Measurement Modes
● Signal Direction.......................................................................................................81
● Channel Frequency Configuration (CH FREQ).......................................................81
● Ampt........................................................................................................................82
● Bandwidth (BW)...................................................................................................... 83
● Setting the Measurement Time (MTime).................................................................84
6.3.3.1 Signal Direction
Access VNC: [s] > "F1"
Signal Direction
Defines the reference for phase notation (see Chapter 6.3.1.3, "Phase Notation in VOR
Measurements", on page 71).
"From"
"To"
Remote command:
SETUP:UNIT:VORDIRECTION on page 192
VOR Mode (Option R&S
North direction at the VOR beacon
North direction at the receiver/ aircraft
EVSG-K2)
6.3.3.2 Channel Frequency Configuration (CH FREQ)
Access VNC: [q]
The channel frequency determines the nominal frequency at which the measurement is
performed. For some avionics standards, the channels are associated with specific frequencies. (See Chapter A, "ILS Channel Frequency List", on page 302 and Chapter B,
"VOR Channel Frequency List", on page 304.)
CH.................................................................................................................................81
Freq...............................................................................................................................81
Step Size.......................................................................................................................81
CH
Sets the receiver frequency channel on the active receiver board according to the
ICAO frequency list.
Remote command:
RFCH on page 187
Freq
Sets the nominal frequency for the measurement. By default, this frequency is also
assumed to be the center frequency for spectrum displays, unless an offset is defined.
For measurements on two frequencies, the frequencies are defined as offsets to this
nominal frequency.
Remote command:
RF on page 187
Step Size
Defines the frequency step size for the rotary knob when setting the frequency.
81User Manual 1178.6410.02 ─ 06
Page 82

R&S®EVSF1000
Numeric Measurement Modes
In many avionics signals, channels are assigned to frequencies with a fixed offset. By
setting the step size of the rotary knob to the fixed offset, you can easily scroll through
the signal's channel frequencies using the rotary knob. Thus, for example, you can
analyze the measurement results for one channel after the other simply by changing
the selected channel frequency with the rotary knob.
The default step size for ILS/VOR mode is 50 kHz.
Remote command:
GS_DEFAULT_FREQSTEP on page 218
6.3.3.3 Ampt
Access VNC: [w]
The following settings define the amplification for the input signal.
RF Att............................................................................................................................82
RF Mode....................................................................................................................... 82
Transducer Correction...................................................................................................83
RF Att
Determines how the attenuation of the RF signal is defined. The attenuation should be
adjusted such that the measured power level remains in the valid level range (indicated
by the green area of the bargraph, see Chapter 6.1.3.1, "RF Level and Frequency Dis-
play", on page 38). Note that the valid level range depends on the selected measure-
ment mode.
"Manual"
"Auto"
Remote command:
SETATTMODE on page 187
SCOPE_ATTMODE on page 285
FFT_ATTMODE on page 279
IFSPECT_ATTMODE on page 275
VOR Mode (Option R&S
The RF attenuation mode is specified manually (see "RF Mode"
on page 53).
The RF attenuation mode is selected automatically.
The signal attenuation is selected automatically according to the signal strength.
This mode works best with clean signals. In difficult receiving conditions, the "Low Noise", "Normal" or "Low Distortion" modes can be
more stable.
When monitoring signals with mostly constant signal levels, it is also
recommended that you use the "Low Noise", "Normal" or "Low Distortion" mode.
If the R&S EVSF1000 has to adapt the attenuation frequently, indicated by a frequent clicking noise from the attenuator, spikes can occur
in the trace.
EVSG-K2)
RF Mode
Defines the RF attenuation mode to be used.
82User Manual 1178.6410.02 ─ 06
Page 83

R&S®EVSF1000
Numeric Measurement Modes
VOR Mode (Option R&S EVSG-K2)
"Low Noise"
"Norm"
"Low Dist"
Remote command:
SETATTMODE on page 187
FSCAN_ATTMODE on page 270
SCOPE_ATTMODE on page 285
FFT_ATTMODE on page 279
IFSPECT_ATTMODE on page 275
GBAS:ATTMODE on page 258
Transducer Correction
Configures the level correction. The specified value is added to the measured power
levels to compensate for an inherent offset by the measurement setup, for example the
antenna.
15 dB pre-amplification
Provides a high sensitivity. Suitable when scanning the area for distant signals.
0 dB
Provides a normal sensitivity.
15 dB attenuation
Provides a low sensitivity. Suitable when analyzing a nearby signal, to
avoid overload due to high-level signals.
6.3.3.4 Bandwidth (BW)
Access VNC: [e]
IF BW
Determines the frequency range for which the measurement is performed on the IF
signal.
Remote command:
VOR_DEM_BW on page 241
AM30 BW
Defines the filter bandwidth with which the 30 Hz AM rotational signal is demodulated.
Remote command:
VOR_DEM_AM_BW on page 241
FM BW
Defines the filter bandwidth with which the 30 Hz reference signal is demodulated.
Remote command:
VOR_DEM_FM_BW on page 242
Bear.Filt.
Defines the filter type used to determine the bearing angle.
"Narrow"
"Wide"
For small input levels
Faster; used in previous software releases
83User Manual 1178.6410.02 ─ 06
Page 84

R&S®EVSF1000
Numeric Measurement Modes
Remote command:
VOR_DEM_BEARFILTER on page 241
6.3.3.5 Setting the Measurement Time (MTime)
Access VNC: [d]
The measurement time determines the interval at which new measurement results are
displayed. Internally, values are captured every 100 ms, that is: 10 per second. (With
the High Measurement Rate option R&S EVSG-K22 installed, the internal capture rate
is 10 ms, that is: 100 per second.) If the defined measurement time is longer, the values captured internally in that interval are averaged and only the average value is displayed.
Note that the measurement time determines the minimum interval for values to be
stored during recording (see "Time" on page 164).
Enter the time in milliseconds.
Remote command:
MEASTIME on page 186
COM Mode (Option R&S
EVSG-K6)
6.4 COM Mode (Option R&S EVSG-K6)
Access VNC: [m] > Down arrow key
If the COM Analysis option (R&S EVSG-K6) is installed, signals from VHF/UHF communication channels can be analyzed with the R&S EVSF1000. Very high frequency
(VHF) and ultrahigh frequency (UHF) communication is used for air traffic control (ATC
COM), for example.
The COM mode can be used to analyze both the civil aircraft band and military frequencies, with channels spaced at 25 kHz or 8.33 kHz.
The R&S EVSF1000 can perform COM measurements on signals containing one or
two carriers (see Chapter 6.1.4.1, "Channel and Frequency Configuration",
on page 49). It assumes a 1000 Hz test tone is being sent.
Remote command:
MODE_COM on page 248
6.4.1 COM Measurement Results
The COM measurement provides the following results. For measurements on two frequencies, the results for the individual frequencies and the sum of both are displayed.
84User Manual 1178.6410.02 ─ 06
Page 85

R&S®EVSF1000
Numeric Measurement Modes
COM Mode (Option R&S
EVSG-K6)
You can display graphical results directly from the COM mode by selecting the softkey
in the "Meas" menu. In this case, the settings for the current measurement are applied
to the graphical results.
To return from the graphical results to the COM mode, select "Return" ([F8]).
For details on the graphical results, see:
●
Chapter 7.1, "RF Spectrum Mode (Option R&S EVSG-K10)", on page 94
●
Chapter 7.2, "IF Spectrum Mode (Option R&S EVSG-K10)", on page 98
●
Chapter 7.3, "AF Spectrum Mode (Option R&S EVSG-K11)", on page 103
●
Chapter 7.4, "AF Time Domain Mode (Option R&S EVSG-K12)", on page 108
Remote command:
MODE_COM on page 248
● RF Level and Frequency Display............................................................................85
● IF Spectrum Preview...............................................................................................86
● COM Main View...................................................................................................... 87
● COM Recording View..............................................................................................88
6.4.1.1 RF Level and Frequency Display
The measured RF power and frequency of the input signal is displayed both numerically and graphically.
Figure 6-19: RF level display
The following results are provided:
●
Numeric power level in dBm ("Lev")
For measurements on two frequencies: individual and sum power levels
●
Measured frequency offset to the nominal frequency in kHz
●
Numeric frequency offset of measured power
●
Bargraph indicating the power and a color-coded overload state, where:
– red: overload state, check message
– yellow: power approaching overload state
– green: power in a valid range
●
If applicable: overload messages
85User Manual 1178.6410.02 ─ 06
Page 86

R&S®EVSF1000
Numeric Measurement Modes
COM Mode (Option R&S
EVSG-K6)
Overload messages
The following messages indicate an overload:
●
"RF Overload"
Overload of the input mixer or of the analog IF path.
●
"IF Overload"
Overload of the IF signal.
●
"ADC Overload"
The dynamic range of the AD-converter is exceeded (clipping).
A combination of these overloads is also possible.
In all cases, set the RF attenuation to normal or low distortion (for RF input), or reduce
the input level.
Remote commands to retrieve results:
LA? on page 186
FMEAS on page 246
RFCH on page 187
GET_MEASFREQ on page 252
GET_TX1_MEASFREQ on page 255
GET_TX2_MEASFREQ on page 257
GET_TX1_LEVEL on page 255
GET_TX2_LEVEL on page 256
6.4.1.2 IF Spectrum Preview
A preview of the measured spectrum (power level vs. frequency) for the IF (intermediate frequency) signal is provided. The center frequency is the nominal channel frequency. The frequency range shows the measured bandwidth. The power range is
selected such that the noise level remains visible.
Figure 6-20: IF spectrum preview
This preview spectrum allows you to check if the current measurement settings are
appropriate, such as the bandwidth or frequency offsets. For a larger, more detailed
86User Manual 1178.6410.02 ─ 06
Page 87

R&S®EVSF1000
Numeric Measurement Modes
spectrum diagram, select one of the graphical Spectrum modes. If you switch to such a
mode directly from a numeric measurement mode, the current measurement settings
are applied to the spectrum automatically.
6.4.1.3 COM Main View
The COM Main view provides the following measurement results:
COM Mode (Option R&S
EVSG-K6)
Figure 6-21: COM Main view
You can display graphical results directly from the COM mode by selecting the softkey
in the "Meas" menu. In this case, the settings for the current measurement are applied
to the graphical results.
To return from the graphical results to the COM mode, select "Return" ([F8]).
For details on the graphical results, see:
●
Chapter 7.1, "RF Spectrum Mode (Option R&S EVSG-K10)", on page 94
●
Chapter 7.2, "IF Spectrum Mode (Option R&S EVSG-K10)", on page 98
●
Chapter 7.3, "AF Spectrum Mode (Option R&S EVSG-K11)", on page 103
●
Chapter 7.4, "AF Time Domain Mode (Option R&S EVSG-K12)", on page 108
87User Manual 1178.6410.02 ─ 06
Page 88

R&S®EVSF1000
Numeric Measurement Modes
COM Mode (Option R&S EVSG-K6)
Remote command:
VIEW_COM on page 248
AM Mod.........................................................................................................................88
AM Freq........................................................................................................................ 88
AM Mod
Displays the AM modulation of a 1 kHz test tone at the individual carrier frequencies
and for both carriers together.
Remote command:
GET_ONE_AMMOD_1_0 on page 253
GET_TX1_AMMOD_1_0 on page 254
GET_TX2_AMMOD_1_0 on page 256
AM Freq
Displays the demodulated frequency of the 1 kHz AM test tone at the individual carrier
frequencies and for both carriers together.
Remote command:
GET_ONE_AMFREQ _1_0 on page 253
GET_TX1_AMFREQ_1_0 on page 254
GET_TX2_AMFREQ_1_0 on page 256
6.4.1.4 COM Recording View
The Recording view displays the recorded data for COM measurements from the
selected data list (see "List" on page 163). If available, the stored GPS data from the
GPS receiver is also displayed.
88User Manual 1178.6410.02 ─ 06
Page 89

R&S®EVSF1000
Numeric Measurement Modes
COM Mode (Option R&S
EVSG-K6)
Which measurement results are stored is described in the remote commands, see
GETDATADEF on page 294.
The individual measurement results are described in Chapter 6.4.1.3, "COM Main
View", on page 87.
For details on data logging see Chapter 10.2, "Recording Measurement Data",
on page 161.
6.4.2 COM Configuration
In this view, the measurements settings available for the currently active mode, can be
configured.
● Channel and Frequency Configuration................................................................... 89
● Ampt........................................................................................................................91
● Bandwidth (BW)...................................................................................................... 92
● Setting the Measurement Time (MTime).................................................................93
6.4.2.1 Channel and Frequency Configuration
The ILS Localizer and Glidepath measurements can detect both course and clearance
carriers simultaneously. Alternatively, the individual carriers can be measured only, or
any one or two user-defined frequencies. By default, a wideband measurement is performed. The available measurement settings depend on the selected channel and frequency configuration.
89User Manual 1178.6410.02 ─ 06
Page 90

R&S®EVSF1000
Numeric Measurement Modes
COM Mode (Option R&S
● Channel Setup........................................................................................................ 90
● Carrier Configuration (1F/2F Config).......................................................................90
● Channel Frequency Configuration (CH FREQ).......................................................91
Channel Setup
Access VNC: [m] > [F1]
1F/2F
Selects the number of frequencies or channels to be measured.
"1F"
"2F"
Remote command:
COM_1F2F_MEASMODE on page 250
One frequency only is measured, namely the nominal frequency,
which is also the center frequency.
The nominal frequency is configured by the Freq settings.
Two frequencies are measured at the same time. Which frequencies
are measured is configured by the Freq settings.
The numeric results are calculated as the sum of both frequencies. In
the RF Level display, the individual carriers are also indicated. In the
RF Spectrum preview, both carriers are displayed.
EVSG-K6)
Carrier Configuration (1F/2F Config)
Access VNC: [s] > "F1"
Configures the carriers and frequencies for measurements on a single or two frequencies. Which settings are available depends on the "1F/2F" on page 90.
Upper Carrier................................................................................................................ 90
Lower Carrier................................................................................................................ 90
1F Offset........................................................................................................................90
Upper Carrier
The two carriers are defined as offsets to either side of the nominal (center) frequency.
This setting defines the upper carrier with a positive offset to the center frequency.
Remote command:
AMFREQ_OFFSET_TX1 on page 249
Lower Carrier
The two carriers are defined as offsets to either side of the nominal (center) frequency.
This setting defines the lower carrier with a negative offset to the center frequency.
Remote command:
AMFREQ_OFFSET_TX2 on page 249
1F Offset
For single frequency measurements only:
Defines an offset of the measured frequency to the nominal frequency.
Remote command:
AMFREQ_OFFSET_1F on page 249
90User Manual 1178.6410.02 ─ 06
Page 91

R&S®EVSF1000
Numeric Measurement Modes
COM Mode (Option R&S EVSG-K6)
Channel Frequency Configuration (CH FREQ)
Access VNC: [q]
The carrier frequency determines the nominal frequency at which the measurement is
performed.
Freq...............................................................................................................................91
Step Size.......................................................................................................................91
Freq
Sets the nominal frequency for the measurement. By default, this frequency is also
assumed to be the center frequency for spectrum displays, unless an offset is defined.
For measurements on two frequencies, the frequencies are defined as offsets to this
nominal frequency.
Remote command:
RF on page 187
Step Size
Defines the frequency step size for the rotary knob when setting the frequency.
The default step size for COM mode is 8.33 kHz.
6.4.2.2 Ampt
Access VNC: [w]
The following settings define the amplification for the input signal.
RF Att............................................................................................................................91
RF Mode....................................................................................................................... 92
Transducer Correction...................................................................................................92
RF Att
Determines how the attenuation of the RF signal is defined. The attenuation should be
adjusted such that the measured power level remains in the valid level range (indicated
by the green area of the bargraph, see Chapter 6.1.3.1, "RF Level and Frequency Dis-
play", on page 38). Note that the valid level range depends on the selected measure-
ment mode.
"Manual"
The RF attenuation mode is specified manually (see "RF Mode"
on page 53).
91User Manual 1178.6410.02 ─ 06
Page 92

R&S®EVSF1000
Numeric Measurement Modes
"Auto"
Remote command:
SETATTMODE on page 187
SCOPE_ATTMODE on page 285
FFT_ATTMODE on page 279
IFSPECT_ATTMODE on page 275
RF Mode
Defines the RF attenuation mode to be used.
"Low Noise"
"Norm"
"Low Dist"
Remote command:
SETATTMODE on page 187
FSCAN_ATTMODE on page 270
SCOPE_ATTMODE on page 285
FFT_ATTMODE on page 279
IFSPECT_ATTMODE on page 275
GBAS:ATTMODE on page 258
The RF attenuation mode is selected automatically.
The signal attenuation is selected automatically according to the signal strength.
This mode works best with clean signals. In difficult receiving conditions, the "Low Noise", "Normal" or "Low Distortion" modes can be
more stable.
When monitoring signals with mostly constant signal levels, it is also
recommended that you use the "Low Noise", "Normal" or "Low Distortion" mode.
If the R&S EVSF1000 has to adapt the attenuation frequently, indicated by a frequent clicking noise from the attenuator, spikes can occur
in the trace.
15 dB pre-amplification
Provides a high sensitivity. Suitable when scanning the area for distant signals.
0 dB
Provides a normal sensitivity.
15 dB attenuation
Provides a low sensitivity. Suitable when analyzing a nearby signal, to
avoid overload due to high-level signals.
COM Mode (Option R&S
EVSG-K6)
Transducer Correction
Configures the level correction. The specified value is added to the measured power
levels to compensate for an inherent offset by the measurement setup, for example the
antenna.
6.4.2.3 Bandwidth (BW)
Access VNC: [e]
The bandwidth determines the filter width with which the measurement is performed.
The wider the filter, the less meaurement time is required, but also the less sensitive
the frequency results.
92User Manual 1178.6410.02 ─ 06
Page 93

R&S®EVSF1000
6.4.2.4 Setting the Measurement Time (MTime)
Numeric Measurement Modes
COM Mode (Option R&S EVSG-K6)
BW 1FBW 2F
Specifies the filter bandwidth for the single or both carriers.
Remote command:
COM_DEMOD_BW_1F on page 250
COM_DEMOD_BW_2F on page 250
Access VNC: [d]
The measurement time determines the interval at which new measurement results are
displayed. Internally, values are captured every 100 ms, that is: 10 per second. (With
the High Measurement Rate option R&S EVSG-K22 installed, the internal capture rate
is 10 ms, that is: 100 per second.) If the defined measurement time is longer, the values captured internally in that interval are averaged and only the average value is displayed.
Note that the measurement time determines the minimum interval for values to be
stored during recording (see "Time" on page 164).
Enter the time in milliseconds.
Remote command:
MEASTIME on page 186
93User Manual 1178.6410.02 ─ 06
Page 94

R&S®EVSF1000
7 Graphic Measurement Modes
7.1 RF Spectrum Mode (Option R&S EVSG-K10)
Graphic Measurement Modes
RF Spectrum Mode (Option R&S EVSG-K10)
● RF Spectrum Mode (Option R&S EVSG-K10)........................................................94
● IF Spectrum Mode (Option R&S EVSG-K10)..........................................................98
● AF Spectrum Mode (Option R&S EVSG-K11)...................................................... 103
● AF Time Domain Mode (Option R&S EVSG-K12)................................................ 108
Access VNC: [m] > Down arrow key
The RF Spectrum mode displays the power vs. frequency diagram (spectrum) for a
user-defined frequency range of the input signal. This is useful to obtain an overview of
the entire input signal. The RF Spectrum requires the R&S EVSG-K10 option.
The x-axis displays the absolute measured frequency in Hz. The y-axis displays the
measured power levels in dBm.
Marker functions allow you to analyze specific details in the spectrum.
Figure 7-1: RF Spectrum
94User Manual 1178.6410.02 ─ 06
Page 95

R&S®EVSF1000
Graphic Measurement Modes
RF Spectrum Mode (Option R&S
Generally, each mode is configured individually. When you switch modes, the most
recently defined settings for that mode are applied.
However, graphical results can also be displayed directly from the measurement
modes with numeric results. In this case, the settings for the current mode are applied
to the graphical results.
The following settings are displayed in the measurement settings area of the RF spectrum:
●
RX board ("RX1" | "RX2")
The currently active receiver board. See Chapter 5.2, "Receiver Board",
on page 33.
●
Measurement mode
The currently active measurement mode on the active receiver board, e.g. "RF
Spectrum". See Chapter 5.3, "Measurement Mode", on page 34.
●
Frequency range
"Center", "Span", "Start", "Stop"
The swept frequency range, see Chapter 7.1.1, "Configuring the Frequency
Range", on page 95.
●
RF attenuation ("Att")
The used attenuation mode; see also "RF Mode" on page 53.
●
Reference level ("Ref Lev")
The maximum expected power level, see "Ref Level" on page 97.
●
Level correction ("Lev Corr")
The applied level correction by a transducer. See "Transducer Correction"
on page 53.
●
Resolution Bandwidth ("RBW")
Resolution bandwidth with which the measurement is performed. See "Resolution
Bandwidth (RBW Mode/Res BW)" on page 96.
EVSG-K10)
Remote command to select RF Spectrum mode:
MODE_FSCAN on page 270
Remote command to retrieve trace results:
FSCAN_GETSPECT on page 274
7.1.1 Configuring the Frequency Range
Access VNC: [q]
The following settings configure the frequency range of the spectrum, that is: the xaxis.
Define the frequency range to be displayed using one of the following methods:
●
Center + Span: the center frequency is displayed in the center of the x-axis, with
half the span to the either side
95User Manual 1178.6410.02 ─ 06
Page 96

R&S®EVSF1000
Graphic Measurement Modes
RF Spectrum Mode (Option R&S EVSG-K10)
●
Start + Stop: the x-axis starts with the start frequency and ends with the stop fre-
quency
Center........................................................................................................................... 96
Span..............................................................................................................................96
Start...............................................................................................................................96
Stop...............................................................................................................................96
Center
Configures the center frequency. The configured value is displayed as "Center" in the
measurement settings area.
Remote command:
FSCAN_FREQCENTER on page 270
Span
Configures the frequency span, which must be at least 100 kHz. The configured value
is displayed as "Span" in the measurement settings area.
Remote command:
FSCAN_FREQSPAN on page 271
Start
Configures the start frequency of the x-axis. The configured value is displayed as
"Start" in the measurement settings area.
Remote command:
FSCAN_FREQSTART on page 271
Stop
Configures the stop frequency of the x-axis. The configured value is displayed as
"Stop" in the measurement settings area.
Remote command:
FSCAN_FREQSTOP on page 271
7.1.2 Configuring the Bandwidth
Access VNC: [e] > "F1"
Resolution Bandwidth (RBW Mode/Res BW)............................................................... 96
Resolution Bandwidth (RBW Mode/Res BW)
Defines the resolution bandwidth (RBW) of the spectrum. The resolution bandwidth
defines the minimum frequency separation at which the individual components of a
spectrum can be distinguished. Small values result in high precision, as the distance
between two distinguishable frequencies is small. Higher values decrease the precision, but increase measurement speed.
The RBW can be determined automatically by the R&S EVSF1000, or manually.
AUTO mode
The RBW is determined automatically according to the sweep time
and frequency range.
96User Manual 1178.6410.02 ─ 06
Page 97

R&S®EVSF1000
Graphic Measurement Modes
RF Spectrum Mode (Option R&S
Manual mode
Remote command:
FSCAN_RESBW_AUTO on page 272
FSCAN_RES_BW on page 272
Select a predefined fixed value manually.
7.1.3 Configuring the Amplitude (Y-Axis)
Access VNC: [w]
The amplitude settings configure the y-axis of the spectrum.
Ref Level.......................................................................................................................97
Y-Range........................................................................................................................ 97
RF Mode....................................................................................................................... 97
Transducer Correction...................................................................................................98
Ref Level
The reference level determines the maximum power level displayed in the spectrum.
The reference level should be set as close as possible to the highest expected power
level to avoid overload at the RF input or signal clipping.
Remote command:
FSCAN_REFLEVEL on page 272
EVSG-K10)
Y-Range
Determines the displayed power level range on the y-axis of the spectrum. The range
starts at the specified Ref Level at the top of the diagram.
RF Mode
Defines the RF attenuation mode to be used.
"Low Noise"
"Norm"
"Low Dist"
Remote command:
SETATTMODE on page 187
FSCAN_ATTMODE on page 270
SCOPE_ATTMODE on page 285
FFT_ATTMODE on page 279
IFSPECT_ATTMODE on page 275
GBAS:ATTMODE on page 258
15 dB pre-amplification
Provides a high sensitivity. Suitable when scanning the area for distant signals.
0 dB
Provides a normal sensitivity.
15 dB attenuation
Provides a low sensitivity. Suitable when analyzing a nearby signal, to
avoid overload due to high-level signals.
97User Manual 1178.6410.02 ─ 06
Page 98

R&S®EVSF1000
Graphic Measurement Modes
Transducer Correction
Configures the level correction. The specified value is added to the measured power
levels to compensate for an inherent offset by the measurement setup, for example the
antenna.
7.1.4 Configuring the Trace
Access VNC: [a]
Trace settings determine how the display values are calculated from the measured values.
Trace mode...................................................................................................................98
Average Count.............................................................................................................. 98
Trace mode
Defines the update mode for subsequent traces.
"Clear/Write"
"Average"
"Max Hold"
"RMS"
Remote command:
FFT_TRACEMODE on page 283
IFSPECT_TRACE_MODE on page 277
FSCAN_TRACE_MODE on page 273
Overwrite mode (default): the trace is overwritten by each sweep
The average is determined over several sweeps
The Average Count determines the number of averaging procedures.
The maximum value is determined over several sweeps and dis-
played. The R&S EVSF1000 saves each trace point in the trace
memory only if the new value is greater than the previous one.
The Average Count determines the number of sweeps to evaluate.
The RMS value for each trace point over several sweeps is determined and displayed.
The Average Count determines the number of sweeps to evaluate.
IF Spectrum Mode (Option R&S
EVSG-K10)
Average Count
Determines the number of sweeps over which trace evaluation is performed (e.g. averaging or maxhold).
Remote command:
FFT_TRACE_AVRGCOUNT on page 284
IFSPECT_TRACE_AVRGCOUNT on page 278
FSCAN_TRACE_AVRGCOUNT on page 273
7.2 IF Spectrum Mode (Option R&S EVSG-K10)
Access VNC: [m] > Down arrow key
IF Spectrum mode displays the measured power vs frequency spectrum for a (small)
span around the center frequency of the input signal. This is useful to perform detailed
98User Manual 1178.6410.02 ─ 06
Page 99

R&S®EVSF1000
Graphic Measurement Modes
IF Spectrum Mode (Option R&S
EVSG-K10)
analysis on the signal around the center frequency. This mode requires the
R&S EVSG-K10 option.
The x-axis displays the frequency offset to the nominal RF frequency in Hz. The y-axis
displays the measured power levels in dBm.
Marker functions allow you to analyze specific details in the spectrum.
Figure 7-2: IF Spectrum
Generally, each mode is configured individually. When you switch modes, the most
recently defined settings for that mode are applied.
However, graphical results can also be displayed directly from the measurement
modes with numeric results. In this case, the settings for the current mode are applied
to the graphical results.
The following settings are displayed in the measurement settings area of the RF spectrum:
●
RX board ("RX1" | "RX2")
The currently active receiver board. See Chapter 5.2, "Receiver Board",
on page 33.
●
Measurement mode
The currently active measurement mode on the active receiver board, e.g. "RF
Spectrum". See Chapter 5.3, "Measurement Mode", on page 34.
●
Frequency range ("RF Freq", "Span")
The swept frequency range, see "RF Freq" on page 100.
99User Manual 1178.6410.02 ─ 06
Page 100

R&S®EVSF1000
Graphic Measurement Modes
IF Spectrum Mode (Option R&S
●
Reference level ("Ref Lev")
The maximum expected power level, see "Ref Level" on page 101.
●
Level correction ("Lev Corr")
The applied level correction by a transducer. See "Transducer Correction"
on page 53.
●
Resolution Bandwidth ("RBW")
Resolution bandwidth with which the measurement is performed. See "RBW"
on page 101.
Remote command to select RF Spectrum mode:
MODE_IFSPECT on page 275
Remote command to retrieve trace results:
IFSPECT_GETSPECT on page 278
7.2.1 Configuring the Frequency Range
EVSG-K10)
Access VNC: [q]
The following settings configure the frequency range of the spectrum, that is: the xaxis.
RF Freq.......................................................................................................................100
Span............................................................................................................................100
RF Freq
Configures the center frequency. The configured value is displayed as "RF Freq" in the
measurement settings area.
Remote command:
IFSPECT_FREQRF on page 275
Span
Configures the frequency span, which must be at least 100 kHz. The span is distributed evenly to the left and right of the "RF Freq" on page 100. The configured value is
displayed as "Span" in the measurement settings area.
Remote command:
IFSPECT_FREQ_SPAN on page 276
7.2.2 Configuring the Bandwidth
Access VNC: [e] > "F1"
RBW............................................................................................................................101
100User Manual 1178.6410.02 ─ 06
 Loading...