

Page 1

R&S®EVS300-K9/-K10
GBAS and SCAT-I Analysis
User Manual
(;Úê<2)
1176.9212.02 ─ 02
User Manual
Test & Measurement
Page 2

This manual applies to the following R&S®EVS300 models with firmware version 5.2 and higher:
●
R&S®EVS300 (3544.4005.02)
(For exceptions see the data sheet.)
The following firmware options are described:
●
R&S EVS300-K9 GBAS Analysis (5202.8154.02)
●
R&S EVS300-K10 SCAT-I Analysis (5201.7783.00)
The firmware of the instrument makes use of several valuable open source software packages. For information, see the "Open
Source Acknowledgement" on the user documentation CD-ROM (included in delivery).
Rohde & Schwarz would like to thank the open source community for their valuable contribution to embedded computing.
© 2015 Rohde & Schwarz GmbH & Co. KG
Mühldorfstr. 15, 81671 München, Germany
Phone: +49 89 41 29 - 0
Fax: +49 89 41 29 12 164
E-mail: info@rohde-schwarz.com
Internet: www.rohde-schwarz.com
Subject to change – Data without tolerance limits is not binding.
R&S® is a registered trademark of Rohde & Schwarz GmbH & Co. KG.
Trade names are trademarks of the owners.
The following abbreviations are used throughout this manual: R&S®EVS300 is abbreviated as R&S EVS300.
Page 3

R&S®EVS300-K9/-K10
Contents
1 Preface.................................................................................................... 5
1.1 About this Manual......................................................................................................... 5
1.2 Typographical Conventions.........................................................................................5
2 Welcome to the GBAS and SCAT-I Analysis Application.................. 7
2.1 Installing and Activating the GBAS and SCAT-I Analysis Applications.................. 7
2.2 Starting the GBAS and SCAT-I Analysis Application................................................ 9
3 Basics on GBAS and SCAT-I Analysis ..............................................10
3.1 GBAS Specifics........................................................................................................... 10
3.2 Broadcast Timing Structure.......................................................................................12
3.3 Final Approach Segment (FAS) Construction Data................................................. 12
Contents
3.4 Data Acquisition with the Data Logger..................................................................... 13
3.5 Data Streaming............................................................................................................14
3.6 Time Slot Synchronization via PPS...........................................................................15
4 Result Displays.................................................................................... 16
4.1 Overview of Captured Data (Main View)................................................................... 16
4.2 Time Slot Details - Received Messages (Time Slot View)....................................... 18
4.3 Message Type 1 - Differential Corrections (MT1 View)............................................19
4.4 Message Type 4 - Final Approach Segment Data (FAS DB View).......................... 22
4.5 GBAS / SCAT Data Logger List View........................................................................ 26
4.6 Pseudorange Correction Data Graph (PRC Graph)................................................. 27
4.7 GPS Information..........................................................................................................29
5 Configuration and Analysis................................................................ 31
5.1 Defining the Receive Frequency................................................................................31
5.2 Setting the RF Input Attenuation............................................................................... 31
5.3 Working with the Data Logger................................................................................... 32
6 Optimizing and Troubleshooting Analysis........................................ 45
7 Remote Commands to Perform GBAS and SCAT-I Analysis...........46
7.1 Activating GBAS and SCAT-I Analysis..................................................................... 46
7.2 Configuring GBAS and SCAT-I Analysis.................................................................. 47
3User Manual 1176.9212.02 ─ 02
Page 4

R&S®EVS300-K9/-K10
7.3 Configuring the GPS Reference Point...................................................................... 48
7.4 Configuring the Data Logger......................................................................................48
7.5 Configuring Time Synchronization with the R&S EVS300 Clock........................... 55
7.6 Activating a Data Stream............................................................................................57
7.7 Retrieving Results.......................................................................................................58
A Annex.................................................................................................... 61
A.1 References...................................................................................................................61
A.2 Format Description of GBAS and SCAT-I Data........................................................ 61
List of Commands................................................................................67
Index......................................................................................................68
Contents
4User Manual 1176.9212.02 ─ 02
Page 5

R&S®EVS300-K9/-K10
1 Preface
Preface
About this Manual
1.1 About this Manual
This GBAS and SCAT-I Analysis User Manual provides all the information specific to
the application. All general instrument functions and settings common to all applica-
tions are described in the main R&S EVS300 User Manual.
The main focus in this manual is on the analysis results and the tasks required to
obtain them. The following topics are included:
●
Welcome to the GBAS and SCAT-I Analysis Application
Introduction to and getting familiar with the application
●
Result Displays
Details on result displays
●
GBAS and SCAT-I Analysis Basics
Background information on basic terms and principles in the context of the analysis
●
GBAS and SCAT-I Configuration + Analysis
A concise description of all functions and settings available to configure measurements and analyze results with their corresponding remote control command
●
Optimizing and Troubleshooting the Analysis
Hints and tips on how to handle errors and optimize the test setup
●
Remote Commands for GBAS and SCAT-I Analysis
Remote commands required to configure and perform GBAS and SCAT-I Analysis
in a remote environment, sorted by tasks
(Commands required to set up the environment or to perform common tasks on the
instrument are provided in the main R&S EVS300 User Manual)
●
Annex
Reference material
●
List of remote commands
Alpahabetical list of all remote commands described in the manual
●
Index
1.2 Typographical Conventions
The following text markers are used throughout this documentation:
Convention Description
"Graphical user interface elements"
KEYS Key names are written in capital letters.
All names of graphical user interface elements on the screen, such as
dialog boxes, menus, options, buttons, and softkeys are enclosed by
quotation marks.
5User Manual 1176.9212.02 ─ 02
Page 6

R&S®EVS300-K9/-K10
Convention Description
Preface
Typographical Conventions
File names, commands,
program code
Input Input to be entered by the user is displayed in italics.
Links Links that you can click are displayed in blue font.
"References" References to other parts of the documentation are enclosed by quota-
File names, commands, coding samples and screen output are distinguished by their font.
tion marks.
6User Manual 1176.9212.02 ─ 02
Page 7

R&S®EVS300-K9/-K10
2 Welcome to the GBAS and SCAT-I Analysis
Application
The R&S EVS300-K9/-K10 options are firmware applications that add functionality to
perform GBAS and SCAT-I Analysis on the R&S EVS300.
The K9 option enables you to receive and analyze the very high frequency (VHF) Data
Broadcast (VDB) Signal-in-Space transmitted from a Ground Based Augmentation
System (GBAS) ground subsystem to the airborne subsystem. This implementation is
in line with the specification RTCA DO-246D [1] (see chapter A.1, "References",
on page 61).
Similarly, using option K10, data from special category I (SCAT-I) systems can be
received and analyzed. The main difference is the content of the message data. This
implementation is in line with the specification RTCA DO217 [2] (see chapter A.1, "Ref-
erences", on page 61).
The R&S EVS300-K9/-K10 applications feature:
Welcome to the GBAS and SCAT-I Analysis Application
Installing and Activating the GBAS and SCAT-I Analysis Applications
●
Receiving GBAS signal data from a GBAS ground station in a frequency range
between 108.000 and 117.975 MHz with a channel spacing of 25 kHz
●
Receiving SCAT-I signal data from a SCAT-I ground station in a frequency range
between 108.025 and 117.95 MHz with a channel spacing of 25 kHz
●
Analyzing the RF characteristics, signal strength and frequency accuracy of the
GBAS/SCAT-I signal
●
Demodulating, decoding and displaying GBAS/SCAT-I signal data
●
Analyzing up to 8 time slots or individual time slot details in the GBAS/SCAT-I signal data
●
Analyzing individual Final Approach Segment (FAS) data blocks
●
Logging and storing up to 9999 lists of received GBAS/SCAT-I signal data
This user manual contains a description of the functionality that the application provides, including remote control operation.
All functions not discussed in this manual are the same as in the base unit and are
described in the R&S EVS300 User Manual. The latest version is available for download at the product homepage.
● Installing and Activating the GBAS and SCAT-I Analysis Applications.....................7
● Starting the GBAS and SCAT-I Analysis Application................................................9
2.1 Installing and Activating the GBAS and SCAT-I Analysis Applications
The GBAS and SCAT-I Analysis applications require an additional option:
R&S EVS300-K9 (GBAS) or R&S EVS300-K10 (SCAT-I). When you purchase these
7User Manual 1176.9212.02 ─ 02
Page 8

R&S®EVS300-K9/-K10
options, Rohde & Schwarz provides the necessary license key. This key must be activated before the applications can be started.
In order to install the R&S EVS300-K9 or the R&S EVS300-K10 options, firmware version 5.1 or higher is required on the R&S EVS300.
Both the R&S EVS300-K9 and the R&S EVS300-K10 options add the common GBAS/
SCAT-I mode to the R&S EVS300.
However, in order to see the detailed GBAS data ("MT1 View", "MT4 View", "MT1
Graph", see chapter 4, "Result Displays", on page 16), the option R&S EVS300-K9 is
required.
In order to see the detailed SCAT-I data ("MT1 View", "MT4 View", "MT1 Graph", see
chapter 4, "Result Displays", on page 16), the option R&S EVS300-K10 is required.
To activate the license key
1. Press the SETUP key.
2. Press the ^ key (below SK7) to switch to the "Setup - GeneralSettings" window
Welcome to the GBAS and SCAT-I Analysis Application
Installing and Activating the GBAS and SCAT-I Analysis Applications
(2/2).
3. Press the "Options" softkey to display an overview of all available R&S EVS300
options.
4. Press the ENTER button to open an input edit field for "KEY".
5. Enter the license key number as provided by Rohde & Schwarz.
(Note: the license key consists of 18 numbers, separated by commas)
6. Press ENTER to confirm the entry.
If the key is valid, the purchased options are enabled and identified as "available"
in the overview.
Fig. 2-1: Available R&S
EVS300 options
If the key is not valid, the entered number is displayed in red.
8User Manual 1176.9212.02 ─ 02
Page 9

R&S®EVS300-K9/-K10
Welcome to the GBAS and SCAT-I Analysis Application
Starting the GBAS and SCAT-I Analysis Application
Fig. 2-2: Invalid option key
Correct the number and try again.
2.2 Starting the GBAS and SCAT-I Analysis Application
The GBAS and SCAT-I Analysis application adds a new mode to the R&S EVS300.
► To activate the GBAS/SCAT-I mode, press the SPLIT button and select the
"GBAS/SCAT-I" option.
The main GBAS/SCAT-I window is displayed.
Remote command:
MODE_GBAS on page 46
PPS input recommended
It is strongly recommended that you connect the PPS signal of the GPS receiver to the
trigger input of the R&S EVS300. Although it is possible to operate the R&S EVS300
without the PPS signal connected, this may lead to an incorrect assignment of the data
to the time slots.
For details see chapter 3.6, "Time Slot Synchronization via PPS", on page 15.
9User Manual 1176.9212.02 ─ 02
Page 10

R&S®EVS300-K9/-K10
3 Basics on GBAS and SCAT-I Analysis
The following topics summarize some background information on the GBAS and other
avionics related standards. The provided overview information is intended as an
explanation of the used terms and does not aim to be comprehensive.
● GBAS Specifics.......................................................................................................10
● Broadcast Timing Structure.....................................................................................12
● Final Approach Segment (FAS) Construction Data................................................ 12
● Data Acquisition with the Data Logger....................................................................13
● Data Streaming....................................................................................................... 14
● Time Slot Synchronization via PPS.........................................................................15
Basics on GBAS and SCAT-I Analysis
GBAS Specifics
3.1 GBAS Specifics
GBAS is a ground based augmentation system that can enhance satellite navigation.
The GBAS is intended to improve aircraft safety and to enhance satellite navigation
and the full range of precision approach and landing procedures, as well as the terminal area operations.
GBAS components
The illustration in figure 3-1 is a simplified representation of the GBAS' three main components:
●
the GNSS satellite subsystem
●
the airborne subsystem
●
the GBAS ground subsystem.
The ground equipment consists of four reference GNSS receivers at exactly defined
positions around the airport, GBAS ground station, and a VHF data broadcast transmitter (VDB).
10User Manual 1176.9212.02 ─ 02
Page 11

R&S®EVS300-K9/-K10
Basics on GBAS and SCAT-I Analysis
GBAS Specifics
Fig. 3-1: GBAS components and signals (simplified representation)
1 = GNSS reference receiver
2 = GBAS ground station
3 = VHF data broadcast (VDB) transmitter
a = GNSS navigation message
b = Pseudorange
c = GBAS Correction message
d = VDB signal
The GBAS GNSS reference receivers receive the GNSS navigation message, perform
pseudorange measurements and transmits this information to the GBAS ground station. The GBAS ground station determines errors in the calculated positions, adds
additional parameters and approach path information, produces a GBAS correction
message and sends it the VDB transmitter. The VDB transmitter modulates and encodes this message and broadcasts it to the airborne GBAS equipment, for example a
GBAS receiver in the airplane. The GBAS equipment in the airplane is a high-precision
multimode receiver that evaluates the message and applies corrections parameters to
improve the navigation algorithms from GPS.
This list outlines the three signals transmitted between the components and referred to
as GBAS Signal-in-Space:
●
GNSS satellite to GBAS ground subsystem navigation signal
●
GNSS satellite to GBAS airborne subsystem navigation signal
●
GBAS ground subsystem to GBAS airborne subsystem VHF data broadcast
Carrier frequencies and frequency channels
The VHF data broadcast is defined for carrier frequencies within the range of
108.025 MHz to 117.975 MHz and carrier spacing of 25.0 kHz.
11User Manual 1176.9212.02 ─ 02
Page 12

R&S®EVS300-K9/-K10
Basics on GBAS and SCAT-I Analysis
Broadcast Timing Structure
3.2 Broadcast Timing Structure
The broadcast is a Time Division Multiple Access (TDMA). According to [1], the TDMA
timing structure uses a two level hierarchy, composed of 500 ms long frames, each
divided into 8 VDB time slots (A - H), see figure 3-2.
Fig. 3-2: TDMA timing structure (simplified representation)
A VDB time slot is the minimum resource that an individual VDB transmitter can use.
During one time slot a VDB transmitter transmits exactly one burst.
The GBAS specification [1] defines the TDMA timing structure, including timing budget
of the VDB bursts, burst data contents and message encoding in great details. The
R&S EVS300 receives the required training sequence, decodes the message according to [1] and demodulates the D8PSK modulated data automatically.
3.3 Final Approach Segment (FAS) Construction Data
According to the standard [1], the message type 4 contains one or more data sets that
contain approach data, associated vertical/lateral alert limits, and/or the Terminal Area
Path (TAP).
The FAS path is a line in space that defines the path an airplane follows on its final
approach. This line is defined by the Landing Threshold Point/Fictitious Threshold
Point (LTP/FTP), Flight Path Alignment Point (FPAP), Threshold Crossing Height
(TCH), and the Glide Path Angle (GPA).
12User Manual 1176.9212.02 ─ 02
Page 13

R&S®EVS300-K9/-K10
Fig. 3-3: Final Approach Segment (FAS) diagram, according to [1]
Basics on GBAS and SCAT-I Analysis
Data Acquisition with the Data Logger
LTP/FTP = Landing Threshold Point/Fictitious Threshold Point; point at the center of the landing runway,
defined by its WGS84 coordinates
GPIP = Glide Path Intercept Point; the point where the final approach path intercepts the local level
plane
FPAP = Flight Path Alignment Point; point at the end of the runway that in conjunction with the LTP/FTP
defines the geodesic plane of the precision final approach, landing and flight path.
TCH = Threshold Crossing Height
GPA = Glide Path Angle; angle at the TCH that describes the intended angle of descent at the final
approach path.
The coordinates of the LTP/FTP are defined in WGS84 coordinates. In this coordinate
system, a location is identified by three coordinates, the altitude, the latitude and the
longitude.
3.4 Data Acquisition with the Data Logger
The Data Logger records and manages the data captured during a single measurement or a series of measurements. You can define when and how long data is stored,
and from which time slots. Up to 9999 lists with a maximum of 1 000 000 data lines
each can be recorded in GBAS/SCAT-I mode. One line corresponds to the captured
data at the receive frequency for the GBAS signal in one time slot. Within a list, each
data entry is represented by a unique index. Different lists can be used to store multiple measurements at different times, for example. The data lists are stored on the
internal compact flash card of the R&S EVS300.
The stored data can be output graphically on the screen or as a data stream in remote
operation. You can select the relevant parameters for analysis individually. For further
processing, the data can be exported to a USB storage device in CSV format.
13User Manual 1176.9212.02 ─ 02
Page 14

R&S®EVS300-K9/-K10
Selecting parameters
For each list you can define which parameters are to be displayed and stored by the
Data Logger, and in which order. Thus, you can save storage space if not all parameters are relevant for the current measurement scenario. If you add further parameters
to the selection after logging, the columns and headers will be added to the list, however the contents of those columns will remain empty. Only in subsequent data logs
the new parameters will be available. On the other hand, if you reduce the number of
selected parameters, the display is restricted immediately. However, the logged
parameter values remain available on the instrument.
When a list is stored to a file, a header line is automatically included that describes the
provided parameters.
In remote operation, the individual parameter selection is not considered. Only a complete or a short list of parameters can be selected.
Selecting time slots
Furthermore, you can select from which time slots data is logged, which can also
reduce the required storage space for the data list. Note, however, that if no time slots
are selected, data logging can not be activated.
Basics on GBAS and SCAT-I Analysis
Data Streaming
For a detailed description of the stored data see the chapter A.2, "Format Description
of GBAS and SCAT-I Data", on page 61.
Time synchronization for longterm measurements
For longterm measurements, you can configure data logging to start a new list every
hour of the day (see "Logging Mode" on page 34). This is useful to determine the
used list at a specific time easily.
To determine when to start a new list, the Data Logger refers to the operating system
clock of the R&S EVS300. In order to improve accuracy you can synchronize this clock
to a GPS or NTP server (see chapter 5.3.2, "Synchronizing the R&S EVS300 Clock",
on page 35). If the R&S EVS300 clock differs from the selected synchronization
source time by more than 1000 ms, the R&S EVS300 clock is adjusted accordingly.
3.5 Data Streaming
In addition to the Data Logger, which can be operated both manually and remotely, a
data streaming function is provided for remote operation. As opposed to the Data Logger, which stores the measurement results internally in lists, the data streaming function outputs the results directly to the connected remote control device, synchronously
with the measurement. Thus, the results can be analyzed on the remote device during
an on-going measurement. The internal storage with its lists is bypassed entirely; no
results are stored on the R&S EVS300.
Using the R&S EVS300's remote commands for streaming you can specify which time
slots and channels to output, and whether a full or only a short list of parameters is
streamed. However, more detailed timing parameters as for the data logger are not
14User Manual 1176.9212.02 ─ 02
Page 15

R&S®EVS300-K9/-K10
available for streaming. Functions other than starting and stopping the data stream
must be controlled by the remote control device using other means.
Basics on GBAS and SCAT-I Analysis
Time Slot Synchronization via PPS
3.6 Time Slot Synchronization via PPS
The data captured by the R&S EVS300 is assigned to the eight time slots and then
decoded.
A PPS signal from a connected GPS receiver can help the R&S EVS300 detect the
individual time slots accurately. In this case, the positive slope of the PPS signal indicates the time "0" for slot A. Data transmission may start from -1.5 ms before to +5 ms
after the PPS.
Thus, it is strongly recommended that you connect the PPS signal of the GPS receiver
to the trigger input of the R&S EVS300. Although it is possible to operate the
R&S EVS300 without the PPS signal connected, this may lead to an incorrect assignment of the data to the time slots.
The status of the PPS signal is indicated in the main view of the GBAS/SCAT-I mode.
The PPS signal should be as short as possible, with a maximum duration of 1 ms. Longer signals may cause errors at the AC-coupled trigger input of the R&S EVS300. Note
that the default PPS duration on many GPS receivers is 100 ms!
Triggering on PPS
In order to ensure a common time reference between multiple measured data sets,
data logging can be triggered such that the GPS time in the data sets is synchronized
with the PPS signal of a connected GPS receiver (see "Logging Source"
on page 33).
15User Manual 1176.9212.02 ─ 02
Page 16

R&S®EVS300-K9/-K10
4 Result Displays
The data that was received by the R&S EVS300 can be evaluated in increasing detail.
● Overview of Captured Data (Main View).................................................................16
● Time Slot Details - Received Messages (Time Slot View)......................................18
● Message Type 1 - Differential Corrections (MT1 View).......................................... 19
● Message Type 4 - Final Approach Segment Data (FAS DB View).........................22
● GBAS / SCAT Data Logger List View..................................................................... 26
● Pseudorange Correction Data Graph (PRC Graph)................................................27
● GPS Information......................................................................................................29
Result Displays
Overview of Captured Data (Main View)
4.1 Overview of Captured Data (Main View)
When you activate GBAS/SCAT-I mode, the main view displays an overview of the
captured data in all eight slots. You can return to this view from most other views by
selecting the "Main View" softkey.
Fig. 4-1: Application-specific elements in the GBAS/SCAT-I main view
1 = Receive frequency in MHz
2 = Pulse per second (PPS) status from GPS
3 = Overview of captured data in all 8 slots
4 = Measured power level in the selected slot
5 = Color bar for power level
16User Manual 1176.9212.02 ─ 02
Page 17

R&S®EVS300-K9/-K10
The following general information is displayed for a GBAS/SCAT-I measurement:
Table 4-1: Displayed general information for a GBAS/SCAT-I measurement
Label / Element Description
FREQ. [MHz] Receive frequency in MHz
PPS Status Pulse per second (PPS) status from GPS; if error occurs, measurement results
The overview of captured data displays the following data for each of the 8 time slots:
Table 4-2: Displayed information for each captured slot in main view
Column Description
Slot Slot 0 to 7 (A to H)
Level [dBm] Measured power level
DeltF [kHz] Delta between measured frequency and nominal receive frequency
SS ID Received station slot identifier
Result Displays
Overview of Captured Data (Main View)
may be invalid; check GPS receiver connection
Stat ID Received station ID, equivalent to GBAS ID or SCAT ID
TLen [bit] Transmission length in bits
MsgB ID Message identifier to distinguish GBAS/SCAT-I messages
TrS FEC FEC of the training sequence
App FEC FEC of the data content
Cycle [sec] Time difference between the last 2 incoming bursts
ElapT [sec] Elapsed time since the last burst reception
Selected slot
One of the slots is always selected for display or further analysis, this slot is highlighted. To change the selected slot, select the "Time Slot" softkey and select a different
slot number.
Time slot details in the "Time Slot" view are always displayed for the currently selected
slot.
In addition to the information displayed in the overview, the following information is
highlighted for the selected slot in the GBAS/SCAT-I main view:
Table 4-3: Highlighted information for the selected slot in the main view:
Label / Element Description
LEVEL [dBm] Measured power level in the selected slot
Color bar Position of measured power level within range of valid values (according to data
sheet); for valid measurements, ensure the power level is within the green area of
the color bar (adjust attenuation)
17User Manual 1176.9212.02 ─ 02
Page 18

R&S®EVS300-K9/-K10
Remote commands:
Querying results:
GBAS:LEV? on page 59
GBAS:FMEAS? on page 58
GBAS:GETMDEF on page 58
Result Displays
Time Slot Details - Received Messages (Time Slot View)
4.2 Time Slot Details - Received Messages (Time Slot View)
Detailed information for each of the time slots is available in the "Time Slot" view. To
display this view, select the "Slot View" softkey in the main window or any other GBAS/
SCAT-I window.
Time slot details in the "Time Slot" view are always displayed for the slot currently
selected in the main view. This slot is highlighted. To change the selected slot, select
the "Time Slot" softkey and select a different slot number.
Fig. 4-2: Information on received messages for an individual time slot
At the top of the "Time Slot" view, the general information for the time slot from the
main view is repeated for reference (for a description of the information see chap-
ter 4.1, "Overview of Captured Data (Main View)", on page 16).
In addition, the following information on the received message blocks in the selected
time slot is displayed:
18User Manual 1176.9212.02 ─ 02
Page 19

R&S®EVS300-K9/-K10
Table 4-4: Displayed information for each message block in the slot in Time Slot view
Column Description
Ser.Nr. Serial number of message
Message Type Message type (1,2,4,11)
Result Displays
Message Type 1 - Differential Corrections (MT1 View)
Msg.Block ID
Station ID Received station ID, equivalent to GBAS ID or SCAT ID
Msg. Len [byte] Message length
Msg.Bl. CRC Message block CRC
Message block ID:
●
1001 1001: SCAT-I
●
1010 1010: normal LAAS message (GBAS)
●
1111 1111: test LAAS message (GBAS)
For message types 1 and 4 further details can be displayed.
4.3 Message Type 1 - Differential Corrections (MT1 View)
If the time slot contains a message of type 1, further details on the differential correction data contained in the message can be displayed in the "MT1" view (it is assumed
that no more than one message of this type is available per slot). To display this view,
select the "M.Type 1 View" softkey in the "Time Slot" view.
The displayed information differs for GBAS and SCAT-I signals.
In order to see the detailed GBAS data the option R&S EVS300-K9 is required (see
chapter 2.1, "Installing and Activating the GBAS and SCAT-I Analysis Applications",
on page 7).
In order to see the detailed SCAT-I data the option R&S EVS300-K10 is required (see
chapter 2.1, "Installing and Activating the GBAS and SCAT-I Analysis Applications",
on page 7).
4.3.1 GBAS Message Type 1 View
The message type 1 view displays further details on the differential correction data
contained in the message.
In order to see the detailed GBAS data the option R&S EVS300-K9 is required (see
chapter 2.1, "Installing and Activating the GBAS and SCAT-I Analysis Applications",
on page 7).
19User Manual 1176.9212.02 ─ 02
Page 20

R&S®EVS300-K9/-K10
Result Displays
Message Type 1 - Differential Corrections (MT1 View)
Fig. 4-3: GBAS Message Type 1 view
At the top of the window, the information for the selected message block from the Time
Slot view is displayed (see table 4-4.
On the left-hand side of the window, the following satellite-independant information is
displayed:
Table 4-5: Displayed satellite-independant information for each type 1 message in MT1 view
Z-count [m:s]
Add.Msg Flag
No. of PRCs
Meas Type
Decorr.P [m/m]
Eph.CRC MSB
Eph.CRC LSB
Avail.Durat.[s]
In addition, the following details for the differential correction data from up to 12 satellites are displayed in the MT1 view (in the order of reception):
Table 4-6: Displayed correction data for each satellite in MT1 view
SAT ID
IOD
PRC [m]
20User Manual 1176.9212.02 ─ 02
Page 21

R&S®EVS300-K9/-K10
RRC [m/s]
Spr [m]
B1 [m]
B2 [m]
B3 [m]
B4 [m]
For details on the correction data parameters refer to the GBAS specification [1].
Result Displays
Message Type 1 - Differential Corrections (MT1 View)
4.3.2 SCAT-I Message Type 1 View
The message type 1 view displays further details on the differential correction data
contained in the message.
In order to see the detailed SCAT-I data the option R&S EVS300-K10 is required (see
chapter 2.1, "Installing and Activating the GBAS and SCAT-I Analysis Applications",
on page 7).
Fig. 4-4: SCAT-I Message Type 1 view
At the top of the window, the information for the selected message block from the Time
Slot view is displayed (see table 4-4.
21User Manual 1176.9212.02 ─ 02
Page 22

R&S®EVS300-K9/-K10
Beneath the message block information, the following satellite-independant information
is displayed:
Table 4-7: Displayed satellite-independant information for each type 1 message in MT1 view
Z-count [m:s]
AccErrBound [m/s²]
Kmd_gnd
In addition, the following details for the differential correction data from up to 12 satellites are displayed in the MT1 view (in the order of reception):
Table 4-8: Displayed correction data for each satellite in MT1 view
SAT ID
PRC [m]
IOD
RRC [m/s]
Result Displays
Message Type 4 - Final Approach Segment Data (FAS DB View)
Sp [m]
Sf [m]
Bf [m]
For details on the correction data parameters refer to the SCAT specification [2].
4.4 Message Type 4 - Final Approach Segment Data (FAS DB View)
If the time slot contains one or more messages of type 4, further constructional details
on the final approach segment contained in the message can be displayed in the
"MT4" view. A time slot may contain multiple messages of type 4, from different final
approach segments. Each segment is uniquely identified by its "Reference Path ID".
Thus, you can display the details for a particular reference path by selecting one of up
to 46 "Reference Path Data Selector"s.
The displayed information differs for GBAS and SCAT-I signals.
In order to see the detailed GBAS data the option R&S EVS300-K9 is required (see
chapter 2.1, "Installing and Activating the GBAS and SCAT-I Analysis Applications",
on page 7).
In order to see the detailed SCAT-I data the option R&S EVS300-K10 is required (see
chapter 2.1, "Installing and Activating the GBAS and SCAT-I Analysis Applications",
on page 7).
22User Manual 1176.9212.02 ─ 02
Page 23

R&S®EVS300-K9/-K10
Result Displays
Message Type 4 - Final Approach Segment Data (FAS DB View)
4.4.1 GBAS Final Approach Segment Data (GBAS FAS DB View)
The details for a particular reference path are displayed in the "GBAS FAS DB" view.
To display this view, select the "M.TYPE 4 VIEW" softkey in the "Time Slot" view.
To view the details for a different reference path, select "Sel.FASDB" and then select
one of the available Reference Path Data Selectors (RPDS) from the list on the lefthand side.
In order to see the detailed GBAS data the option R&S EVS300-K9 is required (see
chapter 2.1, "Installing and Activating the GBAS and SCAT-I Analysis Applications",
on page 7).
Fig. 4-5: GBAS Final Approach Segment Data (FAS DB) view
The following specific FAS DB data is displayed:
For a visualization of the most important GBAS FAS data parameters see figure 3-3.
Table 4-9: Displayed FAS DB for a single GBAS reference path in GBAS FAS DB view
Reference Path Data Selector
Reference Path ID
FAS Data Length [byte]
Operation Type
23User Manual 1176.9212.02 ─ 02
Page 24

R&S®EVS300-K9/-K10
SBAS Service Provider
Airport ID
Runway Number
Runway Letter
Appr. Perform.Designator
Route Indicator
LTP/FTP Latitude [°]
LTP/FTP Longitude [°]
LTP/FTP Height [m]
Delta FPAP Latitude [°]
Delta FPAP Longitude [°]
Thres.Cross.Height
Thres.Cross.Height Unit
Result Displays
Message Type 4 - Final Approach Segment Data (FAS DB View)
Glide Path Angle (GPA) [°]
Course Width at Threshold [m]
Delta Length Offset [m]
FAS DATA BLOCK CRC
FAS Vertical Alert Limit [m]
FAS Lateral Alert Limit [m]
4.4.2 SCAT-I Final Approach Segment Data (SCAT-I FAS DB View)
The details for a particular reference path are displayed in the "SCAT-I FAS DB" view.
To display this view, select the "M.TYPE 4 VIEW" softkey in the "Time Slot" view.
To view the details for a different reference path, select "Sel.FASDB" and then select
one of the available Reference Path Data Selectors (RPDS) from the list on the lefthand side.
In order to see the detailed SCAT-I data the option R&S EVS300-K10 is required (see
chapter 2.1, "Installing and Activating the GBAS and SCAT-I Analysis Applications",
on page 7).
24User Manual 1176.9212.02 ─ 02
Page 25

R&S®EVS300-K9/-K10
Result Displays
Message Type 4 - Final Approach Segment Data (FAS DB View)
Fig. 4-6: SCAT-I Final Approach Segment Data (FAS DB) view
The following specific FAS DB data is displayed:
Table 4-10: Displayed FAS DB for a single SCAT-I reference path in SCAT-I FAS DB view
Reference Path Data Selector
Reference Path ID
Operation Type
Airport ID
Runway Number
Runway Letter
Route Indicator
Validity Indicator
TD Point Latitude [°]
TD Point Longitude [°]
TD Point Height [m]
DERP Latitude [°]
DERP Longitude [°]
Thres.Cross.Height
25User Manual 1176.9212.02 ─ 02
Page 26

R&S®EVS300-K9/-K10
Glide Path Angle (GPA)
FAS DATA BLOCK CRC
Result Displays
GBAS / SCAT Data Logger List View
4.5 GBAS / SCAT Data Logger List View
The "GBAS / SCAT-1" mode provides a data logger function. You can specify when
and how long the data is logged.
In the list view, the logged data is provided as an overview.
To display this view, select the MEM key in "GBAS / SCAT-1" mode.
Fig. 4-7: GBAS / SCAT Data Logger List view
Each data entry is represented by a unique index, in the chronological order it was
recorded. Furthermore, for each entry, the time it was logged is stored. Up to 30
parameters can be displayed for each data entry, if available. You can select the
parameters and time slots whose information is to be displayed individually. For a
description of the individual parameters see chapter A.2, "Format Description of GBAS
and SCAT-I Data", on page 61.
Furthermore, the following general list information is provided beneath the list:
Label Description
List Size Number of data entries within the current list.
Free CF Available memory on the internal compact flash card
26User Manual 1176.9212.02 ─ 02
Page 27

R&S®EVS300-K9/-K10
To scroll through the parameters of an entry, use the rotary knob.
The information in the data log can also be displayed graphically, in the Pseudorange
Correction Data Graph (PRC Graph).
For further functions available for data logs see chapter 5.3.4, "Analyzing the Data Log-
ger Entries", on page 38.
Result Displays
Pseudorange Correction Data Graph (PRC Graph)
4.6 Pseudorange Correction Data Graph (PRC Graph)
The PRC graph displays the data from the data logger graphically. It displays the pseudorange correction data contained in messages of type 1 in the stored data log.
To display this view, select the "PRC Graph" softkey from the "GBAS / SCAT Data
Logger" list view.
In order to see the SCAT-I correction data graph the option R&S EVS300-K10 is
required (see chapter 2.1, "Installing and Activating the GBAS and SCAT-I Analysis
Applications", on page 7).
The graph displays three traces:
●
yellow: the RF level in dBm measured in the time slot versus time
●
green: distance in meters between the GPS reference point and the decoded GPS
location (see also chapter 4.7, "GPS Information", on page 29)
●
white: pseudorange correction (PRC) data in meters vs. time for the specified slot
and satellite
For each trace, the start value, stop value and scaling per division is indicated in the
table above the diagram. The scaling for each trace can be defined individually.
27User Manual 1176.9212.02 ─ 02
Page 28

R&S®EVS300-K9/-K10
Result Displays
Pseudorange Correction Data Graph (PRC Graph)
Fig. 4-8: Graphical display of pseudorange correction data contained in a message of type 1
Time axis
The x-axis indicates the time of the data log entry. However, the time axis need not be
linear, and the duration in time between two samples need not be equal if the data was
not logged continuously. Each data entry is represented by an index. The start index
and the scaling of the x-axis are user-definable.
The actual time of an individual data entry is indicated when you position a cursor on a
particular data entry, see below.
Cursor
A cursor is available to select an individual data log entry. The cursor is indicated as a
vertical red line and can be positioned to any available list entry in the data log. The
position of the cursor on the x-axis, as well as the time of the selected list entry, is indicated above the diagram.
28User Manual 1176.9212.02 ─ 02
Page 29

R&S®EVS300-K9/-K10
Result Displays
GPS Information
Fig. 4-9: Cursor in the Data Logger
4.7 GPS Information
In addition to the specific GBAS/SCAT-I data, the captured GPS data may be of interest. If option R&S EVS300-K2 is installed, the GPS mode is available. The GPS view
now includes information on a specified reference point and the distance between the
currently received GPS data and the specified reference point.
29User Manual 1176.9212.02 ─ 02
Page 30

R&S®EVS300-K9/-K10
Result Displays
GPS Information
Fig. 4-10: GPS view with additional information on GPS reference point
The following information has been added:
●
Ref. Lat.: Latitude of the reference point in degrees, minutes (decimal format) and
direction
●
Ref. Long.: Longitude of the reference point in degrees, minutes (decimal format)
and direction
●
Dist. from Ref.: Distance of the received GPS position from the indicated reference point
●
Angle Ref.: Angle of the received GPS position from the indicated reference point
Reference point
The reference point is preset to a default position. However, it can be changed manually to any other position.
To change the position of the reference point, select the "Ref.Point Latitude" or
"Ref.Point Longitude" softkey. Select the softkey again to toggle between the degree,
minute, and direction information.
Remote command:
SETUP:GPSREF on page 48
For more information on the GPS mode see the main R&S EVS300 User Manual.
30User Manual 1176.9212.02 ─ 02
Page 31

R&S®EVS300-K9/-K10
5 Configuration and Analysis
GBAS and SCAT-I Analysis require a special application on the R&S EVS300, which
you activate using the SPLIT key on the front panel.
● Defining the Receive Frequency.............................................................................31
● Setting the RF Input Attenuation.............................................................................31
● Working with the Data Logger.................................................................................32
Configuration and Analysis
Defining the Receive Frequency
5.1 Defining the Receive Frequency
The frequency at which data is received from the ground station is configured via the
FREQ key. The currently recieved frequency is indicated in the GBAS/SCAT-I main
window.
Remote command:
RF / GBAS:FREQRF on page 47
5.2 Setting the RF Input Attenuation
The input attentuation mode determines the sensitivity of the input channel. Depending
on the level of the incoming signal, the input connector of the R&S EVS300 must be
protected from overload, while avoiding signal distortion for weak signals. The attenuation mode changes the sensitivity of the input connector by selecting a different signal
path for each mode. The valid input levels for each mode are indicated by a color bar
in the GBAS/SCAT-I main view. The attenuation mode should be selected such that
the input level always remains within the green area.
Att.Mode
The following attenuation modes are provided:
"Low Noise"
For signal levels in the range of -90 dBm to -53 dBm
Provides a high sensitivity;
Suitable when scanning the area for distant signals, as the noise level
is kept low and high-level signals are not to be expected.
"Normal"
For signal levels in the range of -65 dBm to -23 dBm
Provides a normal sensitivity;
Suitable when a signal has been detected in the distance and only
medium-level signals are expected.
"Low Distortion"
For signal levels in the range of -35 dBm to +13 dBm
Provides a low sensitivity and high protection;
Suitable when analyzing a nearby signal, to avoid overload due to
high-level signals.
31User Manual 1176.9212.02 ─ 02
Page 32

R&S®EVS300-K9/-K10
Configuration and Analysis
Working with the Data Logger
"LN+AGC"
For signal levels in the range of -90 dBm to -20 dBm
The signal attenuation is selected automatically according to the signal strength in each slot.
Since the signal offers only a very short period of time for such AGC
operations, this mode works best with clean signals. In difficult receiving conditions it may be more stable to use the "Low Noise", "Normal"
or "Low Distortion" mode.
When monitoring signals with mostly constant signal levels, it is also
recommended that you use the "Low Noise", "Normal" or "Low Distortion" mode.
Remote command:
GBAS:ATTMODE on page 47
GBAS:LEV? on page 59
5.3 Working with the Data Logger
The Data Logger records and manages the data captured during a single measurement or a series of measurements. Data Logger functions are available when you
press the MEM key in GBAS/SCAT-I mode.
For details on the Data Logger see chapter 3.4, "Data Acquisition with the Data Log-
ger", on page 13.
● Setting Up the Data Logger.....................................................................................32
● Synchronizing the R&S EVS300 Clock...................................................................35
● Starting and Stopping the Data Logger...................................................................37
● Analyzing the Data Logger Entries..........................................................................38
● Managing Data Logger Lists................................................................................... 39
● Selecting Parameters in the Data Logger List.........................................................41
● Configuring the PRC Graph.................................................................................... 43
5.3.1 Setting Up the Data Logger
You can define when and how often data is logged. These settings are available when
you press the SETUP key and then select "Data Logger".
32User Manual 1176.9212.02 ─ 02
Page 33

R&S®EVS300-K9/-K10
Configuration and Analysis
Working with the Data Logger
Fig. 5-1: Data Logger Setup dialog box
Logging Channels......................................................................................................... 33
Logging Source............................................................................................................. 33
Logging Interval.............................................................................................................34
Ext. Trigger Count......................................................................................................... 34
Ext. Trigger Impulse...................................................................................................... 34
Auto Power Down......................................................................................................... 34
Logging Mode............................................................................................................... 34
Logging Channels
Selects the channel (RF board 1 or 2) to be logged.
Logging Source
Specifies the function that defines when and how often data is logged.
"time"
"ext. trigger"
A time interval defines how often data is logged.
When the specified number of pulses was received from an external
trigger (Ext. Trigger Count), the R&S EVS300 logs a single data set.
"time + ext.
trigger"
Data is logged in the specified time interval, and additionally when an
external trigger is received. A data set that was logged due to a trigger is indicated by a status flag "T".
"time + PPS"
A time interval defines how often data is logged. The GPS time in the
data sets is synchronized with the PPS signal of a connected GPS
receiver to ensure a common time reference. This setting requires a
GPS receiver with PPS to be connected to the R&S EVS300.
33User Manual 1176.9212.02 ─ 02
Page 34

R&S®EVS300-K9/-K10
Logging Interval
Defines the interval of logging in hours and minutes, in seconds (decimal format), or
both. Each time the interval is completed, a single data set is logged.
Ext. Trigger Count
If an external trigger is used as the Logging Source, this parameter specifies how
many pulses the connected device must send before data logging is triggered.
Ext. Trigger Impulse
If an external trigger is used as the Logging Source, this parameter specifies whether
rising (positive) or falling (negative) edges are counted on the signal from the trigger
device.
Auto Power Down
If enabled, the R&S EVS300 automatically switches off after each measurement. Two
minutes before the next measurement is due, the R&S EVS300 automatically boots
again in order to be ready in time. Thus, this function is only useful for time intervals
larger than five minutes in order to save battery power.
Configuration and Analysis
Working with the Data Logger
Logging Mode
Defines how often the active list which is used for logging is switched.
Note: If the list is full before the specified switching time, logging is stopped.
"single"
"week"
"month"
"24/7"
The same active list is used continuously. When the list is full, logging
is stopped.
For each day of the week (starting Monday), a different list is activated. After one week, the first list is cleared and logging starts in this
list again.
For each day of the month, a different list is activated. After one
month, the first list is cleared and logging starts in this list again.
After each hour, a new list is activated. For each day of the week specific lists are used:
Monday: lists 100 to 123
Tuesday: lists 200 to 223
Wednesday: lists 300 to 323
etc.
After one week, the first list is cleared and logging starts in this list
again.
This is useful to determine the used list at a specific time easily.
(See also chapter 5.3.2, "Synchronizing the R&S EVS300 Clock",
on page 35).
34User Manual 1176.9212.02 ─ 02
Page 35
R&S®EVS300-K9/-K10
Configuration and Analysis
Working with the Data Logger
"24/31"
After each day of the month, after each hour, a new list is activated.
For each day of the month specific lists are used:
First day: lists 100 to 123
Second day: lists 200 to 223
etc.
31st day: lists 3100 to 3123
After one month, the first list is cleared and logging starts in this list
again.
This is useful to determine the used list at a specific time easily.
(See also chapter 5.3.2, "Synchronizing the R&S EVS300 Clock",
on page 35).
Remote command:
LISTMODE on page 51
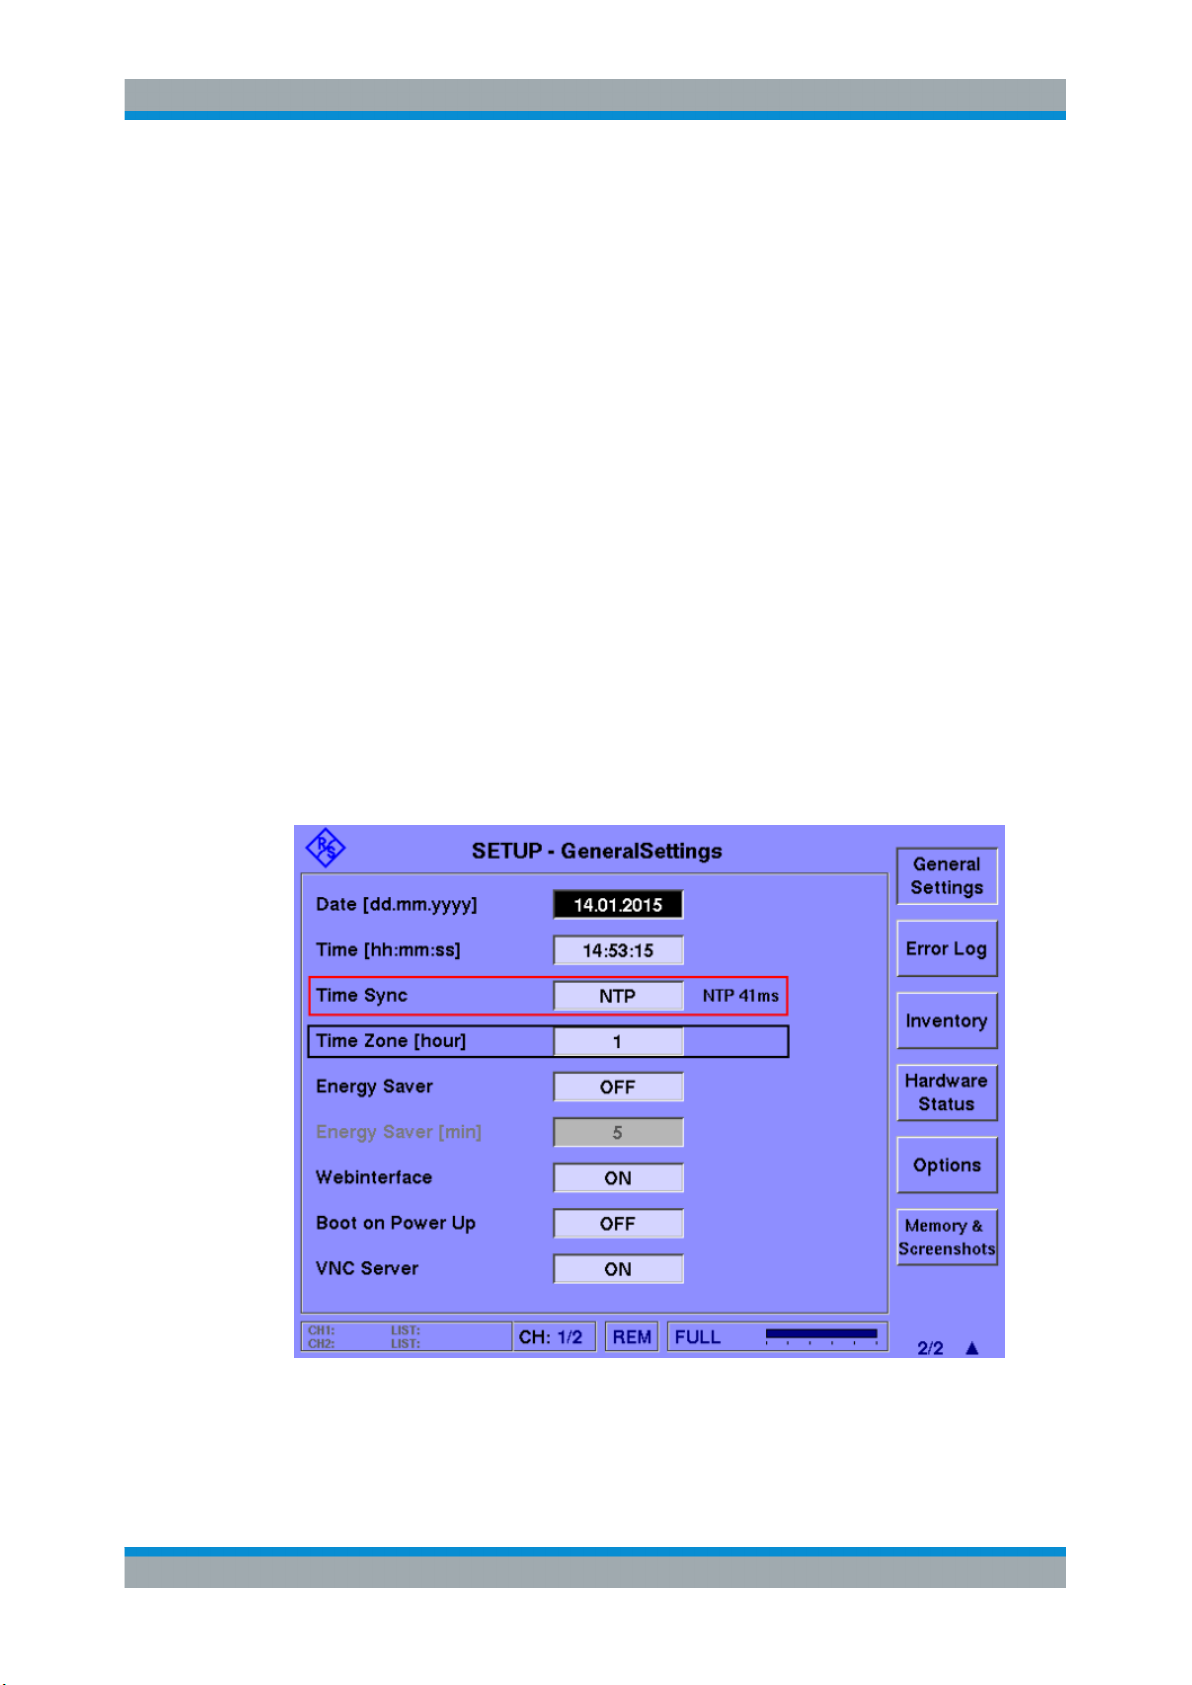
5.3.2 Synchronizing the R&S EVS300 Clock
For longterm measurements, you can define data logging where a new list is started
every hour of the day (see "Logging Mode" on page 34). To determine when to start a
new list, the Data Logger refers to the operating system clock of the R&S EVS300. In
order to improve accuracy you can synchronize this clock to a GPS or NTP server.
These settings are available when you press the SETUP key and then select "General
Settings".
Fig. 5-2: Time Synchronization settings
35User Manual 1176.9212.02 ─ 02
Page 36

R&S®EVS300-K9/-K10
Time Sync..................................................................................................................... 36
Time zone..................................................................................................................... 36
NTP Server................................................................................................................... 36
Time Sync
Defines the time source with which the R&S EVS300 clock is synchronized. The current offset from the source is indicated next to the input field (if synchronization is successful). If the R&S EVS300 clock differs from the selected synchronization source
time by more than 1000 ms, the R&S EVS300 clock is adjusted accordingly.
Supported synchronization sources:
"Off"
Configuration and Analysis
Working with the Data Logger
No synchronization is performed for the internal R&S EVS300 clock.
"GPS"
"NTP"
Remote command:
SETUP:TIMESYNC on page 56
SETUP:GETSYNCSTATUS? on page 55
Time zone
GPS and NTP usually provide normal time (UTC). In order to take a time zone difference into account on the R&S EVS300, define an offset in hours.
Remote command:
SETUP:TIMEZONE on page 56
NTP Server
The NTP server for time synchronization is specified by its IP address under "Setup >
Remote Control":
Synchronization with a connected GPS (see the main R&S EVS300
User Manual)
Synchronization with a connected NTP server (see "NTP Server"
on page 36)
36User Manual 1176.9212.02 ─ 02
Page 37

R&S®EVS300-K9/-K10
Configuration and Analysis
Working with the Data Logger
Fig. 5-3: NTP Server configuration
Remote command:
SETUP:NTPSERVER on page 55
5.3.3 Starting and Stopping the Data Logger
You can start and stop the Data Logger manually.
Starting the Data Logger............................................................................................... 37
Stopping the Data Logger............................................................................................. 38
Starting the Data Logger
Press the START key to start logging data for the selected time slots. The data
received from the selected channel and the selected receive frequency is stored internally and can be streamed via remote control or displayed on the screen (see "PRC
Graph View" on page 39).
Note: Be aware that if no time slots are selected for logging (see chapter 5.3.6,
"Selecting Parameters in the Data Logger List", on page 41), logging cannot be acti-
vated.
You can select which parameters are displayed; see chapter 5.3.6, "Selecting Parame-
ters in the Data Logger List", on page 41.
Remote command:
DL_START on page 49
37User Manual 1176.9212.02 ─ 02
Page 38

R&S®EVS300-K9/-K10
Stopping the Data Logger
Press the STOP key to stop logging data.
Remote command:
DL_STOP on page 50
Configuration and Analysis
Working with the Data Logger
5.3.4 Analyzing the Data Logger Entries
The stored data can be output graphically on the screen or as a data stream in remote
operation.
Press the MEM key to display the main Data Logger view.
Fig. 5-4: Main Data Logger view
Select List
......................................................................................................................39
Clear List....................................................................................................................... 39
Select Line.................................................................................................................... 39
Copy List to USB...........................................................................................................39
List Index.......................................................................................................................39
Select Params...............................................................................................................39
PRC Graph View...........................................................................................................39
38User Manual 1176.9212.02 ─ 02
Page 39

R&S®EVS300-K9/-K10
Select List
Selects one of up to 9999 data set lists for analysis. The contents of the currently
selected list are displayed in the overview. When the data logger is started, the data is
appended to the currently selected list.
Remote command:
SETACTIVELIST on page 54
Clear List
Clears the currently selected list. All entries are deleted.
Remote command:
CLEARACTIVELIST on page 49
Select Line
Selects an individual data entry in the data log. Scroll through the entries in the list
using the rotary knob or the "Up Arrow" and "Down Arrow" keys.
Note that a single list may contain up to 1 000 000 entries!
Copy List to USB
Copies the selected list to a connected USB storage device as a .CSV file. A default
file name is proposed but can be edited.
Remote command:
SAVEACTIVELIST2USB on page 53
Configuration and Analysis
Working with the Data Logger
List Index
Displays an overview of all available Data Logger lists. For details see chapter 5.3.5,
"Managing Data Logger Lists", on page 39.
Select Params
Selects the parameters and time slots for which data is displayed. For details see
chapter 5.3.6, "Selecting Parameters in the Data Logger List", on page 41.
Remote command:
SELECTLISTPARAM on page 54
PRC Graph View
Displays the Pseudorange Correction Data Graph (PRC Graph) of the displayed data
list. The diagram can be configured, see chapter 5.3.7, "Configuring the PRC Graph",
on page 43 for details.
5.3.5 Managing Data Logger Lists
Up to 9999 lists with a maximum of 1 000 000 data lines each can be recorded in
GBAS/SCAT-I mode. These lists can be managed in the Data Logger list index view.
39User Manual 1176.9212.02 ─ 02
Page 40

R&S®EVS300-K9/-K10
Configuration and Analysis
Working with the Data Logger
Fig. 5-5: Data Logger list index view
This view is displayed when you press the MEM key in GBAS/SCAT-I mode and then
select "List Index".
Select List......................................................................................................................40
Clear List....................................................................................................................... 40
Rename.........................................................................................................................40
Copy List to USB...........................................................................................................41
Next Empty List............................................................................................................. 41
Clear All Lists................................................................................................................ 41
Back to List View...........................................................................................................41
Select List
Selects an individual list in the data log list index. Scroll through the entries in the index
using the rotary knob or the "Up Arrow" and "Down Arrow" keys.
Note that the index may contain up to 9999 entries!
Remote command:
SETACTIVELIST on page 54
Clear List
Clears the currently selected list. All entries are deleted.
Remote command:
CLEARACTIVELIST on page 49
Rename
Renames the currently selected list to the user-defined name.
40User Manual 1176.9212.02 ─ 02
Page 41

R&S®EVS300-K9/-K10
Copy List to USB
Copies the selected list to a connected USB storage device as a .CSV file. A default
file name is proposed but can be edited.
Remote command:
SAVEACTIVELIST2USB on page 53
Next Empty List
Selects the next list in the index that does not yet contain data. This is useful to start a
new list rather than appending data to an existing data list when the data logger is started.
Clear All Lists
Clears all lists in the index. All data in the lists is deleted.
Remote command:
CLEARALLLISTS on page 49
Back to List View
Returns to the Data Logger list view for the selected list.
Configuration and Analysis
Working with the Data Logger
5.3.6 Selecting Parameters in the Data Logger List
You can define which data is logged and displayed for the currently selected list.
This view is displayed when you press the MEM key in GBAS/SCAT-I mode and then
select "Select Params".
Fig. 5-6: GBAS / SCAT Data Logger parameter and time slot selection
41User Manual 1176.9212.02 ─ 02
Page 42

R&S®EVS300-K9/-K10
For more information on selecting parameters for the Data Logger see "Selecting
parameters" on page 14.
Select for Logg.............................................................................................................. 42
Drag and Drop (Changing the order of the parameters)............................................... 42
Select All....................................................................................................................... 42
Select None...................................................................................................................42
Default Order.................................................................................................................42
Default Selection........................................................................................................... 42
Back to List View...........................................................................................................42
Select for Logg.
Toggles the selection for the currently highlighted parameter or time slot for logging. If
the parameter or time slot was previously already selected, it is deselected. All parameters and slots selected for logging are displayed with a green background.
To scroll through the list of available parameters and time slots use the rotary knob or
the "Up Arrow" and "Down Arrow" keys.
Only the parameters selected for logging are displayed and stored in the data log. Note
that if no time slots are selected, data logging can not be activated.
Configuration and Analysis
Working with the Data Logger
Drag and Drop (Changing the order of the parameters)
Marks the selected parameter (with a blue background) to move it to a different position in the list. Use the rotary knob to select the new position within the list. Select
"Drag and Drop" again to insert the selected parameter at the new position.
Note that the data is stored in this order.
Select All
Selects all parameters and all time slots for logging.
Select None
Deselects all parameters and all time slots for logging.
Note: Be aware that if no time slots are selected for logging, logging cannot be activated.
Default Order
Restores the default order of the parameters according to the factory defaults (as
described in chapter A.2, "Format Description of GBAS and SCAT-I Data",
on page 61).
Default Selection
Restores the default selection of the parameters according to the factory defaults (as
described in chapter A.2, "Format Description of GBAS and SCAT-I Data",
on page 61).
Back to List View
Returns to the Data Logger list view for the selected list.
42User Manual 1176.9212.02 ─ 02
Page 43

R&S®EVS300-K9/-K10
Configuration and Analysis
Working with the Data Logger
5.3.7 Configuring the PRC Graph
The information in the data log for a single slot and a single satellite can also be displayed graphically, in the Pseudorange Correction Data Graph (PRC Graph).
This view is displayed when you press the MEM key in GBAS/SCAT-I mode and then
select "PRC Graph".
Fig. 5-7: GBAS/SCAT-I PRC graph
The diagram can be configured using the following functions:
Start Index.....................................................................................................................43
Time Slot....................................................................................................................... 43
Trace/Sat.......................................................................................................................43
Sample/Xdiv.................................................................................................................. 44
PRC/Ydiv.......................................................................................................................44
Dist/Ydiv........................................................................................................................ 44
Cursor (2/2)................................................................................................................... 44
Back to List View...........................................................................................................44
Start Index
Defines the starting point of the x-(time-)axis.
Time Slot
Selects the time slot (0 to 7) for which data is displayed in the graph.
Trace/Sat
Selects one trace, that is: one satellite (1 to 32), for which data is highlighted white in
the graph. All other satellite traces are indicated by gray lines.
43User Manual 1176.9212.02 ─ 02
Page 44

R&S®EVS300-K9/-K10
Sample/Xdiv
Defines the scaling of the x-(time-)axis as the number of samples displayed per division. Predefined values between 5 and 500 are available.
PRC/Ydiv
Defines the y-axis scaling for the PRC graph as the meters displayed per division. Predefined values between 0.2 m and 200.0 m are available.
Dist/Ydiv
Defines the y-axis scaling for the distance to reference point trace as the meters displayed per division. Predefined values between 0.1 m and 20.0 m are available.
Cursor (2/2)
Sets the cursor (vertical red line) to the data entry selected by its index in the Data
Logger list.
The position of the cursor on the x-axis, as well as the time of the selected list entry, is
indicated above the diagram.
(This softkey is available on the second softkey page for the PRC graph.)
Configuration and Analysis
Working with the Data Logger
Back to List View
Returns to the Data Logger list view for the selected list.
44User Manual 1176.9212.02 ─ 02
Page 45

R&S®EVS300-K9/-K10
6 Optimizing and Troubleshooting Analysis
If the results do not meet your expectations, possibly the following information will help:
Error message: UNCAL................................................................................................ 45
Unstable results display................................................................................................ 45
Incorrect slot assignment.............................................................................................. 45
No values displayed...................................................................................................... 45
Error message: UNCAL
Error which might cause incorrect results.
Solution: Reboot the instrument.
If the error persists, a hardware error may be the cause. Contact your
Rohde & Schwarz service representative.
Unstable results display
Possible solutions:
●
●
Optimizing and Troubleshooting Analysis
Define a suitable input attenuation mode manually rather than using "LN+AGC"
mode (see chapter 5.2, "Setting the RF Input Attenuation", on page 31)
Check the status of the PPS signal in the main view. If the status is NOK, check
the GPS receiver connection. (See also chapter 3.6, "Time Slot Synchronization
via PPS", on page 15.)
Incorrect slot assignment
Possible solution:
Check the status of the PPS signal in the main view. If the status is NOK, check the
GPS receiver connection.
Using an oscilloscope, check the PPS signal. Each pulse per second should have a
maximum duration of 1 ms. (See also chapter 3.6, "Time Slot Synchronization via
PPS", on page 15.)
No values displayed
Possible solution:
Restart the internal signal processing by pressing the checkmark key on the front panel
of the R&S EVS300 (in the navigation area beneath the rotary knob).
45User Manual 1176.9212.02 ─ 02
Page 46

R&S®EVS300-K9/-K10
7 Remote Commands to Perform GBAS and
SCAT-I Analysis
The following commands are required to perform measurements in the GBAS and
SCAT-I Analysis application in a remote environment. It is assumed that the
R&S EVS300 has already been set up for remote operation in a network as described
in the R&S EVS300 User Manual.
Note that basic tasks that are also performed in the base unit in the same way are not
described here. For a description of such tasks, see the R&S EVS300 User Manual.
Conventions used in Remote Command Descriptions
Note the following conventions used in the remote command descriptions:
●
●
●
Remote Commands to Perform GBAS and SCAT-I Analysis
Activating GBAS and SCAT-I Analysis
Command and parameter syntax
All commands and parameters described here are case-insensitive.
Default unit
This is the unit used for numeric values if no other unit is provided with the parameter.
Manual operation
If the result of a remote command can also be achieved in manual operation, a link
to the description is inserted.
The following tasks specific to the GBAS and SCAT-I Analysis application are described here:
● Activating GBAS and SCAT-I Analysis................................................................... 46
● Configuring GBAS and SCAT-I Analysis.................................................................47
● Configuring the GPS Reference Point.................................................................... 48
● Configuring the Data Logger...................................................................................48
● Configuring Time Synchronization with the R&S EVS300 Clock............................ 55
● Activating a Data Stream........................................................................................ 57
● Retrieving Results...................................................................................................58
7.1 Activating GBAS and SCAT-I Analysis
GBAS and SCAT-I Analysis requires a special application on the R&S EVS300. A
measurement is started immediately with the default settings.
MODE_GBAS..................................................................................................................46
MODE_GBAS
Activates the GBAS/SCAT-I mode.
46User Manual 1176.9212.02 ─ 02
Page 47

R&S®EVS300-K9/-K10
Usage: Setting only
Remote Commands to Perform GBAS and SCAT-I Analysis
Configuring GBAS and SCAT-I Analysis
7.2 Configuring GBAS and SCAT-I Analysis
The following commands are required to configure GBAS and SCAT-I analysis.
GBAS:FREQRF?............................................................................................................. 47
GBAS:FREQRF............................................................................................................... 47
GBAS:ATTMODE?...........................................................................................................47
GBAS:ATTMODE.............................................................................................................47
GBAS:FREQRF?
GBAS:FREQRF <Freq>
This command defines the receive frequency for the GBAS signal. The query returns
the most recently measured frequency.
This command is identical to the general R&S EVS300 RF command.
Parameters:
<Freq> Default value: 108 MHz
Range: 75 MHz to 350 MHz
Default unit: kHz
Return values:
<SettingResult> READY
Setting was successfully applied.
ERROR
An error occurred; setting was not successful.
Example:
GBAS:FREQRF 117.975
GBAS:ATTMODE?
GBAS:ATTMODE <Mode>
This command defines the attenuation mode. The query returns the mode that was
actually used for the current measurement.
Parameters:
<Mode> LN
(Low Noise) Applies an attenuation of +10 dB.
NORM
(Normal) Applies no attenuation.
LD
(Low Distortion) Applies an attenuation of -25 dB.
LN+AGC
The attenuation mode is selected automatically, depending on
the measured power level.
Default value: LN+AGC
47User Manual 1176.9212.02 ─ 02
Page 48

R&S®EVS300-K9/-K10
Return values:
<SettingResult> READY
Remote Commands to Perform GBAS and SCAT-I Analysis
Configuring the GPS Reference Point
Setting was successfully applied.
ERROR
An error occurred; setting was not successful.
Example:
GBAS:ATTMODE LN
Manual operation: See "Att.Mode" on page 31
7.3 Configuring the GPS Reference Point
In addition to the specific GBAS/SCAT-I data, the captured GPS data may be of interest. If option R&S EVS300-K2 is installed, the GPS mode is available. The GPS view
now includes information on a detected or manually specified reference point and the
distance between the currently received GPS data and the indicated reference point.
The new command to define the reference point is described here. For all other GPSrelated commands, see the main R&S EVS300 User Manual.
SETUP:GPSREF............................................................................................................. 48
SETUP:GPSREF <Latitude>,<Longitude>
By default, the reference point for GPS information is automatically taken from the
position of the built-in GPS antenna of the R&S EVS300. However, it can be changed
manually to any other position using this command.
Parameters:
<Latitude> <degrees><minutes><direction>
Latitude of the reference point in degrees, minutes (decimal format) and direction (S | N)
<Longitude> <degrees><minutes><direction>
Longitude of the reference point in degrees, minutes (decimal
format) and direction (W | E)
Example:
7.4 Configuring the Data Logger
SETUP:GPSREF 89°44.123456789S,23°55.123456789S
You can define which data is stored during the measurement.
For details on the Data Logger see chapter 3.4, "Data Acquisition with the Data Log-
ger", on page 13.
Useful commands for the Data Logger described elsewhere:
●
chapter 7.5, "Configuring Time Synchronization with the R&S EVS300 Clock",
on page 55
48User Manual 1176.9212.02 ─ 02
Page 49

R&S®EVS300-K9/-K10
Remote commands exclusive to configuring the Data Logger:
CLEARACTIVELIST.........................................................................................................49
CLEARALLLISTS ............................................................................................................49
DL_START......................................................................................................................49
DL_STOP....................................................................................................................... 50
GETACTIVELIST............................................................................................................. 50
GETFREEMEMORY ....................................................................................................... 50
GETLISTDATA ............................................................................................................... 51
GETLISTSIZE..................................................................................................................51
LISTMODE......................................................................................................................51
GBAS:LOGSLOTS...........................................................................................................52
SAVEACTIVELIST2USB...................................................................................................53
SELECTLISTPARAM....................................................................................................... 54
SETACTIVELIST............................................................................................................. 54
CLEARACTIVELIST
This command clears the currently active list. All entries are deleted.
Remote Commands to Perform GBAS and SCAT-I Analysis
Configuring the Data Logger
Return values:
<EventResult> READY
Command was executed successfully
ERROR
An error occurred; command was not successful
Example:
SETACTIVELIST 2
Defines list 2 as the active list.
CLEARACTIVELIST
Clears list 2.
Manual operation: See "Clear List" on page 39
CLEARALLLISTS
This command clears all 999 list for the GBAS/SCAT-I mode. All entries are deleted in
all lists.
Return values:
<EventResult> READY
Command was executed successfully
ERROR
An error occurred; command was not successful
Manual operation: See "Clear All Lists" on page 41
DL_START
Starts logging data for the selected time slots and the currently selected parameters
until the DL_STOP command is executed. The data received from the selected channel
and the selected receive frequency is stored internally.
49User Manual 1176.9212.02 ─ 02
Page 50

R&S®EVS300-K9/-K10
To reduce the amount of logged data, restrict it to specific time slots or parameters, or
both. See SELECTLISTPARAM on page 54 and GBAS:LOGSLOTS on page 52.
In the default settings, the "short list" of parameters as specified in table 1-1 are
selected.
Return values:
<EventResult> READY
Usage: Event
Manual operation: See "Starting the Data Logger" on page 37
DL_STOP
Stops logging data.
Remote Commands to Perform GBAS and SCAT-I Analysis
Configuring the Data Logger
Command was executed successfully
ERROR
An error occurred; command was not successful
Return values:
<EventResult> READY
Command was executed successfully
ERROR
An error occurred; command was not successful
Usage: Event
Manual operation: See "Stopping the Data Logger" on page 38
GETACTIVELIST
This command retunrs the number of the currently active list for the Data Logger in the
GBAS/SCAT-I mode.
Return values:
<ListNo> integer
list number
Range: 1 to 999
Example:
SETACTIVELIST 2
Defines list 2 as the active list.
GETACTIVELIST
Queries the number of the active list.
Result:
2
GETFREEMEMORY
This command queries the amount of free storage space on the internal flash memory.
50User Manual 1176.9212.02 ─ 02
Page 51

R&S®EVS300-K9/-K10
Return values:
<FreeMemSize> Default unit: MByte
GETLISTDATA <ListNo>
This command queries the contents of the selected list.
Setting parameters:
<ListNo> integer
Return values:
<ListData> Contents of the list as described in chapter A.2, "Format
<EventResult> READY
Remote Commands to Perform GBAS and SCAT-I Analysis
Configuring the Data Logger
list number
Range: 1 to 999
Description of GBAS and SCAT-I Data", on page 61.
Command was executed successfully
ERROR
An error occurred; command was not successful
Example:
GETLISTSIZE
This command queries the size of the active list.
Return values:
<NoEntries> integer
Number of entries in the active list.
Range: 0 to 1 000 000
LISTMODE <Mode>
This command defines how often the active list which is used for logging is switched.
51User Manual 1176.9212.02 ─ 02
Page 52

R&S®EVS300-K9/-K10
Parameters:
<Mode> SINGLE
Remote Commands to Perform GBAS and SCAT-I Analysis
Configuring the Data Logger
(Default:) The same active list is used continuously. When the
list is full, logging is stopped.
WEEK
For each day of the week (starting Monday), a different list is
activated. After one week, the first list is cleared and logging
starts in this list again.
MONTH
For each day of the month, a different list is activated. After one
month, the first list is cleared and logging starts in this list again.
24_7
After each hour, a new list is activated. For each day of the week
specific lists are used:
Monday: lists 100 to 123
Tuesday: lists 200 to 223
Wednesday: lists 300 to 323
etc.
After one week, the first list is cleared and logging starts in this
list again.
24_31
After each day of the month, after each hour, a new list is activated. For each day of the month specific lists are used:
First day: lists 100 to 123
Second day: lists 200 to 223
etc.
31st day: lists 3100 to 3123
After one month, the first list is cleared and logging starts in this
list again.
This is useful to determine the used list at a specific time easily.
Return values:
<SettingResult> READY
Setting was successfully applied.
ERROR
An error occurred; setting was not successful.
Example:
Manual operation: See "Logging Mode" on page 34
GBAS:LOGSLOTS <Channel>{<Channel},<TimeSlot>{<TimeSlot>}
This command defines the slots to be logged by the Data Logger.
Tip: to select the parameters to be included in data logging use the
SELECTLISTPARAM command.
LISTMODE MONTH
52User Manual 1176.9212.02 ─ 02
Page 53

R&S®EVS300-K9/-K10
Setting parameters:
<Channel> 1 | 2
<TimeSlot> 0 | 1 | 2 | 3 | 4 | 5 | 6 | 7
Return values:
<EventResult> READY
Usage: Setting only
SAVEACTIVELIST2USB <Filename>
This command copies the active list to a connected USB storage device as a .CSV file
with the specified name.
Remote Commands to Perform GBAS and SCAT-I Analysis
Configuring the Data Logger
Channel assigned to the receiving antenna (RF board);
Numbers of the time slots for which the results are to be logged.
By default, the results for all time slots are logged.
Command was executed successfully
ERROR
An error occurred; command was not successful
Note that this command may be very time-consuming for long lists (max. 1 000 000
entires!).
To reduce the amount of logged data, restrict it to specific time slots or parameters, or
both. See SELECTLISTPARAM on page 54 and GBAS:LOGSLOTS on page 52.
Parameters:
<Filename> string
Path, file name and extension of the file on the USB device to
which the data will be stored: Note that a specified path must
already exist on the USB device, otherwise an error occurs.
Return values:
<EventResult> MOUNT
Preparing access to USB device
COPY
Copying files to USB device
UNMOUNT
Exiting USB device
READY
Command was executed successfully
ERROR
An error occurred; command was not successful
Example:
SETACTIVELIST 2
//Defines list 2 as the active list.
SAVEACTIVELIST2USB DataLogs\Mar2014\DataLog1.csv
Manual operation: See "Copy List to USB" on page 39
53User Manual 1176.9212.02 ─ 02
Page 54

R&S®EVS300-K9/-K10
SELECTLISTPARAM <Params>
This command selects the parameters to be logged. For details see chapter 5.3.6,
"Selecting Parameters in the Data Logger List", on page 41.
In the default settings, the "short list" of parameters as specified in table 1-1 are
selected.
Tip: to select the time slots to be included in data logging use the GBAS:LOGSLOTS
command.
Parameters:
<Params> Parameters to be included in data log.
Remote Commands to Perform GBAS and SCAT-I Analysis
Configuring the Data Logger
ALL
All parameters are selected for logging.
Repeat the command with specific parameter numbers to
exclude individual parameters in a subsequent step.
NONE
All parameters are deselected.
Repeat the command with specific parameter numbers to
include individual parameters in a subsequent step.
<integer>;{<integer>;}
The parameters with the specified numbers are selected for logging.
!<integer>;{!<integer>;}
The parameters with the specified numbers are deselected for
logging.
Example:
//Deselect all parameters for logging
SELECTLISTPARAM NONE
//Select the first 5 parameters in the list for logging
SELECTLISTPARAM 1;2;3;4;5;
(See table 1-1) .
Example:
//Select all parameters for logging
SELECTLISTPARAM ALL
//Deselect the GPS parameters for logging.
SELECTLISTPARAM !19;!20;!21;!22;!23;!24;!25;!26;!27;
Manual operation: See "Select Params" on page 39
SETACTIVELIST <ListNo>
This command selects one of the 999 possible lists for subsequent Data Logger tasks
in the GBAS/SCAT-I mode.
Setting parameters:
<ListNo> integer
list number
Range: 1 to 999
54User Manual 1176.9212.02 ─ 02
Page 55

R&S®EVS300-K9/-K10
Return values:
<EventResult> READY
Remote Commands to Perform GBAS and SCAT-I Analysis
Configuring Time Synchronization with the R&S EVS300 Clock
Command was executed successfully
ERROR
An error occurred; command was not successful
Example:
SETACTIVELIST 2
Usage: Setting only
Manual operation: See "Select List" on page 39
See "Select List" on page 40
7.5 Configuring Time Synchronization with the
R&S EVS300 Clock
In order to improve accuracy in longterm data logging you can synchronize the
R&S EVS300 clock to a GPS or NTP server.
SETUP:GETSYNCSTATUS?............................................................................................ 55
SETUP:NTPSERVER.......................................................................................................55
SETUP:TIMESYNC?........................................................................................................ 56
SETUP:TIMESYNC..........................................................................................................56
SETUP:TIMEZONE?........................................................................................................ 56
SETUP:TIMEZONE..........................................................................................................56
SETUP:GETSYNCSTATUS?
Queries the current offset of the internal R&S EVS300 clock from the time synchronization source if synchronization is successful (see SETUP:TIMESYNC on page 56).
If the R&S EVS300 clock differs from the selected synchronization source time by
more than 1000 ms, the R&S EVS300 clock is adjusted accordingly.
Return values:
<Offset> Deviation in ms
Example:
SETUP:TIMESYNC NTP
SETUP:NTPSERVER 10.0.2.166
SETUP:GETSYNCSTATUS?
0.001
Usage: Query only
Manual operation: See "Time Sync" on page 36
SETUP:NTPSERVER <IPAdress>
Defines the IP address of the NTP server used for time synchronization of the internal
R&S EVS300 clock (see SETUP:TIMESYNC on page 56).
55User Manual 1176.9212.02 ─ 02
Page 56

R&S®EVS300-K9/-K10
Parameters:
<IPAdress> TCP/IP address between 0.0.0.0 and 0.255.255.255
Remote Commands to Perform GBAS and SCAT-I Analysis
Configuring Time Synchronization with the R&S EVS300 Clock
Example:
Usage: Setting only
Manual operation: See "NTP Server" on page 36
SETUP:TIMESYNC?
SETUP:TIMESYNC <Source>
Defines or queries the time source with which the R&S EVS300 clock is synchronized.
If the R&S EVS300 clock differs from the selected synchronization source time by
more than 1000 ms, the R&S EVS300 clock is adjusted accordingly.
Parameters:
<Source> OFF
SETUP:TIMESYNC NTP
SETUP:NTPSERVER 10.0.2.166
No synchronization is performed for the internal R&S EVS300
clock.
GPS
Synchronization with a connected GPS (see the main
R&S EVS300 User Manual)
NTP
Synchronization with a connected NTP server (see SETUP:
NTPSERVER on page 55)
Example:
Manual operation: See "Time Sync" on page 36
SETUP:TIMEZONE?
SETUP:TIMEZONE <Offset>
Defines or queries an offset in hours to the normal time (UTC) provided by the GPS or
NTP server. The offset is considered for time synchronization of the internal
R&S EVS300 clock.
Parameters:
<Offset> numeric value
Example:
Manual operation: See "Time zone" on page 36
SETUP:TIMESYNC NTP
Range: -12 to +12
Default unit: h
SETUP:TIMEZONE -1
56User Manual 1176.9212.02 ─ 02
Page 57

R&S®EVS300-K9/-K10
Remote Commands to Perform GBAS and SCAT-I Analysis
Activating a Data Stream
7.6 Activating a Data Stream
Data for a running measurement can be output to an external storage medium, independantly of the Data Logger.
For details on data streaming see chapter 3.5, "Data Streaming", on page 14.
GBAS:STREAM...............................................................................................................57
GBAS:STOPSTREAM...................................................................................................... 57
GBAS:STREAM <ListType>,<Channel>{<Channel},<TimeSlot>{<TimeSlot>}
This command starts sending a data stream with the results of the specified channel
and time slots to the remote control device. The data stream continues until the GBAS:
STOPSTREAM command is executed.
Setting parameters:
<ListType> FULL | SHORT
FULL
Outputs the complete list of data, as described in chapter A.2,
"Format Description of GBAS and SCAT-I Data", on page 61.
SHORT
Outputs an extract of the list of data, as described in chapter A.
2, "Format Description of GBAS and SCAT-I Data",
on page 61.
<Channel> 1 | 2
Channel assigned to the receiving antenna (RF board);
<TimeSlot> 0 | 1 | 2 | 3 | 4 | 5 | 6 | 7
Numbers of the time slots for which the results are to be output.
Example:
GBAS:STREAM FULL,12,24
Starts streaming the full list of results for channels 1 and 2 in
time slots 2 and 4.
Usage: Setting only
GBAS:STOPSTREAM
This command stops the data stream.
Return values:
<EventResult> READY
Command was executed successfully
ERROR
An error occurred; command was not successful
Usage: Event
57User Manual 1176.9212.02 ─ 02
Page 58

R&S®EVS300-K9/-K10
Remote Commands to Perform GBAS and SCAT-I Analysis
Retrieving Results
7.7 Retrieving Results
The following commands are required to retrieve the received data.
Useful commands for retrieving results described elsewhere:
●
GBAS:FREQRF? on page 47
●
GBAS:ATTMODE? on page 47
Remote commands exclusive to retrieving results:
GBAS:FMEAS?............................................................................................................... 58
GBAS:GETMDEF.............................................................................................................58
GBAS:GETMEAS.............................................................................................................59
GBAS:LEV?.................................................................................................................... 59
GBAS:FMEAS? <TimeSlot>
This command queries the difference between the measured frequency and the nominal receive frequency for the GBAS signal in the specified time slot.
Query parameters:
<TimeSlot> 0 | 1 | 2 | 3 | 4 | 5 | 6 | 7
Time slot
Return values:
<DeltaFreq> Default unit: kHz
Example:
GBAS:FMEAS? 2
Queries the measured delta frequency for time slot 2.
Usage: Query only
GBAS:GETMDEF <ListType>,<Channel>{<Channel}
This command returns the description of the contents of one line in the logged data.
The result can be used as a header row for a result table, for example.
One line corresponds to the captured data at the receive frequency for the GBAS signal in one time slot.
For details on the returned values see the chapter A.2, "Format Description of GBAS
and SCAT-I Data", on page 61.
58User Manual 1176.9212.02 ─ 02
Page 59

R&S®EVS300-K9/-K10
Setting parameters:
<ListType> FULL | SHORT
<Channel> 1 | 2
Remote Commands to Perform GBAS and SCAT-I Analysis
Retrieving Results
FULL
Returns headers for the complete list of logged data, as described in chapter A.2, "Format Description of GBAS and SCAT-I
Data", on page 61.
SHORT
Returns headers for an extract of the list of logged data, as
described in chapter A.2, "Format Description of GBAS and
SCAT-I Data", on page 61.
Channel assigned to the receiving antenna (RF board);
(currently irrelevant, but required)
Example:
GBAS:GETMEAS
This command returns the contents of one line in the logged data.
For details on the returned values see the chapter A.2, "Format Description of GBAS
and SCAT-I Data", on page 61.
Setting parameters:
<ListType> FULL | SHORT
<Channel> 1 | 2
GBAS:GETMDEF FULL
Returns the header row for a complete table of logged data.
<ListType>,<Channel>{<Channel},<TimeSlot>{<TimeSlot>}
FULL
Returns the complete list of logged data, as described in chap-
ter A.2, "Format Description of GBAS and SCAT-I Data",
on page 61.
SHORT
Returns an extract of the list of logged data, as described in
chapter A.2, "Format Description of GBAS and SCAT-I Data",
on page 61.
Channel assigned to the receiving antenna (RF board);
<TimeSlot> 0 | 1 | 2 | 3 | 4 | 5 | 6 | 7
Numbers of the time slots for which the results are to be
returned. By default, the results for all time slots are returned.
Example:
GBAS:LEV? <TimeSlot>
This command queries the most recently measured power level at the receive frequency for the GBAS signal in the specified time slot.
GBAS:GETMEAS FULL,12,24
Returns the full list of results for channels 1 and 2 in time slots 2
and 4.
59User Manual 1176.9212.02 ─ 02
Page 60

R&S®EVS300-K9/-K10
This command is identical to the general R&S EVS300 LA? query.
Query parameters:
<TimeSlot> 0 | 1 | 2 | 3 | 4 | 5 | 6 | 7
Return values:
<Level> Default unit: dBm
Remote Commands to Perform GBAS and SCAT-I Analysis
Retrieving Results
Time slot
Example:
Usage: Query only
Manual operation: See "Att.Mode" on page 31
GBAS:LEV? 2
Queries the measured power level for time slot 2.
60User Manual 1176.9212.02 ─ 02
Page 61

R&S®EVS300-K9/-K10
A Annex
Annex
References
A.1 References
●
[1] RTCA DO-246D, "GNSS-Based Precision Approach Local Area Augmentation
System (LAAS) Signal-in-Space Interface Control Document (ICD)"
●
[2] RTCA DO217, Minimum aviation system performance standards DGNSS instrument approach system: Special Category I (SCAT-I) , DO-217, August 1993
A.2 Format Description of GBAS and SCAT-I Data
The Data Logger records and manages the data captured during one or a series of
measurements. Up to 999 lists with a maximum of 1 000 000 data lines each can be
recorded. One line corresponds to the captured data at the receive frequency for the
GBAS signal in one time slot.
Similarly, a data stream consists of lines of measurement results, where one line corresponds to the captured data at the receive frequency for the GBAS signal in one time
slot.
You can also query a single measurement result, which corresponds to one row in the
Data Logger list.
In all three cases, the available parameters and their format are identical.
Which parameters are logged and in which order is user-definable and can be defined
individually for each list. The following overview describes all available parameters
(complete list) in their default order.
The format of the data for each slot is identical, regardless whether a parameter contains data or not. This allows you to create a table from the exported comma-separated
list. If a slot is empty, only the general data is stored in the list entry; the message-specific parameters are cropped.
When a list is stored to a file, a header line is automatically included that describes the
provided parameters.
General Information
The following general information is always included, regardless whether the slot contains data or not, and whether the signal is GBAS or SCAT type.
The number ("No.") in the following table is required to select the individual parameters
to be logged in remote operation, see SELECTLISTPARAM on page 54.
The parameters in this table are included in the "short list" for remote operation.
61User Manual 1176.9212.02 ─ 02
Page 62

R&S®EVS300-K9/-K10
Table 1-1: General information for the individual slot
No. Column Description
Annex
Format Description of GBAS and SCAT-I Data
1 STIOCP
2 Index Counts each measurement
3 Date Date of measurement
4 Time Time of measurement
5 Temp[°C] Temperature on R&S EVS300 mainboard
6 SLOT Time slot (A | B | C | D | E | F | G | H )
7 FREQ[MHz] Receiving frequency
8 F_DEV[kHz] Frequency deviation
9 LEVEL[dBm] Level measured over the "Synchronization and Ambiguity Resolution" period
10 SSID Received Station ID, equivalent to GBAS ID or SCAT ID
11 Len[bit] Length of the entire message block
Channel RF board 1 or 2
Status Flags:
●
S: Start (started manually)
●
T: Triggered (externally)
●
I: Invalid (power level not permitted or too low)
●
O: Overload (RF input signal too high)
●
C: Corrected (includes RF input correction factor)
●
P: PPS-synced (triggered by external PPS)
of the GBAS/SCAT signal
12 Train.FEC FEC of the training sequence
13 Applic.FEC FEC of the data content
14 MBI Message block identifier
15 MT 1 Message type 1 available (YES | NO)
16 MT 4 Message type 4 available (YES | NO)
17 GPS_lat. Received GPS data
18 GPS_long.
19 GPS_alt[m]
20 GPS_speed[km/h]
21 GPS_date
22 GPS_time
23 GPS_Sat
24 GPS_Status
25 GPS_Fix
26 GPS_HDOP
27 GPS_VDOP
28 GPS_Dist[m] Distance between GPS reference point and current GPS position
62User Manual 1176.9212.02 ─ 02
Page 63

R&S®EVS300-K9/-K10
No. Column Description
29 GPS_Angle[°] Angle between GPS reference point and current GPS position
30 ATT.MODE Attenuator mode during slot measurement (LN | NORM | LD)
GBAS Signal - MT1
After the general information, if the slot contains a message type 1, the following burst
data is provided for each of the up to 32 satellites (in "full" list only):
Table 1-2: Decoded message type 1 data for the individual slot and each satellite (GBAS)
Column Description
MT1 GBAS Section label (separator in list)
Annex
Format Description of GBAS and SCAT-I Data
In AUTO mode: the used hardware setting
MB CRC
MB ID
Stat ID Received Station ID, equivalent to GBAS ID or SCAT ID
MsgLen[byte]
Z-Cnt[m:s]
Add.Msg.Flag
NrOfMeasn
MeasnType
EphDecorPar[m/m]
EphemCrcMSB
EphemCrcLSB
SrcAvailDur[sec]
SatID
IOD
PRC[m]
Message block ID:
●
1010 1010: normal LAAS message (GBAS)
●
1111 1111: test LAAS message (GBAS)
RRCor[m/s]
S_pr_gnd[m]
DiffnprcB1[m]
DiffnprcB2[m]
DiffnprcB3[m]
DiffnprcB4[m]
For details on the correction data parameters refer to the GBAS specification [1].
63User Manual 1176.9212.02 ─ 02
Page 64

R&S®EVS300-K9/-K10
MT4
If the slot contains a message type 4, the following decoded message data is provided
for each of the up to 15 FASDBs (in "full" list only):
Table 1-3: Decoded message type 4 data for the individual slot and each FASDB (GBAS)
Column Description
MT4 GBAS Section label (separator in list)
Annex
Format Description of GBAS and SCAT-I Data
MB CRC
MB ID
Stat ID Received Station ID, equivalent to GBAS ID or SCAT ID
MsgLen[byte]
DataSetLen
OpType
SbasServProv
AirportID
RunwayNo
RunwayLtr
ApproachPerfDesig
RouteInd
RPDS
RefPathID
LTP_FTP_Lat[°]
Message block ID:
●
1010 1010: normal LAAS message (GBAS)
●
1111 1111: test LAAS message (GBAS)
LTP_FTP_Long[°]
LTP_FTP_Height[m]
DeltaFPAP_Lat[°]
DeltaFPAP_Long[°]
TCH
UnitTCH
GPA[°]
CourseWidth[m]
DeltaLenOffset[m]
VertAlertLim[m]
LatrAlertLim[m]
FASCRC
64User Manual 1176.9212.02 ─ 02
Page 65

R&S®EVS300-K9/-K10
SCAT-I Signal - MT1
After the general information, if the slot contains a message type 1, the following burst
data is provided for each of the up to 32 satellites (in "full" list only):
Table 1-4: Decoded message type 1 data for the individual slot and each satellite (SCAT-I)
Column Description
MT1 SCAT Section label (separator in list)
Annex
Format Description of GBAS and SCAT-I Data
MB CRC
MB ID
Stat ID Received Station ID, equivalent to GBAS ID or SCAT ID
MsgLen[byte]
Z-Cnt[m:s]
Acc.Err.Bnd.[m/s*s]
K_md_gnd
SatID
PRC[m]
IOD
RRCor[m/s]
S_pr_gnd[m]
B_pr_gnd[m]
S_fail_gnd[m]
B_fail_gnd[m]
Message block ID:
●
1001 1001: SCAT-I
PRC[m]
For details on the correction data parameters refer to the SCAT-I specification [2].
MT4
If the slot contains a message type 4, the following decoded message data is provided
for each of the up to 15 FASDBs (in "full" list only):
Table 1-5: Decoded message type 4 data for the individual slot and each FASDB (SCAT-I)
Column Description
MT4 DATA Section label (separator in list)
MB CRC
MB ID
Stat ID Received Station ID, equivalent to GBAS ID or SCAT ID
MsgLen[byte]
Message block ID:
●
1001 1001: SCAT-I
65User Manual 1176.9212.02 ─ 02
Page 66

R&S®EVS300-K9/-K10
Column Description
Annex
Format Description of GBAS and SCAT-I Data
OpType
AirportID
RunwayNo
RunwayLtr
RouteInd
ValInd
RPDS
RefPathID
ThDP_Lat[°]
ThDP_Long[°]
ThDP_Height[m]
DERP_LAT[°]
DERP_Long[°]
TCH[ft]
GPA[°]
FASCRC
66User Manual 1176.9212.02 ─ 02
Page 67

R&S®EVS300-K9/-K10
List of Commands
CLEARACTIVELIST........................................................................................................................................ 49
CLEARALLLISTS ............................................................................................................................................49
DL_START.......................................................................................................................................................49
DL_STOP.........................................................................................................................................................50
GBAS:ATTMODE............................................................................................................................................ 47
GBAS:ATTMODE?.......................................................................................................................................... 47
GBAS:FMEAS?................................................................................................................................................58
GBAS:FREQRF............................................................................................................................................... 47
GBAS:FREQRF?............................................................................................................................................. 47
GBAS:GETMDEF............................................................................................................................................ 58
GBAS:GETMEAS............................................................................................................................................ 59
GBAS:LEV?..................................................................................................................................................... 59
GBAS:LOGSLOTS...........................................................................................................................................52
GBAS:STOPSTREAM..................................................................................................................................... 57
GBAS:STREAM...............................................................................................................................................57
GETACTIVELIST.............................................................................................................................................50
GETFREEMEMORY .......................................................................................................................................50
GETLISTDATA ............................................................................................................................................... 51
GETLISTSIZE..................................................................................................................................................51
LISTMODE.......................................................................................................................................................51
MODE_GBAS.................................................................................................................................................. 46
SAVEACTIVELIST2USB................................................................................................................................. 53
SELECTLISTPARAM.......................................................................................................................................54
SETACTIVELIST............................................................................................................................................. 54
SETUP:GETSYNCSTATUS?.......................................................................................................................... 55
SETUP:GPSREF............................................................................................................................................. 48
SETUP:NTPSERVER......................................................................................................................................55
SETUP:TIMESYNC......................................................................................................................................... 56
SETUP:TIMESYNC?....................................................................................................................................... 56
SETUP:TIMEZONE......................................................................................................................................... 56
SETUP:TIMEZONE?....................................................................................................................................... 56
List of Commands
67User Manual 1176.9212.02 ─ 02
Page 68

R&S®EVS300-K9/-K10
Index
Index
Symbols
24/7
Data Logger ................................................................ 34
A
Activating
GBAS/SCAT-I (remote) .............................................. 46
Allocating the VDB to the time domain
Principle ...................................................................... 12
Angle
GPS Reference point .................................................. 30
Attenuation
Configuring ................................................................. 31
Auto Power Down
Data Logger ................................................................ 34
C
Copying
Lists to USB .......................................................... 39, 41
Correction data
GBAS .......................................................................... 20
Graphical display ........................................................ 27
SCAT-I ........................................................................ 22
Cursor
PRC graph ............................................................ 28, 44
D
Data acquisition
Data Logger ................................................................ 13
Data Logger
Analyzing entries ........................................................ 38
Automatic switchoff ..................................................... 34
Basics ......................................................................... 13
Channels ..................................................................... 33
Configuring ................................................................. 32
Format description ...................................................... 61
Interval ........................................................................ 34
List view ...................................................................... 26
Lists ...................................................................... 38, 39
Logging mode ............................................................. 34
Main view .................................................................... 38
Parameters ................................................................. 41
PPS synchronization ................................................... 33
PRC graph ............................................................ 27, 39
Remote ....................................................................... 48
Result display ............................................................. 39
Setup .......................................................................... 32
Source function ........................................................... 33
Starting ....................................................................... 37
Stopping ...................................................................... 37
Time synchronization ............................................ 14, 35
Trigger ........................................................................ 33
Data storage
Data Logger ................................................................ 13
Data streaming
Basics ......................................................................... 14
Remote ....................................................................... 57
Differential corrections
Result display ............................................................. 19
Distance
GPS Reference point .................................................. 30
E
Exporting
Data to USB .......................................................... 39, 41
External trigger
Count, Data Logger .................................................... 34
Data Logger ................................................................ 33
Impulse, Data Logger ................................................. 34
F
FAS DB view
GBAS .......................................................................... 23
Result display ............................................................. 22
SCAT-I ........................................................................ 24
Fictitious Threshold Point (FTP) ........................................ 12
Final Approach Segment (FAS) data
Diagram ...................................................................... 12
Result display ............................................................. 22
see also FAS DB ........................................................ 12
Flight Path Alignment Point (FPAP) .................................. 12
Frequency
Configuring ................................................................. 31
G
GBAS
Basics ......................................................................... 10
Broadcast timing structure .......................................... 12
Components ............................................................... 10
Correction message .................................................... 11
Data format ................................................................. 61
FAS data ..................................................................... 12
FAS DB view ............................................................... 23
Frequencies ................................................................ 11
Message type 1 data .................................................. 63
Message type 4 data .................................................. 64
MT1 view .................................................................... 19
Specification ............................................................... 61
GBAS/SCAT mode
Main view .................................................................... 16
Result displays ............................................................ 16
Starting ......................................................................... 9
Glide Path Angle (GPA) .................................................... 12
GPS
Angle ........................................................................... 30
Distance ...................................................................... 30
Reference point .......................................................... 29
View ............................................................................ 29
I
Impulse
External trigger, Data Logger ...................................... 34
Index
Data Logger lists ......................................................... 39
L
Landing Threshold Point (LTP) ......................................... 12
68User Manual 1176.9212.02 ─ 02
Page 69

R&S®EVS300-K9/-K10
Index
Licenses
Activating ...................................................................... 7
Lists
Clearing .......................................................... 39, 40, 41
Copying to USB .................................................... 39, 41
Data Logger ................................................................ 38
Graphical results ......................................................... 39
Index view ................................................................... 39
Managing .............................................................. 38, 39
Next empty .................................................................. 41
Parameters ........................................................... 39, 41
Renaming ................................................................... 40
Logging data
see Data Logger ......................................................... 32
Logging interval (Data Logger) .......................................... 34
Logging mode (Data Logger) ............................................ 34
Logging source (Data Logger) .......................................... 33
Low distortion
Attenuation mode ........................................................ 31
Low noise
Attenuation mode ........................................................ 31
M
Main view
GBAS/SCAT mode ..................................................... 16
Message type 1
Displayed information ................................................. 19
GBAS data ............................................................ 19, 63
Result display ............................................................. 19
SCAT-I data .......................................................... 21, 65
Message type 4
Displayed information ................................................. 22
GBAS data .................................................................. 64
Result display ............................................................. 22
SCAT-I data ................................................................ 65
Messages
Displayed information ................................................. 19
Final Approach Segment data .................................... 22
MT1 View .................................................................... 19
Modes
GBAS/SCAT ................................................................. 9
MT1 view
Result display ............................................................. 19
MT4 view
Result display ............................................................. 22
N
NTP server
Time synchronization .................................................. 36
O
Options
Activating ...................................................................... 7
GBAS (K9) .................................................................... 7
Installing ........................................................................ 7
SCAT-I (K10) ................................................................ 7
Starting ......................................................................... 9
P
Parameters
Data Logger .......................................................... 14, 41
Default order ............................................................... 42
Default selection ......................................................... 42
Selecting ............................................................... 39, 42
Selecting (remote) ...................................................... 61
Short list ...................................................................... 61
Sort order .................................................................... 42
PPS
Basics ......................................................................... 15
Duration ...................................................................... 15
Synchronization, Data Logger .................................... 33
Triggering .............................................................. 15, 33
PRC graph
Configuring ................................................................. 43
Cursor ................................................................... 28, 44
Result display ....................................................... 27, 39
Time axis .................................................................... 28
Time slot ..................................................................... 43
Traces ......................................................................... 27
X-axis .............................................................. 28, 43, 44
Y-axis .......................................................................... 44
Pseudorange correction data
see PRC graph ........................................................... 27
R
Receive frequency
Configuring ................................................................. 31
Reference path data selector (RPDS) ............................... 22
Selecting ............................................................... 23, 24
Reference point
Angle ........................................................................... 30
Defining ....................................................................... 30
Distance ...................................................................... 30
GPS ............................................................................ 29
PRC graph .................................................................. 27
Remote ....................................................................... 48
Renaming
Lists ............................................................................ 40
Result displays
Data Logger list view .................................................. 26
FAS DB view ............................................................... 22
GBAS/SCAT main view .............................................. 16
MT1 view .................................................................... 19
MT4 view .................................................................... 22
PRC graph .................................................................. 27
Time Slot view ............................................................ 18
Results
Retrieving (remote) ..................................................... 58
Results display
Troubleshooting .......................................................... 45
RF input attenuation
Configuring ................................................................. 31
RF level
PRC graph .................................................................. 27
S
SCAT-I
Data format ................................................................. 61
FAS DB view ............................................................... 24
Message type 1 data .................................................. 65
Message type 4 data .................................................. 65
MT1 view .................................................................... 21
Specification ............................................................... 61
Short list
Parameters ................................................................. 61
Slots
Assignment, troubleshooting ...................................... 45
69User Manual 1176.9212.02 ─ 02
Page 70

R&S®EVS300-K9/-K10
Status
Logged data ................................................................ 62
Streaming
Data ............................................................................ 14
Switching off
Automatically, Data Logger ......................................... 34
Synchronization
R&S EVS300 clock ............................................... 14, 35
T
TDMA timing structure ...................................................... 12
Terminal Area Path (TAP) ................................................. 12
Threshold Crossing Height (TCH) ..................................... 12
Time axis
PRC graph .................................................................. 28
Time domain allocation
Principle ...................................................................... 12
Time slots
Data Logger ................................................................ 14
Details ......................................................................... 18
Displayed information ................................................. 17
PRC graph .................................................................. 43
Result display ............................................................. 18
Selected ...................................................................... 17
Synchronization .......................................................... 15
Time synchronization
Data Logger .......................................................... 14, 35
Time zone
R&S EVS300 clock ..................................................... 36
Timing
GBAS .......................................................................... 12
Trigger
Count, Data Logger .................................................... 34
Data Logger ................................................................ 33
Edge, Data Logger ...................................................... 34
Troubleshooting ................................................................ 45
Results display ............................................................ 45
Slot assignment .......................................................... 45
UNCAL ........................................................................ 45
Index
U
UNCAL
Troubleshooting .......................................................... 45
70User Manual 1176.9212.02 ─ 02
 Loading...