

Page 1
Spectrum Analyzer FSP
The new medium-class standard
Features
• 21 cm TFT colour display
• 1 Hz to 10 MHz RBW
• RMS detector for fast and reproducible measurements on
digitally modulated signals
• Measurement routines for TOI,
ACPR, OBW, amplitude statistics
• EMI bandwidths and quasipeak detector
Speed
• 2.5 ms minimum sweep time in
frequency domain
• 1 µs sweep time in time domain
• Up to 30 GPIB measurements/s
in frequency domain (including trace transfer)
• Up to 70 GPIB measurements/s
in time domain (including trace
transfer)
• Fast ACP measurement routine
in time domain
Performance
• Total measurement uncertainty:
0.5 dB
• Displayed average noise level:
–155 dBm/Hz
•Phase noise:
–113 dBc/Hz at 10 kHz
•Dynamic range of
RMS detector: 100 dB
• Synthesized frequency setting
Page 2

The new standard in the medium class…
Features
The new FSP Spectrum Analyzers from
Rohde & Schwarz are outstanding for
their innovative measurements and a
host of standard functions.
Instead of a wide choice of options,
FSP offers as standard all the functions
and interfaces you may expect from a
state-of-the-art spectrum analyzer:
• Largest colour display in its class
• Resolution bandwidths from 1 Hz
to 10 MHz
• Highly selective digital and FFT
filters
• Quasi-peak detector and EMI
bandwidths
• Convenient documentation of
results as a hardcopy or file in
PC-compatible formats
• Interfaces: GPIB, Centronics,
RS232, LAN (option)
• Automatic test routines for measuring
TOI, OBW, phase noise and ACP (R)
• Split screen with separate settings
and up to 3 traces per screen
• Editable limit lines including
PASS/FAIL indication
• Fast measurements in the time domain : minimum sweep time 1 µs
• Gated sweep for measurements on
TDMA signals
• Statistical measurement functions
for determining crest factor and
CCDF (complementary cumulative
distribution function)
Featuring such a wealth of functions,
FSP offers state-of-the-art spectrum
analysis at an extremely attractive
price-performance ratio.
Speed
Time is a finite resource – so high
measurement speed is indispensable
for competitiveness and cost-effective
testing.
Here, too, the new FSP offers characteristics that make it top of the class:
• Up to 30 measurements/s on GPIB
interface including trace transfer of
501 binary data
• 70 measurements/s on GPIB interface in zero span mode including
trace transfer of 501 binary data
On top of this, FSP features as standard the following unique attributes:
• RMS detector for fast and reproducible power measurements on
digitally modulated signals in frequency and time domain
2 Spectrum Analyzer FSP
Page 3

Performance
• Minimum sweep time of 2.5 ms
• 1 µs time domain measurements
• Unique fast ACP mode for high-
speed ACPR measurements in time
domain using the standard-stipulated test filters
With 30 measurements/s in manual
operation and digital filters with
sweep time 2.5 times faster than comparable analog filters, FSP will also
help in your day-to-day work to
develop your product much faster.
Modern communication systems are
required to achieve optimum spectral
efficiency at high data rates. For the
3rd generation of CDMA mobile radio
systems currently under development
this is achieved, among other things,
by high-precision power control.
FSP is the ideal partner in development and production, featuring the
smallest level measurement uncertainty of all spectrum analyzers presently on the market, as well as excellent RF characteristics:
• 0.5 dB total measurement uncertainty allows higher tolerances for
the DUT, thus increasing production yield
• 0.07 dB linearity uncertainty (1 σ)
is ideal for precise measurements,
for example of gain control and
ACPR
• RMS detector with >100 dB
dynamic range measures power
fast and accurately irrespective of
the signal shape – almost like a
thermal power sensor
• The displayed average noise level
of typ. –155 dBm (1 Hz) is attained without the use of preamplifiers and thus without any reduction in dynamic range
• Typ. –145 dBc (1 Hz) phase noise
at 10 MHz offset offers optimum
conditions for ACPR measurements on W-CDMA systems
Resolution bandwidths of up to
100 kHz are fully digital and provide
– in addition to high selectivity – an
ideal basis for accurate (adjacent-)
channel power measurements thanks
to a maximum bandwidth deviation of
3%.
…with high-end characteristics
Spectrum Analyzer FSP 3
Page 4

High-end characteristics…
Rohde&Schwarz ASICs
Top-class performance as offered by
FSP essentially depends on the extensive use of digital signal processing
and large-scale integration of components.
For these demanding tasks, Rohde&
Schwarz has developed ASICs tailored to the requirements of signal
analysis. Key functions such as
• RMS detection,
• digital IF filtering,
• logarithmation,
• CCDF measurement
are "cast into silicon" and
are thus faster than
conventional solutions.
RMS detector of the FSP spectrum analyzer measures all modern communication signals with an accuracy and
speed unparalleled so far.
Logarithmic amplifier
FSP is equipped as standard with digital resolution filters between 10 Hz
and 100 kHz of high selectivity and
very small band-
CCDF
The complementary cumulative distribution function, or briefly CCDF,
describes the probability of a signal
power exceeding a specific (usually
the average) power. CCDF analysis is
indispensable for determining the optimal transmitting power for CDMA signals assuming that clipping over
known, short intervals is tolerable. FSP
with its dedicated CCDF measurement
routine furnishes 10
only 250 ms, thus enabling extremely
accurate statistical analysis even of
rarely occurring signal peaks.
6
single values in
This analysis
function,
which is
becoming
more and more
important, has
been realized for
the first time in
Spectrum Analyzer
FSP as a fast and cost-
effective solution based
on ASICs.
RMS detector
The RMS detector – a unique feature in
all current Rohde & Schwarz spectrum
analyzers – yields fast to stable and
reproducible results also for complex
signals such as CDMA. With a very
large number of linear single measurements performed, followed by power
integration, the detector avoids the
measurement error inherent in conventional analyzers which results from the
averaging of the log video signal. The
4 Spectrum Analyzer FSP
width
error. The filters have
an extremely small logarithmic level deviation of <0.2 dB
in the range 0 dB to –70 dB. They are
implemented as ASIC functions, so
their great precision is attained without any reduction in measurement
speed.
Page 5

The platform
Fit for the future
Ergonomics & design
Excellent technical data like those of
FSP require a high-grade and servicefriendly platform. All the modules are
optimally shielded and easy to
exchange, and are accommodated in
a lightweight but stable frame. A lownoise powerful fan in conjunction with
low power consumption of 70 VA to
150 VA (depending on model) makes
for high reliability.
A 2-year calibration interval (excluding the reference frequency) and a
3-year warranty worldwide are
offered with the FSP.
Thanks to its modular design, FSP is
optimally equipped to cope with all
present and future tasks. The design
takes into account both hardware and
firmware extensions to safeguard your
investment far into the future. So you
can rely on your FSP to meet all
requirements also in the years to
come.
FSP sets the ergonomic standard in this
class of analyzers. The 21 cm (8.4”)
colour display is the largest and most
brilliant in its category. Vertical and
horizontal rows of softkeys allow the
convenient handling even of complex
measurement tasks. Parameters like
frequency and amplitude are entered
by means of dedicated hardkeys and
unit keys.
…through innovative solutions
Spectrum Analyzer FSP 5
Page 6
Innovative solutions…
Optimum dynamic range
Featuring the lowest displayed average noise level in its class
(DANL <−145 dBm at 10 Hz RBW),
FSP measures even small signals accurately without the use of preamplifiers
whilst maintaining the full dynamic
range. Together with the high intercept
point this yields an intermodulationfree range of typically 100 dB
– again a record in the medium class
of analyzers.
Ultralow measurement
uncertainty
In the vital frequency range below
3 GHz, FSP is outstanding for its ultralow measurement uncertainty. The
total measurement uncertainty is less
than 0.5 dB. Due to this excellent
value, the use of power meters in routine lab applications very often
becomes superfluous and DUTs may
be allowed greater tolerances.
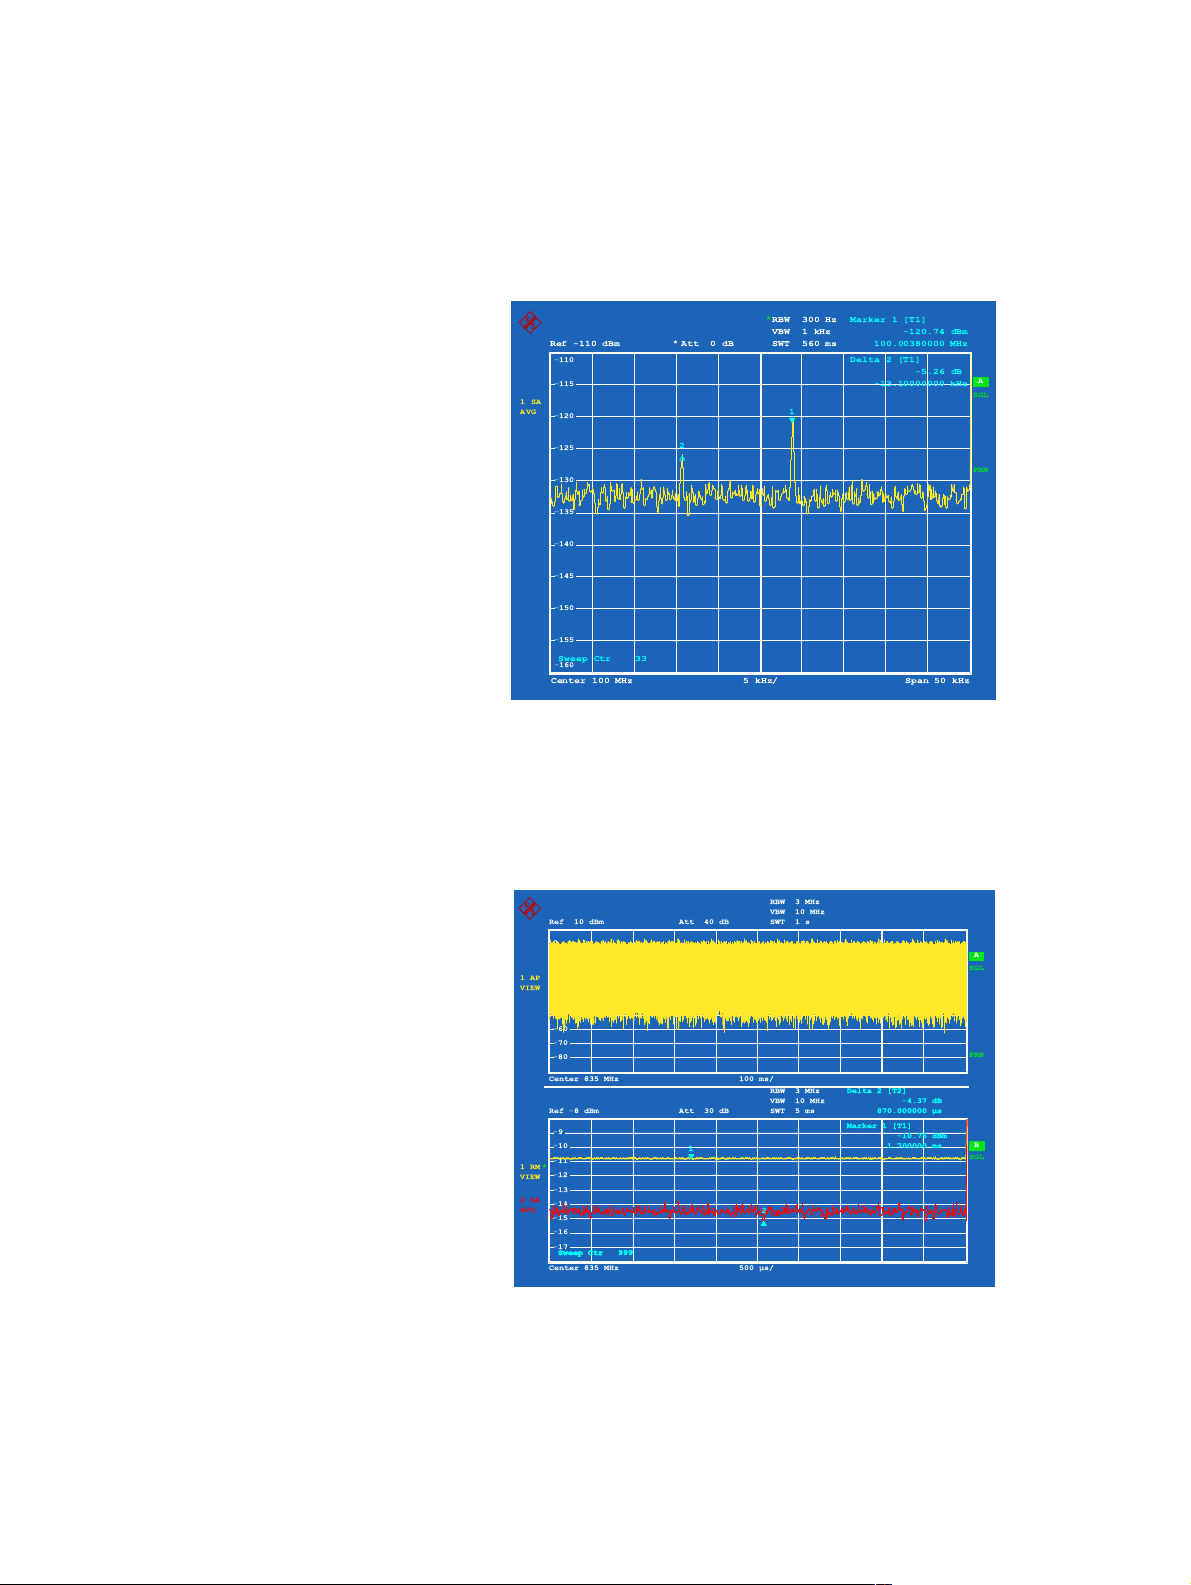
RMS detector
The unique RMS detector used in spectrum analyzers from Rohde & Schwarz
measures modern, noise-like communication signals with best repeat accuracy and stability.
There are neither correction factors
nor the typical errors caused by averaging of logarithmic trace data, so the
correct average power is displayed
with high stability for all signal types –
almost like in measurements with a
thermal power meter.
1SA
AVG
1AP
VIEW
1RM*
VIEW
2SA
AVG
Ref -110 dBm
Ref -8 dBm
-110
-115
-120
-125
-130
-135
-140
-145
-150
-155
Sweep Ctr 33
-160
0
-10
-20
-30
-40
-50
-60
-70
-80
-9
-10
-11
-12
-13
-14
-15
-16
-17
Sweep Ctr 999Sweep Ctr 999
Sweep Ctr 999Sweep Ctr 999
*
RBW 300 Hz
1 kHz
5 kHz/ Span 50 kHzCenter 100 MHz
100 ms/Center 835 MHz
500 µs/Center 835 MHz
VBW
1
RBW 3 MHz
VBW 10 MHz
SWT 1 sAtt 40 dBRef 10 dBm
RBW 3 MHz
VBW 10 MHz
SWT 5 ms
2
2
*
0dB
Att SWT 560 ms
2
Att 30 dB
1
1
Marker 1 [T1]
100.00380000 MHz
Delta 2 [T1]
-13.10000000 kHz
Delta 2 [T2]
Delta 2 [T2]
870.000000 µs
870.000000 µs
Marker 1 [T1]
Marker 1 [T1]
-10.75 dBm
-10.75 dBm
1.700000 ms
1.700000 ms
-120.74 dBm
-5.26 dB
-4.37 dB
-4.37 dB
A
SGL
PRN
A
SGL
PRN
B
SGL
6 Spectrum Analyzer FSP
Page 7

Phase noise
The low phase noise of FSP makes it
suitable for demanding measurement
tasks both in the vicinity of the carrier
(typ. –113 dBc (1 Hz) at 10 kHz) and
far from the carrier (typ. –125 dBc
(1 Hz) at 1 MHz). FSP is thus optimally
equipped for performing spectral
analysis and ACPR measurements on
narrowband systems like IS-136 or
PDC as well as on wideband systems
like IS-95 or W-CDMA.
CCDF analysis
1SA
VIEW
1SA
VIEW
-10
-20
-30
-40
-50
-60
-70
-80
-90
Ref 0 dBm
-10
-20
-30
-40
-50
-60
-70
-80
-90
PHN -0.53 dBm
PHN -0.688 dBm
*
Att 10 dB
*
PHN
220 kHz/ Span 2.2 MHzCenter 100 MHz
RBW 300 Hz
*
VBW 1 kHz
1
1
SWT 245 msAtt 10 dBRef 0 dBm
RBW 30 kHz
*
VBW 100 kHz
1
1
SWT 2.5 ms
PHN
Delta 2 [T1 PHN]
Delta 2 [T1 PHN]
-116.45 dBc/Hz
-116.45 dBc/Hz
10.00000000 kHz
10.00000000 kHz
Marker 1 [T1 FXD]
Marker 1 [T1 FXD]
-0.52 dBm
-0.52 dBm
100.00000000 MHz
100.00000000 MHz
Delta 2 [T1 PHN]
Delta 2 [T1 PHN]
Marker 1 [T1 FXD]
Marker 1 [T1 FXD]
Span 22 kHzCenter 100 MHz 2.2 kHz/
-125.83 dBc/Hz
-125.83 dBc/Hz
1.00000000 MHz
1.00000000 MHz
-0.83 dBm
-0.83 dBm
100.00000000 MHz
100.00000000 MHz
Phase noise measurement with FSP
A
PRN
2
2
EXT
B
2
2
FSP is the first spectrum analyzer to
offer statistical analysis of signals by
means of the complementary cumulative distribution function (CCDF) as
standard and at an impressively high
speed. FSP furnishes in only 250 ms
the exact CCDF characteristic, average and peak power as well as the
crest factor over 1 million measured
values.
ACPR measurements
Adjacent-channel power ratio (ACPR)
measurements, which many mobile
radio standards stipulate for components and units, are implemented in
FSP by means of automatic test routines. All settings, measurements and
filters required for a selected standard
are activated at a keystroke. In addition to a large number of preprogrammed standards, the channel
width and channel spacing can be
individually selected. Thanks to the
excellent dynamic range, lowest
phase noise in its class and the RMS
detector, FSP sets the standard in the
medium class also for ACPR measurements.
RBW 10 MHz
Ref -13.5 dBm Att 20 dB
0.1
0.01
1SA
CLRWR
1E-3
1E-4
1E-5
Center 2.225 GHz 2 dB/ Mean Pwr + 20 dB
Complementary Cumulative Distribution Function
Samples 1000000
Mean Power -32.98 dBm
Peak Power -19.23 dBm
Crest Factor 13.75 dB
Ref -26 dBm
-30
-40
-50
-60
*1RM
CLRWR
-70
-80
-90
-100
-110
cl2
-120
Center 160 MHz Span 25.46574363 MHz2.546574363 MHz/
Tx Channel
Power -19.40 dBm
Adjacent Channel
Lower -63.86 dBc
Upper -64.04 dBc
Alternate Channel
Lower -67.75 dBc
Upper -67.76 dBc
cl1
cl2
1
Trace 1
Att 0 dB SWT 500 ms
*
cl1
SWT 250 ms
2
3
RBW 30 kHz
*
VBW 300 kHz
*
*
C0
C0
Bandwidth 3.84 MHz
Bandwidth 3.84 MHz
Spacing 5 MHz
Bandwidth 3.84 MHz
Spacing 10 MHz
Marker 1 [T1]
0.010306703
Marker 2 [T1]
0.001004205
Marker 3 [T1]
0.000100206
Marker 4 [T1]
0.000010132
4
cu2
cu1
cu1
7.72 dB
9.92 dB
11.60 dB
12.96 dB
CCDF of wideband
CDMA signal
A
SGL
PRN
(Adjacent-) channel
measurement on wideband CDMA signal
A
cu2
PRN
…for research & development
Spectrum Analyzer FSP 7
Page 8

Innovative solutions…
High measurement speed
7
10
With 30 measurements/s in manual
operation, minimum sweep time of
2.5 ms and 1 µs zero span as a standard, FSP is ideal for time-critical
applications. The highly selective, fastsweeping digital filters featuring "analog" response allow measurements on
pulsed signals as well as the use of the
built-in frequency counter.
At high span/RBW ratios, measurements can be as much as 300 times
faster with the use of the standard FFT
filters. Thanks to the implemented digital filters, channel filters for common
mobile radio standards such as
W-CDMA, cdmaOne, IS-136 or
TETRA can be realized. With FSP the
adjacent-channel power can be measured in the time domain, which
reduces the measurement time and
increases reproducibility. In addition,
the adjacent-channel power due to
switching can be measured.
30 measurements per second on
GPIB interface
6
10
100000
10000
Sweep time in ms
1.000
100
10
10 30 100 300 1000
Resolution bandwidth in Hz
Comparison of sweep times for 200 kHz span using digital filters or FFT
0
-10
-20
*1RM
-30
CLRWR
-40
-50
-60
-70
-80
-90
Center 2.1175 GHz 10 ms/
Tx Channel
Power -0.01 dBm
Adjacent Channel
Lower -56.49 dBc
Upper -56.45 dBc
Alternate Channel
Lower -57.10 dBc
Upper -57.02 dBc
Att 20 dBRef 6 dBm
SWT 100 ms
Bandwidth 3.84 MHz
Bandwidth 3.84 MHz
Spacing 5 MHz
Bandwidth 3.84 MHz
Spacing 10 MHz
FFT filter
Digital RBW
A
SGL
PRN
EXT
The standard high-speed GPIB interface enables up to 30 measurements
per second including trace data transfer of 501 test points with the display
switched off. In the zero span mode,
70 measurements/s are possible. This
characteristic makes FSP by far the fastest spectrum analyzer on the GPIB
interface. Valuable time can be saved
in production and the throughput
boosted enormously. FSP thus supports
you in getting your products more costeffective on the market.
8 Spectrum Analyzer FSP
Measurement of adjacent-channel power in time domain: FAST ACP
Sweeps/s
Span 10 MHz,
sweep time 2.5 ms
Sweeps/s
Span 0 Hz,
sweep time 100 µs
ASCII format 25 40
Binary IEEE754 format 30 70
Measurement speed on GPIB interface
Settings:display off, default coupling, single trace, 501 points
Page 9

0.5 dB total measurement
uncertainty
Probability
density
Measurement uncertainty can be split
into the contribution from the instrument and that introduced by the test
setup. With a smaller uncertainty of
the spectrum analyzer, greater tolerances can be allowed for the test
setup. If the small uncertainty of the
analyzer is utilized to allow for higher
DUT tolerances, the result will be a
marked reduction of manufacturing
rejects – an advantage that pays off
immediately. With a total measurement uncertainty of 0.5 dB, FSP undisputedly ranks top way ahead of other
medium class analyzers.
0.2 dB maximum linearity
uncertainty
All modern mobile radio systems
achieve high spectral efficiency
through precise control of transmitter
output power, among other measures.
The correct functioning of gain control,
which may be as much as -70 dB
depending on the system, is checked
against the nominal value in a large
number of individual measurements.
Featuring a maximum linearity uncertainty of only 0.2 dB and fast power
measurement routines especially for
digitally modulated signals, FSP is the
ideal choice wherever the reduction of
the test time and the number of rejects
is of primary importance.
Yield for 1 dB
total measurement uncertainty
Additional yield for 0.5 dB
total measurement uncertainty
1
0
1
1
Deviation from
mean power [dB]
Tolerance limit
1
2
1
3
Production sample
-1.5 -1 -0.5 +0.5
Effect of measurement uncertainty on production yield
1
2
Test margin
3
4
5
6
7
8
9
0.6
0.4
0.2
0
-0.2
Linearity uncertainty in dB
-0.4
-0.6
0 102030405060708090
dB below reference level
Display linearity with
≤100 kHz resolution bandwidth (measurement on 30 units)
…for production
Spectrum Analyzer FSP 9
Page 10

Innovative solutions…
Measurement routines
TOI, OBW …
FSP offers fast routines for a multitude
of typical measurement tasks, which
make result postprocessing superfluous by supplying the desired data
directly:
• Determination of TOI
• Occupied bandwidth (OBW)
• Burst power with peak, average
and RMS indication as well as
standard deviation
• Modulation depth of AM signals
• Phase noise
• Bandwidth marker
Of course these functions can also be
used via the fast GPIB interface.
Environmental compatibility
• Fast and easy disassembly
• Small number of materials
• Compatibility of materials
• Easy identification of substances
through appropriate marking
(plastics)
• Recycling of enclosure
Ref 10 dBm
10
0
1SA
-10
AVG
-20
-30
-40
-50
3
-60
-70
-80
Sweep Ctr 10
-90
20
10
0
1SA
-10
CLRWR
-20
-30
-40
-50
T1
-60
Ref -30 dBm Att 10 dB
-35
-40
-45
-50
*1RM
-55
CLRWR
-60
-65
-70
-75
-80
-85
10
0
1AP
-10
CLRWR
-20
-30
-40
-50
-60
-70
-80
-90
3
*
RBW 10 kHz
77.7 kHz/ Span 777 kHzCenter 2.2 GHz
500 µs/Center 835 MHz
500 kHz/ Span 5 MHzCenter 835 MHz
300 Hz/ Span 3 kHzCenter 454.85kHz
VBW 30 kHz
SWT 10 ms
RBW 3 MHz
VBW 10 MHz
RBW 30 kHz
*
VBW 300 kHz
SWT 1 s
*
1
1
RBW 100 Hz
*
VBW 300 kHz
SWT 300 ms
1
*
Att 20 dB
1 2
Att 60 dBRef 30 dBm SWT 5 ms
T1
T1
Mix -10 dBm
Att 20 dBRef 10 dBm
Marker 2 [T1 TOI]
TOI 31.47 dBm
Marker 1 [T1 TOI]
Marker 3 [T1 TOI]
Marker 4 [T1 TOI]
Marker 1 [T1]
POWER [T1]
POWER [T1]
PEAK -7.01 dBm
PEAK -7.01 dBm
RMS -16.65 dBm
RMS -16.65 dBm
MEAN -18.11 dBm
MEAN -18.11 dBm
1
1
SDEV 2.47 dB
SDEV 2.47 dB
Marker 1 [T1 OBW]
Marker 1 [T1 OBW]
OBW 1.28000000 MHz
OBW 1.28000000 MHz
T2T1 T2
T2T1 T2
Temp 1 [T1 OBW]
Temp 1 [T1 OBW]
Temp 1 [T1 OBW]
Temp 1 [T1 OBW]
Temp 2 [T1 OBW]
Temp 2 [T1 OBW]
Temp 2 [T1 OBW]
Temp 2 [T1 OBW]
Marker 1 [T1MOD]
MD
Delta 2 [T1 MOD]
Delta 3 [T1 MOD]
2.59 dBm
2.20010101 GHz
2.60 dBm
2.19990054 GHz
-55.49 dBm
2.19970008 GHz
-54.80 dBm
2.20030148 GHz
4
-8.91 dBm
-8.91 dBm
3.120000 ms
3.120000 ms
-33.42 dBm
-33.42 dBm
835.00000000 MHz
835.00000000 MHz
-90.85 dBm
832.50000000 MHz
-39.57 dBm
-39.57 dBm
-39.57 dBm
-39.57 dBm
835.64000000 MHz
835.64000000 MHz
835.64000000 MHz
835.64000000 MHz
455.00000000kHz
EPTH 0.960%
-46
1.00200000 kHz
-46.40 dB
-1.00200000 kHz
2
T2
2.02 dBm
.35 dB
A
SGL
PRN
SGL
PRN
B
SGL
A
SGL
PRN
EXT
Measurement of TOI
Measurement of
burst power
(top)
Determination
of occupied
bandwidth
(OBW) (bottom)
Measurement of
modulation
depth of AM signal
10 Spectrum Analyzer FSP
Comment A: DUT = PWRA2117.5
Date: 11.AUG.1999 16:18:35a
Page 11

Electronic attenuator for high
production throughput
The optional Electronic Attenuator
FSP-B25 supplements the standard
mechanical attenuator and provides a
wear-and-tear-free setting range of
30 dB in 5 dB steps. The option does
away with frequent switching of the
mechanical attenuator as called for in
high production throughput and so
increases the availability and reliability of the measurement facility. The
limit of 10
which is typical of mechanical attenuators, means a breakdown after
approx. 6 months already at 1.5
switching operations/s whereas Electronic Attenuator FSP-B25 can be
switched any number of times without
degrading the specifications.
The integrated switchable 20 dB
preamplifier allows high-sensitivity
measurements in the useful frequency
range from 10 MHz to 7000 MHz.
7
switching operations,
LAN interface
With the aid of the optional LAN Interface FSP-B16, FSP can be connected
to common networks such as
100Base-T so that functions like file
logging on network drives or documentation of measurement results via
network printer are available. In addition, FSP can be remote-controlled via
LAN. This yields a clear speed advantage over the IEC/IEEE bus in particular for the transmission of large data
blocks.
Noise measurements
Thanks to its excellent display linearity,
FSP is especially suited for noise measurements. With the aid of the optional
Noise Measurement Software
FSP can be enhanced to a noise test system offering analyzer-specific advantages (see data sheet PD 757.2380)
• Due to the numerous resolution
bandwidths, you have always the
right choice, even for narrowband
DUTs
• In case of doubtful measurement
result you can use the analyzer to
check your test setup for radiated
interference or spurious responses
• The lower frequency limit is
100 kHz
• Measurements on frequencyconverting DUTs are supported by
driving an external generator
FS-K3
,
Measurement of noise figure using Noise Measurement Software FS-K3
…for production
Spectrum Analyzer FSP 11
Page 12

Innovative solutions…
Scalar network analysis in wide
dynamic range and at any
frequency offset
The optional Internal Tracking Genera-
FSP-B9
tor
Generator Control FSP-B10 extend the
FSP spectrum analyzers to scalar network analyzer functionality. The gain,
frequency response, insertion and
return loss are measured using a selective method in a wide dynamic range
without any influence from the harmonics or spurious of the generator. Internal
Tracking Generator FSP-B9 can be used
in any FSP models and covers the frequency range from 9 kHz to 3 GHz.
A frequency offset of ±150 MHz can
be set for measurements on frequencyconverting modules. The tracking generator can be broadband-modulated by
an external IQ baseband signal.
up to 3 GHz and External
• Any frequency offset, which is only
limited by the RF generator, for example up to 40 GHz with Microwave Signal Generator SMR
TG 0 dBm
Ref -4 dBm
-10
-20
-30
1SA
-40
AVG
-50
160
-60
-70
-80
-90
-100
Center 160 MHz Span 12 MHz1.2 MHz/
Ref -21 dBm
-22
-23
-24
1SA
-25
AVG
T1
T1
-26
-27
-28
-29
-30
Center 161 MHz Span 7 MHz700 kHz/
Att 10 dB
*
TG 0 dBm
Att 10 dB
• Operation of external generator
on multiples or subharmonics of
the analyzer, eg for frequency multiplier or mixer measurements
RBW 300 kHz
VBW 1 MHz
SWT 100 ms
LIMIT CHECK PASS
RBW 300 kHz
VBW 1 MHz
SWT 100 ms
1
1
Marker 1 [T1]
159.990000000 MHz
ndB [T1] 3.00 dB
BW 4.130000000 MHz
Temp 1 [T1 ndB]
Temp 1 [T1 ndB]
157.500000000 MHz
Temp 2 [T1 ndB]
Temp 2 [T1 ndB]
Temp 2 [T1 ndB]
Temp 2 [T1 ndB]
T2T1 T2
T2T1
162.106000000 MHz
162.106000000 MHz
162.106000000 MHz
-23.12 dBm
-83.47 dBm
-26.17 dBm
-26.17 dBm
-26.17 dBm
A
PRN
B
Option
FSP-B10
uses commercial RF
signal generators as its external tracking source that can be controlled via the
GPIB or a TTL bus. With this option the
functionality of the internal tracking
generator can be utilized:
• Normalization with interpolation
also for reflection measurements
with open and short
• Automatic bandwidth measure-
ment with "n dB down" function
• Tolerance lines with PASS/FAIL
verdict
Moreover, the use of the external tracking generator offers unique benefits:
• High generator output power, eg
+30 dBm with Signal Generator
SMGL for measurements on highly
attenuating DUTs
12 Spectrum Analyzer FSP
…through custom-made options
Page 13

Complete measurement solutions…
Open for the PC world…
• PC-compatible screen shots, no
conversion software needed
• Windows printer support
• LabWindows driver
• LabView driver
• SCPI-compatible
• FSE/FSIQ-compatible GPIB com-
mand set
• GPIB command set with search
function on CD-ROM
• Customized training
• Solution-oriented consulting
• Application notes
• 3-year warranty
• 2-year calibration cycle
…and much more
…no guessing games
Spectrum Analyzer FSP 13
Page 14

Specifications
Specifications are guaranteed under the following conditions:
15 minutes warm-up time at ambient temperature, specified environmental
conditions met, calibration cycle adhered to, and total calibration performed.
Data without tolerances: typical values only.
Data designated "nominal" apply to design parameters and are not tested.
Data designated "
Frequency
Frequency range 9 kHz to
Frequency resolution 0.01 Hz
Internal reference frequency (nominal)
Aging per year
Temperature drift 1 × 10
with option FSP-B4 (OCXO)
Aging per year
Temperature drift 1 × 10
External reference
frequency
Frequency display with marker or frequency counter
Marker resolution span/500
Max. deviation
(sweep time
sweep time)
Frequency counter
resolution
Count accuracy
(S/N
>25 dB)
Frequency span 0 Hz,
Max. span deviation 0.1%
Spectral purity (dBc (1 Hz))
SSB phase noise, f = 500 MHz, for f
Carrier offset
100 Hz
1 kHz
10 kHz
100 kHz
2)
1 MHz
10 MHz typ.
Residual FM
f = 500 MHz,
RBW 1 kHz,
sweep time 100 ms
1 )
After 30 days of operation.
2 )
Valid for span >100 kHz.
Typical values for SSB phase noise
(referred to 1 Hz bandwidth):
Offset
100 Hz
1 kHz
10 kHz
100 kHz
1 MHz
σ = xx dB" are shown as standard deviation.
FSP3 FSP7 FSP13 FSP30
3GHz
1)
1)
9 kHz to
7GHz
1 × 10
1 × 10
9 kHz to
13.6 GHz
-6
-6
-7
-8
9 kHz to
30 GHz
10 MHz
>3 x auto
± (frequency x reference frequency + 0.5% x span +
10% x resolution bandwidth + ½ (last digit))
0.1 Hz to 10 kHz (selectable)
±(frequency x reference frequency + ½ (last digit))
10 Hz to
3GHz
0 Hz,
10 Hz to
7GHz
0 Hz,
10 Hz to
13.6 GHz
0 Hz,
10 Hz to
30 GHz
> 500 MHz see diagrams
<−84, typ. −90
<−100, typ. −108
<−106, typ. −113
2)
<−110, typ. −113
<−120, typ. −125
−145
typ. 3 Hz
fin= 3 GHz
fin= 7 GHz fin= 13 GHz fin= 22 GHz fin= 26 GHz
−74 dBc −67 dBc −61 dBc −57 dBc −55 dBc
−100 dBc −94 dBc −88 dBc −84 dBc −82 dBc
−108 dBc −104 dBc −98 dBc −94 dBc −92 dBc
−108 dBc −106 dBc −100 dBc −96 dBc −94 dBc
−118 dBc −118 dBc −112 dBc −108 dBc −106 dBc
SSB phase noise vs offset
-60
-70
-80
-90
-100
SSB phase noise in dBc (1Hz)
-110
-120
-130
100 Hz 1 k 10 k 100 k 1 M
-50
-60
-70
-80
-90
-100
SSB phase noise in dBc (1 Hz)
-110
-120
-130
0 5 10 15 20 25 30
Offset frequency
SSB phase noise vs frequency
Frequency in GHz
f
in GHz
in
0,5
3
7
13
22
30
Offset frequency
100 Hz
1 k
10 k
100 k
1 M
FSP 3 FSP 7 FSP13 FSP30
Sweep time
Span
≥10 Hz 2.5 ms to 16000 s
Max. deviation 1%
Span 0 Hz 1 µs to 16000 s
Resolution 125 ns
Resolution bandwidths
Bandwidths 10 Hz to 10 MHz (-3 dB) in 1, 3 sequence
EMI bandwidths 200 Hz, 9 kHz, 120 kHz (-6 dB)
Bandwidth accuracy
≤100 kHz <3%
300 kHz to 3 MHz
<10%
10 MHz +10%, –30%
Shape factor -60 dB: -3 dB
≤100 kHz <5:1 (Gaussian filters)
300 kHz to 3 MHz
10 MHz
<15:1 (4-pole synchronously tuned filters)
<7:1
Shape factor -60 dB: -6 dB
EMI bandwidths
<5:1
Video bandwidths 1 Hz to 10 MHz in 1, 3 sequence
FFT filter
Bandwidths 1 Hz to 30 kHz (- 3 dB) in 1, 3 sequence
Bandwidth accuracy 5%, nominal
Shape factor
-60 dB:-3 dB
2.5:1 nominal
14 Spectrum Analyzer FSP
Page 15

FSP 3 FSP 7 FSP13 FSP30
Level
Display range displayed average noise level to 30 dBm
Maximum input level
DC voltage 50 V 0 V
RF attenuation 0 dB
CW RF power 20 dBm
Pulse spectral density 97 dBµV (1 MHz)
RF attenuation
CW RF power 30 dBm
Max. pulse voltage 150 V 50 V
Max. pulse energy
(10 µs)
1 dB compression of input mixer
0 dB RF attenuation,
>200 MHz
f
Intermodulation
3rd-order intermodulation
Intermodulation-free dynamic range, level
2 x -30 dBm,
20 MHz to 200 MHz
200 MHz to 3 GHz
3 GHz to 7 GHz
7 GHz to 20 GHz
20 GHz to 30 GHz
with optional Electronic Attenuator FSP-B25 switched on
20 MHz to 200 MHz
200 MHz to 3 GHz >80 dBc, TOI >10 dBm −
3 GHz to 7 GHz >84 dBc, TOI >12 dBm −
Second harmonic intercept point (SHI)
Frequency
<100 MHz >25 dBm
100 MHz to 3 GHz >35 dBm
3 GHz to 7 GHz
7 GHz to 13.6 GHz
13.6 GHz to 30 GHz
Displayed average noise level
(0 dB RF attenuation, RBW 10 Hz, VBW 1 Hz, 20 averages, trace average, span 0 Hz, termination 50
Frequency
9 kHz
100 kHz
1 MHz
10 MHz to 1 GHz
1 GHz to 3 GHz
3 GHz to 7 GHz
7 GHz to 13.6 GHz
13.6 GHz to 22 GHz
22 GHz to 30 GHz
Displayed average noise level with preamplifier on (option FSP-B25)
10 MHz to 2 GHz
2 GHz to 7 GHz <−150 dBm −
≥10 dB
1 mWs 0.5 mWs
0 dBm nominal
∆f > 5 x RBW or 10 kHz, whichever the greater value
>70 dBc, TOI >5 dBm
>74 dBc, TOI >7 dBm (typ. 10 dBm)
−>80 dBc, TOI >10 dBm (typ. 15 dBm)
−−>80 dBc, TOI >10 dBm
−−−>76 dBc,
TOI
>74 dBc, TOI >7 dBm −
− >45 dBm
−− typ. 45 dBm
−−−typ. 45 dBm
Ω)
<−95 dBm
<−100 dBm
<−120 dBm, typ. −125 dBm
<−142 dBm,
typ.
−145 dBm
<−140 dBm,
typ.
−145 dBm
−<−138 dBm,
<−140 dBm, typ. −145 dBm
<−138 dBm, typ. −143 dBm
<−135 dBm,
typ.
−143 dBm
typ.
−145 dBm
−− <−132 dBm,
−138 dBm
typ.
−−−<−120 dBm,
−130 dBm
−−−<−115 dBm,
−123 dBm
<−152 dBm −
>8dBm
typ.
typ.
FSP 3 FSP 7 FSP13 FSP30
Immunity to interference
Image frequency
Intermediate fre-
quency (f <3 GHz)
Spurious responses
>1 MHz, without
(f
input signal, 0 dB
>70 dB
>70 dB
<−103 dBm
attenuation)
f
Other spurious (with
input signal, mixer
<–10 dBm,
level
<7 GHz: <−70 dBc
f
<13.6 GHz: <−64 dBc
<30 GHz: <−56 dBc
f
∆f >100 kHz)
Level display
Screen 501 × 400 pixels (one diagram), max. 2 diagrams
with independent settings
Log level scale 10 dB to 200 dB, in steps of 10 dB
Linear level scale 10% of reference level per level division,
(10 divisions )
Traces max. 3, with two diagrams on screen max. 3 per
diagram
Trace detector Max Peak, Min Peak, Auto Peak, Sample,
Quasi-Peak, Average, RMS
Trace functions Clear/Write, Max. Hold, Min Hold, Average
Setting range of reference level
Logarithmic level
display
–130 dBm to 30 dBm, in steps of 0.1 dB
Linear level display 70.71 nV to 7.07 V in steps of 1%
Units of level scale dBm, dBmV, dBµV, dBµA, dBpW (log level display),
mV, µV, mA, µA, pW, nW (linear level display)
Max. uncertainty of level measurement
at 128 MHz,
−30 dBm (RF attenua-
tion 10 dB, RBW
10 kHz, ref. level
<0.2 dB (σ = 0.07 dB)
–20 dBm)
Frequency response
<50 kHz <+0.5/− 1.0 dB
50 kHz to 3 GHz
3 GHz to 7 GHz
7 GHz to 13.6 GHz
13.6 GHz to 30 GHz
Frequency response with preamplifier, electronic attenuator option FSP-B25
switched on
10 MHz to 3 GHz
3 GHz to 7 GHz −<2 dB
< 0.5 dB (σ = 0.17 dB)
−<2 dB
−− <2.5 dB
(σ = 0.7 dB)
1
)
−−−<3 dB
<1 dB
(σ = 0.33 dB)
−
−
1
)
(σ = 0.7 dB)
Attenuator <0.2 dB (σ = 0.07 dB)
Reference level
switching
Display nonlinearity LOG/LIN (S/N
RBW
≤100 kHz
0 dB to –70 dB
–70 dB to –90 dB
≥300 kHz
RBW
0 dB to –50 dB
–50 dB to –70 dB
<0.2 dB (σ = 0.07 dB)
>16 dB)
<0.2 dB (σ = 0.07 dB)
<0.5 dB (σ = 0.17 dB)
<0.2 dB (σ = 0.07 dB)
<0.5 dB (σ = 0.17 dB)
Bandwidth switching uncertainty (ref. to RBW = 10 kHz)
10 Hz to 100 kHz
300 kHz to 10 MHz
1 Hz to 3 kHz, FFT
1
) RF attenuation 10 dB, sweep time >1 s/1 GHz
<0.1 dB (σ = 0.03 dB)
<0.2 dB (σ = 0.07 dB)
<0.2 dB (σ = 0.03 dB)
Spectrum Analyzer FSP 15
Page 16

FSP 3 FSP 7 FSP13 FSP30
Trigger functions
Tri gg er
Span
≥10 Hz
Trigger source free run, video, external, IF level
Trigger offset
125 ns to 100 s, resolution 125 ns min. (or 1% of offset)
Span = 0 Hz
Trigger source free run, video, external, IF level
Trigger offset ±125 ns to 100 s, resolution 125 ns min.,
Max. deviation of
dependent on sweep time
±(125 ns + (0.1% x delay time))
trigger offset
Gated sweep
Trigger source external, IF level, video
Gate delay 1 µs to 100 s
Gate length 125 ns to 100 s, resolution min. 125 ns
or 1% of gate length
Max. deviation of
gate length
±(125 ns + (0.05% x gate length))
Inputs and outputs (front panel)
RF input N female, 50 Ω
VSWR (RF attenuation >0 dB)
<3 GHz 1.5:1
f
<7 GHz − 2.0:1
f
f
<13 GHz −− 2.5:1
<30 GHz −−−3.0:1
f
attenuator 0 dB to 70 dB in 10 dB steps
Input
With option FSP-B25
0 dB to 75 dB
in 5 dB steps
Probe power supply +15 V DC, –12.6 V DC and ground, max. 150 mA
Keyboard connector PS/2 female for MF2 keyboard
AF output (only with
3.5 mm mini jack
option FSP-B3)
Output impedance 10
Ω
Open-circuit voltage up to 1.5 V, adjustable
test port
system
50
N female,
3.5 mm
female
not available
Ω
,
1)
Inputs and outputs (rear panel)
IF 20.4 MHz Z
Level
≤100 kHz, FFT -10 dBm at reference level, mixer level >–60 dBm
RBW
RBW
≥300 kHz 0 dBm at reference level, mixer level >–60 dBm
Reference frequency
Output BNC female
Output frequency 10 MHz
Level 0 dBm nominal
Input 10 MHz
Required level 0 dBm from 50
Others
Power supply for
noise source
External trigger/gate
input
BNC female, 0 V and 28 V, switchable,
Trigger voltage 1.4 V
= 50 Ω, BNC female
out
max. 100 mA
BNC female,
>10 kΩ
Ω
FSP 3 FSP 7 FSP13 FSP30
IEC/IEEE-bus remote
control
interface to IEC 625-2 (IEEE 488.2)
Command set SCPI 1997.0
Connector 24-pin Amphenol female
Interface functions SH1, AH1, T6, L4, SR1, RL1, PP1, DC1, DT1, C0
Serial interface RS 232 C (COM), 9-pin sub-D connector
Printer interface parallel (Centronics-compatible)
Mouse connector PS/2 female
Connector for ext.
15-pin sub-D connector
monitor (VGA)
General data
Display 21 cm TFT colour display (8.4”)
Resolution 640 x 480 pixels (VGA resolution)
Pixel failure rate
Mass memory 1.44 Mbyte 3 ½” disk drive (built-in),
Data storage
>500 instrument settings and traces
Temperatures
Rated temperature
+ 5 °C to +40 °C
range
Limit temperature
range
Storage temperature
+ 5 °C to +45 °C
–40 °C to +70 °C
range
Damp heat +40 °C at 95% relative humidity (IEC 68–2–3)
Mechanical resistance
Vibration test,
sinusoidal
Vibration test,
5 Hz to 150 Hz, max. 2 g at 55 Hz;
0.5 g from 55 Hz to 150 Hz;
meets IEC 68-2-6, IEC 68-2-3, IEC 1010-1,
MIL-T-28800D, class 5
10 Hz to 100 Hz, acceleration 1 g (rms)
random
Shock test 40 g shock spectrum, meets MIL-STD-810C and
Recommended calibration interval
MIL-T-28800D, classes 3 and 5
2 years for operation with external reference,
1 year with internal reference
Power supply
AC supply 100 V AC to 240 V AC,
50 Hz to 400 Hz, 3.1 A to 1.3 A,
class of protection I to VDE 411
Typical power
consumption
Safety meets EN 61010-1, UL 3111-1,
70 VA 120 VA 150 VA
CSA C22.2 No. 1010-1, IEC 1010-1
RFI suppression meets EMC Directive of EU (89/336/EEC) and
German EMC law
Test mark VDE, GS, CSA, CSA-NRTL/C
Dimensions in mm
(W x H x D)
412 x 197 x 417
Weight 10.5 kg 11.3 kg 12 kg
1)
See recommended extras for alternate connectors
<2 x 10
hard disk
–5
Spectrum Analyzer FSP 16
Page 17

Specifications of options
Tracking Generator FSP-B9
Unless specified otherwise, specifications not valid for frequency range from
–3 x RBW to +3 x RBW, however at least not valid from –9 kHz to +9 kHz.
Frequency
Frequency range 9 kHz to 3000 MHz
Frequency offset
Setting range ±150 MHz
Resolution 1 Hz
Spectral purity
(dBc (1 Hz)) SSB phase noise, f = 500 MHz, carrier offset 100 kHz
Normal mode typ. –90
With FM modulation on typ. –70
Level
Level range –30 dBm to 0 dBm in steps of 0.1 dB
Level range with AM –30 dBm to –6 dBm in steps of 0.1 dB
Max. deviation of output level,
128 MHz, 0 dBm
Frequency response
Output level 0 dBm,
100 kHz to 2 GHz
Output level
−25 dBm,
0 dBm to
9 kHz to 3 GHz
Dynamic range
Attenuation measurement
range, RBW = 1 kHz,
f >10 MHz
Spurious
Harmonics,
output level –10 dBm
Nonharmonics,
output level 0 dBm
Modulation
Modulation format (external) I/Q, AM, FM, FM-DC, PM, ASK, FSK
AM, f >10 MHz
Modulation depth 0% to 99%
Modulation frequency range 0 Hz to 1 MHz
FM, f >10 MHz
Frequency deviation 0 Hz to 20 MHz
Modulation frequency range 0 Hz to 100 kHz
I/Q modulation, f >10 MHz
0 Hz to 30 MHz typ. 1 dB
Inputs and outputs (front panel)
RF output N female, 50
VSWR typ. 2:1
Inputs and outputs (rear panel)
TG/AM In V
TG Q/FM In V
max(pp)
max(pp)
<1 dB
<1 dB
<3 dB
120 dB
typ. –30 dBc
typ. –30 dBc
Ω
=1 V; Zin = 50 Ω, BNC female
=1 V; Zin = 50 Ω, BNC female
LAN Interface FSP-B16
Connector (rear panel) RJ-45
Supported protocols
10Base-T (IEEE standard 10 Mbit/s 802.3)
100Base-Tx (IEEE standard 100 Mbit/s
802.3u)
Electronic Attenuator FSP-B25 (only for FSP3 and FSP7)
Frequency
Frequency range 10 MHz to 7000 MHz
Input attenuator range
(mechanical)
Electronic attenuation range 0 dB to 30 dB in 5 dB steps
Preamplifier 20 dB, switchable
Displayed average noise level with preamplifier on
(0 dB RF attenuation, RBW 10 Hz, VBW 1 Hz, 20 averages,
trace average, span 0 Hz, termination 50
10 MHz to 2 GHz <-152 dBm
2 GHz to 7 GHz <-150 dBm
Intermodulation with electronic attenuator on
3rd-order intermodulation, intermodulation-free dynamic range, level
2 x -30 dBm,
20 MHz to 200 MHz >74 dBc, TOI >7 dBm
200 MHz to 3 GHz >80 dBc, TOI >10 dBm
3 GHz to 7 GHz >84 dBc, TOI >12 dBm
Max. deviation of level measurement
128 MHz, -30 dBm
(RF attenuation 10 dB, RBW
10 kHz, ref. level -20 dBm),
preamplifier ON
Electronic attenuator <0.2 dB (σ = 0.07 dB)
Frequency response with preamplifier, electronic attenuator
10 MHz to 3 GHz <1.0 dB (
3 GHz to 7 GHz <2 dB (
∆f >5 x RBW or 10 kHz, whichever the greater value
0 dB to 75 dB in 5 dB steps
Ω)
σ = 0.07 dB)
<0.2 dB (
σ = 0.33 dB)
σ = 0.7 dB)
External Generator Control FSP-B10
Supported signal generators SME02/03/06, SMG, SMGL, SMGU,
SMIQ 02B/02E/03B/03E/04B/06B
SMH, SMHU,
SML01, SMR 20/27/30/40
SMP 02/22/03/04, SMX
Spectrum Analyzer FSP 17
Page 18

Ordering information
Recommended extras
Order designation Type Order No.
Spectrum Analyzer 9 kHz to 3 GHz FSP 3 1093.4495.03
Spectrum Analyzer 9 kHz to 7 GHz FSP 7 1093.4495.07
Spectrum Analyzer
Spectrum Analyzer 9 kHz to 30 GHz FSP30 1093.4495.30
Accessories supplied
Power cable, operating manual, service manual
FSP30: test port adapter 3.5 mm female (1021.0512.00) and N female
(1021.0535.00)
9 kHz to 13.6 GHz
FSP13 1093.4495.13
Options
Order designation Type Order No.
Delete Manuals FSP-B0 1129.8394.02
Rugged case, carrying handle
(factory-fitted)
AM/FM Demodulator FSP-B3 1129.6491.02
OCXO Reference Frequency FSP-B4 1129.6740.02
Internal tracking Generator 9 kHz to
3 GHz, IQ modulator, for all FSP models
External Generator Control for all
FSP models
LAN Interface 100BT for all FSP models
Electronic Attenuator,
0 dB to 30 dB, 5 dB steps, integrated
preamplifier for FSP3 and FSP7
Software
Noise Measurement Software FS-K3 1057.3028.02
FSP-B1 1129.7998.02
FSP-B9 1129.6991.02
FSP-B10 1129.7246.02
FSP-B16 1129.8042.02
FSP-B25 1129.7746.02
Order designation Type Order No.
Headphones 0708.9010.00
US Keyboard with trackball PSP-Z2 1091.4100.02
PS/2 Mouse FSE-Z2 1084.7043.02
Colour Monitor, 15", 230 V PMC3 1082.6004.02
IEC/IEEE-Bus Cable, 1 m PCK 0292.2013.10
IEC/IEEE-Bus Cable, 2 m PCK 0292.2013.20
19" Rack Adapter (not for FSP-B1) ZZA 478 1096.3248.00
Trolley ZZK-1 1014.0510.00
Matching Pads, 75
L Section RAM 0358.5414.02
Series Resistor, 25
SWR Bridge, 5 MHz to 3000 MHz ZRB2 0373.9017.52
SWR Bridge, 40 kHz to 4 GHz ZRC 1039.9492.52
High-Power Attenuators, 100 W
3/6/10/20/30 dB RBU 100 1073.8820.XX
High-Power Attenuators, 50 W
3/6/10/20/30 dB RBU 50 1073.8895.XX
For FSP30
Test port Adapter, 3.5 mm male –
Test port Adapter, N male –
*) Taken into account in device function RF INPUT 75 Ω.
Ω
Ω *) RAZ 0358.5714.02
(XX=03/06/10/20/
30)
(XX=03/06/10/20/
30)
1021.0529.00
1021.0541.00
Printed in Germany 6/2000 (U as)
Data without tolerances: typical values
⋅
Subject to change
⋅
Certified Quality System
ISO 9001
DQS REG. NO 1954-04
Trade names are trademarks of the owners
⋅
Spectrum Analyzer FSP
⋅
PD 757.5137.23
ROHDE& SCHWARZ GmbH & Co. KG ⋅ Mühldorfstraße 15 ⋅ D-81671 München ⋅ P.O.B. 8014 69 ⋅ D-81614 München ⋅ Telephone +49894129-0
Internet: http://www.rohde-schwarz.com ⋅ CustomerSupport: Tel. +491805124242, Fax +49 89 4129-3777, E-mail: CustomerSupport@www.rohde-schwarz.com
Page 19

The new Spectrum
Analyzers FSP from
Rohde & Schwarz…
• Unparalleled range of functions
• Highest measurement speed
• Maximum in precision
With the new FSP family, the well-known advantages of
high-end Analyzers FSE and FSIQ have been systematically
integrated into the medium class of analyzers. FSP sets the
standard for the medium class regarding the vital criteria of
functionality, measurement speed and accuracy. The use of
innovative techniques such as an highly integrated front-end
and fully digital signal processing in the back-end, together
with ASICs developed by Rohde & Schwarz, has resulted in
a product of top-class specifications and high reliability.
…the new medium class
standard
Page 20

A wealth of functions…
The FSP option list is short – all important functions and interfaces are implemented as standard. FSP features future-oriented characteristics such as an RMS detector and a CCDF
routine for fast statistical measurements on digitally modulated signals not offered by any other medium-class spectrum analyzer.
Function / Option Standard Option
Highly selective digital filters from
10 Hz to 100 kHz
Fast FFT filters from 1 Hz to 30 kHz l
QP detector & EMI bandwidths
200Hz, 9kHz, 120kHz
2.5 ms sweep time in frequency
domain
1 µs sweep time in time domain l
Time-selective spectrum analysis
with gating
GPIB interface, IEEE 488.2 l
RS232C serial interface,
9-pin sub-D
VGA output, 15-pin sub-D l
PC-compatible screen shots on
floppy disk or hard disk
Measurement speed manually
up to 20 measurements/s
Measurement speed GPIB
up to 30 measurements/s
SCPI-compatible GPIB command set l
FSE/FSIQ-compatible GPIB
command set
Fast ACP measurements in time
domain
CCDF measurement functions l
RMS detector with 100 dB dynamic
range
2-year calibration interval l
3-year warranty l
Cabinet for portable use − B1
AM/FM audio demodulator − B3
OCXO reference frequency − B4
Tracking generator – B9
External generator control – B10
LAN interface – B16
Electronic attenuator – B25
l
l
l
l
l
l
l
l
l
l
l
…the new standard in the
medium class
 Loading...