

Page 1

Test and Measurement
Division
Operating Manual
Handheld Spectrum Analyzer
R&SFSH
1145.5850.03
1145.5850.13
1145.5850.23
1145.5850.06
1145.5850.26
1145.5850.18
1145.5973.12-14- 1
Page 2

Dear Customer,
R&S® is a registered trademark of Rohde & Schwarz GmbH & Co. KG.
Trade names are trademarks of the owners.
1145.5973.12-14- 2
Page 3

R&S FSH Contents
Contents
Specifications
Safety Instructions
Certificate of Quality
EC-Certificate of Conformity
Support Center Address
List of R&S Representatives
1 Putting into Operation..............................................................................................................1.1
Front view..........................................................................................................................................1.1
Putting into Operation......................................................................................................................1.2
Unpacking the Instrument ...........................................................................................................1.2
Setting up the Instrument............................................................................................................1.3
Switching on the Spectrum Analyzer ..........................................................................................1.4
Spectrum Analyzer Connectors ..................................................................................................1.5
Screen Settings...........................................................................................................................1.8
Country-Specific Settings..........................................................................................................1.10
Setting the Date and Time ........................................................................................................1.11
Setting the date ............................................................................................................1.11
Setting the time ............................................................................................................1.11
Charging the Battery......................................................................................................................1.12
Selecting the Instrument Default Setup .......................................................................................1.13
External Reference / External Trigger Switchover ......................................................................1.14
Controlling the RF Attenuator.......................................................................................................1.15
Using a Preamplifier .......................................................................................................................1.15
PIN Entry..........................................................................................................................................1.17
Connecting Printers .......................................................................................................................1.19
Setting the Baud Rate for Remote Control ..................................................................................1.21
Enabling Options............................................................................................................................1.21
Checking the Installed Options.....................................................................................................1.22
1145.5973.12 I.1 E-14
Page 4

Contents R&S FSH
2 Getting Started ............................................................................................................................2.1
Measurements on CW Signals ........................................................................................................2.1
Level measurement ....................................................................................................................2.1
Setting the Reference Level........................................................................................................2.2
Frequency Measurements ..........................................................................................................2.3
Harmonic Measurements of a Sinewave Signal.........................................................................2.4
Power Measurements Using the Power Sensor .........................................................................2.5
Power and Return Loss Measurements with the R&S FSH-Z14 or the R&S FSH-Z44..............2.7
Two-Port Transmission Measurements ......................................................................................2.9
Measurement of Return Loss ...................................................................................................2.11
Performing Distance-To-Fault Measurements..........................................................................2.14
Operation in Receiver Mode..........................................................................................................2.20
Measuring the Carrier-to-Noise Ratio...........................................................................................2.25
Reference power/reference level ..............................................................................................2.26
Measuring the noise power.......................................................................................................2.27
Saving and Recalling Settings and Test Results ........................................................................2.28
Saving Measurement Results ...................................................................................................2.28
Saving Calibration Data ............................................................................................................2.29
Recalling Measurement Results ...............................................................................................2.30
Printing Out Measurement Results ..............................................................................................2.31
1145.5973.12 I.2 E-14
Page 5

R&S FSH Contents
3 Operation .......................................................................................................................................3.1
Screen Layout ...................................................................................................................................3.1
Screen layout for spectrum-mode measurements without markers ...........................................3.1
Screen layout when the marker mode is selected ......................................................................3.2
Entering Measurement Parameters ................................................................................................3.3
Entering values and texts............................................................................................................3.3
Entering units ..............................................................................................................................3.4
Menu Overview .................................................................................................................................3.5
Frequency entry........................................................................................................................3.5
Frequency span ........................................................................................................................3.5
Level setting ..............................................................................................................................3.5
Bandwidth setting.....................................................................................................................3.5
Sweep.........................................................................................................................................3.6
Trace setting..............................................................................................................................3.6
Measurement functions ...........................................................................................................3.7
Markers .....................................................................................................................................3.10
Save and print menu ..............................................................................................................3.12
Instrument setup.....................................................................................................................3.12
Status display............................................................................................................................3.12
Menus in the Receiver Mode (Option R&S FSH-K3) ...................................................................3.13
Menu for 3GPP BTS Code Domain Power Measurement (Option R&S FSH-K4) ...................3.16
1145.5973.12 I.3 E-14
Page 6

Contents R&S FSH
4 Instrument Functions ..........................................................................................................................4.1
Instrument Default Setup.................................................................................................................4.1
Status Display ...................................................................................................................................4.1
Setting the Frequency......................................................................................................................4.2
Entering the center frequency.....................................................................................................4.2
Setting a frequency offset ...........................................................................................................4.2
Entering the center-frequency step size .....................................................................................4.3
Entering the start and stop frequency .........................................................................................4.4
Working with channel tables .......................................................................................................4.4
Setting the Span ...............................................................................................................................4.6
Setting the Amplitude Parameters..................................................................................................4.7
Setting the reference level ..........................................................................................................4.8
Entering the display range ..........................................................................................................4.9
Entering the display unit..............................................................................................................4.9
Entering the reference offset ....................................................................................................4.10
Entering the input impedance ...................................................................................................4.10
Setting the Bandwidths .................................................................................................................4.11
Resolution bandwidth................................................................................................................4.11
Video bandwidth........................................................................................................................4.13
Setting the Sweep...........................................................................................................................4.15
Sweep time ...............................................................................................................................4.15
Sweep mode .............................................................................................................................4.16
Trigger.......................................................................................................................................4.16
Trace Settings.................................................................................................................................4.19
Trace mode...............................................................................................................................4.19
Detector ....................................................................................................................................4.20
Trace memory...........................................................................................................................4.22
Trace mathematics ...................................................................................................................4.23
Using the Markers ..........................................................................................................................4.24
Automatic marker positioning ...................................................................................................4.25
Using more than one marker at a time (multimarker mode).....................................................4.27
Marker functions .......................................................................................................................4.30
Measuring the noise power density..............................................................................4.30
Measuring the frequency..............................................................................................4.31
AF demodulation.......................................................................................................................4.32
1145.5973.12 I.4 E-14
Page 7

R&S FSH Contents
Using the Display Line ...................................................................................................................4.33
Setting and Using the Measurement Functions..........................................................................4.34
Measuring the channel power of continuously modulated signals ..........................................4.34
Selecting the standard ..............................................................................................................4.35
Setting the reference level ........................................................................................................4.37
Setting the channel bandwidth..................................................................................................4.37
Changing the span....................................................................................................................4.38
Power display............................................................................................................................4.39
Power measurements on TDMA signals......................................................................................4.41
Selecting a standard .................................................................................................................4.41
Setting the measurement time ..................................................................................................4.43
Optimizing the reference level ..................................................................................................4.43
Power readout...........................................................................................................................4.44
Setting the trigger......................................................................................................................4.44
Measuring the occupied bandwidth .............................................................................................4.45
Selecting a standard .................................................................................................................4.46
Setting the reference level ........................................................................................................4.47
Setting the channel bandwidth..................................................................................................4.48
Entering the power percent to determine the occupied bandwidth ...........................................4.49
Displaying the occupied bandwidth...........................................................................................4.49
Changing the span....................................................................................................................4.50
Measuring the Carrier-to-Noise Ratio...........................................................................................4.51
Determining the reference ........................................................................................................4.52
DIGITAL Tx mode........................................................................................................4.52
ANALOG TV mode ......................................................................................................4.53
CW Tx mode................................................................................................................4.53
Manual reference mode ...............................................................................................4.54
Setting the reference channel ......................................................................................4.54
Setting the reference channel bandwidth.....................................................................4.55
Setting the analyzer reference level for the reference channel measurement.............4.56
Inserting the C/N reference ..........................................................................................4.57
Units of the C/N reference ...........................................................................................4.57
Measuring the noise channel power and calculating the carrier power/noise power ................4.57
Setting the noise channel.............................................................................................4.58
Setting the noise channel bandwidth ...........................................................................4.59
Setting the R&S FSH reference level during noise channel measurement .................4.59
Selecting the C/N result display ...................................................................................4.60
C/N measurement result display..................................................................................4.60
Changing the span.......................................................................................................4.61
1145.5973.12 I.5 E-14
Page 8

Contents R&S FSH
Using the R&S FSH in receiver mode...........................................................................................4.62
Setting the frequency ................................................................................................................4.63
Setting the reference level ........................................................................................................4.65
Setting the bandwidth................................................................................................................4.66
Setting the detector...................................................................................................................4.67
Setting the measurement time ..................................................................................................4.67
Measurement on multiple frequencies or channels (scan) .......................................................4.68
Measurements using the power sensor.......................................................................................4.70
Connecting the power sensor ...................................................................................................4.70
Zeroing the power sensor .........................................................................................................4.72
Selecting the unit for the power readout ...................................................................................4.73
Setting the averaging time ........................................................................................................4.74
Taking additional loss or gain into account ...............................................................................4.74
Measuring forward and reflected power ......................................................................................4.76
Zeroing the power sensor .........................................................................................................4.78
Setting the power measurement weighting...............................................................................4.79
Selecting the unit for the power readout ...................................................................................4.80
Taking additional attenuation into account................................................................................4.82
Two-port measurements with the tracking generator ................................................................4.83
Measuring the transmission of two-ports ..................................................................................4.85
Vector transmission measurement ..............................................................................4.88
Measuring the transmission magnitude .......................................................................4.90
Measuring the transmission phase ..............................................................................4.90
Measuring the electrical length when measuring transmission....................................4.93
Measuring the group delay when measuring transmission..........................................4.94
Transmission measurement using the connected VSWR Bridge R&S FSH-Z3..........4.96
Spectrum measurements with the VSWR Bridge R&S FSH-Z3 or R&S FSH-Z2
connected.....................................................................................................................4.97
Setting for detecting the R&S FSH-Z3 in the transmission and spectrum meas. ........4.98
Supplying DC voltage to active DUTs..........................................................................4.99
Reflection measurements ............................................................................................4.99
Scalar measurement of reflection ..............................................................................4.100
Vector measurement of reflection..............................................................................4.102
Measuring the reflection magnitude...........................................................................4.105
Measuring the reflection phase..................................................................................4.105
Measuring the electrical length when measuring reflection .......................................4.106
Displaying the reflection in the Smith chart.................................................4.107
Measuring the group delay when measuring reflection..............................................4.112
Spectrum measurements with the VSWR Bridge R&S FSH-Z3 or R&S FSH-Z2
connected...................................................................................................................4.113
Settings for detection of the R&S FSH-Z2 and R&S FSH-Z3 ....................................4.114
One-Port Measurement of Cable Loss .......................................................................................4.115
1145.5973.12 I.6 E-14
Page 9

R&S FSH Contents
Cable Measurements....................................................................................................................4.116
Cable selection .......................................................................................................................4.117
Selecting the frequency range ................................................................................................4.120
Calibrating the test setup ........................................................................................................4.121
Locating cable faults by means of the marker function ..........................................................4.124
Measuring spectrum and reflection.........................................................................................4.127
Further information .................................................................................................................4.128
Setting the span .........................................................................................................4.128
Selecting the center frequency...................................................................................4.129
Measurement .............................................................................................................4.130
Length measurement accuracy..................................................................................4.130
Using Limit Lines..........................................................................................................................4.131
Measurements with limit lines .................................................................................................4.133
Definition range of limit lines ...................................................................................................4.134
Data sets containing limit lines................................................................................................4.134
Measuring with Transducer Factors...........................................................................................4.135
Unit for measurements with transducers ................................................................................4.137
Reference level settings for measurements with transducers ................................................4.137
Frequency range of transducer...............................................................................................4.138
Data sets containing transducer factors .................................................................................4.138
Field-Strength Measurement with Isotropic Antenna...............................................................4.139
Connecting the antenna to the R&S FSH ...............................................................................4.139
Measurement of the resultant field strength in a transmission channel with large bandwidth 4.141
Code Domain Power Measurement on 3GPP FDD Signals ......................................................4.148
Saving and Loading Instrument Settings and Measurement Results.....................................4.153
Saving results .........................................................................................................................4.154
Entering a data set name........................................................................................................4.155
Loading measurement results ................................................................................................4.155
Deleting saved data sets.........................................................................................................4.156
Deleting all data sets...............................................................................................................4.157
Printing out Measurement Results .............................................................................................4.158
Measurements ..............................................................................................................................4.159
How a spectrum analyzer operates ........................................................................................4.159
1145.5973.12 I.7 E-14
Page 10

R&S FSH3, R&S FSH6, R&S FSH18 Data Sheet
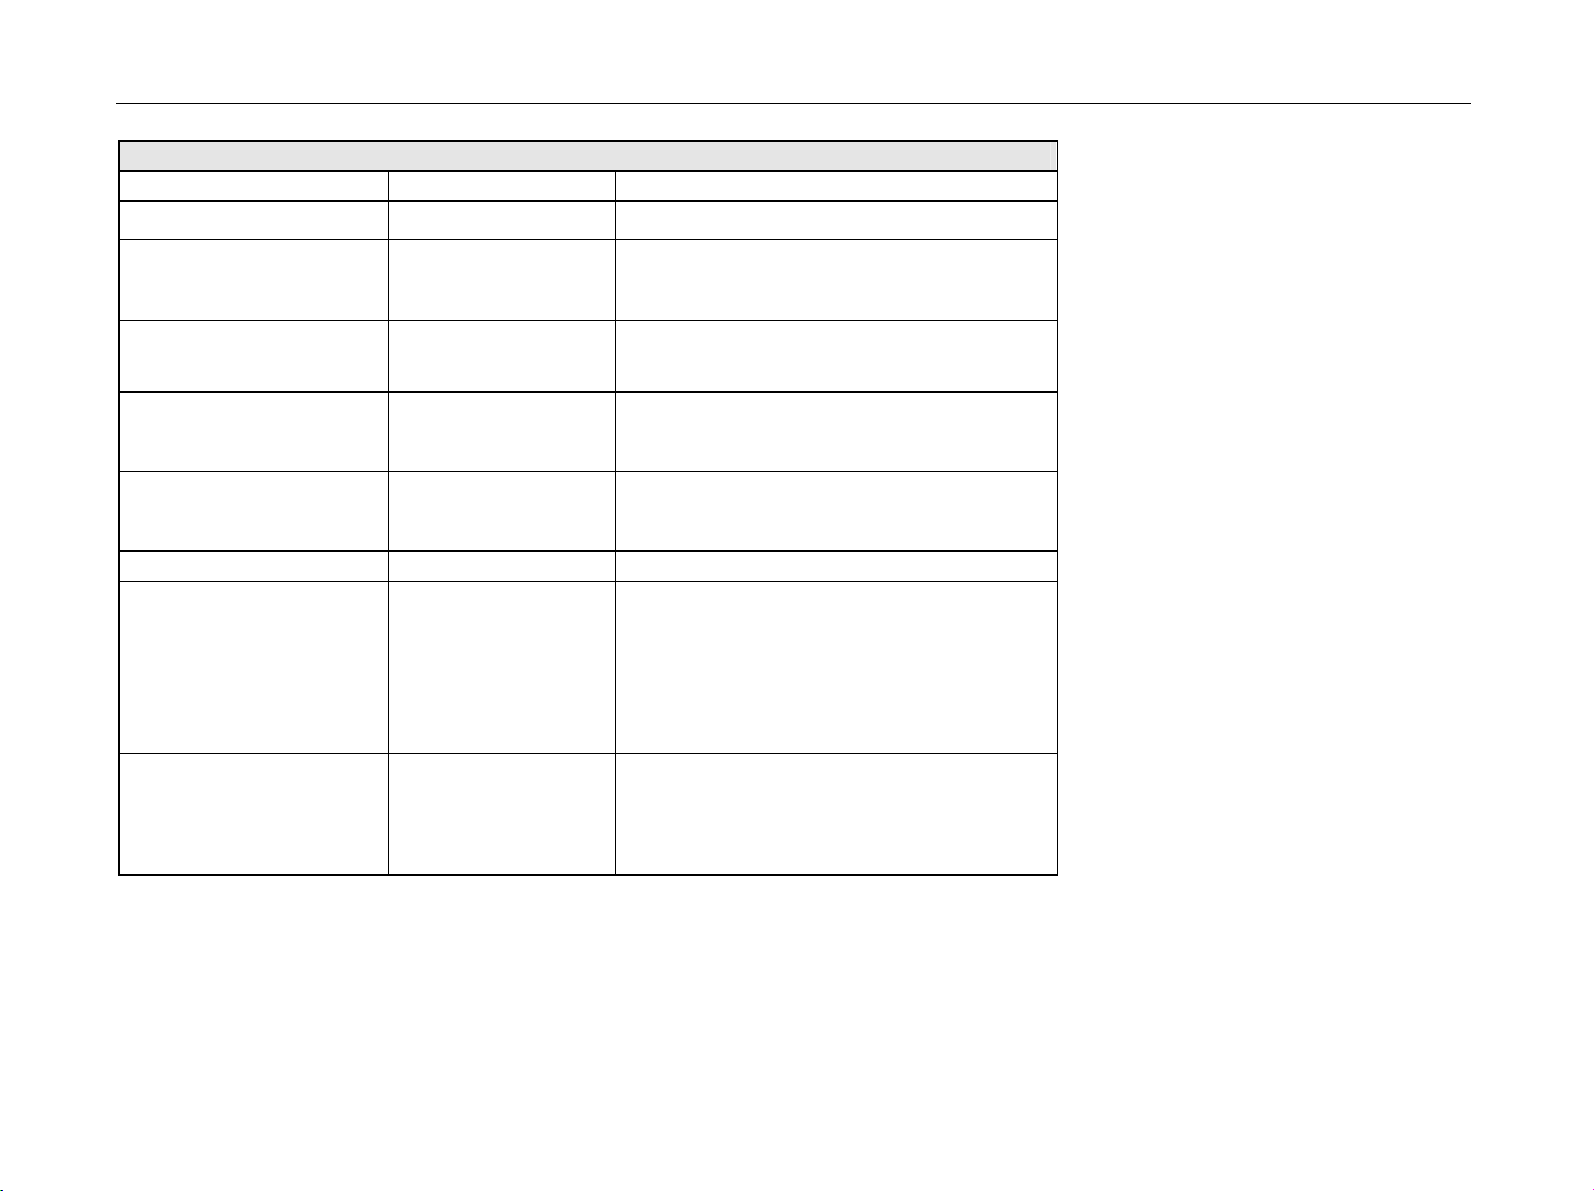
Specifications
Specifications are valid under the following conditions: 15 minutes warm-up time at ambient temperature, specified environmental conditions met and
calibration cycle adhered to. Data without tolerances: typical values. Data designated as "nominal": design parameters, i.e. not tested.
Specification Condition R&S FSH3 R&S FSH6 R&S FSH18
Frequency
Frequency range 100 kHz to 3 GHz 100 kHz to 6 GHz 10 MHz to 18 GHz
Reference frequency
Aging 1 ppm/year
Temperature drift 0 °C to 30 °C
30 °C to 50 °C
Frequency counter
Resolution 1 Hz
Frequency span 0 Hz, 100 Hz to 3 GHz 0 Hz, 100 Hz to 6 GHz 0 Hz, 100 Hz to 18 GHz
1145.5850.13 0 Hz, 1 kHz to 3 GHz - -
Spectral purity
SSB phase noise f = 500 MHz, 20 to 30 °C
30 kHz from carrier <-85 dBc/(1 Hz) <-85 dBc/(1 Hz)
100 kHz from carrier < -100 dBc/(1 Hz) < -90 dBc/(1 Hz)
1 MHz from carrier < -120 dBc/1 Hz) < -100 dBc/(1 Hz)
Sweep time span = 0 Hz 1 ms to 100 s
span > 0 Hz 20 ms to 1000 s, min. 20 ms/600 MHz
Bandwidths
Resolution bandwidths
(-3 dB)
Tolerance
1145.5850.13 1, 3, 10, 30,100, 200, 300 kHz, 1 MHz
1145.5850.03, .23,
1145.5850.06, .26, .18
300 kHz ± 5 %, nominal
1 MHz
in addition 2 ppm/10°C
In addition 100, 300 Hz
2 ppm
± 10 %, nominal
1145.5973.12 TI.1 E-14
Page 11
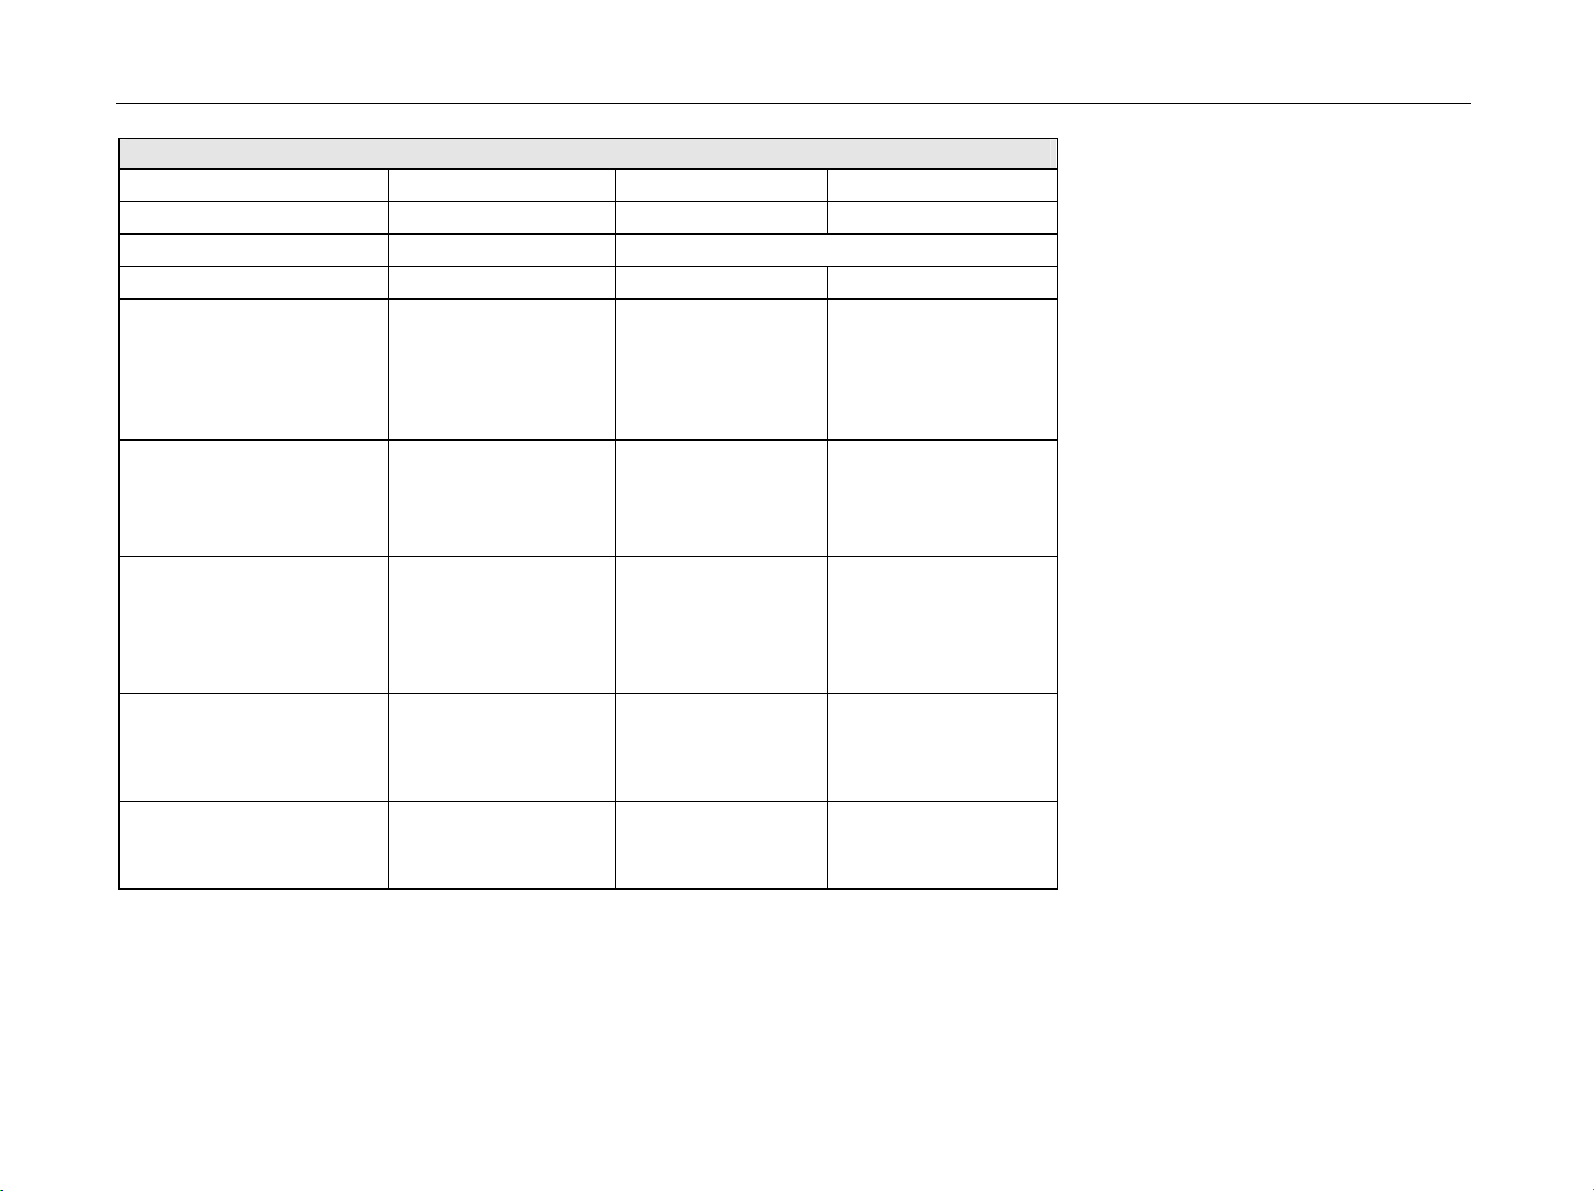
Data Sheet R&S FSH3, R&S FSH6, R&S FSH18
Specification Condition R&S FSH3 R&S FSH6 R&S FSH18
Resolution bandwidths
(-6 dB)
Video bandwidths 10 Hz to 1 MHz in 1, 3 steps
Amplitude
Display range
Maximum permissible DC
voltage at RF input
Maximum power 20 dBm, 30 dBm (1 W) for max. 3 minutes 20 dBm
Intermodulation-free dynamic
range
Carrier offset 2 MHz
Carrier offset > 2 MHz 66 dB (+13 dBm third-order intercept) 50 dB (nominal)
with option R&S FSH-K3
installed
third-order IM products,
2 x -20 dBm, reference
level = -10 dBm
in addition 200 Hz, 9 kHz, 120 kHz, 1 MHz
average noise level displayed to +20 dBm
50 V / 80 V1)
50 V
60 dB (+10 dBm third-order intercept) 50 dB (nominal)
(+5 dBm third-order
intercept)
(+5 dBm third-order
intercept)
1
80 V valid as of serial number 100900 (model 1145.5850.03) or 101600 (model 1145.5850.13); models 1145.5850.23, 1145.5850.06 and .26 all serial numbers.
1145.5973.12 TI.2 E-14
Page 12

R&S FSH3, R&S FSH6, R&S FSH18 Data Sheet
Specification Condition R&S FSH3 R&S FSH6 R&S FSH18
Displayed average noise level average value,
resolution bandwidth
1 kHz,
video bandwidth 10 Hz,
reference level -30 dBm
10 MHz to 50 MHz <-105 dBm,
typ. -114 dBm
50 MHz to 3 GHz <-105 dBm,
typ. -114 dBm
3 GHz to 5 GHz - <-103 dBm,
5 GHz to 6 GHz - <-96 dBm,
6 GHz to 8 GHz - - <-108 dBm,
8 GHz to 12 GHz - - <-105 dBm,
12 GHz to 16 GHz - - <-100 dBm,
16 GHz to 18 GHz - - <-90 dBm,
With preamplifier
10 MHz to 2.5 GHz
only models
1145.5850.03
1145.5850.23,
2
),
<-120 dBm,
typ. -125 dBm
1145.5850.06 and
1145.5850.26
2.5 GHz to 3 GHz <-115 dBm,
typ. -120 dBm
3 GHz to 5 GHz - <-115 dBm,
5 GHz to 6 GHz - <-105 dBm,
<-105 dBm,
typ. -112 dBm
<-105 dBm,
typ. -112 dBm
typ. -108 dBm
typ. -102 dBm
<-120 dBm,
typ. -125 dBm
<-115 dBm,
typ. -120 dBm
typ. -120 dBm
typ. -110 dBm
<-90 dBm,
typ. -98 dBm
<-110 dBm,
typ. -118 dBm
<-110 dBm,
typ. -118 dBm
<-110 dBm,
typ. -118 dBm
typ. -113 dBm
typ. -113 dBm
typ. -108 dBm
typ. -102 dBm
-
-
-
-
2
As of serial number 100900 and firmware version 6.0 or higher.
1145.5973.12 TI.3 E-14
Page 13

Data Sheet R&S FSH3, R&S FSH6, R&S FSH18
Specification Condition R&S FSH3 R&S FSH6 R&S FSH18
Inherent spurious
Input related spurious
R&S FSH3 / FSH6
Receive frequency
Up to 3 GHz
3 GHz to 6 GHz
reference level -20 dBm,
f > 30 MHz,
RBW 100 kHz,S/N>10dB
mixer level -40 dBm
carrier offset >1 MHz
<-80 dBm <-80 dBm <-80 dBm
-70 dBc (nominal)
-70 dBc (nominal)
-64 dBc (nominal)
Receive frequency =
signal frequency – 2.0156 GHz
Input related spurious
R&S FSH18
Receive frequency:
10 MHz to 14 GHz
14 GHz to 18 GHz
Receive frequency =
signal frequency – 3.9 GHz
signal frequency + 0.6 GHz to +
1 GHz
signal frequency – 0.6 GHz to
– 1 GHz
2nd harmonic
Receive frequency
Up to 6 GHz
6 GHz to 9 GHz
Level display
Reference level -80 to +20 dBm in steps of 1 dB
Display range 100 dB, 50 dB, 20 dB, 10 dB, linear
signal frequency
2 GHz to 3.2 GHz
mixer level
carrier offset >1MHz
signal frequency:
10 MHz to 7.6 GHz
7.6 GHz to 18 GHz
10 MHz to 2.8 GHz
2.8 GHz to 7.6 GHz
7.6 GHz to 18 GHz
signal frequency:
3.9 GHz to 18 GHz
7.4 GHz to 7.7 GHz
7.8 GHz to 8.5 GHz
mixer level -40 dBm
-20 dBm
55 dBc (nominal)
-60 dBc (nominal) -60 dBc (nominal)
55 dBc (nominal)
-60 dBc (nominal)
-50 dBc (nominal)
-50 dBc (nominal)
-30 dBc (nominal)
-50 dBc (nominal)
-40 dBc (nominal)
-45 dBc(nominal)
-45 dBc(nominal)
-60 dBc (nominal)
-50 dBc (nominal)
1145.5973.12 TI.4 E-14
Page 14

R&S FSH3, R&S FSH6, R&S FSH18 Data Sheet
Specification Condition R&S FSH3 R&S FSH6 R&S FSH18
Display units
Logarithmic
Linear
Traces 1 trace and 1 memory trace
Trace mathematics A-B and B-A (trace – memory trace and memory trace – trace)
Detectors auto peak, maximum peak, minimum peak, sample, RMS
with option R&S FSH-K3
installed
Level measurement error
at reference level down to
-50 dB, 20 °C to 30 °C
1 MHz to 10 MHz
10 MHz to 20 MHz
20 MHz to 6 GHz
6 GHz to 14 GHz
14 GHz to 18 GHz
Markers
Number of markers or delta
markers
Marker functions peak, next peak, minimum, center = marker frequency,
Marker displays normal (level), noise marker, frequency counter (count)
Trigger
Audio demodulation
with transducer also dBIV/m and dBIA/m
with transducer also V/m, mV/m , IV/m and W/m
in addition average and quasi-peak
< 1.5 dB, typ. 0.5 dB
< 1.5 dB, typ. 0.5 dB
< 1.5 dB, typ. 0.5 dB
reference level = marker level, all markers to peak
AM (video voltage without AGC) and FM
dBm, dBIV, dBmV
IV, mV, V, nW, µW, mW, W
-
-
max. 6
free-running, video, external
2
-
< 2 dB
< 1.5 dB
< 2.5 dB
< 3.0 dB
1145.5973.12 TI.5 E-14
Page 15

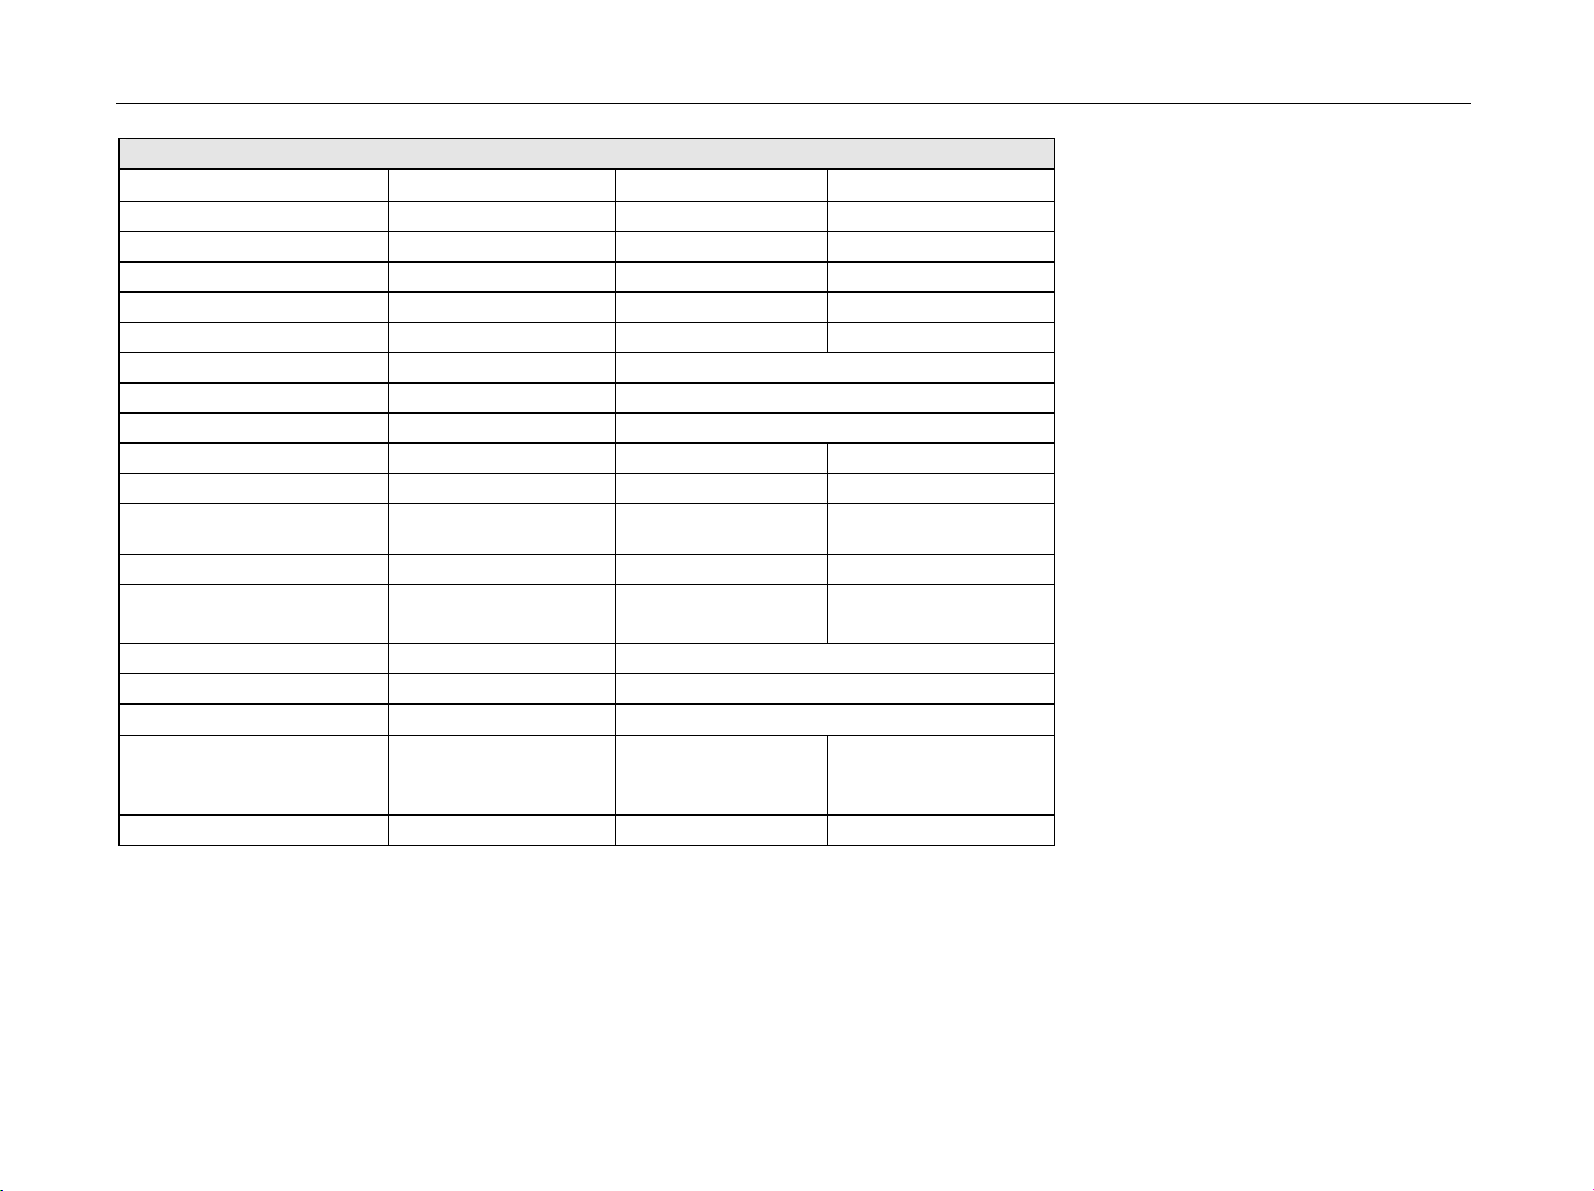
Data Sheet R&S FSH3, R&S FSH6, R&S FSH18
Specification Condition R&S FSH3 R&S FSH6 R&S FSH18
Inputs
RF input N female
Input impedance
VSWR 10 MHz to 3 GHz
3 GHz to 6 GHz
6 GHz to 15 GHz
15 GHz to 18 GHz
Trigger/external reference input BNC female, selectable
Trigger voltage TTL
Reference frequency 10 MHz
Required level
Outputs
AF output 3.5 mm mini jack
Output impedance
Open-circuit voltage
Tracking generator only models 145.5850.13,
Frequency range 5 MHz to 3 GHz 5 MHz to 6 GHz -
Output level model 1145.5850.13
Output impedance
from 50
1145.5850.23 und
1145.5850.26
model 1145.5850.23
model 1145.5850.26
f < 3 GHz
f > 3 GHz
<1.5 nominal <1.5 nominal
adjustable up to 1.5 V
-20 dBm (nominal)
0 dBm / -20 dBm,
selectable
Interfaces
RS-232-C optical interface
Baud rate 1200, 2400, 9600, 19200, 38400, 57600, 115200 baud
Power sensor 7-contact female connector (type Binder 712)
50
<1.5 nominal
10 dBm
100
- 10 dBm (nominal)
- 20 dBm (nominal)
50 , nominal
<1.5 nominal
<1.5 nominal
<2 nominal
<3 nominal
-
1145.5973.12 TI.6 E-14
Page 16
R&S FSH3, R&S FSH6, R&S FSH18 Data Sheet
Accessories
Power Sensors R&S FSH-Z1 and R&S FSH-Z18
Frequency range R&S FSH-Z1 10 MHz to 8 GHz
R&S FSH-Z18 10 MHz to 18 GHz
VSWR
10 MHz to 30 MHz
30 MHz to 2.4 GHz
2.4 GHz to 8 GHz
8 GHz to 18 GHz
Maximum input power average power
peak power
(<10 Is, 1% duty cycle)
Measurement range 200 pW to 200 mW (-67 dBm to +23 dBm)
Signal weighting average power
Effect of harmonics
Effect of modulation
Absolute measurement
uncertainty
10 MHz to 8 GHz
8 GHz to 18 GHz
Zero offset after zeroing < 110 pW
Dimensions 48 mm x 31 mm x 170 mm, connecting cable 1.5 m
Weight < 0.3 kg
sine signals,
no zero offset
15 °C to 35 °C
0 °C to 50 °C
15 °C to 35 °C
0 °C to 50 °C
<0.5 % (0.02 dB) at harmonic ratio of 20 dB
<1.5 % (0.07 dB) for continuous digital modulation
< 1.15
< 1.13
< 1.20
<1.25
400 mW (+26 dBm)
1 W (+30 dBm)
<2.3 % (0.10 dB)
<4.2 % (0.18 dB)
<3.5 % (0.15 dB)
<5.0 % (0.21 dB)
1145.5973.12 TI.7 E-14
Page 17
Data Sheet R&S FSH3, R&S FSH6, R&S FSH18
Directional Power Sensor R&S FSH-Z14
Frequency range 25 MHz to 1 GHz
Power measurement range 30 mW to 300 W
VSWR referenced to 50
Power-handling capacity depending on temperature
and matching
(see diagram below)
Insertion loss < 0.06 dB
Directivity > 30 dB
Average power
Power measurement range
CW, FM, PM, FSK, GMSK
Modulated signals
Measurement uncertainty
25 MHz to 40 MHz
40 MHz to 1 GHz
Zero offset after zeroing
Range of typical meas. error
with modulation
FM, PM, FSK, GMSK
AM (80 %)
2 CW carriers with identical
power
EDGE, TETRA
CF: ratio of peak envelope
power to average power
sine signal,
18 °C to 28 °C, no zero
offset
*) if standard is selected
on the R&S FSH
30 mW to 300 W / CF
4.0 % of measured value (0.17 dB)
3.2 % of measured value (0.14 dB)
0 % of measured value (0 dB)
± 3 % of measured value (± 0.13 dB)
± 2 % of measured value (± 0.09 dB)
± 0.5 % of measured value (± 0.02 dB) *)
< 1.06
100 W to 1000 W
30 mW to 300 W
± 4 mW
Temperature coefficient
25 MHz to 40 MHz
40 MHz to 1 GHz
0.40 %/K (0.017 dB/K)
0.25 %/K (0.011 dB/K)
1145.5973.12 TI.8 E-14
Page 18
R&S FSH3, R&S FSH6, R&S FSH18 Data Sheet
Directional Power Sensor R&S FSH-Z14
Max. peak envelope power
Power measurement range
Video bandwidth 4 kHz
200 kHz
600 kHz
Measurement uncertainty 18°C to 28°C same as for average power plus effect of peak hold
Error limits of peak hold
circuit for burst signals
Duty cycle 0.1 and
repetition rate 100 / s
20/s repetition rate <100/s
0.001 duty cycle < 0.1
Temperature coefficient
25 MHz to 40 MHz
40 MHz to 1 GHz
Load matching
Matching measurement range
Return loss
VSWR
Minimum forward power specs met from 0.4 W 0.06 W
video bandwidth 4 kHz
200 kHz
600 kHz
± (3 % of measured value + 0.05 W) starting from a
± (3 % of measured value + 0.20 W) starting from a
± (7 % of measured value + 0.40 W) starting from a
plus ± (1.6 % of measured value + 0.15 W)
0.4 W to 300 W
1 W to 300 W
2 W to 300 W
circuit
burst width of 200 Is
burst width of 4 Is
burst width of 2 Is
plus ± 0.10 W
0.50 %/K (0.022 dB/K)
0.35 %/K (0.015 dB/K)
0 dB to 23 dB
> 1.15
1145.5973.12 TI.9 E-14
Page 19

Data Sheet R&S FSH3, R&S FSH6, R&S FSH18
Directional Power Sensor R&S FSH-Z14
Error limits for matching
measurements
Power-handling capacity
Dimensions 120 mm x 95 mm x 39 mm, connecting cable 1.5 m
Weight 0.65 kg
1145.5973.12 TI.10 E-14
Page 20
R&S FSH3, R&S FSH6, R&S FSH18 Data Sheet
Directional Power Sensor R&S FSH-Z44
Frequency range 200 MHz to 4 GHz
Power measurement range
VSWR referenced to 50
200 MHz to 3 GHz
3 GHz to 4 GHz
Power-handling capacity depending on temperature
and matching
(see diagram below)
Insertion loss
200 MHz to 1.5 GHz
1.5 GHz to 4 GHz
Directivity
200 MHz to 3 GHz
3 GHz to 4 GHz
Average power
Power measurement range
CW, FM, PM, FSK, GMSK
3GPP W-CDMA,
cdmaOne, cdma2000,
DAB, DVB-T
Other modulated signals
Measurement uncertainty
200 MHz to 300 MHz
300 MHz to 4 GHz
CF: ratio of peak envelope
power to average power
sine signal,
18 °C to 28 °C, no zero
offset
4.0 % of measured value (0.17 dB)
3.2 % of measured value (0.14 dB)
30 mW to 300 W
< 1.07
< 1.12
120 W to 1000 W
< 0.06 dB
< 0.09 dB
> 30 dB
> 26 dB
30 mW to 300 W
30 mW to 120 W
30 mW to 300 W / CF
1145.5973.12 TI.11 E-14
Page 21

Data Sheet R&S FSH3, R&S FSH6, R&S FSH18
Directional Power Sensor R&S FSH-Z44
Zero offset after zeroing
Range of typical measurement error with modulation
FM, PM, FSK, GMSK
AM (80 %)
2 CW carriers with identical
power
/4-DQPSK
EDGE
cdmaOne, DAB
3GPP W-CDMA, cdma2000
DVB-T
Temperature coefficient
200 MHz to 300 MHz
300 MHz to 4 GHz
Max. peak envelope power
Power measurement range
DAB, DVB-T, cdmaOne,
cdma2000, 3GPP W-CDMA
Other signals at
video bandwidth 4 kHz
200 kHz
4 MHz
*) if standard is selected
on the R&S FSH
0 % of measured value (0 dB)
± 3 % of measured value (± 0.13 dB)
± 2 % of measured value (± 0.09 dB)
± 2 % of measured value (± 0.09 dB)
± 0.5 % of measured value (± 0.02 dB) *)
± 1 % of measured value (± 0.04 dB) *)
± 2 % of measured value (± 0.09 dB) *)
± 2 % of measured value (± 0.09 dB) *)
± 4 mW
0.40 %/K (0.017 dB/K)
0.25 %/K (0.011 dB/K)
4 W to 300 W
0.4 W to 300 W
1 W to 300 W
2 W to 300 W
1145.5973.12 TI.12 E-14
Page 22

R&S FSH3, R&S FSH6, R&S FSH18 Data Sheet
Directional Power Sensor R&S FSH-Z44
Measurement uncertainty 18°C to 28°C same as for average power plus effect of peak hold
circuit
Error limits of peak hold
circuit for burst signals
Duty cycle 0.1 und
repetition rate 100 / s
20/s repetition rate <100/s
0.001 duty cycle < 0.1
Burst width 0.5Is
Burst width 0.2Is
Range of typical measurement error of peak hold
circuit for
cdmaOne, DAB
DVB-T, cdma2000,
3GPP W-CDMA
Temperature coefficient
200 MHz to 300 MHz
300 MHz to 4 GHz
Load matching
Matching measurement range
Return loss
200 MHz to 3 GHz
3 GHz to 4 GHz
VSWR
200 MHz to 3 GHz
3 GHz to 4 GHz
Minimum forward power specs met from 0.2 W 0.03 W
video bandwidth 4 kHz
200 kHz
4 MHz
video bandwidth 4 MHz
and standard selected on
the R&S FSH
± (3 % of measured value + 0.05 W) starting from a
burst width of 100 Is
± (3 % of measured value + 0.20 W) starting from a
burst width of 4 Is
± (7 % of measured value + 0.40 W) starting from a
burst width of 1 Is
plus ± (1.6 % of measured value + 0.15 W)
plus ± 0.10 W
plus ± 5 % of measured value
plus ± 10 % of measured value
± (5% of measured value + 0.4 W)
± (15% of measured value + 0.4 W)
0.50 %/K (0.022 dB/K)
0.35 %/K (0.015 dB/K)
0 dB to 23 dB
0 dB to 20 dB
> 1.15
> 1.22
1145.5973.12 TI.13 E-14
Page 23

Data Sheet R&S FSH3, R&S FSH6, R&S FSH18
Directional Power Sensor R&S FSH-Z44
Error limits for matching
measurements
Power-handling capacity
6
dB
4
2
0
Measurement error
-2
-4
0 5 10
1000
800
600
AVG -10 °C to 35 °C
SWR < 3
400
Forwar d power
AVG 35 °C to 50 °C
200
SWR < 3
0.2 GHz to 3 GHz
3 GHz to 4 GHz
20
15
dB
Return loss
PEAK (max 10 ms), SWR < 3
AVG -10 °C to 35 °C
SWR < 1.5
25
100
0,2
0,4
1
0,7
2 3
Frequency
4 GHz
Dimensions 120 mm x 95 mm x 39 mm, connecting cable 1.5 m
Weight 0.65 kg
1145.5973.12 TI.14 E-14
Page 24
R&S FSH3, R&S FSH6, R&S FSH18 Data Sheet
VSWR Bridge R&S FSH-Z2 / R&S FSH-Z3
R&S FSH-Z2 R&S FSH-Z3
Frequency range 10 MHz to 3 GHz 10 MHz to 3 GHz
Impedance
VSWR bridge
Directivity
10 MHz to 30 MHz
30 MHz to 1 GHz
1 GHz to 3 GHz
3 GHz to 6 GHz
Directivity, corrected
2 MHz to 10 MHz
10 MHz to 3 GHz
3 GHz to 6 GHz
Return loss at test port
10 MHz to 50 MHz
50 MHz to 3 GHz
3 GHz to 6 GHz
Return loss at test port,
corrected
2 MHz to 3 GHz
3 GHz to 6 GHz
Insertion loss
Test port
Bypass
typ. 30 dB
typ. 30 dB
typ. 25 dB
-
option R&S FSH-K2
typ. 40 dB
typ. 43 dB
-
20 dB, typ.
20 dB, typ.
-
option R&S FSH-K2
typ. 35 dB
-
typ. 9 dB
-
50
typ. 16 dB
> 20 dB, typ. 28 dB
> 20 dB, typ. 28 dB
> 16 dB, typ. 25 dB
typ. 40 dB
typ. 40 dB
typ. 37 dB
> 12 dB, typ. 18 dB
> 16 dB, typ. 22 dB
> 16 dB, typ. 22 dB
typ. 40 dB
typ. 37 dB
typ. 9 dB
typ. 4 dB
1145.5973.12 TI.15 E-14
Page 25
Data Sheet R&S FSH3, R&S FSH6, R&S FSH18
VSWR Bridge R&S FSH-Z2 / R&S FSH-Z3
R&S FSH-Z2 R&S FSH-Z3
DC bias
Max. input voltage - 50 V
Max. input current - 300 mA /600 mA *
Type of connector - BNC female
Connectors
Generator input/RF output N male
Test port N female
Control interface 7-contact connector (type Binder)
General data
Power consumption - 3 mW (nominal)
Dimensions (W x H x D) 169 mm x 116 mm x
Weight 485 g 620 g
Calibration standards
R&S FSH-Z30/-Z31
Short/open N male
50 load
Impedance
Return loss
DC to 3 GHz
3 GHz to 6 GHz
Power-handling capacity 1 W 1 W
-
30 mm
R&S FSH-Z29
> 43 dB
-
)
149 mm x 144 mm x
45 mm
R&S FSH-Z28
N male
50
> 40 dB, typ. 46 dB
> 37 dB, typ. 43 dB
*)
as of serial number 100500
1145.5973.12 TI.16 E-14
Page 26

R&S FSH3, R&S FSH6, R&S FSH18 Data Sheet
Distance-to-Fault Measurement R&S FSH-B1
(only with R&S FSH3 models 1145.5850.13, 1145.5850.23 and R&S FSH6 model 1145.5850.26)
Display 301 pixels
Maximum resolution, distance
to fault
Display range
Return loss
VSWR
Reflection coefficient
mRho
Cable length depending on cable loss 0 m to max. 1000 m
Maximum permissible spurious
signal
Specification Condition R&S FSH3 R&S FSH6
Transmission measurements (only with R&S FSH3 models 1145.5850.13, 1145.5850.23 and R&S FSH6
model 1145.5850.26)
Frequency range 5 MHz bis 3 GHz 5 MHz bis 6 GHz
Dynamic range
10 MHz to 2.2 GHz
2.2 to 3 GHz
3 to 5 GHz
5 to 6 GHz
maximum zoom cable length/1023 pixels
10, 5, 2, 1 dB/div, linear
1 to 2 ,1 to 6, 1 to 10 und 1 to 20 with option
R&S FSH-K2 in addition
1 to 1.2 and 1 to 1.5
0 to 1, 0 to 0.1, 0 to 0.01, 0 to 0.001
0 to 100, 0 to 100, 0 to 10, 0 to 1
1st mixer 1 dB compression point typ. +10 dBm
IF overload at reference level typ. +8 dB
scalar mode
vector mode, option
R&S FSH-K2
scalar mode
vector mode, option
R&S FSH-K2
scalar mode
vector mode, option
R&S FSH-K2
scalar mode
vector mode, option
R&S FSH-K2
typ. 60 dB
typ. 80 dB
typ. 50 dB
typ. 65 dB
-
-
-
-
typ. 80 dB
typ. 90 dB
typ. 70 dB
typ. 85 dB
typ. 40 dB
typ. 55 dB
typ. 35 dB
typ. 50 dB
1145.5973.12 TI.17 E-14
Page 27
Data Sheet R&S FSH3, R&S FSH6, R&S FSH18
Specification Condition R&S FSH3 R&S FSH6
Reflection measurements
(only with R&S FSH3 model 1145.5850.13 or 1145.5850.23, R&S FSH6 model 1145.5850.26 and
R&S FSH-Z2/-Z3)
Frequency range 10 MHz to 3 GHz 10 MHz to 3 GHz
Display range of return loss 10, 20, 50, 100 dB, selectable
VSWR display range 1 to 2 , 1 to 6, 1 to 10 und 1 to 20, selectable,
with option R&S FSH-K2 also 1 to 1.2 and 1 to 1.5
Display range
Reflection coefficient
mRho
Smith chart only with option
R&S FSH-K2
Marker formats:
Reflection dB mag and phase
Impedance R+jX
Admittance G+jB
Reference impedance Z
0
Zoom function expansion factor 2, 4, 8
Measurement uncertainty see diagrams
0 to 1, 0 to 0.1, 0 to 0.01, 0 to 0.001
0 to 100, 0 to 100, 0 to 10, 0 to 1
lin mag and phase
real and imag
(R+jX)/Z
(G+jB)/Z
0
0
10 m to 10 k
1145.5973.12 TI.18 E-14
Page 28

R&S FSH3, R&S FSH6, R&S FSH18 Data Sheet
3
2
Measurement
Uncertainty / dB
1
0
-1
-2
-3
0 2 4 6 8 10 12 14 16 18
Measurement uncertainty with scalar
measurements
Return Loss DUT / dB
20
3
2
Measurement
Uncertainty / dB
1
0
-1
-2
-3
0 5 10
15
20
Measurement uncertainty with vector
measurements (option R&S FSH-K2)
25 30
Return Loss DUT / dB
Specification Condition R&S FSH3 R&S FSH6
Phase measurements (transmission, reflection)
(only with R&S FSH3 models 1145.5850.13 or 1145.5850.23, R&S FSH6 1145.5850.26 and R&S FSH-K2)
Frequency range
Reflection
Transmission
Display range
with R&S FSH-Z2/-Z3 10 MHz to 3 GHz
5 MHz to 3 GHz
± 180° (wrap)
0° to 54360° (unwrap)
10 MHz to 6 GHz
5 MHz to 6 GHz
Group delay measurements
(only with R&S FSH3 models 1145.5850.13 or 1145.5850.23, R&S FSH6 1145.5850.26 and R&S FSH-K2)
Frequency range
Reflection
Transmission
with R&S FSH-Z2/-Z3 10 MHz to 3 GHz
5 MHz to 3 GHz
10 MHz to 6 GHz
5 MHz to 6 GHz
Aperture increments 1 to 300
Display range
10 ns, 20 ns, 50 ns, 100 ns, 200 ns, 500 ns,
1000 ns,
selectable
1145.5973.12 TI.19 E-14
Page 29

Data Sheet R&S FSH3, R&S FSH6, R&S FSH18
Specification Condition R&S FSH3
(only for model 1145.5850.23 as of serial
number 103500)
3GPP FDD code domain power BTS/Node B measurement
(only with R&S FSH-K4 1300.7633.02)
Frequency range
Carrier frequency error
Measurement range
Measurement uncertainty
Total power
Measurement range
Measurement uncertainty
CPICH power
Measurement range
Measurement uncertainty
P-CCPCH power
Measurement range
Measurement uncertainty
PSCH/SSCH power
Measurement range
Measurement uncertainty
Symbol EVM
Measurement range
Measurement uncertainty
Residual EVM
symbol
S/N > 30 dB
S/N > 30 dB
frequency > 1 MHz
20 °C to 30 °C
-40 dBm < P
P
REF_LEV
P
REF_LEV
total
-30dB < P
+3dB
< 20 dBm
S/N > 30 dB
-40 dBm < P
- P
-20 dBm < P
total
< 20 dBm P
total
S/N > 30 dB
-40 dBm < P
P
-20 dBm < P
total
< 20 dBm P
total
S/N > 30 dB
-40 dBm < P
P
-20 dBm < P
total
3% < EVM
10% < EVM
< 20 dBm P
total
symbol
symbol
total
CPICH
PCCPCH
PSCH
< 10%
< 20%
<
< P
< P
< P
total
10 MHz to 3 GHz
(test case 6.3 in accordance with 3GPP 25.141)
±1 kHz
< 50 Hz + Sf
1)
ref
(T = 20 Hz)
(test case 6.2.1 in accordance with 3GPP 25.141)
-60 dBm < P
< 20 dBm
total
± 1.5 dB, typ. 0.5 dB
(test case 6.2.2 in accordance with 3GPP 25.141)
total
total
-20 dB < P
total
± 1.5 dB, typ. 0.5 dB
-40 dB < P
total
± 1.5 dB, typ. 0.5 dB
-30 dB < P
total
CPICH
PCCPCH
SCH
< P
< P
< P
± 2.5 dB, typ. 1.5 dB
3% < EVM
symbol
< 25%
± 2.5% typ.
± 3.0% typ.
3% typ.
total
total
total
1145.5973.12 TI.20 E-14
Page 30

R&S FSH3, R&S FSH6, R&S FSH18 Data Sheet
Specification Condition R&S FSH3
3GPP FDD scrambling code detection
Frequency range
± 1 kHz
10 MHz to 3 GHz
Single scrambling code
detection
Calculation time
CPICH EC/ I
0
24 s
> -18 dB
Multiple scrambling code
detection
Max. number of
scrambling codes
Calculation time 57 s
CPICH EC/ I
CPICH power
0
-40 dBm < P
total
< 20 dBm
> -21 dB
± 4.2 dB
Measurement uncertainty
1)
2)
f
= uncertainty of reference frequency source.
ref
Probability of detection >50% with test model 1.16 in accordance with 3GPP TS 25.141 test specifications.
2)
8
2)
1145.5973.12 TI.21 E-14
Page 31

Data Sheet R&S FSH3, R&S FSH6, R&S FSH18
General data
Display
Resolution 320 x 240 pixels
Memory
Settings and traces
Environmental conditions
Temperature
Operating temperature range
R&S FSH powered from internal battery
R&S FSH powered from AC power supply
Storage temperature range -20°C to +60 °C
Battery charging mode 0 °C to 40 °C
Climatic conditions
Relative humidity 95 % at 40 °C (IEC60068)
IP class of protection
Mechanical resistance
Vibration, sinusoidal complies with EN 60068-2-1, EN61010-1
Vibration, random complies with EN60068-2-64
Shock complies with EN 60068-2-27
RFI suppression
Immunity to radiated interference
Level display at 10 V/m (reference level -10 dBm)
Input frequency
IF
Other frequencies
14 cm (5.7") LC color display
CMOS RAM
100
0°C to 50 °C
0°C to 40 °C
51
5 Hz to 55 Hz: max. 2 g, 55 Hz to 150 Hz: 0.5 g constant,
12 minutes per axis
10 Hz to 500 Hz, 1.9 g, 30 minutes per axis
40 g shock spectrum
complies with EMC directive of EU (89/336/EEC)
and German EMC legislation
10 V/m
< -75 dBm (nominal)
< -85 dBm (nominal)
< displayed noise level
1145.5973.12 TI.22 E-14
Page 32

R&S FSH3, R&S FSH6, R&S FSH18 Data Sheet
Power supply
AC supply plug-in AC power supply (R&S FSH-Z33)
100 V AC to 240 V AC, 50 Hz to 60 Hz, 400 mA
External DC voltage 15 V to 20 V
Internal battery NiMH battery (type Fluke BP190, R&S FSH-Z32)
Battery voltage 6 V to 9 V
Operating time with fully charged battery typ. 4 h with tracking generator off, typ. 3 h with
tracking generator on, typ. 3 h for R&S FSH18
Battery charging time 4 h with instrument off
Lifetime 300 to 500 charging cycles
Power consumption typ. 7 W
Safety
Test mark VDE, GS, CSA, CSA-NRTL
Dimensions (W x H x D)
Weight
Order No.
Handheld Spectrum Analyzer R&S FSH3
100 kHz to 3 GHz, with preamplifier
Handheld Spectrum Analyzer R&S FSH3
100 kHz to 3 GHz, with tracking generator
Handheld Spectrum Analyzer R&S FSH3
100 kHz to 3 GHz, with tracking generator and
preamplifier
Handheld Spectrum Analyzer R&S FSH6
100 kHz to 6 GHz, with preamplifier
Handheld Spectrum Analyzer R&S FSH6
100 kHz to 6 GHz, with tracking generator and
preamplifier
Handheld Spectrum Analyzer R&S FSH18
10 MHz to 18 GHz
complies with EN 61010-1, UL 3111-1,
CSA C22.2 No. 1010-1
170 mm x 120 mm x 270 mm
2.5 kg
1145.5850.03
1145.5850.13
1145.5850.23
1145.5850.06
1145.5850.26
1145.5850.18
1145.5973.12 TI.23 E-14
Page 33

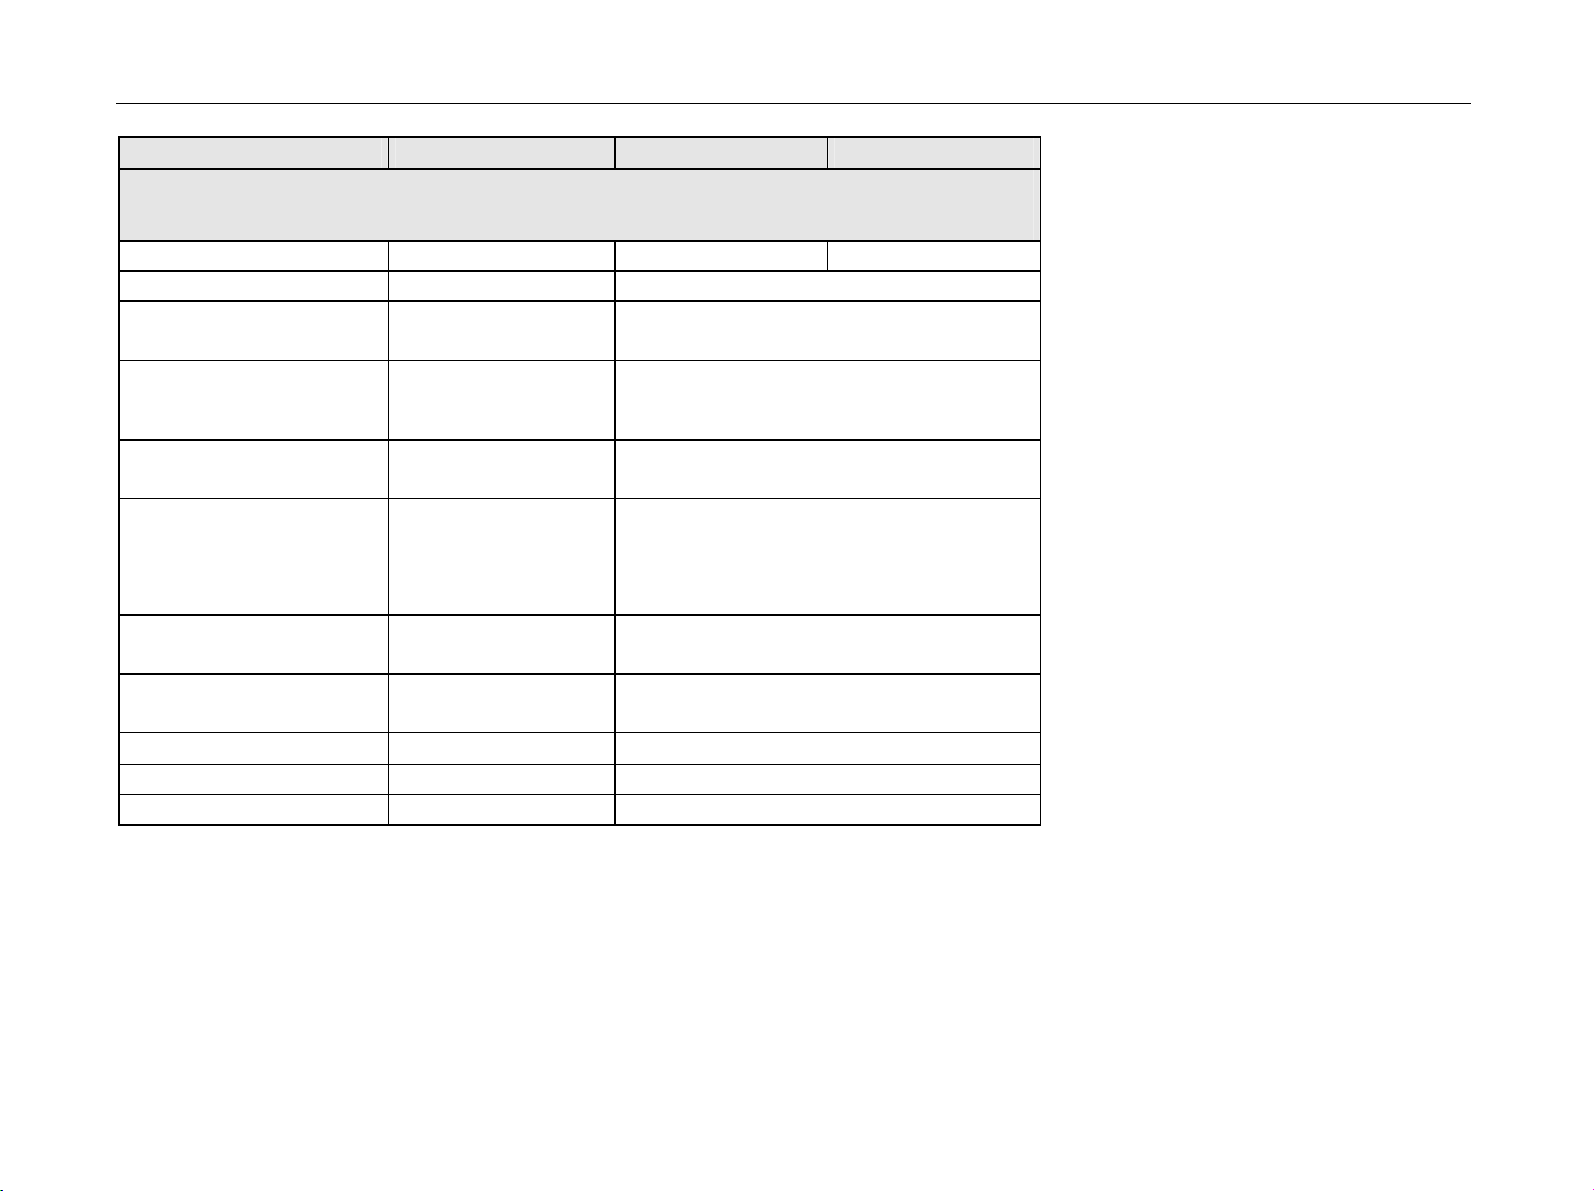
Data Sheet R&S FSH3, R&S FSH6, R&S FSH18
Power supply
Accessories supplied
Options
Distance-to-Fault Measurement for the R&S FSH
(includes 1 m cable, R&S FSH-Z2 required)
Remote Control via RS-232-C for the R&S FSH R&S FSH-K1 1157.3458.02
Vector Transmission and Reflection Measurements
for the R&S FSH
Receiver Mode for the R&S FSH R&S FSH-K3 1157.3429.02
3GPP FDD Code Domain Power BTS/Node B
Measurement for the R&S FSH3 model 23 as of
serial number 103500
Optional accessories
Power Sensor for the R&S FSH, 10 MHz to 8 GHz R&S FSH-Z1 1155.4505.02
VSWR Bridge and Power Divider for the R&S FSH,
10 MHz to 3 GHz (incl. calibration standards open,
short, 50 U load)
VSWR Bridge with DC Bias and Bypass Connector
for the R&S FSH, 10 MHz to 6 GHz (incl. calibration
standards open, short, 50 U load)
external power supply, battery pack (built-in),
RS-232-C optical cable, headphones, Quick Start manual,
CD-ROM with Control Software R&S FSH View and
documentation
Designation Order No.
R&S FSH-B1 1145.5750.02
R&S FSH-K2 1157.3387.02
R&S FSH-K4 1300.7633.02
Designation Order No.
R&S FSH-Z2 1145.5767.02
R&S FSH-Z3 1300.7756.02
1145.5973.12 TI.24 E-14
Page 34

R&S FSH3, R&S FSH6, R&S FSH18 Data Sheet
Power supply
Optional accessories
Designation Order No.
Directional Power Sensor for the R&S FSH,
25 MHz to 1 GHz
Power Sensor for the R&S FSH, 10 MHz to 18 GHz
Directional Power Sensor for the R&S FSH,
200 MHz to 4 GHz
Matching Pad, 50/75 U, 0 Hz to 2700 MHz RAZ 0358.5714.02
Spare RF Cable (1 m),
connectors N male/N female for R&S FSH-B1
12 V Car Adapter for the R&S FSH R&S FSH-Z21 1145.5873.02
Serial/Parallel Converter for the R&S FSH R&S FSH-Z22 1145.5880.02
Carrying Bag for the R&S FSH R&S FSH-Z25 1145.5896.02
Transit Case for the R&S FSH R&S FSH-Z26 1300.7627.00
Spare Combined Short/Open and 50 Load for
VSWR and DTF calibration, DC to 6 GHz
Combined Short/Open and 50 Load for VSWR
and DTF calibration, DC to 3 GHz
Spare Short/Open Calibration Standard for
R&S FSH-Z2 for VSWR calibration, DC to 3 GHz
Spare 50 Load Standard for R&S FSH-Z2 for
VSWR and DTF calibration, DC to 3 GHz
Spare Battery Pack for the R&S FSH R&S FSH-Z32 1145.5796.02
Spare AC Power Supply for the R&S FSH R&S FSH-Z33 1145.5809.02
R&S FSH-Z14 1120.6001.02
R&S FSH-Z18 1165.1909.02
R&S FSH-Z44 1165.2305.02
R&S FSH-Z20 1145.5867.02
R&S FSH-Z28 1300.7804.02
R&S FSH-Z29 1300.7504.02
R&S FSH-Z30 1145.5773.02
R&S FSH-Z31 1145.5780.02
1145.5973.12 TI.25 E-14
Page 35

Data Sheet R&S FSH3, R&S FSH6, R&S FSH18
Power supply
Optional accessories
Designation Order No.
Spare RS-232-C Optical Cable R&S FSH-Z34 1145.5815.02
Spare CD-ROM with Control Software R&S FSH
View and documentation
Spare Headphones R&S FSH-Z36 1145.5838.02
Spare USB Optical Cable R&S FSH-Z37 1300.7733.02
Active Directional Antenna R&S HE-200 4050.3509.02
Portable EMF Measurement System, 30 MHz to
3 GHz, for the Handheld Spectrum Analyzer
R&S FSH
Near-Field Probe Set R&S HZ-15 1147.2736.02
Preamplifier for the R&S HZ-15 R&S HZ-16 1147.2720.02
R&S FSH-Z35 1145.5821.02
R&S TS-EMF 1158.9295.13
1145.5973.12 TI.26 E-14
Page 36

Before putting the product into operation for
the first time, make sure to read the following
Safety Instructions
All plants and locations of the Rohde & Schwarz group of companies make every effort to keep the
safety standard of our products up to date and to offer our customers the highest possible degree of
safety. Our products and the auxiliary equipment required for them are designed and tested in
accordance with the relevant safety standards. Compliance with these standards is continuously
monitored by our quality assurance system. The product described here has been designed and tested
in accordance with the EC Certificate of Conformity and has left the manufacturer’s plant in a condition
fully complying with safety standards. To maintain this condition and to ensure safe operation, observe
all instructions and warnings provided in this manual. If you have any questions regarding these safety
instructions, the Rohde & Schwarz group of companies will be happy to answer them.
Furthermore, it is your responsibility to use the product in an appropriate manner. This product is
designed for use solely in industrial and laboratory environments or in the field and must not be used in
any way that may cause personal injury or property damage. You are responsible if the product is used
for an intention other than its designated purpose or in disregard of the manufacturer's instructions. The
manufacturer shall assume no responsibility for such use of the product.
The product is used for its designated purpose if it is used in accordance with its product documentation
and within its performance limits (see data sheet, documentation, the following safety instructions).
Using the product requires technical skills and a basic knowledge of English. It is therefore essential
that the product be used exclusively by skilled and specialized staff or thoroughly trained personnel with
the required skills. If personal safety gear is required for using Rohde & Schwarz products, this will be
indicated at the appropriate place in the product documentation.
Observe
product
documentation
Supply
voltage
ON/OFF
Weight
indication for
units >18 kg
Standby
indication
Symbols and safety labels
Danger of
electric
shock
Warning!
Hot
surface
PE terminal Ground
Direct
current
(DC)
Alternating
current (AC)
Direct/alternating
current (DC/AC)
Ground
terminal
Attention!
Electrostatic
sensitive
devices
Device fully
protected by
double/reinforced
insulation
1171.0000.42-03.00 Sheet 1
Page 37

Safety Instructions
Observing the safety instructions will help prevent personal injury or damage of any kind caused by
dangerous situations. Therefore, carefully read through and adhere to the following safety instructions
before putting the product into operation. It is also absolutely essential to observe the additional safety
instructions on personal safety that appear in relevant parts of the product documentation. In these
safety instructions, the word "product" refers to all merchandise sold and distributed by the Rohde &
Schwarz group of companies, including instruments, systems and all accessories.
Tags and their meaning
DANGER
WARNING
CAUTION This tag indicates a hazard carrying a low risk of minor or moderate
ATTENTION
NOTE
These tags are in accordance with the standard definition for civil applications in the European
Economic Area. Definitions that deviate from the standard definition may also exist in other economic
areas or military applications. It is therefore essential to make sure that the tags described here are
always used only in connection with the related product documentation and the related product. The
use of tags in connection with unrelated products or documentation can result in misinterpretation and
thus contribute to personal injury or material damage.
This tag indicates a definite hazard carrying a high risk of death or
serious injury if not avoided.
This tag indicates a possible hazard carrying a medium risk of death or
(serious) injury if not avoided
injury if not avoided.
This tag indicates the possibility of incorrect use that can cause damage
to the product.
This tag indicates a situation where the user should pay special attention
to operating the product but which does not lead to damage.
.
Basic safety instructions
1. The product may be operated only under
the operating conditions and in the
positions specified by the manufacturer. Its
ventilation must not be obstructed during
operation. Unless otherwise specified, the
following requirements apply to
Rohde & Schwarz products:
prescribed operating position is always with
the housing floor facing down, IP protection
2X, pollution severity 2, overvoltage
category 2, use only in enclosed spaces,
max. operation altitude 2000 m above sea
level, max. transport altitude 4500 m above
sea level.
Unless specified otherwise in the data
sheet, a tolerance of ±10% shall apply to
the nominal voltage and of ±5% to the
nominal frequency.
2. Applicable local or national safety
regulations and rules for the prevention of
accidents must be observed in all work
performed. The product may be opened
only by authorized, specially trained
personnel. Prior to performing any work on
the product or opening the product, the
product must be disconnected from the
supply network. Any adjustments,
replacements of parts, maintenance or
repair must be carried out only by technical
personnel authorized by Rohde & Schwarz.
Only original parts may be used for
replacing parts relevant to safety (e.g.
power switches, power transformers,
fuses). A safety test must always be
performed after parts relevant to safety
have been replaced (visual inspection, PE
conductor test, insulation resistance
measurement, leakage current
measurement, functional test).
3. As with all industrially manufactured goods,
the use of substances that induce an
allergic reaction (allergens, e.g. nickel)
such as aluminum cannot be generally
excluded. If you develop an allergic
reaction (such as a skin rash, frequent
sneezing, red eyes or respiratory
difficulties), consult a physician immediately
to determine the cause.
1171.0000.42-03.00 Sheet 2
Page 38

Safety Instructions
4. If products/components are mechanically
and/or thermically processed in a manner
that goes beyond their intended use,
hazardous substances (heavy-metal dust
such as lead, beryllium, nickel) may be
released. For this reason, the product may
only be disassembled, e.g. for disposal
purposes, by specially trained personnel.
Improper disassembly may be hazardous to
your health. National waste disposal
regulations must be observed.
5. If handling the product yields hazardous
substances or fuels that must be disposed
of in a special way, e.g. coolants or engine
oils that must be replenished regularly, the
safety instructions of the manufacturer of
the hazardous substances or fuels and the
applicable regional waste disposal
regulations must be observed. Also
observe the relevant safety instructions in
the product documentation.
6. Depending on the function, certain products
such as RF radio equipment can produce
an elevated level of electromagnetic
radiation. Considering that unborn life
requires increased protection, pregnant
women should be protected by appropriate
measures. Persons with pacemakers may
also be endangered by electromagnetic
radiation. The employer/operator is
required to assess workplaces where there
is a special risk of exposure to radiation
and, if necessary, take measures to avert
the danger.
7. Operating the products requires special
training and intense concentration. Make
certain that persons who use the products
are physically, mentally and emotionally fit
enough to handle operating the products;
otherwise injuries or material damage may
occur. It is the responsibility of the
employer to select suitable personnel for
operating the products.
8. Prior to switching on the product, it must be
ensured that the nominal voltage setting on
the product matches the nominal voltage of
the AC supply network. If a different voltage
is to be set, the power fuse of the product
may have to be changed accordingly.
9. In the case of products of safety class I with
movable power cord and connector,
operation is permitted only on sockets with
earthing contact and protective earth
connection.
10. Intentionally breaking the protective earth
connection either in the feed line or in the
product itself is not permitted. Doing so can
result in the danger of an electric shock
from the product. If extension cords or
connector strips are implemented, they
must be checked on a regular basis to
ensure that they are safe to use.
11. If the product has no power switch for
disconnection from the AC supply, the plug
of the connecting cable is regarded as the
disconnecting device. In such cases, it
must be ensured that the power plug is
easily reachable and accessible at all times
(corresponding to the length of connecting
cable, approx. 2 m). Functional or
electronic switches are not suitable for
providing disconnection from the AC
supply. If products without power switches
are integrated in racks or systems, a
disconnecting device must be provided at
the system level.
12. Never use the product if the power cable is
damaged. Check the power cable on a
regular basis to ensure that it is in proper
operating condition. By taking appropriate
safety measures and carefully laying the
power cable, ensure that the cable cannot
be damaged and that no one can be hurt by
e.g. tripping over the cable or suffering an
electric shock.
13. The product may be operated only from
TN/TT supply networks fused with max.
16 A (higher fuse only after consulting with
the Rohde & Schwarz group of companies).
14. Do not insert the plug into sockets that are
dusty or dirty. Insert the plug firmly and all
the way into the socket. Otherwise, this can
result in sparks, fire and/or injuries.
15. Do not overload any sockets, extension
cords or connector strips; doing so can
cause fire or electric shocks.
16. For measurements in circuits with voltages
V
> 30 V, suitable measures (e.g.
rms
appropriate measuring equipment, fusing,
current limiting, electrical separation,
insulation) should be taken to avoid any
hazards.
17. Ensure that the connections with
information technology equipment comply
with IEC 950/EN 60950.
18. Unless expressly permitted, never remove
the cover or any part of the housing while
the product is in operation. Doing so will
expose circuits and components and can
lead to injuries, fire or damage to the
product.
1171.0000.42-03.00 Sheet 3
Page 39

Safety Instructions
19. If a product is to be permanently installed,
the connection between the PE terminal on
site and the product's PE conductor must
be made first before any other connection
is made. The product may be installed and
connected only by a license electrician.
20. For permanently installed equipment
without built-in fuses, circuit breakers or
similar protective devices, the supply circuit
must be fused in such a way that suitable
protection is provided for users and
products.
21. Do not insert any objects into the openings
in the housing that are not designed for this
purpose. Never pour any liquids onto or into
the housing. This can cause short circuits
inside the product and/or electric shocks,
fire or injuries.
22. Use suitable overvoltage protection to
ensure that no overvoltage (such as that
caused by a thunderstorm) can reach the
product. Otherwise the operating personnel
will be endangered by electric shocks.
23. Rohde & Schwarz products are not
protected against penetration of water,
unless otherwise specified (see also safety
instruction 1.). If this is not taken into
account, there exists the danger of electric
shock for the user or damage to the
product, which can also lead to personal
injury.
24. Never use the product under conditions in
which condensation has formed or can form
in or on the product, e.g. if the product was
moved from a cold to a warm environment.
25. Do not close any slots or openings on the
product, since they are necessary for
ventilation and prevent the product from
overheating. Do not place the product on
soft surfaces such as sofas or rugs or
inside a closed housing, unless this is well
ventilated.
26. Do not place the product on heatgenerating devices such as radiators or fan
heaters. The temperature of the
environment must not exceed the maximum
temperature specified in the data sheet.
27. Batteries and storage batteries must not be
exposed to high temperatures or fire. Keep
batteries and storage batteries away from
children. Do not short-circuit batteries and
storage batteries.
If batteries or storage batteries are
improperly replaced, this can cause an
explosion (warning: lithium cells). Replace
the battery or storage battery only with the
matching Rohde & Schwarz type (see
spare parts list). Batteries and storage
batteries must be recycled and kept
separate from residual waste. Batteries and
storage batteries that contain lead, mercury
or cadmium are hazardous waste. Observe
the national regulations regarding waste
disposal and recycling.
28. Please be aware that in the event of a fire,
toxic substances (gases, liquids etc.) that
may be hazardous to your health may
escape from the product.
29. The product can be very heavy. Be careful
when moving it to avoid back or other
physical injuries.
30. Do not place the product on surfaces,
vehicles, cabinets or tables that for reasons
of weight or stability are unsuitable for this
purpose. Always follow the manufacturer's
installation instructions when installing the
product and fastening it to objects or
structures (e.g. walls and shelves).
31. Handles on the products are designed
exclusively for personnel to hold or carry
the product. It is therefore not permissible
to use handles for fastening the product to
or on means of transport such as cranes,
fork lifts, wagons, etc. The user is
responsible for securely fastening the
products to or on the means of transport
and for observing the safety regulations of
the manufacturer of the means of transport.
Noncompliance can result in personal injury
or material damage.
32. If you use the product in a vehicle, it is the
sole responsibility of the driver to drive the
vehicle safely. Adequately secure the
product in the vehicle to prevent injuries or
other damage in the event of an accident.
Never use the product in a moving vehicle if
doing so could distract the driver of the
vehicle. The driver is always responsible for
the safety of the vehicle. The manufacturer
assumes no responsibility for accidents or
collisions.
33. If a laser product (e.g. a CD/DVD drive) is
integrated in a Rohde & Schwarz product,
do not use any other settings or functions
than those described in the product
documentation. Otherwise this may be
hazardous to your health, since the laser
beam can cause irreversible damage to
your eyes. Never try to take such products
apart, and never look into the laser beam.
1171.0000.42-03.00 Sheet 4
Page 40

DIN EN ISO 9001 : 2000
DIN EN 9100 : 2003
DIN EN ISO 14001 : 1996
DQS REG. NO 001954 QM/ST UM
Certified Quality System
Sehr geehrter Kunde,
Sie haben sich für den Kauf eines
Rohde & Schwarz-Produktes entschieden. Hiermit erhalten Sie ein nach
modernsten Fertigungsmethoden
hergestelltes Produkt. Es wurde nach
den Regeln unseres Managementsystems entwickelt, gefertigt und
geprüft.
Das Rohde & Schwarz Managementsystem ist zertifiziert nach:
DIN EN ISO 9001:2000
DIN EN 9100:2003
DIN EN ISO 14001:1996
Dear Customer,
you have decided to buy a Rohde &
Schwarz product. You are thus assured of receiving a product that is
manufactured using the most modern
methods available. This product was
developed, manufactured and tested
in compliance with our quality management system standards.
The Rohde & Schwarz quality management system is certified according to:
DIN EN ISO 9001:2000
DIN EN 9100:2003
DIN EN ISO 14001:1996
Cher Client,
vous avez choisi d‘acheter un produit
Rohde & Schwarz. Vous disposez
donc d‘un produit fabriqué d‘après
les méthodes les plus avancées. Le
développement, la fabrication et les
tests respectent nos normes de gestion qualité.
Le système de gestion qualité de
Rohde & Schwarz a été homologué
conformément aux normes:
DIN EN ISO 9001:2000
DIN EN 9100:2003
DIN EN ISO 14001:1996
QUALITÄTSZERTIFIKAT CERTIFICATE OF QUALITY CERTIFICAT DE QUALITÉ
1171.0200.11-01.00
Page 41

EC Certificate of Conformity
Certificate No.: 2002-41
This is to certify that:
complies with the provisions of the Directive of the Council of the European Union on the
approximation of the laws of the Member States
- relating to electrical equipment for use within defined voltage limits
- relating to electromagnetic compatibility
Conformity is proven by compliance with the following standards:
EN61010-1 : 2001
EN55011 : 1998 + A1 : 1999, Klasse B
EN61326 : 1997 + A1 : 1998 + A2 : 2001 + A3 : 2003
For the assessment of electromagnetic compatibility, the limits of radio interference for Class B
equipment as well as the immunity to interference for operation in industry have been used as a basis.
Affixing the EC conformity mark as from 2002
Munich, 2006-11-14 Central Quality Management MF-QZ / Radde
Equipment type
Stock No. Designation
FSH3 1145.5850.03/.13/.23 Handheld Spectrum Analyzer
FSH6 1145.5850.06/.26
FSH18 1145.5850.18
FSH-Z1 1155.4505.02 Average Power Sensor
FSH-Z2 1145.5767.02 VSWR Bridge and Power Driver
FSH-Z3 1300.7756.02 VSWR Bridge
FSH-Z14 1120.6001.02 Directional Power Sensor
FSH-Z18 1165.1909.02 Average Power Sensor
FSH-Z21 1300.7579.02 12V Car Adapter
FSH-Z32 1145.5796.02 Spare Batterie Pack
FSH-Z33 1145.5809.02 Spare Power Supply
FSH-Z34 1145.5815.02 Optical RS232 Interface Cable
FSH-Z37 1300.7733.02 Optical USB Interface Cable
FSH-Z44 1165.2305.02 Directional Power Sensor
(73/23/EEC revised by 93/68/EEC)
(89/336/EEC revised by 91/263/EEC, 92/31/EEC, 93/68/EEC)
ROHDE & SCHWARZ GmbH & Co. KG
Mühldorfstr. 15, D-81671 München
1145.5850.01 CE E-9
Page 42

Customer Support
Technical support – where and when you need it
For quick, expert help with any Rohde & Schwarz equipment, contact one of our Customer
Support Centers. A team of highly qualified engineers provides telephone support and will
work with you to find a solution to your query on any aspect of the operation, programming
or applications of Rohde & Schwarz equipment.
Up-to-date information and upgrades
To keep your Rohde & Schwarz equipment always up-to-date,
please subscribe to our electronic newsletter at
http://www.rohde-schwarz.com/www/response.nsf/newsletterpreselection
or request the desired information and upgrades via email from your Customer Support
Center (addresses see below).
Feedback
We want to know if we are meeting your support needs. If you have any comments please
email us and let us know CustomerSupport.Feedback@rohde-schwarz.com.
USA & Canada
East Asia
Rest of the World
Monday to Friday (except US public holidays)
8:00 AM – 8:00 PM Eastern Standard Time (EST)
Tel. from USA 888-test-rsa (888-837-8772) (opt 2)
From outside USA +1 410 910 7800 (opt 2)
Fax +1 410 910 7801
E-mail Customer.Support@rsa.rohde-schwarz.com
Monday to Friday (except Singaporean public holidays)
8:30 AM – 6:00 PM Singapore Time (SGT)
Tel. +65 6 513 0488
Fax +65 6 846 1090
E-mail Customersupport.asia@rohde-schwarz.com
Monday to Friday (except German public holidays)
08:00 – 17:00
Tel. from Europe +49 (0) 180 512 42 42
From outside Europe +49 89 4129 13776
Fax +49 (0) 89 41 29 637 78
Central European Time (CET)
1171.0200.29-01.00
E-mail CustomerSupport@rohde-schwarz.com
Page 43

12
Address List
Headquarters, Plants and Subsidiaries
Headquarters
ROHDE& SCHWARZ GmbH & Co. KG
Mühldorfstraße 15 · D-81671 München
P.O.Box 80 14 69 · D-81614 München
Plants
ROHDE& SCHWARZ Messgerätebau GmbH
Riedbachstraße 58 · D-87700 Memmingen
P.O.Box 16 52 · D-87686 Memmingen
ROHDE& SCHWARZ GmbH & Co. KG
Werk Teisnach
Kaikenrieder Straße 27 · D-94244 Teisnach
P.O.Box 11 49 · D-94240 Teisnach
ROHDE& SCHWARZ závod
Vimperk, s.r.o.
Location Spidrova 49
CZ-38501 Vimperk
ROHDE& SCHWARZ GmbH & Co. KG
Dienstleistungszentrum Köln
Graf-Zeppelin-Straße 18 · D-51147 Köln
P.O.Box 98 02 60 · D-51130 Köln
Subsidiaries
R&S BICK Mobilfunk GmbH
Fritz-Hahne-Str. 7 · D-31848 Bad Münder
P.O.Box 20 02 · D-31844 Bad Münder
ROHDE& SCHWARZ FTK GmbH
Wendenschloßstraße 168, Haus 28
D-12557 Berlin
ROHDE& SCHWARZ SIT GmbH
Am Studio 3
D-12489 Berlin
R&S Systems GmbH
Graf-Zeppelin-Straße 18
D-51147 Köln
GEDIS GmbH
Sophienblatt 100
D-24114 Kiel
HAMEG Instruments GmbH
Industriestraße 6
D-63533 Mainhausen
Fax +49 (89) 41 29-121 64
info.rs@rohde-schwarz.com
Phone +49 (83 31) 1 08-0
info.rsmb@rohde-schwarz.com
Phone +49 (99 23) 8 50-0
info.rsdts@rohde-schwarz.com
Phone +420 (388) 45 21 09
Fax +49 (22 03) 49 51-229
info.rsdc@rohde-schwarz.com
service.rsdc@rohde-schwarz.com
Phone +49 (50 42) 9 98-0
info.bick@rohde-schwarz.com
Phone +49 (30) 658 91-122
info.ftk@rohde-schwarz.com
info.sit@rohde-schwarz.com
Phone +49 (22 03) 49-5 23 25
Fax +49 (22 03) 49-5 23 36
info.rssys@rohde-schwarz.com
Phone +49 (431) 600 51-0
Phone +49 (89) 41 29-0
+49 (83 31) 1 08-1124
Fax +49 (99 23) 8 50-174
Fax +420 (388) 45 21 13
Phone +49 (22 03) 49-0
Fax +49 (50 42) 9 98-105
Fax +49 (30) 655 50-221
Phone +49 (30) 658 84-0
Fax +49 (30) 658 84-183
Fax +49 (431) 600 51-11
sales@gedis-online.de
Phone +49 (61 82) 800-0
Fax +49 (61 82) 800-100
info@hameg.de
Locations Worldwide
Please refer to our homepage: www.rohde-schwarz.com
◆ Sales Locations
◆ Service Locations
◆ National Websites
12
1171.0200.42-02.00
Page 44

R&S FSH Front view
1 Putting into Operation
Front view
RF input
N connector
Connector for
headphones
Softkey
labels
Softkeys
Function keys
Alphanumeric
keypad
External trigger /external
reference input BNC connector
Connector for
power sensor
Generator output
N connector
Connector for
AC power supply
Display
RS-232-C
optical interface
Setup key
Status key
Rotary knob
On/off button
Entry keys
Unit keys
1145.5973.12 1.1 E-14
Preset key
Cursor keys
Page 45

Putting into Operation R&S FSH
Putting into Operation
The following section describes how to put the handheld spectrum analyzer into operation and how to
connect external devices, e.g. printers.
Section 2 describes the operation of the spectrum analyzer using simple measurements as examples.
Unpacking the Instrument
The R&S FSH comes in formfitting packaging that consists of upper and lower shells. The two shells
are held together by tape.
The packaging contains all accessories supplied.
Undo the tape to unpack the analyzer.
Upper shell
RS-232-C
cable
Power
supply
AC supply plug
(country-specific)
Headphones
CD-ROM
R&S
FSH
Quick Start
manual
Lower shell
Remove the R&S FSH and the accessories.
Remove the protective foil from the screen.
Note: Each R&S FSH comes with a unique master PIN. Keep the master PIN in a secure place
away from the R&S FSH. If someone enters an incorrect PIN three times in succession,
the R&S FSH cannot be used again until the master PIN is entered.
1145.5973.12 1.2 E-14
Page 46

R&S FSH Putting into Operation
Setting up the Instrument
The Handheld Spectrum Analyzer R&S FSH has been designed for operation in labs as well as for onsite use for service and maintenance applications.
For any application, the R&S FSH can be set up to optimize ease of operation and the viewing angle of
the display.
When used as a desktop instrument, the R&S FSH can
either be laid flat or it can be propped up using the
fold-out support at the back.
The R&S FSH can be laid flat for operation from
above. Because the grip is slightly raised at the back,
the R&S FSH is tilted forward to give the optimum
viewing angle for the display.
For use as a desktop, fold out the support at the rear
so that the instrument can easily be operated from the
front and the display can be read easily (see Fig.).
For on-site installation and service measurements, it is
best to hold the instrument with both hands. All the
controls are easy to reach (e.g. with your thumbs). Use
the R&S FSH-Z25 carrying bag so that you have both
hands free to adjust the DUT. The R&S FSH can be
placed in the hanger provided on the open bag for this
purpose.
To secure the instrument in place, affix its carrying handle to the front of the carrying bag with the
Velcro tape.
The carrying handle at the top of the R&S FSH can also be used to hang it from cabinet doors, for
example. The shape of the grip ensures that the instrument does not fall off.
1145.5973.12 1.3 E-14
Page 47

Putting into Operation R&S FSH
ground (for example, via the RF connector). This does not apply to the new
Switching on the Spectrum Analyzer
The R&S FSH can be powered using either the included power supply unit or internal battery. When
fully charged, the built-in nickel metal hydride battery provides an operating time of about four hours. On
delivery, the battery in the R&S FSH may be flat. Therefore, it must be charged before the R&S FSH
can be used. If the instrument is switched off, the charging time is four hours.
When the adapter is used, the R&S FSH’s battery is charged simultaneously.
Insert the jack plug of the power supply unit into the POWER ADAPTER connector on the right-hand
side of the carrying handle so that it locks into position. Then connect the power supply unit to an AC
outlet. The voltage range of the power supply unit is 100 V to 240 V.
Caution!
In vehicles, the battery can be charged from the cigarette lighter socket using the R&S FSH-Z21 cable.
Caution!
Only the supplied power supply unit – the R&S FSH-Z33 – may be used to power the
R&S FSH or charge the battery from the AC supply.
Prior to use, make sure that the AC supply voltage is compatible with the voltage
specified on the power supply unit. Before inserting the power supply unit into the AC
power outlet, attach the appropriate adapter.
It is strictly forbidden to operate the R&S FSH via the cigarette lighter socket while the
vehicle is in motion or the engine is running. In these cases, the R&S FSH must be off.
While the battery of the R&S FSH is being charged via the R&S FSH-Z21 adapter with
the stock number 1145.5873.02, the adapter must not be connected to the vehicle’s
R&S FSH-Z21 adapter with the stock number 1300.7579.02.
To switch on the R&S FSH, press the yellow button
To indicate that it is connected to the AC supply, the
R&S FSH displays a connector symbol in the middle of
the display above the softkey labels.
When the R&S FSH is switched on, it recalls the settings that it was using when it was last switched off.
Note: If the internal battery is completely flat, the R&S FSH cannot be switched on even though it
is connected to the AC supply via the power supply unit. In this case, the internal battery
must be charged for a while with the instrument switched off. Only then can the instrument
be switched on.
at the bottom left of the front panel.
1145.5973.12 1.4 E-14
Page 48

R&S FSH Putting into Operation
Spectrum Analyzer Connectors
The R&S FSH has the following connectors:
RF input
Connect the RF input via a cable with an N connector to the DUT. Make sure that it is not overloaded.
The maximum permissible continuous power at the RF input is 20 dBm (100 mW). It can be loaded with
up to 30 dBm (1 W) for a maximum of three minutes. If the instrument is loaded with 1 W for longer, it
heats up to such an extent that it may be destroyed.
Caution!
Input for external trigger or external reference (EXT TRIG/EXT REF)
Via the EXT TRIG/EXT REF BNC connector, either an external trigger signal is applied to start a
measurement, or a 10 MHz reference signal is applied for frequency synchronization. The trigger
threshold is similar to that of TTL signals. The level for the reference signal must be greater than
10 dBm. Switchover between external trigger input and reference input is via the SETUP key.
DC connector for external power supply (on the right-hand side of the carrying handle).
The DC connector is used to supply the R&S FSH with power from the AC/DC adapter and to charge
the R&S FSH internal battery. The input voltage for the instrument must be between 15 V and 20 V.
Power consumption is approx. 7 W.
The RF input is AC-coupled. However, the DC input voltage must never exceed the value
specified on the housing; otherwise the coupling capacitor at the input may be destroyed
and, thus, the input attenuator or mixer as well. The RF input is protected from static
discharges and voltage pulses by a combination of limiting circuits and high-voltage
arresters.
The battery can also be charged from a cigarette lighter socket in a vehicle. The adapter is available as
an R&S FSH accessory (R&S FSH-Z21, order no. 1145.5873.02).
Caution!
Headphones connector (n the left-hand side of the carrying handle)
A 3.5 mm jack is provided for headphones. The internal impedance of the connector is approx. 10 E.
While the battery of the R&S FSH is being charged via the 12 V Car Adapter
R&S FSH-Z21, the car adapter must not be connected to the vehicle's ground (for
example, via the R&S FSH's RF connector or the power sensor) under any
circumstances.
1145.5973.12 1.5 E-14
Page 49

Putting into Operation R&S FSH
RS-232-C optical interface
(on the right-hand side of the R&S FSH; can be accessed by folding out the stand)
The RS-232-C optical interface is for connecting a printer or PC. The R&S FSH-Z34 RS-232-C optical
cable or the FSH-Z37 USB optical cable R&S is used to make the connection. Starting with the
R&S FSH serial numbers listed below, the R&S FSH-Z37 USB optical cable will replace the
R&S FSH-Z34:
Model Ser. No.
R&S FSH 3 (1145.5850.03) 103001
R&S FSH 3 (1145.5850.13) 103501
R&S FSH 3 (1145.5850.23) 102501
R&S FSH 6 (1145.5850.06) 101001
R&S FSH 6 (1145.5850.26) 101501
R&S FSH 18 (1145.5850.18) all
If you use the R&S FSH-Z37 USB optical cable, you need to install a software driver on your PC. The
CD-ROM, which is supplied with the R&S FSH, includes both the driver and the installation instruction.
Important: If a computer with an Intel
a USB connecting cable without the labeling Rev. II is used, a connection with the R&S FSH cannot be
set up as long as the Hyper Threading function is active. To use the USB cable, you must first disable
the HT function. You can do this as follows: Go to START, select Run… and then enter msconfig under
Open. Then select the BOOT.INI tab and enter /NUMPROC=1 under expanded functions.
The R&S FSH is now supplied with a new Rev. II-labeled USB cable starting from the serial numbers
listed below. This adapter cable contains a USB chip-set of the latest generation and does not require
the deactivation of the hyper threading function as described above. The Rev. II cable must always be
used for computers with Intel
Model Ser. No.
R&S FSH 3 (1145.5850.03) 104374
R&S FSH 3 (1145.5850.13) 103864
R&S FSH 3 (1145.5850.23) 103927
R&S FSH 6 (1145.5850.06) 101738
R&S FSH 6 (1145.5850.26) 102595
R&S FSH 18 (1145.5850.18) all
processor with HT technology and MicrosoftWindows XP and
Dual Core processors.
The optical connection prevents spurious measurements due to interference from these devices.
Use the Serial/Parallel Converter R&S FSH-Z22 for printers with a parallel interface.
Printers with a USB interface cannot be connected directly to the R&S FSH.
1145.5973.12 1.6 E-14
Page 50

R&S FSH Putting into Operation
Connector for power sensor
The connector has been especially configured for Rohde & Schwarz power sensors. The connector is
used to power the sensor and to transfer data via the power sensor’s interface. If the R&S FSH-Z2
(VSWR bridge and power divider) is used, it is controlled by the connector.
Tracking generator output (models 1145.5850.13, 1145.5850.23 and 1145.5850.26 only)
Connect the tracking generator output to the DUT via an N connector. The nominal output level is
-20 dBm (100 LW). With the R&S FSH3 model 1145.5850.23, the level can be switched between
-20 dBm and 0 dBm (1 mW). Up to 3 GHz, the R&S FSH6 model 1145.5850.26 supplies an output level
of -10 dBm; above 3 GHz, the level is -20 dBm. Starting with serial number 100500, the output level of
the R&S FSH6, model 1145.5850.26, can be reduced in 1 dB steps by maximally 20 dB by means of a
step attenuator.
Caution!
The output is AC-coupled and a voltage that does not exceed the voltage stated on the
housing can be fed into the output; if this voltage is exceeded, the output may be
destroyed.
1145.5973.12 1.7 E-14
Page 51

Putting into Operation R&S FSH
Using the rotary knob, adjust the contrast until
Screen Settings
The R&S FSH’s screen is a transflective, passive color LCD. Indoors, its brightness depends on the
intensity of the backlighting. If light irradiation is strong, the ambient light supports readability. The
viewing angle can be optimized by adjusting the contrast. To achieve maximum contrast, the screen
can be switched from color display to black-and-white display.
To strike a balance between battery operating time and screen display quality, set backlighting to the
minimum brightness needed.
Setting brightness
Press the SETUP key.
Press the DISPLAY softkey.
The submenu with the contrast, lighting and color
settings opens.
Using the rotary knob or cursor keys, select LIGHT...
and confirm by pressing the DISPLAY softkey or the
ENTER key again.
The BACKLIGHT submenu for the lighting level opens.
The level can be set to HIGH, NORMAL and LOW.
Using the rotary knob or cursor keys, select the
setting you want and confirm by pressing the
DISPLAY softkey or the ENTER key.
Setting the contrast
Press the SETUP key.
Press the DISPLAY softkey.
The submenu with the contrast, lighting and color
settings opens.
Using the rotary knob or the cursor keys, select
CONTRAST... and confirm by pressing the
DISPLAY softkey or the ENTER key again.
The contrast value entry box opens.
screen legibility is optimal.
When setting the contrast, view the display at the
same angle that will be used for the application.
Confirm the entry with the ENTER key or by
pressing the DISPLAY softkey again.
The R&S FSH displays the setting in the Display
Contrast line in the overview of the setup settings.
1145.5973.12 1.8 E-14
Page 52

R&S FSH Putting into Operation
Setting the screen color
Press the SETUP key.
Press the DISPLAY softkey.
The submenu with the contrast, lighting and color
settings opens.
Using the rotary knob or cursor keys, select TYPE...
and confirm with the ENTER key or by pressing the
DISPLAY softkey again.
In the submenu that opens, select COLOR or
BLACK/WHITE.
Confirm with the ENTER key or by pressing the
DISPLAY softkey again.
The R&S FSH switches to the selected color settings.
1145.5973.12 1.9 E-14
Page 53

Putting into Operation R&S FSH
Country-Specific Settings
The R&S FSH is “multilingual” and can display text in the language of your choice. The softkey lettering
is always in English. The default setting (factory-setting) is also English.
Selection
Press the SETUP key.
The R&S FSH displays all default settings. The last
two lines indicate the current language and the date
format.
Press the LOCAL SETTINGS softkey.
A submenu with the LANGUAGE..., DATE FORMAT...
and UNIT OF LENGTH... entries opens. This menu
allows the entry of a country-specific language, date
format or the unit of length used by the R&S FSH.
Using the rotary knob or cursor keys, select the
LANGUAGE... you want from the menu and confirm
with the ENTER key or by pressing the LOCAL
SETTINGS softkey again.
The languages available are displayed in a submenu.
The selected language is highlighted in red.
Using the rotary knob or cursor keys, select the
language you want.
The originally selected language is highlighted in
green. The red bar indicates the new selection.
Confirm the new selection with the ENTER key or by
pressing the LOCAL SETTINGS softkey.
Using the rotary knob or cursor keys, select DATE FORMAT... from the menu and confirm with the
ENTER key or by pressing the LOCAL SETTINGS softkey again.
Using the rotary knob or cursor keys, select the date format (dd/mm/yyyy or mm/dd/yyyy) and
confirm with the ENTER key.
Using the rotary knob or cursor keys, select UNIT OF LENGTH... from the menu and confirm with the
ENTER key or by pressing the LOCAL SETTINGS softkey again.
Using the rotary knob or cursor keys, select the required unit of length (METER or FEET) and
confirm with the ENTER key.
Note: The unit of length is relevant only with distance-to-fault cable measurements in order to
display the fault distance from the measurement plane.
1145.5973.12 1.10 E-14
Page 54

R&S FSH Putting into Operation
Setting the Date and Time
The R&S FSH has an internal clock that can apply a date and time stamp, e.g. for output to a printer or
stored data records. The user can reset the date and time.
Setting the date
Press the SETUP key.
Press the GENERAL softkey.
Using the rotary knob or cursor keys, select DATE...
from the menu and confirm with the ENTER key.
The value entry box above the row of softkey labels is
highlighted in red and displays the currently set date in
the selected format (dd/mm/yyyy or mm/dd/yyyy). The
active value entry field is highlighted in white.
Depending on the date format, change the day (dd)
or month (mm) by using the rotary knob, cursor keys
or a numeric entry and confirm with the ENTER key.
After the entry, the cursor automatically moves to the
second field in the date (day or month, depending on
the date format). Proceed with the next two fields as
with the first.
After the last data block has been entered, the R&S FSH verifies the validity of the entered date. If the
date is not valid, the R&S FSH sets the next valid date.
Setting the time
Press the SETUP key.
Press the GENERAL softkey.
Using the rotary knob or cursor keys, select TIME...
from the menu and confirm with the ENTER key.
The value entry box above the row of softkey labels is
highlighted in red and displays the currently set time in
hours:minutes format. The hours display is highlighted
in white to enter a new value.
Change the hours with the rotary knob, cursor keys
or numeric entry and confirm with the ENTER key.
After entry, the cursor automatically goes to the
minutes display. The entry is the same as for the hours
display.
After the minutes have been entered, the R&S FSH verifies the validity of the entered time. If the time is
not valid, the R&S FSH sets the next valid time.
1145.5973.12 1.11 E-14
Page 55

Charging the Battery R&S FSH
Charging the Battery
The R&S FSH is fitted with a nickel metal hydride battery. The operating time is approx. four hours at
room temperature if the battery is fully charged.
Note: The battery in the R&S FSH is not charged when it leaves the factory. It must therefore be
charged after delivery.
When stored over an extended period, self-discharging reduces the battery charge. The battery should
therefore be charged before use if it is going to be the sole power source for a long period of operation.
The charging status of the battery is displayed by a
symbol that looks like a battery in the middle of the
screen above the row of softkey labels. If the battery is
fully charged, the entire battery symbol is white. As the
battery discharges, the white coloring disappears in
five steps until just the battery outline indicates that the
battery is flat.
The battery is charged via the included power supply unit, which is connected to the jack on the righthand side of the carrying handle.
If required, equip the power supply unit
with the country-specific plug. Remove
the plug from the power supply unit
toward the front and firmly connect the
appropriate plug to the power supply
unit.
Battery charge-level symbol
DC power jack
Power supply
AC supply plug
For rapid charging, be sure to switch off the R&S FSH during charging. The charging time is approx.
seven hours. After four hours, the battery will be approx. 80 % charged.
If the R&S FSH is switched on, the charging current for the battery is reduced by the current drain of the
R&S FSH, which means the battery might not be charged.
To prevent the battery from discharging unnecessarily, the R&S FSH has an automatic cut-off or auto
power down mode that is activated if no entry is made for a definable period of time (5 minutes or
30 minutes).
The auto power down mode is deactivated in the default setting.
1145.5973.12 1.12 E-14
Page 56

R&S FSH Selecting the Instrument Default Setup
The auto power down mode is set as follows:
Press the GENERAL key.
The R&S FSH opens the submenu with the general
settings. The cursor is positioned to POWER DOWN in
the menu.
Confirm the POWER DOWN selection by pressing
the ENTER key.
The R&S FSH opens a selection window with the settings:
5 minutes, 30 minutes and DISABLE.
Using the rotary knob or cursor keys, select the
setting you want and confirm by pressing the
ENTER key or the GENERAL softkey.
Selecting the Instrument Default Setup
The PRESET key sets the R&S FSH to the default setup. This allows a new configuration based on
defined measurement parameters to be entered, without parameters from a previous setting
unintentionally still being active.
Press the PRESET key.
The R&S FSH is set to the default setup. The span depends on the model. With the R&S FSH3, it is
3 GHz; with the R&S FSH6, 6 GHz and with the R&S FSH18, 18 GHz..
If certain parameters are always to deviate from the default setup for a specific application, it is also
possible to select a user-defined default setup, which is then automatically set with the PRESET key.
This is useful, for example, if the measurement is always made with a 75 matching pad. When the
PRESET key is pressed, the R&S FSH always selects 75 as the input impedance for the userspecific default setup. The user-defined default setup is generated by manually entering the desired
parameters and saving the setting as a data set. This data set can subsequently be declared the preset
settings with the aid of the R&S FSH View software.
The data set designated as the preset settings becomes the default setup of the R&S FSH as follows:
Press the SETUP key.
Press the GENERAL softkey.
Select PRESET SETTINGS from the menu using
the cursor keys or the rotary knob.
Confirm your choice with the ENTER key or the
GENERAL softkey.
The submenu for selecting the default setup opens. Either DEFAULT or CUSTOM can be selected.
Select CUSTOM from the menu using the cursor
keys or the rotary knob.
Confirm your choice with the ENTER key or the
GENERAL softkey.
1145.5973.12 1.13 E-14
Page 57

External Reference / External Trigger Switchover R&S FSH
The parameters defined in the data set for the default setup are now used as the preset settings.
If no user-specific default setup is defined, CUSTOM is inactive and cannot be selected.
The data set defined as the user default setup can be viewed using the R&S FSH's recall function.
Press the SAVE/PRINT key.
Press the RECALL softkey.
All stored data sets are displayed.
The status of the data set is indicated in the status
field:
P: Preset setting
: Data set disabled
Data set
overwritable
Data set not
overwritable or
deletable
User-defined
default setup
Status field
If no data sets are stored in the R&S FSH, the
message "No datasets available" is output instead of
the list of data sets.
External Reference / External Trigger Switchover
The Ext Trig/Ext Ref BNC connector on top of the R&S FSH can be used either as an input for an
external trigger or an external reference. Switchover is via the SETUP menu.
Press the SETUP key.
Press the HARDWARE SETUP softkey.
Using the rotary knob or the cursor keys, select the
menu item and confirm your choice with the ENTER
key or the BNC I/O MODE softkey.
The active input setting (EXT TRIG or EXT REF) is
highlighted in green.
Using the rotary knob or cursor keys, select EXT
REF IN or EXT TRIG IN.
Confirm with the ENTER key or the HARDWARE
SETUP softkey.
The EXT TRIG IN setting is only for input configuration. The use of the external trigger must be set in
the SWEEP menu (SWEEP key, TRIGGER softkey).
The input setting can be queried via the status display (press the STATUS key).
1145.5973.12 1.14 E-14
Page 58

R&S FSH Controlling the RF Attenuator
Controlling the RF Attenuator
Depending on the selected reference level, the R&S FSH sets the attenuator on the RF input to a
suitable value. It offers two modes: one for the highest possible sensitivity (LOW NOISE) and one for
the lowest possible intermodulation products (LOW DISTORTION). The difference between the two
modes is that the attenuation that the R&S FSH sets for the RF attenuator is 10 dB higher for LOW
DISTORTION than for LOW NOISE.
Press the SETUP key.
Press the HARDWARE SETUP softkey.
Using the rotary knob or cursor keys, select
DYNAMIC RANGE... from the menu.
Confirm with the ENTER key or the HARDWARE SETUP softkey.
Using the rotary knob or cursor keys, select LOW NOISE or LOW DISTORTION.
Confirm with the ENTER key or the HARDWARE SETUP softkey.
Using a Preamplifier
(Only models 1145.5850.03, 1145.5850.23, 1145.5850.06 and 1145.5850.26.)
The R&S FSH models 1145.5850.03, 1145.5850.23, 1145.5850.06 and 1145.5850.26 come with an
internal preamplifier for increasing sensitivity. Depending on the frequency, this amplifier has 15 dB to
18 dB gain and increases sensitivity by 10 to 15 dB. It is fitted behind the RF attenuator and in front of
the input mixer.
Press the SETUP key.
Press the HARDWARE SETUP softkey.
Using the rotary knob or cursor keys, select
PREAMP... .
Confirm with the ENTER key or the HARDWARE
SETUP softkey.
The R&S FSH changes to the submenu for
preamplifier configuration. The selection bar indicates
the active setting.
Using the rotary knob or cursor keys, select the
setting you want (ON or OFF) and confirm by
pressing the ENTER key.
1145.5973.12 1.15 E-14
Page 59

Using a Preamplifier R&S FSH
If the preamplifier is switched on, its use is coupled to the reference level, thus ensuring the optimum
dynamic range of the R&S FSH at all times. The table below shows the positions of the RF attenuator
and the preamplifier as a function of the reference level.
Preamplifier
Reference level
Low Noise Low Distortion Low Noise Low Distortion
-25 dBm
-24 dBm to -20 dBm 0 dB 0 dB 10 dB 10 dB On
-19 dBm to -15 dBm 0 dB 10 dB 10 dB 10 dB On
-14 dBm to -10 dBm 0 dB 10 dB 0 dB 10 dB Off
-9 dBm to 0 dBm 10 dB 20 dB 10 dB 20 dB Off
1 dBm to 10 dBm 20 dB 30 dB 20 dB 30 dB Off
11 dBm to 20 dBm 30 dB 30 dB 30 dB 30 dB Off
0 dB 0 dB 0 dB 0 dB On
OFF
RF attenuation RF attenuation Preamplifier
The attenuator position can be queried at any time via the status display.
Preamplifier
ON
1145.5973.12 1.16 E-14
Page 60

R&S FSH PIN Entry
Using the rotary knob or cursor keys, select
PIN Entry
To prevent unauthorized use, the R&S FSH can be protected with a personal identification number
(PIN).
When the R&S FSH is delivered, the PIN is set to 0000 and PIN entry is disabled when the R&S FSH is
switched on. A PIN, i.e. a four-digit number, can be re-entered whenever you wish. But it is not
activated until the PIN mode has been enabled.
A new PIN is entered as follows:
Press the SETUP key to call up the SETUP menu
and the instrument settings.
Press the GENERAL softkey.
PINCODE... from the menu and press the ENTER key.
The selection box with the PIN settings is opened.
The current PIN must be entered before it can be modified. This prevents unauthorized PIN
modification.
Enter your valid PIN.
When the R&S FSH is delivered, the valid PIN is 0000.
After you enter your valid PIN, the PIN functions can be selected from the selection box. When the
R&S FSH is delivered, a new PIN can be activated only if it differs from the factory-set PIN.
Note: Before you activate the PIN mode, enter a user-defined PIN. Keep your PIN in a secure
place away from the R&S FSH. If the active PIN is not available, the instrument can be
reset to the default PIN ('0000') with the master PIN supplied with each instrument. If the
master PIN is not available, please contact an authorized Rohde & Schwarz service
center.
Entering a new PIN
Using the rotary knob or cursor keys, select New Pincode... from the menu in the selection box and
enter a new four-digit PIN. Confirm with ENTER.
The R&S FSH will prompt you to re-enter the PIN in order to prevent incorrect entries.
Re-enter the PIN.
Activating the PIN mode
Using the rotary knob or cursor keys, select PINCODE ON from the menu and press the ENTER key.
The R&S FSH now prompts you to enter the PIN prior to its activation.
Enter the PIN and confirm with the ENTER key.
1145.5973.12 1.17 E-14
Page 61

PIN Entry R&S FSH
The selected PIN is now activated. The next time you switch on the R&S FSH, you must enter the PIN
before you can operate the instrument. If you enter an incorrect PIN , the R&S FSH again prompts you
for the PIN code. After three attempts with an incorrect PIN, the R&S FSH prompts you for the master
PIN.
Note: The R&S FSH comes with labels reading ‘PIN Code protected’. If the instrument is
protected with a PIN, affix one of these labels to the instrument. This warns unauthorized
users that they cannot operate the R&S FSH.
Deactivating PIN protection
Using the rotary knob or cursor keys, select PINCODE OFF from the menu and press the ENTER
key.
Prior to deactivation, the R&S FSH prompts you to enter your PIN. This prevents unauthorized
deactivation of PIN protection.
Enter your PIN number and confirm with the ENTER key.
The R&S FSH can now be operated without PIN protection.
1145.5973.12 1.18 E-14
Page 62

R&S FSH Connecting Printers
Connecting Printers
The R&S FSH can output a screenshot to a printer equipped with an RS-232-C interface. The
Serial/Parallel Converter R&S FSH-Z22 is available as an accessory for printers with a parallel
interface.
A printer with an RS-232-C interface can be directly connected using the R&S FSH-Z34 RS-232-C
optical cable.
Fold out the stand at the rear of the
R&S FSH.
Connect the optical connector of the
R&S FSH-Z34 RS-232-C cable to the
RS-232-C cable
9-pin
connector
optical interface on the right-hand
side of the R&S FSH.
Connect the 9-pin D-Sub connector of
the cable to the RS-232-C input of the
printer.
Optical RS-232-C
interface
Connect printers with a parallel interface to the R&S FSH using the Serial/Parallel Converter R&S FSHZ22, thus freeing up the Centronics parallel interface to connect a printer. The R&S FSH-Z22 is
powered by a 9 V alkaline battery (NEDA, IEC6LR61).
Fold out the stand at the rear of the
R&S FSH.
Connect the optical connector of the
R&S FSH-Z22 to the optical interface
on the right-hand side of the
R&S FSH.
Optical RS-232-C
interface
Connect the printer cable to the 25-
pin interface of the R&S FSH-Z22.
Switch on the serial/parallel converter
using the slide switch on its top.
R&S
FSH-Z22
Slide switch positions:
OFF The R&S FSH-Z22 is off.
ON The R&S FSH-Z22 is on, and
the Battery OK LED flashes.
AUTO OFF The R&S FSH-Z22 is on, and
the Battery OK LED flashes. If
data transmission is interrupted for more than 5 minutes,
the R&S FSH-Z22 is switched
off automatically.
While data is being transmitted to the printer, the "Busy" LED remains lit.
1145.5973.12 1.19 E-14
Page 63

Connecting Printers R&S FSH
Using the rotary knob or cursor keys, select
baud rates
Note: The R&S FSH-Z22 is designed for a data transmission rate of max. 38 400 baud (= default
setting). Therefore, set the baud rate (PRINTER BAUD RATE) in the SETUP menu to
38 400 baud. The baud rates 9600 baud and 19 200 baud can also be set on the
R&S FSH-Z22 by opening its housing.
Selecting a printer
Press the SETUP key on the R&S FSH.
The R&S FSH displays the selected printer and its
baud rate in the setup settings.
To select another printer, proceed as follows:
Press the GENERAL softkey.
Using the rotary knob or cursor keys, select
PRINTER TYPE... from the menu and confirm with
the ENTER key or by pressing the GENERAL
softkey again.
Using the rotary knob or cursor keys, select the
printer you want and confirm with the ENTER key or
by pressing the GENERAL softkey again.
The R&S FSH displays the selected printer under
"Printer Type".
Next, set the baud rate for the selected printer.
Press the GENERAL softkey.
PRINTER BAUD... from the menu and confirm with
the ENTER key.
The selection box for the available
(1200 baud to 115 200 baud) opens.
Using the rotary knob or cursor keys, select the
baud rate you want and confirm with the ENTER key
or by pressing the GENERAL softkey a second time.
The R&S FSH displays the selected baud rate under
"RS232 Baudrate" in the setup display.
Note: If the serial/parallel converter (R&S FSH-Z22) is used to control a printer with a parallel
The contents of the setup display can be output to the printer by pressing the SETUP -> PRINTER
softkey.
1145.5973.12 1.20 E-14
interface, set the RS-232-C interface to 38 400 baud.
Page 64

R&S FSH Setting the Baud Rate for Remote Control
Setting the Baud Rate for Remote Control
The R&S FSH offers different baud rates for remote control. The desired baud rate is set via the setup
menu.
Press the SETUP key.
Press the GENERAL softkey.
Use the rotary knob or the cursor keys to select
SERIAL BAUD... from the menu and confirm the
selection with the ENTER key.
The selection box for the available baud rates
(9600 baud to 115200 baud) opens.
Use the rotary knob or the cursor keys to select the
baud rate you want and confirm the entry with the
ENTER key or by pressing the GENERAL softkey
again.
The R&S FSH displays the selected baud rate under
SERIAL BAUDRATE in the setup display.
Enabling Options
The R&S FSH can be fitted with options (e.g. distance-to-fault measurements on cables) which are
enabled by entering a key code. The key code is based on the unique serial number of the instrument.
To add an option, enable it with a key code.
Operation
Press the SETUP key.
Press the GENERAL key.
Using the rotary knob or cursor keys, select OPTIONS... from the menu and confirm with the ENTER
key.
Enter the key code (ten-digit number) for the option with the numeric keys and confirm with the ENTER
key.
If the correct key code is entered, the R&S FSH displays "<....> Option enabled".
If an invalid key code is entered, the R&S FSH displays "Option key error".
The correct key code can then be entered.
1145.5973.12 1.21 E-14
Page 65

Checking the Installed Options R&S FSH
Checking the Installed Options
The R&S FSH displays the installed options in the Setup menu so you can check them:
Press the SETUP key.
Using the rotary knob or the cursor keys, scroll the
status display downwards.
The R&S FSH displays all available options together
with their current status.
1145.5973.12 1.22 E-14
Page 66

R&S FSH Measurements on CW Signals
2 Getting Started
This section explains the basic operation of the Handheld Spectrum Analyzer R&S FSH using some
simple measurements as examples. A more detailed description of operation and functions, such as
selecting menus and setting measurement parameters, is provided in section 3 of this manual.
Measurements on CW Signals
A basic task performed by spectrum analyzers is measuring the level and frequency of sinewave
signals. The following examples illustrate the most effective way of performing these measurements
with the R&S FSH.
A signal generator is used as a signal source, e.g. the Signal Generator R&S SML.
Measurement setup:
Connect the RF output of the signal generator to the RF input of the R&S FSH.
Signal generator settings:
Frequency 100 MHz
Level -30 dBm
Level measurement
First, set the R&S FSH to its default settings to show all the operating steps that are required.
Press the PRESET key.
The analyzer displays the frequency spectrum from
100 kHz to 3 GHz or 100 kHz to 6 GHz (dependent on
the model) – the R&S FSH’s maximum frequency
span. At 100 MHz, the generator signal is displayed as
a vertical line. Generator harmonics can also be seen
as lines at frequencies that are multiples of 100 MHz.
To analyze the generator signal at 100 MHz in more
detail, reduce the frequency span. Set the R&S FSH’s
center frequency to 100 MHz and reduce the span to
10 MHz.
1145.5973.12 2.1 E-14
Page 67

Measurements on CW Signals R&S FSH
Press the FREQ key.
Enter “100” using the numeric keypad and confirm
the entry with the MHz key.
Press the SPAN key.
Enter “10” using the numeric keypad and confirm the
entry with the MHz key.
The R&S FSH now displays the generator signal with a
higher resolution.
The R&S FSH has markers for reading off signal levels and frequencies. Markers are always positioned
on the trace. Both the level and frequency at their current positions are displayed on the screen.
Press the marker key.
The marker is activated and is automatically positioned
on the trace maximum. A vertical line on the
measurement diagram indicates the marker frequency.
A short horizontal line on the trace indicates the level.
The R&S FSH displays the marker frequency and level
numerically at the top of the measurement diagram.
Setting the Reference Level
The level shown by spectrum analyzers at the top of the measurement diagram is called the reference
level (REF LEVEL). To obtain the best dynamic range from a spectrum analyzer, its full level range
should be used. This means that the maximum spectrum level should be at or close to the top of the
measurement diagram (= reference level).
The reference level is the maximum level on the level axis (y axis).
Reduce the reference level by 10 dB to increase the dynamic range.
Press the AMPT key.
The softkeys for the AMPT menu are displayed and the REF LEVEL softkey label is highlighted in red,
i.e. it is enabled for value entry. The red value entry box at the bottom right-hand corner of the
measurement diagram displays the current reference level.
Enter “30” using the numeric keypad and confirm the entry with the dBm key.
The reference level is now set to –30 dBm. The maximum trace value is close to the maximum scale
value of the measurement diagram. The increase in the displayed noise floor is minimal. The difference
between the signal maximum and the displayed noise (i.e. the dynamic range ) has, however, been
increased.
1145.5973.12 2.2 E-14
Page 68

R&S FSH Measurements on CW Signals
Using markers is also an effective way to shift the trace maximum so that it coincides with the top of the
measurement diagram. If the marker is positioned on the trace maximum (as in the example), the
reference level can be set to the marker level by entering the following keystrokes:
Press the MARKER key.
Press the SET MARKER softkey.
Select REF LVL = MRK LVL in the submenu by using the rotary knob or the cursor keys.
Press the ENTER key.
The reference level is then set to the measured level indicated by the marker. Only a few keystrokes
are needed to set the optimal reference level.
Frequency Measurements
The R&S FSH’s trace displays 301 measurement points (associated with 301 frequency or time points
along the x axis). The marker is always positioned on one of these measurement points. The R&S FSH
calculates the marker frequency from the measurement-point frequency, and the center frequency and
frequency span that have been set. The measurement point resolution and, consequently, the accuracy
of the marker-frequency readout therefore depend on the frequency span that has been selected.
The R&S FSH has a frequency counter to increase the accuracy of the marker frequency readout, It
stops the sweep at the marker position, counts the frequency and then continues the sweep.
The following measurement example is based on the previous example.
Press the MARKER MODE softkey in the marker
menu.
The marker mode selection box opens.
Select FREQ COUNT from the selection box using
the rotary knob or the cursor keys.
Press the ENTER key.
The label 'M:' at the upper left-hand corner of the
measurement diagram changes to 'Ct:' to tell you that
the frequency counter has been switched on. The
resolution of the frequency readout is now 1 Hz no
matter what span has been set. The accuracy is
determined by the R&S FSH’s internal reference
frequency. It is far higher than that of pixel-oriented,
marker-frequency readout.
1145.5973.12 2.3 E-14
Page 69

Measurements on CW Signals R&S FSH
Harmonic Measurements of a Sinewave Signal
Since a spectrum analyzer can resolve different signals in the frequency domain, it is ideal for
measuring harmonic levels or harmonic ratios. To speed up these operations, the R&S FSH has marker
functions that deliver fast results with only a few keystrokes.
As above, a signal generator with a 100 MHz output frequency and an output level of –20 dBm is used
in the following measurement example.
First, the R&S FSH is set to its default settings to show all measurement steps that are needed.
Press the PRESET key.
The analyzer displays the frequency spectrum from 100 kHz to 3 GHz, the largest available span. At
100 MHz, the generator signal is displayed as a line. The generator harmonics are displayed as lines
at frequencies that are multiples of 100 MHz.
To measure the second harmonic ratio, set the start and stop frequency as follows:
Press the FREQ key.
The softkey menu opens entering the frequency.
Press the START softkey.
Enter '50' using the numeric keypad and confirm the entry with the MHz key.
Press the STOP softkey.
Enter '250' using the numeric keypad and confirm the entry with the MHz key.
The R&S FSH now displays the spectrum from 50 MHz to 250 MHz and thus the signal at 100 MHz and
its second harmonic at 200 MHz.
To measure the harmonic ratio, set the marker on the fundamental and the delta marker on the second
harmonic.
Press the MARKER key.
The softkey menu opens for marker entry and
automatically positions the main marker on the trace
maximum.
Press the DELTA softkey.
The delta marker is activated (vertical dotted line) and
is automatically placed on the next trace maximum (=
second harmonic).
The harmonic ratio in dB can be read directly from the
numeric delta-marker display.
1145.5973.12 2.4 E-14
Page 70

R&S FSH Measurements on CW Signals
Power Measurements Using the Power Sensor
For highly accurate power measurements, the R&S FSH provides the Power Sensor R&S FSH-Z1 or
R&S FSH-Z18 as options. They measure power in the span 10 MHz to 8 GHz or 10 MHz to 18 GHz,
respectively.
The Power Sensor R&S FSH-Z1 or R&S FSH-Z18 is controlled and powered via a special RS-232-C
interface at the top of the instrument.
Power Sensor
connector
Power Sensor
R&S FSH-Z1 or
R&S FSH-Z18
RF connector
(Device under Test)
The continuous power applied to the power sensor’s input must not exceed 400 mW
(26 dBm). However, brief (
10 $s) power peaks up to 1 W (30 dBm) are permissible.
Higher input powers can destroy the sensor. An attenuator pad must be used to ensure
that the maximum permissible power for the sensor is never exceeded when
measurements are made on high-power transmitters.
Connect the power sensor cable to the R&S FSH’s power sensor connector and screw it into
position.
Press the MEAS key.
Press the MEASURE softkey.
Using the cursor keys or the rotary knob, select the POWER SENSOR menu item and confirm your
selection with the ENTER key or the MEASURE softkey.
The R&S FSH opens the screen for power measurements. If a power sensor has not been connected,
no measured value is displayed. If a power sensor has been connected, the R&S FSH sets up a
connection via the RS-232-C interface and, after a few seconds, displays the measured power.
If there are any communication problems with the power sensor, the R&S FSH outputs error messages
(sensor error: error number) indicating the possible causes (see main manual).
To compensate for internal offset of the power meter, it needs to be compensated before starting the
measurement.
1145.5973.12 2.5 E-14
Page 71

Measurements on CW Signals R&S FSH
Press the ZERO softkey.
The R&S FSH outputs a message telling you not to
apply any signals to the power meter while zeroing is
being performed.
Disconnect the power sensor from any signal
sources.
Start zeroing with the first or second softkey
(CONTINUE).
The R&S FSH immediately starts power meter zeroing.
While this process is being performed, the R&S FSH
outputs the message “Zeroing power sensor, please
wait..”.
When zeroing is over, the R&S FSH outputs the
message "Power Sensor Zero OK" and switches back
to the softkey menu for the power sensor.
Connect the signal under test.
The R&S FSH shows the measured power level in dBm.
For a highly accurate measurement, enter the frequency of the signal under test.
Press the FREQ softkey.
Using the numeric keys, enter the frequency you
want and confirm the entry with the ENTER key or
by pressing the FREQ softkey again.
The R&S FSH transfers the new frequency to the
power sensor which then corrects the measured power
readings.
1145.5973.12 2.6 E-14
Page 72

R&S FSH Measurements on CW Signals
Power and Return Loss Measurements with the R&S FSH-Z14 or the R&S FSH-Z44
The Directional Power Sensors R&S FSH-Z14 and R&S FSH-Z44 are connected between the source
and the load and measure the power flux in both directions, i.e. from the source to the load (forward
power) and from the load to the source (reverse power). The ratio between reverse power and forward
power is a measure of the load matching and is displayed as the return loss or standing wave ratio.
The R&S FSH-Z14 and the R&S FSH-Z44 have an asymmetrical design and must therefore be inserted
into the test setup in such a way that the FORWARD arrow on the sensor points toward the load (= in
the direction of the power flux).
They are driven and powered via a special serial interface.
The cable on the power sensor must be connected and screw-fastened to the power sensor connector
on the R&S FSH. The directional power sensor itself has to be inserted between the source and the
load.
Directional Power Sensor
R&S FSH-Z14 / R&S FSH-Z44
Source
Load
When measuring high powers, pay strict attention to the following instructions to avoid personal injury
and to prevent the power sensor from being destroyed:
• Never exceed the permissible continuous power (see diagram on the rear of the
sensor).
• Connect the sensor only when the RF power is off.
• The RF connectors must be screwed tight.
Failure to follow these rules can lead to injuries such as skin burns or cause the
destruction of the measurement instruments in use.
Operation:
Press the MEAS key.
Power sensor
connector
Press the MEASURE softkey.
The R&S FSH opens the menu for the measurement functions.
Using the cursor keys or the rotary knob, select POWER SENSOR and confirm with the ENTER key or
by pressing the MEASURE softkey.
1145.5973.12 2.7 E-14
Page 73

Measurements on CW Signals R&S FSH
FSH informs you not to apply any signals
The R&S FSH opens the screen and the menu for the power measurement. If no power sensor is
connected, no measured value is displayed. If a power sensor is connected, the R&S FSH establishes
a connection to the power sensor via the interface and, after a few seconds, displays the connected
power sensor type (R&S FSH-Z14 or R&S FSH-Z44) as well as the measured forward power and return
loss of the load.
Before performing the power measurement, zero the power sensor.
Press the ZERO softkey.
The R&S
while the power sensor is being zeroed.
Disconnect the power sensor from any signal
sources.
Start zeroing with the first or second softkey
(CONTINUE).
Softkey 4 or 5 (CANCEL) can be used to cancel
zeroing before it begins, e.g. if the signal source
cannot be disconnected.
The R&S FSH immediately starts power sensor zeroing. While this is being done, the R&S FSH outputs
the message "Zeroing power sensor, please wait...".
When zeroing is over, the R&S FSH outputs the message "Power Sensor Zero OK" and switches back
to the softkey menu for the power sensor.
Now connect the R&S FSH-Z14 or R&S FSH-Z44 between the source and the load.
The R&S FSH displays the measured forward power level in dBm and the VSWR of the load.
To achieve maximum measurement accuracy, enter the frequency of the signal under test.
Press the FREQ softkey.
The R&S FSH opens the entry box for the frequency.
Using the numeric keys, enter the desired frequency
and terminate the input with the ENTER key or by
pressing the FREQ softkey again.
The R&S FSH transfers the new frequency to the
power sensor which then corrects the measured power
readings.
1145.5973.12 2.8 E-14
Page 74

R&S FSH Measurements on CW Signals
Two-Port Transmission Measurements
(Only for R&S FSH with tracking generator)
For measurements of the gain or attenuation of two-port devices, the R&S FSH provides a tracking
generator which generates a sinewave signal exactly at the receive frequency of the R&S FSH.
Press the MEAS key.
Press the MEASURE softkey.
The measurement function menu opens.
Using the cursor keys or the rotary knob, select the TRACKING GEN menu item and confirm your
selection with the ENTER key or the MEAS softkey.
The R&S FSH switches on the tracking generator and calls up its softkey menu.
When the tracking generator is switched on, the R&S FSH displays Uncal . This indicates that tracking
generator measurements are uncalibrated.
Before calibration, the span you want should be set because calibration is valid only for the calibrated
span. Changing the frequency settings after calibration invalidates calibration.
Press the FREQ key.
Using the numeric keys, enter the center frequency.
Press the SPAN key.
Using the numeric keys, enter the span.
Alternately, the start and stop frequencies can be entered using the START and STOP softkeys in the
frequency menu.
Calibrate the R&S FSH for the transfer function measurement.
The following example shows a scalar measurement of the transmission function. If the option
R&S FSH-K2 is installed, the measurement must first be switched to scalar.
Press the MEAS key.
Press the MEAS MODE softkey.
Using the rotary knob or cursor keys, select SCALAR.
Confirm with the ENTER key or the MEAS MODE softkey.
1145.5973.12 2.9 E-14
Page 75

Measurements on CW Signals R&S FSH
In the main menu for the tracking generator, press
the MEAS key.
Press the TRANSM CAL softkey.
The R&S FSH now prompts you to connect the RF
input to the tracking generator’s output so that
calibration can be carried out.
Connect the RF output to the generator’s input
without the DUT.
Press the CONTINUE softkey to start calibration.
During calibration, the R&S FSH outputs the message
"Calibrating THROUGH, please wait...".
When calibration has been completed, the R&S FSH
outputs the message "Transm. calibrated" for
3 seconds.
The R&S FSH now displays Transm. in the upper
right-hand corner of the measurement diagram. This
tells you that the R&S FSH has been calibrated for
transfer function measurements. In addition, the
TRANSM CAL softkey label is highlighted in green.
Connect the DUT between the RF input and the
generator's output.
The R&S FSH displays the magnitude of the transfer
function. You can read out values with the markers, for
example.
The transmission calibration remains valid until the center frequency or the span is changed on the
R&S FSH such that the new span falls outside the calibrated frequency range. If the calibration is no
longer valid,. Uncal is displayed in the upper right-hand corner of the screen.
If the reference is changed after calibration, greater measurement uncertainty must be anticipated. The
R&S FSH retains the calibration data but displays a red dot in front of • Transm. .
When saving a data set for a scalar transmission measurement in a calibrated state, the R&S FSH can
store the calibration data along with the other settings (see section "Saving Calibration Data"). Thus,
after the setting is recalled, a measurement can be performed without prior calibration, provided that the
instrument's temperature does not deviate more than 5 °C from its temperature when the data set was
stored.
If the temperature deviation is greater, the R&S FSH outputs a (red) dot in front of • Transm. . A
precise measurement can then be made only after a calibration.
1145.5973.12 2.10 E-14
Page 76

R&S FSH Measurements on CW Signals
Measurement of Return Loss
(Only for R&S FSH with tracking generator)
For reflection measurements, the VSWR Bridge and Power Divider R&S FSH-Z2 or R&S FSH-Z3 and a
short standard (supplied with the R&S FSH-Z2) are needed. The R&S FSH-Z2 or R&S FSH-Z3 is
screw-connected to the RF input connector and the generator’s output.
VSWR Bridge
and
Control
cable
Power Divider
R&S FSH-Z2
Test port
R&S FSH with VSWR Bridge R&S FSH-Z3
R&S FSH with VSWR Bridge
R&S FSH-Z2
Connect the control cable of the R&S FSH-Z2/-Z3 to the power sensor connector of the R&S FSH.
Connect the RF and generator port of the R&S FSH-Z2/-Z3 to the RF input and generator output of
the R&S FSH.
The test setup must be calibrated before any measurements are made. This is done with a short and an
open at the point were the reflection measurement is to be made. If a cable is to be inserted between
the DUT and the bridge, perform the calibration at the measurement end of the cable.
Press the MEAS key.
Press the MEASURE softkey.
Using the cursor keys or the rotary knob, select TRACKING GEN from the menu and confirm with the
ENTER key or the MEAS softkey.
The R&S FSH switches on the tracking generator and calls up its softkey menu. Since no calibration
has been performed, Track Gen Uncal appears in the upper right-hand corner of the measurement
diagram.
Before performing calibration, set the required span because calibration is valid only for the calibrated
span. Changing the frequency settings after calibration invalidates calibration.
Press the FREQ key.
Using the numeric keys, enter the center frequency.
Press the SPAN key.
Using the numeric keys, enter the span.
Alternately, the start and stop frequency can be input using the START and STOP softkeys in the
frequency menu.
1145.5973.12 2.11 E-14
Page 77

Measurements on CW Signals R&S FSH
Calibrate the R&S FSH for the return loss measurement.
The following example shows a scalar measurement of return loss. If the option R&S FSH-K2 is
installed, measurement must first be switched to scalar.
Press the MEAS key.
Press the MEAS MODE softkey.
Using the rotary knob or cursor keys, select SCALAR.
Confirm with the ENTER key or the MEAS MODE softkey.
In the main menu for the tracking generator, press
the REFLECT CAL softkey.
The R&S FSH prompts you to leave the measurement
port open.
Leave the test port of the R&S FSH-Z2 open.
Using the CONTINUE softkey, start the OPEN cali-
bration.
While calibration is in progress, the R&S FSH outputs
the message "Calibrating OPEN, please wait... ".
When OPEN calibration is over, the R&S FSH prompts you to perform SHORT calibration.
Connect a short to the test port of the R&S FSH-Z2.
Using CONTINUE, start the SHORT calibration.
While calibration is in progress, the R&S FSH outputs
the message "Calibrating SHORT, please wait... ".
When calibration is over, the R&S FSH outputs the
message "Reflect. calibrated" for 3 seconds.
FSH-Z2: Refl. is displayed in the upper right-hand
corner of the measurement diagram to indicate that the
R&S FSH has been calibrated for reflection
measurements and that the VWSR bridge is being
used.
1145.5973.12 2.12 E-14
Page 78

R&S FSH Measurements on CW Signals
Connect the DUT to the measurement port of the
R&S FSH-Z2 or R&S FSH-Z3.
The R&S FSH displays the return loss of the DUT.
The reflection calibration remains valid until the R&S FSH’s center frequency or span is changed such
that the new span falls outside the calibrated frequency range. If calibration becomes invalid, the
R&S FSH displays Uncal in the upper right-hand corner of the screen.
If the reference is changed after calibration, a larger measurement uncertainty must be anticipated. The
R&S FSH retains the calibration data but places a red dot in front of the • FSH-Z2: Refl. display to
indicate a possible increase in measurement uncertainty.
When saving a data set for a scalar reflection measurement in a calibrated state, the R&S FSH can
store the calibration data along with the other settings (see section "Saving Calibration Data"). Thus,
after the setting is recalled, a measurement can be performed without prior calibration, provided that the
instrument's temperature does not deviate more than 5 °C from its temperature when the data set was
stored.
If the temperature deviation is greater, the R&S FSH outputs a (red) dot in front of • FSH-Z2: Refl. . A
precise measurement can then be made only after a calibration.
1145.5973.12 2.13 E-14
Page 79

Measurements on CW Signals R&S FSH
Performing Distance-To-Fault Measurements
(Only for the R&S FSH with tracking generator, installed option R&S FSH-B1 (distance-to-fault
measurement) and VSWR Bridge and Power Divider R&S FSH-Z2 or R&S FSH-Z3).
Measurement
VSWR bridge
cable
Test port
VSWR Bridge
and
Power Divider
R&S FSH-Z2
Measurement
cable
Test port
RF input
Control
cable
Generator
output
Short circuit
DUT
R&S FSH with VSWR Bridge R&S FSH-Z3
R&S FSH with VSWR Bridge
Control
cable
RF input
Generator
output
Short
circuit
DUT
R&S FSH-Z2
Connect the control cable of the R&S FSH-Z2 or R&S FSH-Z3 to the power sensor connector of the
R&S FSH.
Connect the RF and generator port of the R&S FSH-Z2/R&S FSH-Z3 to the RF input and generator
output of the R&S FSH.
Connect the 1 m test cable supplied with option R&S FSH-B1 to the bridge test port.
Note: The 1 m cable must be used. Results are invalid without this cable.
Press the MEAS key.
Press the MEASURE softkey.
Using the cursor keys or rotary knob, select DISTANCE TO FAULT from the menu and confirm with
the ENTER key or the MEAS softkey.
The R&S FSH switches on the distance-to-fault measurement function.
The R&S FSH delivers optimum results if the center frequency is set to the frequency at which the
device under test is operated.
Press the FREQ key.
Input the center frequency, e.g. frequency of the antenna at the end of the cable under test.
1145.5973.12 2.14 E-14
Page 80

R&S FSH Measurements on CW Signals
To perform distance-to-fault cable measurements, the R&S FSH needs to be informed about the type of
cable and its approximate length. Frequency-dependent cable models can be generated with the
supplied R&S FSH View software for Windows and loaded onto the R&S FSH. The procedure is
described in the R&S FSH View manual. The cable parameters for a frequency can also be entered
directly.
Selecting a cable model from the list:
Press the MEAS key.
Press the CABLE MODEL softkey.
The R&S FSH displays the list of loaded cable models.
Using the rotary knob or the cursor keys, select the
appropriate cable model.
Using the SELECT softkey, activate the cable model
you have selected.
The analyzer returns to the DTF measurement menu
and displays the cable used for the measurement in
the upper right-hand corner of the screen.
Entering the cable parameters at a specific frequency:
If cables are used that are not listed in cable models stored in the R&S FSH, it is possible to enter the cable parameters at a specific frequency. It is advisable to use the center frequency of the DTF measurement.
Press the MEAS key.
Press the CABLE MODEL softkey.
The R&S FSH displays the list of loaded cable models
(if available).
Press the SELECT USER MOD softkey.
The softkey is highlighted in green to indicate that a
user-specific cable model has been chosen.
The cable model is defined with the DEFINE USER
MOD softkey.
Press the DEFINE USER MOD softkey.
The R&S FSH opens a submenu for defining the
FREQUENCY, the VELOCITY FACTOR and the
ATTENUATION.
Using the rotary knob or the cursor keys, select the
appropriate parameter from the submenu and press
the ENTER key.
Enter the value (e. g. velocity factor) for the cable
used.
Confirm with the ENTER key.
1145.5973.12 2.15 E-14
Page 81

Measurements on CW Signals R&S FSH
Please refer to the cable manufacturer's data sheet for the velocity factor (= speed of the wave in the
cable relative to the speed of light) and the attenuation of the cable per meter or per foot at the specified
frequency.
Use the EXIT softkey to exit the menu for defining the cable model.
The analyzer returns to the DTF measurement menu and displays the cable used for the measurement
in the upper right-hand corner of the screen.
The R&S FSH uses the cable length to determine the optimal span for the measurement and for scaling
the x axis in DTF mode. For best results, the cable should be specified 20% to 50% longer than the
actual cable length.
Press the CABLE LENGTH softkey.
The R&S FSH opens the cable length (CABLE LEN)
value entry box and displays the current length setting.
Using the numeric keys, enter the cable length in
meters and terminate the entry with the ENTER key
or one of the unit keys, or
Using the rotary knob (1 m steps) or the cursor keys
(10 m steps), adjust the cable length.
If the unit of length is set to Feet (via SETUP: LOCAL
SETTINGS), the entry is in feet.
The minimum cable length is 3 m. The maximum cable
length that can be set is 1000 m.
Note: Always enter the cable length before the test setup is calibrated. If it is entered afterwards,
measurement accuracy is reduced.
Calibrating the test setup:
The test setup must be calibrated before any measurements are performed.
Press the DTF CAL softkey.
The R&S FSH opens a text window that prompts you
to terminate the measurement cable with a SHORT.
Firmly screw the SHORT to the output end of the
measurement cable.
Press the CONTINUE softkey to start the SHORT
calibration.
While the SHORT calibration is in progress, the
R&S FSH outputs the message "Calibrating SHORT,
please wait...".
When calibration is over, the R&S FSH displays DTF CAL in the upper right-hand corner of the
screen.
1145.5973.12 2.16 E-14
Page 82

R&S FSH Measurements on CW Signals
Calibration tip:
The R&S FSH performs calibration over its entire span. Therefore, recalibration is not necessary after
the cable length is changed. The calibration data is stored in the R&S FSH memory. Thus, the
calibration is valid after the operating mode is changed or after the instrument is switched off. For a
calibration to remain valid, the instrument temperature must not deviate more than 5°C. If the
temperature deviates more than this amount, the R&S FSH shows a red dot in front of the • DTF
display . A new calibration is then necessary.
Unscrew the short from the measurement cable.
Screw the cable under test to the measurement cable.
The R&S FSH displays the return loss produced in the cable under test versus the distance.
The R&S FSH can also list any cable faults. It displays the return loss and distance from the
measurement plane of all reflections that exceed a definable threshold.
Press the LIST VIEW softkey.
The R&S FSH opens the threshold value entry box and
also displays the threshold as a horizontal line across
the measurement diagram.
Set the threshold using the cursor keys (5 dB steps),
the rotary knob (1 dB steps) or the numeric keys.
Press the ENTER key or the LIST VIEW softkey
again.
The R&S FSH displays a table listing all the return
losses that are above the threshold, sorted according
to distance from the measurement plane.
To close the list and to return to the graphical
display mode, press the EXIT softkey.
The distance to the cable faults or the distance between any two faults can also be read out with the
marker.
1145.5973.12 2.17 E-14
Page 83

Measurements on CW Signals R&S FSH
Press the MARKER key.
The R&S FSH opens the marker menu and places the
distance marker on the largest return loss. The marker
readout provides the distance of the reflection from the
measurement plane in meters and its return loss.
Change the distance marker by entering a number,
adjusting the rotary knob (pixel by pixel) or by using
the cursor keys (step = 10 % of the span).
For higher fault resolution, the R&S FSH offers a zoom function in the position of the marker. The x axis
of the display can be extended up to a span of 3 m.
Press the MARKER MODE softkey.
Using the rotary knob or the cursor keys, select
ZOOM ON from the menu.
Confirm with the ENTER key.
The entry field for the zoom factor is displayed while
the R&S FSH simultaneously expands the x axis by a
factor of 2.
Using the rotary knob or the cursor keys, set the
zoom factor to the value you want.
The screenshot on the right shows that the fault of the
measured cable consists of two transitions. A coupling
of approx. 7 cm in length was used to connect two
cables.
Disable the zoom function as follows:
Press the MARKER MODE softkey in the MARKER menu.
Using the rotary knob or the cursor keys, select ZOOM OFF from the menu.
Confirm by pressing the ENTER key or by pressing the MARKER MODE softkey again.
Checking the return loss of the cable under test:
Press the MEAS MODE softkey.
Select REFLECTION using the rotary knob or the cursor keys.
Confirm by pressing the MEAS MODE softkey again or by pressing the ENTER key.
1145.5973.12 2.18 E-14
Page 84

R&S FSH Measurements on CW Signals
The R&S FSH measures the return loss over the span
that has been selected for the distance-to-fault cable
measurement.
To indicate that the R&S FSH is measuring return loss,
DTF refl. cal is displayed in the upper right-hand
corner of the screen.
Checking the spectrum in the span for detecting external interferers:
Press the MEAS MODE softkey.
Using the rotary knob or cursor keys, select SPECTRUM.
Confirm by pressing the MEAS MODE softkey again or by pressing the ENTER key.
The R&S FSH turns off the tracking generator and
displays the spectrum over the span of the DTF
measurement.
To indicate that the R&S FSH is in the spectrum mode,
DTF Spectrum is displayed in the upper right-hand
corner of the screen. Otherwise, the R&S FSH uses
exactly the same settings as it did for DTF
measurements.
1145.5973.12 2.19 E-14
Page 85

Operation in Receiver Mode R&S FSH
Operation in Receiver Mode
(Available only if the option R&S FSH-K3 is installed.)
To provide a means of measuring levels at a specific frequency, the R&S FSH offers the receiver mode
as an option (option R&S FSH-K3). With this option, the R&S FSH functions like a receiver that
measures the level at a predefined frequency.
Switching on the receiver mode:
Press the MEAS key.
Press the MEASURE softkey.
The menu for measurement functions opens.
Using the rotary knob or the cursor keys, select
RECEIVER from the menu and confirm with the
ENTER key or the MEASURE softkey.
The R&S FSH activates the receiver mode and measures the level at the specified frequency.
The most important settings for the measurement
parameters are provided directly in the main menu of
the receiver mode, or they can be entered using the
corresponding keys.
Setting the frequency:
Press the FREQ softkey in the main menu of the receiver mode.
Using the rotary knob or the cursor keys, adjust the frequency, or, using the numeric keys, enter a
new frequency and confirm the entry with the ENTER key.
You can also enter the frequency by using the FREQ key.
1145.5973.12 2.20 E-14
Page 86

R&S FSH Operation in Receiver Mode
Selecting the frequency step size:
The frequency resolution in the receiver mode is 100 Hz. The tuned step size can be changed as
required for the application
Press the FREQ key.
Press the FREQ STEPSIZE softkey.
Set the required step size in the selection table.
Confirm with the ENTER key.
You can set any step size you want by using MANUAL....
To do so, select MANUAL... for the step size in the selection table.
Using the rotary knob or cursor keys, change the tuned step size and confirm with the ENTER key,
or, using the numeric keypad, manually enter a step size and confirm by pressing the units key.
Tuning the frequency in channel grids:
As an alternative to entering the frequency, the R&S FSH can also be tuned in channels. The channel
tables that the R&S FSH uses to set channel frequencies are defined either by using the R&S FSH
View software or by directly entering the first channel number, the associated frequency, the number of
channels and the channel spacing.
Press the FREQ key.
Press the CHANNEL MODE softkey.
The R&S FSH now uses the active channel table. The FREQ softkey for frequency entry is renamed to
CHANNEL for channel entry, and the R&S FSH displays the channel number rather than the frequency.
The channel numbers are now used to tune the frequency.
Selecting a channel table that was predefined using R&S FSH View:
If the channel display is active (CHANNEL MODE
softkey active in the FREQ menu), press the
CHANNEL TABLE softkey.
The R&S FSH will display the stored channel tables.
Using the rotary knob or cursor keys, select the
channel table you want.
To activate the channel table, press the SELECT
softkey.
1145.5973.12 2.21 E-14
Page 87

Operation in Receiver Mode R&S FSH
Direct entry of a channel table:
If the channel display is active (CHANNEL MODE softkey active in the FREQ menu), press the
CHANNEL TABLE softkey.
Press the SELECT USER TAB softkey.
The R&S FSH will use the last channel table that was entered directly.
Press the DEFINE USER TAB softkey.
The R&S FSH will open the submenu for defining the
channel table.
Press the DEFINE USER TAB softkey again.
Enter the number of the first channel and confirm with the ENTER key.
Press the DEFINE USER TAB softkey.
Using the rotary knob or the cursor keys, select 1ST CHANNEL FREQ... from the menu and confirm
with the ENTER key.
Enter the frequency for the first channel number.
Press the DEFINE USER TAB softkey.
Using the rotary knob or the cursor keys, select NO OF CHANNELS... from the menu and confirm
with the ENTER key.
Enter the number of channels and confirm with the ENTER key.
Press the DEFINE USER TAB softkey.
Using the rotary knob or the cursor keys, select CHANNEL SPACING... from the menu and confirm
with the ENTER key.
Enter the frequency spacing for the channels and confirm with the ENTER key.
Press the EXIT key to exit the menu for defining channel tables.
The R&S FSH will now show channel numbers rather than the frequency. It also shows the associated
frequency above Channel.
Selecting the reference level:
The reference level is the maximum level of the analog bar-graph display. It must be set such that the
level display is located within the bar-graph scale.
Press the REF LEVEL softkey in the main menu of the receiver mode (MEAS key). Or press the
AMPT key.
Using the rotary knob or cursor keys, change the reference level or, using the numeric keys, enter a
new reference level.
Confirm with the ENTER key.
1145.5973.12 2.22 E-14
Page 88

R&S FSH Operation in Receiver Mode
Selecting the bandwidth:
The receiver mode provides the same bandwidths as in analyzer operation. In addition, the three
bandwidths 200 Hz, 9 kHz and 120 kHz are available for EMI measurements in accordance with
CISPR16.
Press the BW key
Using the rotary knob or cursor keys, change the
bandwidth and confirm with the ENTER key, or,
using the numeric keypad, manually enter
bandwidth and confirm by pressing the units key.
For input of a CISPR bandwidth press the softkey
CISPR BW.
Using the rotary knob or cursor keys, change the bandwidth and confirm with the ENTER key, or,
using the numeric keypad, manually enter bandwidth and confirm by pressing the units key.
According to CISPR16 the bandwidth is connected to the frequency. The R&S FSH allows to couple the
bandwidth to the set frequency automatically:
Press the softkey AUTO CISPPR BW.
The R&S FSH uses the suitable bandwidth dependent on the set frequency.
Setting the detector:
The receiver mode of the R&S FSH offers a peak detector, average detector, RMS detector and quasipeak detector.
Set the detector either from the main menu of the receiver mode or by using the TRACE key.
Press the DETECTOR softkey in the main menu of
the receiver mode, or press first the TRACE key and
then the DETECTOR softkey
Using the rotary knob or cursor keys, select a
detector from the selection list.
Press the ENTER softkey.
Setting the measurement time:
The measurement time is the amount of time during which the R&S FSH collects measured values and
compiles them into a display result for the selected detector.
Press the MEAS TIME softkey in the main menu of the receiver mode, or press the SWEEP key.
Using the rotary knob or cursor keys, adjust the measurement time, or, using the numeric keys, enter
a new measurement time and confirm with the unit.
Note: If the quasi-peak detector is selected, the selected measurement time must be larger than
100 ms in order to ensure that fluctuating or pulse-like signals are measured correctly.
1145.5973.12 2.23 E-14
Page 89

Operation in Receiver Mode R&S FSH
Scanning in the receiver mode:
In the receiver mode, the R&S FSH can scan across a defined number of frequencies and graphically
display the results. It performs a measurement at each frequency for the defined measurement time.
Press the SPAN softkey.
Press the FREQ SCAN softkey.
The R&S FSH switches to the scan mode and displays the measurement levels at the individual
frequencies as vertical lines.
Press the SCAN START softkey.
Enter the start frequency for the scan.
Press the SCAN STOP softkey.
Enter the stop frequency for the scan.
Press the SCAN STEP softkey.
Enter the step size for the scan.
It is also possible to scan the frequencies of a channel table. This requires activating a channel table as
follows:
Press the FREQ softkey.
Press the CHANNEL MODE softkey.
The R&S FSH now performs a measurement at the frequencies of the channel table.
1145.5973.12 2.24 E-14
Page 90

R&S FSH Measuring the Carrier-to-Noise Ratio
Measuring the Carrier-to-Noise Ratio
(Available as of firmware version 8.0 or higher.)
The R&S FSH offers a carrier/noise measurement for measuring the ratio of carrier power to noise
power. It performs the measurement in two steps. First, the carrier power of a transmission channel is
measured or a reference power determined which is then used for C/N calculation. In the second step,
the R&S FSH measures the noise power of an unoccupied transmission channel and calculates the
ratio of carrier power to noise power.
Determining the carrier power (reference power or reference level)
The R&S FSH offers the carrier power measurement for three different types of modulation.
• Digital Tx
In the Digital Tx operating mode, the channel power of a reference channel is measured. This is
common with digitally modulated carriers where power is equally distributed, i.e. the carrier power is
independent of the modulation signal.
• Analog TV
In the Analog TV operating mode, the peak power of the vision carrier is measured. This is common
with amplitude-modulated TV signals.
• CW Tx
In the CW Tx operating mode, the power of an unmodulated carrier is measured.
• Manual entry of a reference power or a reference level
You can also enter a reference power or reference level manually. The R&S FSH then uses this
value for C/N calculation.
Noise power and C/N power ratio
For noise power measurements, the R&S FSH is set to an unoccupied transmission channel where it
measures the noise power in accordance with the selected channel bandwidth. If required, the
R&S FSH also displays the power ratio with reference to the noise power density of the transmission
channel (C/N
Activating the C/N measurement:
Press the MEAS key.
Press the MEASURE softkey.
The menu for measurement functions opens.
Using the rotary knob or the cursor keys, select
CARRIER / NOISE from the menu and confirm your
choice with the ENTER key or the MEASURE
softkey.
The R&S FSH activates the carrier/noise mode and
starts the carrier power measurement that was
selected last.
The major measurement parameter settings are
available directly in the main menu of the carrier/noise
measurement or can be entered using the appropriate
keys.
). C/N0= C/N + 10 lg(channel bandwidth/Hz)
0
1145.5973.12 2.25 E-14
Page 91

Measuring the Carrier-to-Noise Ratio R&S FSH
Reference power/reference level
To determine the reference, you need to enter the type of reference measurement, the reference
channel and the channel bandwidth of the reference channel.
Selecting the reference measurement:
Press the SELECT MEASURE softkey.
Using the rotary knob or the cursor keys, select the desired measurement method to determine
the reference carrier power (Digital Tx, Analog TV or CW Tx) and confirm your choice with the
ENTER key or the F1 softkey.
The R&S FSH measures the reference in accordance with the selected modulation method.
Selecting the reference channel:
Press the REF MEASURE softkey.
Using the rotary knob or the cursor keys, select the desired entry (Channel, Vision Carrier Freq,
Center Freq or 8VSB Pilot Freq) and confirm your choice with the ENTER key or the F4 softkey.
You can alternatively also enter the channel center frequency after pressing the FREQ function key.
The R&S FSH measures the reference in the selected transmission channel.
Entering the channel bandwidth of the reference channel:
If the reference measurement is active, press the CHANNEL BW softkey.
Enter the desired value and terminate the entry with the appropriate unit key.
The R&S FSH sets the span in accordance with the selected bandwidth.
The channel center frequency is calculated when the vision carrier frequency is entered.
Selecting the reference unit:
Press the LEVEL softkey.
Using the rotary knob or the cursor keys, select the desired entry (dBm, dBmV or dBQV) and
confirm your choice with the ENTER key or the F2 softkey.
The measurement result of the reference measurement is displayed in the selected unit.
Manual reference entry:
Press the REF MEASURE softkey.
Using the rotary knob or the cursor keys, select MAN REF POWER/LEVEL and confirm with the
ENTER key or the REF MEASURE softkey.
Enter the desired reference value in the selected reference unit by means of the numeric
keypad and terminate the entry with one of the unit keys.
Automatic levelling:
If the reference measurement is active, press the LEVEL softkey.
Using the rotary knob or the cursor keys, select LEVEL ADJUST and confirm your choice with
the ENTER key or the F2 softkey.
Depending on the input signal, the R&S FSH is optimally levelled.
1145.5973.12 2.26 E-14
Page 92

R&S FSH Measuring the Carrier-to-Noise Ratio
Measuring the noise power
Enter an unoccupied transmission channel and its channel bandwidth to determine the noise power.
Selecting the result display:
Press the SELECT MEASURE softkey.
Using the rotary knob or the cursor keys, select the desired result display (C/N or C/N
confirm your choice with the ENTER key or the F1 softkey.
The R&S FSH outputs the power ratio according to the selected result display.
Selecting the unoccupied transmission channel:
Press the NOISE MEASURE softkey.
Using the rotary knob or the cursor keys, select the desired entry (Channel, Vision Carrier Freq,
Center Freq or 8VSB Pilot Freq) and confirm your choice with the ENTER key or the F5 softkey.
You can alternatively also enter the channel center frequency after pressing the FREQ function key.
The R&S FSH measures the noise power in the selected transmission channel.
Entering the channel bandwidth of the noise channel:
If the noise power measurement is active, press the CHANNEL BW softkey.
Enter the desired value and terminate the entry with the appropriate unit key.
The R&S FSH sets the span in accordance with the selected bandwidth.
The channel center frequency is calculated when the vision carrier frequency is entered.
Automatic levelling:
If the noise power measurement is active, press the LEVEL softkey.
Using the rotary knob or the cursor keys, select LEVEL ADJUST and confirm your choice with
the ENTER key or the F2 softkey.
) and
0
Depending on the input signal, the R&S FSH is optimally levelled.
Blanking out the result display:
The C/N ratio or the reference is indicated at the bottom of the display. This insertion can be
deactivated.
Press the NOISE MEASURE or REF MEASURE softkey.
Using the rotary knob or the cursor keys, select DISPLAY OFF and confirm your choice with the
ENTER key or the F4 or F5 softkey.
The R&S FSH blanks out the result display.
Inserting the result display:
Press the NOISE MEASURE or REF MEASURE softkey.
Using the rotary knob or the cursor keys, select DISPLAY ON and confirm your choice with the
ENTER key or the F4 or F5 softkey.
The R&S FSH inserts the result display at the bottom of the display.
1145.5973.12 2.27 E-14
Page 93

Saving and Recalling Settings and Test Results R&S FSH
Saving and Recalling Settings and Test Results
Instrument settings and results can be saved to the R&S FSH’s internal CMOS RAM. Results and
settings are always stored together, allowing them to be interpreted in context when recalled. The
R&S FSH can store a maximum of 100 data sets, each with a unique name.
Saving Measurement Results
Press the SAVE / PRINT key.
Press the SAVE softkey.
An input box opens and you will be prompted to enter
a name for the data set to be saved.
The name for the most recently stored data set is
suggested in the 'Name:' entry box, which is
highlighted in red. When you press the ENTER key or
the SAVE softkey a second time, the data set is saved
under the suggested name.
By pressing the BACK key, you can instruct the R&S FSH to browse through the list of names of the
data sets already stored and display them with the first available free extension. Thus, the name of the
data set recalled for a specific measurement can be selected for storing the measurement data.
A new name can be entered via the numeric keypad. The numeric keypad has the same letter
assignment as mobile phone keypads. Enter the letter above the key by pressing the key the
appropriate number of times.
The number of free memory locations is also displayed.
Enter a name for the data set using the numeric keypad.
Confirm with ENTER.
The data set is saved to the R&S FSH’s internal memory under the specified name.
The name of an existing data set can be edited with the cursor keys. It is therefore not necessary to
fully enter the name of a new data set.
Press the SAVE key.
The R&S FSH suggests a name for the data set to be saved.
Press a cursor key ( or ).
A vertical cursor is positioned at the end of the name
for the data set.
Use the key to move the cursor to the left.
1145.5973.12 2.28 E-14
Page 94

R&S FSH Saving and Recalling Settings and Test Results
Use the key to move the cursor to the right.
Insert a new letter or number at the cursor position using the alphanumeric keypad.
Press the BACK key to delete the letter or digit to the left of the cursor.
Saving Calibration Data
When performing scalar transmission or return loss measurements, the R&S FSH can store the
calibration data along with the settings and results. Saving the settings and results with calibration data
requires twice as much memory space as without it. This, of course, reduces the maximum number of
data sets that can be saved. With the R&S FSH6 and R&S FSH3 model 23 (from serial number
102314), you can now also save the calibration data for the vector measurement of the transmission or
of the reflection.
In the default state, calibration data storage is disabled.
Press the SETUP key.
Press the GENERAL softkey.
Select SAVE CAL DATA... and confirm by pressing
the ENTER key or the GENERAL softkey.
Using the rotary knob or the cursor keys, select ON
or OFF.
Confirm with ENTER.
The state for calibration data saving is entered in the SETUP menu.
When recalling data sets with stored calibration data, the R&S FSH checks whether the current
instrument temperature corresponds to the instrument temperature at the time the data was stored. If it
deviates more than 5°C, the R&S FSH displays a red dot in front of the • Transmission or • Reflection
display. Recalibration is then necessary.
1145.5973.12 2.29 E-14
Page 95

Saving and Recalling Settings and Test Results R&S FSH
Recalling Measurement Results
Use the R&S FSH’s recall function to review previously saved measurement results and settings.
Press the SAVE / PRINT key.
Press the RECALL softkey.
A list of all saved data sets opens. The red selection
bar marks the last data set to be saved.
Select a data set from the list using the rotary knob.
Confirm your selection by pressing the RECALL
softkey.
The selected data set is displayed on the screen, but
the R&S FSH is not set to the settings in the data set.
You can now check the data set before its settings are
activated.
The name of the selected data set is displayed at the
lower left-hand corner of the screen.
Using the rotary knob or the cursor keys, you can scroll
through all the available data sets. The settings and
results for each data set are displayed.
You now have the following options:
Press the STATUS key to see all the instrument
settings in the selected data set. When you press
the STATUS key again, the R&S FSH returns to the
graphical display.
Press the ACTIVATE softkey to load the data set.
Press the EXIT softkey to display the list of data sets
again. Press EXIT a second time and the R&S FSH
returns to its previous settings without loading a data
set.
Press SCREEN->PRINTER to send the displayed
data set to a printer.
Pressing the ACTIVATE softkey transfers the stored trace to the R&S FSH's trace memory. The current
trace can be compared with the stored one by switching on the trace memory.
Press the TRACE key.
Press the SHOW MEMORY softkey.
The R&S FSH displays the stored trace in white and the current trace in yellow.
Note: The trace is in the R&S FSH's trace memory. The level and frequency values are
displayed correctly only if neither the instrument's frequency setting nor its level setting
have been changed.
1145.5973.12 2.30 E-14
Page 96

R&S FSH Printing Out Measurement Results
Printing Out Measurement Results
The R&S FSH can send screenshots to a printer equipped with a serial interface. The type of printer
and the baud rate of the serial interface can be defined in the setup menu (SETUP key) by using the
GENERAL softkey and selecting 'PRINTER BAUD...' and 'PRINTER TYPE...' from the menu. For
printers with a parallel interface, a serial/parallel converter (R&S FSH-Z22) is available.
Printer with serial interface:
Connect the printer to the optical interface using the RS-232-C optical interface cable R&S FSH-Z34.
Printer with parallel interface:
Connect the RS-232-C optical interface cable to the Serial/Parallel Converter R&S FSH-Z22.
Connect the R&S FSH-Z22 parallel interface to the printer.
Switch on the Serial/Parallel Converter R&S FSH-Z22
Operating the R&S FSH:
Press the SAVE / PRINT key.
The SAVE/PRINT menu with the option for printing out
a screenshot to a printer opens.
Press the SCREEN->PRINTER softkey.
The R&S FSH starts printing out the screenshot to a
printer.
1145.5973.12 2.31 E-14
Page 97

R&S FSH Screen Layout
3 Operation
Screen Layout
Screen layout for spectrum-mode measurements without markers
Detector
display
Reference
level display
Trace mode
display
Trigger
display
Parameter
uncoupled
Display of
resolution bandwidth (RBW),
video bandwidth (VBW) and
sweep time (SWT)
Invalid-trace symbol
Level-axis
scale
X-axis scale
Status
message
Battery charge-level
indicator
Grid
Trace
Value entry box
Softkey labelling
1145.5973.12 3.1 E-14
Page 98

Screen Layout R&S FSH
Screen layout when the marker mode is selected
Marker-value
readout
Display:
Setting not coupled
Marker
Delta marker
Selected
menu item
Softkey menu
Softkey function on
Softkey activated
for entry
The colour of the softkey labelling and its background indicate the status of the softkey function in
question:
Softkey colour Meaning
Blue background, white labelling Softkey function is turned off
Blue background, grey labelling In the current setting, this softkey function is not available
Green background Softkey function is turned on
Red background Softkey function has been activated for value entry or selecting a menu
function
1145.5973.12 3.2 E-14
Page 99

R&S FSH Entering Measurement Parameters
Entering Measurement Parameters
Settings and texts are entered either by directly calling the functions or by entering values, units or texts
separately. The R&S FSH has a variety of operating modes.
Alphanumeric
Rotary knob
keypad
Unit keys
BACK key
CANCEL key
ENTER key
Cursor keys
Entering values and texts
Values are entered using the number keys (0 to 9), the decimal point key (.) and the minus key (-) in the
alphanumeric keypad. The alphanumeric keypad is also used to enter letters, e.g. file names for data
sets. If the R&S FSH is expecting a letter entry, it automatically assigns the letters above the keys to the
keys in the alphanumeric keypad. The keys have multiple assignments. The letter you want is obtained
by pressing the key the appropriate number of times. The key assignments are listed below:
Key x1 x2 x3 x4 x5 x6 x7 x8 x9
1
2
3
4
5
6
7
8
9
-
0
.
1
a b c 2 A B C
d e f 3 D E F
g h i 4 G H I
j k l 5 J K L
m n o 6 M N O
p q r s 7 P Q R S
t u v 8 T U V
w x y z 9 W X Y Z
-
0 SPC
_
.
You can delete any letter or digit you have entered with the BACK key. Pressing the BACK key deletes
the last keystroke that has been entered. Complete entries can be cancelled with the CANCEL key.
Values can also be entered with the rotary knob or the cursor keys. The entry is changed in steps and
the R&S FSH immediately sets the appropriate entry parameter.
1145.5973.12 3.3 E-14
Page 100

Entering Measurement Parameters R&S FSH
Entering units
To enter a unit for a value entry, terminate the entry with a unit key. Use the unit keys down the righthand side of the alphanumeric keypad. These keys have multiple assignments which depend on the
unit entry expected by the R&S FSH.
GHz, -dBm, V, s
MHz, dBm, dBmV, mV, ms
kHz, dBHV, HV, Hs
kHz, nV, ns
The relative unit dB can be entered with any of the unit keys.
1145.5973.12 3.4 E-14
 Loading...