

Page 1

Trusted
TM
AN-T80020
Application Note
Diagnostics Procedure
This document provides:
• A procedure for first-line diagnostics
This explains how to gather the appropriate data for each situation. It is easy to lose evidence after a
module or system failure. This procedure explains how to collect the evidence to give to a support
engineer, who can use the rest of this document to diagnose the problem.
• Details of all error codes produced by the I/O modules
For I/O module faults, the first-line diagnostics will usually provide a fault code. This section explains
the fault that has been found and advises on a course of action.
• A guide to the Analysis Tool
The Analysis Tool is a program which helps with the collection and analysis of diagnostic data from the
system. It includes advice on all the error codes and will warn about problems found on the system.
For technical support email: support@icstriplex.com
Issue Record
Issue
Number
6 March
7 May 09 Nick Owens Pete Stock Gerry Creech Added action on processor
8 July 09 Nick Owens Andy Holgate Pete Stock Revised Analysis Tool manual
9 Jan 10 Nick Owens Andy Holgate Pete Stock Revised Analysis Tool manual
10 May 10 Nick Owens Andy Holgate Pete Stock Analysis Tool v3.6 manual
11 Oct 10 Nick Owens Andy Holgate Pete Stock Analysis Tool v4.0 manual
12 Feb 11 Nick Owens Andy Holgate Pete Stock Analysis Tool v4.1 manual
Date Revised by Technical
Check
Nick Owens Pete Stock Gerry Creech Derived from 552936 rev 05.
09
Authorised
by
Modification
Fault codes revised, converted
to AN, advice rewritten.
shutdown
Issue 12 Feb 11 AN-T80020 1
Page 2

Trusted
TM
AN-T80020 Diagnostics Procedure
Diagnostics Procedure
Table of Contents
Diagnostics Procedure..............................................................................................................................2
Table of Contents...................................................................................................................................2
First-line Diagnostics ................................................................................................................................4
Toolset Diagnostics ..................................................................................................................................7
Other data on Equipment Definitions ...................................................................................................11
Analysis Tool ..........................................................................................................................................12
Online...................................................................................................................................................13
Online Options...................................................................................................................................15
‘Set the time/date’..............................................................................................................................15
‘Auto set time/date’ ............................................................................................................................16
‘I/O Module Options’ ..........................................................................................................................16
‘Analyse Data’....................................................................................................................................17
System Graphic / Online Tree Window .............................................................................................18
Manual Command Entry....................................................................................................................19
Offline...................................................................................................................................................20
File Menu...........................................................................................................................................21
View Menu.........................................................................................................................................21
Log View............................................................................................................................................21
Log View............................................................................................................................................22
Find Menu..........................................................................................................................................22
Analysis View.....................................................................................................................................22
Bookmarks ........................................................................................................................................25
Module Versions................................................................................................................................29
System Health ...................................................................................................................................30
Bookmarks ........................................................................................................................................31
Main Processor System Logs .................................................................................................................32
Clearing the MP Non-Volatile RAM (NVRAM) Memory ..........................................................................35
GALPAT errors (TN20014)................................................................................................................35
Processor build 122 and System.INI changes (TN20061) ................................................................35
Clearing the non-volatile RAM...........................................................................................................35
Action on Processor Shutdown...............................................................................................................36
Normal Shutdown Action ...................................................................................................................36
Processor LED States..........................................................................................................................36
Toolset Debugger Messages ...............................................................................................................36
Processor System Event Logs .............................................................................................................37
Issue 12 Feb 11 AN-T80020 2
Page 3

Trusted
TM
AN-T80020 Diagnostics Procedure
Please do NOT send:...........................................................................................................................37
APPENDIX A. ERROR CODE DESCRIPTIONS....................................................................................38
Glossary...............................................................................................................................................39
0x0000 Series Codes (Firmware and System) ....................................................................................41
0x1000 Series Codes (Host Interface Unit) .........................................................................................43
0x2000 Series Codes (Host Interface ASIC) .......................................................................................46
0x3000 Series Codes (Field Interface ASIC) .......................................................................................48
0x4000 Series Codes (Module firmware operation).............................................................................49
0x5000 Series Codes (Input Field Interface Unit) ................................................................................50
0x6000 Series Codes (Output Field Interface Unit) .............................................................................55
0x7000 Series Codes (Processor generated) ......................................................................................65
0x8000 Series Codes (General non-resettable) ..................................................................................68
0x9000 Series Codes (Host Interface Unit non-resettable) .................................................................69
0xC000 Series Codes (Module firmware non-resettable) ....................................................................69
Self Test Cycle Times.............................................................................................................................70
Issue 12 Feb 11 AN-T80020 3
Page 4

Trusted
TM
AN-T80020 Diagnostics Procedure
First-line Diagnostics
Every day, check the processor’s System Healthy LED. If this is green, there are no system faults.
There may still be communications problems and field wiring problems.
If the System Healthy LED is flashing red, there is a system fault. Look at the other diagnostic LEDs in
the table on the next few pages.
Each module has ‘Healthy’ LEDs, one for each slice of the module’s circuitry. The Communications
Interfaces (8151 or 8151B) are not triplicated and so only have one LED.
Do not press the main processor reset pushbutton or remove and reinsert a module unless specifically
advised to do so in the procedures below. Pressing the reset pushbutton may clear important
diagnostic information. Removing and reinserting a module may cause shutdowns and will also clear
some fault information.
Keep a logbook for recording error codes from I/O modules. Record the error code, module position
(chassis and slot or reference number), date and time. If the advice in this document for that error code
is to act only if it is persistent (returns later after pressing Reset), use the logbook to look for earlier
records of the same fault.
LED colour Reason Procedure
Processor
'Healthy'
LEDs are
red
Processor
'Educated'
LED is not
steady
green
Active
Processor
'Run' light
is not
flashing
green
Processor
'Inhibit'
LED is
flashing
green
Processor
module fault.
No application The Standby Processor takes a few minutes to synchronise with the
Application not
running
The processor
cannot be hot
swapped
Collect the processor’s current system log. The procedure is
described in a section below.
Obtain a replacement processor module of the same or later build.
Swap to the replacement module.
If the fault appeared after the processor was restarted, it is likely that
a memory corruption has occurred because the education process
had not completed. Refer to TN20014.
Active Processor. It should not be removed during this time. If it has,
memory corruption may occur. Refer to TN20014.
The Active Processor may have no application loaded.
The Standby Processor may not have started or completed its
education from the Active processor.
The 'Run' light is always steady green on the Standby processor.
The Active processor should show a flashing green 'Run' LED.
The 'Run' LED is off when the application in the Active processor is
stopped.
If the ‘Run’ LED has stopped when it should not have, then the
system has detected a fault of some kind. This should be reported to
ICS Triplex Technology. Refer to the section below describing Action
on Processor Shutdown. This describes how to collect diagnostic
information which may be lost during attempts to restart.
The 'Inhibit' LED flashes green when any input or output is locked, as
a warning. This LED also flashes green when the current Standby
Processor has an incompatible system configuration. A changeover
from the Active to the Standby processor will not work if the Inhibit
LED is flashing. To enable a swap in this second case, remove and
reinsert the Standby processor to load the system configuration.
Issue 12 Feb 11 AN-T80020 4
Page 5

Trusted
TM
AN-T80020 Diagnostics Procedure
LED colour Reason Procedure
rocessor
P
'System
Healthy'
LED is not
steady
green
Processor
‘Healthy’
LEDs all
steady
green,
System
Healthy
LED
flashing
red, all
other LEDs
off
Comms
Interface
'Healthy'
LED is not
steady
green
System
shut down
when it
should not
have done
here is a
T
system fault
Processor kernel
fault
Communications
interface fault
Further
investigation
needed
he 'System Healthy' LED is steady green when the complete system
T
is healthy. The LED flashes red when there is a fault in the system, or
the processor is not yet initialised.
A fault in the system may be any of a long list of possibilities, but the
processor current log will always show the reason.
Collect the processor’s current system log. The procedure is
described in a section below.
Note that some faults may not show any other LED indication.
The processor’s foundation operating system has stopped the
processor because of a firmware error. The processor is no longer
running and will not communicate until it is restarted.
If you have just swapped processors, the old processor will always be
stopped using a watchdog timeout kernel fault; in this case remove
the old processor and do not worry.
If you had not swapped processors, this is a serious error and should
be reported to ICS Triplex Technology. Refer to the section below
describing Action on Processor Shutdown. This describes how to
collect diagnostic information which may be lost during attempts to
restart.
If the 'Healthy' LED is flashing red, the module has halted. Remove
and refit the module. The module may have shut down when unable
to cope with a communications situation and may work properly next
time.
If it still fails, obtain a replacement module. Remove the existing
module and insert the replacement (they do not hot swap). The
replacement will automatically load its configuration. Return the faulty
module for repair.
Communications modules from hardware build C will store their
current event log on power loss as the backup log. The backup log
can be collected on the first restart (the procedure is described
below). This will explain the reason for the fault.
If the ‘Run’ LED is still flashing and there was no recent intervention,
check if the system has performed a shutdown that it was
programmed to do.
If an online update had just been loaded, and outputs were deenergised unexpectedly, refer to AN-80009 section 1.12. This
describes a problem with intelligent online updates with Toolset
versions up to and including build 103 (TUV release 3.5).
If the ‘Run’ LED has stopped when it should not have, then the
system has detected a fault of some kind. This should be reported to
ICS Triplex Technology. Refer to the section below describing Action
on Processor Shutdown. This describes how to collect diagnostic
information which may be lost during attempts to restart.
Issue 12 Feb 11 AN-T80020 5
Page 6

Trusted
TM
AN-T80020 Diagnostics Procedure
LED colour Reason Procedure
comms
A
interface
port is not
showing
LED
activity
Expander
Interface
module
'Healthy'
LED not
steady
green
Expander
Processor
module
'Healthy'
LED not
steady
green
o comms Serial ports should be flickering red/green or yellow if active.
N
Ethernet ports should be flickering red/green or yellow if active and
steady green or off when inactive.
Flickering red or green only indicates one way communications. Red
is transmit, green is receive.
If communications has previously been successfully commissioned,
check the communications path for cable faults etc. Refer to the
8151B Communications Module PD for information on
communications module settings.
Module fault Obtain a replacement module. Swap to the replacement module.
Return the faulty module for repair.
A table of further diagnostics is given in PD-8311.
Module fault Obtain a replacement module. Swap to the replacement module.
Return the faulty module for repair.
A table of further diagnostics is given in PD-8310.
Expander
Processor
Tx/Rx
LEDs not
flickering
yellow
I/O module
'Healthy'
LED
flashing
red
I/O module
'Healthy'
LED
steady red
I/O module
Channel
LEDs are
not off or
steady
green
No comms These three LEDs monitor the communications on the three cables
from the Expander Interface. Note that no communications will be
shown whilst the Expander Processor is in Standby, the Expander
Interface is not operating or the system is starting up. If one
communications link LED is off, check the cable and connections for
that link.
A fault has been
detected on the
slice but the
slice is still
operating
A slice of the
triplicated
module has
been set offline
and has been
disconnected.
Field fault Channel LED settings are system specific and may be configured in
Collect the error code using the Toolset debugger, as described in a
section below. Look up the advice in the Error Code Descriptions
below. Note the fault code, module reference, date and time in a log
book and press Reset.
You cannot clear these faults or restart the slice by pressing Reset.
You cannot get any logs from this slice without restarting it.
Obtain a replacement module of the same or later build. Swap to the
replacement module. Remove the faulted module.
Insert the faulted module into an unused slot (one for which scanning
is not disabled in the system configuration, but which is not
connected to an I/O cable or hot-swap cable).
If the slice fails to start, return the faulty module for repair.
If the faulted slice starts, collect the I/O module log from that slice
(described in a section below). Read the end of the log for error
codes. Look up the advice in the Error Code Descriptions below.
the System Configuration. Check the meaning of the LED colour and
investigate the channel wiring.
Issue 12 Feb 11 AN-T80020 6
Page 7
Trusted
TM
AN-T80020 Diagnostics Procedure
Toolset Diagnostics
If you need to find an I/O module fault code, use the Toolset to access the data in the system. The
data also includes further data on the system, e.g. temperature, voltages, currents etc.
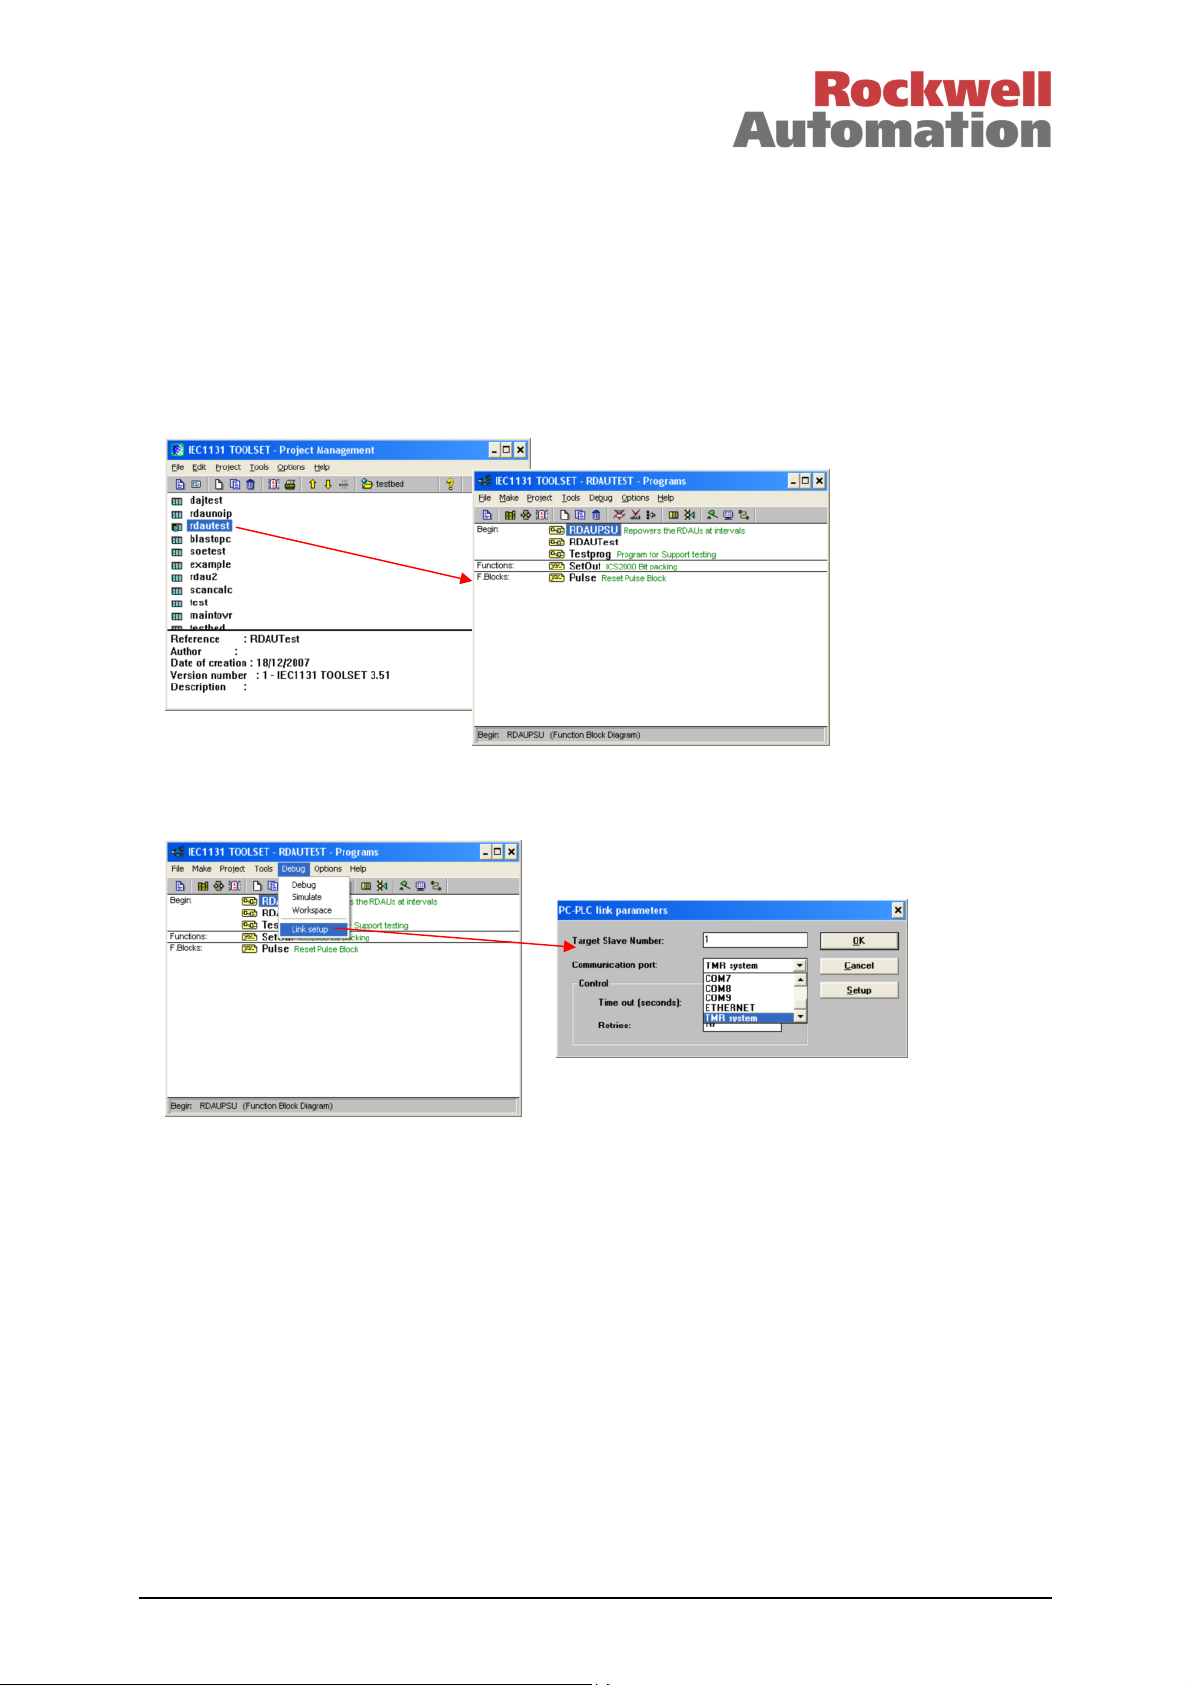
Open the Toolset, using either your desktop shortcut or the Start menu ( Start | All Programs | Trusted |
Toolset ).
Open the application running in the system by double-clicking on its name.
It is possible to connect to the system using either the processor’s front panel serial port or over
Ethernet via a communications interface. Before connecting to the system, check that the
communications port settings are correct. Select Debug | Link Setup.
If you are using a TC-304 maintenance cable to connect to the processor’s front panel serial port,
check that ‘Communication port:’ is set to COM1 (or whichever serial port you are using on the PC).
Check that the maintenance cable is plugged into the PC serial port and the processor’s front panel
port.
If you are using Ethernet, check that TMR System is selected. This option is at the bottom of the list
and you need to scroll down to see it. Click on Setup and check the IP address is set. Hopefully for
existing site systems, the communications settings will already be set up. Check that the system and
PC are connected to the Ethernet network with addresses on the same subnet.
Ensure the processor keyswitch is turned to ‘Maintain’ if using a Toolset before build 103. Toolsets
before build 103 will not communicate with the system if the keyswitch is in the ‘Run’ position. Toolsets
from build 103 will communicate read-only if the keyswitch is in the ‘Run’ position.
Issue 12 Feb 11 AN-T80020 7
Page 8
Trusted
TM
AN-T80020 Diagnostics Procedure
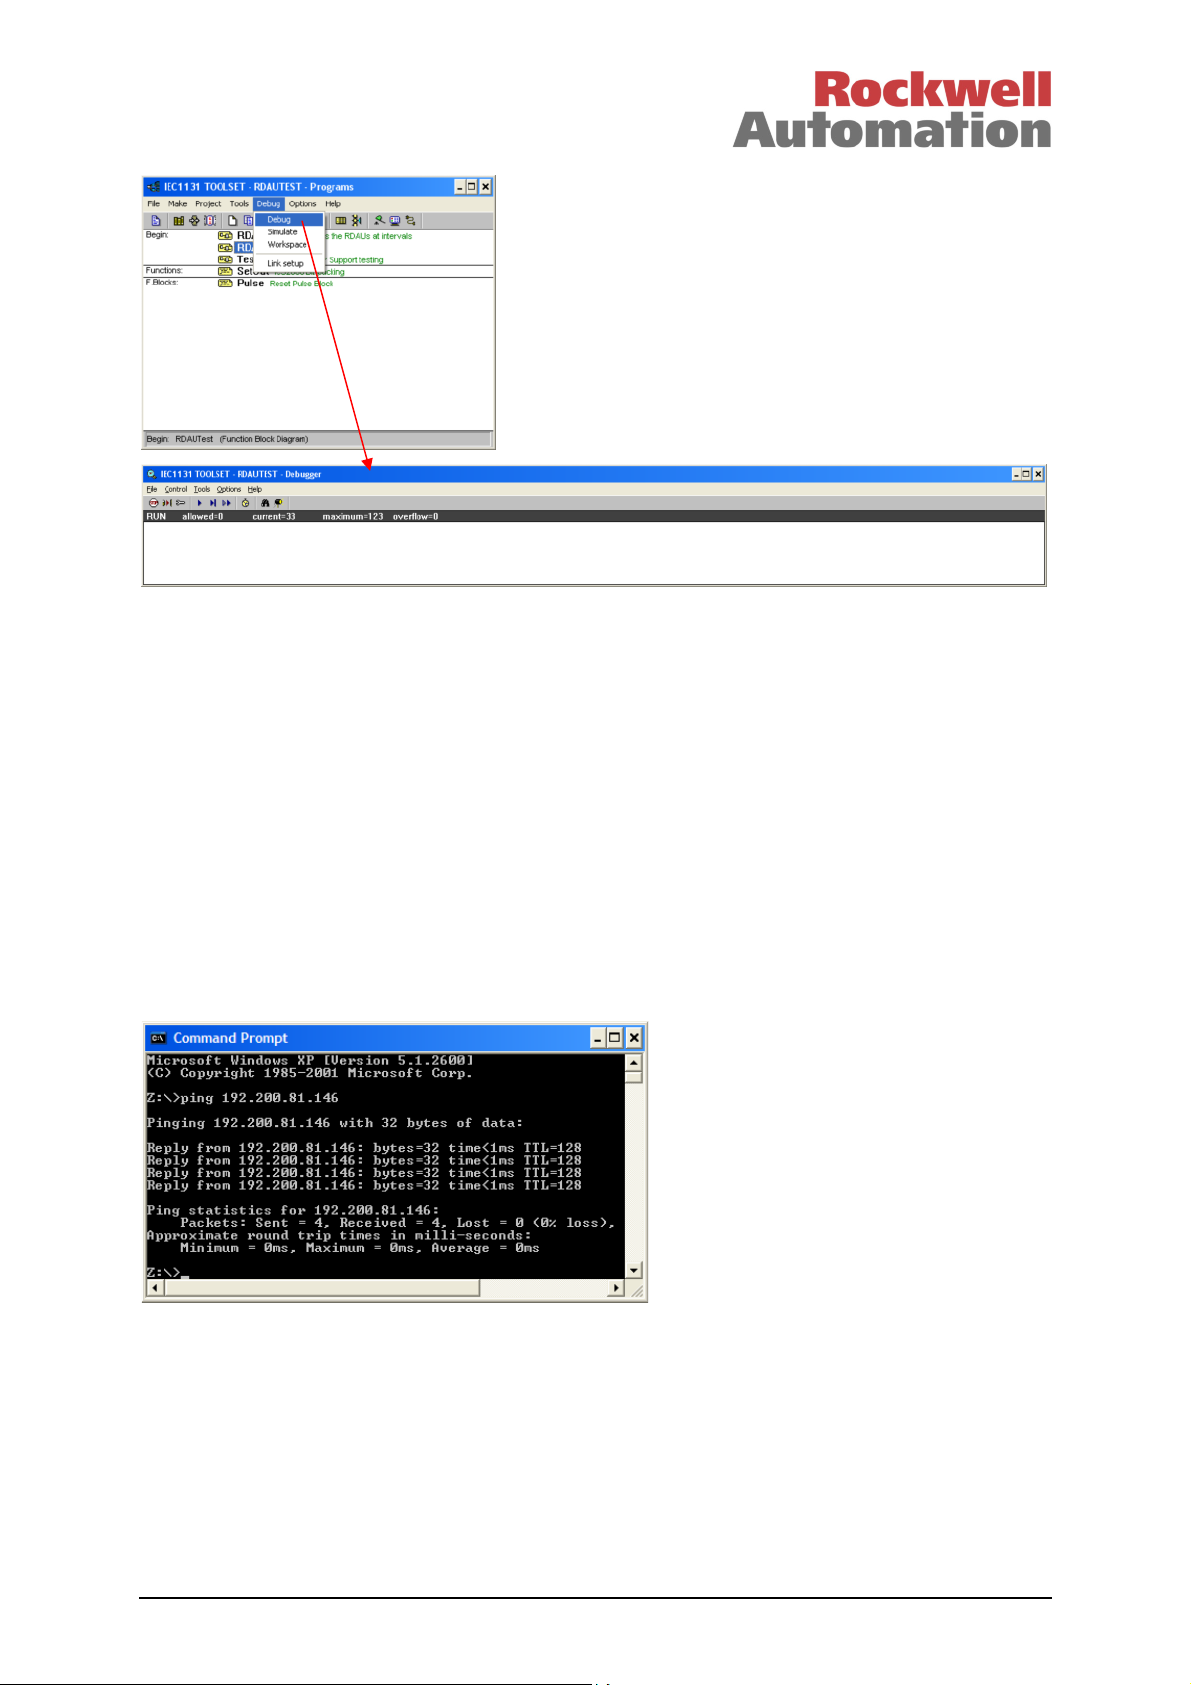
Select Debug | Debug. A long thin window entitled IEC1131 TOOLSET – (application) – Debugger
should appear. This will have a bold black line of text giving the state of the application. This window is
called the Debugger window and it is the key to all online controls. To disconnect from the system,
close this window and all other online windows will also close.
If the black line of text says RUN, you are connected to the system. Go on to the next page.
If the black line of text does not say RUN, and the system is clearly running (flashing ‘Run’ LED on the
processor), then there is likely to be a communications problem.
Using a serial port, you will see ‘Disconnected’. Check that the keyswitch is set to Maintain and the
maintenance cable is connected. Then try to connect again. Using Ethernet, the online session will
abort with the message ‘Cannot install the communication’. You will need to close down all Toolset
windows to reset this error.
Check the keyswitch position. Check that the Ethernet network is connected by sending a ‘ping’
command to the communications interface port using the following command (with the appropriate IP
address) in a command window. Then try to connect again.
Issue 12 Feb 11 AN-T80020 8
Page 9

Trusted
TM
AN-T80020 Diagnostics Procedure
You will see a window similar to the ‘Programs’ window, now called the ‘Debug Programs’ window. This
gives access to online diagnostics. You cannot close this window. To end an online session, close the
Debugger window.
Open the I/O connection table by clicking on the icon shown above or menu Project | I/O connection.
Each module in the system has an equipment definition. Imagine this as a marshalling terminal rail,
with several blocks of terminals. These terminals are shown as icons appearing like screws, in several
different terminal blocks called boards. Each board is used to send data to or from the module, and
some of it is useful for diagnostics.
Each equipment definition is described in the product description for the module. Note that equipment
definition ttmrp is the processor (see PD-T8110B) and tci is the communications interface (but there is
no data on the tci boards).
Each equipment definition is allocated to a chassis and slot position where the module is. Click on the
first board in the definition (for the 8403 shown, click on DI). At the top of the data on the right is the
chassis and slot position.
If you are looking for an error code, find the definition with the same chassis and slot number as the
faulty module. Then click on the HKEEPING board and scroll down to the last three channels. In the
example above, the module is healthy. All three slices are reporting a zero error code.
If any of the last three channels is not zero, note the number.
Issue 12 Feb 11 AN-T80020 9
Page 10
Trusted
TM
AN-T80020 Diagnostics Procedure
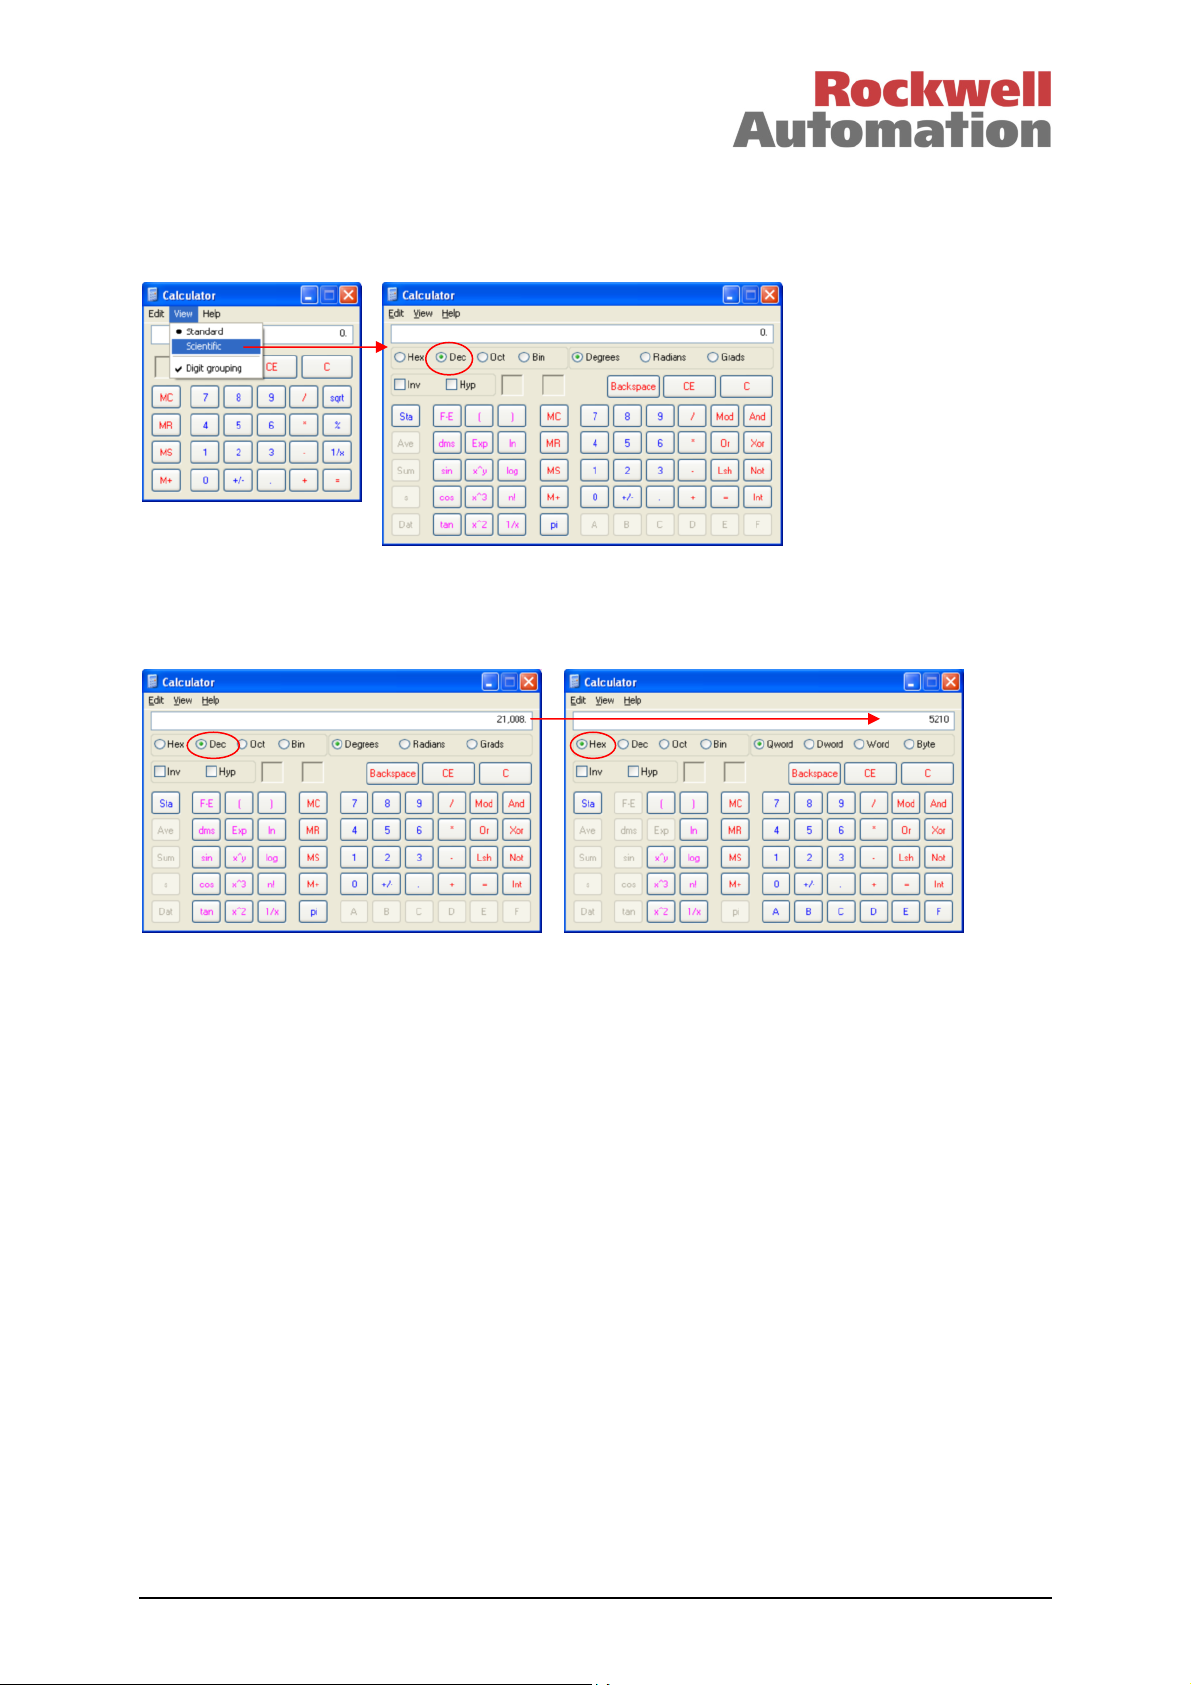
The error code number is shown in decimal (base 10). However, the codes are defined in hexadecimal
(base 16) and the number needs to be converted.
Open the Windows Calculator. Select the Scientific view (View | Scientific).
Select ‘Dec’ (decimal) as shown above. Type the error code number. Select ‘Hex’ (hexadecimal). The
calculator will convert the number.
Look up the hexadecimal number in the table in this manual. The error codes are listed in hexadecimal
number order, which is like decimal but has six extra digits: 0,1,2,3,4,5,6,7,8,9,A,B,C,D,E,F,10,11,...
In this case, 52?? Indicates an input channel fault. It is on channel 16, because 10 in hexadecimal is
16 in decimal.
Follow the advice given for the error code.
You can avoid having to convert the error code if an integer variable is wired to each channel, and its
format is set to 1A2B (four digit hexadecimal). The toolset will convert the value into hexadecimal for
you.
It is important to check for error codes before pressing the main processor reset pushbutton, because
pressing reset will clear all fault indications and fault filter counters. It is possible that a rare or slow
fault has occurred, due to a genuine problem, which may not occur again for some time.
Once you have collected all fault codes and noted them, you may press the processor Reset
pushbutton to clear them.
Issue 12 Feb 11 AN-T80020 10
Page 11

Trusted
TM
AN-T80020 Diagnostics Procedure
Other data on Equipment Definitions
All modules provide information on temperature, in many cases at several points throughout the
module. Note that these temperatures are ranged differently, e.g. on the processor 1°C = 10 counts,
but on the I/O modules, 1°C = 256 counts. The operating range of all native 8000 series modules
except the Gateway module which contains a PC104 computer) is –5 to 60°C. Since there is no fan
(
fail monitoring, there should be alarms set on overtemperature in the application.
There is also detailed information on internal voltages and currents at many points in each module,
measured in millivolts and milliamps. This covers both internal measurements and field I/O condition.
These should approximate to the stated voltage (e.g. 24V or 8V) or show that currents are shared
evenly and not overloaded.
There are channels left spare for condensation monitors. These are not used. The main processor
definition (TTMRP) gives some digital system status information including the number of locked
variables in the application, a variety of digital system alarms including the System Healthy LED state,
and the health of the active and standby processors.
Each I/O module definition provides details of the state and condition of each channel, with
discrepancy alarms for where the triplicated slices disagree on the state of an I/O point.
All of the above data may be connected to in the application and used for diagnostic alarms and
actions. The data is described in the Product Descriptions for each module.
Issue 12 Feb 11 AN-T80020 11
Page 12
Trusted
TM
AN-T80020 Diagnostics Procedure
Analysis Tool
This application can collect command line diagnostics online from a live system. It can analyse the
collected data and provide advice and reports. It can also analyse logs taken by the macro program
Dumptrux in the same way. It can erase the system logs.
The program installs itself by default into the same directory as the Toolset and other 8000 series
software. It also provides the option of a desktop icon and a Quick Launch icon.
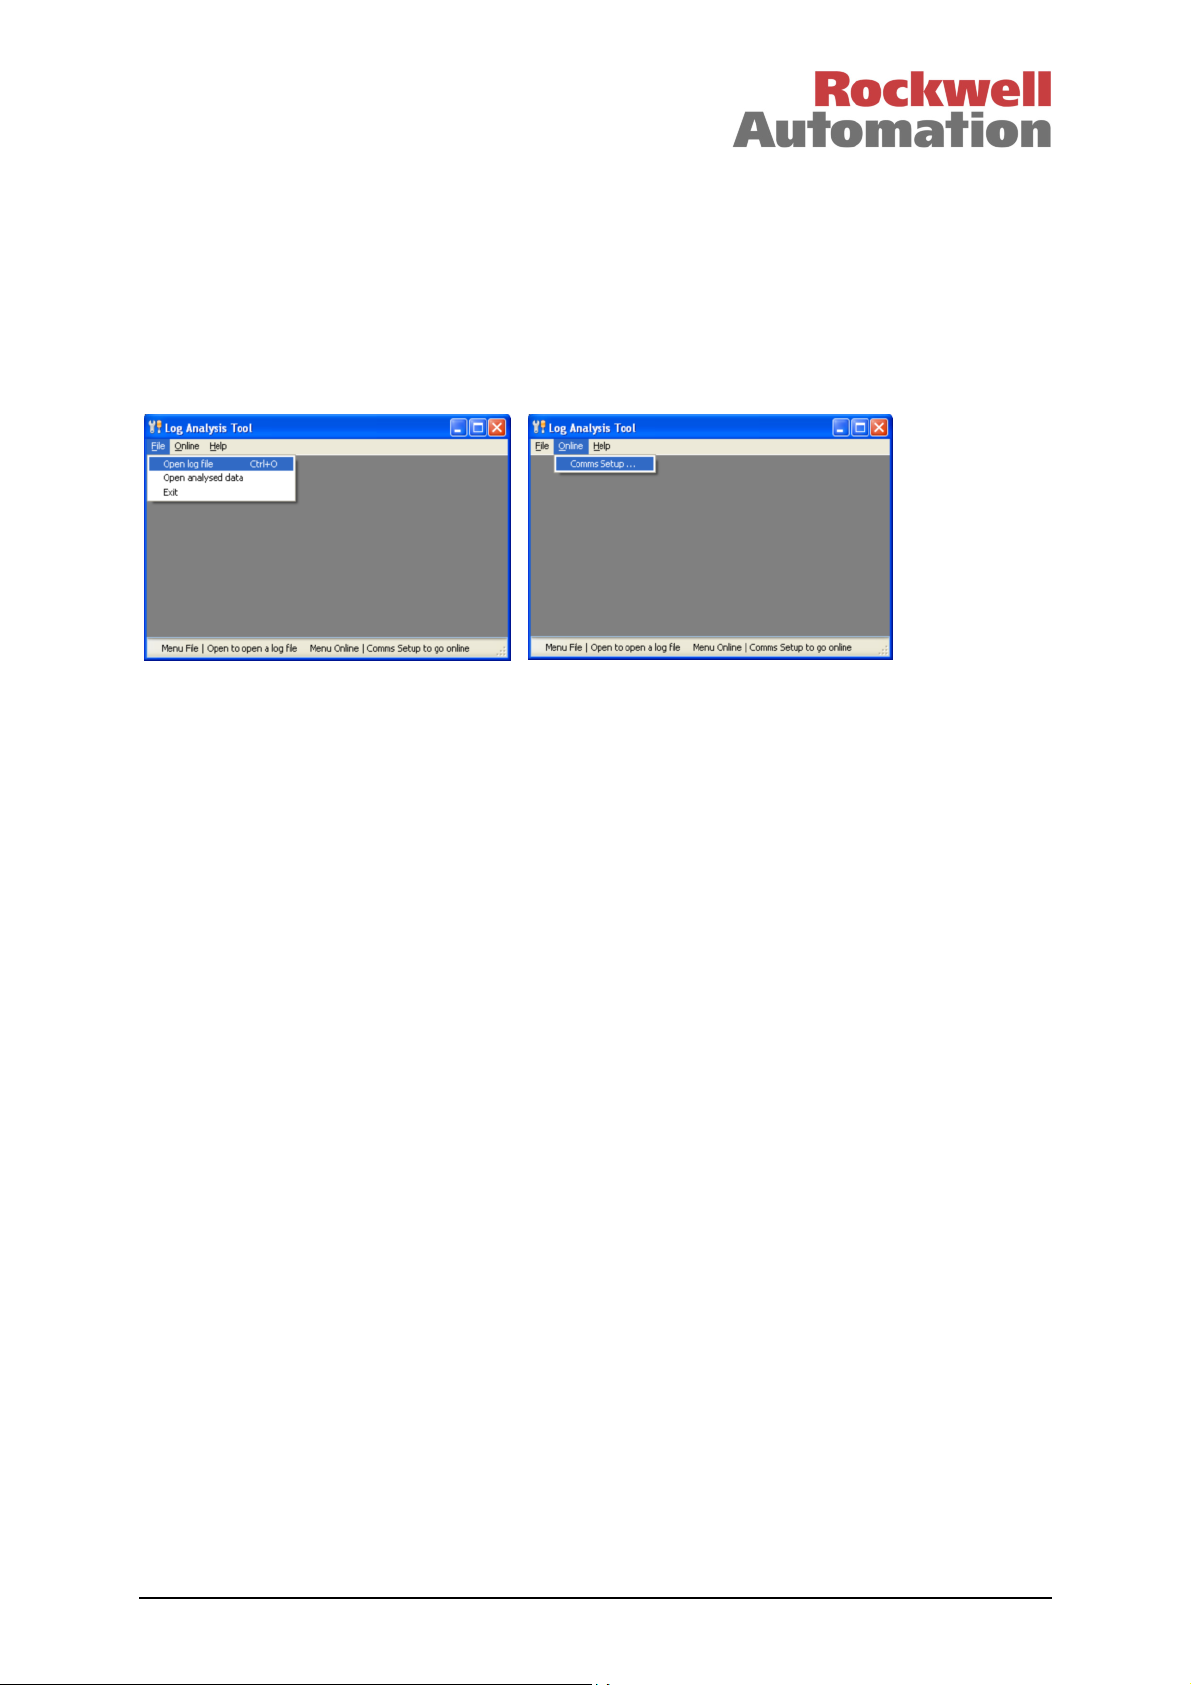
On opening, you can either go online (Online | Comms Setup ...) or choose an existing file to analyse
(File | Open log file). At each point, the bottom banner shows the options available to you.
Open Analysed Data will open a file that this program has created, which has the log and all reports in
it. After opening a log file, you can save the analysed data. Analysed data can be opened quicker than
a log file because the analysis work has already been done.
Issue 12 Feb 11 AN-T80020 12
Page 13
Trusted
TM
AN-T80020 Diagnostics Procedure
Online
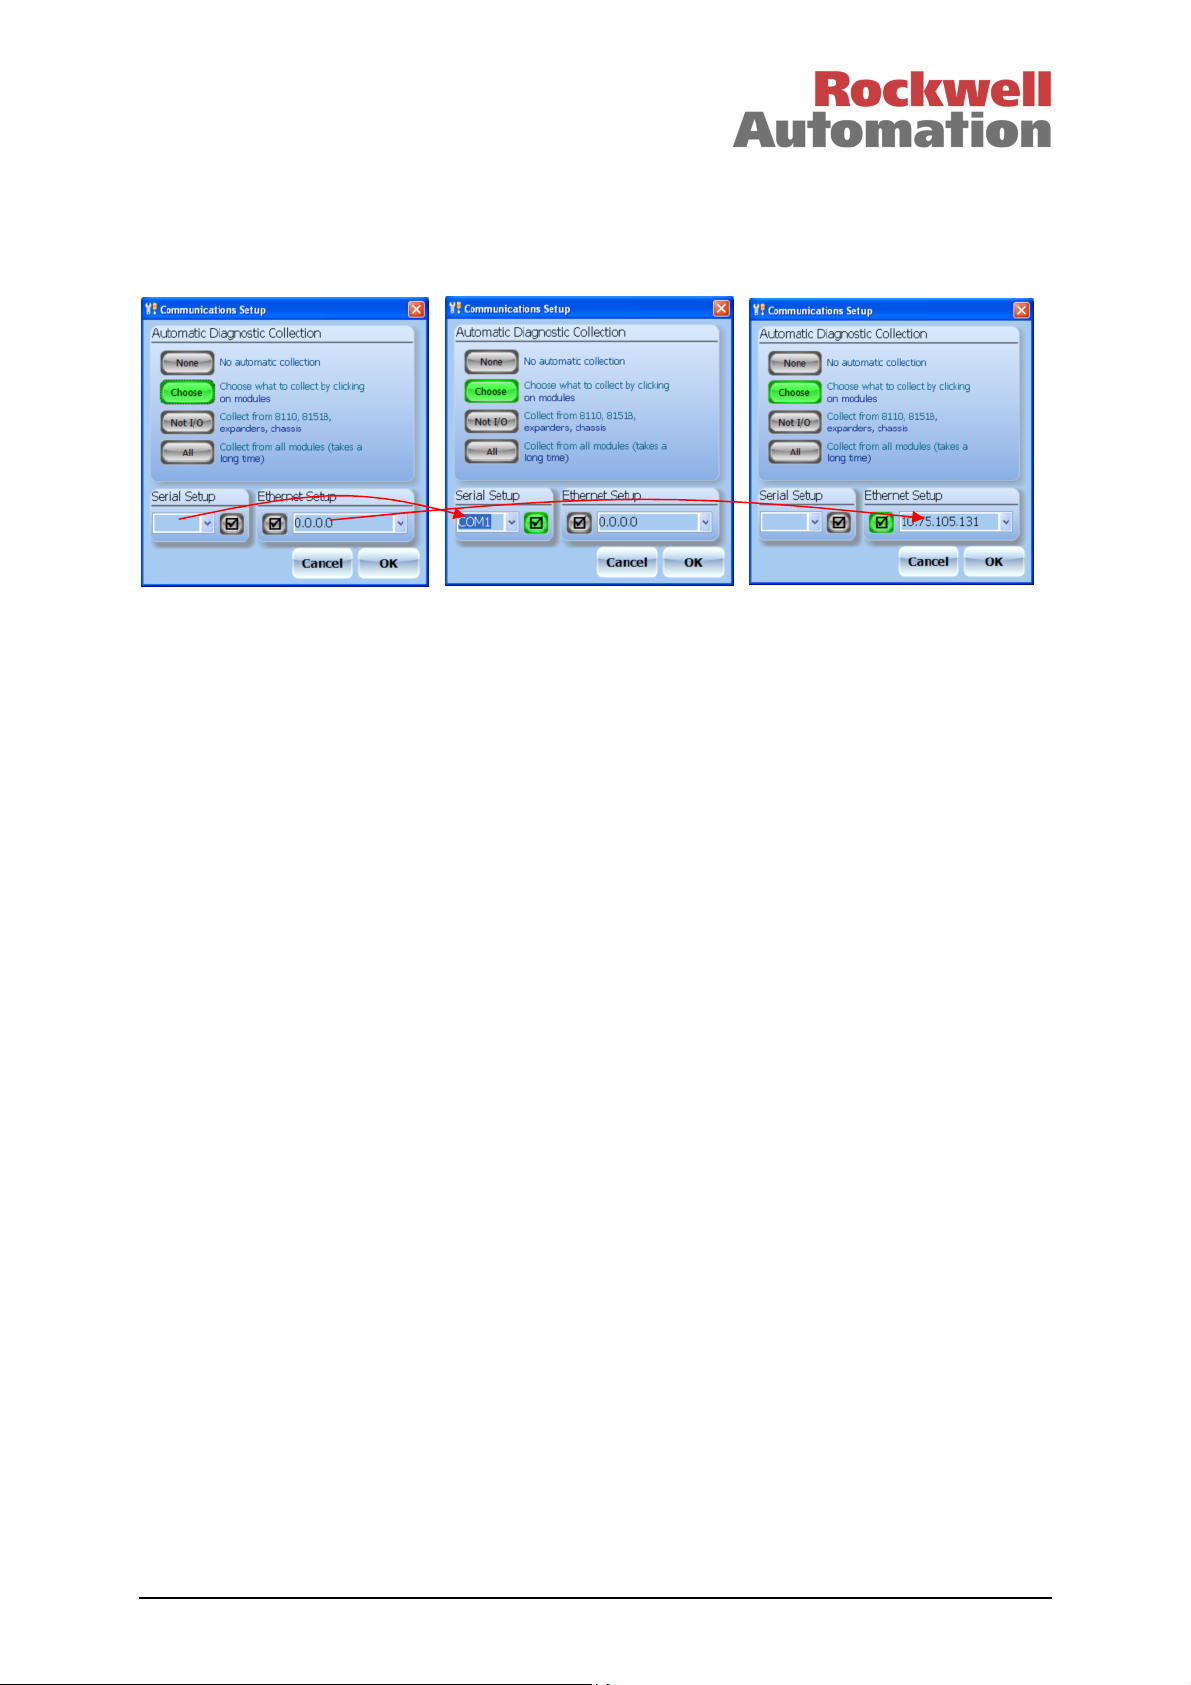
The online comms setup allows Ethernet or serial connection. Choose the Ethernet IP address or
serial port number as appropriate.
Choose the automatic diagnostic collection option:
1) None
This just makes a connection and opens the terminal.
2) Choose
This collects enough data to discover the modules fitted in the system and takes only a few seconds. It
then provides a picture or tree of the system which can be clicked on to get data from each module.
2) Not I/O
This collects all diagnostic data from the processor(s), communication interfaces, expander modules
and chassis, which will only take one or two minutes. This information is often the most important, and
is necessary even if the fault is in an I/O module. It also provides a picture or tree of the system, so that
data can be gathered from any I/O module.
3) All
This collects all the above data, but also collects from all the I/O modules. This will take some time,
especially if the I/O module logs are collected. It may be appropriate to ask a user to collect all data, to
avoid needing to explain which data is required.
For a serial connection, use a TC-304 maintenance cable. Check that the maintenance cable is
plugged into the PC serial port and the processor’s front panel port. Ensure the processor keyswitch is
turned to ‘Run’. The Analysis Tool cannot communicate if the keyswitch is in the ‘Maintain’ position. If
the processor front panel port does not seem to work, the Analysis Tool can also be connected to a
communication interface front panel port.
If you are using Ethernet, check that the system and PC are connected to the Ethernet network with
addresses on the same subnet. The keyswitch can be in either position.
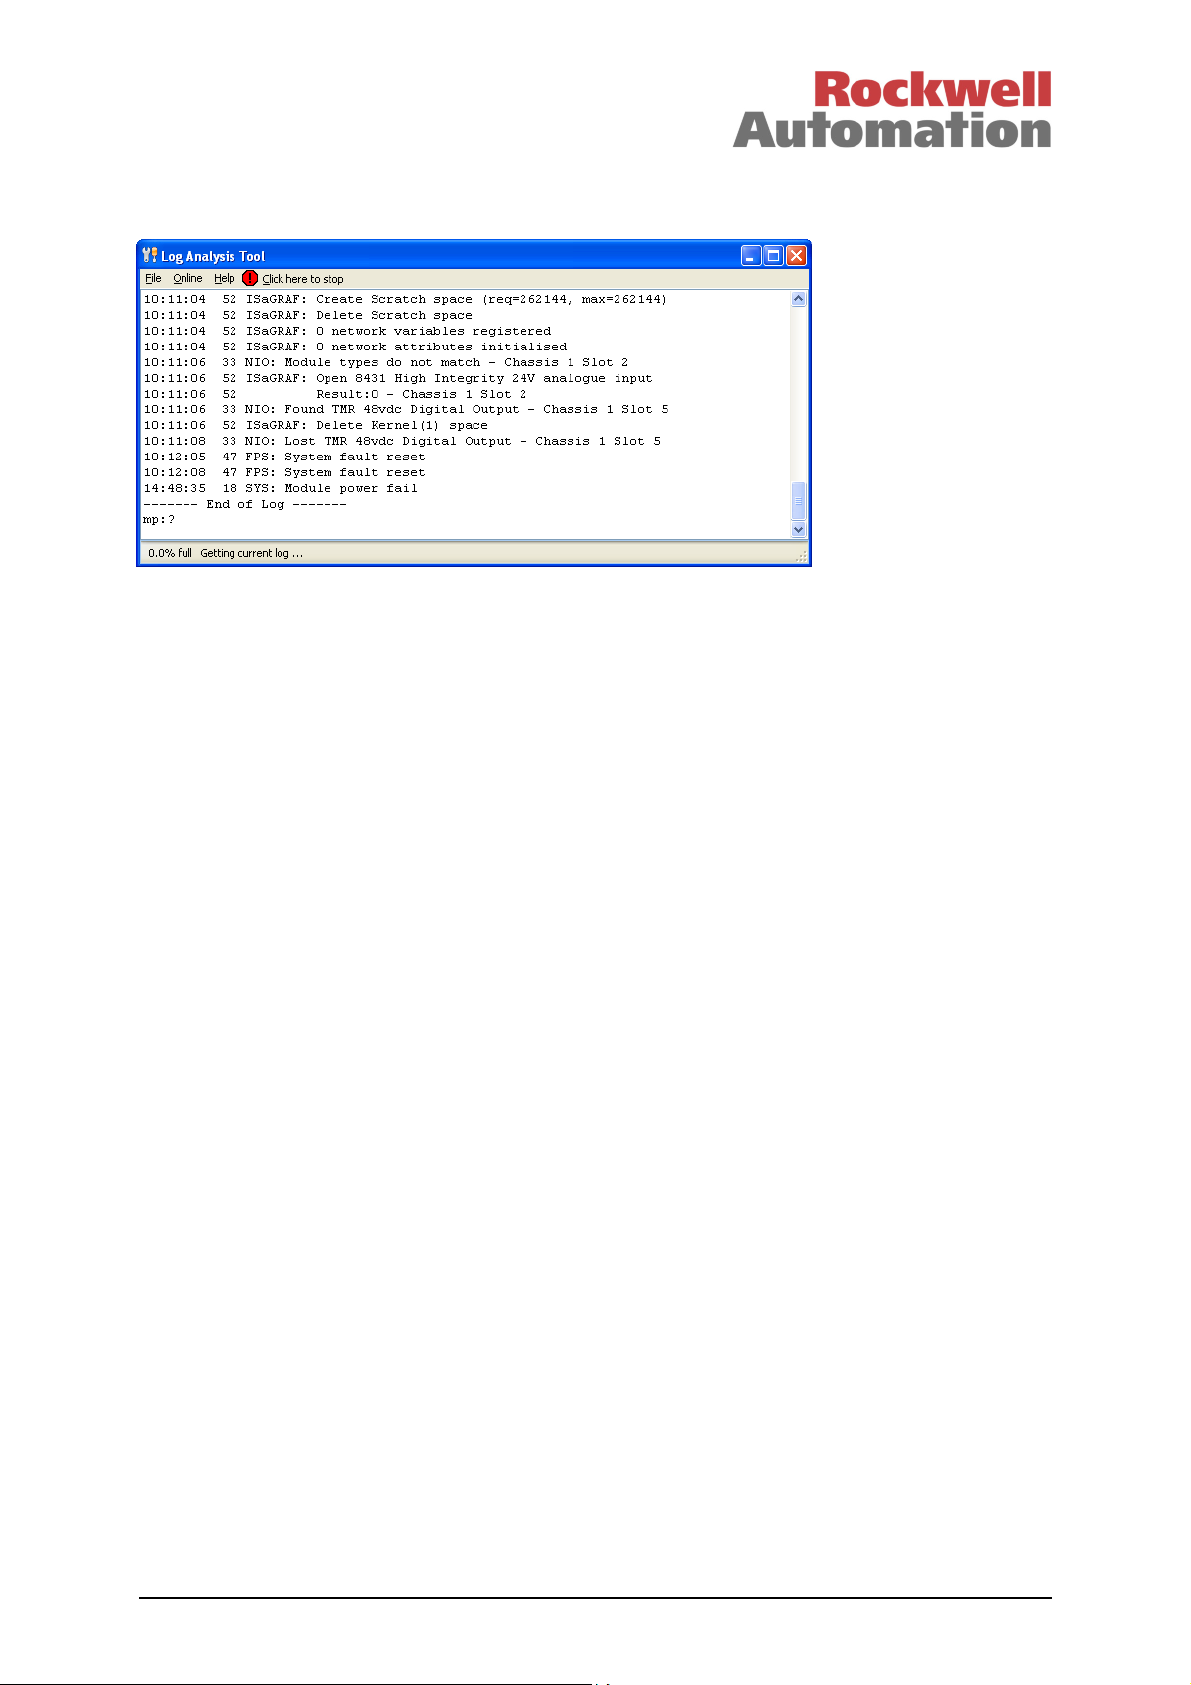
On clicking OK, you should see a title line (which assists the analysing code) and a prompt (ci:? for
Ethernet and mp:? for serial). If you only see an empty window or the program reports it cannot make a
connection, there is no communications. For a serial connection, check the cable and the keyswitch
position, then press Enter to request a prompt. For an Ethernet connection, check that the Ethernet
network is connected by sending a ‘ping’ command to the communications interface port using the
‘ping’ command (with the appropriate IP address) in a command window as shown in the Toolset
diagnostics section above. Then try Online | Comms Setup again.
Issue 12 Feb 11 AN-T80020 13
Page 14
Trusted
TM
AN-T80020 Diagnostics Procedure
Once the program has a connection, it will start the automatic collection option that was chosen. Leave
the collection to run. It will report its progress in the bottom banner.
Issue 12 Feb 11 AN-T80020 14
Page 15
Trusted
TM
AN-T80020 Diagnostics Procedure
Online Options
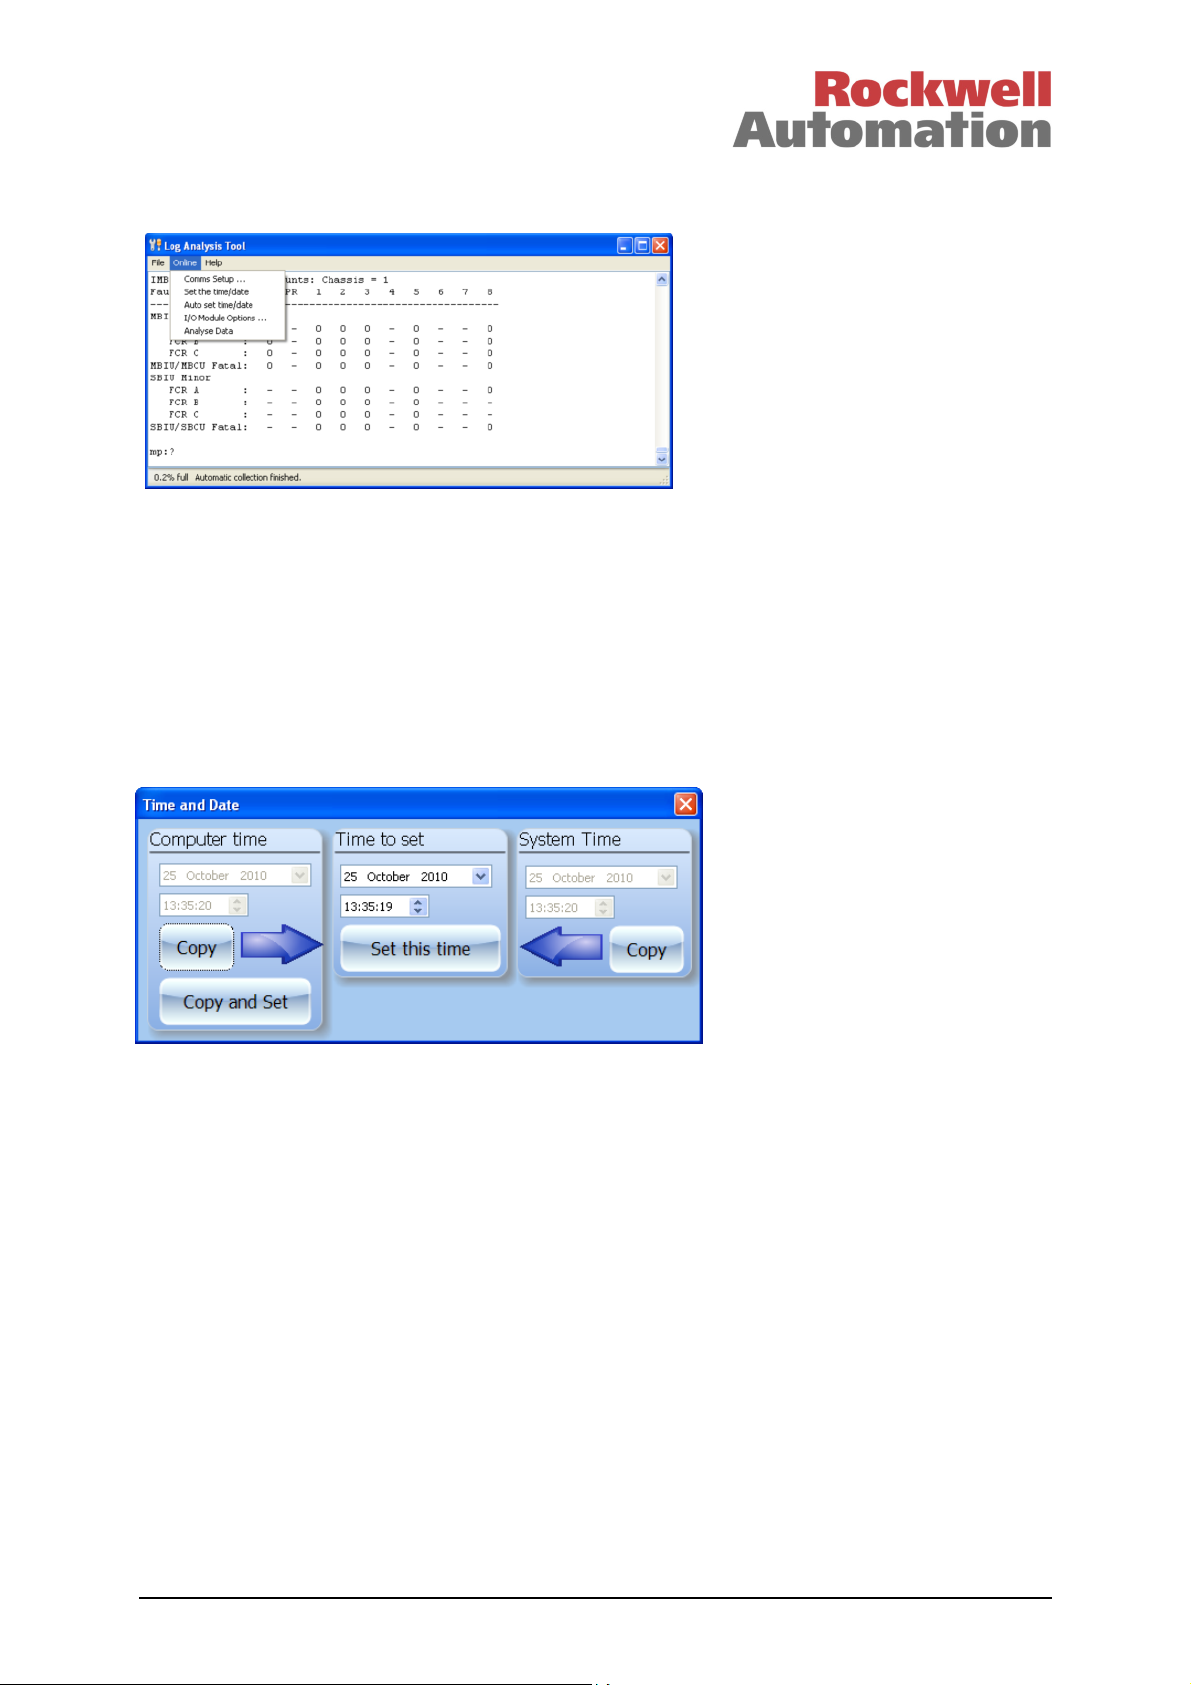
Once the online collection has finished, more options are available on the Online menu.
‘Set the time/date’ allows you to set the clock in the system.
You can enter a time/date using the middle ‘Time to set’ options, and click ‘Set this time’. Clicking
‘Copy and Set’ does both actions.
‘Copy computer time’ will put the current PC time and date into the ‘Time to set’ options. ‘Copy system
time’ will put the current system time and date into the options; you can then correct this, e.g. for time
zone changes.
At the moment the ‘Time to set’ is correct, click ‘Set this time’. This is most reliable on a serial cable to
the processor front panel, because there is a delay in connection from a communication interface
which can cause the request to be missed.
Issue 12 Feb 11 AN-T80020 15
Page 16

Trusted
TM
AN-T80020 Diagnostics Procedure
‘Auto set time/date’ sets the time automatically from the computer’s clock. It firstly measures the
delay between sending a new line and receiving a prompt, and then plans a moment to set the time
every ten seconds. On setting the time, the new line is sent at a calculated moment before the second
to attempt the most accurate time synchronization. Serial is the fastest medium with latencies of a few
milliseconds; Ethernet latencies are at least twenty times longer. This still cannot be accurate to the
illisecond, and only IRIG can provide true millisecond timestamping.
m
‘I/O Module Options’ provides the diagnostic privileged access password and chooses the data to
be collected from I/O modules. The Analysis Tool must have the diagnostic password entered before
collecting data from I/O modules. The options dialog will appear if you try collecting or erasing I/O
modules without having entered the password.
Enter the diagnostic password. The password may be changed using the System.INI configuration file;
if in doubt, contact support@icstriplex.com.
You can also choose:
Collect logs: whether to get the event logs from the I/O modules plus general data, or just the
general data. This can be used to speed up collection if you aren't interested in the logs; they can take
a long time to collect and can be very large.
Collect from slice: you can speed up diagnostics by just collecting from faulty slices. Choose
the slice you want; the default is all three.
Issue 12 Feb 11 AN-T80020 16
Page 17
Trusted
TM
AN-T80020 Diagnostics Procedure
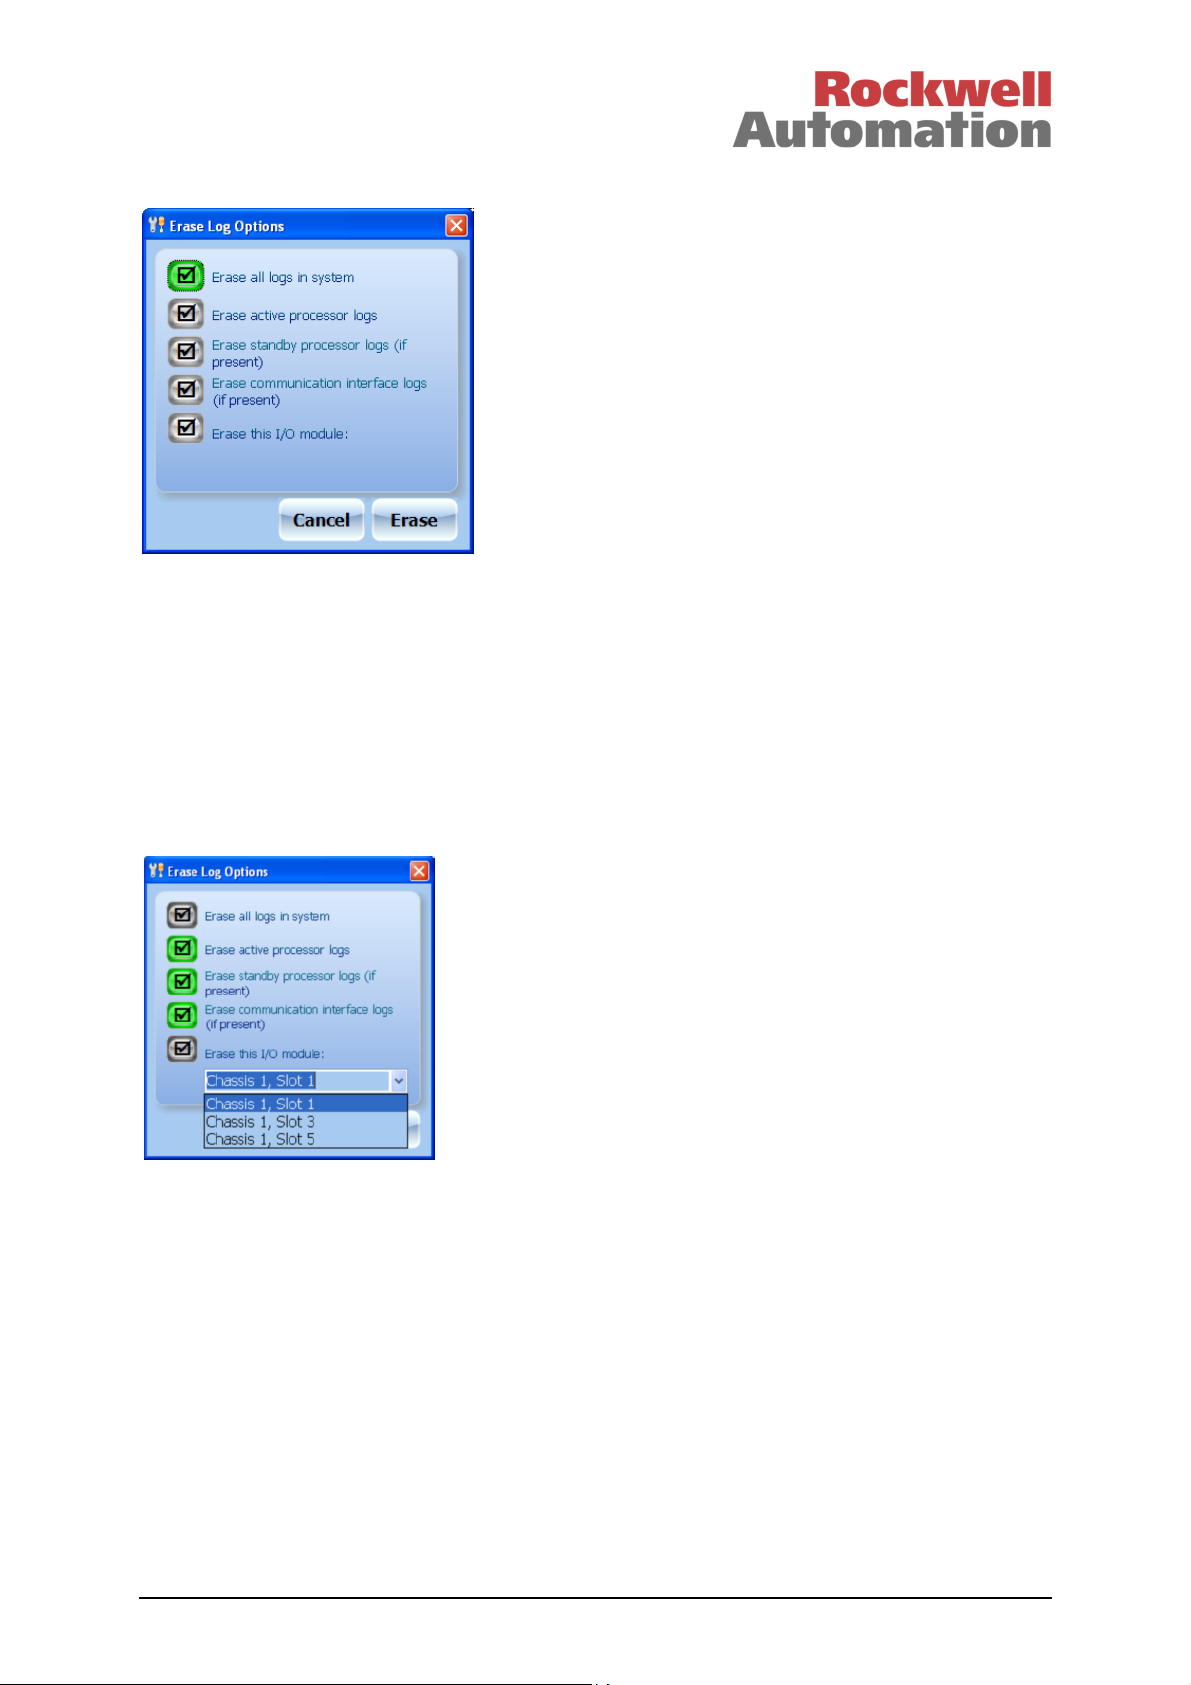
‘Erase Logs’ deletes all system event logs.
Do not erase any logs unless you are sure they are no longer necessary. For example:
• The logs are too big to collect. Erase the logs, leave the system to run its diagnostic routines
(24 hours), then collect the logs to inspect current problems.
• Collect the logs once a month for an archive, and erase the logs after each collection to keep
them small.
The default option is to erase all logs in the system. This includes the main processor current and
backup logs (in both processors if two are fitted), all communication interface logs, and all I/O module
logs.
If you de-select ‘Erase all logs in system’, you can choose which module logs to erase. You can select
one I/O module from a drop-down list.
The Analysis Tool will collect the first 90 lines of each I/O module log before erasing it. It checks these
lines for manufacturing test entries, and puts these test entries back into the log after erasing it. This
assists with module diagnosis and repair. Note that Dumptrux does not preserve these test entries and
should no longer be used for erasing logs.
‘Analyse Data’ passes the collected data to the analysing side of the program, which will prepare
reports. Choose this option when you have collected all the data you want, and you want to analyse it.
After this, the program behaves exactly as if you had opened an existing file through File | Open. You
can still go back online however, using menu option Online | Terminal. The analysis side of the tool is
described later.
Issue 12 Feb 11 AN-T80020 17
Page 18

Trusted
TM
AN-T80020 Diagnostics Procedure
System Graphic / Online Tree Window
When you connect, the Analysis Tool will interrogate the system and make a clickable window of the
system shape.
If you hover over a module, the window title shows the module type and a pop-up ‘Tool Tip’ shows
whether you have already collected from that module. A grey module has not been collected, a light
blue module is being collected, and a dark blue module has been collected. If you click on a module or
chassis end, the Analysis Tool will collect all useful data from that part of the system.
If there are two processors, the left-hand processor in the graphic is always the active processor (the
Analysis Tool cannot distinguish left and right slots).
Issue 12 Feb 11 AN-T80020 18
Page 19

Trusted
TM
AN-T80020 Diagnostics Procedure
Manual Command Entry
You can type commands into the online window. This is recommended only if you are competent with
the 8000 series systems and you know the command you need, or the first-line diagnostics specifically
asks you to type these commands. The most useful commands are:
ls b Show backup log of events before the last power-down of the main processor
ls d Show current main processor log since last power-up (moved to backup log on power loss)
ls l Real-time monitor of processor log
The terminal is a simple implementation and will not refresh the screen until a new line is entered. This
is most evident with ls l; type ctrl-c to exit and press Enter. Teraterm Pro is recommended for full
manual command-line access.
The Main Processor log is available without privileged (password) access, and does therefore not
invalidate any safety protection. A later section describes some of the possible entries in these logs.
Issue 12 Feb 11 AN-T80020 19
Page 20
Trusted
TM
AN-T80020 Diagnostics Procedure
Offline
You can either:
1) analyse some data you have collected online (see above) or
2) open an existing log file (collected using the Analysis Tool, Dumptrux or a terminal program) or
3) open a file of analysed data previously made by this program.
If you want to analyse your online data, use Online | Analyse Data.
If you want to analyse a saved file, use File | Open log file.
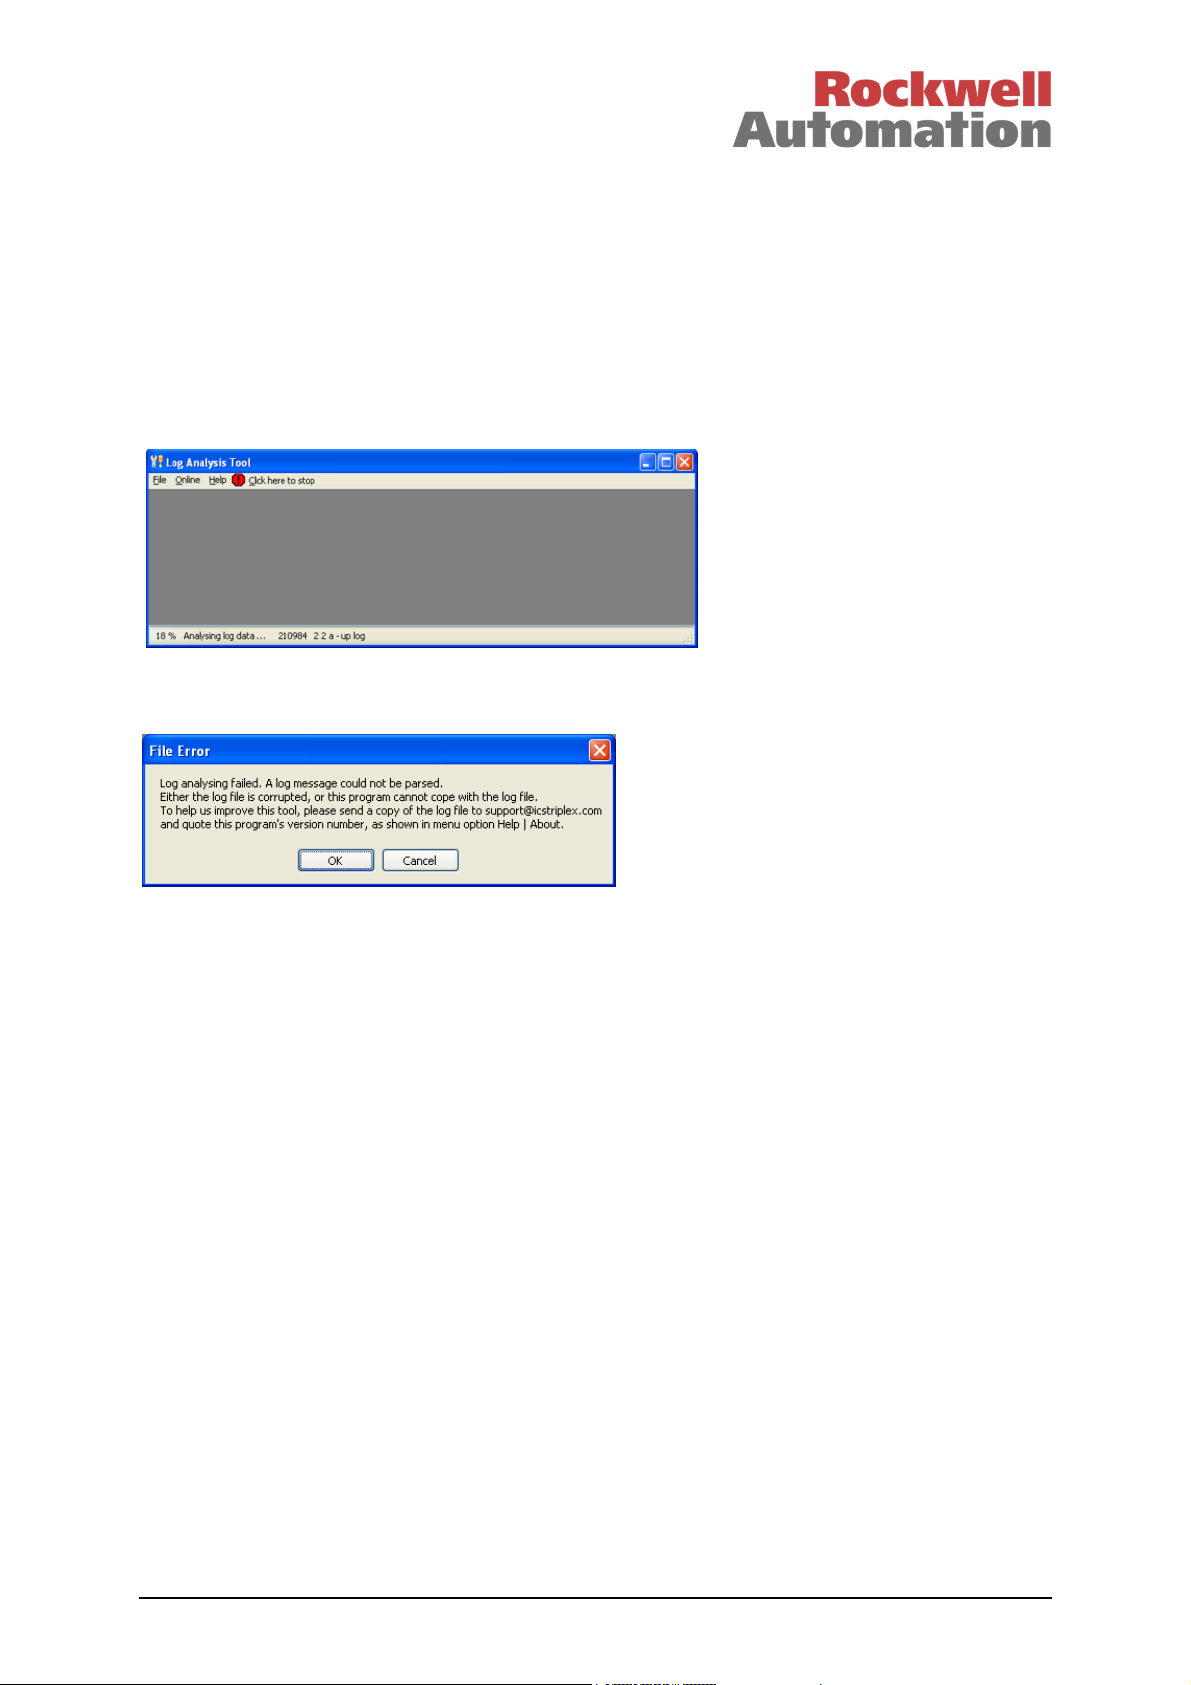
The analyser will read each log command and gather its data, then prepare the data for the reports.
This process can take time on large logs. If it takes forever, you can cancel it by clicking the menu
option Click here to stop. The reports will only contain information from the data analysed so far.
Sometimes the Analysis Tool will be unable to open the log. If it fails, it will give the message shown
above. Some logs are corrupted due to communications noise, and sometimes the I/O modules will not
store their logs properly (the logging process is not the highest priority task and it can be interrupted).
In some cases, the system may contain modules which reply with message formats that have not been
tested (or accounted for) with the Analysis Tool, causing the code to abort. There is little that can be
done to cope with corrupted logs, but it may be possible to account for an unknown reply format.
Please send the log to ICS Triplex as instructed.
Issue 12 Feb 11 AN-T80020 20
Page 21
Trusted
TM
AN-T80020 Diagnostics Procedure
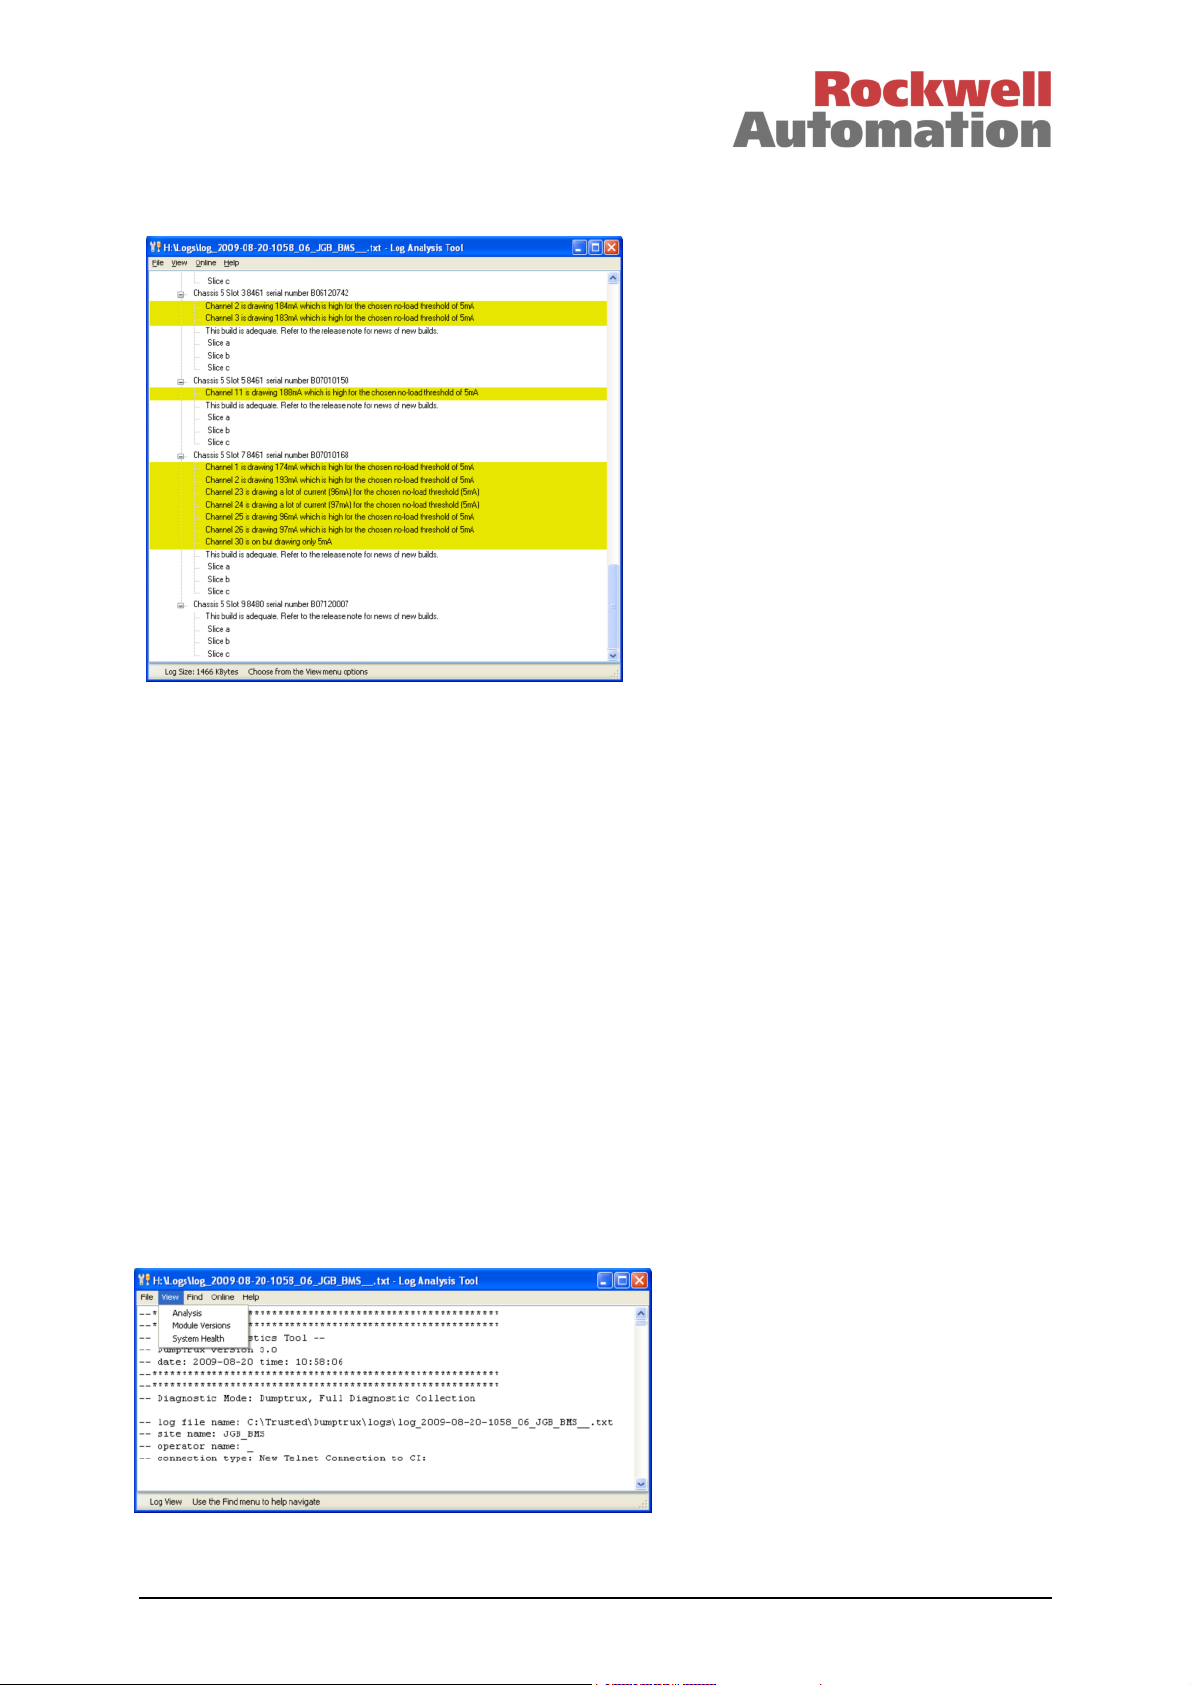
Once open, you see the System Health view. This shows a summary of advice given by the program
and it is described later.
File Menu
The File menu provides basic tools as follows, depending on which view is shown:
• Open log file: chooses a new file to open. (Ctrl-O will also work)
• Open analysed data: opens a file created by the Save analysed data option below. It will open
quickly because the analysis work is already done.
• Save analysed data: saves a file containing the log and all report data. This can be opened
later by the Open analysed data option above. The file can be very large, but it will compress
well. Please compress it if you want to email it. (Ctrl-S will also work)
• Save this report: saves the currently displayed report to a file.
• Copy selection: copies the selected text for pasting into other documents. (Ctrl-C will also
work)
• Print this view: sends the current view to the printer. (Ctrl-P will also work)
• Exit: closes the Analysis Tool.
View Menu
The View menu lets you choose the different reports and displays that the Analysis Tool provides. The
contents of this menu will change depending on the report view you have chosen. The reports are
described on the next pages.
Issue 12 Feb 11 AN-T80020 21
Page 22

Trusted
TM
AN-T80020 Diagnostics Procedure
Log View
This shows the initial view of the whole file, as if it was in a text editor. Experienced engineers can
search through the data for details that may not be captured by the reports. Use the Find menu to help
with searching.
Find Menu
The Find menu has the following options for manual searching through the log.
• Text … : simple text search as in Notepad, with
similar options. (Ctrl-F will also work)
• Current Log: goes to next ls d command in the log
(from the active processor, standby processor or
communications interface)
• Backup Log: goes to next ls b command in the log
• Chassis/slot ... : goes to the next I/O module prompt for the given
chassis, slot and slice.
Analysis View
This view shows a representation of the system and provides detailed reports on parts of the system. It
will show the active processor’s individual report when opened. A navigational window lets you choose
a report.
This shows a simple picture of the system, and provides access to the
reports described below.
Hovering the mouse over a module will show its description in the title, and
an explanation of the colour.
Beige: no module fitted
Green: fitted module, either healthy or no data gathered
Amber: possible fault, needs further investigation
Orange: definite fault on that module (or its configuration).
Red: critical fault found which should be reported to ICS Triplex.
Blue border: upgrade recommended. Thicker borders are higher
priority.
Left-click a module to see its main report, as described below.
Right-click a module to see the other available reports in a screen menu.
This system has one processor. If it had a second processor, it would be
shown in the right-hand slot. The left hand slot is always the active
processor – it is not possible for the program to determine which physical
slot the module is in.
Processors and communication interfaces have three reports. Left-clicking
on the module provides the basic report. Right-clicking provides the current and backup logs. The
contents of the processor log are described in a later section.
Issue 12 Feb 11 AN-T80020 22
Page 23

Trusted
TM
AN-T80020 Diagnostics Procedure
Each I/O module has up to seven reports. Left-click on the module for the main report. This provides
serial numbers, versions and the error codes currently reported on each module. These are the same
error codes as found through the Toolset Diagnostics.
Right clicking provides the system event logs on each slice (if the file includes them), and two or three
data reports. The system event logs include a lot of data, so the main events have been extracted for
the report.
Hold the mouse pointer over a row in the table to get some advice on an event. All faults with fault
codes have advice for further diagnostics and remedy. This is taken from the advice in the Error Codes
Descriptions in Appendix A of this document, and includes all its maintenance advice.
Issue 12 Feb 11 AN-T80020 23
Page 24

Trusted
TM
AN-T80020 Diagnostics Procedure
Each event includes a timestamp, which is calculated from a millisecond count in the log. If the
timestamp can't be determined, it is shown as time since startup or the beginning of the log. The logs
contain no information on the year, so the Analysis Tool makes a best guess based on other data. For
his reason, the year may be wrong.
t
Entries are categorised and coloured in a similar way to the graphical system view – see page 22.
The Severity shows the Analysis Tool’s category for the event:
Info Information: normal operation (coloured white)
Fault? Possible Fault: requires further investigation (coloured amber)
FAULT Definite Fault: the module needs repair or fault in configuration (coloured orange)
ALERT Critical Alerts: report to ICS Triplex via support@icstriplex.com (coloured red)
These categories are often revised, and so is the advice on each type of fault.
You can filter this data using the menu option View | I/O Log Options.
• You can see only recent events by selecting Only from and choosing a date.
• You can chose to see only important categories by selecting Only at/above and choosing a
level. Events at this category or higher will be shown.
To see your new choice of data, click OK and open the log report again.
Issue 12 Feb 11 AN-T80020 24
Page 25

Trusted
TM
AN-T80020 Diagnostics Procedure
Bookmarks
If you click on a log event, you can add a bookmark and a comment by choosing the Bookmark menu
option. The event in the log then has a bookmark icon. Bookmarks and their comments are saved with
the report data when you choose ‘Save analysed data’, so that you can send the analysed data file for
further investigation.
When there are bookmarks, the View menu has an extra option ‘Bookmarks’. This shows all the
bookmarks in the analysis, so a support engineer can find them later.
Issue 12 Feb 11 AN-T80020 25
Page 26

Trusted
TM
AN-T80020 Diagnostics Procedure
Other data from the I/O modules is available under the Data branch.
• Channel Data is useful for comparing the measurements or states of the three slices. Note
that log data collection results in snapshots from the three slices at different times, so
differences may just reflect changing channel states.
Issue 12 Feb 11 AN-T80020 26
Page 27

Trusted
TM
AN-T80020 Diagnostics Procedure
• Housekeeping Data provides system circuit measurements of voltage, current and
temperature. This provides more data than is available through the Toolset HKEEPING board.
Issue 12 Feb 11 AN-T80020 27
Page 28

Trusted
TM
AN-T80020 Diagnostics Procedure
• Threshold Data provides the input state measurement thresholds operating in the module.
Issue 12 Feb 11 AN-T80020 28
Page 29

Trusted
TM
AN-T80020 Diagnostics Procedure
Module Versions
This is a simple report of all the module firmware versions in the system. It is useful for collecting serial
numbers, firmware versions and module types and gives a quick idea of the shape of the system.
Issue 12 Feb 11 AN-T80020 29
Page 30

Trusted
TM
AN-T80020 Diagnostics Procedure
System Health
This report collects all the most important advice that the Analysis Tool has provided into one report. It
is a global report of the health and state of the system. You can use this report as a single point of
advice for the whole system. It reports all current faults on I/O modules, advises on firmware upgrade
needs, reports communication configuration problems and I/O module configuration problems.
Entries are categorised and coloured in a similar way to the I/O module logs and graphical layout (see
page 22).
Hover the mouse over an entry for more advice.
Issue 12 Feb 11 AN-T80020 30
Page 31

Trusted
TM
AN-T80020 Diagnostics Procedure
Bookmarks
If you click on an entry, you can add a bookmark and a comment by choosing the Bookmark menu
option. The entry then has a bookmark icon. Bookmarks and their comments are saved with the report
data when you choose ‘Save analysed data’, so that you can send the analysed data file for further
investigation.
When there are bookmarks, the View menu has an extra option ‘Bookmarks’. This shows all the
bookmarks in the analysis, so a support engineer can find them later.
Issue 12 Feb 11 AN-T80020 31
Page 32

Trusted
TM
AN-T80020 Diagnostics Procedure
Main Processor System Logs
MON 2009-03-23
17:02:56 25 Cfg: Configuration file loaded.
17:02:56 26 IMB: LRAM power up test passed
17:02:59 51 ISaGRAF: Create Comms space (req=1024, max=1024)
17:03:06 22 A/S: Processor mode set to Active
17:03:06 26 IMB: Expander configuration complete
17:03:06 26 IMB: Found CI module - Chassis 1 Slot 7
17:03:06 28 IMB: Slave connection manager started - Chassis 1 Slot 7
17:03:06 33 NIO: Found TMR 24Vdc Digital Input - Chassis 1 Slot 1
17:03:06 33 NIO: Found TMR Analogue Input - Chassis 1 Slot 3
These logs show date-stamps at the start of each day (e.g. MON 2009-03-23 above). Each entry has a
time stamp, the number and name of the task that wrote the entry (e.g.
of the entry. Most entries will be due to normal operation. To find the current state of the system, read
the log from the bottom, up to the first ‘fault reset’ entry. Some possible entries are shown below.
NIO: Disabling interface (Rack 1 Slot
5), slice C
A module slice is being set offline by the processor;
this will appear in the I/O module as an 0x8741 fault.
Check the First-Line Diagnostics advice for a steady
red I/O module 'Healthy' LED
NIO: CLI error (FAIL) - Chassis 3 Slot 7
Slice C
NIO: Lost (Rack 3 Slot 1) …
NIO: Simulating …
NIO: Module(s)
removed/unconfigured/simulated
IMB: Expander FCR fault set - …
NIO: Channel 6 Discrepancy (Rack 6 Slot
5), slice C
The I/O module slice has stopped communicating
A module has been removed
The system is running without the module
The processor is warning that it is still running without
all modules
Communications via expander modules has failed
I/O point measurement discrepancy; this will appear in
the I/O module as a 0x70nn fault. Check the First-Line
Diagnostics advice for a flashing red I/O module
'Healthy' LED
CLI Response Error FAIL - Chassis 2 Slot
11
FPS: [Manual] System fault reset
NIO: Linked (or) Unlinked Chassis 3 Slot
7 - Chassis 3 Slot 12
NIO: Impending module removal set (or)
cleared - Chassis 2 Slot 9
A module is missing on startup
The reset pushbutton has been pressed
Two I/O modules have been partnered for a hot swap
(linked) or the partnership has been broken (unlinked)
The ejector tabs on this module have been opened (or)
closed. If the log reports alternating set/cleared
messages, the ejector switches are faulty.
NIO: Slice fault - Chassis 4 Slot 9
A module has a fault but is still running. Check the
First-Line Diagnostics advice for a flashing red I/O
module 'Healthy' LED
NIO: Module not properly configured Chassis 3 Slot 2
The I/O module has rejected its System.INI
configuration. It will have shut down on starting the
system.
NIO: Illegal 'standby' module state
(fatal) - Chassis 4 Slot 1
The I/O module was set Active but went back to
Standby. This probably indicates that it has rejected its
System.INI configuration.
IMB: Permanent minor fault (MBCU)
Chassis 4 Slot 13 FCR C
Indicates a permanent problem with system
communication to the given chassis, slot and slice.
26 IMB:) and a text description
Issue 12 Feb 11 AN-T80020 32
Page 33

Trusted
TM
AN-T80020 Diagnostics Procedure
IMB: Permanent fatal fault (MBCU) Chassis 3 Slot 2
NIO: Slice state discrepancy - Chassis 2
Slot 11 Slice A
Self Test: FCR A(B,C) BACKGROUND monitor
- permanent fault
Self Test: FCR (A,B,C) MBIU SAFETY LAYER
COMMON test - permanent fault
I2K: Peer connection lost
UART: Port 2 not supported by hardware config. Ignored
CFS: Overflow in SOE buffer - Chassis 0
Slot 0
CFS: Overflow in SOE buffer - Chassis 1
Slot 8
IMB: Expander FCR fault set - chassis 1
slot 1 FCR B
24 IMB faulted
24 IMB trip watchdog …
ISaGRAF: Scanning started (or) stopped
IMB: Signal discarded due to slow
connection
PIO: Stopped Peer Comm …
PIO: Bad chassis/slot for … board
PIO: Received an invalid ack. to board
from standby peer
A/S: Standby processor static education
completed
A/S: Standby processor reporting ill
health
A/S: Handover inhibited - ISaGRAF
variables locked
A/S: ISaGRAF variables released
IRIG: Maximum update interval exceeded
The I/O module has shut down
This slice is in a different state to the other two
A confirmed discrepancy was detected between
memory data on the processor’s three slices.
‘Transient’ faults indicate that the fault has been found
but has not been confirmed yet
The voting circuits on the processor’s interface to the
system bus are faulty. This is often caused by inserting
an I/O module into one of the processor slots, which
damages the voter ICs.
I2K is ICS2000 interface; irrelevant if not used
An old (8110) processor has been upgraded with new
firmware; this is not a problem unless the nonexistent
IRIG and serial facilities are needed
Event data may have been lost during MP startup
Event data may have been lost during MP hotswap
A fault has been reported on an expander interface
The IMB comms has been starved of processing time.
If a few seconds after application load, on a system
with no native I/O, then the sleep period has been set
too short. 32ms is the recommended default.
The application has started (or) stopped
A communication interface is not responding
Peer to Peer communications stopped
Incorrect Peer to Peer configuration in this or another
system
The standby processor has failed to acknowledge the
transfer of the Peer to Peer board setup. When a new
application or online update is loaded, it is transferred
to the standby processor. This message may indicate
that the standby processor has failed to educate.
Check the standby processor system log.
The standby processor has finished receiving and
saving the new application.
The standby processor is not responding to the
education process. Check the standby processor log.
The usual cause is that the ejector tabs are not closed
or the ejector switches are faulty (see TN20016).
Variables have been locked or unlocked in the
application. The processors will not hot-swap if there
are locked variables (the Inhibit LED will flash on the
active processor).
The system is configured to receive IRIG-B time
signals but is not receiving a signal. This is a common
cause of the System Healthy LED flashing red with no
other indication of fault.
Issue 12 Feb 11 AN-T80020 33
Page 34

Trusted
TM
AN-T80020 Diagnostics Procedure
FPS: Module ejectors open
SYS: Module power fail
The processor’s ejector tabs are open (or the ejector
switches are faulty)
The processor has been turned off or removed (usually
the last entry in a backup log)
Issue 12 Feb 11 AN-T80020 34
Page 35

Trusted
TM
AN-T80020 Diagnostics Procedure
Clearing the MP Non-Volatile RAM (NVRAM) Memory
This procedure is often abused and is only necessary when changing the system.INI module allocation
with processor build 122 (see TN20061) or when a processor suffers from ‘GALPAT’ errors after losing
power on startup (see TN20014). Do not erase the NVRAM for any other purpose because it will delete
all diagnostic evidence in the processor.
GALPAT errors (TN20014)
If a main processor slice has failed due to a GALPAT (galloping pattern) error, entries similar to the
following will appear in the processor Log.
23:53:04 37 Self Test: FCR A DRAM GALPAT test - transient fault in block at address 0xF76CA0
23:53:04 37 Self Test: FCR A DRAM GALPAT test - transient fault in block at address 0xF76CA0
23:53:04 37 Self Test: FCR A DRAM GALPAT test - transient fault in block at address 0xF76CA0
23:53:04 37 Self Test: FCR A DRAM GALPAT test - transient fault in block at address 0xF76CA0
23:53:07 37 Self Test: FCR A DRAM GALPAT test - permanent fault in block at address 0xF76CA0
23:53:07 37 Self Test: FCR A Faulted processor slice removed from operation
23:53:42 24 IMB: Permanent minor fault (MBCU) Chassis 1 Slot 0 FCR A
Here, a discrepancy between slice A (‘FCR’, Fault Containment Region) and the other two slices was
detected in address F76CA0 hex. This was seen five times, which is the count required to declare a
permanent fault. At this point, the slice was disabled. As a result, the IMB later detected a
communications fault. This is much less common after firmware build 115 because errors are
corrected as they are found.
The MP should be swapped to a spare MP, to allow operation to continue. Then the memory can be
cleared to allow a fresh start.
Processor build 122 and System.INI changes (TN20061)
If a System.INI file with a different arrangement of modules is downloaded to a processor with firmware
build 122, and the processor is restarted, the Toolset debugger will be unable to connect. Firmware
build 123 fixes this problem. A workround is to clear the memory.
Clearing the non-volatile RAM
Connect a TC-304 maintenance cable to the faulty processor, and open a communications terminal
program (e.g. TeraTerm, Hyperterminal). Turn the keyswitch to Run. Press Enter and check that a
prompt appears to verify that communications is established.
Remove the faulty processor from the chassis connectors a little way, to turn it off. Re-insert the MP
with the TC-304 cable still connected and the terminal program still active. The MP will now display the
boot-up sequence, similar to that shown below.
P/N 352010 TMR Processor Boot Code - Build 3
(C) Copyright Enea Data AB, 1991-1997
(C) Copyright ICS Triplex, 2001
Cold start
Attempting auto boot, press <ESC> to abort ...
At this point, press the Escape key (ESC) at the terminal program. The MP will report Auto Boot
Aborted and show the boot prompt ‘>’. There is now no application running in the MP; it is only
running the basic low-level boot system.
Type the following:
> envram
This command ‘Erases the Non-Volatile RAM’. This deletes the FAT table that addresses the flash
memory storing the INI and user application, and also deletes the logs and retained variables. The
processor is then unaware of its INI or application.
Restart the MP by cycling power. Load the system.ini file, restart and load the application.
Issue 12 Feb 11 AN-T80020 35
Page 36

Trusted
TM
AN-T80020 Diagnostics Procedure
Action on Processor Shutdown
The 8000 series system is designed to be fault tolerant, with triplicated circuits allowing simple 2-outof-3 voting at very high speed. It is therefore able to identify and isolate faults which cause one slice to
be different. However, there are always common cause failure modes in any safety system. The 8000
series system is designed to shut itself down if it cannot guarantee its integrity. This may be caused by
faults in the operating system programming or hardware/circuit design or other circumstances. The failsafe action is designed to eliminate situations where the system would fail to perform an intended
shutdown, and the calculated mathematical system integrity is in the SIL4 band as a result (although
IEC61511 limits TMR designs to SIL3 duties).
In the event of an unexpected shutdown, you will understandably want to know what went wrong.
There are several different ways to get diagnostic data from the system, and it is easy to lose this data
in the effort to get the system running again. This procedure describes how to get this data before it is
lost.
Normal Shutdown Action
If the Processor ‘Run’ LED is still flashing, the application is still running. Check if the system has
performed a proper shutdown. The procedures below only apply when the application has stopped.
These procedures do not cover shutdowns due to the loss of function block states during intelligent
online updates. If the shutdown occurred directly after an online update, and the application is still
running, refer to AN-80009. The file that will be of most use to diagnostics is appli.msx in the
application folder; this will record ‘deleted’ and ‘new’ function blocks. Note that Toolset build 111 has
much better matching of function blocks than earlier builds.
Processor LED States
Please note the state of ALL Processor LEDs (on both processors if fitted): Healthy x 3, Active,
Standby, Educated, Run, Inhibit, System Healthy.
Toolset Debugger Messages
The application environment may have recorded some error messages which will be collected by the
Toolset debugger when it is next connected. These are only collected once, and then they are deleted
and cannot be collected again. Restarting the processor will delete these messages.
Attempt to connect using the Toolset using a serial cable to the processor front panel port. The
keyswitch must be in the ‘Maintain’ position.
Open the debugger.
If any messages appear (e.g. “application stopped”), expand the window vertically to show the
messages and take a screen capture (Alt – Print Screen). An example is shown below. There will be
up to 16 messages available.
Paste this into the Windows Paint program and save the file.
Start the application if it reports “No Application” (this may restart the system). If it reports
‘Disconnected’, the Toolset was not able to connect.
Close the debugger. The procedure continues on the next page.
Issue 12 Feb 11 AN-T80020 36
Page 37

Trusted
TM
AN-T80020 Diagnostics Procedure
Processor System Event Logs
If an 8000 series processor shuts down, the reason may be documented in the processor's event log.
The processor keeps two event log files. One is the current log and is written to during operation. On
starting, the processor swaps to the other log file and leaves the original file as a record of the events
efore it last shut down. This is the backup log, and it may reveal the reason for a shutdown that
b
caused the processor to stop completely.
If a processor is started up again more than once, the evidence for the first shutdown is lost because
the processor will have overwritten both log files. The backup log will now only document the last startup attempt.
Another log is kept by the operating system kernel. This records the fault found when the processor
firmware was last halted by the kernel. This log is kept in memory even after repeated restarts, but is
lost if the non-volatile RAM is erased. The only kernel fault that is normally expected is 1F5, which is
found in a processor that has shut itself down after handing over to another processor. 1F5 is a
watchdog timeout caused by the firmware deliberately not resetting the watchdog, in order to shut
down the module. Any other kernel fault needs to be captured and reported.
Before restarting the processor, connect a terminal program (Teraterm or Hyperterminal) with a
maintenance cable. Set the keyswitch to ‘Run’ and set the terminal program to collect data to a file.
If you can connect, collect the current and backup logs by typing:
ls b
ls d
ls k
If you have the Analysis Tool, collect the processor data online and save it in a file. This includes the
logs listed above.
If you cannot connect, restart the processor only once, even if the system does not function properly
first time. Collect the logs as above.
After collecting the logs, proceed to establish normal operation, including further restarts if required.
Send the data files to ICS Triplex Technology for investigation. They may request further information,
such as:
Logs from I/O modules
Application and System.INI file
Please do NOT send:
• SOE logs; these are never useful for diagnosis; they are system specific and only document
the state of I/O points, not system health.
• Screenshots of I/O configurations or data values
• Event logs from graphics stations
• Videos of LED states. These create large files which will delay email delivery. Instead, note
the colours/flashing state as requested above.
Issue 12 Feb 11 AN-T80020 37
Page 38

Trusted
TM
AN-T80020 Diagnostics Procedure
APPENDIX A. ERROR CODE DESCRIPTIONS
This section provides detailed descriptions for each of the error codes reported by I/O modules,
including what is wrong and what to do.
Error codes are described in four digit hexadecimal numbers. The first two digits describe the category
of error, and for many categories the last two digits are a “subcode”, narrowing down which part of the
module was noted as faulty. Fault codes above 0x8000 cannot be cleared by pressing Reset.
“Subcodes” specifiy a faulty channel number, group number, or other attribute. Group number always
designates an output power group. Channel number can designate an input/output channel or a
housekeeping data channel.
“Action” specifies how the slice state or channel state is affected by the fault. The slice can either:
• Continue running. The Healthy LED will flash red. The slice will still communicate, so the fault
is reported in the Toolset debugger and the slice system log can be collected. Note that the
Healthy LED also flashes red when the slice is still in its boot mode and has not started the
firmware.
• Be turned off (OFFLINE). The Healthy LED will be steady red. The slice is not communicating,
so the only way to diagnose it is to swap or remove it, restart the module and collect the slice
system log.
Keep a logbook for recording error codes from I/O modules. Record the error code, module position
(chassis and slot or reference number), date and time. If the advice in this document for that error code
is to act only if it is persistent (returns later after pressing Reset), use the logbook to look for earlier
records of the same fault.
Issue 12 Feb 11 AN-T80020 38
Page 39

Trusted
e to system components (human and
ata displayed in HKEEPING
TM
AN-T80020 Diagnostics Procedure
Glossary
A/D Analogue to Digital Converter (or ADC)
APP Module Application firmware
ASCII Standard text character codes
ASIC Application Specific Integrated Circuit
BOOT Initial code run by module on startup, or startup state
BSU Bus Slave Unit; protocol circuit communicating to the MP over the IMB
BTM Bottom (of an output switch pair)
CLI Command Line Interpreter; text based interfac
internal)
CONFIG A slice is reading its calibration and configuration data.
CRC Cyclic Redundancy Check; data error detection
D/A Digital to Analogue Converter (or DAC)
DSP Digital Signal Processor, used on the HIU
FCR Fault Containment Region
FET Field effect transistor, used in output circuits
FIA Field Interface ASIC; processor controlling I/O circuits
FIU Field Interface Unit
FLASH Permanent writeable memory for module firmware application
FPGA Field Programmable Gate Array
GFSS Group Fail Safe Switches; backup protection on outputs
HIA Host Interface ASIC, communicates to MP over IMB
HIU Host Interface Unit; circuit connecting the module to the IMB
HKAD Housekeeping A/D Converter: reads the environmental d
equipment board in the toolset application
HOIU Host Output Interface Unit
ID Identity code
IFIA Input circuit field interface ASIC
IFIU Input Field Interface Unit
IHIA Input Host Interface Adapter
IMB Inter'Module Bus
IMON Current Monitor
ISL Inter-Slice Link
LRAM Intermediate memory area in MP for IMB data
MP Main Processor
OFFLINE A slice has been powered down deliberately.
OFIA Output circuit field interface ASIC
OFIU Output Field Interface Unit
Issue 12 Feb 11 AN-T80020 39
Page 40

Trusted
TM
AN-T80020 Diagnostics Procedure
OVI, OVC Overcurrent trip
OVP Over Potential (also OVV)
OVV Overvoltage trip (also OVP)
PIC Programmable Intelligent Computer – microcontroller chip used here for channel control
PRM Programmable Ramp Module(?) – for test patterns
RAM Random Access Memory
REG Regulated
RIO Real Time I/O (operating system)
Semaphore Communication token
SHUTDOWN A slice has switched all its I/O to the configured shutdown state
SSL Smart Slot Link
SYNC Synchronisation
BOOT CODE Module in boot state and not running module firmware
VMON Voltage Monitor
Vpp Flash memory program voltage
Issue 12 Feb 11 AN-T80020 40
Page 41

Trusted
TM
AN-T80020 Diagnostics Procedure
0x0000 Series Codes (Firmware and System)
hese fault codes report firmware coding errors and should not be
Codes 0x0001 to 0x01FF
Modules: All
Codes 0x0200 to 0x02FF
Modules: All
Codes 0x0400 to 0x04FF
Modules: All except 8480 (see
note)
IMB FATAL ERROR
0x07nn (to 0x073F)
Modules:All
nn: Error flags in 6 bit word:
1: BSU Finite State Machine error
2: Timeout error
4: Slot error
8: Framing error
10: Symbol error
20: Packet error
IMB_DOUT_RESET
0x0740
Modules: 8442
The other modules report this
fault as 0x8740.
IMB_DOUT_DISABLE
0x0741
Modules: 8442
The other modules report this
fault as 0x8741.
FIA_INVALID_CALIBRATION
0x0804
Modules: All except 8442, 8472,
8473
T
seen in the field. Any example of these fault codes should be reported
to ICS Triplex Technology. The module will fail to start.
These indicate faults in the Flash memory. Return the module for
repair.
These indicate faults in programming the host interface ASIC. The
module will fail to start. Return the module for repair.
The faults are reported by the 8480 as 0x8400, 0x8401 or 0x8402.
Detects communication errors on the IMB, including the chassis
backplane. It also detects faults in the HIA.
Transient errors may occasionally occur in normal operation, so the
firmware logs these faults to check for a pattern. Single cases can
therefore be recorded and then ignored, but repetitive cases indicate a
module fault.
If faults appear on more than one modules in a chassis, then the
expander processor is faulty. If the module goes offline, replace the
module.
Action:
5 occurrences => enable logging (limited to 20 entries)
50 occurrences => disable logging, slice OFFLINE
The processor has requested a slice reset. This provides a
mechanism to reset the slice without removing / inserting the module.
The slice goes into a dormant state (less severe than 0x8740 because
the 8442 must hold its last output states) then resets itself.
This error is simply a by-product of the reset process; the I/O module
log or processor log may indicate the reason in earlier events.
Action:Slice in ‘Shutdown’ state (same as red Active LED on inserting a
module in an active slot), then it should automatically restart.
This provides a means for the processor to disable a slice. Some slice
faults can only be detected by the processor. In this case the
processor must have a mechanism for turning off a faulty slice. The
action is less severe than 0x8741 because the 8442 must hold its last
output states.
This fault is always a secondary symptom of an earlier fault; the I/O
module log or processor log will indicate the primary fault.
Action:Slice in ‘Shutdown’ state (same as red Active LED on inserting a
module in an active slot), will reactivate on pressing Reset.
Detects invalid calibration data stored in FLASH. The calibration data
will also be invalid if the module has never been calibrated. Return the
module for repair.
Action:Slice OFFLINE on transititon to ACTIVE
Issue 12 Feb 11 AN-T80020 41
Page 42

Trusted
TM
AN-T80020 Diagnostics Procedure
FIA_SLICE_STATE_DISCREP
0x0805
Modules:All except 8442 and
8480
FIA_OBSOLETE_
CALIBRATION
0x0806
Modules:Input
HIU_POWER_FEED
0x0900 (feed A), 0x901 (feed B)
Modules:All
If a slice is commanded to change to a new state, and this state is
different to the command sent to the other two states (‘Byzantine’
voting), it will increment a counter every 300ms. After 400 counts (2
minutes), it will signal this fault and go OFFLINE because its state does
not agree with the other two slices. This indicates a bus interface fault;
the module should be returned for repair.
The slice would already have gone to the SHUTDOWN state before
this fault, as a result of an IMB timeout.
Action:slice OFFLINE
Detects an obsolete calibration table. This error occurs when older
modules (prior to build 7) are updated. The module will not start. The
module must be re-calibrated to eliminate the error. Return the module
for repair.
Action:Slice will not boot
Detects a failed 24V power rail. A tripped chassis/system supply will
cause these faults on nearly every I/O module slice within the chassis
or system. If only one module reports these faults consistently, return
the module for repair.
Action: slice fault
Issue 12 Feb 11 AN-T80020 42
Page 43

Trusted
TM
AN-T80020 Diagnostics Procedure
0x1000 Series Codes (Host Interface Unit)
Some of these codes refer to ‘upstream’ and ‘downstream’ slices. The definitions depend on the circuit
concerned, but for the 0x1000 and 0x2000 codes relating to inter-slice communications, the definitions
are:
On slice A: ‘upstream’ = slice B, ‘downstream’ = slice C
On slice B: ‘upstream’ = slice A, ‘downstream’ = slice C
On slice C: ‘upstream’ = slice A, ‘downstream’ = slice B.
FLASH_ERASE_ERROR
0x1000
Modules: All when starting
FLASH_WRITE_ERROR
0x1001
Modules:All when starting
FLASH_VPP_LOW_ERROR
0x1002
Modules:All when starting
HIU_OVI_FAULT
0x1004
Modules:All except 8424, 8442,
8480
HIU_OVV_FAULT
0x1005
Modules:All except 8424, 8442,
8480
HIU_HKAD_TIMEOUT
0x1006
Modules:All
HIU_ISL_NO_SYNC
0x1007
Modules:Output except 8480
Detects a bad FLASH device or interface whilst erasing firmware.
Return the module for repair.
Action:Slice will not boot
Detects a bad FLASH device or interface whilst writing firmware.
Return the module for repair.
Action:Slice will not boot
Detects a bad FLASH device, interface, or low supply voltage whilst
erasing or writing firmware. Check the system supply voltage. If the
supply is healthy, return the module for repair.
Action:Slice will not boot
Checks the operation of the power supply over-current (OVI) trip.
Return the module for repair.
Action:Slice fault
Checks the operation of the power supply over-voltage (OVV) trip.
Check the system supply voltage, else return the module for repair.
Action:Slice fault
This is a timeout on fetching the HIU HKAD data. Detects a faulty
Housekeeping A/D or faulty interface to the HIA. Return the module for
repair.
Action:Slice fault
Checks for two fault conditions -
1) test loop synchronization with neighbor slices via ISL (increments
fault filter on failure)
2) test loop stall (4.37 minutes max)
Detects faults in the ISL and/or a dead slice that prevents test
synchronization. Also detects a test loop stall, possibly caused by
excessive switch command transitions that cause test abortion.
If another slice is offline, ignore this fault. Failing this, check for heavy
switching demand. Failing this, return the module for repair.
This fault can lead to a module shutdown on firmware before release
3.5 (see TN20056).
Action:Slice fault
Issue 12 Feb 11 AN-T80020 43
Page 44

Trusted
TM
AN-T80020 Diagnostics Procedure
HIU_ISL_CRC_ERR
0x1008
Modules:All except 8442, 8472,
8473, 8480
HIU_ISL_STUCK_U_ERR
0x1009
Modules:Input
HIU_ISL_STUCK_D_ERR
0x100A
Modules:Input
HIU_HKAD_ERR
0x101n
Modules:All
Subcode: n = HKAD channel
5V HIU, n = 0 to 7
3.3V HIU, n = 0 to 10
HIU_SSL_ERR
0x1020
Modules:All
This indicates a data check failure on data from the other slices over
the inter-slice link. Detects a corrupted ISL link, including faulty ISL
RAM in the sending or receiving slice.
If a slice is offline, these faults are common in the remaining two slices
and can be ignored. If all slices are online, and the fault is persistent,
eturn the module for repair.
r
Action:Slice fault
This indicates stalled communications with the ‘upstream’ slice.
If the fault is persistent, return the module for repair.
Action:Slice fault
This indicates stalled communications with the ‘downstream’ slice.
If the fault is persistent, return the module for repair.
Action:Slice fault
This test verifies min/max limits on the host interface (HIU)
Housekeeping A/D (HKAD) channels. Detects faulty operation of the
HIU power system and overload faults on the HIU and front panel unit.
It also detects errors in the Housekeeping A/D and its serial link to the
host interface ASIC. The HKAD data can be checked with the
command ‘get reg HKAD’.
These faults may be tripped by severe genuine power supply voltage or
temperature excesses (at 37 volts or 90 degC). Due to the likely
damage and ageing, the advice remains:
Return the module for repair.
Action:Slice OFFLINE
This test compares the received SSL (Smart Slot Link) tag from the
partner module, to the value that the MP says should be received.
Verifies that the SSL connection between partnered modules is
operational. It detects opens and shorts on one or more of the smart
slot links.
In order for this fault to be detected, the module must already be
partnered. If the module is inserted without the Smart Slot jumper
cable, the MP will not partner the module and the fault will not be
detected.
The fault is not consistently indicated on both the ACTIVE and
STANDBY modules, although it is always reported on the STANDBY
module.
During a hot swap, if the new module indicates faults, try another
module. If the second module is successful, send the first for repair.
When swapping back from a Smart Slot to a default slot, always
remove the Smart Slot module from the chassis before disconnecting
the cable. If the cable is removed first, this fault will occur and the
processor will swap back to the Smart Slot module, which is now
disconnected from the field.
Action:Slice fault
Issue 12 Feb 11 AN-T80020 44
Page 45

Trusted
TM
AN-T80020 Diagnostics Procedure
HIU_ISL2_SYNC_TST
0x103n
Modules:8442,8472, 8473
Subcode: n = discrepant slice ID
(0, 1, 2 for slice A,B,C)
HIU_ISL2_SYNC_ERR
0x104n
Modules:Output
Subcode: n = Sync Error bit
position (0, 1, 2)
Detects latent faults in the inter-slice link voter logic and discrepancy
detection logic by injecting discrepant data every minute.
If a slice has gone offline, this fault may appear on the other two slices
and may be ignored. Otherwise return the module for repair.
ction:Slice fault
A
etects a failed slice or a faulty ISL bus connection between slices.
D
If a slice has gone offline, this fault may appear on the other two slices
and may be ignored. Otherwise return the module for repair.
0 = fault on this slice
1 = fault on upstream slice
2 = fault on downstream slice
Action:Slice fault
Issue 12 Feb 11 AN-T80020 45
Page 46

Trusted
TM
AN-T80020 Diagnostics Procedure
0x2000 Series Codes (Host Interface ASIC)
Some of these codes refer to ‘upstream’ and ‘downstream’ slices. The definitions depend on the circuit
concerned, but for the 0x1000 and 0x2000 codes relating to inter-slice communications, the definitions
are:
On slice A: ‘upstream’ = slice B, ‘downstream’ = slice C
On slice B: ‘upstream’ = slice A, ‘downstream’ = slice C
On slice C: ‘upstream’ = slice A, ‘downstream’ = slice B.
HIA_INVALID_IMAGE
0x2000
Modules:BOOT CODE
ISL_STARTUP_ERR
0x2000
Modules: 8480
HIA_INVALID_IMAGE_CRC
0x2001
Modules:BOOT CODE
HIA_CONFIGURE_ERROR
0x2002
Modules:BOOT CODE
HIA_HKAD_TIMEOUT
0x2003
Modules:BOOT CODE (5V only)
(See 0x1006 for 3.3V modules)
ISL_MULTI_ERR
0x2070
Modules: 8480
ISL_CRC_ERR
0x208n
Modules: 8480
Subcode: n = discrepant slice
(1 = ‘upstream’, 2 = ‘downstream’)
This test checks the Host Interface ASIC (HIA) programming file in
FLASH on either loading the boot code or the application firmware.
Detects a FLASH memory fault or missing HIA boot or application
code. The module will stay in boot mode. Return the module for repair.
Action:Slice will not boot
The slice has failed to establish synchronisation with the other slices
after 20 seconds from starting up. Return the module for repair.
Action:Slice OFFLINE
This test performs a CRC check on the HIA programming file in FLASH
on loading the boot code or application firmware (only the one being
loaded is checked). Detects a FLASH memory fault or corrupted HIA
boot or application code. The module will stay in boot mode. Return the
module for repair.
Action:Slice will not boot
This test reports on errors seen whilst programming the Host Interface
ASIC. Detects a faulty HIA or a faulty interface between the HIA and
the DSP. The module will stay in boot mode. Return the module for
repair.
Action:Slice will not boot
This is a timeout on fetching the HIU HKAD data. Detects a faulty
Housekeeping A/D or faulty interface to the HIA. Return the module for
repair.
Action:Slice will not boot
Communications status errors detected with both of the other two
slices.
Return the module for repair.
Action:Slice OFFLINE
CRC data check failed on communications with another slice.
Return the module for repair.
Action:Slice fault
Issue 12 Feb 11 AN-T80020 46
Page 47

Trusted
TM
AN-T80020 Diagnostics Procedure
ISL_SEQ_ERR
0x209n
Modules: 8480
Subcode: n = discrepant slice
(1 = ‘upstream’, 2 = ‘downstream’)
ISL_DSBL_ERR
0x20A0
Modules: 8480
ISL_VOTER_ERR
0x2200
Modules: 8480
BTQ_STALLED
0x2201
Modules: 8480
FIU_HOTSWAP_ERR
0x2300
Modules: 8480
ISL_X_ERR
0x24nn
Modules: 8480
ISL_Y_ERR
0x25nn
Modules: 8480
ISL_Z_ERR
0x26nn
Modules: 8480
Sequence counter discrepancies on communications with another
slice.
Return the module for repair.
Action:Slice fault
equest received from other slices to force this slice offline.
R
This is probably a secondary result of earlier faults, e.g. an 0x8741
from the processor shutting down the slice. If the slice keeps going
offline, return for repair.
Action:Slice OFFLINE
A fault has been found on the inter-slice link voter circuit.
Return the module for repair.
Action:Slice fault
(Background Test Quantum) The state machine that co-ordinates test
scheduling between slices has stopped. This is likely to be due to a
failure on another slice; check the health of the other slices.
Action:Slice fault
A hotswap between modules has completed but the handover of
current drive has not completed. Check the health of both modules to
find the primary cause.
Action:Slice fault
Indicates a fault on the inter-slice communications, and this slice is at
fault. The subcode indicates the detail of the fault in communications
(e.g. synchronization, data check, framing, timing), but the detail is not
relevant to diagnostics.
Return the module for repair.
Action:Slice fault
Indicates a fault on the inter-slice communications, and the ‘Y’ slice is
at fault. (Subcode as ISL_X_ERR)
Return the module for repair.
On slice A: Y is slice B
On slice B: Y is slice A
On slice C: Y is slice A
Action:’Y’ slice OFFLINE
Indicates a fault on the inter-slice communications, and the ‘Z’ slice is
at fault. (Subcode as ISL_X_ERR)
Return the module for repair.
On slice A: Z is slice C
On slice B: Z is slice C
On slice C: Z is slice B
Action:’Z’ slice OFFLINE
Issue 12 Feb 11 AN-T80020 47
Page 48

Trusted
TM
AN-T80020 Diagnostics Procedure
0x3000 Series Codes (Field Interface ASIC)
his test checks the application firmware in FLASH on loading the Field
FIA_INVALID_IMAGE
0x3000
Modules:All
FIA_INVALID_IMAGE_CRC
0x3001
Modules:All
FIA_CONFIGURE_ERROR
0x3002
Modules:All
FIA_NOT_PRESENT
0x3003
Modules:All
FIA_POWERUP_ERROR
0x3004
Modules:All
FIA_CONFIGURE_TIMEOUT
0x3005
Modules:All
FIA_HIA_SYNC_FAULT
0x3006
Modules:BOOT CODE
FIA_FIA_SYNC_FAULT
0x3007
Modules:BOOT CODE
FIA_CHANNEL_FAULT
0x31nn
Subcode:nn = output channel
0x01 to 0x28 (1 to 40)
Modules:8480
T
Interface firmware. Detects a FLASH memory fault or missing
firmware. The module will stay in boot mode. Return the module for
repair.
Action:Slice will not boot
This test performs a CRC check on the firmware in FLASH on loading
the Field Interface firmware. Detects a FLASH memory fault or
corrupted firmware. The module will stay in boot mode. Return the
module for repair.
Action:Slice will not boot
The field interface adapter controllers couldn’t be initialized. The
module will stay in boot mode. Return the module for repair.
Action:Slice will not boot
The field interface adapter did not respond when turned on. The
module will stay in boot mode. Return the module for repair.
Action:Slice will not boot
The field interface adapter did not draw the expected current when
turned on. The module will stay in boot mode. Return the module for
repair.
Action:Slice will not boot
The field interface adapter controllers’ initialization took too long. The
module will stay in boot mode. Return the module for repair.
Action:Slice will not boot
Synchronisation fault on the Host Interface adapter. Return the module
for repair.
Action:Slice fault
Synchronisation fault on the Field Interface adapter. Return the module
for repair.
Action:Slice fault
Detects a faulty channel on the field interface adapter (see also
0x52nn)
Swap the module and test it in an unused unconnected slot. If it still
indicates the same fault, return the module for repair. If its replacement
has the same fault, check the field circuits and earthing.
Action:Slice fault
Issue 12 Feb 11 AN-T80020 48
Page 49

Trusted
TM
AN-T80020 Diagnostics Procedure
0x4000 Series Codes (Module firmware operation)
his test checks the application firmware in FLASH on either loading
APP_INVALID_IMAGE
0x4000
Modules:All
APP_INVALID_IMAGE_CRC
0x4001
Modules:All
APP_BOOT_ERROR
0x4002
Modules:All
APP_STACK_FAULT
0x4003
Modules:All
APP_SELF_TEST_FAULT
0x4004
Modules:All
SFIU_PI_LATE
0x4020
Modules:8442
T
the boot code or the application firmware. Detects a FLASH memory
fault or missing firmware. The module will stay in boot mode. If loading
application firmware, erase and try again, else return the module for
repair. If loading boot firmware, return the module for repair.
Action:Slice will not boot
This test performs a CRC check on the firmware in FLASH on either
loading the boot code or the application firmware. Detects a FLASH
memory fault or corrupted firmware. The module will stay in boot mode.
If loading application firmware, erase and try again, else return the
module for repair. If loading boot firmware, return the module for repair.
Action:Slice will not boot
Checks to see if the firmware application failed to boot the previous
time. A code is stored in memory when the boot process fails. This
code prevents further boot attempts. If the module fails to start, return it
for repair, otherwise ignore this fault.
Action:Slice will not boot
This test checks the stack in the background. Checks for S/W errors
that corrupt the stack. Report to ICS Triplex Technology.
Action:Slice OFFLINE
Declares a fault if the test task does not execute within 2 minutes (input
modules) or 30 minutes (output modules). Also set if one of the
checkpoints in the code is not run, i.e. not all expected code has run.
This is common after a poor startup or a bypass timer lockout and is
usually a secondary symptom of these or other faults. If it occurs with
no recent fault that would have caused the slice to turn off, report to
ICS Triplex Technology.
Action:Slice OFFLINE
The pulse input testing has been delayed too long. This is caused by
abnormal processing burden but may indicate a task scheduling
problem. Report to ICS Triplex Technology.
Action:Slice fault
Issue 12 Feb 11 AN-T80020 49
Page 50

Trusted
TM
AN-T80020 Diagnostics Procedure
0x5000 Series Codes (Input Field Interface Unit)
etects serious errors in field interface/Host interface data transfer
FIU_HFIU_RAM_FAIL
0x5000
Modules:Input, 8480
OFIU_FIA_SYNC_FAULT
0x500n
Subcode: n = quadrant (0 to 3)
Modules:8472, similar in 8442
FIU_HIA_SYNC_FAULT
0x5001
Modules:Input
FIU_FIA_SYNC_FAULT
(input modules)
0x5002
Modules:Input
FIU_FIA_SYNC_FAULT
(output modules)
0x5002
Modules:Output except
8472,8442
FIU_REF_DRIFT
0x5004
Modules:Input
OFIU_FIA_SYNC_FAULT
0x5004
Modules:8442,8472
FIU_REF_OUTOFBOUNDS
0x5005
Modules:Input
HSIU_RAM_TEST_FAULT
0x5005
Modules:8442
OFIU_IMON_BAL_FAULT
0x5005
Modules:8472
IFIU_FREQ_FAULT
0x5006
Modules:Input
D
RAM such as address/data faults. Return the module for repair.
Action:Slice OFFLINE
Detects a failed OFIU quadrant (invalid FPGA configuration data,
power fault, logic fault, etc.) or an ISL synchronization fault. Return the
module for repair.
Action:Slice OFFLINE
Detects serious errors (or noise) in the FIU comms link such as a faulty
optocoupler, FIA, or FIU power supply. Return the module for repair.
Action:Slice OFFLINE
Detects noise in the IFIU comms link, also in the HIA and FIA. Return
the module for repair.
Action:Slice OFFLINE
Detects serious errors (or noise) in the OFIU comms link such as a
faulty optocoupler or a dead output group. Return the module for
repair.
Action:Slice OFFLINE
Checks internal reference channel 41 for drifting. This channel is used
to monitor the live channels. If the fault is persistent, return the module
for repair.
Action:Slice fault
This is similar to 500n above for 8472, but shows that all four quadrants
are faulty. This may be a slice fault, so the slice is set offline. Return
the module for repair.
Action:Slice OFFLINE
Checks internal reference channel 41 for passing limits. This channel is
used to monitor the live channels. Return the module for repair.
Action:Slice OFFLINE
Detects any fault in free RAM. Return the module for repair.
Action:Slice OFFLINE
Checks for imbalance in output circuit current measurement. If the fault
is persistent, return the module for repair.
Action:Slice fault
Checks the HIU and FIU logic that is used to control and generate the
FIU operating frequency. The operating frequencies are critical for
input channel fault detection. Return the module for repair.
Action:Slice OFFLINE
Issue 12 Feb 11 AN-T80020 50
Page 51

Trusted
TM
AN-T80020 Diagnostics Procedure
HSIU_RAM_PAGE_FAULT
0x5006
Modules:8442
OFIU_PLL_FAULT
0x5006
Modules:8472
IFIU_FIUCTRL_TEST_FAULT
0x5007
Modules:Input
OFIU_ISLSEQ_FAULT
0x5007
Modules:8472
FIU_DSCRP_TST_LATE
0x5008
Modules: 8442, 8472
HSIU_RELAY_CMD_
CHECKSUM ERR
0x5009
Modules:8442
OFIU_XMON_CNT_ALL_
FAULT
0x501n
Subcode: n = quadrant (0 to 3)
Modules:8472
OFIU_ISL_SW_TEST_DISCREP
0x5014
Modules:8472
SFIU_IO_TEST_REG_SLICE_
DISCREP
0x5014
Modules:8442
SFIU_IO_TEST_ERR
0x5015
Modules:8442
SFIU_TEST_CTRL_ERR
0x5016
Modules:8442
Detects any fault in free RAM that is related to RAM paging. Return the
module for repair.
Action:Slice OFFLINE
Detects faults in the field interface timing control circuitry (the test
schedule is locked to the AC cycle). These faults may be a secondary
effect of other faults. If the fault is persistent, return the module for
repair.
Action:Slice fault
Detects serious failures in the FIU comms link path between the IHIA
and IFIA, using an echoed token. Return the module for repair.
Action:Slice OFFLINE
Detects failures in the FIU comms link path between slices using a
sequential counter. Return the module for repair.
Action:Slice fault
The slice discrepancy data collection has been delayed so that the data
from each slice is now too far apart to be relevant. Check for other
faults that may explain the delay; otherwise return the module for repair
if the fault appears again after pressing Reset.
Action:Slice fault
Detects errors in the commands to output relays. Return the module for
repair.
Action:Slice OFFLINE
All channel PICs have failed to respond properly on one quadrant
suggesting a common fault. Similar to 56mn (indicates a single PIC at
fault). Return the module for repair.
Action:Slice fault
Software test register is discrepant between this slice and the other
two. This fault may be a secondary effect of other faults. If the fault is
persistent, return the module for repair.
Action:Slice fault
Test control register is discrepant between this slice and the other two.
If the fault is persistent, return the module for repair.
Action:Slice fault
Test control register is different to other slices but no slice fault
indicated. If the fault is persistent, return the module for repair.
Action:Slice fault
Incorrect data in test control register. If the fault is persistent, return the
module for repair.
Action:Slice fault
Issue 12 Feb 11 AN-T80020 51
Page 52

Trusted
TM
AN-T80020 Diagnostics Procedure
SFIU_TRIP_AUTO_RESET
0x502n
Subcode: n = output (0 to 5)
Modules:8442
FIU_TRIP_AUTO_TRIP
S
0x503n
Subcode: n = output (0 to 5)
Modules:8442
SFIU_TRIP_AUTO_RE_TRIP
0x504n
Subcode: n = output (0 to 5)
Modules:8442
HSIU_ISLDATA_AUX_ERR
0x505n
Subcode: n = slice (see text)
Modules:8442
IFIU_CHAN_INDEP_FAULT
0x51nn or 0x51mn
Modules:Input, 8442
Auto-reset of a 1oo3 trip that persisted for too long. This may be the byproduct of other faults. If the fault is persistent, return the module for
repair.
Action:Slice fault
2oo3 trip that co-erced a 3oo3 trip to maintain congruency. This may be
the by-product of other faults. If the fault is persistent, return the
module for repair.
Action:Slice fault
Re-trip after an auto-reset to prevent a spurious drive signal. This may
be the by-product of other faults. If the fault is persistent, return the
module for repair.
Action:Slice fault
Background checks on the inter-slice change-over data (‘sanity check’
data word is wrong, CRC mismatch, sequence error). This may be the
by-product of other faults. If the fault is persistent, return the module for
repair.
1 = fault on upstream slice
2 = fault on downstream slice
On slice A: ‘upstream’ = slice B, ‘downstream’ = slice C
On slice B: ‘upstream’ = slice A, ‘downstream’ = slice C
On slice C: ‘upstream’ = slice A, ‘downstream’ = slice B.
Action:Slice fault
Detects crosstalk between channels. This could be a channel to
channel external short or interaction, or a short or interaction inside the
module.
For inputs: subcode nn = channel, 0x00 to 0x29 (0 to 41)
(channels 0 and 41 are internal reference channels.)
For 8442: subcode mn, m = group 0 – 2, n = speed input channel 0 – 8.
Swap the module and test it in an unused unconnected slot. If it still
indicates the same fault, return the module for repair. If its replacement
has the same fault, check the field circuits and earthing.
Action:Slice fault
Issue 12 Feb 11 AN-T80020 52
Page 53

Trusted
TM
AN-T80020 Diagnostics Procedure
IFIU_CHANNEL_FAULT
0x52nn or 0x52mn
Modules:Input, 8442, 8480
IFIU_CHAN_PIN_FAULT
0x53nn
Modules:Input
SFIU_SPEED_CHAN_QUAD_
DISCREP
0x53mn
Modules:8442
VFMON_RESPONSE_ERROR
0x55mn
Modules: 8472
OFIU_XMON_COUNT_ERR
0x56mn
Modules:8472
Subcode:
m = quadrant (0 to 3),
n = channel (0 to F)
Detects a faulty input channel. Faults could be on the field interface
adapter or due to field effects; later firmware is more robust to field
faults.
For inputs and 8480: subcode nn = channel, 0x00 to 0x29 (0 to 41)
channels 0 and 41 are internal reference channels.)
(
For 8442: subcode mn, m = quadrant 0 – 2, n = speed input channel 0
– 8.
Swap the module and test it in an unused unconnected slot. If it still
indicates the same fault, return the module for repair. If its replacement
has the same fault, check the field circuits and earthing.
For 8480 firmware before 110, this fault can occur during some output
ramps; upgrade to latest firmware.
For 8442, if there are faults reported in the log on more than one
quadrant, the fault is probably outside the module (T8846 or field input).
Action:Slice fault
Detects a short at the IFIA PRM DAC drive pins and the IFIA sigma
delta feedback drive pins. This includes shorts between adjacent pins
and shorts to the power rails. Return the module for repair.
Subcode nn = channel, 0x00 to 0x29 (0 to 41)
(channels 0 and 41 are internal reference channels.)
Action:Slice fault
Detects a discrepancy between measured tooth periods between
quadrants. If the fault is persistent, return the module for repair.
Subcode mn, m = group 0 – 2, n = speed input channel 0 – 8.
Action:Slice fault
Detects problems with the voltage monitoring programmable ICs (PICs)
and the readings they return. The subcode meanings vary between
8472 variants and are not necessary for field diagnostics.
550n to 554n (Data inconsistent or discrepant): if the same fault code is
persistent, return for repair.
555n is a definite fault (a PIC appears to be dead); return the module
for repair.
Action: Slice fault
Detects a PIC clock frequency error or a faulty PIC response packet. A
faulty response packet can be caused by a dead PIC device, failed
3.3V PIC voltage, failed Iso-loop, or open/shorted connection to the
OFIA pin.
It is possible for PICs to crash on severe noise, e.g. short circuit
channel. Swap the module and test it in a different working slot. If the
fault is persistent, return the module for repair.
Action:Slice fault
Issue 12 Feb 11 AN-T80020 53
Page 54

Trusted
TM
AN-T80020 Diagnostics Procedure
OFIU_IMON_AV_DC_ERR
0x57mn
Modules:8472
Subcode:
m = quadrant (0 to 3),
n = channel (0 to F)
OFIU_VMON_AV_DIFF_ERR
0x58mn
Modules:8472
Subcode:
m = quadrant (0 to 3),
n = channel (0 to F)
Detects offset errors in the current monitor op-amp. This can be
caused by a gain/offset resistor fault or op-amp fault. If the fault is
persistent, return the module for repair.
Action:Slice fault
Detects a leaky MOSFET in the back-to-back MOSFET pair that
comprises each AC switch. It also detects a fault in the VMON sense
resistor for each MOSFET drain. Leakage currents will cause a VMON
phase imbalance as the AC voltage changes direction. These faults
have been seen in modules that may have been contaminated at
manufacture. If the fault is persistent, return the module for repair.
Action:Slice fault
Issue 12 Feb 11 AN-T80020 54
Page 55

Trusted
TM
AN-T80020 Diagnostics Procedure
0x6000 Series Codes (Output Field Interface Unit)
etects a stuck bias signal in the Group Fail Safe Switch (GFSS). This
OFIU_GFSS_BIAS_FAULT
0x603n
Modules:Output (not 8442,72 or
80)
Subcode:n = output group
8471: n = 0 to 3
Others: n = 0 to 4
OFIU_GFSS_EN_FAULT
0x604n
Modules:Output (not 8442,72 or
80)
Subcode:n = output group
8471: n = 0 to 3
Others: n = 0 to 4
OFIU_STUCK_ON_FAULT
0x605n
Modules:Output (not 8480)
Subcode:
8471: n = output group 0 to 3
8472: n = channel (0 to F)
8442: n = output (0 to 5)
Others: n = output group 0 to 4
D
fault may also be caused by channel current noise, which may be
caused by poor zero volt referencing or nonlinear loads (the test is less
sensitive from TUV 3.5 firmware). For persistent faults, check the load
linearity and try a replacement module.
Action:Slice fault
Detects a stuck FETin the Group Fail Safe Switch (GFSS). This also
includes a stuck GFSS_BIAS_ENABLE in the owner slice, such that
the bias cannot be turned off. This fault may also be caused by channel
current noise, which may be caused by poor zero volt referencing or
nonlinear loads (the test is less sensitive from TUV 3.5 firmware). For
persistent faults, check the load linearity and try a replacement module.
Action:Slice fault
Checks for an output channel that is stuck ON, i.e the channel has
been commanded OFF and there is a problem with the load voltage or
load current that suggests the load may still be powered. This is a
critical fault for a safety related output that must be able to de-energise.
There are two main sets of fault conditions:
1) Output commanded off, but current AND voltage on output
2) Output commanded off, and channel is not off, the slice recently
changed state and another slice went offline.
See AN-80004 for details on channel state definitions.
This fault can be easily induced by shorting an output channel to
VFIELD. This has been observed in systems caused by corrosion in
junction boxes in the field, and with direct lamp test circuits.
The fault can also occur due to switching noise from other channels in
a group if the resulting current measurement noise is V NLTHRESH.
Ensure that outputs in each group have similar loads (do not mix heavy
and light loads in a group).
A low value of NLTHRESH will increase the test sensitivity because it is
used as the maximum allowed current. Check that the NLTHRESH
settings are appropriate (see TN20031 and AN-80004). A setting of 5 is
the recommended minimum. 3 is possible but significantly increases
the risk of these faults and shutdowns. 1 is below the measurement
resolution and impossible.
The 8472 test is a clearer indication of a module fault, due to different
circuitry. 8442 is similar.
Note that on 8442 firmware release 3.5 this error may occur with no
SOFTA present even if marked as absent in the INI; in this instance a
firmware upgrade is recommended.
Action:Slice OFFLINE, commonly resulting in a module shutdown.
Issue 12 Feb 11 AN-T80020 55
Page 56

Trusted
TM
AN-T80020 Diagnostics Procedure
OFIU_CMD_RESP_ERR
0x606n
Modules:Output
Subcode:
8471, 8442: n = output group 0 to
3
8472: n = quadrant (0 to 3)
Others: n = output group 0 to 4
For all:n = 0xF for HOIU RAM
fault
OFIU_STUCK_OFF_FAULT
0x607n
Modules:8472
Subcode:
8472: n = channel (0 to F)
OFIU_STUCK_X_FAULT
0x608n
Modules:8472
Subcode:
8472: n = channel (0 to F)
Detects a fault in the safety-critical command path. This is usually
caused by a discrepancy in the MP command to each HIU slice or a
fault in the circuits involved in passing the output commands. Swap the
module and try in another slot (it usually clears after a restart). If there
are still similar (communications) faults, return the module for repair.
ction:Slice OFFLINE
A
The DSP declares a STUCK_OFF fault if a channel is commanded ON
and the channel state = OFF. Detects a double fault condition whereby
there is insufficient load voltage when the channel is commanded ON
(based on the no-load threshold NLTHRESH). This could be caused
by a combination of open MOSFETs and/or stuck drive signals. It may
also be caused by incorrect current measurements caused by noise.
If the fault is persistent, return the module for repair.
Action:Slice fault
The DSP declares a STUCK_X fault if the channel state is not a
conclusive ON or OFF state. Detects multiple faults in the SMON
resistor network and/or MOSFET switches. Return the module for
repair.
Action:Slice fault
Batches of all possible 0x609n, An, Bn and Cn faults have been seen in 8472s with many 58nn faults;
these may be the by-products of manufacturing problems. Return the module for repair.
OFIU_LINK_DSCRP_CMD_TST
0x609n
Modules:8472, 8442
Subcode: n = quadrant (0 to 3)
OFIU_ LINK_DSCRP_CFG_TST
0x60An
Modules:8472, 8442
Subcode: n = quadrant (0 to 3)
Detects latent faults in the Field Interface Adapter (FIA) command voter
logic and discrepancy detection logic. These faults are likely to be
internal to the FIA unless accompanied by 0x60Bn.
If a single fault code is persistent, return the module for repair.
If faults are raised on all quadrants, it may be caused by a dead slice. If
there is not a slice offline, return the module for repair.
Action:Slice fault
Detects latent faults in the FIA config clock and data voter logic and
discrepancy detection logic. These faults are likely to be external to the
FIA.
If a single fault code is persistent, return the module for repair.
If faults are raised on all quadrants, it may be caused by a dead slice. If
there is not a slice offline, return the module for repair.
Action:Slice fault
Issue 12 Feb 11 AN-T80020 56
Page 57

Trusted
TM
AN-T80020 Diagnostics Procedure
OFIU_ LNK_DSCRP_CMD_ERR
0x60Bn
Modules:8472, 8442
Subcode: n = quadrant (0 to 3) or
all quadrants (5)
OFIU_ LINK_DSCRP_CFG_ERR
0x60Cn
Modules:8472, 8442
Subcode: n = quadrant (0 to 3) or
all quadrants (5)
The RPM and acceleration discrepancy faults below have incorrect subcodes. The last digit is always
the input channel number within the speed group. However, the speed group number (0,1,2) has been
OR-masked with the third digit, so these faults will be spread over 60Dn to 60Fn. This error is present
in 8442 firmware builds up to 136 and has not been fixed at the time of writing. Review the other
messages in the log to find the true fault and group number.
SFIU_RPM_DISCREP
0x60Dn or 0x60En
Modules: 8442
Subcode: n = input within speed
group (0 to 2)
SFIU_ACCEL_DISCREP
0x60En or 0x60Fn
Modules: 8442
Subcode: n = input within speed
group (0 to 2)
If this fault is reported on a single quadrant, it indicates an open/shorted
command between an HIU slice and the FIA of that quadrant. If the
fault is persistent, return the module for repair.
If the fault is reported on all quadrants (60B5), it indicates a
discrepancy between the switch command registers on the HIU slices.
his can be caused by a dead slice, a discrepant MP command to one
T
of the slices, or a discrepant software overcurrent decision. If there is
not a slice offline, return the module for repair.
Action:Slice fault
If this fault is reported on a single quadrant, it indicates an open/shorted
config clock/data line between an HIU slice and the OFIA of that
quadrant. If the fault is persistent, return the module for repair.
If the fault is reported on all quadrants (60C5), it indicates a
discrepancy between the HIU slices. This is usually caused by a dead
slice. If there is not a slice offline, return the module for repair.
Action:Slice fault
One of the speed input channels is measuring a discrepant speed (with
a difference more than the Speed Discrepancy Threshold set in the
System.INI speed monitor template).
Check the input sensors are working properly. If they are working, and
the module is measuring the input speed, the discrepancy threshold
may need to be increased in the System.INI speed template. If the
module is not seeing a speed signal, check the input FTA.
Action:Slice fault
One of the speed input channels is measuring a discrepant
acceleration (with a difference more than the Acceleration Discrepancy
Threshold set in the System.INI speed monitor template).
Check the input sensors are working properly. If they are working, and
the module is measuring the input speed, the discrepancy threshold
may need to be increased in the System.INI speed template. If the
module is not seeing a speed signal, check the input FTA.
Action:Slice fault
Issue 12 Feb 11 AN-T80020 57
Page 58

Trusted
TM
AN-T80020 Diagnostics Procedure
Some 6nnn series faults can occur on 8442 modules at firmware release 3.5 when some or all Speed
Output FTAs are not fitted, despite ‘SOFTA not present’ configured in the INI. Firmware build 133 (TUV
3.5.1) properly gates out these diagnostic tests when there is no SOFTA.
8442 module outputs and the Speed Output FTAs must be considered part of the same circuit; if
replacement of one part does not cure the fault, try replacing the other part.
OFIU_BTM_SW_SHORT
0x61nn
Modules:Output (not 8442,8480)
Subcode:nn = OFIU output
channel
8471: 0x00 to 0x1F (1 to 32)
Others: 0x00 to 0x27 (1 to 40)
8472: mn; m = quadrant (0 to 3),
n = channel (0 to F)
8442: see below
SFIU_RELAY_CONTACT_TST
0x61mn
Modules:8442
Subcode: mn; m = quadrant (0 to
3), n = output (0 to 5)
OFIU_CHANNEL_TYPE_ERR
0x62nn
Modules:8448
Subcode:nn = channel, 0x00 to
0x27 (1 to 40)
SFIU_RELAY_CONTACT_ERR
0x62mn
Modules:8442
Subcode: mn = quadrant (0 to 3),
output (0 to 5)
OFIU_FET_OPEN
0x63nn
Modules:Output (not 8442,8480)
Subcode:nn = output channel
8471: 0x00 to 0x1F (1 to 32)
Others: 0x00 to 0x27 (1 to 40)
8472: mn = quadrant (0 to 3),
channel (0 to F)
DC modules: Detects a bottom FET short, including a stuck control
signal from the neighbour slice. If the voltage on a de-energised
channel is noisy, a spurious fault may be reported on OFF channels.
Check the field wiring for noise and try a replacement module.
This error code also applies to 8448 input channels. For this reason, a
1K resistor is needed in series with the channel for zener-terminated or
volt-free inputs, to allow the module to manipulate the channel. Refer to
PD-8842.
For 8472, the test covers shorts to each switch as indicated by the
quadrant. If the fault is persistent, return the 8472 module for repair.
Action:Slice fault
This test exercises the module’s output channel FETs as above but
indicates a fault according to the relay that the channel is driving. If the
fault is persistent, return the module for repair. If the fault indicates
random channels, check the field supply voltage.
Action:Slice fault
A fault is reported if the channel is not configured as an INPUT or an
OUTPUT. Since there is no normal cause for this fault, report it to ICS
Triplex Technology.
Action:Slice fault
An output relay contact has failed on the Speed Output FTA. Replace
and return the FTA when possible.
Note that on firmware release 3.5 this error occurs with no SOFTA
present even if marked as absent in the INI; in this instance a firmware
upgrade is recommended.
Action:Slice fault
DC modules: Detects open FET/MOSFET switches or faults in the
drive or sense circuits. This fault may be triggered by noisy field loads
that may make one slice detect an open circuit. If the fault is persistent,
return the module for repair.
This error code does not apply to 8448 and 8449 channels that are
configured as inputs.
Action:Slice fault
Issue 12 Feb 11 AN-T80020 58
Page 59

Trusted
TM
AN-T80020 Diagnostics Procedure
SFIU_RELAY_IMON_TST
0x63mn
Modules:8442
Subcode: mn:
m = quadrant (0 to 3) + current
monitor (0 or 4 for #1 or 2),
n = output (0 to 5)
SFIU_RELAY_IMON_ERR
0x64mn
Modules:8442
Subcode: mn:
m = quadrant (0 to 3)
n = output (0 to 5)
OFIU_HWOVC_FAULT
0x640n
Modules:8472
Subcode: n = channel (0 to F)
OFIU_OVP_FAULT
0x65nn
Modules:Output (not
8472,8442,8480)
Subcode:nn = output channel
8471: 0x00 to 0x1F (1 to 32)
Others: 0x00 to 0x27 (1 to 40)
SFIU_RELAY_DRIVE_TST
0x65mn
Modules:8442
Subcode: mn = quadrant (0 to 3),
output (0 to 5)
OFIU_LINK_ERR
0x66nn
Modules:Output (not 8472,
8442,8480)
Subcode:nn = output channel
8471: 0x00 to 0x1F (1 to 32)
Others: 0x00 to 0x27 (1 to 40)
SFIU_RELAY_DRIVE_ERR
0x66mn
Modules: 8442
Subcode: mn = quadrant (0 to 3),
output (0 to 5)
This tests the current flowing in a relay on a speed output FTA during
switching tests. Replace and return the FTA when possible.
Action:Slice fault
Current is measured in a relay coil when it should be de-energised or
vice versa on the Speed Output FTA. Replace and return the FTA
when possible.
Note that on firmware release 3.5 this error occurs with no SOFTA
present even if marked as absent in the INI; in this instance a firmware
upgrade is recommended.
Action:Slice fault
Detects a faulty overcurrent (OVC) detector. An OVC has been
detected but it did not lead to a de-energised load, and the OVC alarm
can’t be reset. Return the module for repair.
Action:Slice fault
Detects a faulty overvoltage (OVP) detector. If the fault is persistent,
return the module for repair.
This error code does not apply to 8448 and 8449 channels that are
configured as inputs.
Action:Slice fault
8442: see below.
A relay command or diagnostic failed a test for latent faults. This could
indicate a module fault or a speed output FTA fault. Replace the
module; if the fault appears on the new module, the fault is on the
speed output FTA. Action:Slice fault
Detects serious errors in field interface comms link such as faulty
optocouplers or a dead output group. Also detects channel address
errors in host interface RAM. Return the module for repair.
Action:Slice OFFLINE
8442: see below.
A relay command or diagnostic failed on the Speed Output FTA.
Replace the module; if the fault appears on the new module, the fault is
on the speed output FTA.
Note that on firmware release 3.5 this error occurs with no SOFTA
present even if marked as absent in the INI; in this instance a firmware
upgrade is recommended.
Action:Slice fault
Issue 12 Feb 11 AN-T80020 59
Page 60

Trusted
TM
AN-T80020 Diagnostics Procedure
OFIU_DATA_FAULT
0x67nn
Modules:8448
Subcode:nn = channel, 0x00 to
0x27 (1 to 40)
SFIU_RELAY_CONTACT_
XTALK_FAULT
0x67mn
Modules:8442
Subcode: mn = quadrant (0 to 3),
output (0 to 5)
FIU_HKAD_ERR
0x68mn
Modules:All
Inputs:
680n, n = HKAD channel, 0 to 7
(see right)
Outputs including 8480 but not
8442, 8472:
68mn, m = output group (0 to 3
for 8471, 0 to 4 for others),
n = HKAD channel, 0 to 7 (see
right)
8472: 68m0, m = quadrant (0 to
3)
8442:
m=0: quadrant current,
n=quadrant (0 – 3)
m=1: 24v 1, n=group (0 – 2)
m=2: 24v 2, n=group (0 – 2)
m=3: 15v 1, n=group (0 – 2)
m=4: 15v 2, n=group (0 – 2)
This test provides a high level of integrity for all ADC data
(voltage/current monitoring and HKAD). It detects faults in the ADCs
(excluding the input multiplexer) and the data path between the ADCs
and HIU RAM. This test is necessary on an 8448 because the voltage
and current monitoring is used for inputs. Return the module for repair.
ction:Slice OFFLINE
A
This test detects crosstalk between relay contacts, group to group.
Replace and return the Speed Output FTA when possible.
Action:Slice fault
Field interface housekeeping measurement out of range. This test
verifies min/max limits on all field housekeeping A/D channels.
The fault can be triggered by noise but is usually indicating a module
fault.
For 8442, check the field supply voltage, else return the module for
repair.
For 8461, hardware revision L, see TN20049.
In all other cases, return the module for repair.
Action:Slice OFFLINE except 8472 (slice fault)
Input HKAD channels 0 to 7 in order: Condensation, FIU internal supply
voltage, DAC_X2, FIU unregulated input voltage, FIU board
temperature, DAC_X2, DAC_X3, FIU internal supply current.
Output (except 8480) HKAD channels 0 to 7 in order: CHFSS bias
voltage, GFSS bias voltage, Field zero volts voltage, FIU internal supply
voltage, Field supply voltage, FIU board temperature, FIU unregulated
input voltage, FIU internal supply current.
8480 HKAD channels 0 to 7 in order: CHFSS bias voltage, GFSS bias
voltage, Field zero volts voltage, FIU internal supply voltage, FIU board
temperature, Field supply voltage below ‘top rail’, FIU unregulated input
voltage, FIU internal supply current.
Note that field voltages are measured downwards from the group
common ‘top rail’ so some numbers are negative; see AN-80004.
On the 8472, this test checks the current drawn by the field interface
unit, divided into four quadrants. The 8442 also gives quadrant current
if subcode m is 0.
Issue 12 Feb 11 AN-T80020 60
Page 61

Trusted
TM
AN-T80020 Diagnostics Procedure
OFIU_I_ERR
0x69nn
Modules:Output except
8442,8480
8472: 69mn, m = (see right), n =
channel (0 to F)
Others: 0x69nn
Subcode:nn = output channel
8471: 0x00 to 0x1F (1 to 32)
Others: 0x00 to 0x27 (1 to 40)
SFIU_IMON_SAMPLE_ERR
0x69mn
Modules:8442
Subcode: mn: m = (see right), n
= channel (0 – 5)
OFIU_V_ERR
0x6Ann
Modules:Output except
8442,8480
8472: 6Amn, m = (see right), n =
channel (0 to F)
Others: 0x6Ann
Subcode:nn = output channel
8471: 0x00 to 0x1F (1 to 32)
Others: 0x00 to 0x27 (1 to 40)
SFIU_VMON_SAMPLE_ERR
0x6Amn
Modules:8442
Subcode: mn: m = (see right), n
= channel (0 – 5)
OFIU_TOP_SW_SHORT
0x6Bnn
Modules:Output (except 8472,
8442, 8480)
Subcode:nn = output channel
8471: 0x00 to 0x1F (1 to 32)
Others: 0x00 to 0x27 (1 to 40)
This test indicates a fault in the field channel/quadrant/group current
measurement. Return the module for repair.
Action:Slice OFFLINE except 8472 (slice fault)
8472: m = quadrant (0 to 3) + error type: 0 = measurement at range
limit, 4 = imbalance between the two circuit legs, 8 = discrepant or
unknown.
The number of received current samples in the last sampling period is
outside of the expected number. Return the module for repair.
Action: Slice fault
m = circuit leg (0 or 2) + quadrant (0 or 1)
This test indicates a fault in the field channel voltage measurement. It
may indicate a faulty field voltage measurement or an excess field
supply voltage. If the channel is commanded off, the measurement will
see the whole supply voltage and this test will shut down the module on
an excess supply voltage.
Check the field supply voltage is within the module’s capability, else
return the module for repair.
Action:Slice OFFLINE except 8472 (slice fault)
8472: m = quadrant (0 to 3) + error type: 0 = voltage shows ON and
command is OFF, 4 = unknown state, 8 = discrepant, C = multiple
unknown states.
The number of received voltage samples in the last sampling period is
outside of the expected number. Return the module for repair.
Action: Slice fault
m = quadrant (0 or 1)
Detects a top FET short, including a stuck control signal.
The test may be tripped by a very low NLTHRESH or by a field supply
with high ripple or noise. Check these if the replacement module also
shows the same type of faults, otherwise return for repair.
This error code also applies to 8448 input channels.
Action:Slice fault
Issue 12 Feb 11 AN-T80020 61
Page 62

Trusted
TM
AN-T80020 Diagnostics Procedure
OFIU_SMON_ERR
0x6Bmn
Modules: 8472
Subcode: m = error type (see
right), n = channel (0 to F)
SFIU_CONTACT_SAMPLE_
ERR
0x6B0n
Modules: 8442
Subcode: n = group 0 – 2
OFIU_SW_INDEP
0x6Cnn
Modules:Output (except 8442,
8480)
Subcode:nn = output channel
8471: 0x00 to 0x1F (1 to 32)
Others: 0x00 to 0x27 (1 to 40)
8472: mn: m = quadrant (0 to 3),
n = channel (0 to F)
Detects unknown switch states, partial switch open/circuit,
undervoltage or faults in diagnostic circuits, based on a measurement
of the conductance of each switch (SMON = switch monitor). Each
channel has four switches.
m = 0,1,2,3: unknown switch state 0,1,2,3
m = 4: unknown channel state
m = 5, 6, 7, … A: ON/OFF state discrepancy between switches :
5 = 0<>1, 6 = 0<>2, 7 = 0<>3, 8 = 1<>2, 9 = 1<>3, A = 2<>3)
Return the module for repair.
Action:Slice fault
Relay contact sample count out of range. This indicates a fault on the
SOFTA.
Note that on firmware build 130 this error occurs with no SOFTA
present even if marked as absent in the INI; in this instance a firmware
upgrade is recommended. If there is a SOFTA fitted on that group,
replace the SOFTA.
Action:Slice fault
All modules except 8472:
Detects crosstalk between output channels in the same power group.
Also detects shorted switches.
The test is tripped by either a 25% change in current on another
channel in the power group during the test, or a current on the channel
greater than NLTHRESH when it had been switched off.
The load current on all channels in the same power group must be
relatively constant during the test. Beacons and flashing LEDs can
cause test failures. These devices may require parallel loads or
smoothing/soft-start circuits to reduce current disturbance.
Check the current fluctuations on all channels in the same power
group. The log may show a channel which is changing current. A very
low NLTHRESH setting may also trip this fault. 8448s and 8461s will
show the cause in an extra line in the log (“NLThresh” or “25pc
change”)
If there is no evidence of noisy loads, return the module for repair.
Firmware from release 3.5 (build 130) is more robust to nonlinear
loads.
8472 only:
8472 is a very different design and this test is a clear indication of a
module fault. Each switch is inverted in turn and the change in state is
monitored on this and other switches. Return the module for repair.
Action:Slice fault
Issue 12 Feb 11 AN-T80020 62
Page 63

Trusted
TM
AN-T80020 Diagnostics Procedure
SFIU_RELAY_DRIVE_XTALK
0x6Cmn (m=0,1,2,3)
Modules: 8442
Subcode: mn:
m = quadrant (0 to 3)
n = output 0 – 5
SFIU_RELAY_IMON_XTALK
0x6Cmn (m = 4,5,6,7)
Modules: 8442
Subcode: mn:
m = quadrant + 4 (4 to 7)
n = output 0 – 5
OFIU_AUTO_CALIB
0x6Dnn
Modules:Output (except 8472,
8442, 8480)
Subcode:nn = output channel
8471: 0x00 to 0x1F (1 to 32)
Others: 0x00 to 0x27 (1 to 40)
OFIU_PICDI_TEST_ERR
0x6Dmn
Modules:8472
Subcode:m = quadrant (0 to 3)
plus error type (see right),
n = channel (0 to F)
SFIU_IMON_DISCREP
0x6Dmn
Modules:8442
Subcode:m = (see right), n =
output (0 to 5)
Crosstalk between relay commands or diagnostics.
These faults are most likely to be on the module but may be on the
SOFTA. Replace the module, and if the same fault codes appear on
the next module, replace the SOFTA.
ction:Slice fault
A
Crosstalk between relay current monitor circuits.
These faults are most likely to be on the module but may be on the
SOFTA. Replace the module, and if the same fault codes appear on
the next module, replace the SOFTA
Action:Slice fault
Detects excessive drift in the switch OFF state current. Compensates
for all reasonable drift. The module recalibrates itself periodically and
notes significant drift.
Before firmware build 130, these faults were repeatedly called if the
module was in Standby and filled the logs. Some modules stop
reporting this fault after a restart.
Swap the module to another module and then swap back again. If the
fault reappears, return the module for repair.
Action:Slice fault
Detects a fault in the PIC Discrete Input channel and its circuitry.
Error type:
0: test sequence number is not incrementing
4: quadrant or channel numbers in PIC register don’t match PIC
number
8: measured value is out of range
C: same as 4 using different algorithm
On some 8472s, the PICs are unstable and the log will fill with multiple
0x6D faults and PICDI messages. W ith working PICs, the test indicates
faults in the measured voltage or the voltage monitoring circuits, with
error type 8.
Return the module for repair.
Action:Slice fault
Detects current measurement discrepancies in the relay output circuits.
m = 0: Leg 1 Quadrant 1/Quadrant 2 discrepancy
m = 1: Leg 2 Quadrant 1/Quadrant 2 discrepancy
m = 2: Leg to Leg imbalance
Replace and return the Speed Output FTA when possible.
Action:Slice fault
Issue 12 Feb 11 AN-T80020 63
Page 64

Trusted
TM
AN-T80020 Diagnostics Procedure
INPUT_CHANNEL_OVC
0x6Enn
Modules:8448, 8449
Subcode:nn = channel, 0x00 to
0x27 (1 to 40)
SFIU_VMON_QUAD_DISCREP
0x6Emn
Modules:8442
Subcode:m = (see right), n =
group (0 to 2)
OFIU_INPUT_FAULT
0x6Fnn
Modules:8448
Subcode:nn = channel, 0x00 to
0x27 (1 to 40)
SFIU_CONTACT_QUAD_
DISCREP
0x6F0n
Modules: 8442
Subcode: n = group (0 to 2)
This detects an over-current trip on an input channel. Input channels
should not have over-current trips; this implies the channel output
circuits have energised.
Return the module for repair.
ction:Slice fault
A
Detects discrepancies in the voltage measurement in the relay output
ircuits.
c
m = 0: 24V1 Quadrant 1/Quadrant 2 discrepancy
m = 1: 24V2 Quadrant 1/Quadrant 2 discrepancy
m = 2: 15V1 Quadrant 1/Quadrant 2 discrepancy
m = 3: 15V2 Quadrant 1/Quadrant 2 discrepancy
Return the module for repair.
Action:Slice fault
This only applies to 8448 inputs. It tests that the input channel can be
tripped (state 4) and that there is no crosstalk between input channels
or a short to the field supply. It also tests voltage monitoring circuitry
and communications.
It tests the input measurement by turning on the output FETs for 2ms
and looking for a voltage on the test channel and none on the others.
The module must therefore be able to move the channel voltage by
switching the FETs. If the input is volt-free (and closed contact) or
uses zener diodes, the voltage will stick at zero volts or the zener
voltage. To allow the module to manipulate the channel, a 1K resistor is
needed in series with the channel for these inputs. Refer to PD-8842
and TN-20018. In most cases it can be fitted in T8842 socket position
A.
If the channel should be able to drive the input, return the module for
repair.
Action:Slice fault
Detects a discrepancy between the two timers that measure the length
of a contact change on the SOFTA diagnostic trace link.
Return the module for repair.
Action:Slice fault
Issue 12 Feb 11 AN-T80020 64
Page 65

Trusted
TM
AN-T80020 Diagnostics Procedure
0x7000 Series Codes (Processor generated)
All 7000 series faults are created by the processor when it notes a problem on a module’s slice. The
I/O module relies on the processor to log these faults.
MP_CHAN_DISCREP_ERROR
x70nn
0
Modules:All
Subcode:nn = input/output
channel (1-based)
8471: 0x01 to 0x20 (1 to 32)
8472: 0x01 to 0x10 (1 to 16)
Others: 0x01 to 0x28 (1 to 40)
MP_SLICE_DISCREP_ERROR
0x7100
Modules:All
MP_LRAM_ERROR
0x7200
Modules:All
This fault indicates that the channel state or value reported by this slice
is discrepant with respect to the other two slices. The front panel
channel LED will not indicate the fault unless two or more slices receive
the same fault code. A channel discrepancy may be due to a faulty IO
channel on that slice or to field conditions.
For inputs, builds 37 and later detect discrepancy by actual reading, but
earlier builds detect by state. A common cause in earlier builds is
where one slice is on the other side of a state threshold to the other two
channels. This may lead to a slice discrepancy which will result in the
slice being set offline (0x7100)
For inputs from build 37, noisy signals and drifting calibration may
create discrepancies. The discrepancy thresholds may be increased in
the INI if precision is not necessary; see PD-8110B.
For outputs, discrepancies are still detected by state because the
states are more defined, e.g. short circuit, de-energised. A common
cause of output discrepancies is loads near the minimum current,
where one slice may be starved of current and reporting open circuit.
Consider adding resistors to increase the load, or change the no-load
threshold for the group. Collect similar loads on each group. See
TN20031 for 8461. Very noisy loads may also create discrepancies;
check for logged transitions in and out of fault states on that channel.
Check the channel conditions as above. If there is no external reason
for discrepancies, try a replacement module.
Action:Slice fault, channel fault, channel state = 15
This fault indicates that this slice reported a slice state that is
discrepant with respect to the other two slices. An example would be
two slices in ACTIVE and one slice in STANDBY. A slice state
discrepancy is primarily due to a fault within the slice that either forced
or inhibited a state change.
This fault is almost always a secondary effect of a slice going offline.
Check the log history for the initial cause.
Action:Slice OFFLINE
This fault indicates an LRAM (Local RAM) test failure. The processor
occassionally transmits a command containing an ASCII test pattern
(which can often be seen near the beginning of logs). The I/O module
calculates a check word for the pattern which is verified by the
processor. The LRAM is a storage buffer in the I/O module which is
part of the interface with the processor.
The I/O module cannot detect external memory access faults and
therefore relies on the processor. Return the module for repair.
Action:Slice OFFLINE
Issue 12 Feb 11 AN-T80020 65
Page 66

Trusted
TM
AN-T80020 Diagnostics Procedure
MP_CONFIGURATION_ERROR
0x7300
Modules:All
MP_SLICE_NOT_RESPONDING
0x7350
Modules:All
MP_SAFETY_LAYER_ERROR
0x7400
Modules:All
MP_PACKET_ERROR
0x7401
Modules:All
This fault indicates that the configuration data (from the System.INI file)
on this slice is discrepant with respect to the other two slices. After
loading the configuration data, the processor compares the CRC data
checks returned from the three slices. If they are different, this fault is
raised on the discrepant slice (or all slices if there is a three-way
discrepancy).
It may be a side-effect of other IMB communications faults causing
data corruptions.
It will occur soon after going into Standby mode. Restart the module to
load the configuration again. If it keeps failing, return the module for
repair.
Action:Slice fault
This fault indicates that the I/O module slice is not communicating with
the processor. The fault code may be seen on the HKEEPING board
even though the other channels for that slice are zero (because there is
no communications). This fault can never appear in a log.
The likely reason is that the slice has not started. The slice is still in
boot mode, indicated by the slice Healthy LED flashing red (the same
indication as for a slice fault).
A large system log inside the I/O module will delay it from starting up on
all firmware up to 130. This is fixed in later issues of firmware, some of
which are released. If you can successfully restart the module, erase
its logs.
If the slice will not start and go healthy in an unused slot, return the
module for repair.
Action:None; slice stays in boot mode
This tests the I/O module’s Safety Layer, primarily the IMB voting and
fault detection circuits in the host interface. The MP occasionally
requests a test packet. The response packet contains a test pattern
which is generated by exercising the voter/fault detector logic in the
safety layer. The processor compares the response packet to the
expected pattern to determine the health of the safety layer.
Faults appearing on the same slice on several modules in a chassis
indicates expander module or bus faults.
If the fault appears on only one module, and it returns repeatedly after
pressing Reset, return the module for repair.
Action:Slice fault
This indicates a fault in the Error Packet Generator logic. The
processor occasionally sends a packet with a faulty error code and
verifies that the module signals a Packet Error. Return the module for
repair.
Action:Slice fault
Issue 12 Feb 11 AN-T80020 66
Page 67

Trusted
TM
AN-T80020 Diagnostics Procedure
MP_BIU_TRANSIENT_ERROR
0x7402
Modules:All
MP_FCR_DECODE_ERROR
0x7403
Modules:All
This indicates a bus discrepancy due to an I/O module fault. It may also
be caused by expander module or bus faults.
Faults appearing on the same slice on several modules in a chassis
indicates expander module or bus faults.
f the fault appears on only one module, and it returns repeatedly after
I
pressing Reset, return the module for repair.
Action:Slice fault
This fault indicates that the processor detected a slice ID error. The
processor writes a different data pattern to each slice and verifies that
the slice returns its own data. Return the module for repair.
Action:Slice OFFLINE
Issue 12 Feb 11 AN-T80020 67
Page 68

Trusted
TM
AN-T80020 Diagnostics Procedure
0x8000 Series Codes (General non-resettable)
All faults above 8000 cannot be reset using the processor’s Reset pushbutton. They are either
indicating a failed startup or a fault found in the operational logic circuits through background testing.
Codes 0x8400 to 0x8402
Modules: 8480
FIA_INVALID_IMAGE
0x8500
Modules:All
FIA_INVALID_IMAGE_CRC
0x8501
Modules:All
APP_MEMORY_FAULT
0x8601
Modules:All
APP_TIMEOUT
0x8666
Modules:All
IMB_DOUT_RESET
0x8740
Modules:All except 8442
The 8442 reports this fault as
0x0740.
IMB_DOUT_DISABLE
0x8741
Modules:All except 8442
The 8442 reports this fault as
0x0741.
FIA_CONFIGURE_ERROR
0x8800
Modules:All
These indicate faults in programming the host interface ASIC. The
module will fail to start. Return the module for repair.
The faults are reported by all other modules as 0x0400, 0x0401 or
0x0402.
Validates the field interface adapter code file prior to and during
loading. Detects flash memory fault or missing file. The slice will not
boot. Return the module for repair.
Validates the field interface adapter code file prior to loading. Detects
flash memory fault or corrupted file. The slice will not boot. Return the
module for repair.
Detects RAM errors. Return the module for repair.
Action:Slice OFFLINE
The field interface unit has not serviced its watchdog within a timeout
(35ms on input modules, 30ms on 8442, 200ms on output modules
except 600ms on 8472).
This has been seen on input modules and indicates that the field
interface unit has stalled or failed to start or failed to warm-start when
requested. All examples were on firmware before build 130.
If the module had recently been started (in the last minute), restart it
and let it try again.
If the module had been running for some time, swap the module to
another and swap back. If it fails again, return for repair.
Action:Slice OFFLINE
The processor has requested a slice reset. This provides a
mechanism to reset the slice without removing / inserting the module.
The slice goes offline but resets itself.
This error is simply a by-product of the reset process; the I/O module
log or processor log may indicate the reason in earlier events.
Action:Slice OFFLINE then it should automatically restart.
This provides a means for the processor to disable a slice. Some slice
faults can only be detected by the processor. In this case the
processor must have a mechanism for turning off a faulty slice.
This fault is always a secondary symptom of an earlier fault; the I/O
module log or processor log will indicate the primary fault.
Action:Slice OFFLINE
Appears on startup. Verifies that the field interface adaptor (FIA) has
been configured. Detects serious errors in the field interface comms
link such as a faulty optocoupler or a dead FIA. The slice will not boot.
Re-insert the module; if it fails again, return the module for repair.
Issue 12 Feb 11 AN-T80020 68
Page 69

Trusted
TM
AN-T80020 Diagnostics Procedure
FIA_NOT_PRESENT
0x8801
Modules:All
FIA_POWERUP_ERROR
0x8802
Modules:All
FIA_CONFIGURE_TIMEOUT
0x8803
Modules:All
FIA_ISL_TIMEOUT1
0x8804
Modules:8442, 8472
FIA_OVERCURRENT
0x8806
Modules: 8442, 8472
Appears on startup. Detects a missing or misaligned field interface
assembly or ribbon cable. It also detects faults in the field interface
power system that result in little or no current flow from the host
interface, or a faulty current monitor. The slice will not boot.
Re-insert the module; if it fails again, return the module for repair.
Appears on startup. The field interface drew too much current on more
than one quadrant on startup and was prevented from dragging down
the host interface. The slice will not boot.
Re-insert the module; if it fails again, return the module for repair.
Appears on startup. The field interface took too long to be configured.
The slice will not boot.
Re-insert the module; if it fails again, return the module for repair.
Before configuring the field interface, all slices must be synchronized.
This took too long. The slice will not boot.
Return the module for repair.
The field interface drew too much current on one quadrant.
The slice will not boot.
Return the module for repair.
0x9000 Series Codes (Host Interface Unit non-resettable)
HIU_DSP_CORE_FAULT
0x90nn
Modules:All
Subcode:nn = returned DSP test
result register
HIU_MEMORY_ACCESS_FLT
0x9001
Modules:All
HIU_FCRID_FAULT
0x9002
Modules:All
Checks the operation of the DSP Core using its self-test functions.
Detects internal DSP faults.
Return the module for repair.
Action:Slice OFFLINE
Detects faulty memory in the interface to the IMB.
Return the module for repair.
Action:Slice OFFLINE
Detects a fault in the hard-wired slice ID code.
Return the module for repair.
Action:Slice OFFLINE
0xC000 Series Codes (Module firmware non-resettable)
APP_STACK_FAULT
0xC003
Modules:All
APP_TASK_TIMEOUT
0xC005
Modules:All except 8480
Checks for application firmware errors that corrupt the stack.
Report to ICS Triplex Technology.
Action:Slice OFFLINE
Application firmware failed to reset the hardware watchdog (e.g. it is
locked in a loop). The hardware watchdog will turn off the slice.
Report to ICS Triplex Technology.
Action:Slice halted
Issue 12 Feb 11 AN-T80020 69
Page 70

Trusted
Pass
Fail
Fail
Pass
Fail
Fail
Fail
Fail and latched
Pass
i
ncrement
Passdecremen
TM
AN-T80020 Diagnostics Procedure
Self Test Cycle Times
The 8000 Series diagnostics tests occur at different intervals. Some faults cause an immediate error,
and some can take hours before they are reported. Many faults are filtered by requiring a number of
successive faults to cause an error, with a test pass decrementing the fault filter counter. Therefore,
some occasional transient faults may be ignored.
Main processor diagnostics are complete in no more than 24 hours. Output module self-tests are
complete in under 1 hour. Input module self-tests are complete in under 30 minutes. These faults
include 6000 series faults. Some faults are reported immediately, including series 2000, 5000, 7000
and all above 8000. Release 3.5 improved the I/O module diagnostic cycle by raising the priority of
failed tests so that they are repetitively tested. Before release 3.5, the I/O module tests took around
four times longer than stated above.
Each test has a set of filter values which govern when a fault is reported. In some cases a fault is
reported on its first detection, but in cases where other conditions may cause a false report, a counter
is incremented by a set number on detecting the fault. If a later test does not detect a fault, the counter
is decremented by a different set number. If the counter exceeds a threshold, the fault is reported as
permanent. Once the fault is permanent, it is reported in the log as such, sets the appropriate fault
LED, and remains until the Reset pushbutton is pressed. This reset will clear all fault reports (below
error code 8000) and set all fault counters to zero. Whilst this may make the system look tidy, it may
also erase important diagnostic evidence.
Count
Fault Threshold
Test
interval
Fault
Fail
Tests
Issue 12 Feb 11 AN-T80020 70
Page 71

 Loading...