

Page 1

RS-Ruby Users’ Manual
1
Page 2

Revision History
Revision Number
Description
Date
Edited by
1.0
Initial release
2019-11-20
PD
RS-Ruby Users’ Manual
Page 3

Terminology
MSOP
Main data Stream Output Protocol
FOV
Field of View
Azimuth
Horizontal Angle of LiDAR
Timestamp
Time Point of Encapsulation of a UDP Packet
Header
The Header of a UDP Packet
Tail
The Tail of a UDP Packet
Thermolysis
Loss of Heat from the Object
RS-Ruby Users’ Manual
Page 4

RS-Ruby Users’ Manual
TABLE OF CONTENTS
1 Safety Notice
2 Introduction
3 Product Specifications
4 Interface
4.1 Power supply
4.2 Data Output interface of LiDAR
4.3 Interface Box
4.4 Connection of Interface Box
5 Communication Protocol
5.1 MSOP
6 GPS Synchronization
6.1 Principle of GPS synchronization
6.2 GPS Usage
7 Key Specifications
7.1 Return Mode
7.2 Phase Lock
8 Point Cloud
8.1 Coordinating Mapping
8.2 Laser Channel in spatial Distribution
9 Reflectivity
10 Troubleshooting
Appendix A – the Format of all Register
A.1 UTC_TIME
Appendix B RSView
B.1 Software Features
B.2 Installation of RSView
B.3 Network Setup
B.4 Visualization of point cloud
B.5 Save Streaming Sensor Data into PCAP File
B.6 Replay Recorded Sensor Data from PCAP Files
Appendix C RS-Ruby ROS Package
C.1 Software Installation
C.2 Compile RS-Ruby ROS Package
C.3 Configure PC IP address
C.4 Display of the real-time data
C.5 Offline Display the recorded PCAP File
Appendix D Dimension
Appendix E Suggestion of Mechanical LiDAR Mount
..................................................................................................................................
.....................................................................................................................................
..................................................................................................................
..........................................................................................................................................
......................................................................................................................
.......................................................................................
......................................................................................................................
............................................................................................
..............................................................................................................
..................................................................................................................................
5.1.1 Header
5.1.2 Data Field
5.1.3 Tail
5.1.4 MSOP Data Package
...................................................................................................................................
....................................................................................................................................
......................................................................................................................
................................................................................................................
...........................................................................................................................
..........................................................................................
.................................................................................................................
.................................................................................
.......................................................................................................................
......................................................................................................................
.....................................................................................................................
.......................................................................................................................
....................................................................................................
...........................................................................
........................................................................................................................
.....................................................................................
.......................................................................................................................
.......................................................................................................................
...........................................................................................................
....................................................................................................
.................................................................................................................
............................................................................................
..........................................................................................
.......................................................................................................
................................................................................
...............................................................................................
.........................................................................................
......................................................................
..................................................................................................................
............................................................
......................................................
..............................................................
1
2
3
4
4
4
5
6
7
7
8
9
10
10
12
12
12
13
13
13
14
14
15
19
20
22
22
24
24
24
24
25
26
27
30
30
30
30
30
31
33
34
Page 5

RS-Ruby Users’ Manual
Appendix F Clean of LiDAR
F.1 Attention
............................................................................................................................
F.2 Required Materials
F.3 Clean Method
...................................................................................................................
.........................................................................................................
..........................................................................................................
35
35
35
35
Page 6

RS-Ruby Users’ Manual
1
Congratulations on your purchase of a RS-Ruby Real-Time 3D LiDAR Sensor. Please
read carefully before operating the product. Wish you have a pleasurable product
experience with RS-Ruby.
1 Safety Notice
In order to reduce the risk of electric shock and to avoid violating the warranty, do not
open sensor housing.
Laser safety-The laser safety complies with IEC60825-1:2014.
Read Instructions-All safety and operating instructions should be read before
operating the product.
Follow the Instructions-All operating and use instructions should be followed.
Retain Instructions-The safety and operating instructions should be retained for
future reference.
Heed Warnings-All warnings on the product and in the operating instructions should
be adhered to.
Maintenance - The user should not attempt to maintain the product beyond what is
described in the operating instructions. All other Maintenance should be referred to
RoboSense.
Page 7

RS-Ruby Users’ Manual
2
2 Introduction
RS-Ruby, the 128-beam LiDAR developed by RoboSense, is the world leading
Multi-Beam LiDAR that is particular utilized in and perception of environment for
autonomous driving.
RS-Ruby is realized by solid-state hybrid LiDAR. The technical details are listed below:
Measurement rang 200 meters
Vertical angle resolution up to 0.1°
Accuracy ± 5 centimeter
Data rate up to 2,304,000 points/second
Horizontal field of view (FOV) of 360°
Vertical field of view (FOV) of -25°~15°
128 emitters in RS-Ruby can supply high-frequency laser impulse to scan environment
around LiDAR by rapidly spinning optical module. Advanced digital signal processing and
ranging algorithms calculate point cloud data and reflectivity of objects to enable the
machine to “see” the world and to provide reliable data for localization, navigation and
obstacle perception.
Figure 1. Representation of RS-Ruby Imaging.
The operating Instructions of LiDAR:
Connecting the device of RS-Ruby;
Parsing the data packets, in order to capturing the values of azimuth, measuring
distance and calibrated reflectivity;
Calculate X, Y, Z coordinates from reported azimuth, measured distance, and vertical
angle;
Storing the data of point cloud according to demand;
Checking the status of set-up information of device;
Resetting the status of network configuration, timing and rotation speed according to
demand.
Page 8

RS-Ruby Users’ Manual
3
Sensor
TOF measuring distance, including the reflectivity
128 channels
Range: from 3m to 230m (160m@10%)
2
Accuracy: upto ±3cm (typical value)
3
FOV(vertical): -25°~+15°
Angle resolution(vertical): at least 0.1°
FOV (horizontal): 360°
Angle resolution (horizontal/ azimuth): 0.2° (10 Hz)/0.4°
(20 Hz)
Rotation speed: 600/1200 rpm (corresponding to 10/20 Hz)
Laser
Class 1
Wave length: 905nm
Full angle of beam divergence:
horizontal 1.5 mrad, vertical 3.6 mrad
Output
Data rate: ~2.3 million points/second
1000Base-T1 Ethernet
Communication protocol: UDP
The Information that is included in Data Segment:
Distance
Rotation angle/Azimuth
Calibrated reflectivity
Synchronized timestamp (Timer resolution 1 μs)
Mechanical/
Electrical/
Operational
Power consumption: 45 W(typical)
4
Working voltage: 9-32 VDC (19V is recommended)
Weight: 3.75kg (without cable)
Dimensions: Diameter 166mm × Height 148.5mm
Ingress Protection Rating: IP67
Operation temperature: -40℃~+60℃
5
Storage temperature: -40℃~+85℃
3 Product Specifications
Table 1. Product Parameters.
1
1
The following data is only for mass-produced products. Any samples, testing machines and
other non-mass-produced versions may not be referred to this specification. If you have any
questions, please contact RoboSense sales.
2
The measurement target of rang 160 m is a 10% NIST Diffuse Reflectance Calibration
Targets, the test performance is depending on circumstance factors, not only temperature,
range and reflectivity but also including other uncontrollable factors.
3
The measurement target of accuracy is a 50% NIST Diffuse Reflectance Calibration Targets,
the test performance is depending on circumstance factors, not only temperature, range and
reflectivity but also including other uncontrollable factors.
4
The test performance of power consumption is depending on circumstance factors, not only
temperature, range and reflectivity but also including other uncontrollable factors.
5
Device operating temperature is depending on circumstance, including but not limited to
ambient lighting, air flow and pressure etc.
Page 9
RS-Ruby Users’ Manual
4
PIN
Wire Color
Function
1
Black/Brown
GROUND
2
Black
Gigabit network differential signal
3
Brown
Gigabit network differential signal
4
Black/Green
GROUND
5
Red
Gigabit network differential signal
6
Orange
Gigabit network differential signal
7
White/Orange
GROUND
8
Yellow
Gigabit network differential signal
9
Green
Gigabit network differential signal
10
White/Purple
GROUND
11
Blue
Gigabit network differential signal
12
Purple
Gigabit network differential signal
13
Yellow/Brown
GROUND
14
Black/Red
GROUND
15
Black/Orange
PWR
16
Black/Yellow
PWR
17
White/Black
PWR
18
White/Brown
PWR
19
White/Red
PWR
20
White/Yellow
PWR
21
White/Green
Reserved serial signal
22
White/Blue
Reserved serial signal
23
Yellow/Green
GPS_PULSE
4 Interface
4.1 Power supply
The supply voltage should remain in the range of 9~32 VDC with utilization of
Interface-Box. The recommend supply voltage is 19 VDC. The power consumption is
about 45 W.
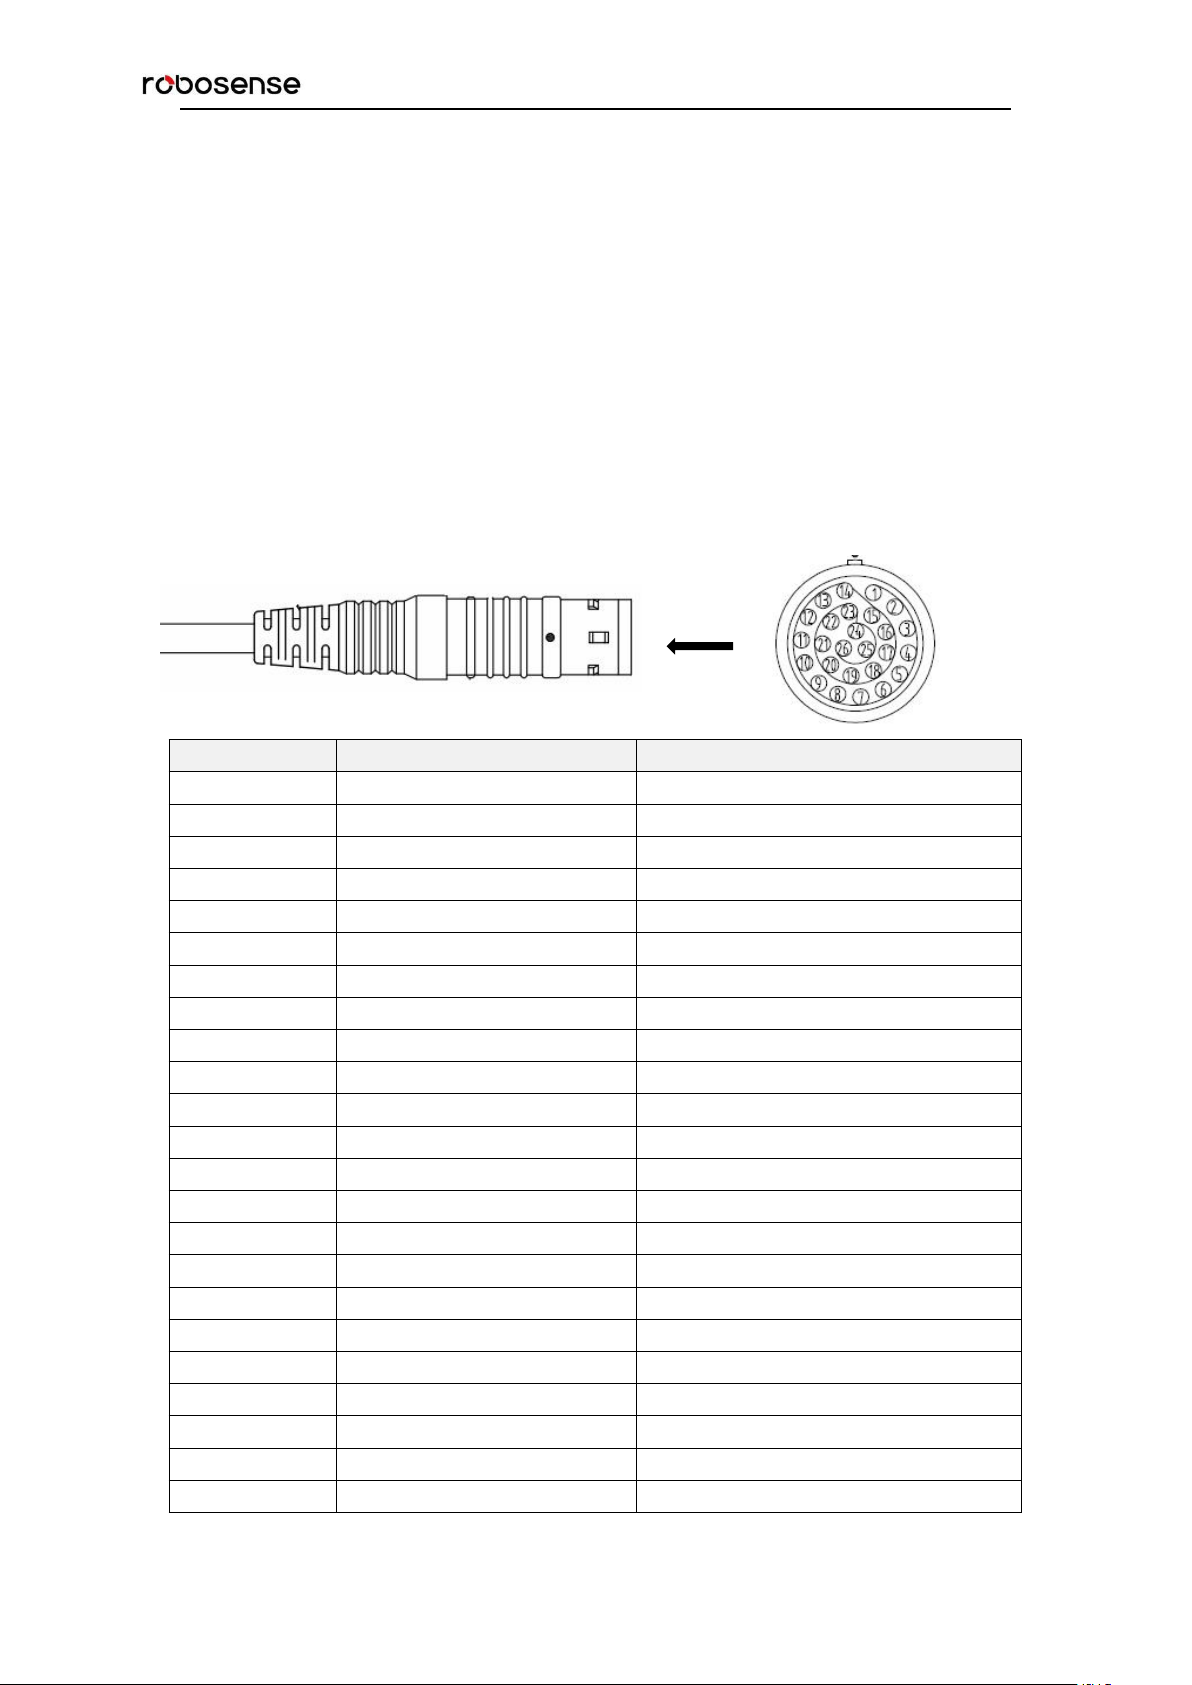
4.2 Data Output interface of LiDAR
The data output access of RS-Ruby is physically protected by an aviation terminal
connector. From the LiDAR to the aviation connector the cable length is 1 meter. The pins
of the aviation terminal connector are defined as follow:
Page 10
RS-Ruby Users’ Manual
5
24
Yellow/Gray
GPS_REC
25
Yellow/Blue
Reserved signal
26
Yellow/Purple
GROUND
PIN No.
function
1
GPS_PULSE
2
+5V
3
GND
4
GPS_REC
5
GND
6
NC
Figure 2. Aviation Connector PIN Number
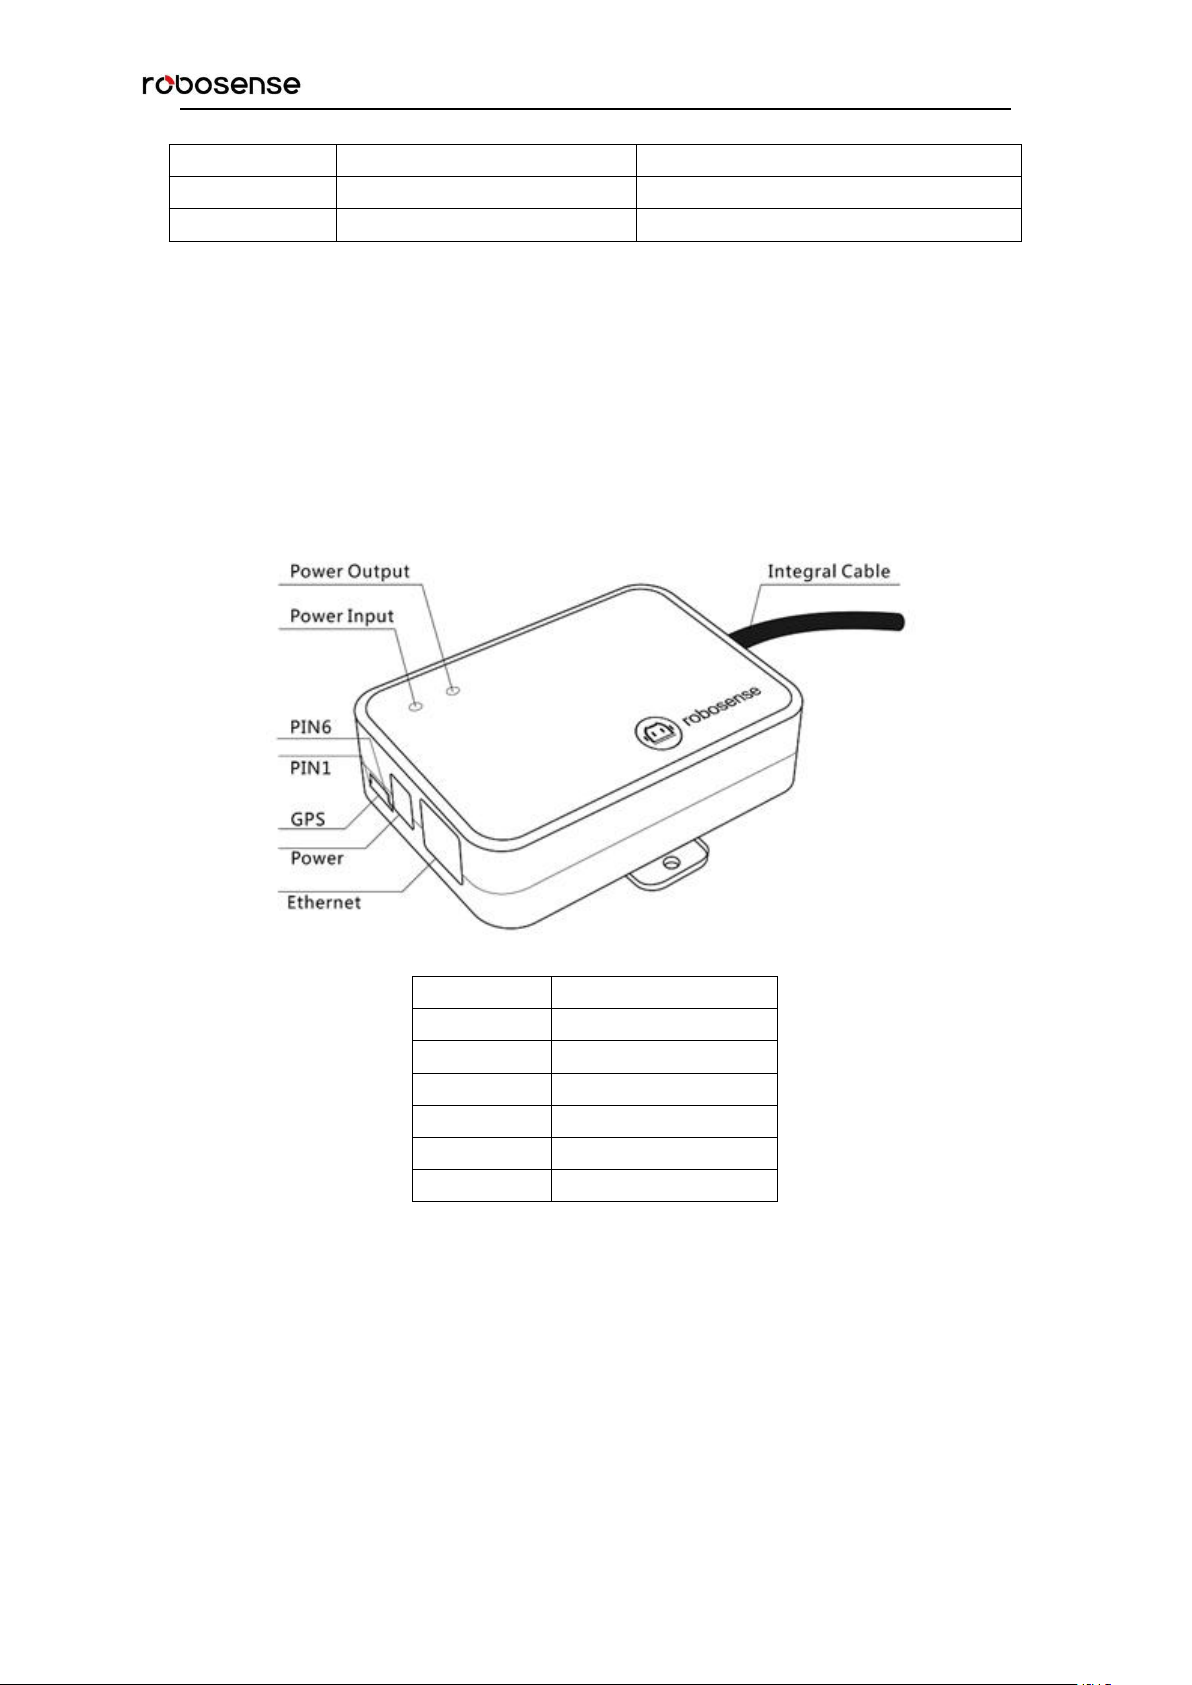
4.3 Interface Box
In order to connect the RS-Ruby conveniently, there is an interface box provided.
There are accesses for power supply, Ethernet and GPS on Interface Box. Meanwhile
there are also indicator LEDs for checking the status of power supply.
For those accesses, an SH1.0-6P female connector is the interface for GPS signal input.
Another interface is a DC 5.5~2.1 connector for power input. The last one is a RJ45
Ethernet connector for RS-Ruby data transport.
Note: When RS-Ruby connects its grounding system with an external system, the external
power supply system should share the same grounding system with that of the GPS.
When the power input is in order, the red LED which indicates the power input status will
be lighted. Meanwhile the green LED which indicates the power output status will be
lighted, when the power output is in order. While red LED is bright and green LED is dark,
Interface Box is in Protection status. While red and green LEDs are all dark, please check
whether the power supply is out of order or damaged. If it is intact, that could prove that
the Interface Box is damaged. Please send the damaged Interface Box back to
Figure 3. Interface Definition of Interface Box.
Page 11
RS-Ruby Users’ Manual
6
RoboSense Service.
GPS interface definition: GPS REC stands for GPS input, GPS PULSE stands for GPS
PPS input.
Interface of power supply is standard DC 5.5-2.1 connector.
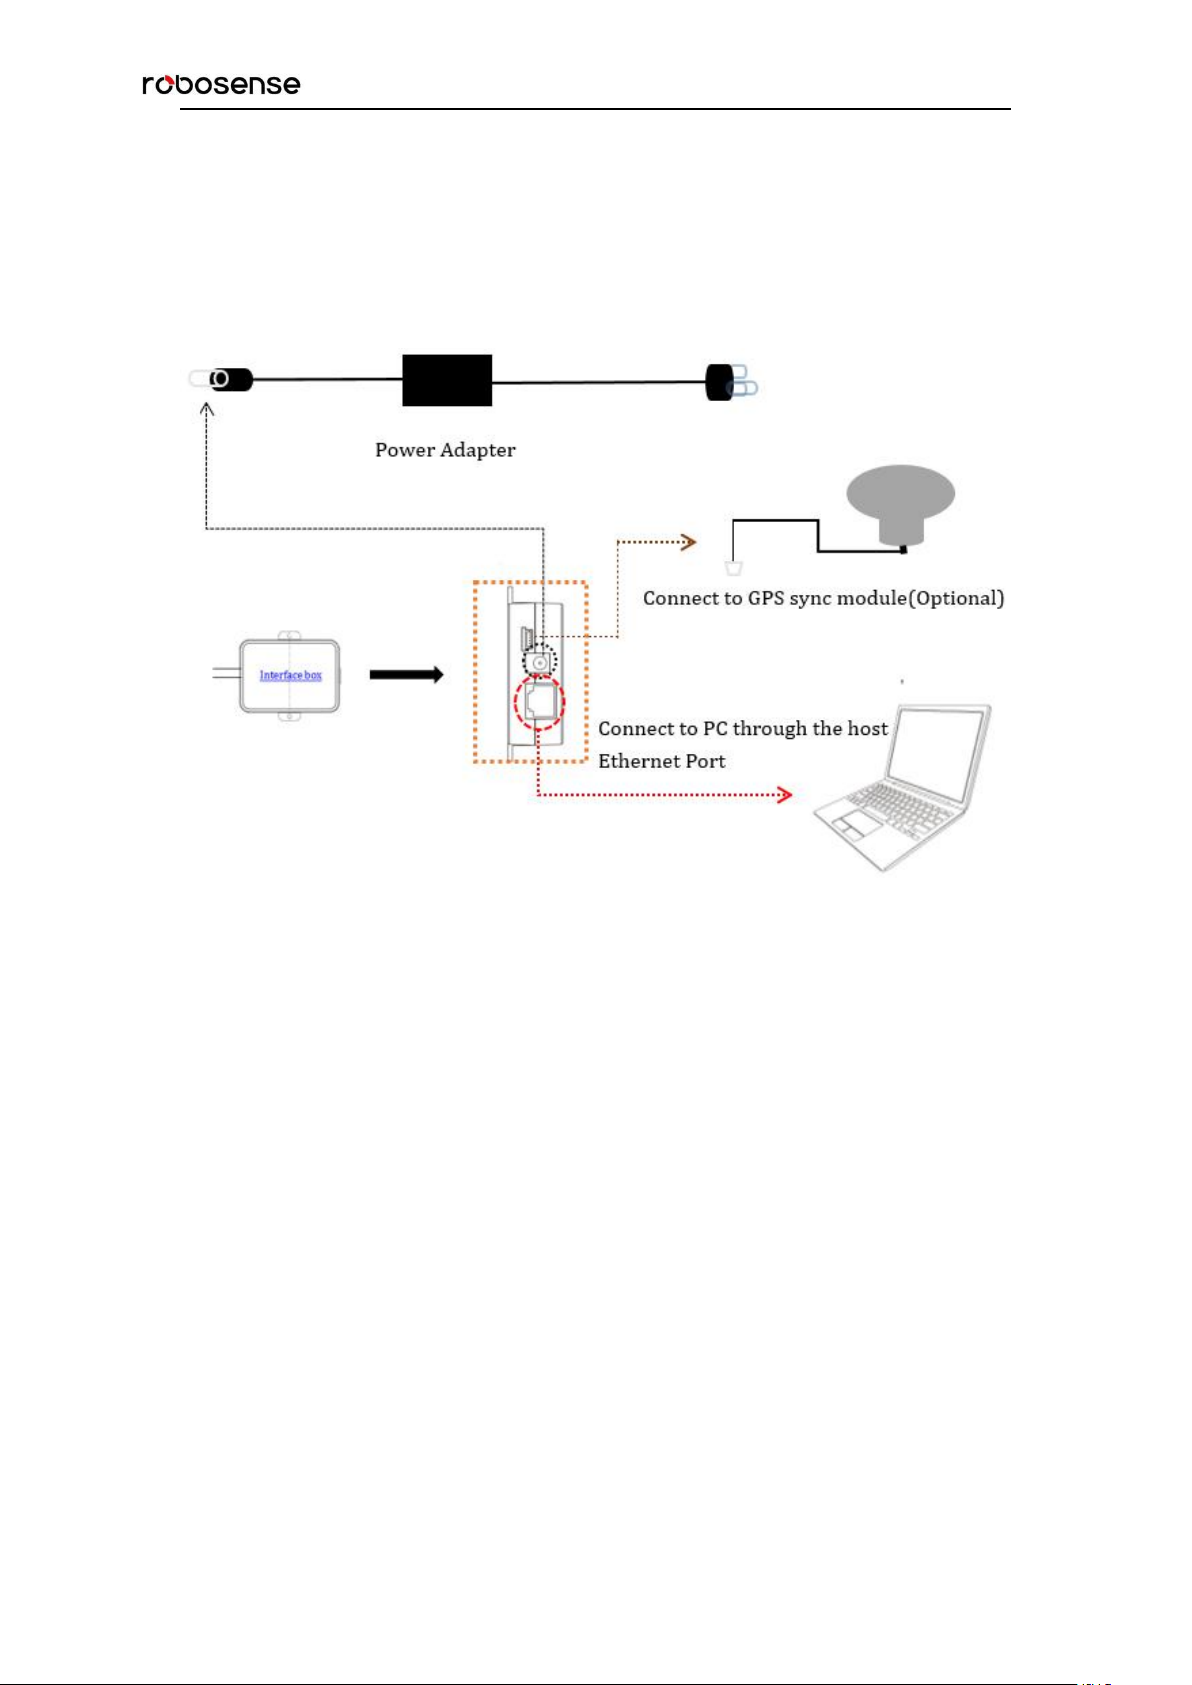
4.4 Connection of Interface Box
Figure 4. Diagram of Interface Box connection.
Page 12
RS-Ruby Users’ Manual
7
IP Address
MSOP Port No.
RS-Ruby
192.168.1.200
6699
PC
192.168.1.102
Protocol
Abbreviation
Function
Type
Size
Interval
Main data Stream
Output Protocol
MSOP
Scan Data Output
UDP
1248 byte
~167 μs
5 Communication Protocol
RS-Ruby adopts IP/UDP protocol and communicates with computer through gigabit
Ethernet. In this User Guide the length of UDP packet is set up to 1248 byte. The IP
address and port number of RS-Ruby is set in the factory as shown in the Table 2, but can
be changed by user as needed.
Table 2. The IP Address and Port Number Set in the Factory.
The default MAC Address of each RS-Ruby is already set up in the factory with
uniqueness. In order to establishing the communication between a RS-Ruby and a
computer, the IP Address of the computer should be set at the same network segment.
For instance, IP Address is 192.168.1.X (X can be taken by a value from 1~254), subnet
mask: 255.255.255.0. If the internet setting of the sensor is unknown, please set the
subnet mask as 0.0.0.0, connect the sensor to the computer, and capture UDP packet to
get the information of IP and Port through Wireshark.
The output message from RS-Ruby is called MSOP. The Information of MSOP is shown
as follow:
Table 3. Overview of the MSOP.
Note: in the following chapters only the valid payload (1248 byte) will be discussed.
5.1 MSOP
I/O type: Device outputs data and computer parses data.
Default port number is 6699.
MSOP packet outputs data information of the 3D environment. Each MSOP packet from
sensor is 1248-byte length and consists of reported distance, calibrated Reflectivity values,
azimuth values and a timestamp in UDP header.
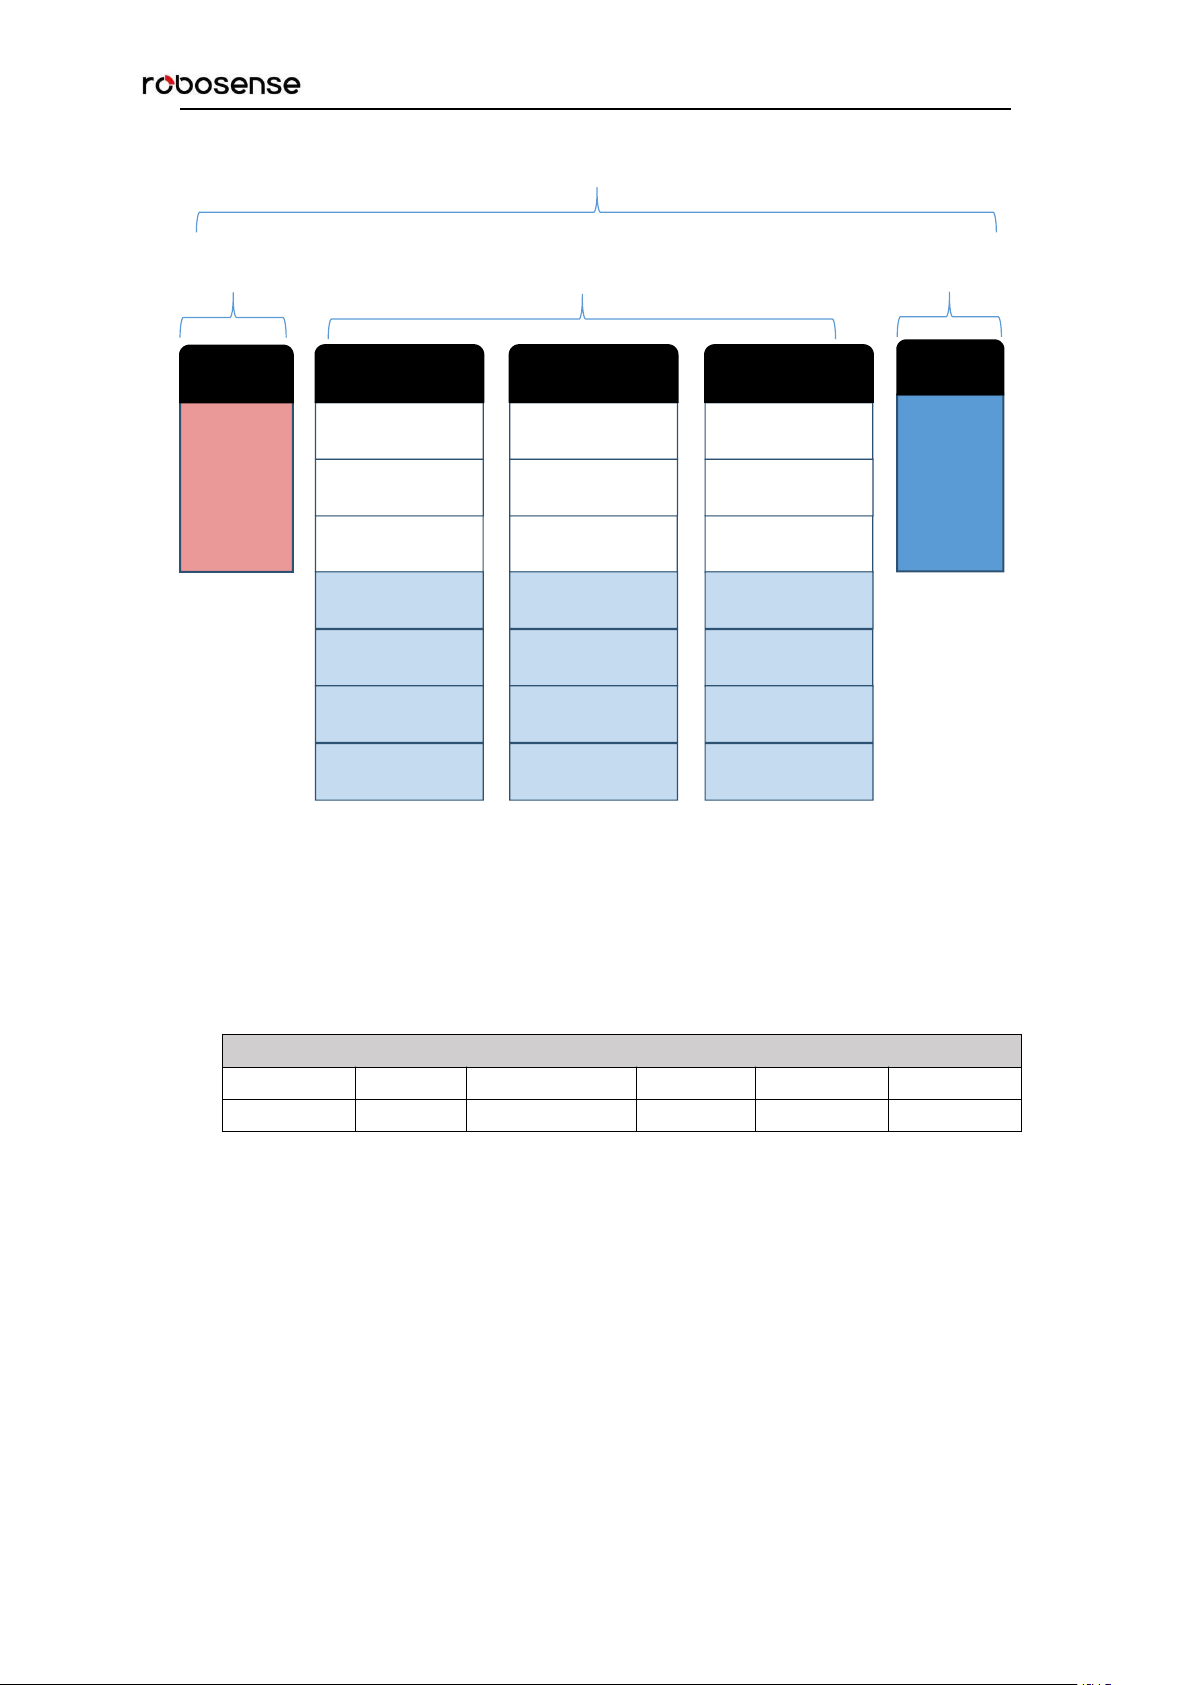
Each MSOP packet payload is 1248-byte length and consists of an 80-byte header and a
1164-byte data field containing 3 blocks of 388-byte data records and a last 4-byte tail.
The basic data structure of a MSOP packet for single return is as shown in Figure 5:
Page 13
RS-Ruby Users’ Manual
8
4byte
80 byte
data packet
3*388byte= 1164byte
80 byte
(11~20
byte is
timestamp)
Header
4byte
(parity)
Tail
Header(80bytes)
Header
Resv
Wave_Mode
Temp
Time
Resv
4bytes
3bytes
1bytes
2bytes
10bytes
60bytes
Azimuth 3
channel data 1
0xFE
Data block 2
Ret_id
channel data 0
channel data ...
channel data 127
Azimuth 1
channel data 1
0xFE
Data block 0
Ret_id
channel data 0
channel data ...
channel data 127
Azimuth 2
channel data 1
0xFE
Data block 1
Ret_id
channel data 0
channel data ...
channel data 127
MSOP Packet(1248 byte)
Figure 5. MSOP Packet of RS-Ruby in Single Return Mode.
5.1.1 Header
The 80-byte Header is used to mark the start position of data, return mode setting, sensor
temperature and timestamp. The detail of the header is as shown in Table 4.
Table 4. Format of Header.
header: this can be used for packets identification: 0x55, 0xAA, 0x05, 0x5A (Default
Value)
wave_mode: Big-Endian mode, lower 4 bit is used to representing the return mode of the
LiDAR, for instance:
00000011 stands for that first and second return mode is chosen.
00000001 stands for that first return mode is chosen.
00000010 stands for that second return mode is chosen.
temp: the temperature of device;
time: it is used to save the timestamp. In the defined timestamp the system time is
recorded, resolution 1us, the definition of time can be found in the appendix A.9 and the
table 8 of this chapter.
resv: those bytes are reserved.
Page 14

RS-Ruby Users’ Manual
9
Data block n(388bytes)
Symbol
Ret_id
Azimuth
Channel0_data
...
Channel127_data
1bytes
1bytes
2bytes
3byte
...
3bytes
5.1.2 Data Field
The value of measurement result is saved in the data field, in total 1164 byte. It consists of
3 data blocks, the length of each data block is 388 bytes. Each block stands for a
complete round of distance measuring for all 128 channel. The definition is shown as
follow:
Table 5. Data Block Definition
Symbol: identification bit, default value: 0xfe;
Ret_id: it is used to represent which echo measurement is for this block;
Azimuth: the information of horizontal rotation angle. This angle information will be used
to calculate the 3D coordinate with all following 128 channel data in the same block. In
following section, it will be completely explained.
Channel data: the length of each channel data is 3 bytes, each block includes 128
channel data (further details could be seen in Table 6). (The relationship between the
number of channel and vertical angle can be found in chapter 8.)
5.1.2.1 Calculation of the Azimuth
In each data block the value of azimuth is measured once and this azimuth corresponds to
the first position of the first laser emission (the first channel data in this block). The rotation
angle is recorded by angle encoder. The zero position of angle encoder is the zero degree
of azimuth. The resolution of resolution angle is 0.01°.
For instance, in figure 6, the azimuth value is calculated as follow:
Get azimuth values (HEX): 0x59, 0x39
Combine to a 16bit, unsigned integer (HEX): 0x 5939
Convert the value to decimal (DEC): 22841
Division by 100 (DEC): 228.41°
Hence, the angle value in this block is 228.41°.
Note: the 0°axis of azimuth is co-axis and same positive direction with the Y axis in Figure
8.
Page 15

RS-Ruby Users’ Manual
10
Channel data n(3 byte)
Distance(2 byte)
Reflectivity(1 byte)
Distance1[15:8]
Distance2[7:0]
Reflectivity [7:0]
5.1.2.2 Channel Data
Channel data is 3 bytes. The higher 2 bytes of them are used to save the distance
information. The lower one byte stands for reflectivity.
Table 6. The Format of Channel Data.
Distance is 2 bytes, resolution: 0.5 cm.
For instance, in figure 6, the explanation of Channel data is as follow:
Get the higher 2 bytes(HEX): 0x08 (Distance 1), 0x4b (Distance 2).
Combine to a 16-bit unsigned integer (HEX):0x084b
Convert the value to decimal (DEC):2123
According to the resolution 0.5 cm, change to meter: 2123 * 0.005 = 10.615 m
Hence, the distance between sensor and measurement object is 10.615 m.
Reflectivity is a relative value, please find the concrete definition in “chapter 9 Reflectivity”,
Reflectivity could show energy of the light return from measuring object in the real
circumstance. Through analytic of reflectivity, the object of different materials can be
distinguished.
5.1.3 Tail
The 4-byte Tail is reserved to identification.
5.1.4 MSOP Data Package
The following figure shows the format of MSOP data packet and relevant parsing
processes.
Page 16

RS-Ruby Users’ Manual
11
Data block 0
Channel 1 data calculation
distance byte: 0x08, 0x4b; Atten byte :0x08
combine the byte: 0x084b; get atten :0x08
get distance: 0x084b; combine the byte :0x08
convert to decimal :2123; convert to decimal :8
multiply by :0.5cm; result :8
result :10.615m;
Header:0x55,0xaa,0x05,0x5a
Data block 1
Azimuth 2 calculation
second azimuth :0x5939
get azimuth :0x59 & 0x39
combine the byte :0x5939
convert to decimal :22841
divide by :100
result :228.41°
Figure 6. MSOP Packet of RS-Ruby in Single Return Mode.
Page 17

RS-Ruby Users’ Manual
12
6 GPS Synchronization
RS-Ruby supports external GPS receiver connections. With GPS connections, we can
synchronize the RS-Ruby system time to GPS global time.
6.1 Principle of GPS synchronization
The GPS receiver keeps generating synchronization Pulse Per Second (PPS) signal and
GPRMC message and send them to the sensor. The pulse width of the PPS should
between 20ms to 200ms, and the GPRMC message should be received within 500ms
after the PPS signal is generated.
6.2 GPS Usage
GPS_REC receives the signal from GPS module with Standard serial RS232
communication protocol.
GPS PULSE receives the PPS from the GPS module and requests voltage between 3.0 V
~ 15.0 V.
PIN +5V of GPS interface can supply power to GPS module. (If GPS module is only
allowed to use +3V as power supply, please don’t use this +5V PIN on Interface Box.
Please exchange the +5V to +3V)
PIN GND is connected to the GPS receives ground wire.
The GPS module should set to 9600bps baud rate, 8-bit data bit, no parity and 1 stop bit.
RS-LiDAR-Ruby only read the GPRMC message from GPS module., the GPSMRC
message format is shown as below:
$GPRMC, <1>,<2>,<3>,<4>,<5>,<6>,<7>,<8>,<9>,<10>,<11>,<12>*hh
<1>UTC time
<2>validity-A-ok, V-invalid
<3>Latitude
<4>North/South
<5>Longitude
<6>East/West
<7>Ground Speed
<8>True course
<9>UTC date
<10>Variation
<11>East/West
<12>Mode(A/D/E/N=)
*hh checksum from $ to*
The different GPS module could send out different GPRMC message length, the RS-Ruby
could be compatible with the most GPS modules on the market. Please contact
RoboSense of technical support when it is incompatible.
Page 18

RS-Ruby Users’ Manual
13
7 Key Specifications
7.1 Return Mode
There are two return modes on RS-Ruby: strongest return and last return mode. Because
of laser divergence, after any laser emission the sensor can receive always more than
one return signals. If return mode is set up to the strongest return mode, only the
strongest return signal can be seen as useful signal in distance calculating. Similarly, if the
setting is the last return mode, only the last return signal can be used to calculate
distance.
7.2 Phase Lock
The Phase Lock feature can be used to make the sensor rotating to the specific position
when the PPS signal is triggered. To operate correctly, the PPS signal must be present
and locked stable.
In figure 7 different Phase Lock is shown as red arrow. When PPS is triggered, sensor can
rotate to the 0°, 135°or 270°.
Figure 7. Different phase lock angles 0°/135°/270°.
In RSVIEW Client “Tools > RS-LiDAR Information”, a parameter “Phase Lock” can be
set up. Here, Phase can be set in the input range of 0°~ 359°.
Page 19

RS-Ruby Users’ Manual
14
8 Point Cloud
8.1 Coordinating Mapping
In data packet including the measured azimuth and distance, in order to calculating the
point cloud, the coordinate in polar coordinate system should be transferred to the 3D
XYZ coordinate in Cartesian Coordinate System, as shown in figure 8. The function of
how to transfer the information is as shown below:
Hereis the reported distance,is the vertical angle/elevation of the laser (which is
fixed and is given by the Laser ID), andis the horizontal angle/azimuth reported at the
beginning of every other firing sequence.
is the angle offset of the azimuth. x, y, z
values are the projection of the polar coordinates on the XYZ Cartesian Coordinate
System.
The value of and defined in Table 7.
Figure 8. Coordinate system mapping between polar system and XYZ system.
Note 1: In the RS-Ruby ROS package, the coordinate system must be transferred to the ROS
right-hand Coordinate system.
The ROS-X axis is co-axis with the Y-axis and with same direction as Figure 8.
The ROS-Y axis is co-axis with the X-axis but the positive direction is reverse as Figure 8.
The Z axis is same before and after transformation.
Note 2: The origin of the LiDAR coordinate is defined at the center of the LiDAR structure, with
68 mm high to the bottom of the LiDAR.
Page 20

RS-Ruby Users’ Manual
15
Channel No
.
Vertical Angle
Horizontal Offset Angle
1
-13.565
5.95
2
-1.09
4.25
3
-4.39
2.55
4
1.91
0.85
5
-6.65
5.95
6
-0.29
4.25
7
-3.59
2.55
8
2.71
0.85
9
-5.79
5.95
10
0.51
4.25
11
-2.79
2.55
12
3.51
0.85
13
-4.99
5.95
14
1.31
4.25
15
-1.99
2.55
16
5.06
0.85
17
-4.19
5.95
18
2.11
4.25
19
-19.582
2.55
20
-1.29
0.85
21
-3.39
5.95
22
2.91
4.25
23
-7.15
2.55
24
-0.49
0.85
25
-2.59
5.95
26
3.71
4.25
27
-5.99
2.55
28
0.31
0.85
29
-1.79
5.95
30
5.96
4.25
31
-5.19
2.55
32
1.11
0.85
8.2 Laser Channel in spatial Distribution
128 lasers in RS-Ruby are defined as 128 channels. The vertical angle of those lasers
distribute in the range of -25°~+15°. The distribution of the angles is non-uniform.
According to table 7 the corresponding channel and vertical angle are as follow.
Table 7. Serial number of laser channel and corresponding horizontal angles.
Page 21

RS-Ruby Users’ Manual
16
33
-0.99
5.95
34
-4.29
4.25
35
2.01
2.55
36
-25
0.85
37
-0.19
5.95
38
-3.49
4.25
39
2.81
2.55
40
-7.65
0.85
41
0.61
5.95
42
-2.69
4.25
43
3.61
2.55
44
-6.09
0.85
45
1.41
5.95
46
-1.89
4.25
47
5.46
2.55
48
-5.29
0.85
49
2.21
5.95
50
-16.042
4.25
51
-1.19
2.55
52
-4.49
0.85
53
3.01
5.95
54
-6.85
4.25
55
-0.39
2.55
56
-3.69
0.85
57
3.81
5.95
58
-5.89
4.25
59
0.41
2.55
60
-2.89
0.85
61
6.56
5.95
62
-5.09
4.25
63
1.21
2.55
64
-2.09
0.85
65
-8.352
-0.85
66
-0.69
-2.55
67
-3.99
-4.25
68
2.31
-5.95
69
-6.19
-0.85
70
0.11
-2.55
71
-3.19
-4.25
Page 22

RS-Ruby Users’ Manual
17
72
3.11
-5.95
73
-5.39
-0.85
74
0.91
-2.55
75
-2.39
-4.25
76
3.96
-5.95
77
-4.59
-0.85
78
1.71
-2.55
79
-1.59
-4.25
80
7.41
-5.95
81
-3.79
-0.85
82
2.51
-2.55
83
-10.346
-4.25
84
-0.89
-5.95
85
-2.99
-0.85
86
3.31
-2.55
87
-6.39
-4.25
88
-0.09
-5.95
89
-2.19
-0.85
90
4.41
-2.55
91
-5.59
-4.25
92
0.71
-5.95
93
-1.39
-0.85
94
11.5
-2.55
95
-4.79
-4.25
96
1.51
-5.95
97
-0.59
-0.85
98
-3.89
-2.55
99
2.41
-4.25
100
-11.742
-5.95
101
0.21
-0.85
102
-3.09
-2.55
103
3.21
-4.25
104
-6.5
-5.95
105
1.01
-0.85
106
-2.29
-2.55
107
4.16
-4.25
108
-5.69
-5.95
109
1.81
-0.85
110
-1.49
-2.55
Page 23

RS-Ruby Users’ Manual
18
111
9
-4.25
112
-4.89
-5.95
113
2.61
-0.85
114
-9.244
-2.55
115
-0.79
-4.25
116
-4.09
-5.95
117
3.41
-0.85
118
-6.29
-2.55
119
0.01
-4.25
120
-3.29
-5.95
121
4.71
-0.85
122
-5.49
-2.55
123
0.81
-4.25
124
-2.49
-5.95
125
15
-0.85
126
-4.69
-2.55
127
1.61
-4.25
128
-1.69
-5.95
Page 24

RS-Ruby Users’ Manual
19
Diffuse Reflector
Retro-Reflector
Black, diffuse reflector
Reflectivity
≈
0
Black, diffuse reflector
Reflectivity < 100
Retro-Reflector is covered
with semi-transparent
Reflectivity > 100
Retro-Reflector without
any coverage
Reflectivity
≈
255
9 Reflectivity
The reflectivity is included in the data field of MSOP packet. Reflectivity is a scale to
evaluate the ability of the object reflection of light. This value is highly related to the
material of measured object. Hence, the character can be used to distinguish the different
materials.
RS-Ruby reports reflectivity values from 0 to 255 with 255 being the reported reflectivity
for an ideal reflector. Diffuse reflection reports values from 0 to 100, with the weakest
reflectivity reported from black objects and strongest reflectivity reported from white object.
Retro-reflector reports values from 101 to 255.
The value of reflectivity is already encapsulated in MSOP. It means that the reflectivity can
be directly read.
Figure 9. Calibration of reflectivity.
Page 25

RS-Ruby Users’ Manual
20
Problem
Resolution
Interface BOX red LED doesn’t light or
blink
Verify the power connection and polarity
Verify the power supply satisfy the requirement (at least
4A @ 19V)
Interface BOX red LED lights on but
green LED doesn’t light or blink
Verify the connection between Interface BOX and LiDAR
is solid.
Rotor doesn’t spin
Verify the Interface BOX LEDs is okay
Verify the connection between Interface BOX and LiDAR
is solid.
Reboot at the boot time
Verify the power connection and polarity
Verify the power supply satisfy the requirement (at least
4A @ 19V)
Check if the LiDAR mounting plane is level or if the LiDAR
bottom fixing screws are too tight.
Unit spin but no data
Verify network wiring is functional.
Verify receiving computer's network settings.
Verify packet output using another application
(e.g. Wireshark)
Verify no security software is installed which may block
Ethernet broadcasts.
Verify input voltage and current draw are in proper ranges
Can see data in Wireshark but not
RSVIEW
Check no firewall is active on receiving computer.
Check the receiving computer’s IP address is the same
as LiDAR destination IP address.
Check the RSVIEW Data Port setting.
Check if the wireshark receive the MSOP packets.
10 Troubleshooting
This section provides detail on how to troubleshoot your sensor.
Page 26

RS-Ruby Users’ Manual
21
Data dropouts
This is nearly always an issue with the network and/or
user computer.
Check the following:
Is there excessive traffic and/or collisions on network?
Are excessive broadcast packets from another service
being received by the sensor? This can slow the sensor
down.
Is the computer fast enough to keep up with the packet
flow coming from the sensor?
Remove all network devices and test with a computer
directly connected to the sensor.
GPS not synchronizing
Check baud rate is 9600 and serial port set to 8N1 (8 bits,
no parity, 1 stop bit).
Check the signal level is RS232 level
Check electrical continuity of PPS and serial wiring
Check incorrect construction of NMEA sentence
Check the GPS and Interface BOX are connected to the
same GND
Check the GPS receive the valid data
No data via router
Close the DHCP function in router or set the Sensor IP in
router configuration
Sensor point cloud data distortion
Check the configuration files is right
A blank region rotates in the cloud data
when using ROS driver
This is the normal phenomenon as the ROS driver use
fixed packets quantity to divide display frame. The blank
region data will output in the next frame.
Point cloud data to be a radial
If the computer is windows 10 OS, then run the RSVIEW
with windows 7 OS compatible mode.
Page 27

RS-Ruby Users’ Manual
22
UTC Time(in total 10 bytes)
Byte No.
byte1
byte2
byte3
byte4
byte5
byte6
byte7
byte8
Function
year
month
day
hour
min
sec
ms
Byte No.
byte9
byte10
Function
μs
set_year
Byte No.
bit7
bit6
bit5
bit4
bit3
bit2
bit1
bit0
Function
set_year[7:0]:Data 0~255 corresponds to year 2000~ year 2255
set_month
Byte No.
bit7
bit6
bit5
bit4
bit3
bit2
bit1
bit0
Function
reserve
reserve
reserve
reserve
set_month[3:0]:1~12 month
set_day
Byte No.
bit7
bit6
bit5
bit4
bit3
bit2
bit1
bit0
Function
reserve
reserve
reserve
set_day[4:0]:1~31 day
reg name:set_hour
Byte No.
bit7
bit6
bit5
bit4
bit3
bit2
bit1
bit0
Function
reserve
reserve
reserve
set_hour[4:0]:0~23 hour
set_min
Byte No.
bit7
bit6
bit5
bit4
bit3
bit2
bit1
bit0
Function
reserve
reserve
set_min[5:0]:0~59 min
set_sec
Byte No.
bit7
bit6
bit5
bit4
bit3
bit2
bit1
bit0
Function
reserve
reserve
set_sec[5:0]:0~59 sec
Appendix A – the Format of all Register
A.1 UTC_TIME
Explanation of each Byte in UTC:
1) year
2) month
3) day
4) hour
5) min
6) sec
Page 28

23
7) ms
set_ms
Byte No.
bit15
bit14
bit13
bit12
bit11
bit10
bit9
bit8
Function
reserve
reserve
reserve
reserve
reserve
reserve
ms[9:8]
Byte No.
bit7
bit6
bit5
bit4
bit3
bit2
bit1
bit0
Function
set_ms[7:0]
set_us
Byte No.
bit15
bit14
bit13
bit12
bit11
bit10
bit9
bit8
Function
reserve
reserve
reserve
reserve
reserve
reserve
us[9:8]
Byte No.
bit7
bit6
bit5
bit4
bit3
bit2
bit1
bit0
Function
set_μs[7:0]
Note:set_ms[9:0]value:0~999
8) μs
Note:set_μs[9:0]value:0~999
RS-Ruby Users’ Manual
Page 29

RS-Ruby Users’ Manual
24
Appendix B RSView
In this appendix, the record, visualization, save and redisplay of the data from RS-Ruby
will be interpreted with using RSView. The original sensor data can be also captured and
examined by using other free tools, such as Wireshark or TCP-Dump. But visualization of
the 3D data through using RSView is easy to realize. RS-Ruby is used with RSView vision
3.1.5. or above.
B.1 Software Features
RSView can provide real-time visualization of 3D coordinate data from RS-Ruby. RSView
can also review the pre-recorded data stored in “pcap” (Packet Capture) files, but RSView
still doesn’t support directly importing “.pcapng” files.
RSView displays directly the point cloud that is exchanged from the measured distance
from RS-Ruby. It supports changing the display mode of point cloud as user wishes,
according to Reflectivity, timestamp, distance, azimuth, and laser channel. The data can
be exported as XYZ coordinate data in CSV format or LAS format. RSView does not
support generating point cloud files in XYZ, or PLY formats.
Function and features of RSView are shown as follow:
Online visualization of sensor data over Ethernet
Record of real-time data into pcap files
Review of the collected point cloud from pcap files
Different visualization mode based on distance, timestamp, azimuth, laser ID, etc.
Tabular inspection of point cloud data
Exporting the point cloud data into CSV format
Tool for measuring distance from visualized cloud point
Simultaneously Display of multiple continuous frames (Trailing frames)
Display or hide subsets of lasers
Crop tool to show partial point cloud
B.2 Installation of RSView
Installation packet of RSView is suited for Windows 64-bit system and it has no need for
other dependent software packets. The executable installation packet can be found in
USB stick with name “RSView_X.X.X_Setup.exe” from the RS-Ruby package. Also you
can download the latest version from RoboSense website
(http://www.robosense.ai/web/resource/en). Launch the installation packet and follow the
instructions to complete the installation. The installation path should not contain any
Chinese characters.
B.3 Network Setup
As mentioned in the chapter 5, the default IP address of the computer should be set as
192.168.1.102, sub-net mask should be 255.255.255.0. You should make sure RSView
doesn’t be blocked by firewall in PC.
Page 30

RS-Ruby Users’ Manual
25
B.4 Visualization of point cloud
1. Connect the RS-Ruby to PC over Ethernet cables and power supply.
2. Right Click to start the RSView application with Run as administrator.
3. Click on the “File”-> Open -> Sensor Stream (Fig B-1).
Figure B - 1. Open sensor stream in RSView.
4. After finishing above 3 steps, the dialogue box “Sensor Configuration” shows up. In this
dialogue box, the default configuration folder of RS-Ruby calibration is already contained
and the folder is already chosen. If there is chaos while display in RSView, please check
and add the right configuration files folder. Click Add button then select corresponding file
at last click OK (as shown in Fig B-2).
Figure B - 2. RSView Select Sensor Correction File.
5. RSView begins displaying the colored point cloud from capturing the sensor data
stream from LiDAR (as shown in Fig. B-3). The stream can be paused by pressing the
Play/Pause button.
Page 31

RS-Ruby Users’ Manual
26
Figure B - 3. RSView Sensor Stream Display.
B.5 Save Streaming Sensor Data into PCAP File
1. Click the record button while real-time display (Fig. B-4).
Figure B - 4. RSView Record Button.
2. In the dialogue box “Choose Output File”, the save path and file name of pcap file can
be set up. (Fig B-5). After clicking “save” button, RSView begins writing data into pcap file.
(Note: RS-Ruby will generate enormous measuring data. So, it is best to use a fast, local
HDD or SSD, not to use a slow subsystem such as USB storage device or network drive.)
Figure B - 5. RSView Record Saving Dialog.
3. Click “Record” Button will finish record and save the all recorded data into this pcap file.
Page 32

RS-Ruby Users’ Manual
27
B.6 Replay Recorded Sensor Data from PCAP Files
In order to replaying (or examining) a pcap file, please import it into RSView. Then press
Play/Pause button to let it play or scrub the time slider to a certain time point as user
wishes. When only a part of 3D point cloud is concerned, it can be selected out by
mouse. Then point cloud data of this part can be shown in table.
1. Click File -> Open then select Capture File.
Figure B - 6. RSView Open Capture File.
2. In dialogue box “Open File”, please import a recorded pcap file then click “open (O)”
button.
Figure B - 7. Select the PCAP File.
3. In dialogue box “Sensor Configuration”, please add and select the right configuration
file of RS-Ruby, then click OK.
4. Clicking Play/Pause button can make 3D point cloud stream play and pause. Using the
Scrub tool can select out the interesting frame. (Fig. B-8)
Figure B - 8. RSView Play Button and Scrub slide tool.
5. In order to inspecting partial relevant point cloud data from a closer aspect, please
scrub to an interesting frame and click the Spreadsheet button (Fig B-9). A data table will
Page 33

RS-Ruby Users’ Manual
28
be displayed on the right side. It contains all displayed data points in the frame.
Figure B - 9. RSView Spreadsheet tool.
6. The dimension and the sort of data in this table are adjustable. That can make the
display more obvious. (Fig. B-10)
Figure B - 10. RSView Data Point Table.
7. Click “Show only selected elements” in spreadsheet can acquire corresponding data,
certainly there is no data shown in table, if no one point is selected. (Fig. B-11)
Figure B - 11. RSView Show Only Selected Elements.
8. By using “Select All Points” Tool, the arbitrary point can be selected. (as shown in fig.
B-12)
Figure B - 12. RSView Select All Points.
9. In the 3D rendered data pane using mouse to draw a rectangle around a small number
of points. The values of them can be immediately shown in the table (Fig. B-13).
Page 34

RS-Ruby Users’ Manual
29
Figure B - 13. RSView Selected Points.
10. Any selected point can be saved by doing File>Save As>Select Frames.
Page 35

RS-Ruby Users’ Manual
30
Appendix C RS-Ruby ROS Package
This appendix describes how to use Ubuntu + ROS to acquiring and visualizing the
measuring data from RS-Ruby.
C.1 Software Installation
1. Download and Install Ubuntu 16.04 OS.
2. Please refer the link (http://wiki.ros.org/kinetic/Installation) to install the ROS Kinetic .
3. Download and install libpcap-dev.
C.2 Compile RS-Ruby ROS Package
1. Create a workspace for ROS:
cd ~
mkdir -p catkin_ws/src
2. Copy the corresponding ros_rslidar_package into the ROS workspace under the path:
~/catkin_ws/src. The latest ros_rslidar driver can be downloaded from
https://github.com/RoboSense-LiDAR/ros_rslidar or contact Robosense support.
3. Build:
cd ~/catkin_ws
catkin_make
4. Place the configuration file of corresponding LiDAR into PC from USB stick:
The configuration_data is in the USB stick shipped with the LiDAR. Copy the launch file
into specified folder. This path can be customized.
For example: rslidar_pointcloud/data/rs_ruby
C.3 Configure PC IP address
For the default RS-Ruby firmware, static IP address of PC is configured to
“192.168.1.102”, submask: “255.255.255.0”, gateway doesn’t need to configure.
After configuring the static IP, it can be examined in CMD with code ifconfig.
C.4 Display of the real-time data
1. Connect the RS-Ruby to PC via twister pair wire with RJ45 connector, power on it, then
wait for PC cognizing LiDAR.
2. An example launch file has been provided under path: rslidar_pointcloud/launch, in
order to starting the node that can be run to visualize the real-time point cloud data. Open
a terminal with a location as shown as below:
cd ~/catkin_ws
source devel/setup.bash
roslaunch rslidar_pointcloud rs_ruby.launch
3. Open a new terminal:
rviz
Page 36

RS-Ruby Users’ Manual
31
Set the Fixed Frame to "rslidar", add a Pointcloud2 type and set the topic to
"rslidar_points".
Figure C - 1. Display point cloud Data in rviz.
C.5 Offline Display the recorded PCAP File
The ros_rslidar ROS package can be also use to display the recorded. Pcap offline data.
1. Modify the “rs_ruby.launch” file like below (please pay attention to the red code line):
<launch>
<arg name="model" default="RS-ruby" />
<arg name="device_ip" default="192.168.1.200" />
<arg name="msop_port" default="6699" />
<arg name="lidar_param_path" default="$(find rslidar_pointcloud)/data/rs_ruby/"/>
<node name="rslidar_node" pkg="rslidar_driver" type="rslidar_node" output="screen" >
<param name="model" value="$(arg model)"/>
<param name="device_ip" value="$(arg device_ip)" />
<param name="msop_port" value="$(arg msop_port)" />
<param name="pcap" value="xxx.pcap absolute address"/>
</node>
<node name="cloud_node" pkg="rslidar_pointcloud" type="cloud_node" output="screen" >
<param name="model" value="$(arg model)"/>
<param name="angle_path" value="$(arg lidar_param_path)/angle.csv" />
<param name="channel_path" value="$(arg lidar_param_path)/ChannelNum.csv" />
</node>
<node name="rviz" pkg="rviz" type="rviz" args="-d $(find rslidar_pointcloud)/rviz_cfg/rslidar.rviz" />
</launch>
Page 37

32
2. Open a terminal, run the node:
cd ~/catkin_ws
source devel/setup.bash
roslaunch rslidar_pointcloud rs_
ruby
.launch
3. This step is same as step 3 in chapter C.4.
RS-Ruby Users’ Manual
Page 38

33
Appendix D Dimension
RS-Ruby Users’ Manual
Figure D - 1: Dimension of Ruby.
Page 39

RS-Ruby Users’ Manual
34
Appendix E Suggestion of Mechanical LiDAR Mount
Please make sure the surface of platform used for mounting LiDAR is smooth as possible.
Please make sure the locating pin on the mount surface do exceed 4mm high.
The material of the mount platform is suggested to be aluminum alloy in order to
thermolysis.
When the LiDAR is installed, if there is a mounting contact surface on the upper and
bottom sides of the LiDAR, make sure that the spacing between the mounting surfaces is
greater than the height of the LiDAR to avoid squeezing the LiDAR.
Please don’t mount the LiDAR in a tilt position where the tilt angle exceeds 90 degrees,
this will reduce the sensor life time.
When the LiDAR cable is routed in the mount device, please keep the cable a little slack,
not too tense.
Page 40

RS-Ruby Users’ Manual
35
Appendix F Clean of LiDAR
F.1 Attention
Before cleaning the RS-LiDAR, please read through this entire Appendix F. Otherwise,
improper handling can permanently damage it.
When the sensor is used in a harsh environment, it is necessary to clean it in time to keep
its performance.
F.2 Required Materials
1. Clean microfiber cloths
2. Mild, liquid dish-washing soap
3. Spray bottle within warm, clean water
4. Solution of Isopropyl alcohol
5. Clean gloves
F.3 Clean Method
If the sensor is just covered by dust, use a clean microfiber cloth with a little isopropyl
alcohol to clean the sensor directly, then dry with another clean microfiber cloth.
If the sensor is caked with mud or bugs, use a spray bottle with clean, warm water to
loosen any debris from it. Do not wipe dirt directly off the sensor. Doing so may abrade the
surface. Then use warm, mildly-soapy water and gently wipe the sensor with a clean
microfiber cloth. Wipe the ring lens gently along the curve of the sensor, not top-to-bottom.
To finish, spray the sensor with clean water to rinse off any remaining soap (if necessary,
use isopropyl alcohol and a clean microfiber cloth to clean any remaining dirt from the
sensor), then dry with another clean microfiber cloth.
Page 41

RS-Ruby Users’ Manual
36
 Loading...