

Page 1

Data Cal 2000
Operator’s Manual
Part Number: 71-0097RK
Revision: D
Released: 11/3/11
RKI Instruments, Inc.
Page 2

Warranty
RKI Instruments, In c. warrant s gas alarm equi pment sold by us to be free
from defects in materials and workmanship, and performance f or a
period of one year from date of shipment from RKI Instruments, Inc. Any
parts found de fective within that period will be repaired or replaced, at our
option, free of charge. This warranty does not apply to tho se items which
by their nature are subject to deterioration or consumption in normal
service, and which must be cleaned, repaired, or replaced on a routine
basis. Examples of such items are:
Absorbent cartridges Batteries
Pump diaphragms and
Filter elements
valves
Fuses
Warrant y is voi ded by abuse including mechanical damage, alteration,
rough handling, or repairs procedures not in accordance with the
instruction manual. This warranty indicates the full extent of our liability,
and we are not responsible for removal or replacement costs, local repair
costs, transportation costs, or contingent expenses incurred without our
prior approval.
HIS WARRANTY IS EXPRESSLY IN LIEU OF ANY AND ALL OTHER
T
WARRANTIES AND REPRESENTATIONS, EXPRESSED OR IMPLIED, AND
ALL OTHER OBLIGATIONS OR LIABILITIES ON THE PART OF RKI
NSTRUMENTS, INC. INCLUDING BUT NOT LIMITED TO THE WARRANTY
I
OF MERCHANTABILITY OR FITNESS FOR A PARTICULAR PURPOSE. IN
NO EVENT SHALL RKI INSTRUMENTS, INC. BE LIABLE FOR INDIRECT,
INCIDENTAL, OR CONSEQUENTIAL LOSS OR DAMAGE OF ANY KIND
CONNECTED WITH THE USE OF ITS PRODUCTS OR FAILURE OF ITS
PRODUCTS TO FUNCTION OR OPERATE PROPERLY.
This warranty covers instruments and parts sold to users only by
authorized distributor s, dealers, and represen tatives as appoin ted by RKI
Instruments, Inc.
We do not assume indemnification for any accident or damage caused
by the operation of this gas monitor and our warranty is limited to
replacement of parts or our complete goods.
Warranty
Page 3

Table of Contents
Introduction . . . . . . . . . . . . . . . . . . . . . . . . . . . . . . . . . . . . . . . . . . . . . . . 1
System Requirement s . . . . . . . . . . . . . . . . . . . . . . . . . . . . . . . . . . . . . . . 2
Specifications . . . . . . . . . . . . . . . . . . . . . . . . . . . . . . . . . . . . . . . . . . . . . . 3
Description . . . . . . . . . . . . . . . . . . . . . . . . . . . . . . . . . . . . . . . . . . . . . . . . 4
Docking Station . . . . . . . . . . . . . . . . . . . . . . . . . . . . . . . . . . . . . . . . . 5
DM-2001, DM-2003, and DM-2009 Docking Modules . . . . . . . . . . . 7
Communication Cables . . . . . . . . . . . . . . . . . . . . . . . . . . . . . . . . . . 12
Power Cord . . . . . . . . . . . . . . . . . . . . . . . . . . . . . . . . . . . . . . . . . . . 13
4-Gas Mix Calibration Cylinder . . . . . . . . . . . . . . . . . . . . . . . . . . . . 13
Demand Flow Regulator & 3 ft. Tube . . . . . . . . . . . . . . . . . . . . . . . 13
10 ft. Exhaust Tube . . . . . . . . . . . . . . . . . . . . . . . . . . . . . . . . . . . . . 13
Data Cal 2000 Hardware Setup . . . . . . . . . . . . . . . . . . . . . . . . . . . . . . . 13
Setting the Docking Module Configuration Switches . . . . . . . . . . . 14
Mechanical Assembly . . . . . . . . . . . . . . . . . . . . . . . . . . . . . . . . . . . 15
Cable Installation . . . . . . . . . . . . . . . . . . . . . . . . . . . . . . . . . . . . . . 16
Tubing Installation . . . . . . . . . . . . . . . . . . . . . . . . . . . . . . . . . . . . . . 17
Installing the Data Cal 2000 Docking S tation Software . . . . . . . . . . . 21
Launching the Data Cal 2000 Software . . . . . . . . . . . . . . . . . . . . . . . . 23
Overview of the Data Cal 2000 Software . . . . . . . . . . . . . . . . . . . . . . . 24
Data Cal 2000 Functions . . . . . . . . . . . . . . . . . . . . . . . . . . . . . . . . 24
Main Program Window . . . . . . . . . . . . . . . . . . . . . . . . . . . . . . . . . . 25
Table of Contents
Page 4

Setting Up the Data Ca l 2000 Software . . . . . . . . . . . . . . . . . . . . . . . . 27
Setting Up the Configuration . . . . . . . . . . . . . . . . . . . . . . . . . . . . . . 28
Viewing the Pre-Defined Cylinders . . . . . . . . . . . . . . . . . . . . . . . . . 32
Adding and Updating Cylinders . . . . . . . . . . . . . . . . . . . . . . . . . . . 33
Setting Up the Solenoids . . . . . . . . . . . . . . . . . . . . . . . . . . . . . . . . 36
Connecting Instruments to the Data Cal 2000 . . . . . . . . . . . . . . . . . . . 38
Bump Testing Instruments . . . . . . . . . . . . . . . . . . . . . . . . . . . . . . . . . . 42
Calibrating Instruments . . . . . . . . . . . . . . . . . . . . . . . . . . . . . . . . . . . . . 45
Deleting Instrument s From the Main Window . . . . . . . . . . . . . . . . . . . 48
Charging Instruments With The Data Cal 2000 . . . . . . . . . . . . . . . . . . 48
Logs Window . . . . . . . . . . . . . . . . . . . . . . . . . . . . . . . . . . . . . . . . . . . . . 50
Viewing Data . . . . . . . . . . . . . . . . . . . . . . . . . . . . . . . . . . . . . . . . . . 50
Deleting Data. . . . . . . . . . . . . . . . . . . . . . . . . . . . . . . . . . . . . . . . . . 52
Alarm Trend Data . . . . . . . . . . . . . . . . . . . . . . . . . . . . . . . . . . . . . . 52
Calibration Data . . . . . . . . . . . . . . . . . . . . . . . . . . . . . . . . . . . . . . . 58
Event Data . . . . . . . . . . . . . . . . . . . . . . . . . . . . . . . . . . . . . . . . . . . 61
Interval Trend Data . . . . . . . . . . . . . . . . . . . . . . . . . . . . . . . . . . . . . 62
Memo Feature . . . . . . . . . . . . . . . . . . . . . . . . . . . . . . . . . . . . . . . . 68
Bump Test Files . . . . . . . . . . . . . . . . . . . . . . . . . . . . . . . . . . . . . . . 70
Instrument/Module Function Menu . . . . . . . . . . . . . . . . . . . . . . . . . . . 72
Open Function . . . . . . . . . . . . . . . . . . . . . . . . . . . . . . . . . . . . . . . . 73
Edit Function . . . . . . . . . . . . . . . . . . . . . . . . . . . . . . . . . . . . . . . . . . 74
Edit Function, Memo Entry . . . . . . . . . . . . . . . . . . . . . . . . . . . . . . . 75
Download Function . . . . . . . . . . . . . . . . . . . . . . . . . . . . . . . . . . . . . 76
Clear Logs Function . . . . . . . . . . . . . . . . . . . . . . . . . . . . . . . . . . . . 76
Reset Function . . . . . . . . . . . . . . . . . . . . . . . . . . . . . . . . . . . . . . . . 76
Table of Contents
Page 5

Power Off Function . . . . . . . . . . . . . . . . . . . . . . . . . . . . . . . . . . . . . 77
Configuration Window . . . . . . . . . . . . . . . . . . . . . . . . . . . . . . . . . . . . . . 77
Parameter Tab . . . . . . . . . . . . . . . . . . . . . . . . . . . . . . . . . . . . . . . . 78
Database Tab . . . . . . . . . . . . . . . . . . . . . . . . . . . . . . . . . . . . . . . . . 79
Sensor Tab . . . . . . . . . . . . . . . . . . . . . . . . . . . . . . . . . . . . . . . . . . . 80
Password Tab . . . . . . . . . . . . . . . . . . . . . . . . . . . . . . . . . . . . . . . . . 81
Optimizing the Database . . . . . . . . . . . . . . . . . . . . . . . . . . . . . . . . . . . . 82
Spare Parts List . . . . . . . . . . . . . . . . . . . . . . . . . . . . . . . . . . . . . . . . . . . 82
CAUTION: Read and understand this manual before using the
Data Cal 2000. Also read and understand the
Model GX-2001, Model GX-2003, and Model GX2009 Operator’s Manuals included with each
instrument.
Table of Contents
Page 6

Introduction
The Data Cal 2000 Docking Station is a comprehensive and reliable
system that provides charging, data downloading, configuration updating,
calibration, and bump testing for the GX-2001, GX-2003, and GX-2009
gas detectors. It is designed for use with a Windows-based PC and the
Data Cal 2000 Docking Station Software.
The purpose of this manual is to explain how to set up and use the Data
Cal 2000 Docking Station and the Data Cal 2000 Docking Station
Software. You will learn how to:
• install and launch the software
• install the hardware
• set up the Data Cal 2000 software and hardware
• download data from the GX-2001, GX-2003, and GX-2009
• perform a bump test
• perform a calibration
• view, print, and save data
• change instrument parameters
• change data logging parameters
• use the Data Cal 2000 to charge an instrument
CAUTION: The GX-2001, GX-2003, and GX-2009 detect
oxygen deficiency and elevated levels of oxygen,
combustible gases, carbon monoxide, and
hydrogen sulfide, all of which can be dangerous or
life threatening. When using the GX-2001,
GX-2003, and GX-2009 you must follow the
instructions and warnings in the O perator’s Manual
1 • Introduction
for each instrument to assure proper and safe
operation of the unit and to minimize the risk of
personal injury.
Page 7

CAUTION: The operator of this instrument is advised that if t he
equipment is used in a manner not specified in this
manual, the protection provided by th e equipment
may be impaired.
System Requirements
To use the Data Cal 2000 and the Data Cal 2000 Docking Station
Software, your personal computer must meet the following requirements:
• Operating Systems: Windows® 98, Windows® ME, Windows®
®
2000, Windows NT
• Processor: IBM
equivalent minimum
4.0, or Windows® XP.
®
compatible PC running Pentium® 2 processor or
• Memory: 32 MB RAM minimum
• Hard Disk Space: 32 MB minimum
• CD-ROM Drive
System Requirements • 2
Page 8
Specifications
Table 1: Dat a Cal 2000 Specifications
Input Power 115 VAC, 50/60 Hz
Environmental
Conditions
Number of
Docking Modules
Applicable
Instruments
Number of Calibration Gas
Cylinders
• For Indoor Use Only
• -10° C to 40° C, below 80% Relative Humidity, NonCondensing
Up to 10 docking modules
• GX-2001
• GX-2003
• GX-2009
Up to 5 calibration gas cylinders and one zero air cylinder
3 • Specifications
Page 9
Description
The Data Cal 2000 consists of the following components:
• Data Cal 2000 Docking Station
• DM-2001 Docking Module for GX-2001
• DM-2003 Docking Module for GX-2003
• DM-2009 Docking Module for GX-2009
• RS-232C serial communication cable for connection of the docking
station to a computer
• RS-485 serial communication cables for connection of the docking
station to a docking module and for daisy chain connection of
additional docking modules to each other
• Power cord
• A 4-gas mix calibration cylinder (optional)
• Demand flow regulator with 3 foot tube (optional)
• 10 ft. exhaust tube
• A Windows based PC compatible computer (user supplied) with the
Data Cal 2000 Docking Station Software loaded
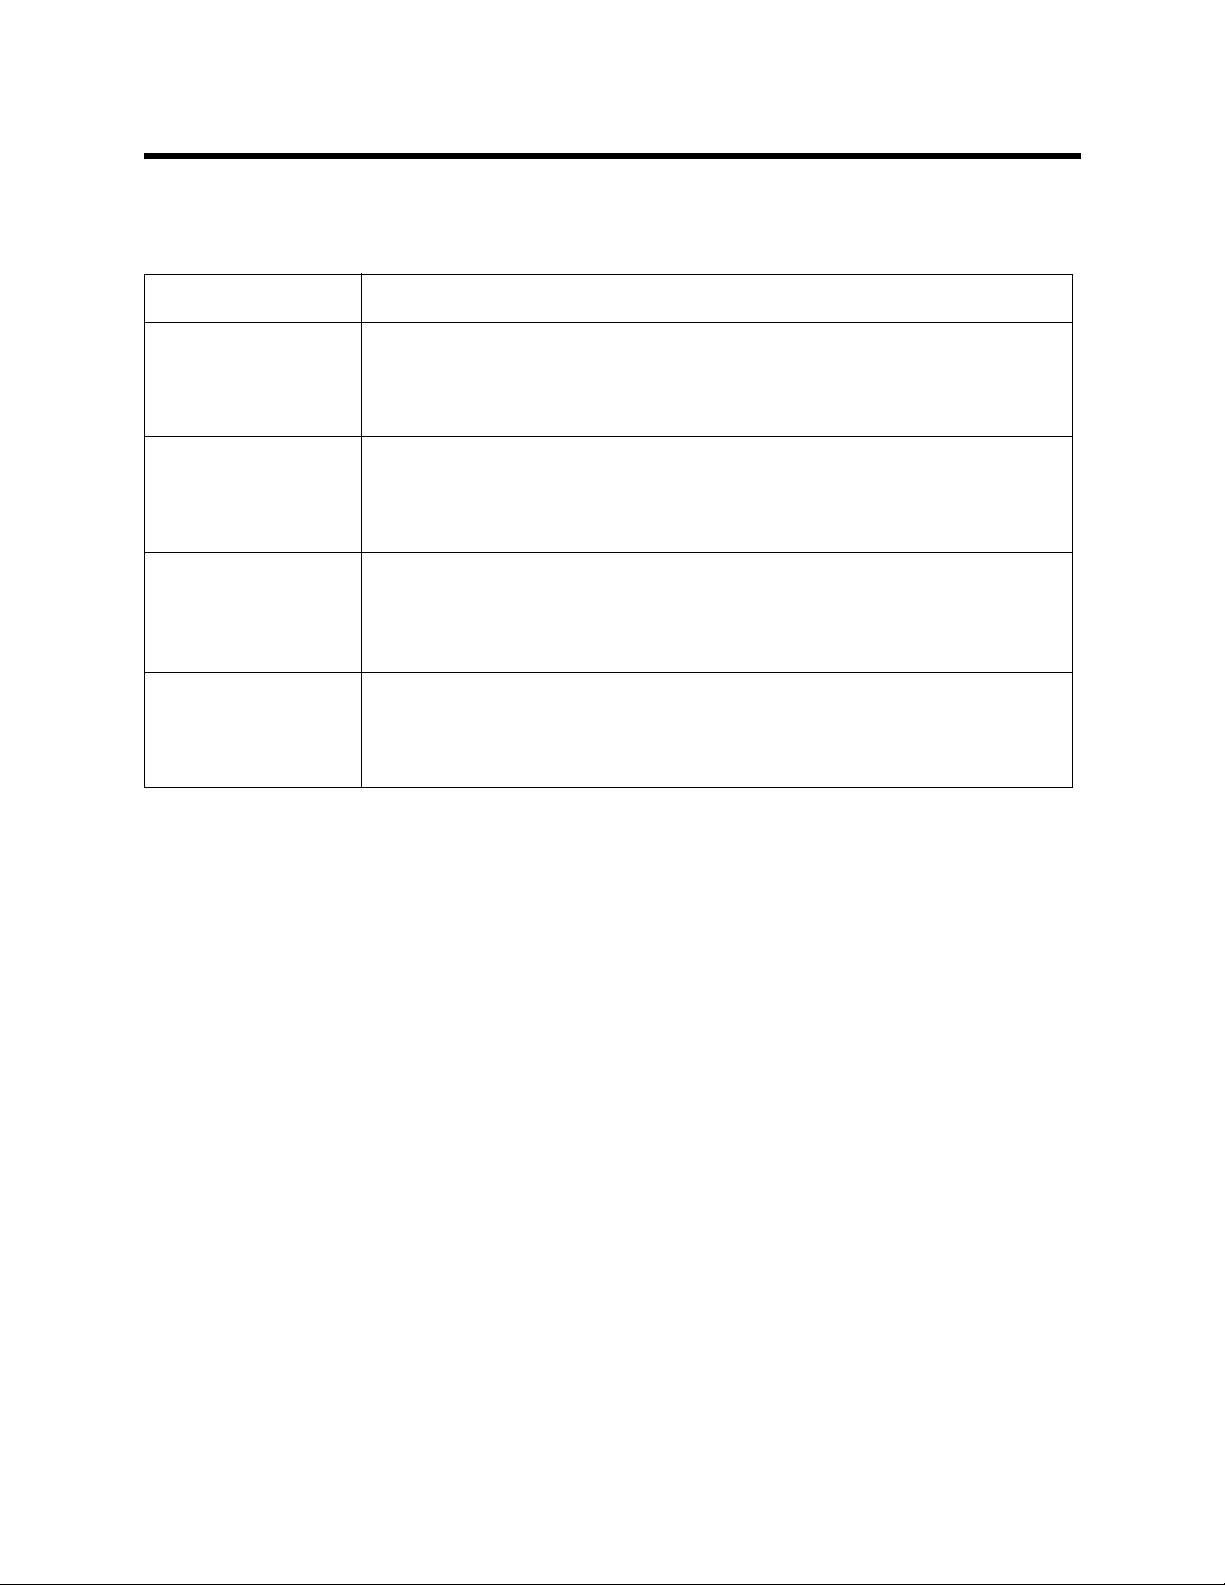
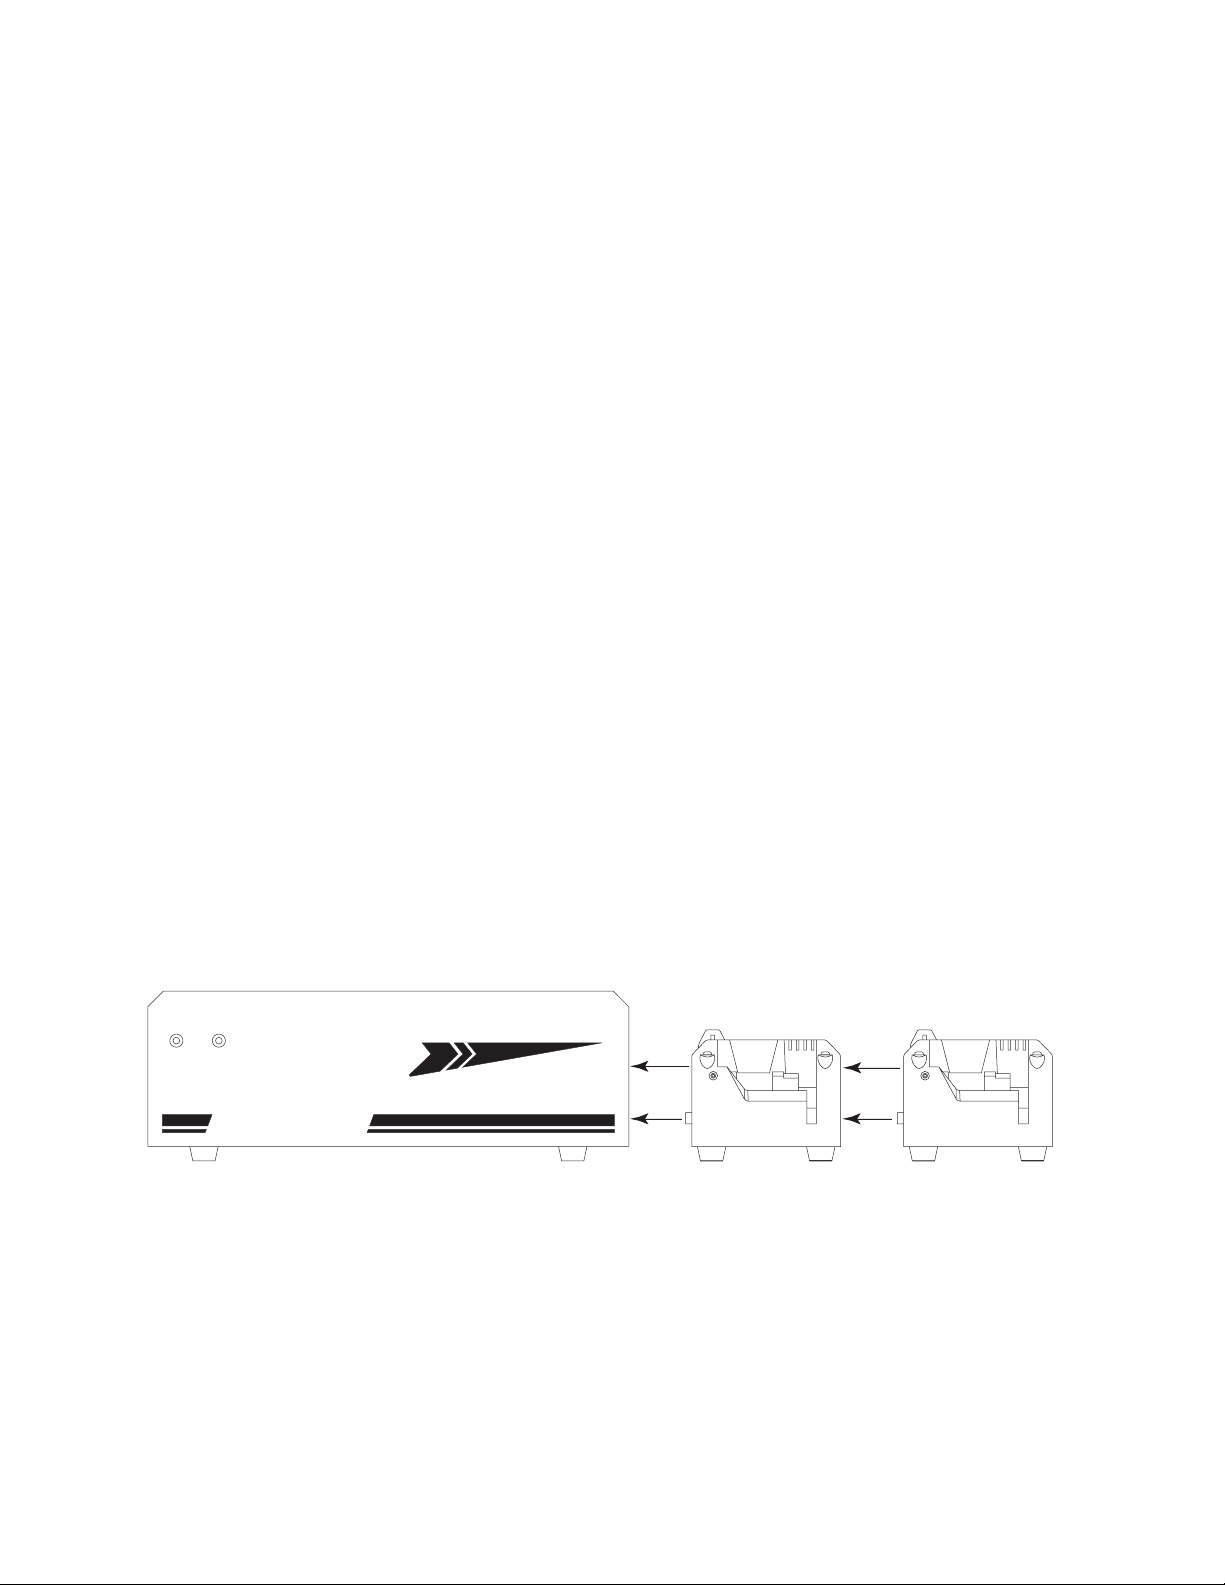
The docking station is designed to be used on a table top with t he DM2001, DM-2003, and/or DM-2009 docking modules extend ing to the rig ht
of the docking station as shown in Figure 1 below. Any combination of
docking modules may be used up to a total of 10. If a laptop computer is
used, it may be placed on top of the docking station if desired.
Up to 1 0 docking modules may b e installed i n any
combination of DM-2001's,DM-2003's, and DM-2009's.
Docking Station
POWER FAULT
Data Cal 2000
DM-2001
DM-2003
DM-2009
Figure 1: Data Cal 2000
Description • 4
Page 10
Docking Station
The docking station manages the calibration, bump test, and informatio n
exchange functions of the Data Cal 2000 once they have been initiated
through the software.The status LED’s are on the front panel. The power
switch and hose barb fittings for connection of calibration gas cylinders
and routing of calibration gas to the docking modules are located on the
back panel. Cable connectors for connecting the docking station to a
computer and to docking modules are also located on the back panel.
Three recesses are located on the right side of the docking station that
mate with tabs on the docking modules. These recesses allow table top
assembly of a docking module to the docking station.
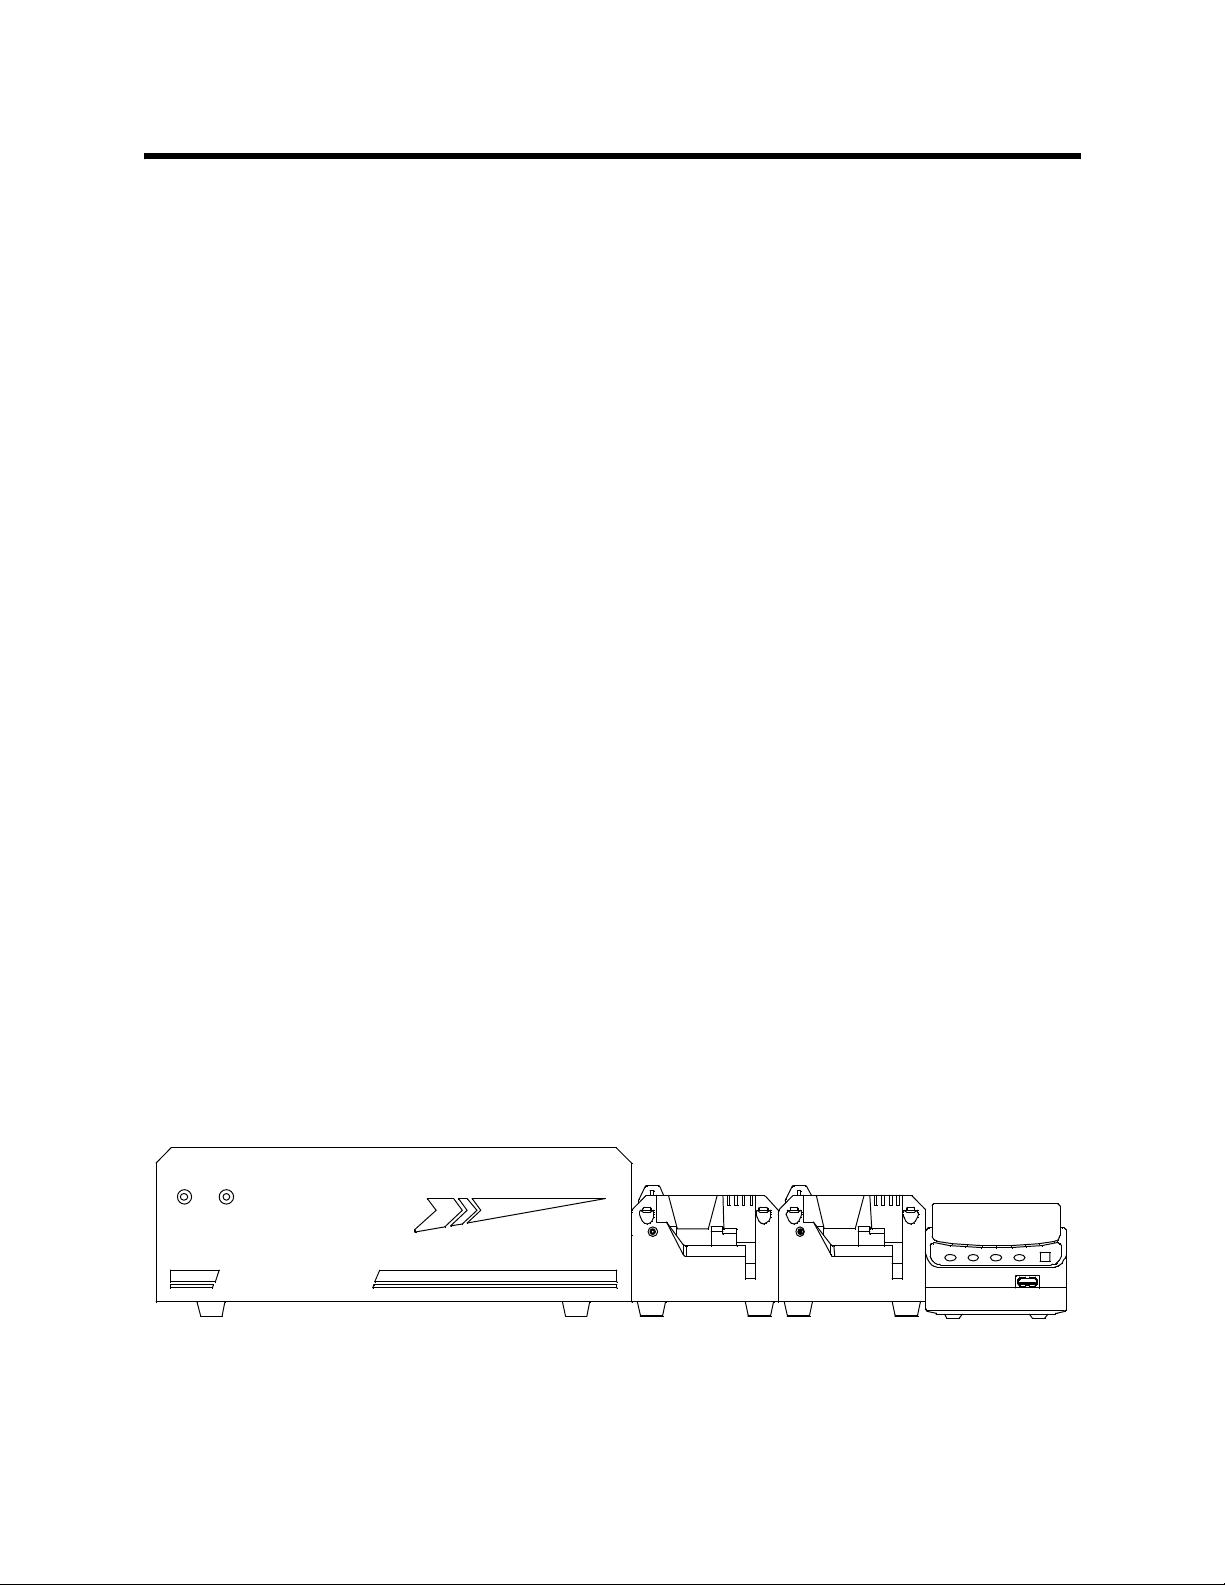
Front Panel
Docking Station
POWER
The two status LED’s are located on the f r ont panel in the upper left
corner. The left LED is green and is the POWER LED. It is on when the
docking station is turned on. The right LED is red and is t he FAULT LED.
It is on when there is a communication error or some hardware problem
that affects communication between the docking station and the
computer or the docking station and the modules.
FAULT
D
ata
Cal 2000
Figure 2: Data Cal 2000 Front Panel
5 • Description
Page 11
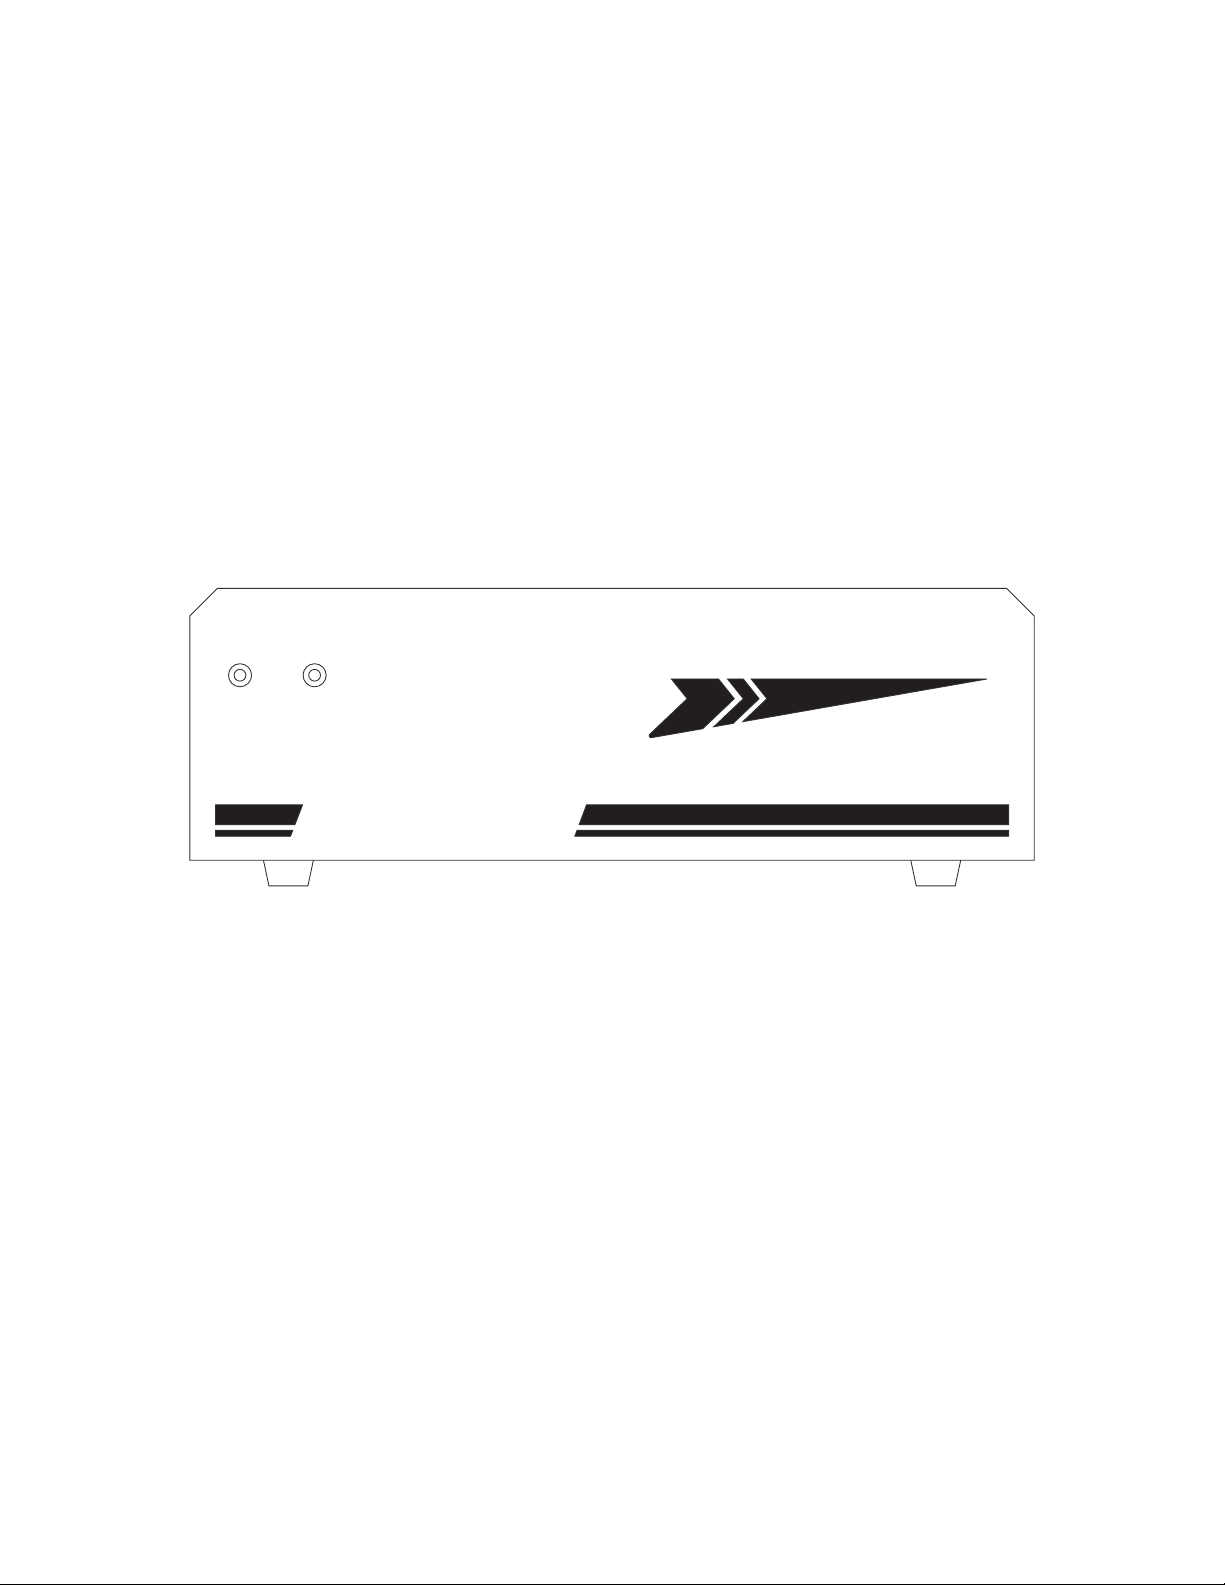
Back Panel
Fan Grill
MODULE
GAS OUT
PC(RS-232C)
AIR GAS1 GAS2 GAS3 GAS4 GAS5
FUSE(5A)
POWER
AC IN
AC100V-AC240V
Figure 3: Data Cal 2000 Back Panel
The power switch is a rocker switch and is located in the upper right
corner of the back pan el. The docking st ation is on when the upper half of
the switch, the “1” position, is pressed in, and of f when the lower half of
the switch, the “0” position, is pressed in.
All the gas fittings are located on the back panel. They are hose barb
type fittings that accept 3/16” inner diameter (ID) tubing. At the bottom
left of the back panel is the GAS OUT fitting. This fitting is used to route
calibration gas from the docking st ation to the docking modules. To the
right of the GAS OUT fitting is the AIR fitting. This fit ting is used to draw
fresh air while the Data Cal 2000 is performing a zeroing operati on during
bump testing or calibration.
To the right of the AIR fitting are five additional fittings of the same type
labeled GAS1, GAS2, GAS3, GAS4, and GAS5. These fittings are used
to connect up to 5 calibration gas cylinders that are defined using the
software. Usually, only one or two calibration cylinders will be needed.
Typical gas cylinders needed are a 4-gas mix of %LEL CH
or 3-gas mix of %LEL CH
%volume CH
TC sensor is installed on a GX-2003).
4
/CO and a %volume cylinder of CH4 (if t he
4/O2
4/O2
/CO/H2S
There are three connectors on the back panel. A DB-15 (15 pin)
receptacle in the upper lef t corner is used to connect the docking station
to the docking modules. It is labeled MODULE. A DB-9 (9 pin) plug to the
right of the MODULE connector is used to connect the docking st ation to
the serial port of a computer. It is labeled PC(RS-232C). A 3-pin
Description • 6
Page 12
recessed plug in the lower right corner of the panel is used t o connect an
AC line cord. It is labeled AC IN.
A fuse holder is located to the left of the AC IN connector. It is labeled
FUSE(5A). The fuse holder consists of a panel mounting socket and a
quarter turn fuse holder. The fuse is a 5 amp, 5 mm x 20 mm fuse.
A cooling fan is located inside the docking stat ion on the ri ght side above
the fuse holder. It draws warm air out of the docking st ation to preve nt the
internal electronic components from overheating.
DM-2001, DM-2003, and DM-2009 Docking Modules
The docking modules are used to facilitate communication between a
GX-2001, GX-2003, or GX-2009 and the docking station and computer
and to apply fresh air and calibration gas to an instrumen t during a bump
test or calibration. They are also used to charge an instrument’s
rechargeable battery pack if one is installed. Two multi color LED’s, one
on the left front and one on the right front of a module, indicate the
operation status of the docking module.
Each module has three connection tabs on the left side near the bottom
of the module and three connection recesses on the right side near the
bottom of the module. The tabs from one module can be pushed into the
recesses on the docking station or on another module to mechanically
connect the module to the docking station or to another module. If
multiple modules are used, one of them will be connected to the docking
station and then each additional module will be connected to the end
module as shown below in Figure 4.
Docking Station
FAULT
POWER
ata
Cal 2000
D
Figure 4: Assembling Docking Modules to Data Cal 2000
Connect any DM-2001s and DM-2003s first and then connect any
DM-2009s. This will allow the exhaust lines for the DM-2001 and
DM-2003 to easily be daisy-chained together and routed to an exhaust
area with a single exhaust tube. Each DM-2009 must have a dedicated
exhaust tube which can be easily routed away without interfering in the
daisy-chain configuration of the DM-2001s and DM-2003s.
7 • Description
Page 13
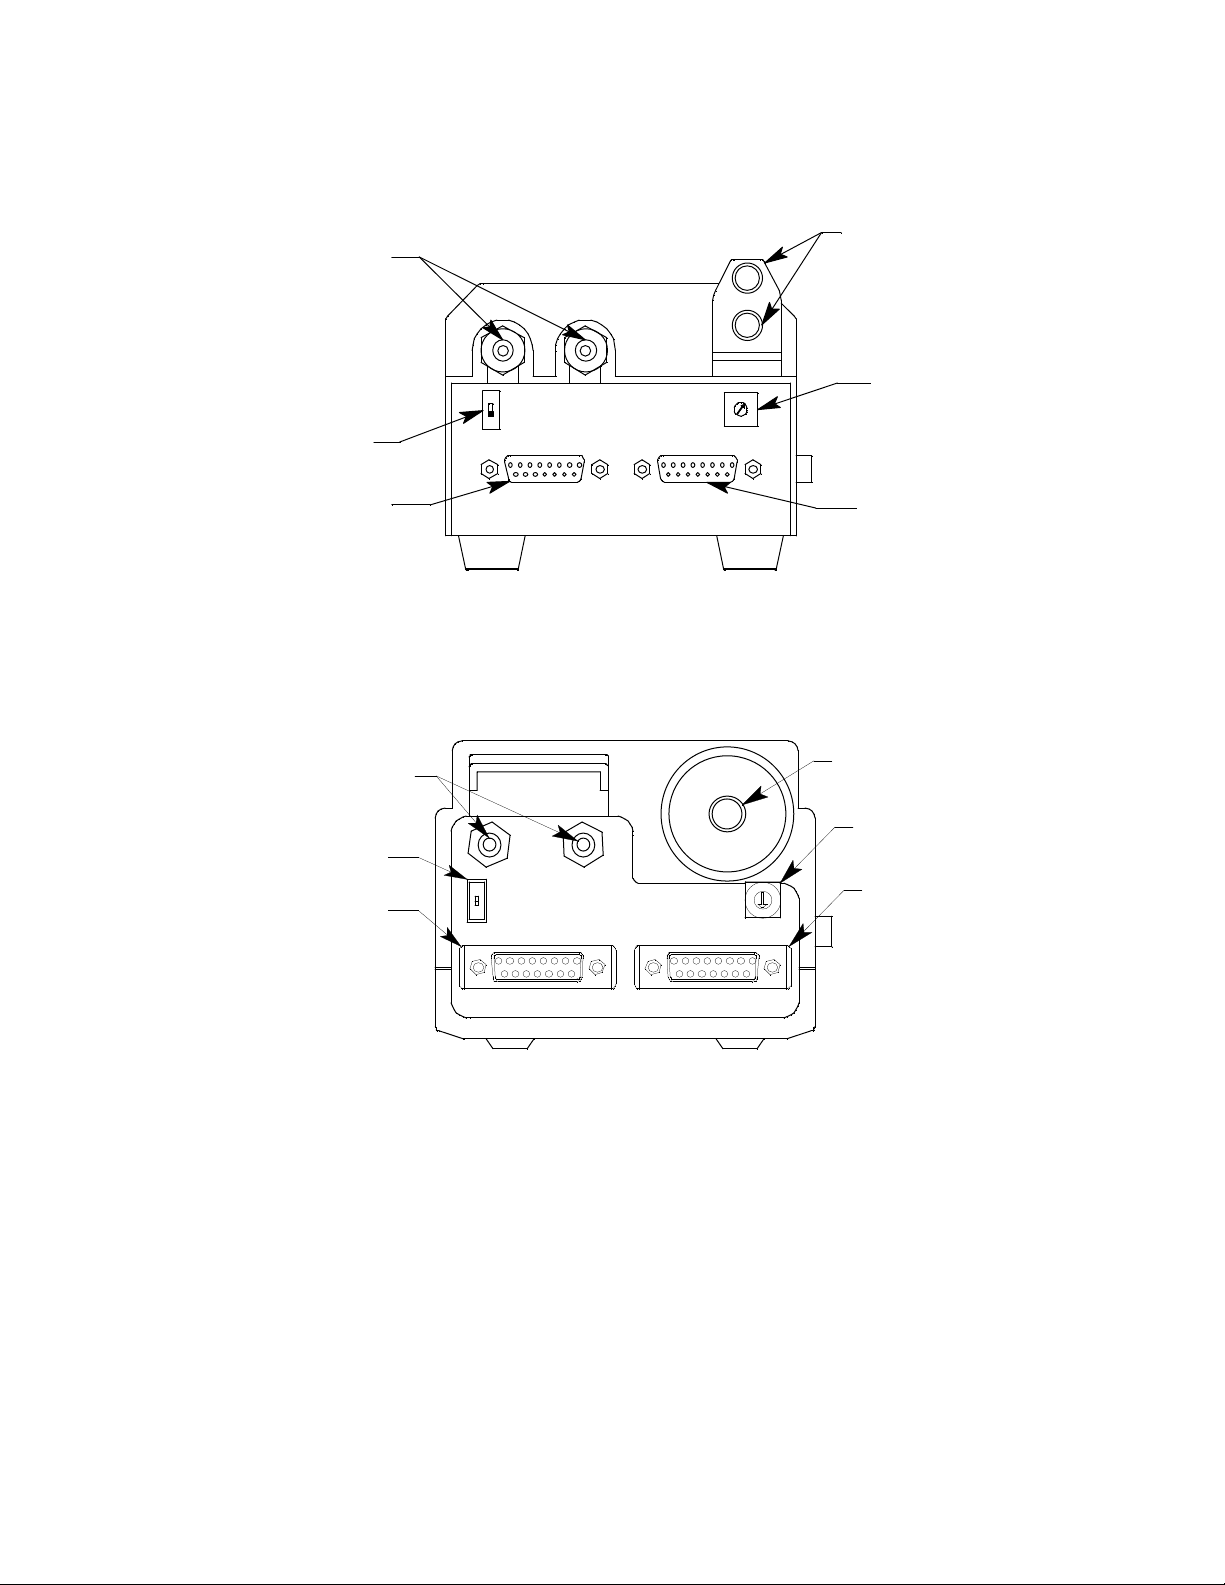
Calibration Gas
r
T
e
Fittings
Terminator Switch
Exhaust Fittings
ID Switch
Connector for
Cable From Other
Docking Module
Connector for
Cable from Data
Cal 2000 or Othe
Docking Module
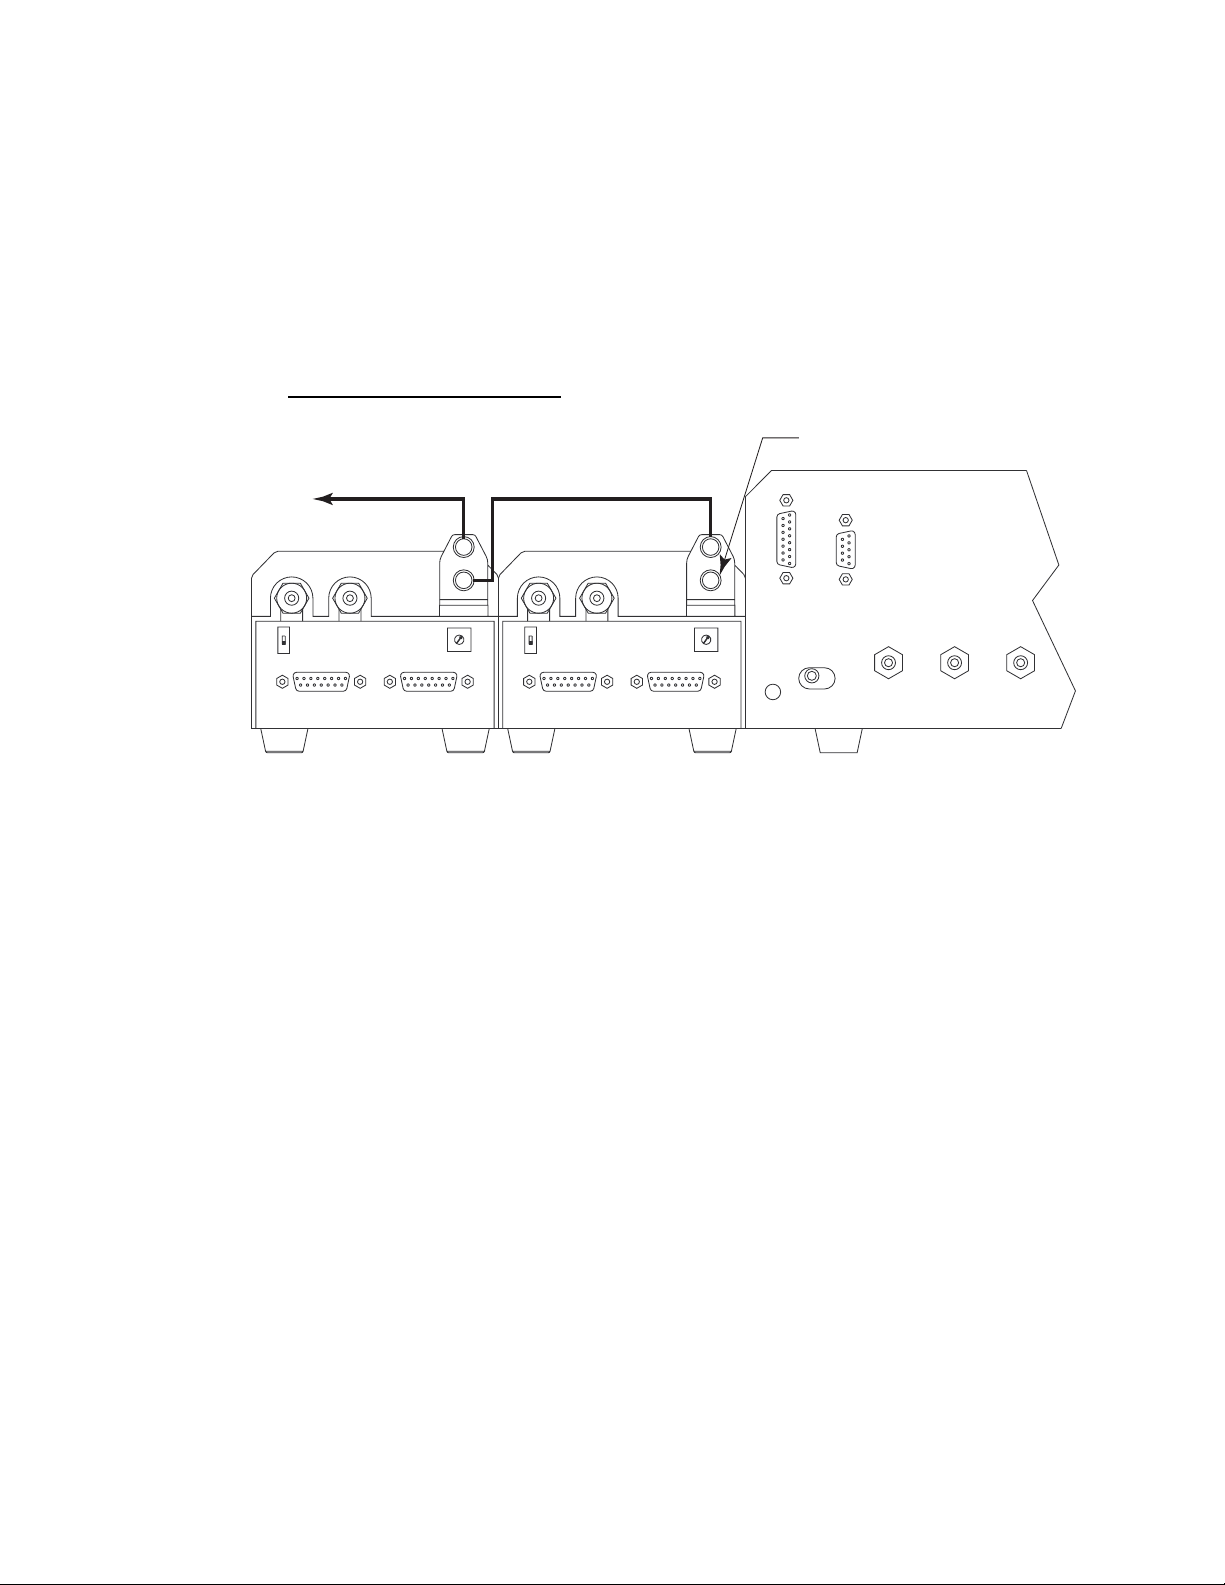
Figure 5: Back of DM-2001 and DM-2003 Docking Module
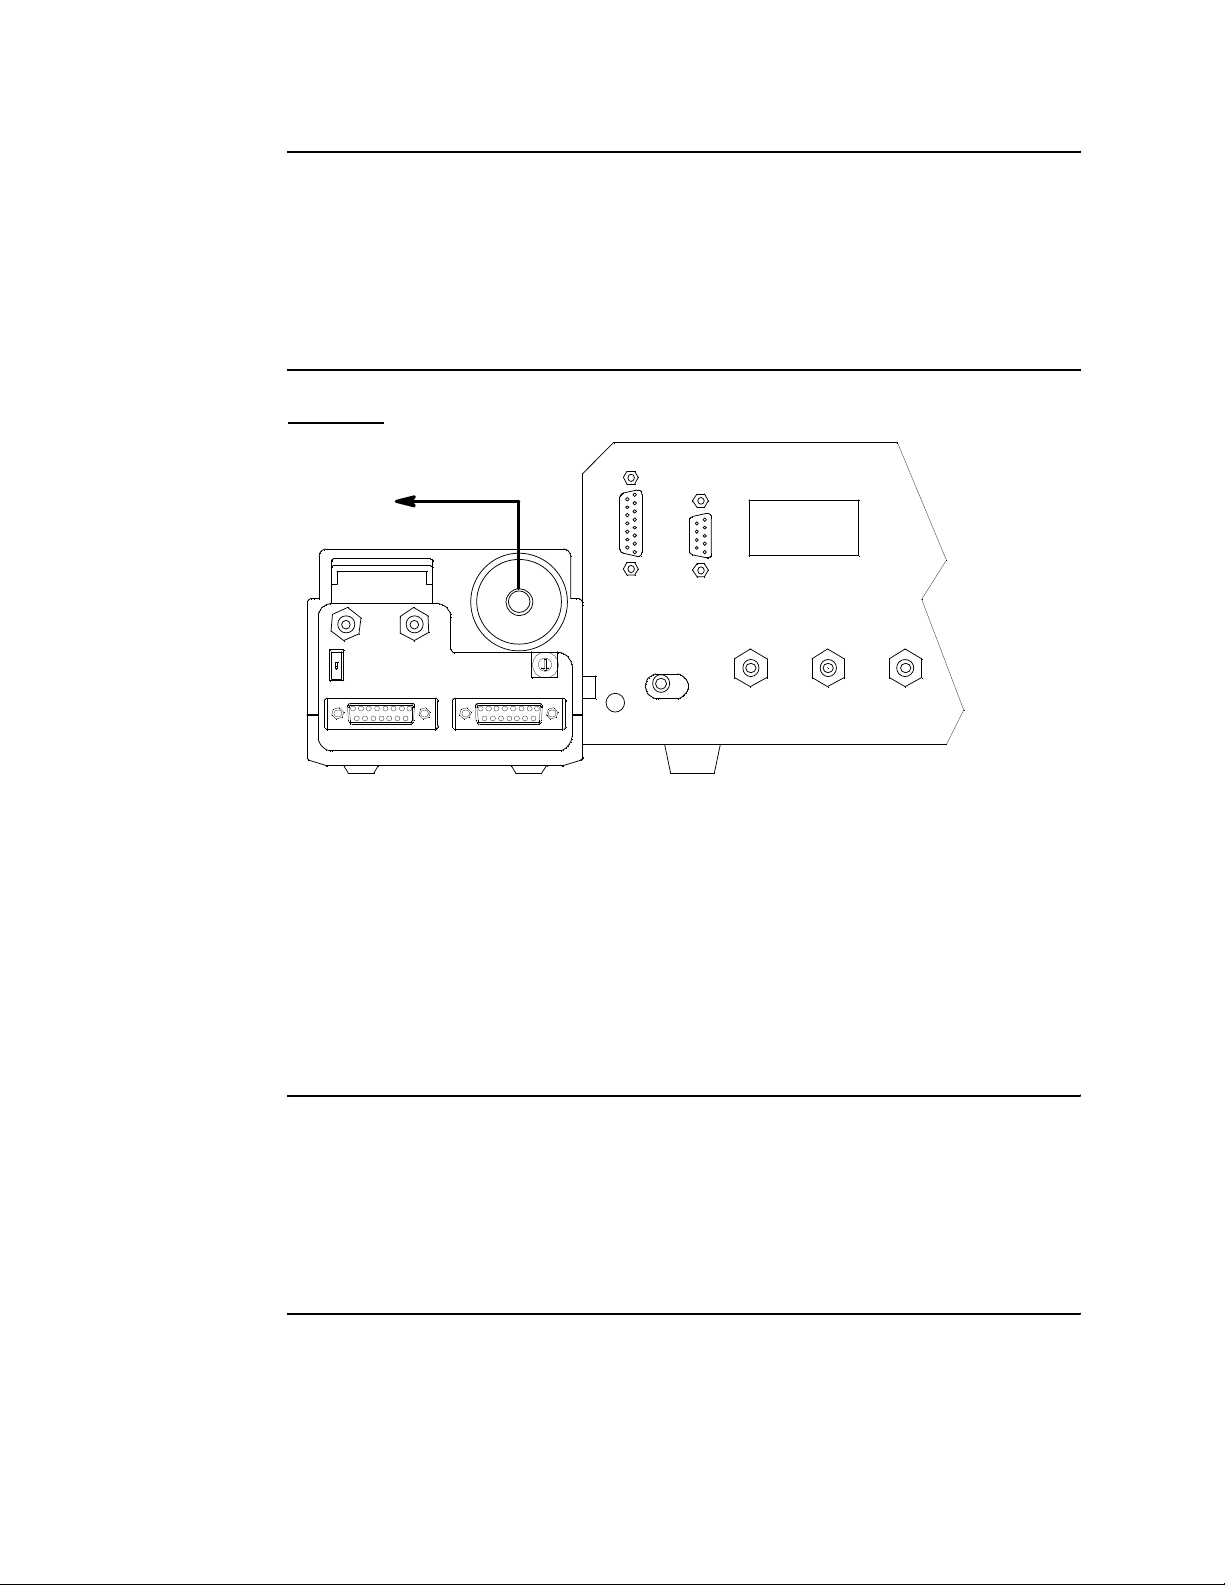
Calibration Gas
Fittin gs
Exhaust
Fittin g
ID Switch
erminat or Switch
Connector for
Connector for
Cable From
Ot her Docki ng
Module
Cable From
Data Cal 2000
or Other
Docking Modul
Figure 6: Back of DM-2009 Docking Module
Two DB-15 connectors on the back of each module allow connection to
other docking modules or directly to the docking sta tion.
T wo hose barb fittings tha t accept 3/16” ID tubing are loca ted in the upper
left corner of the back of each module and are each labeled CAL. GAS.
They allow sample gas connection t o the module and from t he module to
another module. The right fitting (as viewed from the back) is for
connection to the GAS OUT fitting on the docking station or to the left
fitting of the previous module in the system. The left fitting is for
connection to the next docking module in the system or, if the docking
Description • 8
Page 14

module is the last one in the flow system, it is plugged with a push-on
plug that is supplied with the docking station.
A two port exhaust routing fit ting is located in the upper r ight corner of t he
back of the DM-2001 and DM-2003 modules. It allows routing of the
exhausted calibration gas from all DM-2001 or DM-2003 modules t o the
last module so the exhaust gas can be safely routed to a convenient
exhaust location. The DM-2009 module has only one exhaust fitting.
Exhaust from the DM-2009 may only be routed to an exhaust location
and cannot be routed to another module.
NOTE: Even though the exhaust gas can be routed to an area
to be safely dispersed, the docking station should still be
installed in a well ventilated area.
All three types of modules also includ e a 10-positi on rot ary switch, the ID
switch, above the right DB-15 connector, and a 2-position slide switch,
the terminator switch, above the lef t DB-15 connector. The ID switch set s
the ID number of a module from 0 - 9, for a maximum of 10 module IDs.
The terminator switch is set to the down position if the module is the last
module in the system and to the up position for any other module.
9 • Description
Page 15
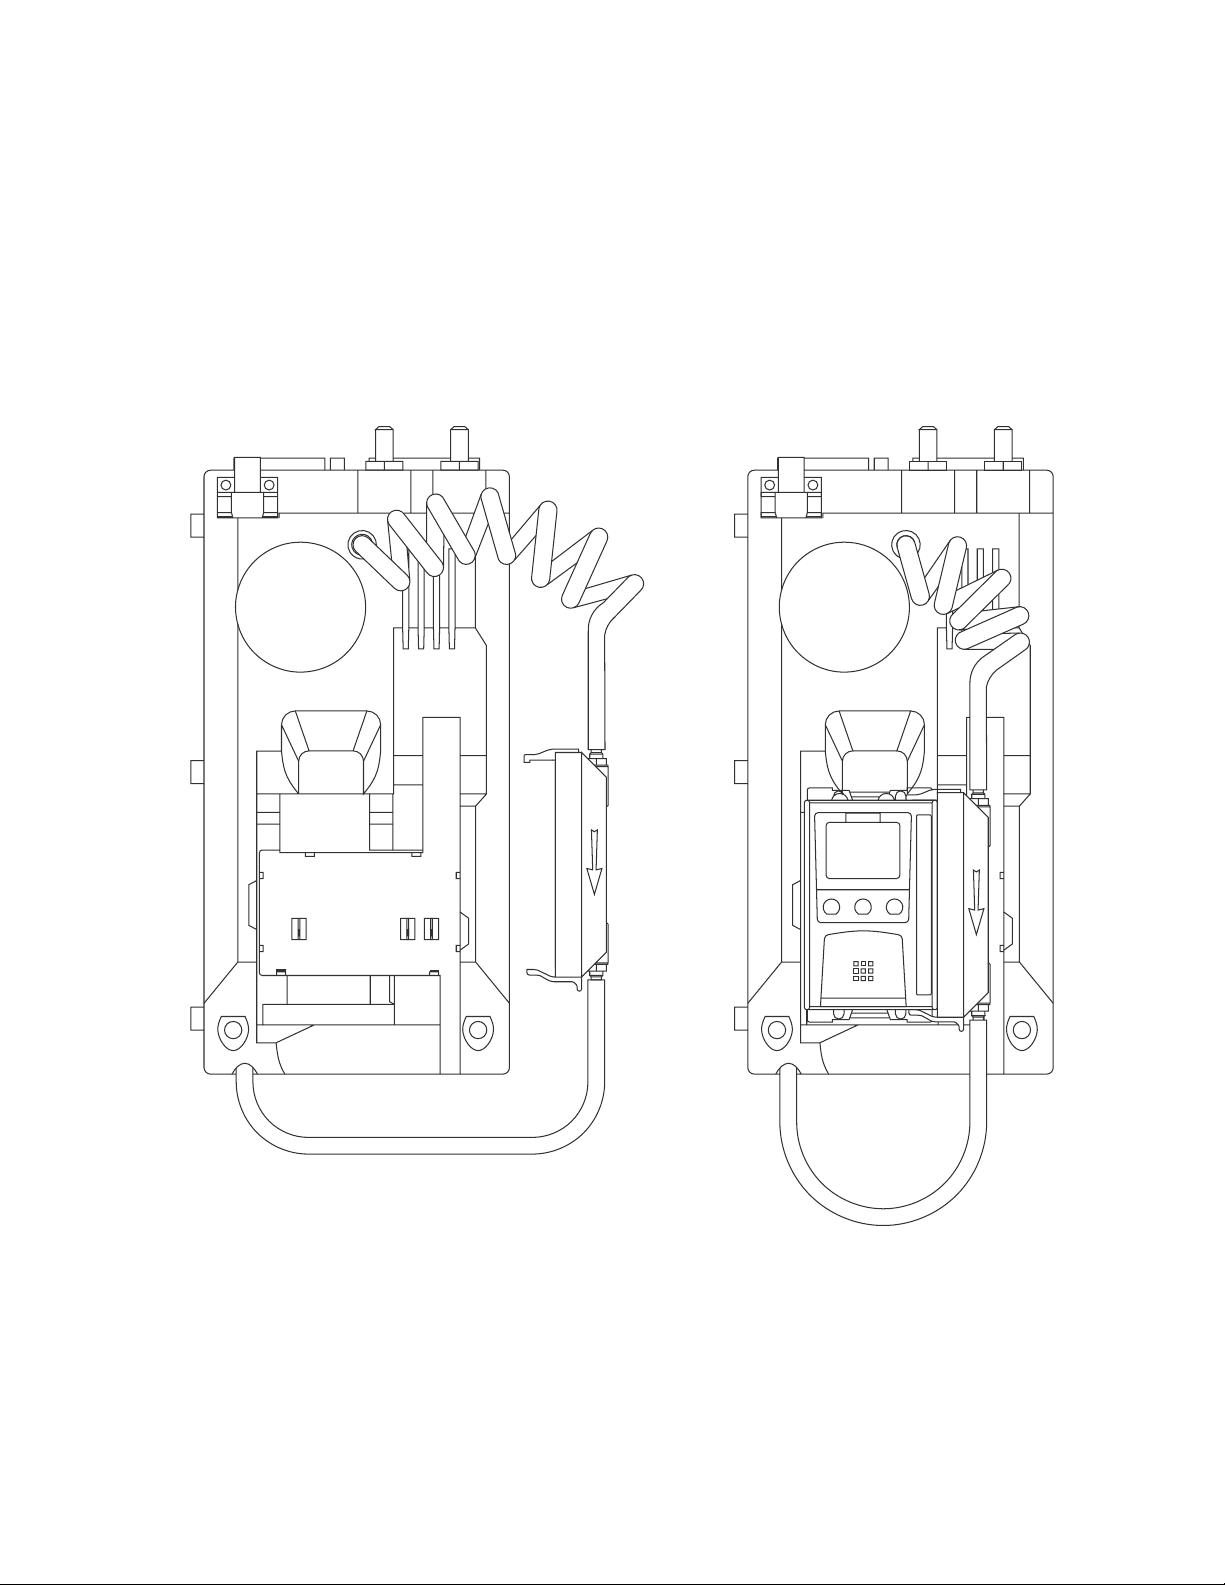
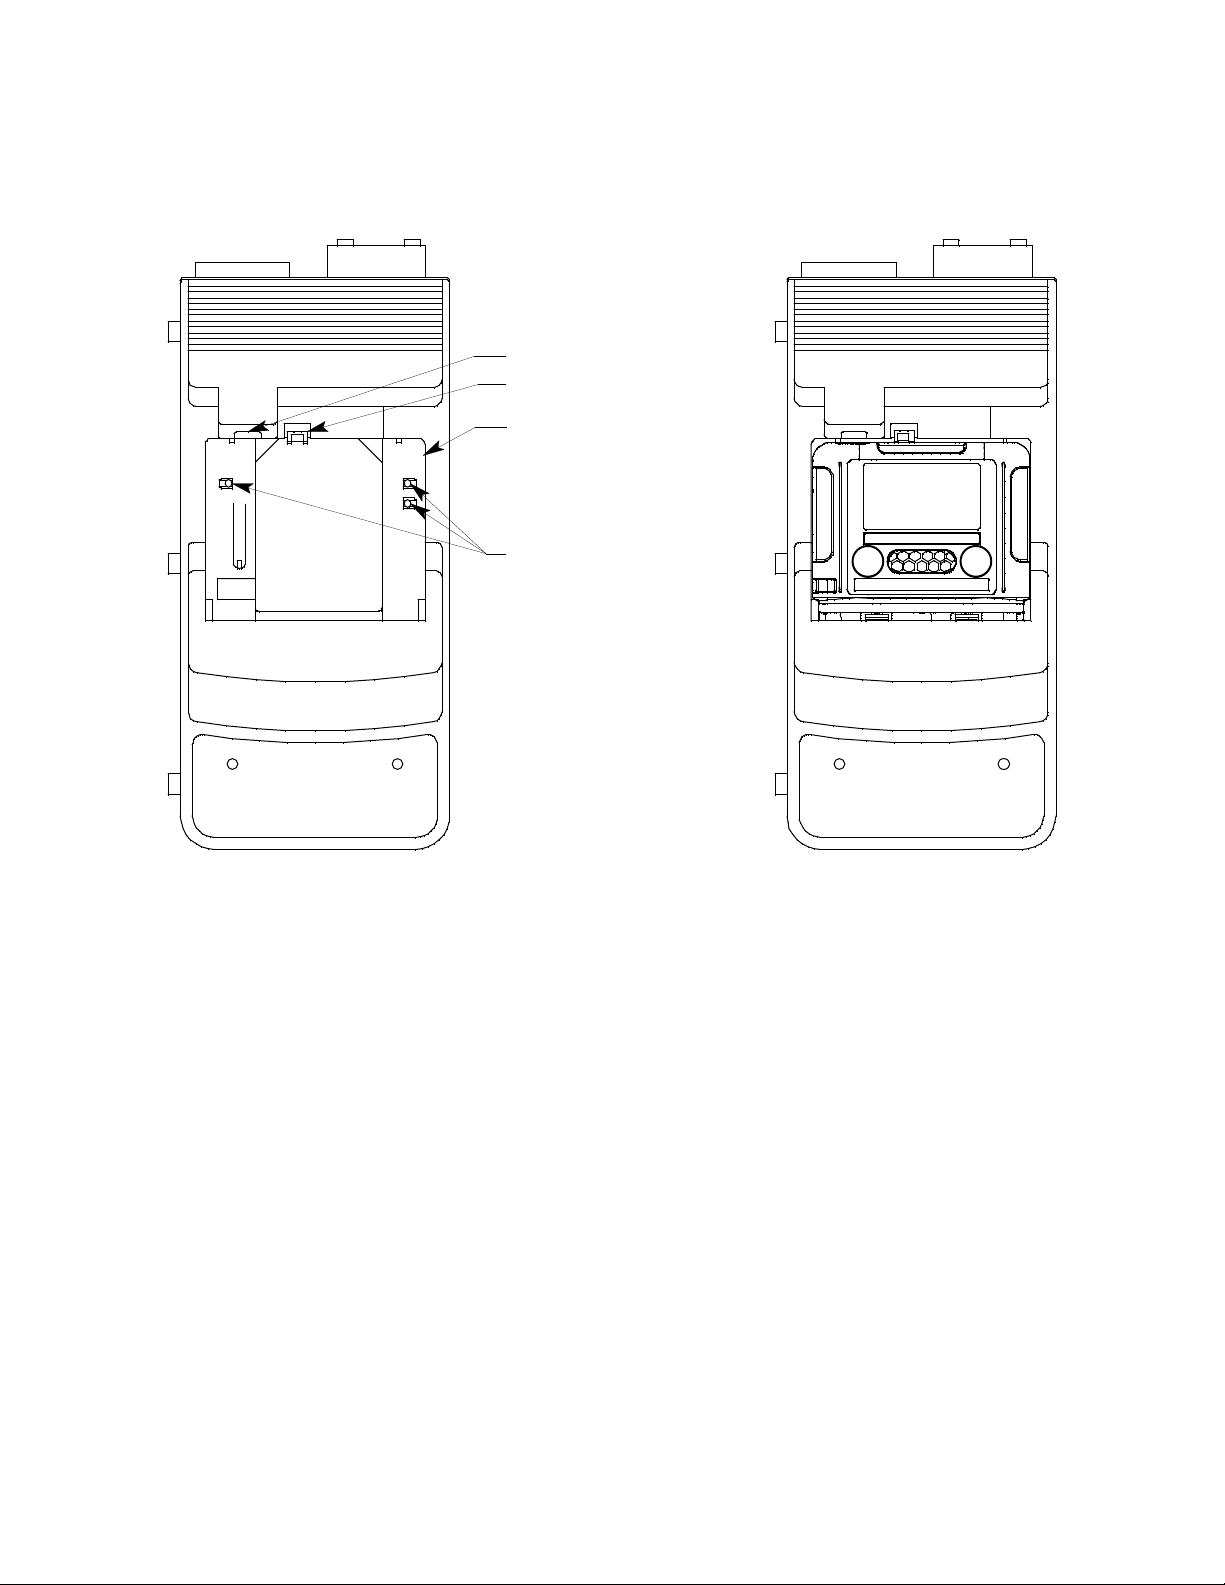
DM-2001 Docking Module
The GX-2001 fits into the DM-2001 module as shown in Figure 7 below.
The module includes a snap-on sample adapter for the GX-2001. The
exhaust port of the adapter is connected to a port on the front left of the
module by a short tube and the adapter’s inlet port is connected to a port
on the top rear of th e module by a coiled t ube. The sample adapte r snaps
onto the sensor side of the GX-2001 before the GX-2001 is installed into
the module.
DM-2001 DM-2001
Figure 7: DM-2001 Docking Module
H
HC
CO
O
2
2
S
Description • 1 0
Page 16
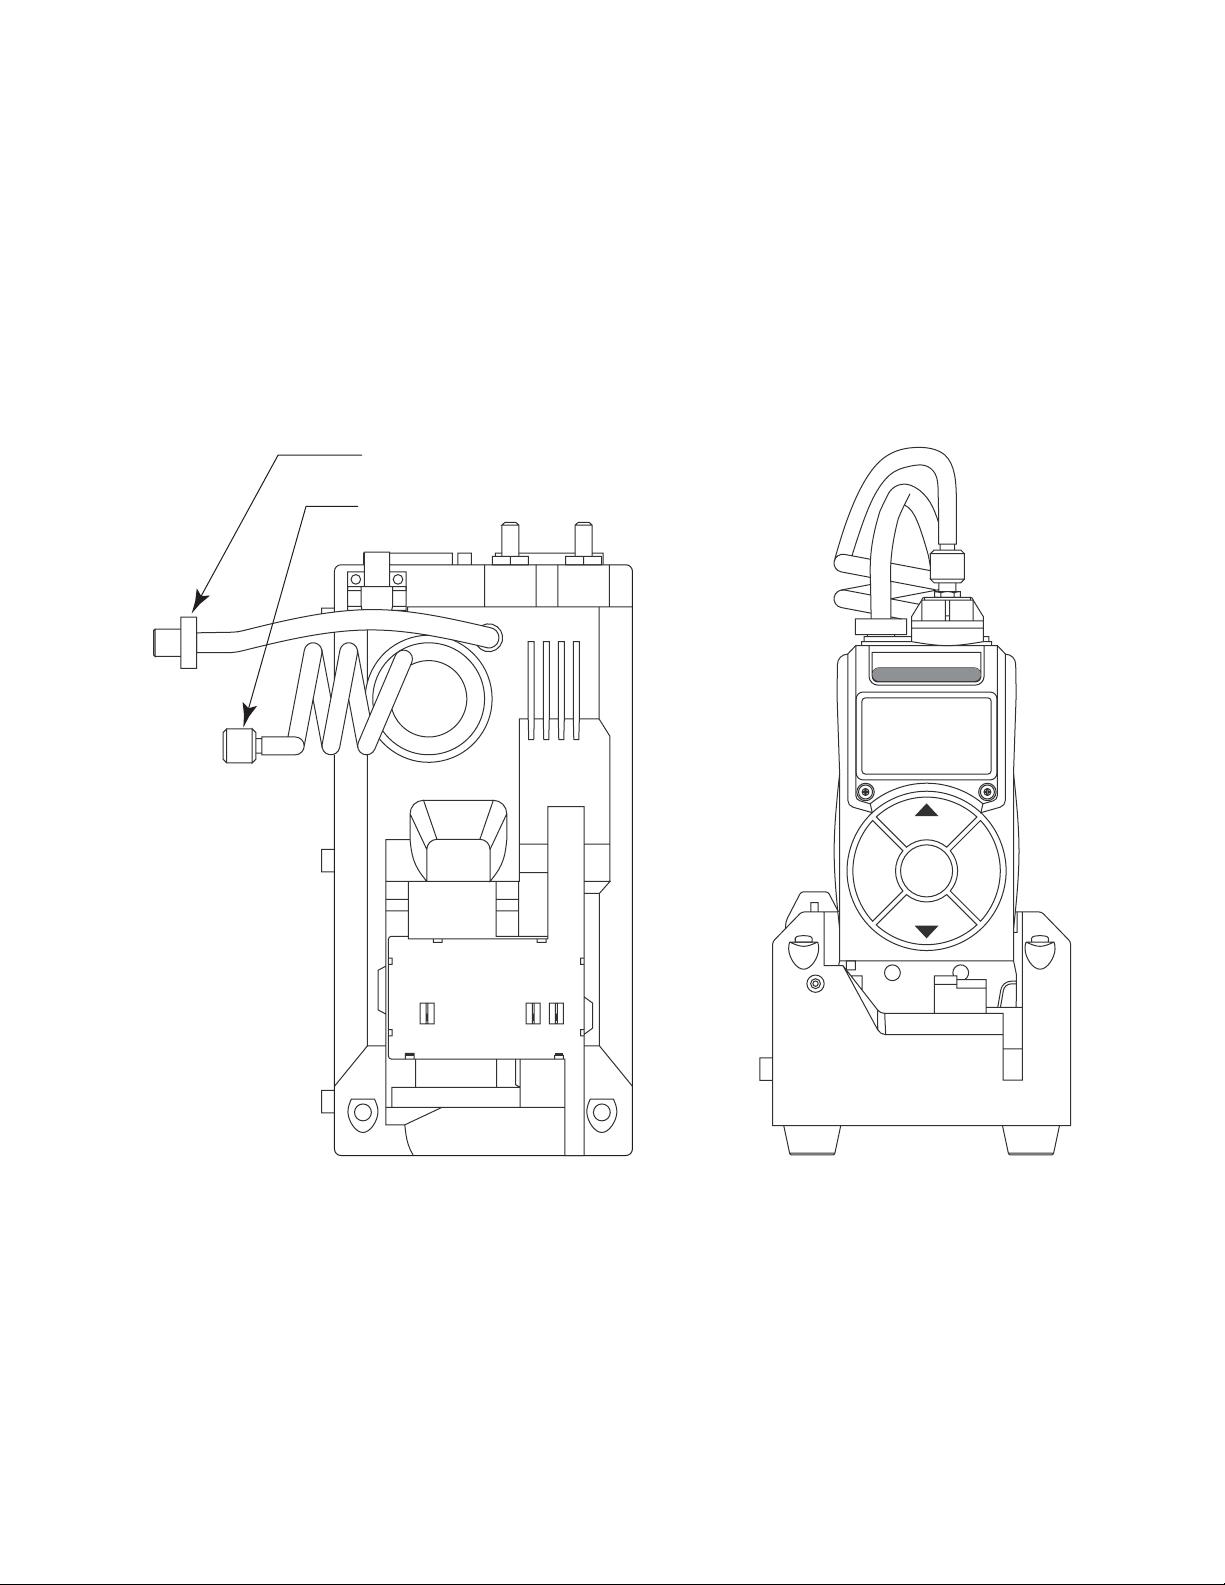
DM-2003 Docking Module
Front Vie wTop View
To GX-2003 Exhaust Fitting
The GX-2003 fits into the module as shown in Figure 8 below. A coiled
black tube with a plastic push -on fit tin g resides in a recess in the lef t rea r
corner of the top of the module. The coiled tube routes gas to the
GX-2003 and extends to connect to the GX-2003’s inlet fitting. A straight
green tube comes out of the top of the module to the right of the coiled
tube and also has a plastic push-on fitting on its end. The fitting on this
tube is pushed onto the GX-2003 exhaust fitting and routes gas away
from the GX-2003.
To GX-2003 Inlet Fitting
Figure 8: DM-2003 Docking Module
DISPLAY
(ADJ)
AIR
RESET
SILENCE
(SHIFT)
DM-2003
11 • Description
Page 17
DM-2009 Docking Module
The GX-2009 fits into the module as shown in Figure 9 below.
IR Port
Instrument Retaining
Tab
Instrument Cradle
Charging Contacts
CAL.
DM-2009 DM-2009
POWER
CHAR GE
CAL.
POWER
CHARGE
Figure 9: DM-2009 Docking Module
Communication Cables
The number of communication cables needed depends on how many
docking modules are used. Every system has at least two cable s, an RS232C cable with a DB-9 receptacle on each end (docking st ation cable
supplied with docking station) to connect the docking station to a
computer and an RS-485 cable with a DB-15 plug on each end (docking
module cable supplied with docking module) to connect the docking
station to the first docking module. For every additional docking module,
an additional RS-485 cable is needed to co nnect the additional module to
the previous module.
Description • 1 2
Page 18

Power Cord
A three-pronged AC power cord is provided wit h t he Dat a Cal 2000. O ne
end connects to a standard AC wall outlet and the other end plugs into
the AC power socket on the back of the docking station.
4-Gas Mix Calibration Cylinder
The Data Cal 2000 may be ordered with or without calibratio n gas and a
demand flow regulator. The standard configuration of the Data Cal 2000
includes a demand flow regulator and one 58 liter 4-gas mix calibration
cylinder which typically cont ains 50% LEL CH
CO/25 ppm H
example if you need a % volume CH
S. If another cylinder is required for your system, for
2
cylinder for a 5-sensor G X-2003, it
4
will have to be ordered separately along with an additional demand flow
regulator.
/12.0% oxygen/50 ppm
4
Demand Flow Regulator & 3 ft. Tube
The standard configuration of the Data Cal 2000 includes one demand
flow regulator with 3 feet of flexible polyurethane tubing. The demand
flow regulator screws onto a calibration cylinder and the tube is used to
connect the regulator to the appr opriate calibration gas f itting on the back
of the docking station. When the regulator senses a vacuum at its fitting,
it allows the gas from the cylinder to flow.
10 Foot Exhaust Tube
The Data Cal 2000 comes with a 10 foot 5/16” I.D. exhaust tube. This
exhaust tube is intended to be used as the collective exhaust for any
connected DM-2001s and DM-2003s. Any connected DM-2009s require
their own dedicated exhaust. Another 10 foot 5/16” I.D. tube is
recommended for each connected DM-2009. This extra tubing is not
included in the Data Cal 2000 kit or in the DM-2009 but can be
purchased from RKI Instruments, Inc.
Data Cal 2000 Hardware Setup
There are two parts to preparing the Data Cal 2000 Docking Station for
use: hardware setup and software setup.This section describes
hardware setup. The hardware setup consists of setting the docking
module configuration switches, simple mechanical assembly, cable
installation, and tubing installation.
13 • Data Cal 2000 Hardware Setup
Page 19
Setting the Docking Module Configuration Switch es
The docking module configuration swi tches determine module ID and the
order in which the modules are physically installed. B efore using the Data
Cal 2000, you will need to set the configuration switches as described
below. If you are adding a module or modules to a syst em that is a lready
setup, make sure the system is setup as described below after the new
module or modules are added.
ID Switch
The ID switch is located above the right DB-15 connector on the back of
the docking module. It is a 10 position rot ary switch with settings from 0
to 9. A Data Cal 2000 may have up to 10 docking modules. Each module
in the system must have a unique ID for the system to work properly.
When you receive a Data Cal 2000, set the ID setting f or each modu le in
the system so that no two modules have the same ID. The IDs should be
set sequentially to make it easy to keep track of the IDs. For example, if
you have 5 modules in a system, the IDs should be set to 0, 1, 2, 3, & 4.
Although the system will still operate properly if ID numbers are skipped,
for example using IDs 0, 3, 4, 6, & 8, setting them sequentially makes it
easier to keep track of t he module IDs an d spot du plicate I D sett ings. I f it
is necessary to change the ID on a module, use a small flat blade
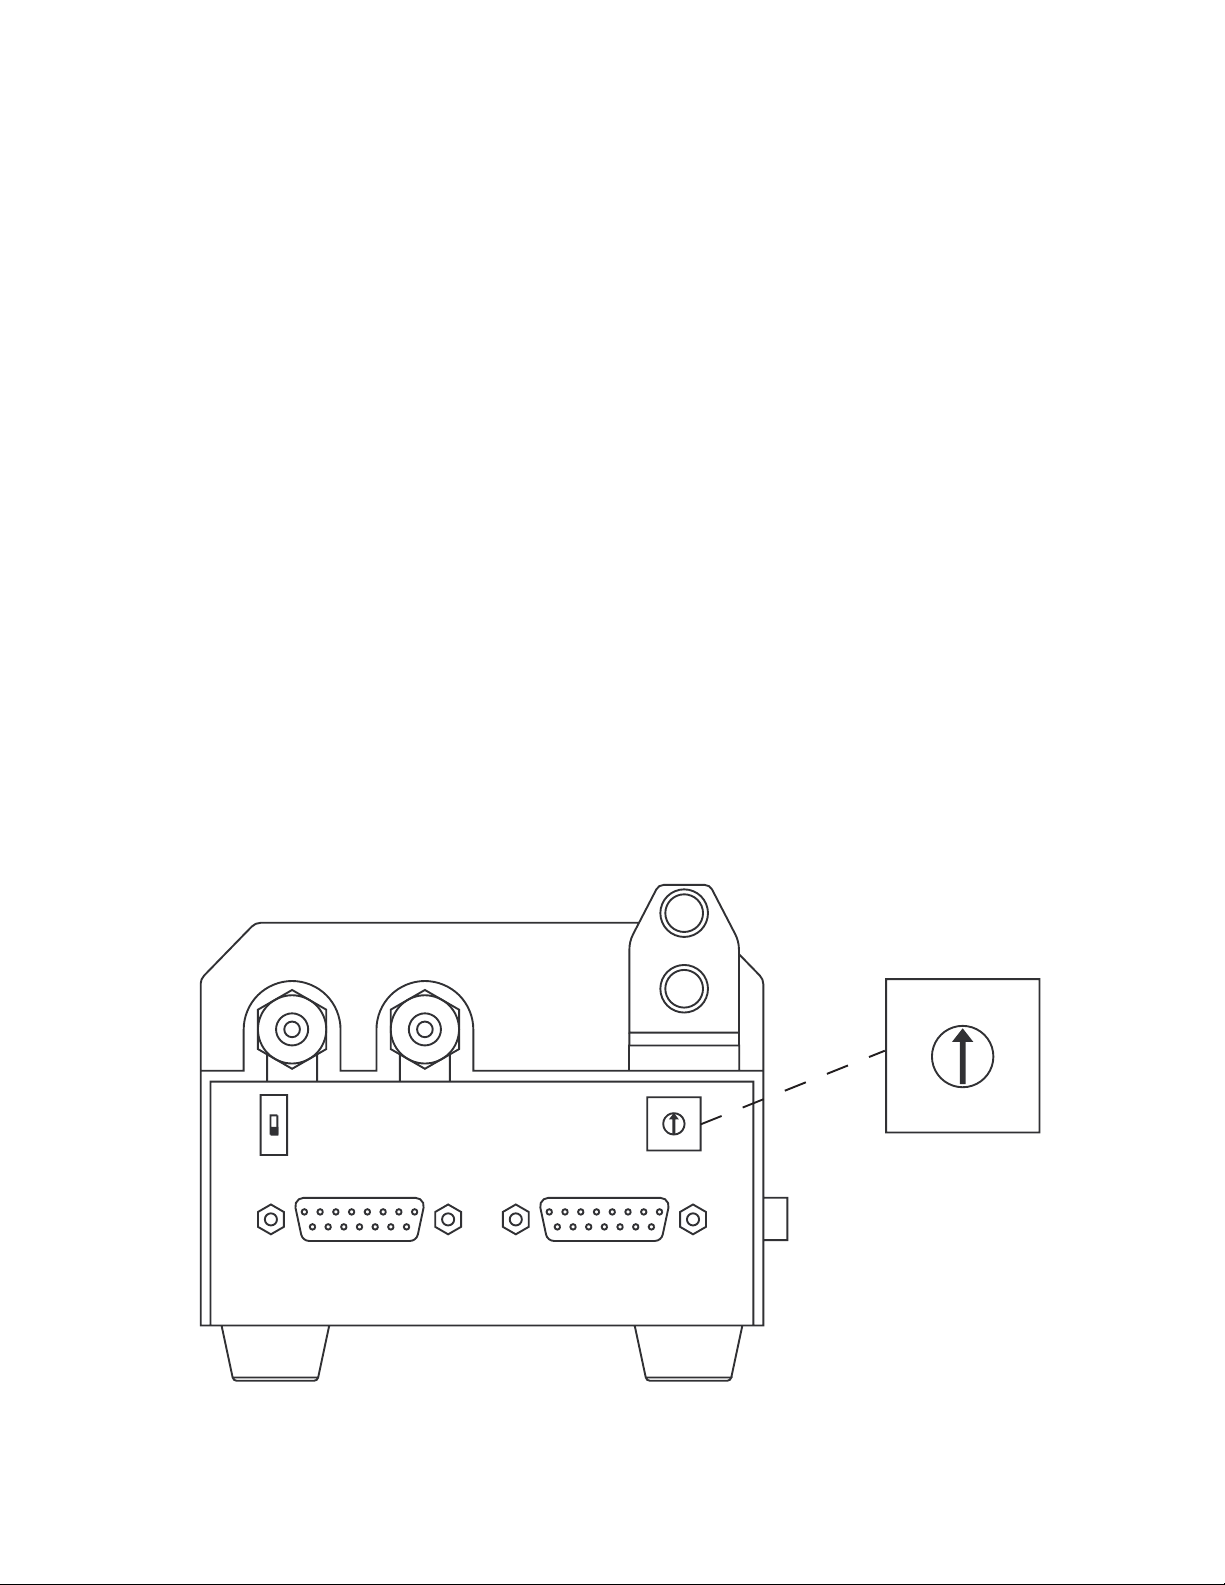
screwdriver to adjust the switch to the desired setting. A small arrow in
the middle of the switch points to the current ID setting.
Figure 10: ID Switch Setting
Data Cal 2000 Hardware Setup • 14
0
19
28
37
46
5
Page 20
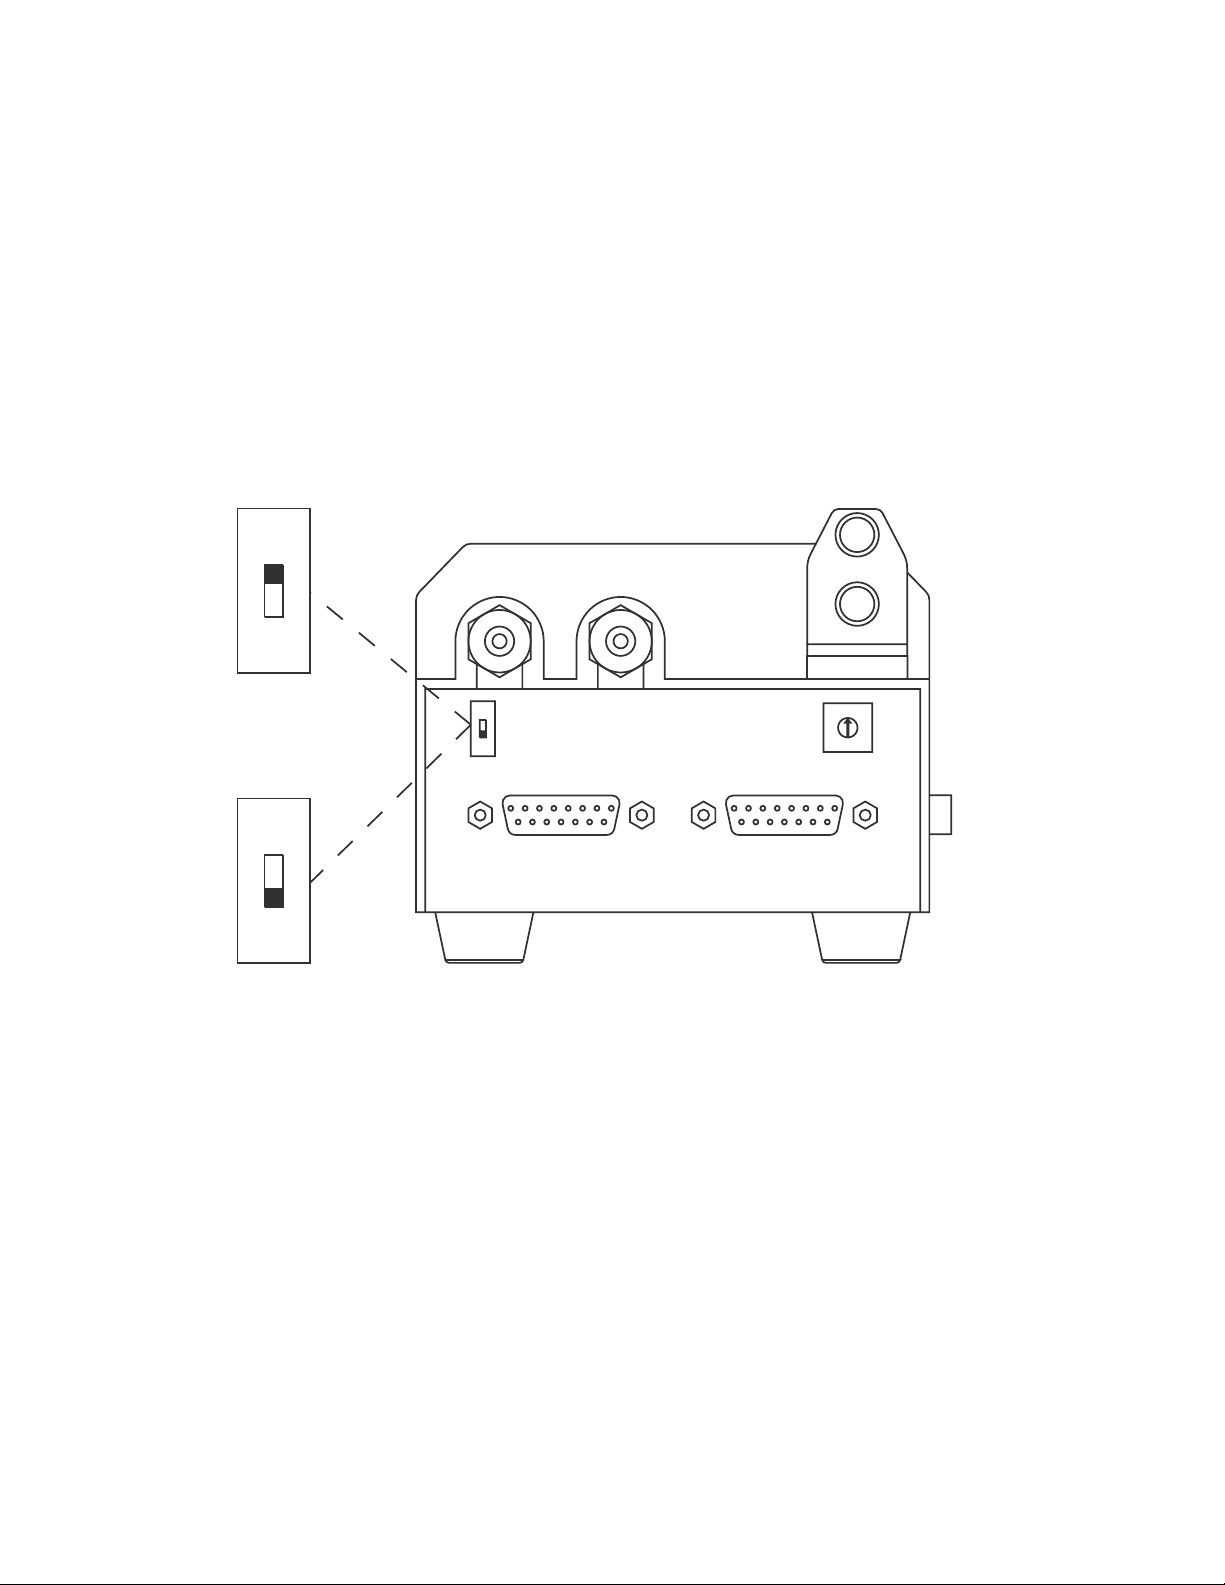
Termination Switch
Set switch to UP position if module IS NOT the last one.
Set switch to DOWN position if module IS the last one.
The termination switch is located above the left DB-15 connector on the
back of the docking module. It is a two position slide switch. The switch
position indicates whether the modu le is physically the last module in t he
installation or not. When the Data Cal 2000 is viewed from the front, the
last module in the installation is the module on the far right and it must
have the termination switch set to the down position for the Data Cal
2000 to operate properly. All other modules in the system must have the
switch set to the up position. If only one module is used in a system, that
module must have the termination switch set to the down position.
Figure 11: Termination Switch Setting
Mechanical Assembly
The Data Cal 2000 is designed for table top use. Perfor m the following
steps to assemble the docking station and docking modules.
1. Find a location that is well ventilated and near a window so that the
exhaust can be routed out of the window.
2. Find a table or other flat surface that is large enough to
accommodate the docking station and the number of modules in
your system.
15 • Data Cal 2000 Hardware Setup
Page 21

3. Place the docking station on the flat surface with enough room to
the right of the docking station (whe n viewed from the fro nt) to fit all
of the docking modules side by side.
4. Place the first docking module to the right of the docking station
and line up the three tabs on the left side of the module with the
three recesses on the right side of the docking station.
5. Push the module toward the docking station so the tabs mate with
the recesses and the module is flush against the docking station. If
only one module is used in your system, then mechanical assembly
is done. If more modules are used in your system, continue with
step 6.
6. Place the next docking module to the right of the installed docking
module and line up the three tabs on the lef t side of the module with
the three recesses on the right side of the installed module.
7. Push the new module toward the installed module so the t abs mate
with the recesses and the new m odul e is fl ush against the installed
module.
8. Repeat steps 6 & 7 for each additional docking module.
CAUTION: Make sure that the last module in the system, the
one on the far right, has the t erminator switch se t to
the down position. If the last module does no t have
the terminator switch set to the down position, the
Data Cal 2000 will not operate properly.
Cable Installation
1. Install the RS-232C cable from the PC connector on the back of the
docking station to the serial port on a computer.
2. Plug the power cord into the power socket on the back of the
docking station. Do not connect the cord to an AC outlet at this
time.
3. Install a RS-485 cable from the MODULE connector on t he back of
the docking station to t he right ( when viewed f rom the b ack) DB- 15
connector on the back of the first module. If only one module is
Data Cal 2000 Hardware Setup • 16
Page 22
used in your system, cable installatio n is done. If more modules are
used in you system, continue with step 4.
4. Install a RS-485 cable between each adjacent module from the left
connector of one module to the right co nnector of t he next modul e.
The module on the end will not have anything connect ed to the left
connector.
Tubing Installation
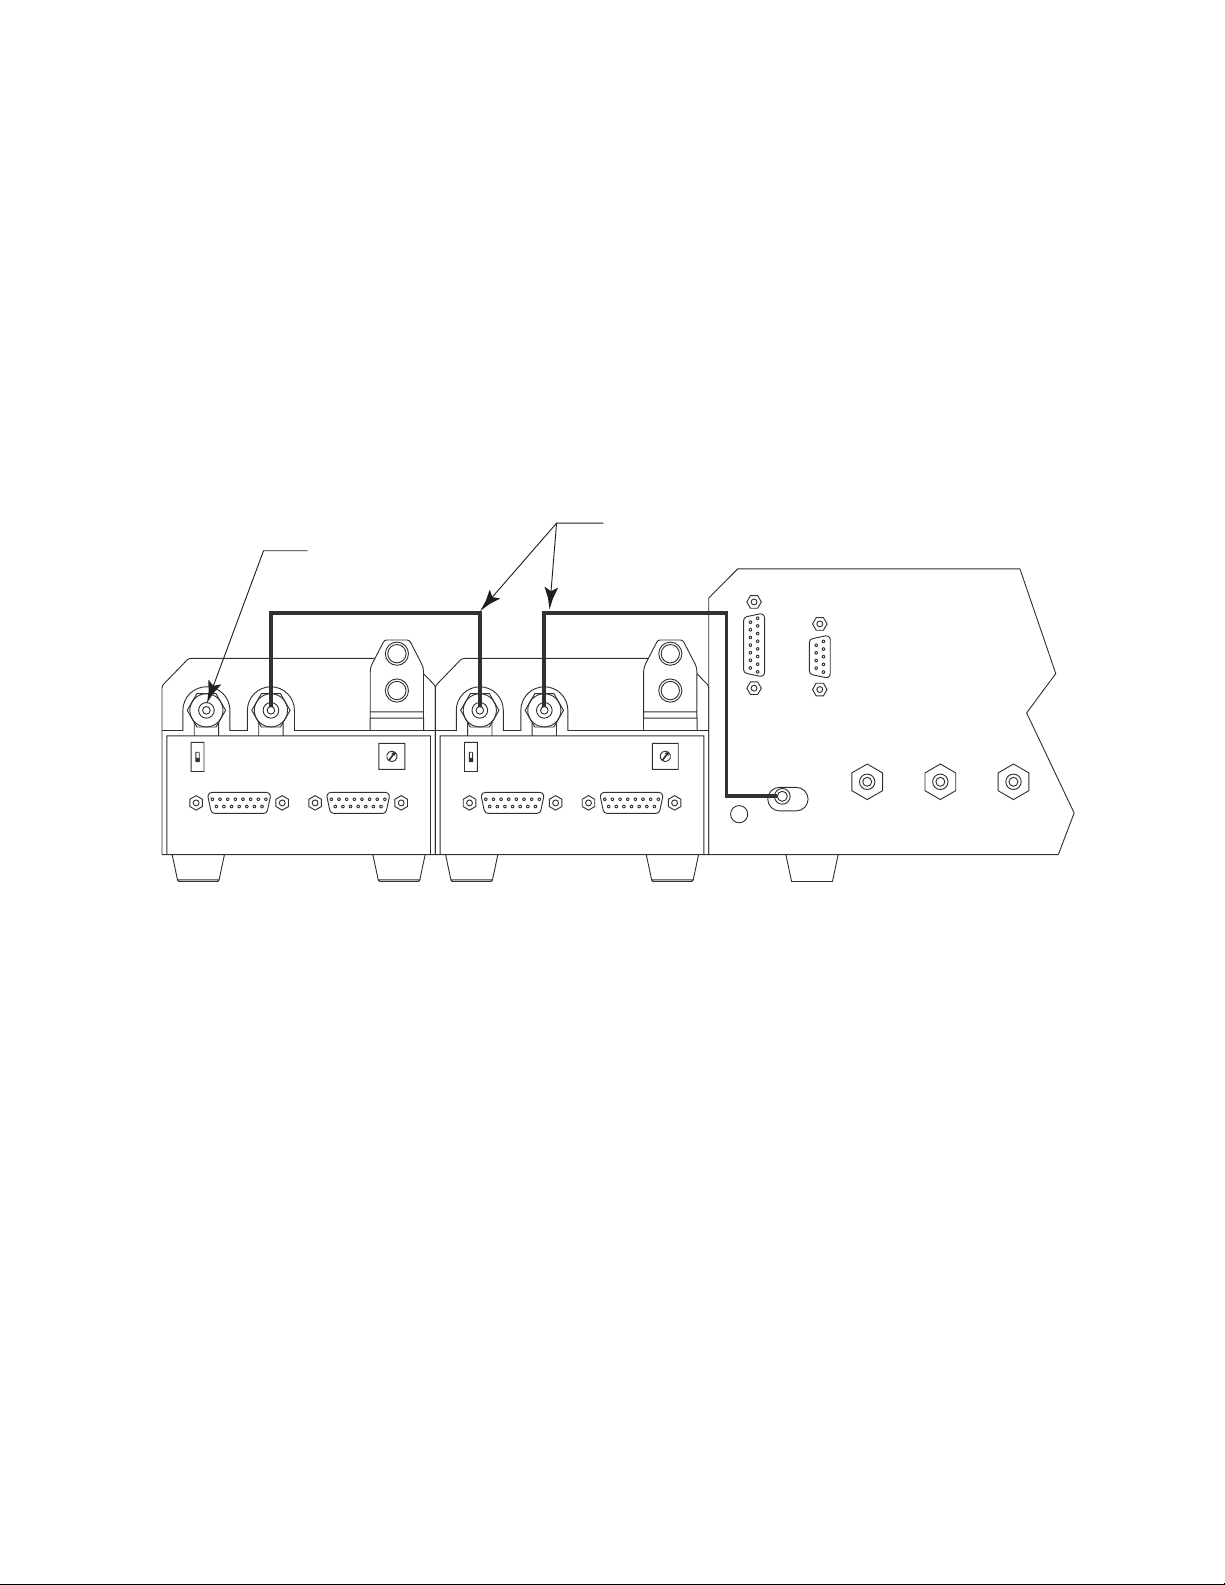
Module CAL. GAS Fitting Connections
Tubing
Install plug on last
CAL. GAS fitting.
MODULE
PC(RS-232C)
AIR GAS1 GAS2
GAS OUT
Figure 12: Calibration Gas Fitting Connections
1. Install a black tube (supplied with the docking station) between the
GAS OUT fitting on the back of the docking station and the right
(when viewed from the back of the module) CAL. GAS fitting on the
first docking module in the system, the one next to the docking
station.
If only one module is to be installed in the system, install the black
fitting plug that is supplied with the system to the left CAL. GAS
fitting of the module. If more modules are used in your system,
continue with step 2.
2. Install a black tube (supplied with the docking module) between t he
left CAL. GAS fitting of the first module and the right CAL. GAS
fitting of the next module in the system.
17 • Data Cal 2000 Hardware Setup
Page 23
3. Repeat step 2 for each successive module in the system until you
Install plug over fitting.
w
get to the last module.
4. Install the black fitting plug on the left CAL. GAS f i tting of the last
module in the system.
Module Exhaust Fitting Connections
GX-2001 and/or GX-2003
Tubing,
Route to open area
here calibration gas
can be exhausted.
User Supplied
Tubing,Supplied with System
MODULE
PC(RS-232C)
AIR GAS1 GAS2
GAS OUT
Figure 13: Exhaust Fitting Connections
1. Install a clear fitting plug, supplied with the system, on the bottom
port of the exhaust fitting of the first module in the system.
2. Install a clear tube, supplied with the system, between the top
exhaust fitting port on the first module and the bottom exhaust
fitting port on the next module.
3. Repeat step 2 for each successive module in the system until you
get to the last module.
4. On the last module in the system, install the 5/16” ID flexible tube
that is included with the Docking Station on the top exhaust fitting
port and route the tube to a n ar ea whe re the calibrat ion gas can be
safely exhausted.
Data Cal 2000 Hardware Setup • 18
Page 24
CAUTION: The maximum recommended length for the
exhaust tube is 10 feet. Do not use more than 10
feet of tubing for the exha ust tube or bump test and
calibration accuracy will be adversely affected. The
tube that is shipped with the Docking Station is 10
feet long.
GX-2009
MODULE
PPC (RS-232C)
AIR GAS 1 GAS 2
GAS OUT
Route to open area
where calibration gas
can be exhaus ted.
Tubing, User Supplied
Figure 14: Exhaust Fitting Connections
The DM-2009 only has one exhaust fitting instead of two like the
DM-2001 and DM-2003. Each DM-2009 in a Data Cal 2000 system
must have a dedicated exhaust tube.
Install the 5/16” ID flexible tube that is included with the DM-2009
on the exhaust fitting port and route the tube to an area where the
calibration gas can be safely exhausted.
CAUTION: The maximum recommended length for the
exhaust tube is 10 feet. Do not use more than 10
feet of tubing for the exha ust tube or bump test and
calibration accuracy will be adversely affected. The
tube that is shipped with the Docking Station is 10
feet long.
19 • Data Cal 2000 Hardware Setup
Page 25
Docking Station Calibration Gas Fitting Connections
The calibration gas fittings on the back panel of the docking station are
designed to be used with calibration gas cylinders that are fitted with
demand flow regulators. The AIR fitting may be used with a demand flow
regulator and a cylinder of zero emissions air, but this is not normally
necessary since the docking station will generally be in a fresh air area.
The types of calibration gas cylinders used depend on the gas sensors
installed in the GX-2001’s, GX-2003’s, and GX-2009’s being connected
to the docking station. Typically a 4-gas mix will be used if all or most
instruments being connected to the system are 4-gas units. If any
GX-2003’s that a re 5-sen sor unit s a re bei ng connected, a %vo lume CH4
cylinder will also be needed. Use Table 2 below as a guide in determining
which and how many calibration gas cylinders are appropriate for your
system.
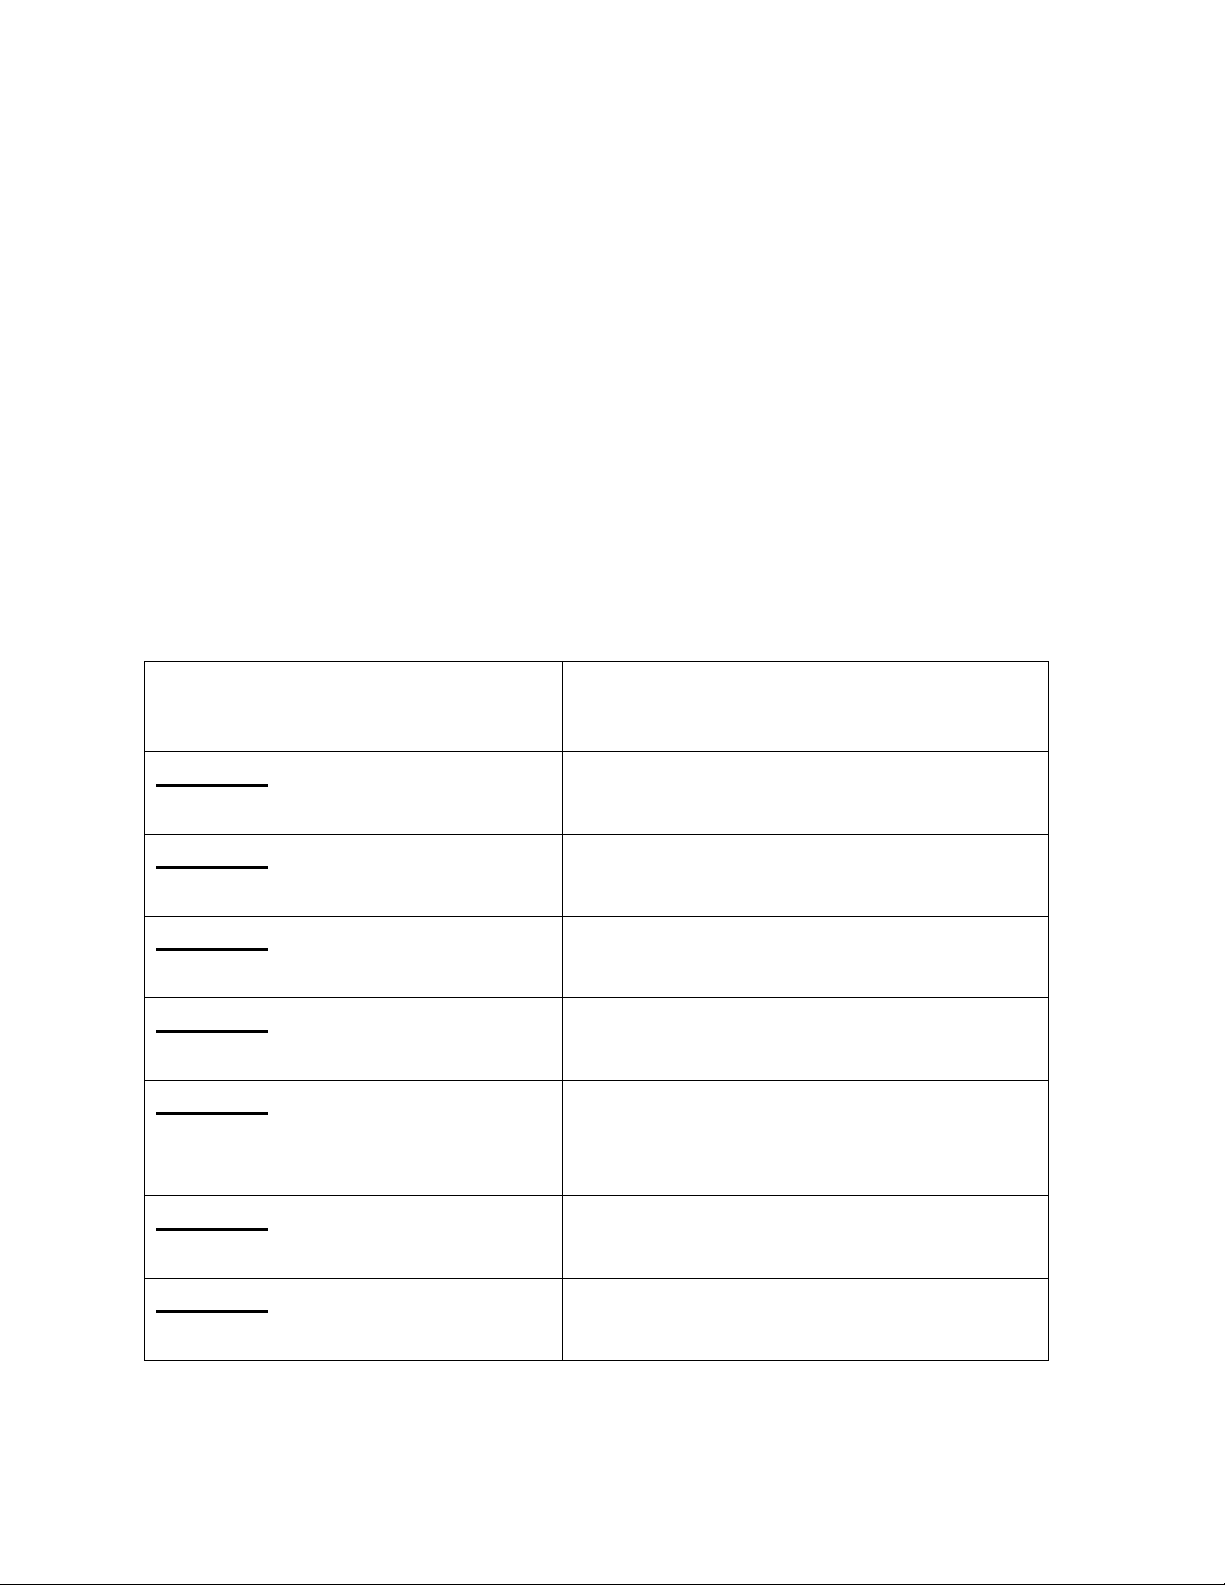
Table 2: Recommended Gas Cylinders
Typical Instrument Types
GX-2001
LEL/Oxy/H2S/CO
GX-2001
LEL/Oxy/CO
GX-2001
LEL/Oxy/H2S
GX-2003
LEL/Oxy/H2S/CO
GX-2003
%V ol CH4/LEL CH4/Oxy/H2S/
CO
GX-2003
LEL/Oxy/CO
Recommended Calibration Gas
Cylinder(s)
4-gas mix with CH4/Oxy/H2S/CO
3-gas mix with CH4/Oxy/CO
4-gas mix with CH4/Oxy/H2S/CO
4-gas mix with CH4/Oxy/H2S/CO
• 4-gas mix with CH4/Oxy/H2S/CO
• %Volume CH4 in air
3-gas mix with CH4/Oxy/CO
GX-2003
LEL/Oxy/H2S
4-gas mix with CH4/Oxy/H2S/CO
Data Cal 2000 Hardware Setup • 20
Page 26
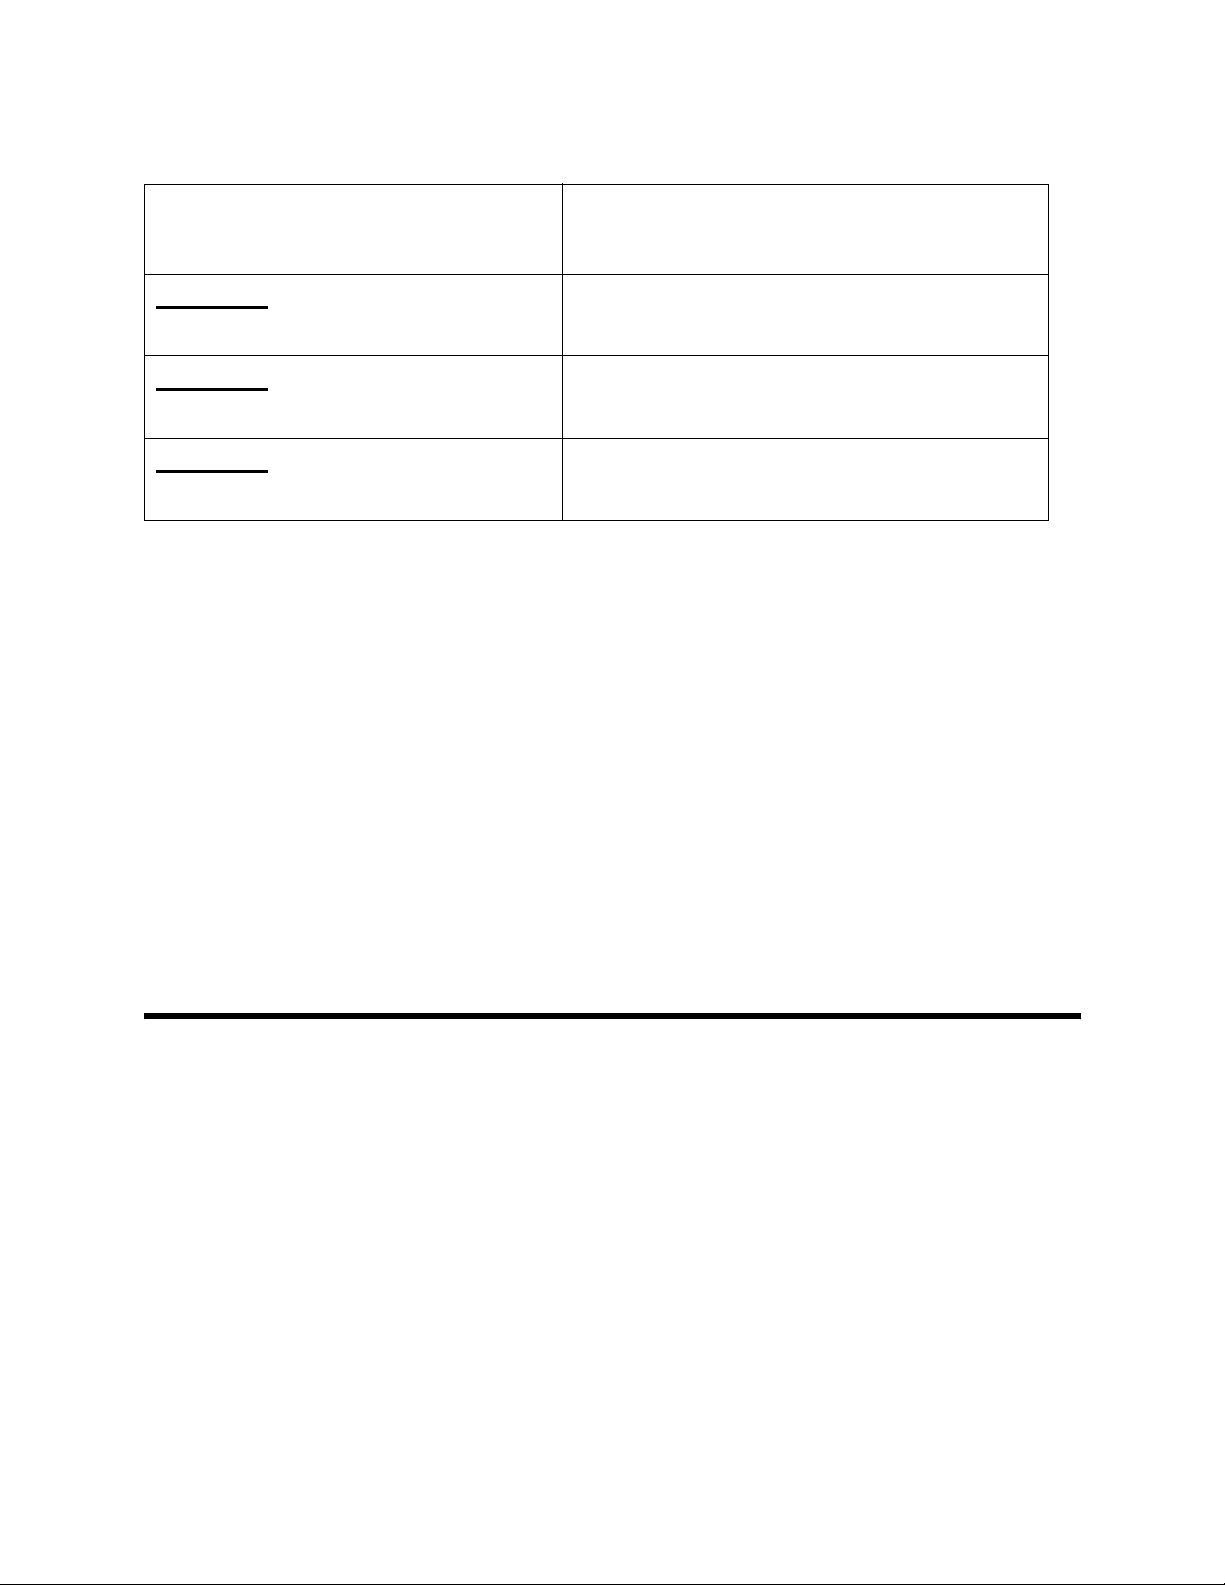
Table 2: Recommended Gas Cylinders
Typical Instrument Types
GX-2009
LEL/Oxy/H2S/CO
GX-2009
LEL/Oxy/CO
GX-2009
LEL/Oxy/H2S
1. If the area around the calibration station is not considered a fresh
air area, an area free of combustible and toxic gases and of normal
oxygen content, 20.9%, install a tube on the AIR fitting on the back
of the docking station and route it to a fresh air area or connect a
cylinder of zero air to the fitting using a demand flow regulator.
2. Install the demand flow regulator(s) on the calibration gas
cylinder(s).
Recommended Calibration Gas
Cylinder(s)
4-gas mix with CH4/Oxy/H2S/CO
3-gas mix with CH4/Oxy/CO
4-gas mix with CH4/Oxy/H2S/CO
3. Connect the demand flow regulator for each calibration gas
cylinder that will be used with th e docking st ation to the desired gas
port, GAS1, GAS2, GAS3, GAS4, or GAS5. These ports must be
defined in the docking station software during the software setup.
See “Setting Up the Solenoids” on page 36.
Installing the Data Cal 2000 Docking
Station Software
1. Launch Windows®.
2. Exit from all applications and open windows.
3. Insert the Data Cal 2000 Docking Station Software Installation CD
into your computer’s CD-ROM drive.
4. The Docking Station InstallShield Wizard comes up to guide you
through installation. Click Next to proceed to the License
Agreement window.
21 • Installing the Data Cal 2000 Docking Station Software
Page 27

5. Read the license agreement and click the agreement acceptance
selection box, then click Next to proceed to the Customer
Information window.
6. Enter a user name and organization, then click Next to proceed to
the Destination Folder window.
7. The default installation folder (C:\ Program Files\Docking S tation\) is
displayed. If you want to install the software in the default folder
continue with step 8. If you want t o install the software in a different
location, click Change and choose a new installation folder now
and then continue with step 8.
8. Click Next to proceed to the Ready to Insta ll the Program window.
9. Review the installation settings. I f t hey are acceptable, click Install
and the installation process will begin. If you want to change
installation settings, click Back and change them to the desired
settings.
10. During software installation, the installation program may find
newer versions of Windows files on your computer than those in
the Installation CD. If this happens, t he insta llation soft ware will ask
you if you want keep these newer files. Click Yes to do so.
11. Follow the on-screen instructions to complete software installation.
Installing the Data Cal 2000 Docking Station Software • 22
Page 28

Launching the Data Cal 2000 Software
1. Click Start on the Windows® Icon Tray, then select Programs/
Docking St ation. The Data Cal 2000 program is launched and the
docking station main program window appears.
Figure 15: Data Cal 2000 Main Window
NOTE: You can also start the sof tware by double clicki ng on the
Docking Station shortcut that the installation CD puts
on the Windows® Desktop or in the Start menu.
2. If you are starting the software for t he first ti me, a message win dow
appears informing you that a database has been cr eated. When
starting the software for the first time, or if you wish to change the
software setup, proceed to the next section, "Overview of the Data
23 • Launching the Data Cal 2000 Software
Page 29

Cal 2000 Software".
If you have already performed the software setup, proceed to
“Connecting Instruments to the Data Cal 2000” on page 38.
Overview of the Dat a Cal 2000 Software
This section provides a brief overview of the software and a description
of the main program windo w . Inst ructions for usi ng the sof tware are gi ven
in other part s of t his manual . Use this sect ion to become familiar with th e
main program window, but before attempting to use the software, make
sure to perform the software setup as described in “Setting Up the Data
Cal 2000 Software” on page 27.
The Data Cal Docking Station Software is designed to provide manual or
automated data downloading, bump testing, and calibration for the
GX-2001, GX-2003, and GX-2009. It also provides the capability to
update instrument paramet ers such as active channels and alarm point s.
The software compiles a database of the instruments that have been
connected to the Data Cal 2000 which consist s of calibration and bump
test history, logged dat a (if a unit’s data is downloaded), and memos that
record user entered information about an instrument at a particular time.
The GX-2001, the GX-2003, and the GX-2009 are gas monito ring
devices for combustible gas, O
, CO, and H2S. They store logged data
2
and calibration information in t heir internal memor ies. See the Operat or’s
Manual for each instrument for a complete description of each
instrument.
Data Cal 2000 Functions
The Data Cal 2000 softwar e has the following basic functions accessed
or controlled by buttons in the main program screen (see Figure 16):
• Solenoid setup accessed by the Solenoid control button
• Gas cylinder setup accessed by the Cylinders control button
• Software & system configuration accessed by the Config control
button (this function is pa ssword prot ected)
• Data viewing accessed by the Logs control button
• Instrument bump testing controlled by the Bump test button
Overview of the Data Cal 2000 Software • 24
Page 30

• Instrument calibration controlled by the Calibration button
Main Program Window
The main program window is where the current status of the software
operation is shown. Any docking modules and instruments that are
connected to it and any instruments tha t have been but are not currently
connected to it are also shown. The program’s various functions are
initiated or accessed from this screen. The current date and time are
always displayed in the lower right corner of the main window.
Figure 16: Parts of the Main Program Window
Control Buttons
The Solenoids, Cylinders, Config, Logs, and Exit control buttons are
located along the top left of the windo w. The Bump test and Calibration
control buttons are located in the lower right of the window along with a
Force Calibration selection box. The use of these control buttons and the
Force Calibration selection box is described in other parts of this manual.
25 • Overview of the Data Cal 2000 Software
Page 31

Docking Module/Instrument Display Area
The large middle portion of the main window displays docking modules
and instruments that are currently connected to the Data Cal 2000 and
instruments that are in the dat a base. The docking modules are iden tified
by a number that corresponds to the ID switch setting on the back of the
docking module. The instruments are identif ied by their serial number. By
selecting either the Icon selection cir cle or the Details selectio n circle, the
modules and instruments can be displayed either as icons or in a table
format that shows various instrument parameter details such as station
ID, user ID, the next scheduled bump test date, and the next scheduled
calibration date among others. If the Only Connected Units box is
checked, then only instruments that are currently connected to the Data
Cal 2000 will be shown.
Software Status
Three areas of the main window indicate the sof tware sta tus. The smaller
area in the lower left below t he docking module/instru ment display area is
the message window. It displays messages that indicate actions and
status of the software.
Below this area, the communications port that is being used by the
software is shown in the lower left corner. A round communication
indicator is located above the commun i cations port name.
To the right of the communications port indicator is the status field. It
displays the current status of the software. It can indicate that the
software is in standby mode or if it is downloading among other
indications.
Solenoid Indicators
To the right of the status field are 6 round solenoid indicators. They
correspond to the fittings on the back of the docking station. They
indicate whether the corresponding solenoid is activated so it can allow
gas to flow through the fitting it controls and also if the cyl inder connected
to it has expired. See “Adding and Updating Cylinders” on pa ge 33 for an
explanation of how to view and define a cylinder expiration date. The
color of the indicator defines the status as foll ows:
• Green indicates that the solenoid is activated and will allow gas to
flow through the corresponding fitting.
• Yellow indicates that the solenoid is not activated.
Overview of the Data Cal 2000 Software • 26
Page 32

• Orange indicates that the corresponding cylinder will expire in less
than 10 days. When the solenoid is activated, the indicator’s color
will change to green while it is activated and then return to orange
when the solenoid is deactivated.
• Red indicates that the corresponding cylinder’s expiration date has
passed. Although the software will allow use of the cylinder if it is
expired, it is recommended that the expired cylinder be changed as
soon as possible.
W ARNING: If an expired cylinder is used for calibration, the
accuracy of the calibration may be adversely
affected.
Setting Up the Data Cal 2000
Software
Once the software is installed, you must set up the software for your
system. Setting up the Data Cal 2000 software consists of the following
tasks:
• setting up the Dat a Cal 2000 para meter confi guration which includes
parameters such as the number of docking modules and their ID.
NOTE: Only the Parameter tab of the Configuration window is
discussed in this section. See “Configuration Window”
on page 77 for a description of the other tabs in the
Configuration window.
• defining which calibration gas cylinders will be required
• defining which solenoids will control which calibration gas cylinder
If docking modules are added or removed or if the calibration cylinders
being used are different from the defined cyl inders, the setup will have to
be updated.
27 • Setting Up the Data Cal 2000 Software
Page 33

Setting Up the Configuration
1. Launch the software as described in “Launching the Data Cal 2000
Software” on page 23.
NOTE: It is not necessary to turn on the Data Cal 2000 if you
are only performing configuration setup. With the Data
Cal 2000 off, the software will indicate communication
errors in the area below the docking module/instrument
display area. This is normal if the Data Cal 2000 is not
turned on.
2. From the main window, click on the Config button located along
the top of the window.
3. Enter the password and click OK. The default password is
“ABCDE” and is case sensitive. After clicking OK, the Configuration
Window is opened and the Parameter tab will be in the foreground.
Figure 17: Configuration Window
Setting Up the Data Cal 2000 Software • 28
Page 34

4. Select the communication port that will be used in the
Communication section. This is typically COM1 or COM2. Be sure
that the port that is selected is not already being used by some
other device.
5. Select the docking modules that are installed in the Docking
Module section. Ten selection boxes are displayed with the IDs 0
through 9. The IDs on the selection boxes correspond with the IDs
on the docking modules set by the ID switch (See “ID Switch” on
page 14). If modules with IDs 0, 1, and 2 are installed, then
selection boxes 0, 1, and 2 must be selected. If extra boxes are
selected or if the incorrect IDs are selected, communication errors
will result and the software will not work properly.
6. Select the cylinder and solenoid options in the Cylinder & Solenoid
section.
• If the SET Cylinder box is selected, t hen you will be able to ent er
the Solenoids and Cylinders windows b y clickin g the Solenoids
or Cylinders button from the main menu. While in these
windows you will be able to define which cylinders the solen oids
control, update defined cylinders, and add new cylinders. If the
SET Cylinder box is not selected, then the Solenoids and
Cylinders buttons in the main program window will not be
available to click.
• The Expiration Notice will define how many days before a
cylinder expiration date the software will indicate that a cylinder
is nearing the expiration date. It is adjustable from 1 to 180 days.
7. Select the instrument information options in the Instrument
Information section.
• If Change Parameter is selected, you will be able to change
various parameters in connected instruments such as the serial
number and enter memos. See “Edit Function” on page 74 and
“Edit Function, Memo Entry” on page 75.
• The Auto Power OFF Time defines when a connected
instrument will turned off by the Data Cal 2000 after the most
recent operation, such as an automatic download or a manual
bump test. It is defined in seconds with a maximum setting of
29 • Setting Up the Data Cal 2000 Software
Page 35

3600 seconds (1 hour).
8. Select the datalogging options in the Data Logger section.
• If Down Load Data Logger is selected, the software will
automatically download all data from an instrument when it is
connected to the Data Cal 2000 if it is due for download. The
Down Load interval value (see below) determines if an
instrument is due. If Down Load Data Logger and Clear After
Down Load are selected, then all logged data in a downloaded
instrument will be cleared after it is downloaded.
• The Down Load Interval defines how often a unit that is
connected to the Data Cal 2000 will be downloaded if Down
Load Data Logger is selected. If it is set to 0 days, instruments
will be downloaded every time they are connected to the Data
Cal 2000. It is adjustable from 0 to 60 days.
9. Select the bump test options in the Bump Test section.
• Selecting the Manual Bump Test selection box activates the
Bump test button in the main window and allows you to perform
a bump test manually.
• If the Auto Bump Test selection box is selected, the sof tware will
automatically check if a connected instrument is due for a bump
test (see the selection of the bump test interval below) and
perform a bump test if the instrument is due. If Auto Bump Test
is selected, make sure the appropriate calibration gas cylinders
are always connected to the appropriate fittings on the back of
the docking statio n when instruments are being connected to the
Data Cal 2000.
• Set the bump test interva l to the d esired numbe r of days. If Auto
Bump Test is selected, when an instrument is connected to the
Data Cal 2000, if it has not been bump tested in the number of
days defined in the Interval field, it will be bump tested by the
Data Cal 2000. It is adjustab l e from 1 day to 180 days.
• Select the gas exposure time. The gas exposure time defines
the number of seconds that calibration gas is applied to an
instrument during a bump test. It is adjustable from 30 seconds
Setting Up the Data Cal 2000 Software • 30
Page 36

to 90 seconds
• Set the bump test tolerance for each channel. This option for
each channel allows you to set up the criteria for determining if
an instrument passes a bump test. The default value for each
channel for the allowable deviation for a bump test is 30% o f the
gas concentration used in the test. These values are adjust able
from 20% to 50%. If the result of the bump test for a channel is
within the set deviation, then the channel p asses the bump test .
For example, if the tolerance for the CH4(100%LEL) channel is
set to 30% and 50% LEL CH
LEL CH
channel must respond between 35% LEL and 65%
4
is used in the bump test, then the
4
LEL to pass the bump test.
10. Select the cali bration settings in the Calibration section
• Selecting the Manual Calibration selection box activates the
Calibration button in the main window and allows you to
perform a calibration manually.
• If Auto Calibration is selected, the software will automatically
check the last calibration date retrieved from a connected
instrument and compare it to the calibration interval to d etermine
if a connected instrument is due for calibration and calibrate the
instrument if it is due. For a GX-2003 or a GX-2009, the
calibration interval is saved in the instrument and retrieved by
the Data Cal 2000. You can use the Data Cal 2000 software to
update the calibration interval in the GX-2003 or the GX-2009
(see “Edit Function” on page 74). For a GX-2001, the calibration
interval is defined in the Data Cal 2000 software and can be
updated (see “Edit Function” on page 74). If Auto Calibration is
selected, make sure the appropriate calibration gas cylinders
are always connected to the appropriate fittings on the back of
the docking statio n when instruments are being connected to the
Data Cal 2000.
11. Click the OK button to save all changes and return to the main
program window.
31 • Setting Up the Data Cal 2000 Software
Page 37

Viewing the Pre-Defined Cylinders
1. From the main program window , click the Cylinders button located
along the top of the window. The Cylinders window appears.
The Cylinders window lists defined cylinders and has four function
buttons in the lower right corner of the window for ad ding, updating,
or deleting cylinders. When the software is first loaded, there are
two pre-defined cylinders on the list. One is a 58 liter 4-gas mix wit h
25 ppm H2S, 50 ppm CO, 50% LEL CH4, and 12% Oxygen, RKI
part number 81-0154RK-02. This cylinder is included with the Data
Cal 2000. The other is a 58 liter 50% vo lume CH4 cylinder, RKI part
number 81-0013RK-05, that is used to calibrate the %volume TC
sensor if it is installed in a GX-2003. The %volume CH4 cylinder is
not included with the Data Cal 2000 and must be ordered
separately.
Figure 18: Cylinders Window
2. If the pre-defined cylinders are sufficient for calibrating and bump
testing the instruments that will be used with the Data Cal 2000,
click the Close button to return to the main window and proceed to
“Setting Up the Solenoids” on page 36.
If the pre-defined cylinders are not appropriate for t he instruments
that will be used with the Data Cal 2000, proceed to the next
section, "Adding and Updating Cylinders".
Setting Up the Data Cal 2000 Software • 32
Page 38

Adding and Updating Cylinders
Add a cylinder if the correct cylinder for your bump testing and calibratio n
needs is not on the cylinder list. For example, you may have GX-2001’s
that are LEL/Oxy/CO and so do not need to use a 4-ga s mix that includes
S. In this case you would add a 3-gas cylinder to the cylinder list with
H
2
the appropriate gas concentrations.
When you begin using a new cylinder that is already on the cylinder list,
you will need to update the expiration date of the new cylinder. Also,
update the gas concentration of a user defined cylinder if the cylinder you
are using is the same as the defined cylinder, but one of the gas
concentrations is slightly different . For example if the oxygen
concentration in the user defined 4-gas cylinder is defined as 12%, but
the cylinder label for the cylinder you will use states that it is 11.5%,
update the gas concentration for that cylinder.
If you are using a cylinder that has the same gas or gases as one of the
pre-defined cylinders, but is not the same RKI part number as one of t he
RKI cylinders that is pre-defined, add the cylinder to the cylinder list
instead of changing the concentrations of a pre-defined cylinder.
33 • Setting Up the Data Cal 2000 Software
Page 39

Adding a Cylinder to the Cylinder List
1. From the Cylinders window, click the New button. The
CylinderDetail window will appear.
Figure 19: CylinderDetail Window, Adding a Cylinder
2. Put the cursor in the Name field and enter the cylinder name.
3. Click on the drop down box in the Pre-define Cylinder field and
select the blank option. The Symbol (Unit) , Gas Name, and
Concentration fields become active.
4. Click in the top Symbol(Unit) field. A drop down box will appear.
5. Click on the drop down box and select a gas. When the gas is
selected, the name automat ically appears in the Gas Name field for
that gas.
6. Put the cursor in the gas’s Concentration field and enter the
concentration for that gas.
Setting Up the Data Cal 2000 Software • 34
Page 40

7. For each additional gas in the cylinder being entered move to the
next Symbol(Unit) field and repeat steps 4 - 6.
8. If the cylinder will be used for bump testing, click in the Bump test
selection box to place a check in it.
9. If the cylinder will be used for calibrating, click in the Calibration
selection box to place a check in it.
10. Click the OK button. A confirmation window appears.
11. Click Yes to save the new cylinder’s settings and return to the
Cylinders window.
12. Click the Close button to return to the main window.
Updating Existing Cylinder Parameters
1. From the Cylinders window, click on the cylinder in the cylinder list
that you want to update. It will be highlighted.
2. Click the Edit button. The CylinderDetail window for that cylinder
will appear.
Figure 20: Cylinder Detail Window, Editing a Cylinder
35 • Setting Up the Data Cal 2000 Software
Page 41

3. Update the cylinder parameters as desired.
4. Click the OK button. A confirmation window appears.
5. Click Yes to save the changes and return to the Cylinders window.
6. Click the Close button to return to the main window.
Setting Up the Solenoids
The solenoids are located inside the Data Cal 2000 docking st ation. They
control which fitting on the back of the docking st ation is used to draw
gas from a connected cylinder during a bump test or calibration. In the
case of the AIR fitting, it may draw from a zer o air cylinder connected to it
or from the ambient air. Which fitting is used to draw gas at a particular
time during a calibration or bump test is determined by the sof tware
depending on the solenoid cylinder as signment and the version of the
instrument that is being bump tested or calibrated by the Data Cal 2000.
To enter the Solenoids window, click the Solenoids button in the main
program window.
Figure 21: Solenoids Window
When the software is first installed, the solenoids are assigned as
follows:
• the AIR solenoid controls the AIR fitting and it is assigned cylinder
number 0000 which is defined as “air”. This assignment is fixed and
cannot be changed.
Setting Up the Data Cal 2000 Software • 36
Page 42

• The GAS 1 solenoid which controls the Gas 1 fitting is assigned to
Cylinder 0001 which is RKI 4-gas mix 81-00154RK-02.
• The GAS 2 solenoid which controls the Gas 2 fitting is assigned to
Cylinder 0002 which is RKI 50% volume CH4 cylinder 81-0013RK-
05.
• Solenoids GAS 3, GAS 4, and GAS 5 are unassigned.
If you define additional cylinders and wish to assign them to unassigned
solenoids or wish to change the solenoid assignments:
1. From the main program window , click the Solenoids button located
along the top of the window. The Solenoids window appears.
2. Click in the Cylinder Name field of an assigned solenoid or an
assigned solenoid whose assignment you what to change.
3. A drop down arrow will appear in the solenoid position on the far
right.
4. Click on the drop down arrow. A list of defined cylinders wi ll appear.
5. Select the cylinder you want assigned to that solenoid.
6. Click the Apply button to make this change.
7. Repeat steps 2 - 6 for any additional assignments you want to
make.
8. When you are done making assignments, click the OK button. A
confirmation window will appear.
9. Click Yes to save the changes. You will return to the main program
window.
37 • Setting Up the Data Cal 2000 Software
Page 43

Connecting Instruments to the
Data Cal 2000
When an instrument is connected to the Data Cal 2000, the software
automatically retrieves the instrument’s parameters such as serial
number, calibration interval setting, and data logging interval time. It can
also automatically download data, bump test, or calibrate an instrument
depending on whether these items are selected in the parameter tab of
the Configuration window . To connect an instrument or instruments to the
Data Cal 2000, perform the following steps:
1. If necessary, veri fy that the Data Cal 2000 is completely assembled
and connected to your computer as described in “Data Cal 2000
Hardware Setup” on page 13.
2. If necessary, verify that the Data Cal 2000 software has been set
up as described in “Setting Up the Data Cal 2000 Software” on
page 27.
3. With the Data Cal 2000 off, put the instrument(s) to be connected
into an appropriate docking module. Make sure that a GX-2001 is
placed into a DM-2001, a GX-2003 is placed into a DM-2003, and a
GX-2009 is placed into a DM-2009.
• For a GX-2001, attach th e flow adapter cup to the sensor side of
the instrument before inserting it into the DM-2001.
• For the GX-2003, place the instrument into the DM-2003,
connect the plastic fitting on the end of the coiled black tube to
the inlet fitting, and then connect the pl astic fitting on the end of
the straight green tube to the exhaust fitt ing.
• For a GX-2009, place the instrument into the DM-2009. No
secondary connections to the GX-2009 are needed.
4. Turn on the Data Cal 2000 with the power switch on the back panel.
5. Launch the Data Cal 2000 software. The main program window will
appear.
6. Turn on all instrument s that ar e in the docking modules.
Connecting Instruments to the Data Cal 2000 • 38
Page 44

NOTE:As soon as a DM-2003 docking module recognizes t hat a
TRANSMIT
GX-2003 is installed, a solenoid in the DM-2003 that
allows the GX-2003 to draw gas is opened. If a GX-2003
is installed in the docking module when the Data Cal 2000
is turned on, it takes th e DM-2003 about 5 seconds after
turn on to recognize the GX-2003. The solenoid remains
open for 3 minutes and is then closed. Turn on all
GX-2003’s af ter this 5 second period and within 3 minutes
of the solenoid being opened. If the solenoid is closed
when the GX-2003 is turned on, it will go into low flow
alarm because the pump activates for a few seconds
before the GX-2003 is connected with the software.
If a low flow occurs when the GX-2003 is turned on,
disconnect the coiled hose from the inlet fitting, press the
RESET button to reset the low flow alarm, and when the
PC TRANSMIT ST ANDBY O K screen appears, reconnect
the coiled hose to the inlet fitting.
• A GX-2009 will begin its normal startup sequence and after a
few seconds, the display will indicate it is ready t o communicate
with the computer:
PC
NOTE: If the GX-2009 is lef t in the DM-2009 for a long period of
time, the dock pump will run for 12 seconds every 2
minutes in order to keep excess hydrogen generat ed
from the NiMH batteries from affecting the CO sensor.
39 • Connecting Instruments to the Data Cal 2000
Page 45

• A GX-2003 will begin its normal startup sequence and after a
few seconds, the pump will turn of f and the display will indicate it
is ready to communicate with the computer:
PC
TRANSMIT
STAND BY
OK
21:09
• A GX-2001 will begin its normal startup sequence and after a
second or two the display will indicate the following:
Conn
7. The message window in the main program window will indicate
when each unit is connected to the program and what actions are
being taken, for example, paramete r reading or automatic data
downloading. In Figure 22 below, one GX-2001, one GX-2003 and
one GX-2009 are connected to the Data Cal 2000 and their
parameters have been downloaded.
If the Data Cal 2000 software is set up for automatic bump testing or
automatic calibration, the software will determine if any connected
instruments require bump testing or calibration after their
parameters have been retrieved by the sof tware and dat a has been
retrieved (if software is setup for automatic downloading), then
perform bump testing or calibration if necessary.
NOTE: If the software is setup for automatic data downloading,
it may take up to 10 minutes to download each GX-2001
if its memory is full, up to 20 minutes to download each
GX-2003 if its memory is full, and up to 25 minutes to
download each GX-2009.
Connecting Instruments to the Data Cal 2000 • 40
Page 46
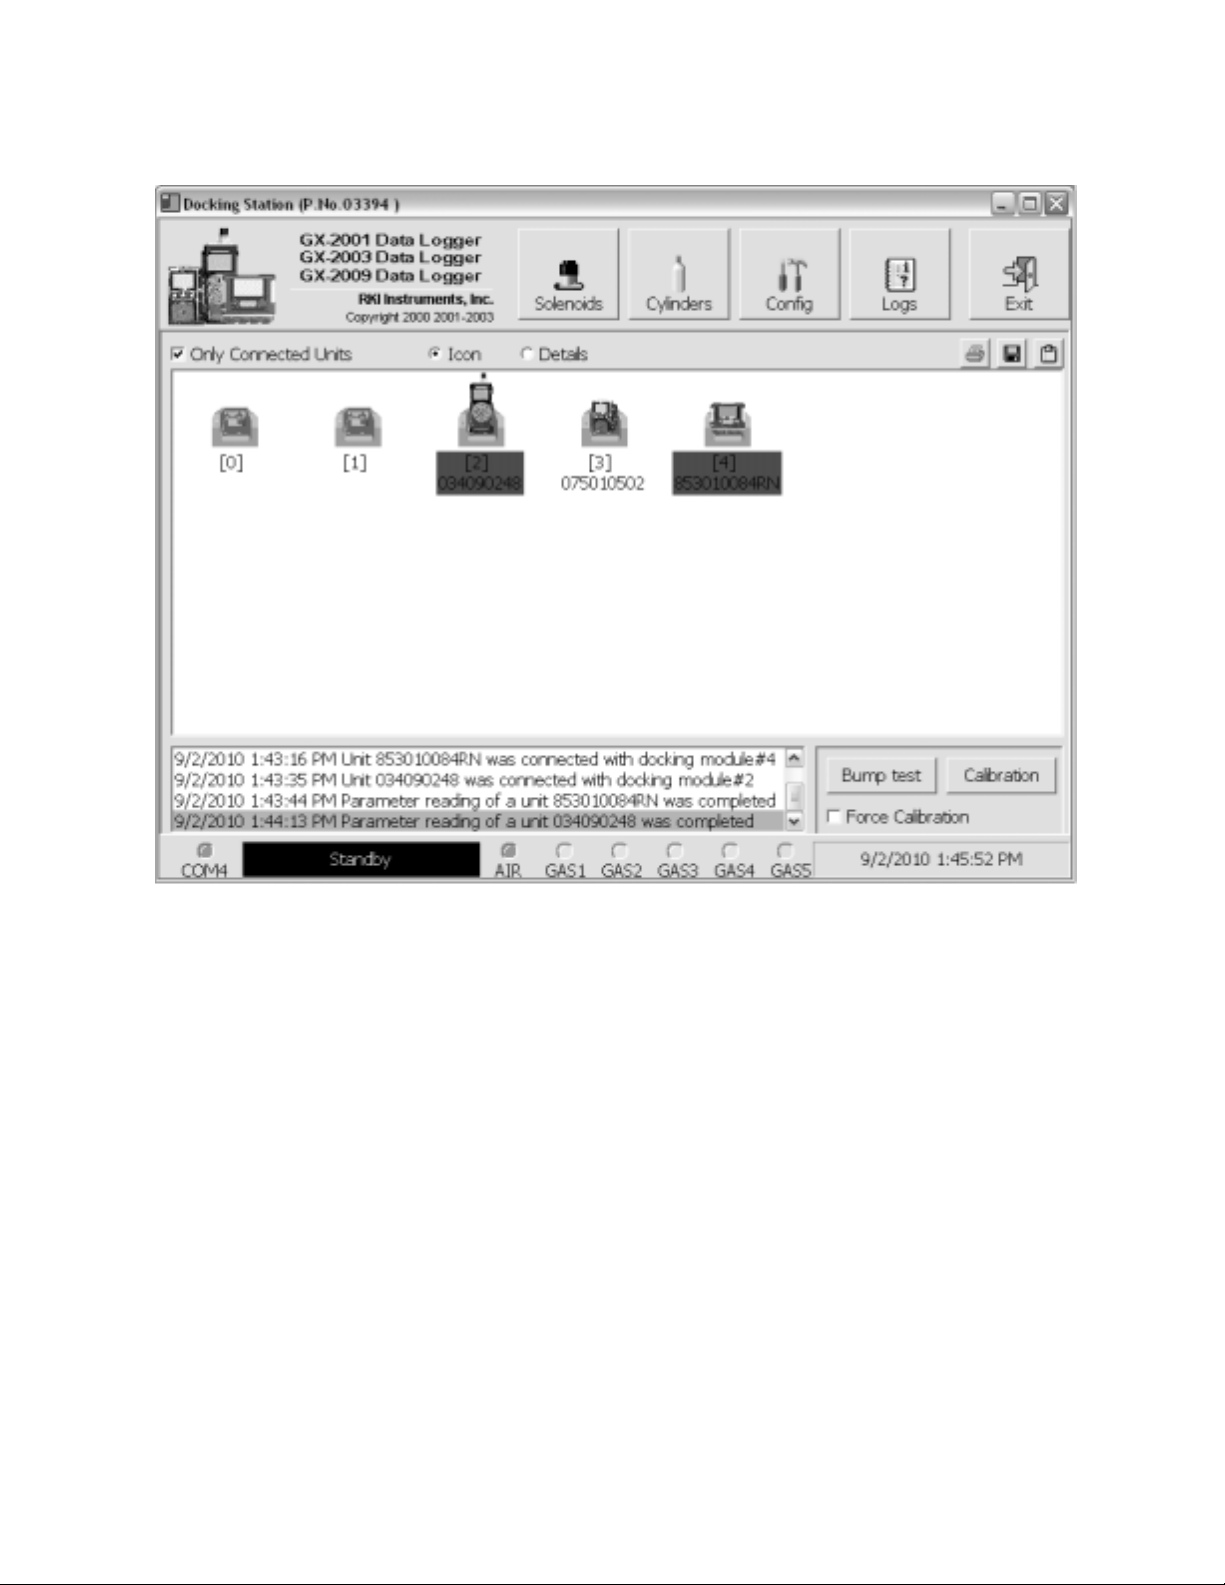
Figure 22: Instruments Connected to Data Cal 2000
8. Once all instruments are connected and all a utomatic f unctions ar e
completed, the instruments are available for bump testing,
calibration, data downloading, or parameter updates.
41 • Connecting Instruments to the Data Cal 2000
Page 47

Bump Testing Instruments
The Data Cal 2000 is capable of performing a bump test both manually
and automatically when an instrument is connected to it. When a bump
test is performed, the Data Cal 2000 performs an air adjust operation on
an instrument and then applies calibration gas to the instrument. The
Data Cal 2000 analyzes the response results based on predefined
criteria and determines if the instrument p assed the bump test.
NOTE: Starting in November 2011, Data Cal 2000 Docking
Station Software version 04033 started shipping along
with updated versions of the DM-2009. Any units
shipped prior to November 2011 do not have the ability
to reset the bump test date on a GX-2009 after a
successful bump test. If you are using the GX-2009’s
bump test feature and your Data Cal 2000 is not
resetting the bump test date, contact RKI Instruments,
Inc. to send your DM-2009 in for an update and to
request a new Data Cal 2000 product CD.
The criteria that the Data Cal 2000 uses to determine if the instrument
passes a bump test, whether the Bump Test button is active, and whether
or not the Data Cal 2000 automatically performs a bump test if it is due
on a connected unit is defined in the Configuration window on the
Parameter tab. See "Setting Up the Configuration", instruction 9 on
page 30 for a description of the bump test configuration setup.
To perform a manual bump test on an instrument that is conne cted to t he
software:
1. Ver ify that the appropriate calibration gas cylinder or cylinders is
connected to the appropriate fitting or fittings on the back panel of
the Data Cal 2000. See “Setting Up the Solenoids” on page 36.
2. From the main program window, select the instrument you want to
bump test by clicking on it in the docking module/instrument
window.
To select additional instruments, hold down the Shift key while
clicking each additional instrument. All selected instruments will be
bump tested.
Bump Testing Instruments • 42
Page 48

3. Click the Bump test button. The Data Cal 2000 will initiate a bump
test. During the bump test, the Data Cal 2000 will perform the
following functions:
• It will apply fresh air to the instrument for 45 seconds.
• It will perform a zero operation on the instrument.
• It will apply the necessary calibration gas to the unit for the
number of seconds defined in the Gas Exposure Time setting in
the Parameter Tab of the Configuration Window (see
instruction 9 on page 30). If more than one cylinder is required
for a bump test, such as a %volume CH4 cylinder and a 4-gas
mix cylinder for a 5 sensor GX-2003, then gas from each
cylinder will by applied separately for the required amount of
time.
4. When the bump test is completed, the software will analyze the
results and display the Calibration & Bump test Result window
which shows the bump test results. If the instrument or instrument s
passed the bump test then the following indication is given.
Figure 23: Bump Test Pass Indication
43 • Bump Testing Instruments
Page 49

If the instrument or instruments failed the bump test, then the
following indication is given.
Figure 24Bump Test Fail Indication
5. If the Force Calibration box is checked, then the Data Cal 2000 will
automatically calibrate any instrument or instrument s that fai led the
bump test.
6. To close the result window, click the OK button. For a failed bump
test, if you want to view the test results for each channel, double
click on an instrument in the result window and the software will
take you to the Bump Test area of the Logs window where th e data
for this bump test is saved.
7. After a bump test, the docking modules and instruments will be
automatically displayed in detail format.
Bump Testing Instruments • 44
Page 50

Calibrating Instruments
The Data Cal 2000 is capable of performing a calibration both manually
and automatically on an instrument connect ed to it. Whe n a calibrat ion is
performed, the Data Cal 2000 performs an air adjust operation on an
instrument and then applies calibration gas to the instrument. The Data
Cal 2000 analyzes the calibration results and determines if the
instrument passed the calibration.
To perform a manual calibration on an instrument that is connected to the
software:
1. Veri fy that the appropriate calibration gas cylinder or cylinders are
connected to the appropriate fitting or fittings on the back panel of
the Data Cal 2000. See “Setting Up the Solenoids” on page 36.
2. From the main program window, select the instrument you want to
calibrate by clicking on it in the docking module/in strument window.
To select additional instruments, hold down the Shift key while
clicking each additional instrument. All selected instruments will be
calibrated.
3. Click the Calibration button. The Data Cal 2000 will initiate a
calibration. During the calibration, the Data Cal 2000 will perform
the following functions:
• It will apply fresh air to the instrument for 45 seconds.
• It will perform a zero operation on the instrument.
• It will apply the necessary calibration gas to the unit for 90
seconds. If more than one cylinder is required for a calibration,
such as a %volume CH4 cylinder and a 4-gas mix cylinder for a
5 sensor GX-2003, then gas from each cylinder will be applied
for 90 seconds each.
• After each gas application, a calibration operation will be
performed on the instrument that is appropriate for th at cylinder.
45 • Calibrating Instruments
Page 51

4. When the calibration is completed, the software will analyze the
results and display the Calibration & Bump test Result window
which shows the calibration result s. If the instrumen t or instruments
passed the calibration then the following indication is given.
Figure 25: Calibration Pass Indication
Calibrating Instruments • 4 6
Page 52

If the instrument or instruments failed the calibra tion, then the
following indication is given.
Figure 26: Calibration Fail Indication
5. To close the result window, click the OK button. For a failed
calibration, if you want to view the test results for each channel,
double click on an instrument in the result window and the software
will take you to the Calibration area of the Logs window where the
data for this calibration is saved.
6. After a calibration, the docking modules and instruments will be
automatically displayed in detail format.
47 • Calibrating Instruments
Page 53

Deleting Instruments From the Main
Window
An instrument, along with a ll its associated dat a, can b e de lete d from the
database from the main program window. This function is password
protected to prevent accidental deletion of an instrument from the
database. To delete an instrument from the database from the main
program window, perform the following:
1. From the main program window , click on th e instrument you want to
delete so that it is highlighted.
2. Press the “Delete” key on the keyboard. A password entry window
will appear.
3. Enter the password and click OK. The default password is
“ABCDE” and is case sensitive. A confirmation window will appear.
4. Click OK to complete the deletion of the selected item.
NOTE: Instruments can also be deleted from the database in
the Database tab of the Configuration window. See
“Database Tab” on page 79.
Charging Instruments With The
Data Cal 2000
The Data Cal 2000 can be used to charge the rechargeable bat tery p a ck
in a GX-2001, GX-2003, or GX-2009. The Data Cal 2000 will not
recharge the batteries in an alkaline version of the GX-2003. An
instrument’s battery pack can be recharged after functions such as data
downloading or bump testing are performed on it. It can also be charged
without the Data Cal 2000 Docking Station Software being launched. To
maximize the battery pack run time and the battery pack life, make sure
the battery pack’s charge is as low as possible before recharging it.
To recharge the batteries in an instrument after it is connected to the
Data Cal 2000 and the software has performed functions such as data
downloading or bump testing on it:
1. After all functions have been completed, turn off the instrument.
Deleting Instruments From the Main Window • 48
Page 54

2. The LED on the left front of the docking module will turn off. The
LED on the right front of the module will start blinkin g yellow.
3. If the battery pack is fully charged, th en the blinking yellow LED will
turn solid green in a few minutes.
If the battery pack is drained enough for t he mo dule to charge it,
the right LED will continue to blink yellow while charging is taking
place. The GX-2001 and GX-2003 each take approximately 90
minutes to charge while the GX-2009 will take approximately 3
hours to fully charge.
NOTE: If the GX-2009 is lef t in the DM-2009 for a long period of
time, the dock pump will run for 12 seconds every 2
minutes in order to keep excess hydrogen generat ed
from the NiMH batteries from affecting the CO sensor.
To recharge the batteries in an instrument wit hout launching t he Data Cal
2000 Docking S tation Software:
1. Turn on the docking station. The right LED on the docking module
will start blinking green.
2. Install the instrument into the docking module. If only charging is
being performed, it is not necessary t o inst all the sample ada pter to
a GX-2001 or the sample tubes to a GX-2003. Since the GX-2009
does not require any attachments, it can be installed in the
DM-2009 normally. The right LED on the docking module will start
blinking yellow.
3. If the battery pack is fully charged, th en the blinking yellow LED will
turn solid green in a few minutes.
If the battery pack is drained enough for t he mo dule to charge it,
the right LED will continue to blink yellow while charging is taking
place. The GX-2001 and GX-2003 each take approximately 90
minutes to charge while the GX-2009 will take approximately 3
hours to fully charge.
49 • Charging Instruments With The Data Cal 2000
Page 55

NOTE: If the GX-2009 is lef t in the DM-2009 for a long period of
time, the dock pump will run for 12 seconds every 2
minutes in order to keep excess hydrogen generat ed
from the NiMH batteries from affecting the CO sensor.
Logs Window
Viewing Data
You can view alarm t rend data , calibration dat a, event da ta, interval t rend
data, memos, and bu mp test information in the Logs window. T o ent er the
Logs window, click the Logs button from the main program window.
When viewing the data, it can be organized in two ways:
1. Base View Format
Neither of the Serial No, Station ID, or User ID select ion boxes i n
the lower left of the window are selected and t he Base box appears
next to these selection boxes. The data can be organized by eit her
the data type or by the month and year.
Figure 27: Logs Window in Base Viewing Format
Logs Window • 5 0
Page 56

2. ID View Format
The data can be organized by one or more of the following items
depending on which selection box or boxes in the lower left of the
window are selected:
• Serial Number
• Station ID
• User ID
If any of these boxes is selected, the Base box disappears.
Figure 28: Logs Window in ID Viewing Format
Once you have selected how you want to organize the data:
1. Click the expanded view symbol (+) next to a folder in the left side
of the Logs window or double click the folder to view the contents
below it.
Single click on the folder to view the contents in the righ t side of the
51 • Logs Window
Page 57

Logs window. If an item is expanded and you want to close it, click
the (-) symbol next to the item or double click it.
2. When a folder no longer has a (+) or (-) symbol next to it, single
click it and the contents of the folder will be shown on the rig ht side
of the Logs window. The various types of data and information are
described below.
Deleting Data
You can delete an instrument, alarm trend data, calibration data, event
data, interval trend dat a, and bump test information in the Logs window.
Memos cannot be deleted unless the instrument to which the memos are
attached is deleted from the dat abase. The delete function is password
protected to avoid accidental deletion of data or instruments. Deleting
data can only be done while the DataCal 2000 is not performing
operations that require communication with instruments such as bump
testing or downloading data. To delete an instrument or data, enter the
Logs window and perform the following:
1. Find the item you wish to delete and right click it. A window will
appear that says “Delete(D)”.
2. Click on “Delete(D)”. A password entry window will appear.
3. Enter the password and click OK. The default password is
“ABCDE” and is case sensitive. A confirmation window will appear.
4. Click OK to complete the deletion of the selected item.
Alarm Trend Data
If a gas alarm event occurs, then an alarm trend file that is centered
around the event is saved in the GX-2001, GX-2003, and GX-2009. The
GX-2001 saves one alarm trend file for the most recent gas alarm event.
The GX-2003 and GX-2009 save up to 8 alarm trend files for the 8 most
recent gas alarm event s. An al arm t rend f ile shows the read ings up to 15
minutes before and 15 minutes after the event, with the log interval time
every five seconds for the GX-2001 and up to 30 minutes before and 30
minutes after the event, with the log time every 5 seconds for the
GX-2003 and the GX-2009. The gas readings logged at the alarm event
time are highlighted in red and the gas readings logged every 5 seconds
around the alarm event are the peak (minimum for oxygen) readings for
the previous five seconds. If a GX-2001 has not been on for 15 minutes
Logs Window • 5 2
Page 58

before an alarm event or is not on for 15 minutes after the alarm event,
only the time that the unit was on is shown in the alarm trend file. If a
GX-2003 or the GX-2009 has not been on for 30 minutes before the
alarm event or is not on for 30 minutes after the alarm event, only the
time that the unit was on is shown in the alarm trend file.
Once the maximum number of alarm trend files are already saved in an
instrument’s memory (one for the GX-2001 and 8 for the GX-2003 and
the GX-2009), the oldest alarm trend file is ove rwritten when a new alarm
trend file is saved. If an alarm trend file is overwritten before data is
downloaded to the Data Cal 2000, that file is lost. At least two dat a point s
must be saved for the alarm trend file to be viewable in both table and
graph format.
To view and perform desired operations with the alarm trend files:
1. While in the Logs window, open folders in the left side of the
window until the Alarm folder you wish to open is visible.
2. If you are viewing data in base view format with the dat a or ganized
by type, expand the Alarm folder. Folders organized by year/month
will appear below the Alarm folder. Click on the folder whose
contents you wish to see. The alarm trend files in the folder will be
shown in the upper right side of the Logs window.
53 • Logs Window
Page 59

Figure 29: Alarm Trend Files in Base View Format
If you organize the data by date, then folders organized by year/
month appear in the left side of the window. Expand the folder you
want to see and click on the Alarm folder. The alarm trend files will
appear in the upper right side of the window.
If you are viewing data in ID view format, expand folders in the left
side of the window until the Alarm folder you wish to view is visi ble.
Expand the Alarm folder. Folders organized by year/month will be
listed below the alarm folder. Click the folder whose contents you
want to view and the alarm trend files in it will be shown in the
upper right side of the Logs window.
Logs Window • 5 4
Page 60

Figure 30: Alarm Trend Files in ID View Format
3. To view summary information about the alarm file, select it in the
right side of the window. A summary of the file will appear in the
area below the file list.
4. To open the file and see the data and a graph of the data, double
click on the file. The Data Sample (Alarm Trend) window will
appear with a table of the data on the left side of the window and a
graph of the data on the right side.
55 • Logs Window
Page 61

Figure 31: Alarm Trend File Data & Graph
5. Yo u can choose to view the data in a variet y of arrangement s, such
as data on the left and graph on the right, by clicking the
appropriate Data Arrangement button in the upper left of the
window. Each Data Arrangement button has a table and graph
symbol inside of it.
6. To display the summary information for a file along with the data
and graph, click the Su mmary Info rmation but ton in the upper left
corner of the window, to the left of the Data Arrangement
buttons.The Summary Information but ton has an “i” in it.
7. To print the data, select either List or Graph in the upper right
corner of the window and then click the Print button in the upper
right corner of the window. The Print button has a printer icon in it.
A dialog box will appear confirming if you want to print. Click OK. If
Graph is selected, the data will print as a graph and if List is
Logs Window • 5 6
Page 62

selected, the data will print as a table.
8. To save the data to a file which can be imported into another
program, select either List or Graph in the upper right corner of the
window and then click the Save To File button. The Save To File
button has a floppy disk icon in it. A “Save As” dialog box will
appear for you to specify the filename, file location, and file type.
Figure 32: Save As Dialog Box
If Graph is selected, the file type is Windows bitmap (.bmp). If List
is selected, the file type is “.csv” (comma-separated values). After
specifying the file name and file location, click the Save button to
save the file to the specified location.
9. To save the data to the clipboard, select either List or Graph in the
upper right corner of the window and then click the Copy To
Clipboard button. The Copy To Clipboard button has a clipboard
icon in it. The table or graph will be saved to the clipboard. It can
then be pasted into a document by using t he Paste command in an
application.
10. To go back and view other data, click the Close button to return to
the Logs window.
57 • Logs Window
Page 63

Calibration Data
The GX-2003 saves the calibration information for t he last 20 calibrations
while the GX-2009 saves the calibration information for the last 100
calibrations. When an autocalibration i s performed, the calibrati on results
are saved as a file. When single calibration is used, the GX-2003 and
GX-2009 consider each time you calibrate a channel a calibration and a
file is saved for that calibration. Once a GX-2003 or a GX-2009 have
reached their maximum number of calibration files, the oldest calibration
file is overwritten when a new one is saved.
When a GX-2003 or a GX-2009 is connected to the Data Cal 2000, the
calibration files in it are retrieved and stored by the software. In addition,
all calibrations performed by the Data Cal 2000 on a GX-2003 or a
GX-2009 are stored by the software.
A GX-2001 only saves calibration informati on for the most recent
successful calibration for each channel. When a GX-2001 is connected
to the Data Cal 2000, this information is not r etrieved by the Data Cal
2000. However, all calibrations performed by the Data Cal 2000 on a
GX-2001 are stored by the software.
To view and perform desired operations with the calibration files:
1. While in the Logs window, open folders in the left side of the
window until the Calibration folder you wish to view is visible.
2. If you are viewing data in base view format with the dat a or ganized
by type, expand the Calibration folder. Folders organized by year/
month will appear below the Calibration folder. Click on the folder
whose contents you wish to see. The calibration files in the folder
will be shown in the upper right side of the Logs window.
Logs Window • 5 8
Page 64

Figure 33: Calibration Files in Base View Format
If you organize the data by date, then folders organized by year/
month appear in the left side of the window. Expand the folder you
want to see and click on the Calibration folder. The calibration files
will appear in the upper right side of the window.
If you are viewing data in ID view format, expand the folders in the
left side of the window until the Calibration folder you wish t o view
is visible. Expand the Calibration folder. Folders organized by year/
month will be listed below the Calibration folder. Click the folder
whose contents you want to view and the calibration files in it will
be shown in the upper right side of the Logs window.
59 • Logs Window
Page 65

Figure 34: Calibration Files in ID View Format
3. Files that record a failed calibration on all channels are highlighted
in red. Files that record a calibration where not all cha nnels passed
are highlighted in orange.
4. T o view the file i n summary format, click on the calibration fi le in the
upper right part of the Logs window that you wish to view. The
calibration information in the file will appear in the lower r ight part of
the window in summary format. It includes the instrument’s serial
number, station ID, user ID, calibration time, and gas readings
during the calibration.
5. To print all the calibration files in the upper right window, click the
Bump test & Calibration Report button above the files. A di alog
box will appear confirming if you want to print. Click OK.
6. To go back and view other data, click the Close button to return to
the Logs window.
Logs Window • 6 0
Page 66

Event Data
The GX-2003 and the GX-2009 save events such as gas alarms,
calibration failures, and sensor failures. These events are saved as files
in the Logs window. The files indicate the instrument, time of the event,
and event type. The Data Cal softwar e does not save event data
separately for GX-2001’s, but the events saved by a GX-2001 are
viewable in the interval trend data. To view and perform desired
operations with the event files:
1. While in the Logs window, open folders in the left side of the
window until the Event folder you wish to view is visible.
2. If you are viewing data in base view format with the dat a or ganized
by type, expand the Event fol der. Folders organized by year/mont h
will appear below the Event folder. Click on the folder whose
contents you wish to see. The event files in the folder will be shown
in the upper right side of the Logs window.
Figure 35: Event Files in Base View Format
If you organize the data by date, then folders organized by year/
month appear in the left side of the window. Expand the folder you
want to see and click on the Event folder. The event files will
appear in the upper right side of the window.
If you are viewing data in ID view format, exp and th e f iles in the lef t
side of the window until the Event fol der you wish to vi ew is visible.
61 • Logs Window
Page 67

Expand the Event folder. Folders organized by year/month will be
listed below the Event folder. Click the folder whose contents you
want to view and the event files in it will be shown in the upper right
side of the Logs window.
Figure 36: Event Files in ID View Format
3. To print all the event files in the upper right window, click the Print
button in the upper lef t corner of t he Logs window. The Print button
has a printer icon in it. A dialog box will appear confirming if you
want to print. Click OK.
4. To go back and view other data, click the Close button to return to
the Logs window.
Interval Trend Data
The GX-2001 saves data every 5 minutes. It saves the ave r age reading
of the previous 5 minutes for each channel and can log up to 40 hou rs o f
data depending on how many times the instrument is turned on and off
and how many events such as gas alarms occur.
The GX-2003’s data logging interval is adjustable using the instrument’s
user interface. See the GX-2003 Operator’s Manual for instructi ons on
how to adjust the dat a logging interval. The data logging interval can also
Logs Window • 6 2
Page 68

be adjusted with the DataCal 2000 software in the Parameter Tab as
described in “Setting Up the Configuration” on p age 28. At the scheduled
log time, the GX-2003 also saves the average readings of the previous
interval period. The log time will depend on how many times the GX-2003
is turned on and off and how many events such as gas alar ms occur.
The GX-2009’s data logging interval is user adjustable through the
GX-2009 User Setup Program, the GX-2009 Data Logger Management
Program, or the Data Cal 2000 Software. See the GX-2009 User Setup
Program Operator’s Manual or the GX-2009 Data Logger Management
Program Operator’s Manual for instructions on how to adjust the data
logging interval. At the scheduled log time, the GX-2009 also saves the
average readings of the previous int erval period. The log time will depend
on how many times the GX-2009 is turned on and off and how many
events such as gas alarms occur.
To view and perform desired operations with the interval trend files:
1. While in the Logs window, open folders in the left side of the
window until the Interval folder you wish to open is visible.
2. If you are viewing data in base view format with the dat a or ganized
by type, expand the Inte rval folder. Folders organized by year/
month will appear below the Interval folder. Click on the folder
whose contents you wish to see. The interval trend files in the
folder will be shown in the upper right side of the Logs window.
63 • Logs Window
Page 69

Figure 37: Interval Trend Files in Base View Format
If you organize the data by date, then folders organized by year/
month appear in the left side of the window. Expand the folder you
want to see and click on the Interval folder. The interval trend files
will appear in the upper right side of the window.
If you are viewing data in ID view format, expand the folders in the
left side of the window until the Interval folder you wish to view is
visible. Expand the Interval folder . Folde rs organized by year/month
will be listed below the Interval folder. Click the folder whose
contents you want to view and the interval trend files in it will be
shown in the upper right side of the Logs window.
Logs Window • 6 4
Page 70

Figure 38: Interval Trend Files in ID View Format
3. T o view summary information about a n interval trend f ile, select it in
the right side of the window. A summary of the f ile will appear in the
area below the file list.
4. To open the file and see the data and a graph of the data, double
click on the file. The Data Sample (Interval Trend) window will
appear with a table of the data on the left side of the window and a
graph of the data on the right side. If less than two data points are
saved, only the data table will appear.
65 • Logs Window
Page 71

Figure 39: Interval Trend File Data & Graph
5. Yo u can choose to view the data in a variet y of arrangement s, such
as data on the left and graph on the right, by clicking the
appropriate Data Arrangement button in the upper left of the Logs
window. Each Data Arrangement button has a table and graph
symbol inside of it.
6. To display the summary information for the file along with the data
and graph, click the Su mmary Info rmation but ton in the upper left
corner of the Logs window, to the left of the Data Arrangement
buttons.
7. To print the data, select either List or Graph in the upper right
corner of the window and then click the Print button in the upper
right corner of the window. The Print button has a printer icon in it.
A dialog box will appear confirming if you want to print. Click OK. If
Logs Window • 6 6
Page 72

Graph is selected, the data will print as a graph and if List is
selected, the data will print as a table.
8. To save the data to a file which can be imported into another
program, select either List or Graph in the upper right corner of the
window and then click the Save To File button. The Save To File
button has a floppy disk icon in it. A “Save As” dialog box will
appear for you to specify the filename, file location, and file type.
Figure 40: Save As Dialog Box
If Graph is selected, the file type is Windows bitmap (.bmp). If List
is selected, the file type is “.csv” (comma-separated values). After
specifying the file name and file location, click the Save button to
save the file to the specified location.
9. To save the data to the clipboard, select either List or Graph in the
upper right corner of the window and then click the Copy To
Clipboard button. The Copy to Clipboard button has a clipboard
icon in it.The table or graph will be saved to the clipboard. It can
then be pasted into a document by using t he Paste command in an
application.
10. To go back and view other data, click the Close button to return to
the Logs window.
67 • Logs Window
Page 73

Memo Feature
Memos can be created in the Instrument Information window. See “Edit
Function, Memo Entry” on page 75. Memos can be used to record
information or comments about an instrument. To view and perform
desired operations with the memo files:
1. While in the Logs window, open folders in the left side of the
window until the Memo folder you wish to view is visible.
2. If you are viewing data in base view format with the dat a or ganized
by type, expand t he Memo folder. Folders organized by year/month
will appear below the Memo folder. Click on the folder whose
contents you wish to see. The memo files in the folder will be
shown in the upper right side of the Logs window.
Figure 41: Memo Files in Base View Format
If you organize the data by date, then folders organized by year/
month appear in the left side of the window. Expand the folder you
want to see and click on the Memo folder. The memo files will
appear in the upper right side of the window.
Logs Window • 6 8
Page 74

If you are viewing data in ID view format, exp and th e f iles in the lef t
side of the window until the Memo folder you wish to view is visible.
Expand the Memo folder. Folders organized by year/month will be
listed below the Memo folder. Click the folder whose contents you
want to view and the memo files in it will be shown in the upper
right side of the Logs window.
Figure 42: Memo Files in ID View Format
3. To print all the memo files in the upper right window, click the Print
button in the upper lef t corner of t he Logs window. The Print button
has a printer icon in it. A dialog box will appear confirming if you
want to print. Click OK.
4. To go back and view other data, click the Close button to return to
the Logs window.
69 • Logs Window
Page 75

Bump Test Files
The results of all bump tests perf ormed by the Data Cal 2000 are saved
in the Logs window. To view and perform desired operations with the
bump test files:
1. While in the Logs window, open folders in the left side of the
window until the Bump test folder you wish to view is visible.
2. If you are viewing data in base view format with the dat a or ganized
by type, expand the Bump test folder. Folders organized by year/
month will appear below the Bump test folder. Click on the folder
whose contents you wish to see. The bump test files in the folder
will be shown in the upper right side of the Logs window.
Figure 43: Bump Test Files in Base View Format
If you organize the data by date, then folders organized by year/
month appear in the left side of the window. Expand the folder you
want to see and click on the Bump test folder. The bump test files
will appear in the upper right side of the window.
If you are viewing data in I D view fo rmat, expand the folders on the
left side of the window until the Bump test folder you wish to view is
visible. Expand the Bump test folder. Folders organized by year/
Logs Window • 7 0
Page 76

month will be listed below the Bump test folder. Click the folder
whose contents you want to view an d the bump test files in it will be
shown in the upper right side of the Logs window.
Figure 44: Bump Test Files in ID View Format
3. Files that record a failed bump test on all channels are highlighted
in red. Files that reco rd a bump test where not all channels passed
are highlighted in orange.
4. To view the file in summary format, click on the bump test file in the
upper right part of the Logs window that you wish to view. The
bump test information in the fi le will appear in the lower right p art of
the window in summary format. It includes the instrument’s serial
number, station ID, user ID, bump test time, and gas readings
during the bump test.
5. To print all the bump test files in the upper right window, click the
Bump test & Calibration Report button above the files. A di alog
box will appear confirming if you want to print. Click OK.
6. To go back and view other data, click the Close button to return to
the Logs window.
71 • Logs Window
Page 77

Instrument/Module Function Menu
When you are in the main program window, if you right click on an
instrument or a docking module, the Instrument/Module Function menu
appears.
Figure 45: Instrument/Module Function Menu
The functions in the Instrument/Module Functi on me nu are Open, Edit,
Download, Clear Logs, Reset, and Power Off. If you right click on an
instrument that is currently connected to a module, all items in the
Instrument/Module Function menu are selectable as shown above in
Figure 45 if the Change Parameter selection box in the Inst rument
Information section of the Configuration wi ndow Parameter tab is
selected. If it is not selected, the Edit function is not selectable. If you
right click on an inst rument that is not curr ently connected to the Data Cal
2000, only the Open function is active. If you right click on a mo dule that
does not have an instrument in it that is connected to the Data Cal 2000,
only the Reset function is active.
Instrument/Module Function Menu • 7 2
Page 78

Open Function
This function can be activated by either right clicking an instrument
and selecting Open(O) when the pull down menu appears or by
selecting an instrument and then using the alt/O key combination.
The Open function brings up the Instrument Informati on window for
viewing only. No changes can be made with the Open function. The
Instrument Information window co nsists of t he Parameter Setting t ab
and the Sensor Setting tab. The Parameter Setting tab shows
various instrument parameters such as serial number, station ID,
user ID and calibration interval. It also includes a Memo field.
Figure 46: Instrument Information Window, Parameter Setting Tab
The Sensor Setting tab includes various channel parameters such
as the alarm point s for each channel, the autocal gas concentration,
and the last calibration date. There are also two buttons that are not
selectable in Open mode, the Load Factory Defaults and Load
User Defaults buttons. These buttons become selectable in Edit
73 • Instrument/Module Function Menu
Page 79

mode (see below).
Figure 47: Instrument Information Window, Sensor Setting Tab
Edit Function
This function can be activated by either right clicking an inst rument that is
connected to the Dat a Cal 2000 and select ing Edit(E) when the pull down
menu appears or by selecting an instrument that is connected to the Data
Cal 2000 and then using the alt/E key combination.
NOTE: The Edit function is not active and cann ot be selected if
the Change Parameter selection box in the Instrument
Information section of the Configuration window
Parameter tab is not selected.
The Edit function brings up the Instrument Information window and
makes the items in the Parameter Setting and Sensor Setting tabs
available for updating. It also activates the Load Factory Defaults and
Instrument/Module Function Menu • 7 4
Page 80

Load User Defaults buttons in the Sensor S etting t a b. To change any of
the items in either of the two tabs’ fields:
1. Put the cursor in the field you want to update and change the
setting. Repeat this for any add itional fields you want to update.
To deactivate or activate a sensor, click in the r i ght side of the
desired sensor field and a pull-down arrow will appear as shown in
Figure 47 (CH4 channel shown) which will allow you to select a gas
name or “---”. If you select “---”, the channel will be deactivated if
you save the change.
If you want to automatically load the factory default values or the
user default values in the Sensor Setting tab, click either the Load
Factory Defaults or Load User Defaults button. See
"Configuration Window", “Parameter Tab” on page 78 for a
description of these defaults and how to edit the user defaults.
2. Click the OK button in the lower right corner of the Instrument
Information window.
3. A confirmation box will appear. Click the Yes button.
4. The software will make the change or changes in the connected
instrument and return to the main program window.
To load the factory or user default values for the items in the Sensor
Setting tab, click the Load Factory Defaults or Load User Defaults
button. The values loaded for each button are defined in the Sensor tab
of the Configuration window (see “Sensor Tab” on page 80).
Edit Function, Memo Entry
The Data Cal 2000 includes a memo feature that allows you to enter
remarks for an instrument that is connected to the software. The memo
may be used to document anything of interest, such as maintenance
records (noting when a sen sor was changed or a batte ry pack changed).
To enter a memo, activate the Edit function to bring up the Parameter
Setting tab as described above in "Edit Function" and perform the
following:
1. Place the cursor in the Memo field. If a memo has been previously
entered, it will still appear in the Memo field.
2. If necessary delete the old memo. Enter the information you wish to
75 • Instrument/Module Function Menu
Page 81

document.
3. Click the OK button in the lower right corner of the Instrument
Information window.
4. A confirmation box will appear. Click the Yes button.
5. The sof tware will save the memo in the instrument’s Memo folder in
the Logs Window and return to the main program window.
Download Function
This function can be activated by either right clicking an inst rument that is
connected to the Data Cal 2000 and selecting Download(D) when the
pull down menu appears or by selecting an instrument that is connected
to the Data Cal 2000 and then using the alt/D key combination. The
Download function downloads all logged dat a and cali bration informat ion
from a GX-2003 and a GX-2009 and all logged data from a GX-2001
connected to the Data Cal 2000. I f you select Download(D), a
confirmation box appears. Click the OK button to proceed with
downloading from the instrument.
Clear Logs Function
This function can be activated by either right clicking an inst rument that is
connected to the Data Cal 2000 and selecting Clear Logs(C) when the
pull down menu appears or by selecting an instrument that is connected
to the Data Cal 2000 a nd then using t he alt/C key combinat ion. The Clear
Logs function clears all logged data and calibration files from an
instrument connected to the Data Cal 2000. If you select Clear Logs(C),
a confirmation box appears. Click t he OK b utt on to proceed with clearing
all the data from the instrument.
Reset Function
This function can be activated by either right clicking an inst rument that is
connected to the Data Cal 2000 or a docking module and selecting
Reset(R) when the pull down menu appears. It can also be activated by
selecting an instrument that is connected to the Dat a Ca l 2000 or a
docking module and then using the alt/R key combination. The Reset
function resets the selected docking module. This is useful if
communication errors occur with the docking module or the module does
not communicate with the Dat a Ca l 2000. If you select Reset(R), a
confirmation box appears. Click the OK button to proceed with resetting
the selected docking module.
Instrument/Module Function Menu • 7 6
Page 82

NOTE: If communication errors for a module or improper
operation of a module continue after resetting the
module, verify that the terminator switch has been set
properly in the down position for the last module in the
system and that all the other modules have the
terminator switch set to the up position.
Power Off Function
This function can be activated by either right clicking an inst rument that is
connected to the Data Cal 2000 and selecting Power Of f(P) when the pull
down menu appears or by selecting an instrument that is connected to
the Data Cal 2000 and then using the alt/P key combination. The Power
Off function turns off the selected instrument. If you select Power Off, a
confirmation box appears. Click the OK button to proceed with clearing
all the data from the instrument.
Configuration Window
The Configuration window is accessible from the main program window
by clicking on the Config button. The Configuration window is password
protected. It includes four t abs, the P aramet er t ab, t he Dat abase tab, the
Sensor tab, and the Password tab, which allow you to do the following:
• Configure system parameters for the Data Cal 2000 in the
Parameter tab.
• Create a new database, import data, export data, and delete data in
the Database tab.
• View the factory defaults and update the user defaults for sensor
settings in the Sensor tab.
• Change the password in the Password tab.
To enter the Configuration window:
1. From the main window, click on the Config button located along
the top of the window.
77 • Configuration Window
Page 83

2. Enter the password and click OK. The factory set password is
“ABCDE” and is case sensitive. After cli cking OK, the Configuration
window appears.
Figure 48: Configuration Window
Parameter Tab
See “Setting Up the Configuration” on page 28 for a description of the
Parameter tab.
Configuration Window • 7 8
Page 84

Database Tab
1. From the Configuration window, click on the Database tab to view
it.
Figure 49: Database Tab
2. To create a new database that is a copy of the existing one, click
the Create button. A Save As dialog box will appear and prompt
you for a file name. Enter the file name and click the Save button.
3. To import data into the database, click the Import button. An Open
dialog box will appear and prompt you for the file name of the file
you wish to import. It must be an MDB (Microsoft Access
Database) type of file. Generally, this is a file that was exported
from the Data Cal 2000 Software on another computer. Enter the
file name and click Open. The file will be imported.
4. To Export sel ected data, select MDB (Microsoft Access Dat abase)
or CSV (Comma Separated Value) as the file type to be exported
and select the instruments in the dat abase list you want to export. I f
you also want to remove these units from the current database,
79 • Configuration Window
Page 85

click the Remove selection box. When you have made all
selections, click the Export button. A Save As dialog box will
appear and prompt you for the file name. Enter the file name and
click the Save button.
5. Click the OK button to return to the main program window.
Sensor Tab
Figure 50: Sensor Tab
The values in the Factory Defaults window in the sensor tab cannot be
changed. They include the alarm points, autocalibration concentrations,
and zero follower settings. The values in the Factory Defaults window
can be loaded to an instrument if desired by using the Instrument/Module
Function menu as described in “Edit Function” on page 74.
The values in the User Defaults window in the sensor tab can be
customized for special applications. To change the user default settings:
1. From the Configuration window, click the Sensor tab.
2. Place the cursor in the fields you wish to change and update them.
3. RKI Instruments, Inc. does not recommend changing the Zero
Configuration Window • 8 0
Page 86

Follower setting from the factory default settings. Do not change
the Zero Follower settings.
4. To save any changes made in the User Defaults window, click the
OK button and you will return to the main program window.
To cancel any changes made in the User Defaults window, click the
Cancel button and you will return to the main program window.
Password Tab
The Data Cal 2000 Software password is case sensitive, so be car eful t o
type in the appropriate up per or lo wer case characters when e ntering the
password. The factory set password is “ABCDE”. Once the software is
installed on a computer, the password can be changed usin g the
Password Tab. To change the password:
1. From the Configuration window, click on the Password tab to view
it.
Figure 51: Password Tab
2. Type the new password in the New Password field.
3. Type the new password in the Confirm New Password field.
4. Click the OK button.
81 • Configuration Window
Page 87

5. A confirmation window appears. Click the Yes button. You will
return to the main program window.
Optimizing the Database
It is possible to optimize the database so that it requires a minimum
amount of computer memory. To optimize the database, press the “F12”
key while in the main program screen.
Spare Parts List
Table 3: Spare Parts List
Part Number Description
06-0200RK Cal gas fitting plug, DataCal 2000 module
06-0201RK Exhaust fitting plug, DataCal 2000 module
06-1248RK Polyurethane tubing, 5/16-inch OD x 3/16-inch ID
06-1254RK Polyurethane tubing, 7/16-inch OD x 5/16-inch ID, for
exhaust tube, 10 feet maximum
43-4167RK Fuse, 5 x 20 mm, 5A, 250V
47-1013RK Power cord
47-5006RK Downloading cable, DB-9 receptacle to DB-9 recept a-
cle, straight through, 6 foot
47-5046RK Data cable, DB-15 plug to DB-15 plug,
81-0013RK-05 Cylinder, methane, 50% volume in N2, 58 liter steel
81-0090RK-03 Three-gas calibration cylinder, 50% LEL CH
/12% O2/
4
50 ppm CO, 103 liter steel
81-0154RK-02 Four-gas calibration cylinder, 50% LEL CH
ppm CO/25 ppm H
S, 58 liter aluminum
2
/12% O2/50
4
81-1054RK Demand flow regulator, 50/103 liter
83-0008RK Data Cal 2000 software
Optimizing the Database • 82
Page 88

Table 3: Spare Parts List
Part Number Description
81-DM2001 Docking module for GX-2001
81-DM2003 Docking module for GX-2003
81-DM2009 Docking module for GX-2009
83 • Spare Parts Li st
 Loading...