

Page 1

04 Series Datalogging Program
Operator’s Manual
Part Number: 71-0525
Revision: P1
Released: 3/5/21
Find Quality Products Online at: sales@GlobalTestSupply.com
www.GlobalTestSupply.com
Page 2

Table of Contents
Chapter 1: Introduction . . . . . . . . . . . . . . . . . . . . . . . . . . . . . . . . . . . . . . . . . . . . . . . . . . 4
Overview . . . . . . . . . . . . . . . . . . . . . . . . . . . . . . . . . . . . . . . . . . . . . . . . . . . . . . . . 4
System Requirements . . . . . . . . . . . . . . . . . . . . . . . . . . . . . . . . . . . . . . . . . . . . . . 5
04 Series Data Logging Capacity . . . . . . . . . . . . . . . . . . . . . . . . . . . . . . . . . . . . . . 5
When Datalogging Memory Gets Full . . . . . . . . . . . . . . . . . . . . . . . . . . . . . . . . . . 5
Chapter 2: Setup . . . . . . . . . . . . . . . . . . . . . . . . . . . . . . . . . . . . . . . . . . . . . . . . . . . . . . . . 6
Installing the 04 Series Datalogging Program . . . . . . . . . . . . . . . . . . . . . . . . . . . . 6
Setting Up a Shared Database. . . . . . . . . . . . . . . . . . . . . . . . . . . . . . . . . . . . . . . . . 7
IrDA Downloading Cable . . . . . . . . . . . . . . . . . . . . . . . . . . . . . . . . . . . . . . . . . . . 9
Installing an IrDA Adapter Cable . . . . . . . . . . . . . . . . . . . . . . . . . . . . . . . 9
Windows® Infrared Operation Note . . . . . . . . . . . . . . . . . . . . . . . . . . . . . . 9
Chapter 3: Operation . . . . . . . . . . . . . . . . . . . . . . . . . . . . . . . . . . . . . . . . . . . . . . . . . . . 11
Launching the Program . . . . . . . . . . . . . . . . . . . . . . . . . . . . . . . . . . . . . . . . . . . . 11
Connecting an Instrument. . . . . . . . . . . . . . . . . . . . . . . . . . . . . . . . . . . . . . . . . . . 12
Downloading Data . . . . . . . . . . . . . . . . . . . . . . . . . . . . . . . . . . . . . . . . . . . . . . . . 13
Turning Off an Instrument . . . . . . . . . . . . . . . . . . . . . . . . . . . . . . . . . . . . . . . . . . 15
Chapter 4: Instrument Information Window . . . . . . . . . . . . . . . . . . . . . . . . . . . . . . . 16
Chapter 5: Data Window (Logged Data) . . . . . . . . . . . . . . . . . . . . . . . . . . . . . . . . . . . 17
Bump Test Data. . . . . . . . . . . . . . . . . . . . . . . . . . . . . . . . . . . . . . . . . . . . . . . . . . . 18
Calibration History . . . . . . . . . . . . . . . . . . . . . . . . . . . . . . . . . . . . . . . . . . . . . . . 20
Event Data . . . . . . . . . . . . . . . . . . . . . . . . . . . . . . . . . . . . . . . . . . . . . . . . . . . . . . 22
Interval Trend Data . . . . . . . . . . . . . . . . . . . . . . . . . . . . . . . . . . . . . . . . . . . . . . . . 24
Alarm Trend Data . . . . . . . . . . . . . . . . . . . . . . . . . . . . . . . . . . . . . . . . . . . . . . . . 29
Deleting Data in the Data Window. . . . . . . . . . . . . . . . . . . . . . . . . . . . . . . . . . . . 32
Changing the Delete Password . . . . . . . . . . . . . . . . . . . . . . . . . . . . . . . . . . . . . . 33
Chapter 6: Last Calibration Window . . . . . . . . . . . . . . . . . . . . . . . . . . . . . . . . . . . . . . 35
Need Calibration/Need Bump Test View . . . . . . . . . . . . . . . . . . . . . . . . . . . . . . . 35
Calibration Date/Bump Test Date View . . . . . . . . . . . . . . . . . . . . . . . . . . . . . . . . 37
Calibration Record/Bump Test Record View . . . . . . . . . . . . . . . . . . . . . . . . . . . . 38
Find Quality Products Online at: sales@GlobalTestSupply.com
www.GlobalTestSupply.com
Page 3

Deleting Last Calibration Data . . . . . . . . . . . . . . . . . . . . . . . . . . . . . . . . . . . . . . . 39
Chapter 7: Set Window (Instrument Parameters). . . . . . . . . . . . . . . . . . . . . . . . . . . . 41
Changing Instrument Parameters . . . . . . . . . . . . . . . . . . . . . . . . . . . . . . . . . . . . . 41
Changing User and Station IDs . . . . . . . . . . . . . . . . . . . . . . . . . . . . . . . . . . . . . . 43
Chapter 8: Set Window (Program Appearance) . . . . . . . . . . . . . . . . . . . . . . . . . . . . . 49
Changing the Font. . . . . . . . . . . . . . . . . . . . . . . . . . . . . . . . . . . . . . . . . . . . . . . . . 50
Changing Graph Colors . . . . . . . . . . . . . . . . . . . . . . . . . . . . . . . . . . . . . . . . . . . . 51
Chapter 9: Spare Parts List . . . . . . . . . . . . . . . . . . . . . . . . . . . . . . . . . . . . . . . . . . . . . 53
CAUTION: Read and understand this manual before using the 04 Series Datalogging
Program. Also read and understand the 04 Series Operator’s Manual included
with the 04 Series portable gas detection unit.
Find Quality Products Online at: sales@GlobalTestSupply.com
www.GlobalTestSupply.com
Page 4

Chapter 1: Introduction
Overview
The 04 Series Datalogging Program downloads stored data from the 04 Series to a Windowsbased PC. Data can be viewed, saved, or printed using your computer and the 04 Series
Datalogging Program.
The purpose of this manual is to explain how to use and set up the 04 Series Datalogging
Program. You will learn how to:
• install and launch the software
• install the downloading cable (if needed)
• access and store data in a shared database
• download data from the 04 Series
• view, print, and save data
• change data logging parameters
• create user and station IDs
• change the appearance of the program screens
• change the color of graphed readings
Before you get started, be sure to review the system requirements in the next section.
CAUTION: The 04 Series detects oxygen deficiency and elevated levels of oxygen, carbon
monoxide, hydrogen sulfide, or other toxic gases all of which can be dangerous
or life threatening. When using the 04 Series, you must follow the instructions
and warnings in the 04 Series Operator’s Manual to assure proper and safe
operation of the unit and to minimize the risk of personal injury.
CAUTION: The operator of this instrument is advised that if the equipment is used in a
manner not specified in this manual, the protection provided by the equipment
may be impaired.
4 • Chapter 1: Introduction
Find Quality Products Online at: sales@GlobalTestSupply.com
www.GlobalTestSupply.com
Page 5

System Requirements
To use the 04 Series Datalogging Program, your personal computer must meet the following
requirements:
• Operating Systems: Windows® 7, Windows® 8, or Windows® 10
• Processor: IBM® compatible PC running Pentium® 2 or higher.
• Memory: 32 MB RAM minimum
• Available Hard Disk Space: 32 MB minimum
• Infrared port or USB port and a USB/IrDA adapter cable
04 Series Data Logging Capacity
Table 1 below lists the 04 Series’ data logging capacity for each interval trend time setting
assuming no alarms or other events. See pg. 41 to change the interval trend time.
Table 1: 04 Series Data Logging Capacity
Interval Trend Time Data Logging Hours
10 seconds 10 hours
20 seconds 20 hours
30 seconds 30 hours
60 seconds 60 hours
180 seconds (3 minutes) 180 hours
300 seconds (5 minutes) 300 hours
600 seconds (10 minutes) 600 hours
When Datalogging Memory Gets Full
When the instrument’s data logging memory becomes full, it begins to overwrite the oldest
interval trend, alarm trend, event, and calibration data with new data.
Chapter 1: Introduction • 5
Find Quality Products Online at: sales@GlobalTestSupply.com
www.GlobalTestSupply.com
Page 6

Chapter 2: Setup
Installing the 04 Series Datalogging Program
1. Launch Windows®.
2. Exit from all applications and open windows.
4. Click on the Download tab.
5. Click the 04 Series Datalogging Program link.
6. A .zip file will begin to download. Select whether you want to open or save the .zip file.
7. Extract the contents of the .zip file.
8. Double click the setup.exe file.
9. Follow the on-screen instructions in the InstallShield Wizard Window to install the
program.
10. If the InstallShield Wizard finds versions of Windows® files on your computer newer
than those in the downloaded .zip file, it will ask you if you want to keep these newer
files. Click Yes .
11. When the InstallShield Wizard indicates that installation is complete, click the Finish
button.
6 • Chapter 2: Setup
Find Quality Products Online at: sales@GlobalTestSupply.com
www.GlobalTestSupply.com
Page 7

Setting Up a Shared Database
Figure 1: GP04.ini File Found on C Drive
By default, the Datalogging Program stores its database on the computer’s hard drive. In a
company with multiple computers, each computer’s database is independent of the others
which means data cannot be shared.
However, it’s possible to map each computer to a shared database on a network. All
computers can then add data to and view data from the same database.
NOTE: Only one computer can access the shared database at once. If one computer is using
the database and another computer tries to access the same database, that second
computer displays an error at program launch.
1. Note the shared database location’s file path. The location must be somewhere that all
computers can access. This section will use a shared Engineering Drive as an example.
2. If the Datalogging Program hasn’t been launched on the computer yet, launch and close
the program.
3. Search your C drive for “GP04.ini”.
4. Double click the GP04.ini file and open it in Notepad.
Chapter 2: Setup • 7
Find Quality Products Online at: sales@GlobalTestSupply.com
www.GlobalTestSupply.com
Page 8

Figure 2: GP04.ini File with Original Path
file
Old
path
Figure 3: GP04.ini File with New Path
file
New
path
5. Scroll down to the very last line, called DataLocation. An example of a local, unshared
file path is shown below.
6. Replace the local, unshared path with the shared path. In the example below, “N:” is the
shared Engineering Drive.
8 • Chapter 2: Setup
Find Quality Products Online at: sales@GlobalTestSupply.com
www.GlobalTestSupply.com
Page 9

7. Save the file and reopen the Datalogging Program.
8. When you launch the program again, a database is created in the specified location.
9. Repeat step 2 - step 7 for all computers that need access to the shared database.
IrDA Downloading Cable
The instrument uses an on-board infrared port to communicate with a computer. The port
complies with IrDA 1.1 protocol standards.
NOTE: If your computer has a built-in infrared port that complies with IrDA 1.1 protocol,
you do not need an adapter cable to download data.
If your computer does not have an infrared port, you will need to install an IrDA 1.1
compliant IrDA/USB adapter cable on your computer. See pg. 53 for the RKI part number.
Installing an IrDA Adapter Cable
NOTE: Do not plug the IrDA/USB adapter cable into your computer before installing the
driver.
Follow the manufacturer’s instructions for installing the cable on your computer. If you do not
have instructions from the cable manufacturer for installing your cable, see your Windows
documentation. In general, you must go to the Control Panel and use the Add Hardware
Wizard to install the cable drivers. RKI makes no warranty for the operation or compatibility
of the drivers with any particular device.
Windows® Infrared Operation Note
Before attempting to use the Datalogging Program with an IrDA adapter cable, you must
confirm or change a setting in the Infrared Configuration window.
NOTE: If you have a Windows 7 computer, the Infrared Configuration window may not
appear. If the Infrared Configuration window does not appear, disregard the
directions below.
1. Click Start on the Windows® Icon Tray.
2. If Control Panel is available to select in the Start menu, select it.
If Control Panel is not selectable in the Start menu but Settings is, select Settings, then
select Control Panel.
Chapter 2: Setup • 9
Find Quality Products Online at: sales@GlobalTestSupply.com
www.GlobalTestSupply.com
Page 10

Figure 4: Image Transfer Tab
Deselect
3. If the Control Panel is viewed by category, open the Hardware and Sound folder then
click “Send or Receive a File” under the Infrared section.
If the Control Panel is viewed by icon, click the Infrared icon.
4. Click on the Image Transfer tab.
5. Deselect the selection box for “Allow digital cameras to use infrared to transfer images
directly to my computer”.
6. Click OK.
7. Close the Control Panel window.
10 • Chapter 2: Setup
Find Quality Products Online at: sales@GlobalTestSupply.com
www.GlobalTestSupply.com
Page 11

Chapter 3: Operation
Figure 5: The Download Window
Launching the Program
1. Double click the 04 Series shortcut on the computer desktop or navigate to the 04 Series
program using the Start menu.
2. The program launches and the Download window appears.
Chapter 3: Operation • 11
Find Quality Products Online at: sales@GlobalTestSupply.com
www.GlobalTestSupply.com
Page 12

Connecting an Instrument
Cable's Infrared Port
To Comput er
USB Port
04 Series
Sensor Diffusi on Port
Infrared Port
Figure 6: Aligning IrDA Ports
Figure 7: Connection Message
1. Launch the 04 Series Datalogging Program.
2. Place the instrument’s infrared port 1-2 inches away from the computer or cable infrared
port and align the two ports. The 04 Series’ infrared port is at the top of the instrument.
3. Press and hold the instrument’s POWER MODE button. Release it when you hear a beep.
4. When the program establishes a connection with the instrument, the Connect light turns
green and “Connection Successful.” displays.
12 • Chapter 3: Operation
Find Quality Products Online at: sales@GlobalTestSupply.com
www.GlobalTestSupply.com
Page 13

Downloading Data from an Instrument
Figure 8: Automatic Download Selection Box
Figure 9: Automatic Download Message
Automatic Downloading
1. Select Automatic Download.
2. A caution message appears. The download commands are not active when Automatic
Download is selected. However, if an 04 Series is connected when you select the
Automatic Download box, the download commands remain active until that instrument
is disconnected.
3. To automatically clear instrument data after an automatic download, select Automatic
Data Removal. Automatic Data Removal is only selectable if the Automatic
Download box is selected.
4. Connect an instrument as described on pg. 12.
5. A download begins automatically after the 04 Series successfully connects.
6. The instrument automatically turns off after the data is downloaded.
Chapter 3: Operation • 13
Find Quality Products Online at: sales@GlobalTestSupply.com
www.GlobalTestSupply.com
Page 14

Manual Downloading
Figure 10: Download
Commands
Figure 11: Download Messages & Download Commands
Download messages Instrument ID
1. To download logged data and instrument
information from the instrument, click Complete
Download.
2. To download instrument information only, click
Instrument Information.
3. To download logged data only, click Download
Logger Data. Download Logger Data becomes
selectable only after doing a Complete Download or
Instrument Information Download.
4. While the data is downloading, the message area of
the Download window indicates program actions,
communication or downloading problems, and what type of information has been
downloaded.
5. To delete all logged data in the instrument, click Clear Logger Data. This will not delete
instrument parameters such as serial number, alarm settings, or auto calibration settings.
WARNING: If you click Clear Logger Data, all logged data is erased in the instrument,
but not in your computer’s memory. So it’s advisable that you download the
instrument data before clicking Clear Logger Data.
14 • Chapter 3: Operation
Find Quality Products Online at: sales@GlobalTestSupply.com
www.GlobalTestSupply.com
Page 15

Turning Off an Instrument
1. Click Download if you are not already in the Download window.
2. Click Power Off and then Ye s in the confirmation window. The instrument shuts off.
3. Click Exit in the bottom right corner of the program and Ye s in the confirmation window
to exit the program.
NOTE: If you shut down the Datalogging Program without turning off the instrument, the
instrument goes into alarm after 3 minutes to indicate that it is not connected to a
program. Reset the alarm by either a) starting up the Datalogging Program and
establishing a connection or b) turning the instrument off using POWER MODE.
Chapter 3: Operation • 15
Find Quality Products Online at: sales@GlobalTestSupply.com
www.GlobalTestSupply.com
Page 16

Chapter 4: Instrument Information Window
Figure 12: Instrument Information Window
1. Connect an instrument and manually perform a Complete Download or Instrument
Information download as described in “Connecting an Instrument” on page 12 and
“Manual Downloading” on page 14.
2. Click Instrument Information on the right side of the program window.
3. The serial number, station ID, user ID, calibration and bump test history, and alarm points
for the connected instrument are visible.
4. If the instrument is turned off after being connected to the program, the information in the
Instrument Information window disappears.
16 • Chapter 4: Instrument Information Window
Find Quality Products Online at: sales@GlobalTestSupply.com
www.GlobalTestSupply.com
Page 17

Chapter 5: Data Window (Logged Data)
Figure 13: Data Window
The instrument logs five types of data files: bump test data, calibration history, event data,
interval trend data, and alarm trend data.
You can view, print, export (save to a file), and delete each type of data. Deleting data is
password protected and is described on pg. 32.
NOTE: If the Datalogging Program database is on the user’s computer (default setting),
data only appears for instruments downloaded to that computer. If the database is
on a shared network location, data appears for all instruments downloaded to that
database. See pg. 7 for more instruction.
1. Click Data on the right side of the program window.
2. Organize the data using the selection boxes in the lower left corner of the window. The
Find Quality Products Online at: sales@GlobalTestSupply.com
data may be organized by one or more of the following parameters: serial number, station
ID, or user ID. If none of the boxes are selected, then the data is organized by date.
NOTE: In the examples that follow, data is organized by serial number. Your Data Window
may appear slightly different.
Chapter 5: Data Window (Logged Data) • 17
www.GlobalTestSupply.com
Page 18

Bump Test Data
Figure 14: Data Window - Selecting Bump Test Files
Click to show bump test file(s) Bump test file(s)
The instrument saves information for up to 100 of the most recent bump tests and calibrations
combined. This bump test history is retrieved using either Complete Download or Download
Logger Data.
All downloaded bump test data for all downloaded instruments is available in the Bump Test
folders in the Data Window. The Bump Test folder is located in an untitled folder for each
instrument. The bump test information available here is more comprehensive than that in the
Last Calibration window.
1. Click Data at the right side of the program window.
Find Quality Products Online at: sales@GlobalTestSupply.com
2. Expand the folders for the desired serial number by double-clicking or using the (+)
18 • Chapter 5: Data Window (Logged Data)
button next to each folder.
3. Open the untitled folder by double-clicking it or using the (+) button.
4. Click the Bump Test folder. The Bump Test file(s) for that instrument appear in the top
right frame. If multiple Station IDs or User IDs are used for an instrument, then more than
one Bump Test file appears.
The date/time displayed on each line corresponds to the date/time of the instrument
download and not the date/time of a bump test.
www.GlobalTestSupply.com
Page 19
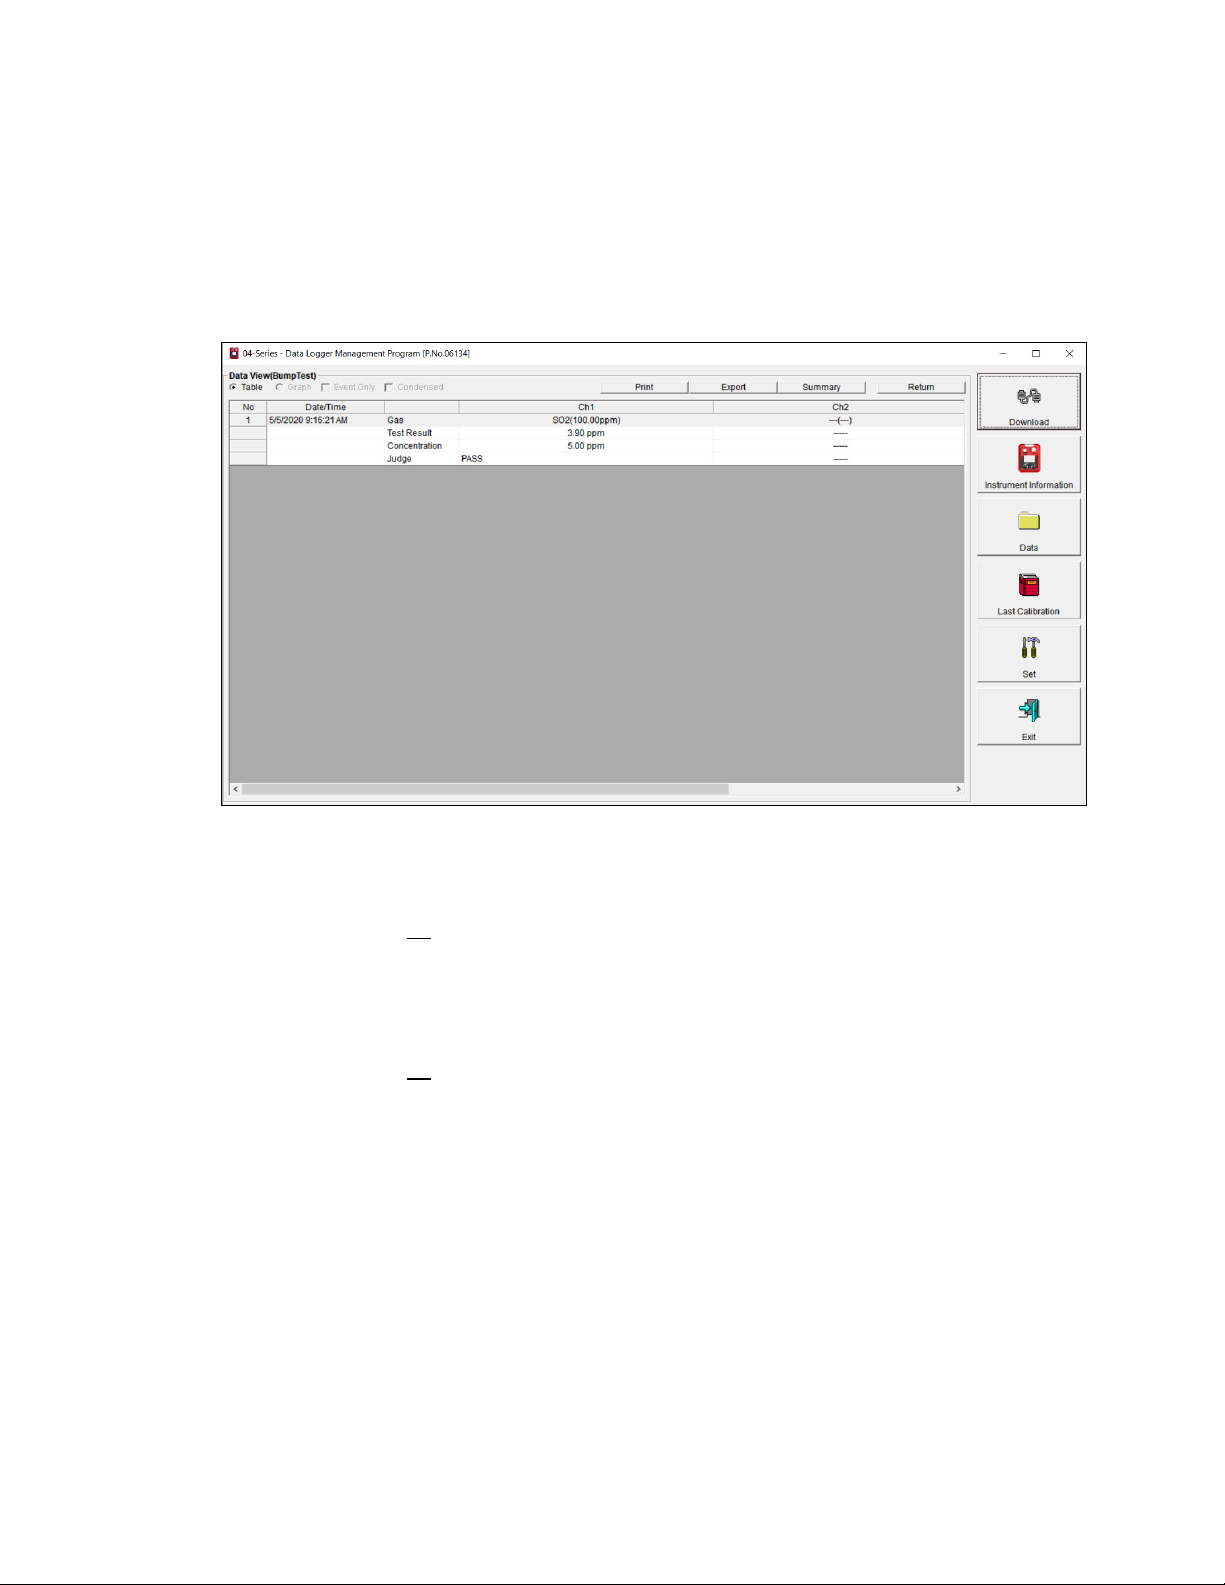
5. Click a file to select it. The first two saved bump tests are shown in the bottom right
Figure 15: Data View, Bump Test
frame along with the total number of saved bump tests if it is more than two.
Each saved bump test shows the date/time of the bump test, the gas, the test result, the gas
concentration, and the bump test result.
6. To view all data in the Bump Test file, double click the Bump Test file or click View
Data.
Printing Data
1. While viewing all data in one Bump Test file, Click Print.
2. Select a printer in the window that appears and click OK.
Exporting Data
1. While viewing all data in one Bump Test file, Click Export.
2. Specify the filename and file location. The default file type is “.csv” (comma-separated
values).
3. Click Save.
Chapter 5: Data Window (Logged Data) • 19
Find Quality Products Online at: sales@GlobalTestSupply.com
www.GlobalTestSupply.com
Page 20

Calibration History
Figure 16: Data Window - Selecting Calibration History Files
Click to show calibration file(s) Calibration file(s)
The instrument saves information for up to 100 of the most recent bump tests and calibrations
combined. This calibration history is retrieved using either Complete Download or
Download Logger Data.
All downloaded calibration information for all downloaded instruments is available in the
Calibration History folders in the Data Window. This information is saved in a Calibration
History Folder that is located in an untitled folder for each instrument. The calibration history
files are differentiated by instrument. The calibration information available here is more
comprehensive than that in the Last Calibration Window.
1. Click Data along the right side of the program window.
2. Expand the folders for the desired serial number by double-clicking or using the (+)
20 • Chapter 5: Data Window (Logged Data)
Find Quality Products Online at: sales@GlobalTestSupply.com
button next to each folder.
3. Open the untitled folder by double-clicking it or using the (+) button.
4. Click the Calibration History folder. The Calibration Histories file(s) for that instrument
appear in the top right frame. If multiple Station IDs or User IDs are used for an
instrument, then more than one Calibration Histories file appears.
The date/time displayed on each line corresponds to the date/time of the instrument
download and not the date/time of a calibration.
www.GlobalTestSupply.com
Page 21

5. Click the file to select it. The first two saved calibrations are shown in the bottom right
Figure 17: Data View, Calibration History
frame along with the total number of saved calibrations if it is more than two.
Each saved calibration shows the date/time of calibration, the gas, the concentration
before calibration, and the concentration after calibration. If a calibration failed, dashes
appear in the After column instead of a gas concentration. If a channel was not included
in calibration, dashes appear in the Before and After columns.
6. To view all data in the Calibration Histories file, double click the Calibration Histories
file or click View Data. Calibration Histories files can only be viewed in table format.
Printing Data
1. While viewing all data in one Calibration Histories file, click Print.
2. Select a printer in the window that appears and click OK.
Exporting Data
1. While viewing all data in one Calibration Histories file, click Export.
2. Specify the filename and file location. The default file type is “.csv” (comma-separated
values).
3. Click Save.
Chapter 5: Data Window (Logged Data) • 21
Find Quality Products Online at: sales@GlobalTestSupply.com
www.GlobalTestSupply.com
Page 22
Event Data
Figure 18: Data Window - Selecting Event Data Files
Click to show alarm event file(s) Alarm event file(s)
The instrument saves the 100 most recent alarm events and the 100 most recent trouble events.
Alarm event files save the time, instrument channel, and alarm type of every gas alarm event
that occurs on a particular instrument. Warning, Alarm, Alarm H, STEL, TWA, and overscale
events are saved.
Trouble event files note the time and type of failure. Dead battery alarms and sensor failures
are examples of trouble events.
1. Click Data along the right side of the program window.
Find Quality Products Online at: sales@GlobalTestSupply.com
22 • Chapter 5: Data Window (Logged Data)
2. Expand the folders for the desired serial number by double-clicking or using the (+)
button next to each folder.
3. Open the untitled folder by double-clicking it or using the (+) button.
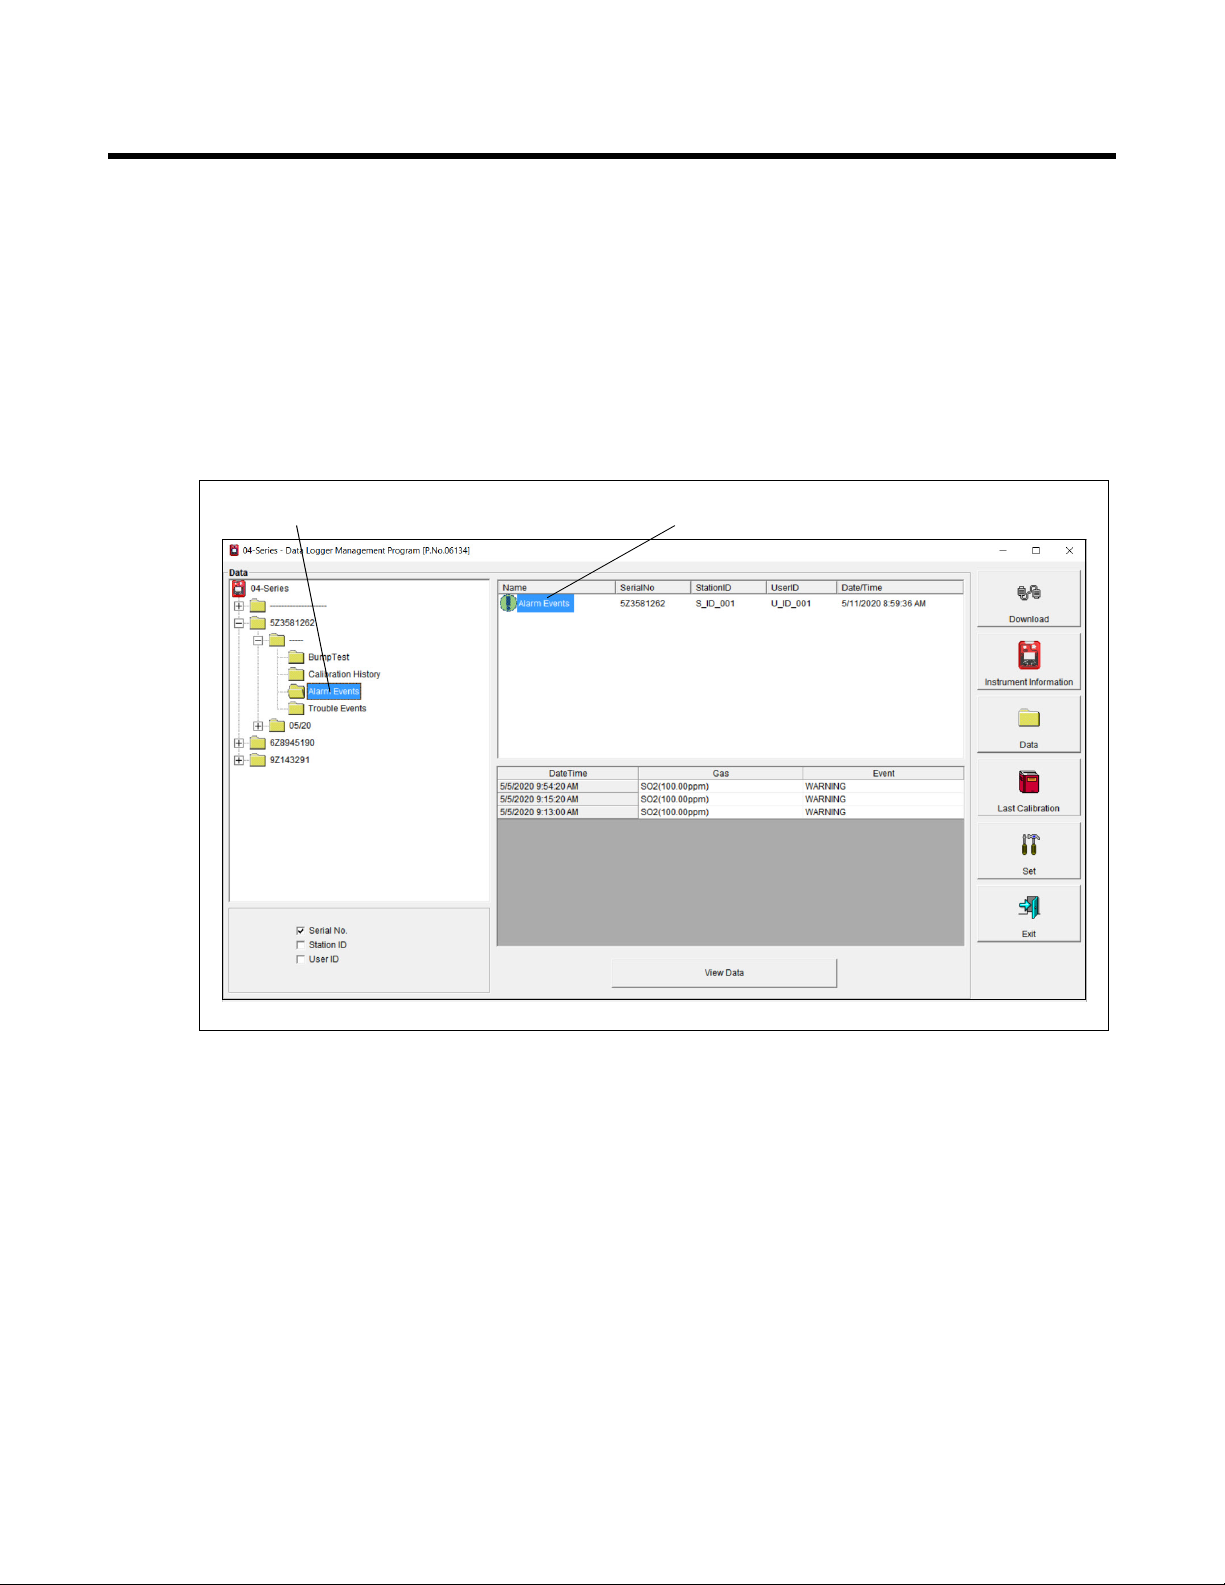
4. Click the Alarm Events or Trouble Events folder. The Alarm Events or Trouble Events
file(s) for that instrument appear in the top right frame. If multiple Station IDs or User
IDs are used for an instrument, then more than one Alarm Events or Trouble Events file
appear.
The date/time displayed on each line corresponds to the date/time of the instrument
download and not a date/time of an alarm or trouble event.
www.GlobalTestSupply.com
Page 23
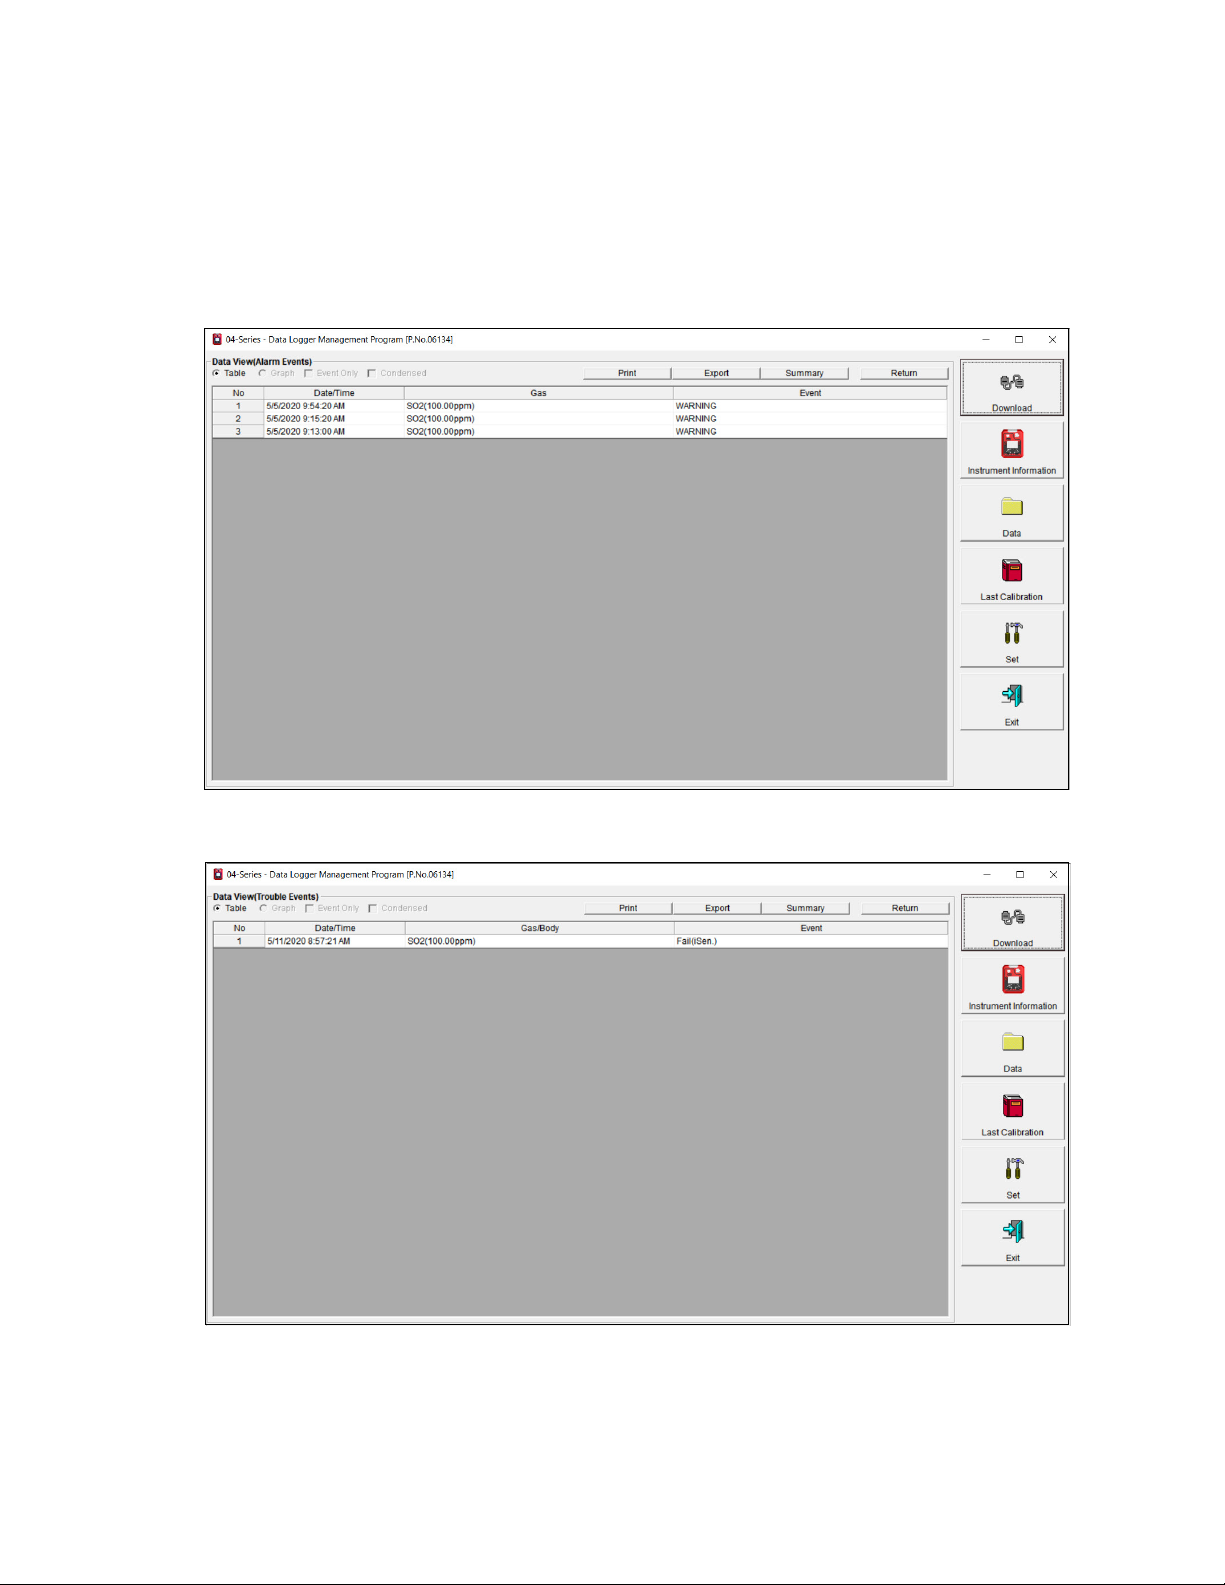
5. Click the desired event file to select it. An event list appears in the bottom right frame
Figure 19: Data View - Alarm Events
Figure 20: Data View - Trouble Events
with the date, time, channel, and event type for the first eight saved events in the selected
file. If more than eight events are saved, the first eight events are shown and the total
number of events in the file is shown at the bottom of the list.
6. To view all data in the Alarm Events or Trouble Events file, double click the file or click
View Data. Event files can only be viewed in table format.
7. Click Summary to show instrument information above the event table.
Chapter 5: Data Window (Logged Data) • 23
Find Quality Products Online at: sales@GlobalTestSupply.com
www.GlobalTestSupply.com
Page 24

Printing Data
1. While viewing all data in one Alarm Events or Trouble Events file, click Print.
2. Select a printer in the window that appears and click OK.
Exporting Data
1. While viewing all data in one Alarm Events or Trouble Events file, click Export.
2. Specify the filename and file location. The default file type is “.csv” (comma-separated
values).
3. Click Save.
Interval Trend Data
Average gas concentrations over the user-defined interval trend time are logged in the interval
trend data files. Events such as gas alarms or sensor failures are saved in the interval trend
data file when they occur. The interval trend time can be changed in the Set window (see pg.
41). The table below outlines how many hours of datalogging are available per interval trend
time.
Interval Time Data Logging Time
10 seconds 10 hours
20 seconds 20 hours
30 seconds 30 hours
1 minute 60 hours
3 minutes 180 hours
5 minutes 300 hours
10 minutes 600 hours
Each interval trend file has data for 1 operating session (turn on to turn off). The serial
number, user ID, and station ID stored in the instrument at turn on are used for that interval
trend file.
The interval trend file does not indicate when a user ID is changed during operation. When the
station ID of the instrument is changed during operation, is it shown as an event in the interval
trend file.
Data can always be viewed in table format. If more than 5 scheduled data points were saved,
the data can be viewed in graph format. Events do not count toward the 5 needed data points
for a graph.
24 • Chapter 5: Data Window (Logged Data)
Find Quality Products Online at: sales@GlobalTestSupply.com
www.GlobalTestSupply.com
Page 25
1. Click Data along the right side of the program window.
Figure 21: Data Window - Selecting Interval Trend Files
Click to show interval trend file(s) Interval trend file(s)
2. Expand the folders for the desired serial number by double-clicking or using the (+)
button next to each folder.
3. Open the dated folder (month/year) whose contents you want to see by double-clicking it
or using the (+) button.
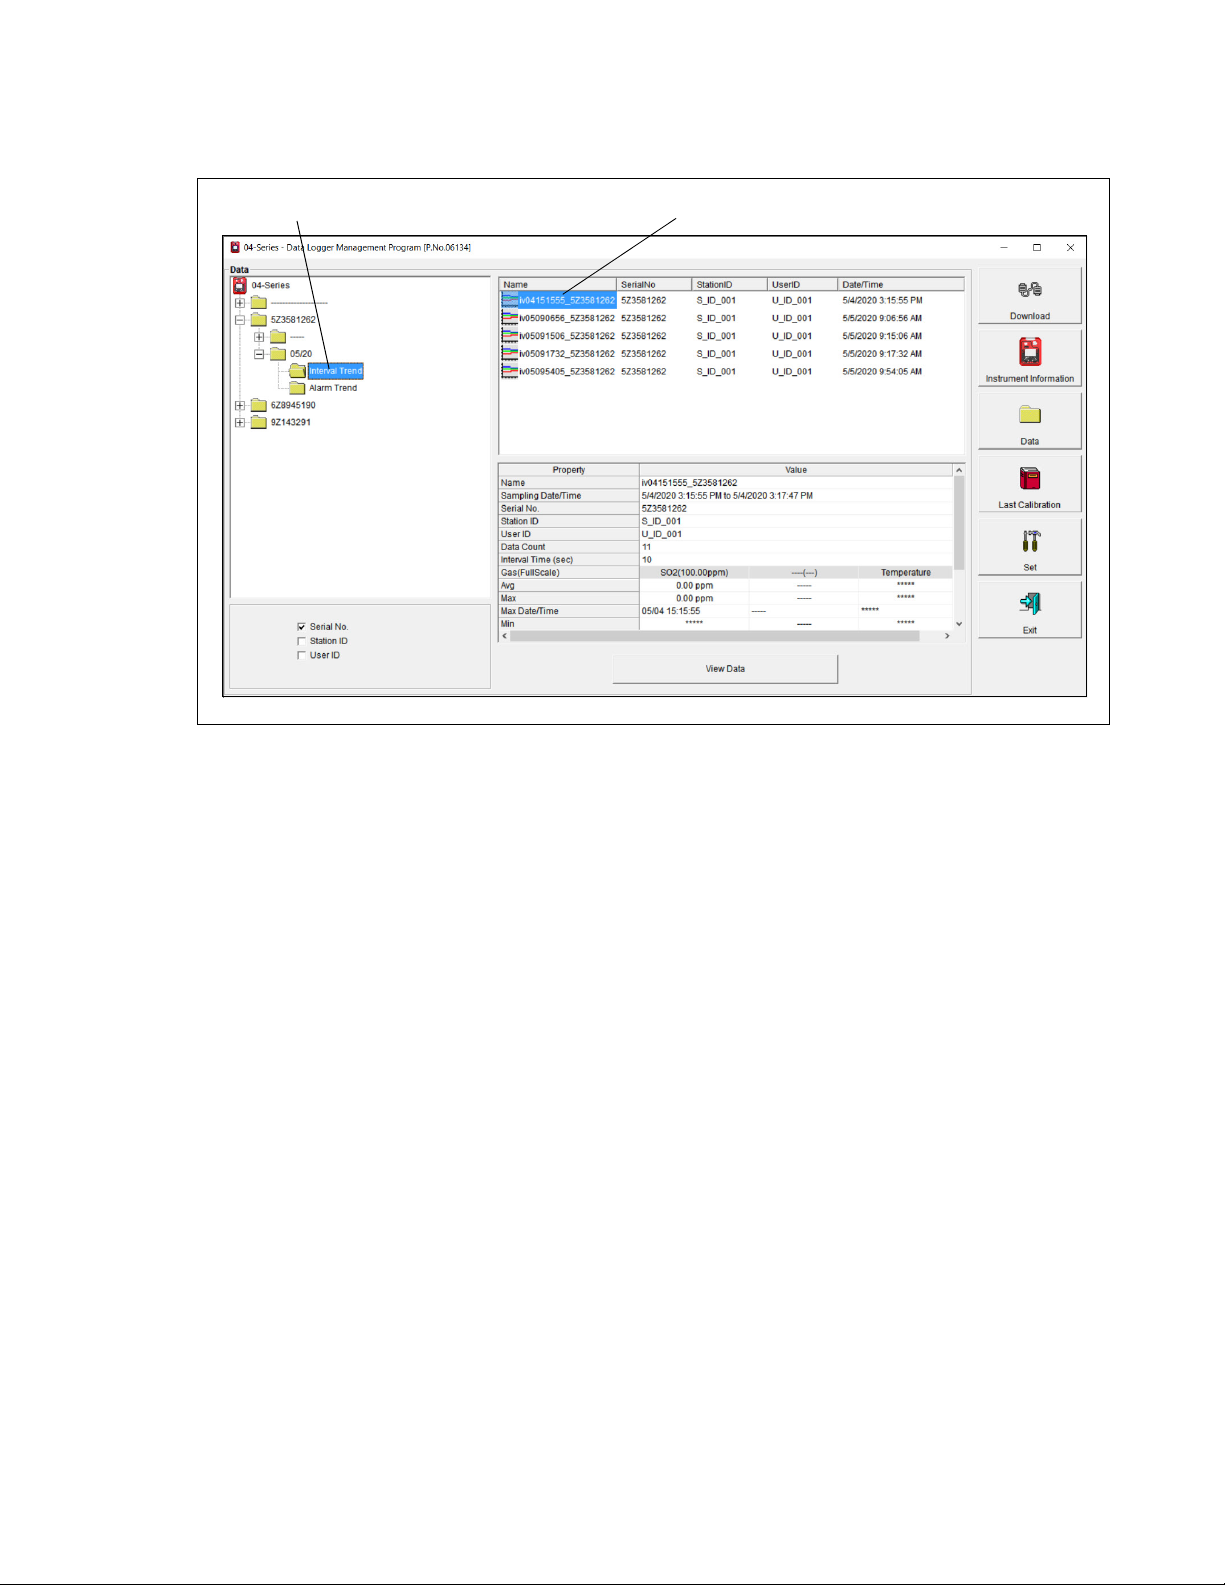
4. Click the Interval Trend folder. The Interval Trend file(s) for that instrument appear in
the top right frame.
The date/time indicated on each line is the date/time that data recording started.
5. Click one of the interval trend data file names. A summary appears in the bottom right
frame with instrument and alarm setting information.
6. If you want to view, graph, print, or export the interval trend data, double-click the
filename or click the View Data button at the bottom of the window. The Interval Trend
Data View window appears.
7. Interval trend data can be viewed in either table or graph format by selecting the Tabl e or
Graph selection buttons.
Chapter 5: Data Window (Logged Data) • 25
Find Quality Products Online at: sales@GlobalTestSupply.com
www.GlobalTestSupply.com
Page 26

Table Format
Figure 22: Interval Trend Data in Table Format
1. To view the data in table format, click the Ta ble selection button in the Data View
window.
2. Interval trend data is shown as the average gas readings over the user defined interval
trend time. So if the data logging session started at 4:13:38 PM and the interval time is set
to 1 minute, then the readings logged at 4:14:38 PM are the average reading for each
channel over that one minute period.
3. Events are displayed in colored boxes. An event always displays even if it didn’t occur
during a scheduled log time. Events include:
• Gas alarms (Warning, Alarm, Alarm H, STEL, TWA)
• Trouble conditions (sensor failure, low battery, etc.)
• “Normal” indication after alarm condition is reset
• Station ID changed during operation
4. Click Summary to show instrument information above the interval trend data table.
5. Select Event Only to view only events.
6. Select Condensed to view condensed interval trend data.
• The first and last scheduled data points in the session are shown.
• If there are more than two consecutive data points with the same readings for all
channels, only the first and last of these consecutive data points are shown.
• All events, such as gas alarms or sensor failures, are shown.
• For any event, the data point before and after the event is always shown.
26 • Chapter 5: Data Window (Logged Data)
Find Quality Products Online at: sales@GlobalTestSupply.com
www.GlobalTestSupply.com
Page 27

7. Click on an alarm event to view the alarm trend data file. To return to the interval trend
Figure 23: Data Displayed by Alarm Trend Cursor Symbol
data file, click Return or click the “X” in the upper right corner of the new window to
close the window.
Chapter 5: Data Window (Logged Data) • 27
Find Quality Products Online at: sales@GlobalTestSupply.com
www.GlobalTestSupply.com
Page 28

Figure 24: Interval Trend Data in Graph Format
Graph Format
1. To view the data in graph format, click Graph in the Data View window. Five or more
scheduled data points are required to display an interval trend data file in graph format.
NOTE: The data count shown in Figure 21 includes scheduled data points and events. A
data count above 5 does not guarantee enough scheduled data points for a graph.
2. Select or deselect gases to show on the graph.
3. Choose the zoom level. Zooming in shows greater detail relative to time.
4. Select Event to see indications for warning, alarm, start of calibration, or end of
calibration. Each indication is color coded to the gas color.
5. Select Cursor to view the gas reading and log time for the data point at the cursor
location. Use the left and right arrows on your keyboard to move the cursor across the
graph horizontally or click on a location to move the cursor to that location. Use the up
and down arrows on the keyboard to move the readings up or down on the screen.
6. Click Summary to show instrument information above the interval trend data graph.
Printing Data
1. While viewing an Interval Trend file in table or graph format, click Print.
2. Select a printer in the window that appears and click OK. Data displayed in Graph view
prints as a graph and data displayed in Table view prints as a table.
Exporting Data
1. While viewing an Interval Trend file in table or graph format, click Export.
28 • Chapter 5: Data Window (Logged Data)
Find Quality Products Online at: sales@GlobalTestSupply.com
www.GlobalTestSupply.com
Page 29

2. Specify the file name, file location, and file type. For Graph view, the export file type is
Figure 25: Data Window - Selecting Alarm Trend Files
Click to show alarm trend file(s) Alarm trend file(s)
“.bmp” (Windows bitmap). For Table view, the default file type is “.csv” (commaseparated values).
3. Click Save.
Alarm Trend Data
The instrument saves up to 8 files for the most recent gas alarm events. If 8 alarm trend files
are already saved, the newest alarm trend file overwrites the oldest. Alarm events must be
more than 15 minutes apart to trigger the saving of a new alarm trend file. Alarm trend files
are separate from the interval trend data files.
The alarm event gas readings are highlighted in red. Peak (minimum for oxygen) readings at 5
second intervals are shown for 30 minutes before and 30 minutes after the alarm event. If the
instrument was not on for 30 minutes before the alarm event occurs, the missing data is left
blank. If the instrument is turned off less than 30 minutes after an alarm event occurs, the data
file will only have logged data until the unit was turned off.
Alarm trend data can always be displayed in either table or graph format.
1. Click Data along the right side of the program window.
Find Quality Products Online at: sales@GlobalTestSupply.com
button next to each folder.
Chapter 5: Data Window (Logged Data) • 29
www.GlobalTestSupply.com
2. Expand the folders for the desired serial number by double-clicking or using the (+)
Page 30

Figure 26: Alarm Trend Data in Table Format
3. Open the dated folder (month/year) whose contents you want to see by double-clicking it
or using the (+) button.
4. Click the Alarm Trend folder. The Alarm Trend file(s) for that instrument appear in the
top right frame.
The date/time indicated on each line is the date/time that data recording started.
5. Click one of the alarm trend data file names. A summary appears in the bottom right
frame with instrument and alarm setting information.
6. If you want to view, graph, print, or export the alarm trend data, double-click the filename
or click the View Data button at the bottom of the window. The Alarm Trend Data View
window appears.
7. Alarm trend data can be viewed in either table or graph format by selecting Ta bl e or
Graph.
Table Format
1. To view the data in table format, click the Ta ble selection button in the Data View
window.
2. The log times are shown along with the peak (minimum for oxygen) gas readings for the
previous five seconds.
3. The gas readings that triggered the saving of the alarm trend file are highlighted in red
and are the instantaneous readings at that time.
4. Click Summary to show instrument information above the alarm trend data table.
30 • Chapter 5: Data Window (Logged Data)
Find Quality Products Online at: sales@GlobalTestSupply.com
www.GlobalTestSupply.com
Page 31

Graph Format
Figure 27: Alarm Trend Data in Graph Format
1. To view the data in graph format, click the Graph button in the Data View window. An
alarm trend file can always be graphed regardless of the number of logged points.
2. Select or deselect gases to show on the graph.
3. Choose the zoom level. Zooming in shows greater detail relative to time.
4. Select Event so see an indication for the alarm event that triggered the saving of the
alarm trend file.
5. Select Cursor to view the gas reading and log time for the data point at the cursor
location. Use the left and right arrows on your keyboard to move the cursor across the
graph horizontally or click on a location to move the cursor to that location. Use the up
and down arrows on the keyboard to move the readings up or down on the screen.
6. Click Summary to show instrument information above the alarm trend data graph.
Printing Data
1. While viewing an Alarm Trend file in table or graph format, click Print.
2. Select a printer in the window that appears and click OK. Data displayed in Graph view
prints as a graph and data displayed in Table view prints as a table.
Chapter 5: Data Window (Logged Data) • 31
Find Quality Products Online at: sales@GlobalTestSupply.com
www.GlobalTestSupply.com
Page 32

Exporting Data
Figure 28: Delete Box
Figure 29: Password Window
1. While viewing an Alarm Trend file in table or graph format, click Export.
2. Specify the file name, file location, and file type. For Graph view, the export file type is
“.bmp” (Windows bitmap). For Table view, the default file type is “.csv” (commaseparated values).
3. Click Save.
Deleting Data in the Data Window
1. Click Data on the right side of the program window.
2. Right click the folder or file you want to delete.
3. The Delete box appears.
4. Click Delete. The Password Window appears.
5. Enter the password and click Continue. The factory-set, case-sensitive password is rki.
See pg. 33 for instructions to change the password.
6. Click Ye s in the confirmation window to confirm that want to delete the folder or file.
32 • Chapter 5: Data Window (Logged Data)
Find Quality Products Online at: sales@GlobalTestSupply.com
www.GlobalTestSupply.com
Page 33

Changing the Delete Password
Figure 30: Delete Box
Figure 31: Password Window
Figure 32: Inputting Current Password
Figure 33: Inputting New Password
CAUTION: Changing the password requires use of the Delete box. Take care to avoid
accidentally deleting data.
1. Right-click a data folder, data file, or event file. The Delete box appears.
2. Click Delete. The Password Window appears.
3. Click Change Password. The Password Window asks you to input the current password.
4. Type the current password, then click Current password. The Password Window asks
you to input the new password.
Chapter 5: Data Window (Logged Data) • 33
Find Quality Products Online at: sales@GlobalTestSupply.com
www.GlobalTestSupply.com
Page 34

Figure 34: Confirming New Password
Figure 35: Confirming New Password
5. Type the new password and click New Password. The Password Window asks you to
input the new password again to confirm it.
6. Type the new password again, then click Confirm New Password.
7. Click OK when the program confirms that you have changed the password.
8. Close the Password Window by clicking the red “X” in the upper right corner of the
window.
34 • Chapter 5: Data Window (Logged Data)
Find Quality Products Online at: sales@GlobalTestSupply.com
www.GlobalTestSupply.com
Page 35

Chapter 6: Last Calibration Window
The Last Calibration Window stores the information for the most recent successful calibration
and for the most recent successful bump test for each downloaded instrument. Calibration data
is displayed in the top part of the screen. Bump test data is displayed in the bottom part of the
screen.
You can display the information three ways by using the Need Calibration/Need Bump Test,
Calibration Date/Bump Test Date, or Calibration Record/Bump Test Record selection
buttons. You can also print the information if you select the Need Calibration/Need Bump
Te st or Calibration Date/Bump Test Date view.
NOTE: If the Datalogging Program database is on the user’s computer (default setting),
data only appears for instruments downloaded to that computer. If the database is
on a shared network location, data appears for all instruments downloaded to that
database. See pg. 7 for more instruction.
Need Calibration/Need Bump Test View
Selecting this view shows the last calibration date, last bump test date, and the last download
date for the instruments that are due for calibration or bump testing.
The instruments that are due for calibration or bump testing (in the case of the Need
Calibration/Need Bump Test view, that will be all of them) will have their last calibration
date or last bump test date highlighted in red. The instruments that have not been downloaded
for more than 90 days will have their last download date highlighted in purple.
All user ID/station ID combinations for a particular serial number will appear as separate lines
but will all have the same last calibration and last bump test date. For example, an instrument
used with U_ID_001/S_ID_001 on one day and U_ID_002/S_ID_002 on another day will be
listed twice to show each of those ID combinations. The serial number, last calibration, last
bump test date, and last download date for each listing will be the same.
Chapter 6: Last Calibration Window • 35
Find Quality Products Online at: sales@GlobalTestSupply.com
www.GlobalTestSupply.com
Page 36

Figure 36: Last Calibration Window: Need Calibration View
Figure 37: Printer List Dialog Box
1. The Need Calibration/Need Bump Test view shows the following fields for both
calibration and bump test data:
• No.: Number assigned to downloaded instrument. The most recently downloaded
instrument is assigned “No. 1”.
• SerialNo: Instrument’s serial number
• UserID: The instrument’s user ID.
• StationID: The instrument’s station ID.
• Target Gases: Date of calibration or bump test for each gas in MM/DD/YYYY and
12-hour format.
• Last Downloaded: Date of last download in MM/DD/YYYY and 12-hour format.
2. To print a list of the instruments shown in the Need Calibration/Need Bump Test view
along with their user ID and last calibration date or last bump test date, click the
appropriate Print button (cal or bump section). A Printer List dialog box appears.
3. Select a printer and click OK to print the instrument list.
36 • Chapter 6: Last Calibration Window
Find Quality Products Online at: sales@GlobalTestSupply.com
www.GlobalTestSupply.com
Page 37

Calibration Date/Bump Test Date View
Figure 38: Last Calibration Window: Calibration Date View
Selecting this view shows the last calibration date, last bump test date, and the last download
date for all instruments in the program’s database.
The instruments that are due for calibration or bump testing will have their last calibration
date or last bump test date highlighted in red. The instruments that have not been downloaded
for more than 90 days will have their last download date highlighted in purple.
All user ID/station ID combinations for a particular serial number will appear as separate lines
but will all have the same last calibration and last bump test date. For example, an instrument
used with U_ID_001/S_ID_001 on one day and U_ID_002/S_ID_002 on another day will be
listed twice to show each of those ID combinations. The serial number, last calibration, last
bump test date, and last download date for each listing will be the same.
1. The Calibration Date/Bump Test Date view shows the following fields for both
calibration and bump test data:
• No.: Number assigned to downloaded instrument. The most recently downloaded
instrument is assigned “No. 1”.
• SerialNo: Instrument’s serial number
• UserID: The instrument’s user ID.
• StationID: The instrument’s station ID.
• Target Gases: Date of calibration or bump test for each gas in MM/DD/YYYY and
12-hour format.
• Last Downloaded: Date of last download in MM/DD/YYYY and 12-hour format.
Chapter 6: Last Calibration Window • 37
Find Quality Products Online at: sales@GlobalTestSupply.com
www.GlobalTestSupply.com
Page 38
2. To print a list of the instruments shown in the Calibration Date/Bump Test Date view
Figure 39: Printer List Dialog Box
Figure 40: Last Calibration Window: Calibration Record View
along with their user ID and last calibration date or last bump test date, click the
appropriate Print button (cal or bump section). A Printer List dialog box appears.
3. Select a printer and click OK to print the instrument list.
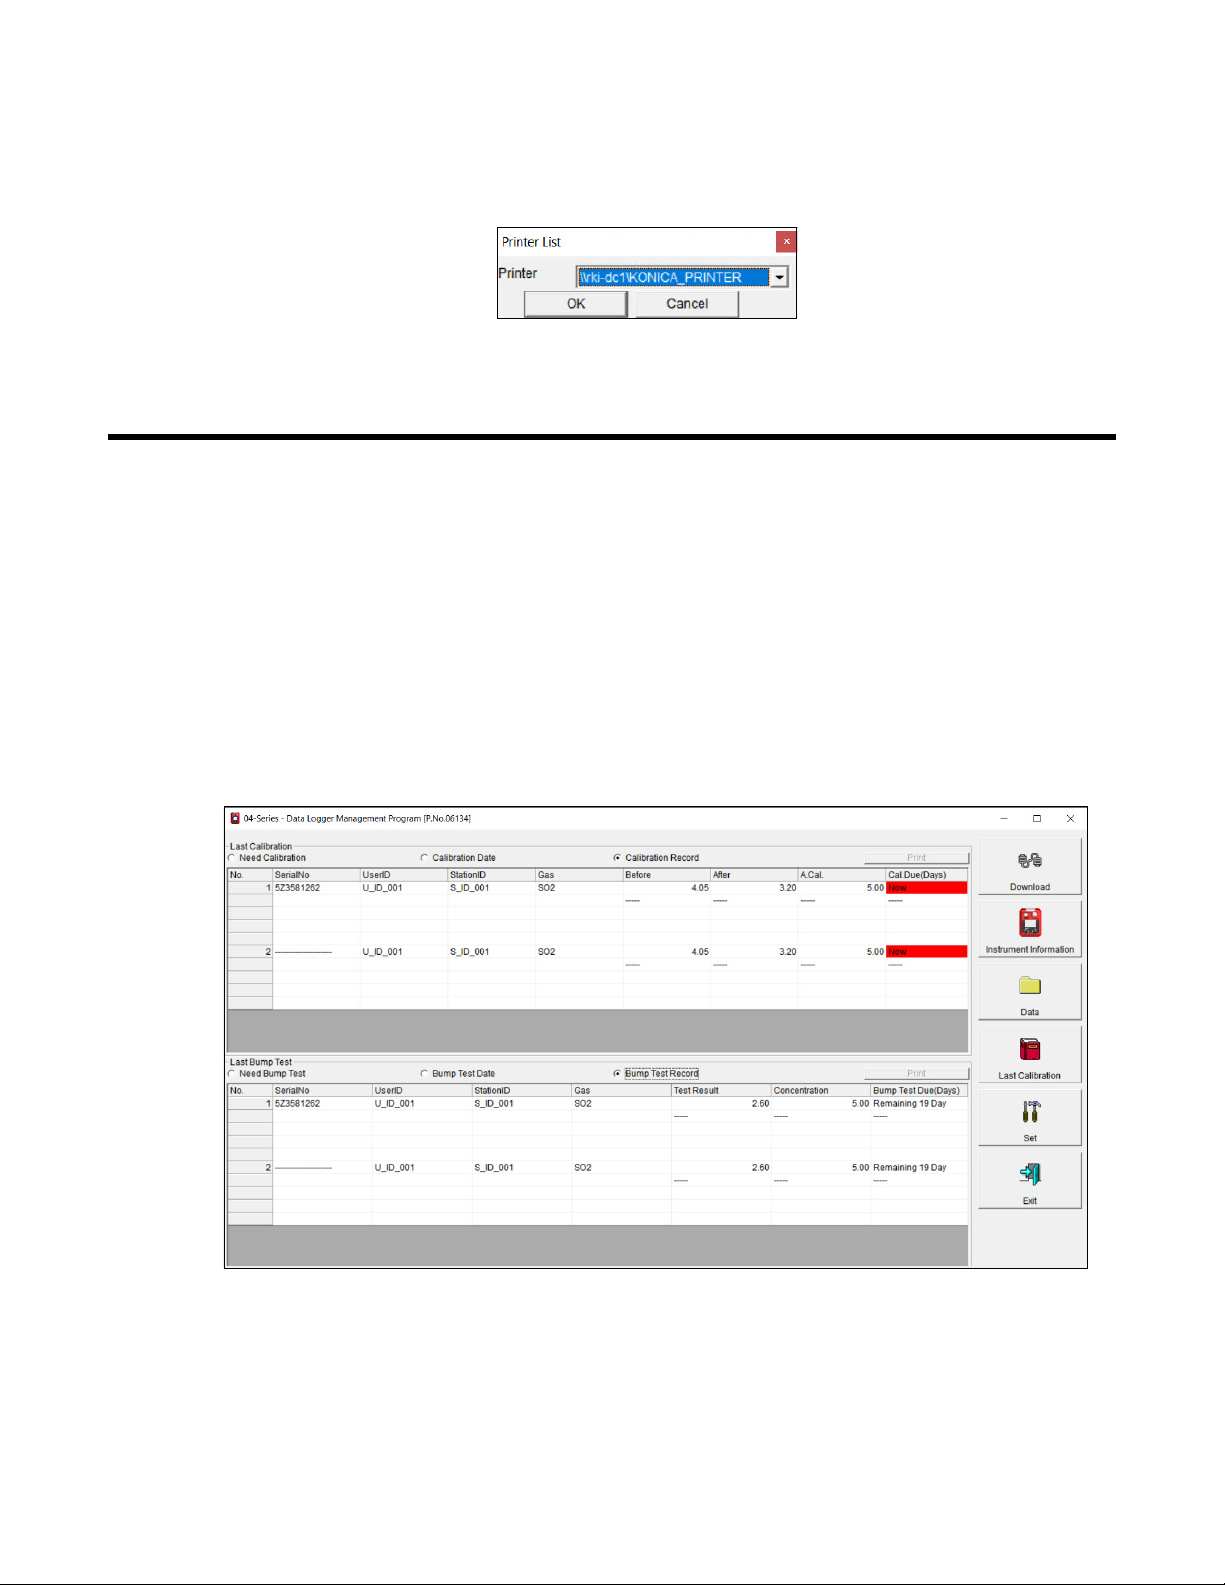
Calibration Record/Bump Test Record View
Selecting the Calibration Record/Bump Test Record view shows detailed calibration or bump
test information for each instrument’s most recent successful calibration or bump test.
The instruments that are due for calibration or bump testing will have their Cal.Due(Days) or
Bump Test Due(Days) value highlighted in red.
All user ID/station ID combinations for a particular serial number will appear as separate lines
but will all have the same last calibration and last bump test date. For example, an instrument
used with U_ID_001/S_ID_001 on one day and U_ID_002/S_ID_002 on another day will be
listed twice to show each of those ID combinations. The serial number and calibration/bump
test data for each listing will be the same.
38 • Chapter 6: Last Calibration Window
Find Quality Products Online at: sales@GlobalTestSupply.com
www.GlobalTestSupply.com
Page 39

1. The calibration field shows:
• SerialNo: Instrument’s serial number
• UserID: The instrument’s user ID.
• StationID: The instrument’s station ID.
• Gas: Instrument’s active gases.
• Before: Gas reading prior to calibration.
• After: Gas reading after calibration.
• A. Cal.: Auto calibration value for each gas. The “After” column should match the
“A. Cal.” column.
• Cal. Due (Days): Days left before calibration is due. If the instrument is due now, the
box is highlighted in red.
2. The bump test field shows:
• SerialNo: Instrument’s serial number
• UserID: The instrument’s user ID.
• StationID: The instrument’s station ID.
• Gas: Instrument’s active gases.
• Test Result: The reading for each channel at the end of the bump test.
• Concentration: Applied gas concentration for each gas.
• Bump Test Due: Days left before bump test is due. If the instrument is due now, the
box is highlighted in red.
3. It is not possible to print any information when the Calibration Record/Bump Test Record
view is selected. To view and print all past calibrations for an instrument, see “Calibration
History” on page 20.
Deleting Last Calibration Data
1. Click Last Calibration on the right side of the program window.
2. Select the Need Calibration/Need Bump Test or Calibration Date/Bump Test Date
view.
3. Click the row for the instrument whose calibration or bump test information you want to
delete. It will be highlighted to show that it is selected.
Chapter 6: Last Calibration Window • 39
Find Quality Products Online at: sales@GlobalTestSupply.com
www.GlobalTestSupply.com
Page 40

Figure 41: Delete Box
Figure 42: Password Window
4. Right click the selected instrument.
5. Click Delete.
6. Enter the password and click Continue. The factory-set, case-sensitive password is rki.
See “Changing the Delete Password” on page 33 for instructions to change the password.
7. Click Ye s in the confirmation window.
NOTE: Deleting instrument data in the Data window will not delete calibration data from
the Last Calibration window. Data in the Last Calibration window must be
deleted separately.
40 • Chapter 6: Last Calibration Window
Find Quality Products Online at: sales@GlobalTestSupply.com
www.GlobalTestSupply.com
Page 41

Chapter 7: Set Window (Instrument Parameters)
In the Set window, you can change the following instrument parameters:
• serial number
• station ID
•user ID
• interval trend time
• date/time
• auto start after successful bump
• auto start after successful cal
• alarm points
• auto calibration value
Changing Instrument Parameters
1. Launch the Datalogging Program.
2. If the Automatic Download selection box is selected, deselect it.
3. Connect an instrument as described on pg. 12.
4. Click Instrument Information (instrument information only) or Complete Download
(instrument information and instrument data).
Chapter 7: Set Window (Instrument Parameters) • 41
Find Quality Products Online at: sales@GlobalTestSupply.com
www.GlobalTestSupply.com
Page 42

5. Click Set.
Figure 43: Set Window
6. To change the serial number stored in the instrument, click the serial number field and use
the backspace key to remove the current entry, then type the new serial number.
7. Use the drop down menu to select a new station ID or user ID from the list. The available
station and user IDs are ones that are stored in the instrument’s memory.
8. Use the drop down menu to set the Interval Trend Time. The available choices are 10,
20, 30, 60, 180, 300, and 600 seconds. The table below outlines how many hours of
datalogging are available per interval trend time.
Interval Time Data Logging Time
10 seconds 10 hours
20 seconds 20 hours
30 seconds 30 hours
1 minute 60 hours
3 minutes 180 hours
5 minutes 300 hours
10 minutes 600 hours
42 • Chapter 7: Set Window (Instrument Parameters)
Find Quality Products Online at: sales@GlobalTestSupply.com
www.GlobalTestSupply.com
Page 43

9. Select or deselect Auto start after successful bump test and Auto start after successful
cal.
Selected (factory setting): If only one calibration cylinder is assigned, the 04 Series
automatically starts its warmup sequence after a successful bump test or calibration. If
multiple calibration cylinders are assigned, these parameters have no effect on operation.
Deselected: The 04 Series does not automatically start its warmup sequence after a
successful bump test or calibration.
10. To change alarm points and the auto calibration value for each channel, double-click the
field you wish to change then type in the new information.
11. Click Update and then Ye s in the confirmation window to upload the changes to the
instrument.
12. To update the instrument’s date and time to match the computer’s, click Date/Time Set
and then click the Ye s in the confirmation window.
Changing User and Station IDs
The Detail Settings button in the Set window allows the user to create or change a User ID list
or Station ID list and upload it to an instrument.
1. Launch the Datalogging Program.
2. If the Automatic Download selection box is selected, deselect it.
3. Connect an instrument as described on pg. 12.
4. Click Instrument Information (instrument information only
(instrument information and instrument data).
) or Complete Download
Chapter 7: Set Window (Instrument Parameters) • 43
Find Quality Products Online at: sales@GlobalTestSupply.com
www.GlobalTestSupply.com
Page 44

5. Click Set.
Figure 44: Set Window
44 • Chapter 7: Set Window (Instrument Parameters)
Find Quality Products Online at: sales@GlobalTestSupply.com
www.GlobalTestSupply.com
Page 45

Directly Editing Station and User ID Lists
Figure 45: Detail Settings Window
The station and user ID lists can be edited directly or through the use of .csv files. Editing
them directly is often more convenient if your station or user ID list is short. For longer ID
lists, using .csv files will be more convenient. See “Updating Station and User ID Lists Using
.csv Files” on page 46 for instructions to use .csv files.
1. Click the Detail Settings button in the Set window. If you do not currently have any userdefined User IDs or Station IDs programmed into the instrument, the screen will appear
as shown below.
The Station ID list is shown on the left and the User ID list is shown on the right. Both
lists have Export csv file and Import csv file buttons located to the right of each list.
If the instrument had any user-defined station or user IDs, they would be displayed in the
appropriate list.
2. Double click the station or user ID you wish to change and delete the existing
information. Type in the new station or user ID. Each ID can be up to 16 characters long
and can contain uppercase letters or numbers. However, only 8 characters are visible on
the instrument screen. If you intend to use the instrument’s Display Mode to switch
between user and station IDs, make sure that the first 8 characters of each ID are unique.
3. Click OK to save the changes and return to the Set window.
4. The new station and user ID lists will be visible in the Station ID and User ID selection
boxes in the Set window. Use the drop down menu to select a current station and user ID
for the instrument.
5. To upload the updated station and/or user ID list to the instrument and upload any other
changes you have made, click Update and click OK when the confirmation box appears.
Chapter 7: Set Window (Instrument Parameters) • 45
Find Quality Products Online at: sales@GlobalTestSupply.com
www.GlobalTestSupply.com
Page 46

Figure 46: Detail Settings Window
Updating Station and User ID Lists Using .csv Files
Station and user ID lists can also be edited by using .csv files.
1. Click the Detail Settings button in the Set window. If you do not currently have any userdefined User IDs or Station IDs programmed into the instrument, the screen will appear
as shown below.
The Station ID list is shown on the left and the User ID list is shown on the right. Both
lists have Export csv file and Import csv file buttons located to their right.
2. To create a new ID list, click the appropriate Export csv file button. In the example
below, the Station ID’s Export csv file button was clicked.
3. Navigate to the file storage location, type in a file name, and click Save.
46 • Chapter 7: Set Window (Instrument Parameters)
Find Quality Products Online at: sales@GlobalTestSupply.com
www.GlobalTestSupply.com
Page 47

4. Open the .csv file in a word processing program such as Word, WordPad, or Notepad.
Figure 47: Station ID .csv File Opened in Notepad
Below is an example of the Station .csv file opened in Notepad.
5. Any existing Station or User IDs are displayed. Factory-loaded Station or User IDs have a
S_ID_XXX or U_ID_XXX appearance.
6. Delete the existing name and replace it with the desired name. The name can be up to 16
characters long and may be any uppercase letter
or number. However, only 8 characters
are visible on the instrument screen. If you intend to use the instrument’s Display Mode
to switch between user and station IDs, make sure that the first 8 characters of each ID are
unique.
Chapter 7: Set Window (Instrument Parameters) • 47
Find Quality Products Online at: sales@GlobalTestSupply.com
www.GlobalTestSupply.com
Page 48

Figure 48: Import .csv File
Click to import Station .csv Click to import User .csv
Importing .csv Files
1. Locate an existing Station ID or User ID .csv file. See above for instructions to generate a
.csv file.
2. In the Detail Settings window, click the appropriate Import csv file.
3. Select the file you want to import and click Open.
4. Click OK to save changes and return to the Set window.
5. The new station and user ID lists will be visible in the Set window’s Station ID and User
ID selection boxes. Use the drop down menu to select a current station and user ID.
6. Click Update and then Yes in the confirmation window to upload the changes to the
instrument.
48 • Chapter 7: Set Window (Instrument Parameters)
Find Quality Products Online at: sales@GlobalTestSupply.com
www.GlobalTestSupply.com
Page 49

Chapter 8: Set Window (Program Appearance)
Figure 49: Set Window
The program font and the graph colors can be changed using the Set window.
1. Launch the Datalogging Program.
2. Click Set.
Chapter 8: Set Window (Program Appearance) • 49
Find Quality Products Online at: sales@GlobalTestSupply.com
www.GlobalTestSupply.com
Page 50

Changing the Font
Figure 50: Font Button
Figure 51: Font Window
1. Click the font name button.
2. Choose the font type, style, size, and script in the Font Window.
3. Click OK.
4. The changes will take effect after you exit and restart the program.
50 • Chapter 8: Set Window (Program Appearance)
Find Quality Products Online at: sales@GlobalTestSupply.com
www.GlobalTestSupply.com
Page 51
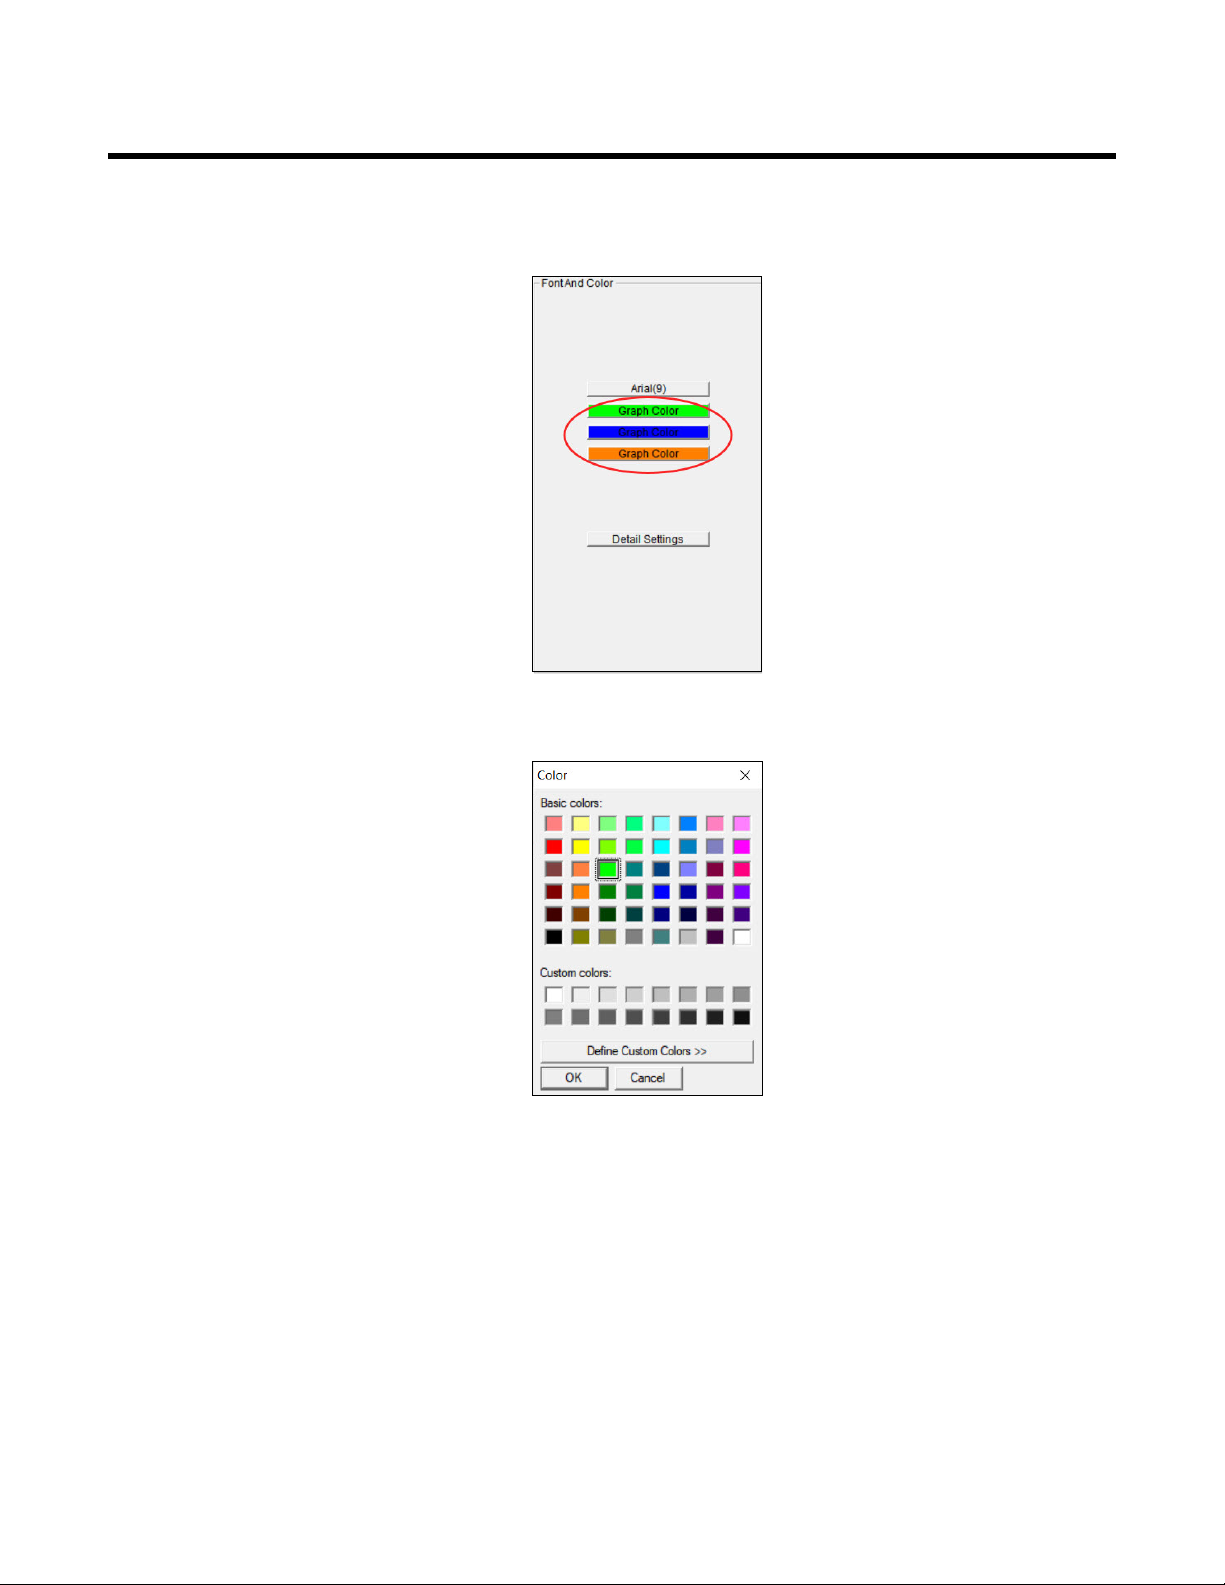
Changing Graph Colors
Figure 52: Graph Color Buttons
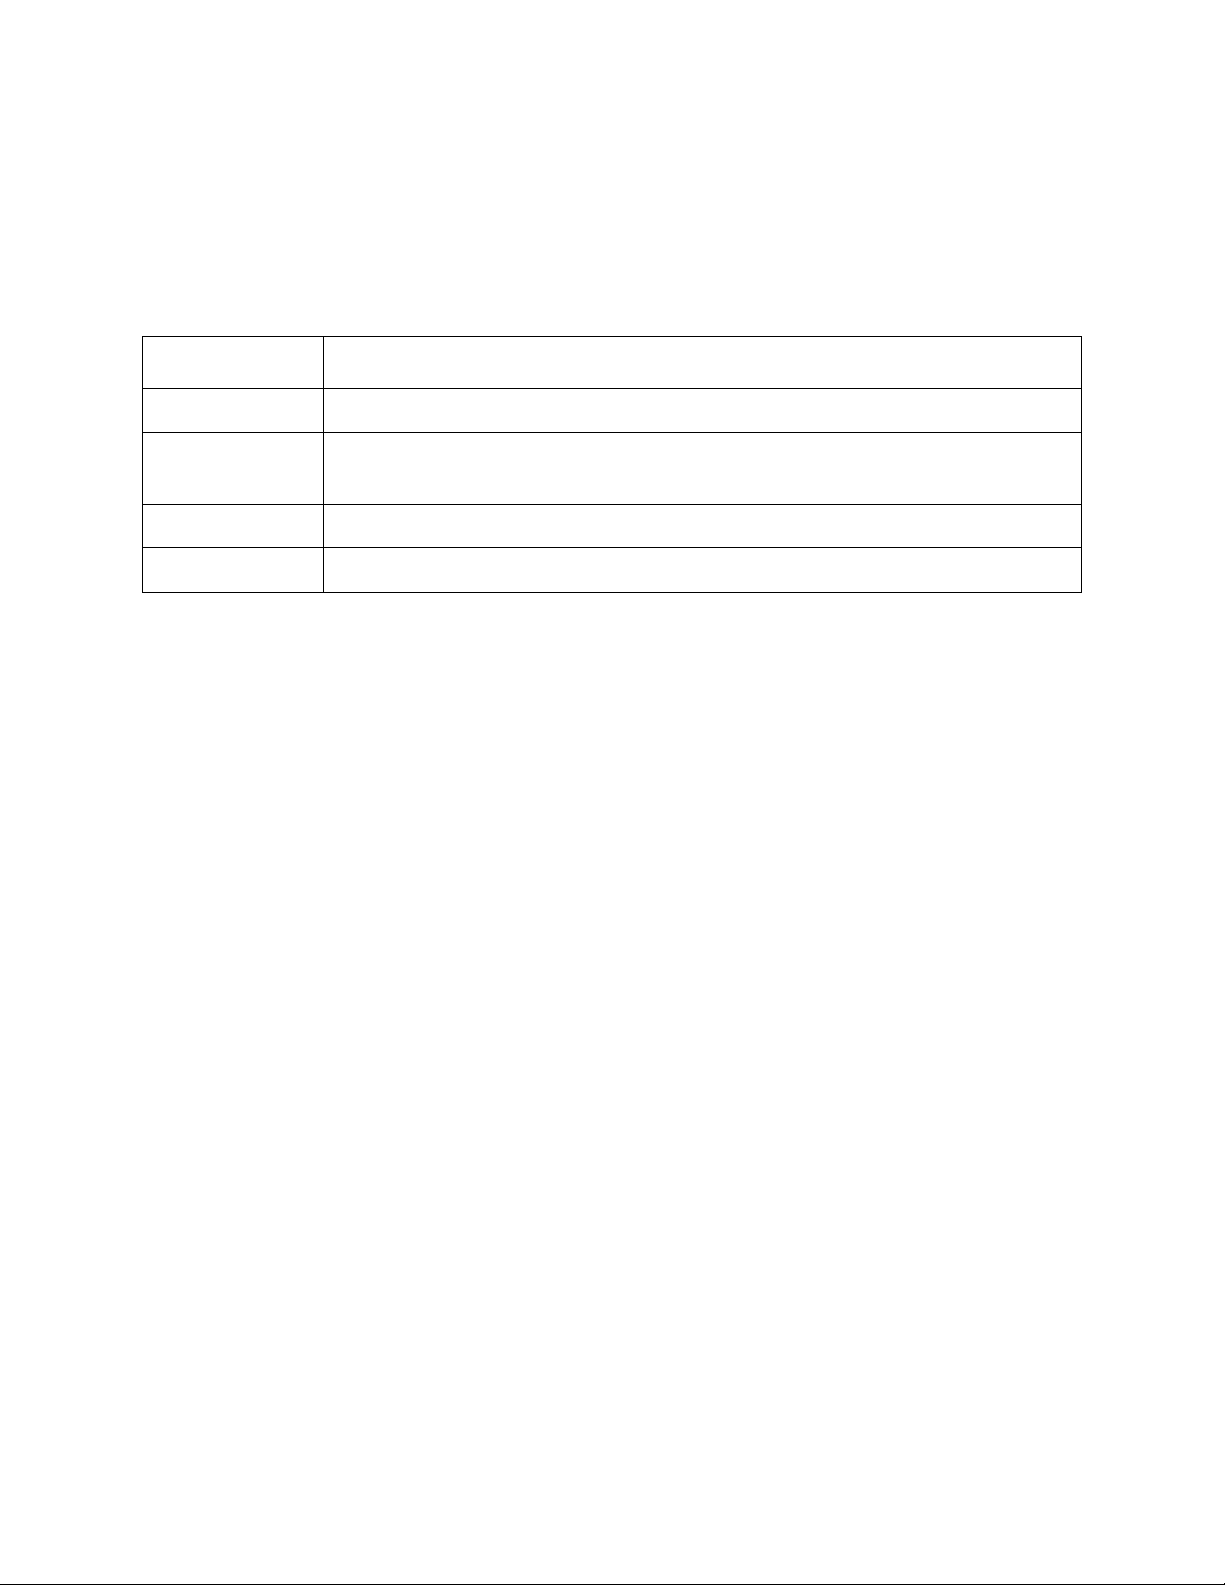
Figure 53: Color Windows
1. Click the appropriate Graph Color button on the left side of the Set Window.
2. Pick a new graph color from the Color Window.
Chapter 8: Set Window (Program Appearance) • 51
Find Quality Products Online at: sales@GlobalTestSupply.com
www.GlobalTestSupply.com
Page 52

Figure 54: Custom Color Windows
3. If you want to define a custom color, click the Define Custom Colors button and the
Custom Color Window replaces the Color Window.
4. Click OK.
5. The changes will take effect after you exit and restart the program.
52 • Chapter 8: Set Window (Program Appearance)
Find Quality Products Online at: sales@GlobalTestSupply.com
www.GlobalTestSupply.com
Page 53
Chapter 9: Spare Parts List
Table 2: Spare Parts List
Part Number Description
47-5084 USB/IrDA adapter, Legasic, module only (for use with all premier portables)
47-5084RK-01 USB/IrDA adapter, Legasic, module and cable (for use with all premier
portables)
47-5085RK USB A to USB mini cable, 6 feet, for 47-5084RK USB/IrDA adapter
71-0525 04 Series Datalogging Program Operator’s Manual (this document)
Chapter 9: Spare Parts List • 53
Find Quality Products Online at: sales@GlobalTestSupply.com
www.GlobalTestSupply.com
 Loading...