


RIGOL
User’s Guide
DSA800E Series
Spectrum Analyzer
May 2016
RIGOL TECHNOLOGIES, INC.
Find Quality Products Online at: sales@GlobalTestSupply.com
www.GlobalTestSupply.com

RIGOL
I
Guaranty and Declaration
Copyright
© 2016 RIGOL TECHNOLOGIES, INC. All Rights Reserved.
Trademark Information
RIGOL is a registered trademark of RIGOL TECHNOLOGIES, INC.
Publication Number
UGD17100-1110
Software Version
DSA832E: 00.01.02
Software upgrade might change or add product features. Please acquire the latest
version of the manual from RIGOL website or contact RIGOL to upgrade the
software.
Notices
RIGOL products are covered by P.R.C. and foreign patents, issued and
pending.
RIGOL reserves the right to modify or change parts of or all the
specifications and pricing policies at the company’s sole decision.
Information in this publication replaces all previously released materials.
Information in this publication is subject to change without notice.
RIGOL shall not be liable for either incidental or consequential losses in
connection with the furnishing, use, or performance of this manual, as well as
any information contained.
Any part of this document is forbidden to be copied, photocopied, or
rearranged without prior written approval of RIGOL.
Product Certification
RIGOL guarantees that this product conforms to the national and industrial
standards in China as well as the ISO9001:2008 standard and the ISO14001:2004
standard. Other international standard conformance certifications are in progress.
User’s Guide for DSA800E Series
Find Quality Products Online at: sales@GlobalTestSupply.com
www.GlobalTestSupply.com

RIGOL
II
Safety Requirement
General Safety Summary
Please review the following safety precautions carefully before putting the
instrument into operation so as to avoid any personal injury or damage to the
instrument and any product connected to it. To prevent potential hazards, please
follow the instructions specified in this manual to use the instrument properly.
Use Proper Power Cord.
Only the exclusive power cord designed for the instrument and authorized for use
within the local country could be used.
Ground the Instrument.
The instrument is grounded through the Protective Earth lead of the power cord.
To avoid electric shock, connect the earth terminal of the power cord to the
Protective Earth terminal before connecting any input or output terminals.
Connect the Probe Correctly.
If a probe is used, the probe ground lead must be connected to earth ground. Do
not connect the ground lead to high voltage. Improper way of connection could
result in dangerous voltages being present on the connectors, controls or other
surfaces of the oscilloscope and probes, which will cause potential hazards for
operators.
Observe All Terminal Ratings.
To avoid fire or shock hazard, observe all ratings and markers on the instrument
and check your manual for more information about ratings before connecting the
instrument.
Use Proper Overvoltage Protection.
Ensure that no overvoltage (such as that caused by a bolt of lightning) can reach
the product. Otherwise, the operator might be exposed to the danger of an electric
shock.
User’s Guide for DSA800E Series
Find Quality Products Online at: sales@GlobalTestSupply.com
www.GlobalTestSupply.com

RIGOL
III
Do Not Operate Without Covers.
Do not operate the instrument with covers or panels removed.
Do Not Insert Objects Into the Air Outlet.
Do not insert objects into the air outlet, as doing so may cause damage to the
instrument.
Use Proper Fuse.
Please use the specified fuses.
Avoid Circuit or Wire Exposure.
Do not touch exposed junctions and components when the unit is powered on.
Do Not Operate With Suspected Failures.
If you suspect that any damage may occur to the instrument, have it inspected by
RIGOL authorized personnel before further operations. Any maintenance,
adjustment or replacement especially to circuits or accessories must be performed by
RIGOL authorized personnel.
Provide Adequate Ventilation.
Inadequate ventilation may cause an increase of temperature in the instrument,
which would cause damage to the instrument. So please keep the instrument well
ventilated and inspect the air outlet and the fan regularly.
Do Not Operate in Wet Conditions.
To avoid short circuit inside the instrument or electric shock, never operate the
instrument in a humid environment.
Do Not Operate in an Explosive Atmosphere.
To avoid personal injuries or damage to the instrument, never operate the
instrument in an explosive atmosphere.
Keep Instrument Surfaces Clean and Dry.
To avoid dust or moisture from affecting the performance of the instrument, keep
the surfaces of the instrument clean and dry.
User’s Guide for DSA800E Series
Find Quality Products Online at: sales@GlobalTestSupply.com
www.GlobalTestSupply.com

RIGOL
IV
Prevent Electrostatic Impact.
Operate the instrument in an electrostatic discharge protective environment to
avoid damage induced by static discharges. Always ground both the internal and
external conductors of cables to release static before making connections.
Use the Battery Properly.
Do not expose the battery (if available) to high temperature or fire.
Keep it out of the reach of children. Improper change of a battery (lithium battery)
may cause an explosion. Use the RIGOL specified battery only.
Handle with Caution.
Please handle with care during transportation to avoid damage to keys, knobs,
interfaces, and other parts on the panels.
User’s Guide for DSA800E Series
Find Quality Products Online at: sales@GlobalTestSupply.com
www.GlobalTestSupply.com

RIGOL
V
CAUTION
DANGER
Hazardous
Safety
Protective
Terminal
Chassis
Test
Safety Notices and Symbols
Safety Notices in this Manual:
WARNING
Indicates a potentially hazardous situation or practice which, if not
avoided, will result in serious injury or death.
Indicates a potentially hazardous situation or practice which, if not
avoided, could result in damage to the product or loss of important data.
Safety Terms on the Product:
It calls attention to an operation, if not correctly performed, could
result in injury or hazard immediately.
WARNING It calls attention to an operation, if not correctly performed, could
result in
potential injury or hazard.
CAUTION It calls attention to an operation, if not correctly performed, could
result in
damage to the product or other devices connected to the
product.
Safety Symbols on the Product:
Voltage
Warning
Earth
Ground
Ground
User’s Guide for DSA800E Series
Find Quality Products Online at: sales@GlobalTestSupply.com
www.GlobalTestSupply.com

RIGOL
VI
Allgemeine Sicherheits Informationen
Überprüfen Sie diefolgenden Sicherheitshinweise
sorgfältigumPersonenschädenoderSchäden am Gerätundan damit verbundenen
weiteren Gerätenzu vermeiden. Zur Vermeidung vonGefahren, nutzen Sie bitte das
Gerät nur so, wiein diesem Handbuchangegeben.
Um Feuer oder Verletzungen zu vermeiden, verwenden Sie ein
ordnungsgemäßes Netzkabel.
Verwenden Sie für dieses Gerät nur das für ihr Land zugelassene und genehmigte
Netzkabel.
Erden des Gerätes.
Das Gerät ist durch den Schutzleiter im Netzkabel geerdet. Um Gefahren durch
elektrischen Schlag zu vermeiden, ist es unerlässlich, die Erdung durchzuführen.
Erst dann dürfen weitere Ein- oder Ausgänge verbunden werden.
Anschluss einesTastkopfes.
Die Erdungsklemmen der Sonden sindauf dem gleichen Spannungspegel des
Instruments geerdet. SchließenSie die Erdungsklemmen an keine hohe Spannung
an.
Beachten Sie alle Anschlüsse.
Zur Vermeidung von Feuer oder Stromschlag, beachten Sie alle Bemerkungen und
Markierungen auf dem Instrument. Befolgen Sie die Bedienungsanleitung für
weitere Informationen, bevor Sie weitere Anschlüsse an das Instrument legen.
Verwenden Sie einen geeigneten Überspannungsschutz.
Stellen Sie sicher, daß keinerlei Überspannung (wie z.B. durch Gewitter verursacht)
das Gerät erreichen kann. Andernfallsbestehtfür den Anwender die
GefahreinesStromschlages.
Nicht ohne Abdeckung einschalten.
Betreiben Sie das Gerät nicht mit entfernten Gehäuse-Abdeckungen.
User’s Guide for DSA800E Series
Find Quality Products Online at: sales@GlobalTestSupply.com
www.GlobalTestSupply.com

RIGOL
VII
Betreiben Sie das Gerät nicht geöffnet.
Der Betrieb mit offenen oder entfernten Gehäuseteilen ist nicht zulässig. Nichts in
entsprechende Öffnungen stecken (Lüfter z.B.)
Passende Sicherung verwenden.
Setzen Sie nur die spezifikationsgemäßen Sicherungen ein.
Vermeiden Sie ungeschützte Verbindungen.
Berühren Sie keine unisolierten Verbindungen oder Baugruppen, während das
Gerät in Betrieb ist.
Betreiben Sie das Gerät nicht im Fehlerfall.
Wenn Sie am Gerät einen Defekt vermuten, sorgen Sie dafür, bevor Sie das Gerät
wieder betreiben, dass eine Untersuchung durch RIGOL autorisiertem Personal
durchgeführt wird. Jedwede Wartung, Einstellarbeiten oder Austausch von Teilen
am Gerät, sowie am Zubehör dürfen nur von RIGOL autorisiertem Personal
durchgeführt werden.
Belüftung sicherstellen.
Unzureichende Belüftung kann zu Temperaturanstiegen und somit zu thermischen
Schäden am Gerät führen. Stellen Sie deswegen die Belüftung sicher und
kontrollieren regelmäßig Lüfter und Belüftungsöffnungen.
Nicht in feuchter Umgebung betreiben.
Zur Vermeidung von Kurzschluß im Geräteinneren und Stromschlag betreiben Sie
das Gerät bitte niemals in feuchter Umgebung.
Nicht in explosiver Atmosphäre betreiben.
Zur Vermeidung von Personen- und Sachschäden ist es unumgänglich, das Gerät
ausschließlich fernab jedweder explosiven Atmosphäre zu betreiben.
Geräteoberflächen sauber und trocken halten.
Um den Einfluß von Staub und Feuchtigkeit aus der Luft auszuschließen, halten Sie
bitte die Geräteoberflächen sauber und trocken.
Schutz gegen elektrostatische Entladung (ESD).
Sorgen Sie für eine elektrostatisch geschützte Umgebung, um somit Schäden und
User’s Guide for DSA800E Series
Find Quality Products Online at: sales@GlobalTestSupply.com
www.GlobalTestSupply.com

RIGOL
VIII
Funktionsstörungen durch ESD zu vermeiden. Erden Sie vor dem Anschluß immer
Innen- und Außenleiter der Verbindungsleitung, um statische Aufladung zu
entladen.
Die richtige Verwendung desAkku.
Wenneine Batterieverwendet wird, vermeiden Sie hohe Temperaturen bzw. Feuer
ausgesetzt werden. Bewahren Sie es außerhalbder Reichweitevon Kindern auf.
UnsachgemäßeÄnderung derBatterie (Anmerkung: Lithium-Batterie) kann zu einer
Explosion führen. VerwendenSie nur von RIGOL angegebenenAkkus.
Sicherer Transport.
Transportieren Sie das Gerät sorgfältig (Verpackung!), um Schäden an
Bedienelementen, Anschlüssen und anderen Teilen zu vermeiden.
User’s Guide for DSA800E Series
Find Quality Products Online at: sales@GlobalTestSupply.com
www.GlobalTestSupply.com

RIGOL
IX
CAUTION
DANGER
Sicherheits Begriffe und Symbole
Begriffe in diesem Guide:
WARNING
Die Kennzeichnung WARNING beschreibt Gefahrenquellen die leibliche
Schäden oder den Tod von Personen zur Folge haben können.
Die Kennzeichnung Caution (Vorsicht) beschreibt Gefahrenquellen die
Schäden am Gerät hervorrufen können.
Begriffe auf dem Produkt:
weist auf eine Verletzung oder Gefährdung hin, die sofort
geschehen kann.
WARNING weist auf eine Verletzung oder Gefährdung hin, die möglicherweise
nicht sofort geschehen.
CAUTION weist auf eine Verletzung oder Gefährdung hin und bedeutet, dass
eine mögliche Beschädigung des Instruments oder anderer
Gegenstände auftreten kann.
Symbole auf dem Produkt:
Gefährliche
Spannung
SicherheitsHinweis
Schutz-erde Gehäusemasse Erde
User’s Guide for DSA800E Series
Find Quality Products Online at: sales@GlobalTestSupply.com
www.GlobalTestSupply.com
RIGOL
X
WARNING
Care and Cleaning
Care
Do not store or leave the instrument where it may be exposed to direct sunlight for
long periods of time.
Cleaning
Clean the instrument regularly according to its operating conditions.
1. Disconnect the instrument from all power sources.
2. Clean the external surfaces of the instrument with a soft cloth dampened with
mild detergent or wa te r. W hen cleaning the LCD, take care to avoid scarifying
it.
CAUTION
To avoid damage to the instrument, do not expose it to caustic liquids.
To avoid short-circuit resulting from moisture or personal injuries, ensure
that the instrument is completely dry before connecting it to the power
supply.
User’s Guide for DSA800E Series
Find Quality Products Online at: sales@GlobalTestSupply.com
www.GlobalTestSupply.com

RIGOL
XI
Environmental Considerations
The following symbol indicates that this product complies with the WEEE Directive
2002/96/EC.
Product End-of-Life Handling
The equipment may contain substances that could be harmful to the environment or
human health. To avoid the release of such substances into the environment and
avoid harm to human health, we recommend you to recycle this product
appropriately to ensure that most materials are reused or recycled properly. Please
contact your local authorities for disposal or recycling information.
User’s Guide for DSA800E Series
Find Quality Products Online at: sales@GlobalTestSupply.com
www.GlobalTestSupply.com

RIGOL
XIII
DSA800E Series Overview
DSA800E series spectrum analyzers which are small, light and cost-effective, are
portable spectrum analyzers designed for starters. Configured with
easy-to-operate numeric keyboard, high-resolution color LCD display and various
remote communication interfaces, they can be widely used in various fields, such
as education, company research and development as well as industrial
manufacture.
Main features:
The highest frequency: 3.2 GHz
Displayed Average Noise Level (DANL): <-148 dBm (Typical)
Phase Noise: <-90 dBc/Hz @ 10 kHz offset ( Typic al )
Level Measurement Uncertainty: <1.0 dB
Minimum Resolution Bandwidth (RBW): 10 Hz
EMI Filter and Quasi-Peak Detector Kit (Option)
VSWR Measurement Kit (Option)
AM/FM Demodulation Function
Various measurement functions (option)
3.2 GHz Tracking Generator (DSA832E-TG)
8 inche (800×480 pixels) high-definition display with clear, vivid, and
easy-to-use graphical interface
Various interfaces such as LAN, USB Host, USB Device and GPIB (option)
User’s Guide for DSA800E Series
Find Quality Products Online at: sales@GlobalTestSupply.com
www.GlobalTestSupply.com

RIGOL
XIV
Document Overview
Topics in this manual:
Chapter 1 Quick Start
This chapter introduces the front/rear panel and user interface as well as
announcements during first use of the analyzer.
Chapter 2 Front Panel Operation
This chapter gives detailed function descriptions of the front panel keys with their
associated menu keys.
Chapter 3 Remote Control
This chapter shows how to control the analyzer in remote mode.
Chapter 4 Troubleshooting&Message
This chapter lists the troubleshooting information and messages that may appear
during the use of the analyzer.
Chapter 5 Specifications
This chapter lists the specifications and general specifications of the analyzer.
Chapter 6 Appendix
This chapter lists the options and accessories that can be ordered along with your
analyzer as well as the service and support information.
User’s Guide for DSA800E Series
Find Quality Products Online at: sales@GlobalTestSupply.com
www.GlobalTestSupply.com
XV
Format conventions in this manual:
Model
Frequency Range
Tracking Generator
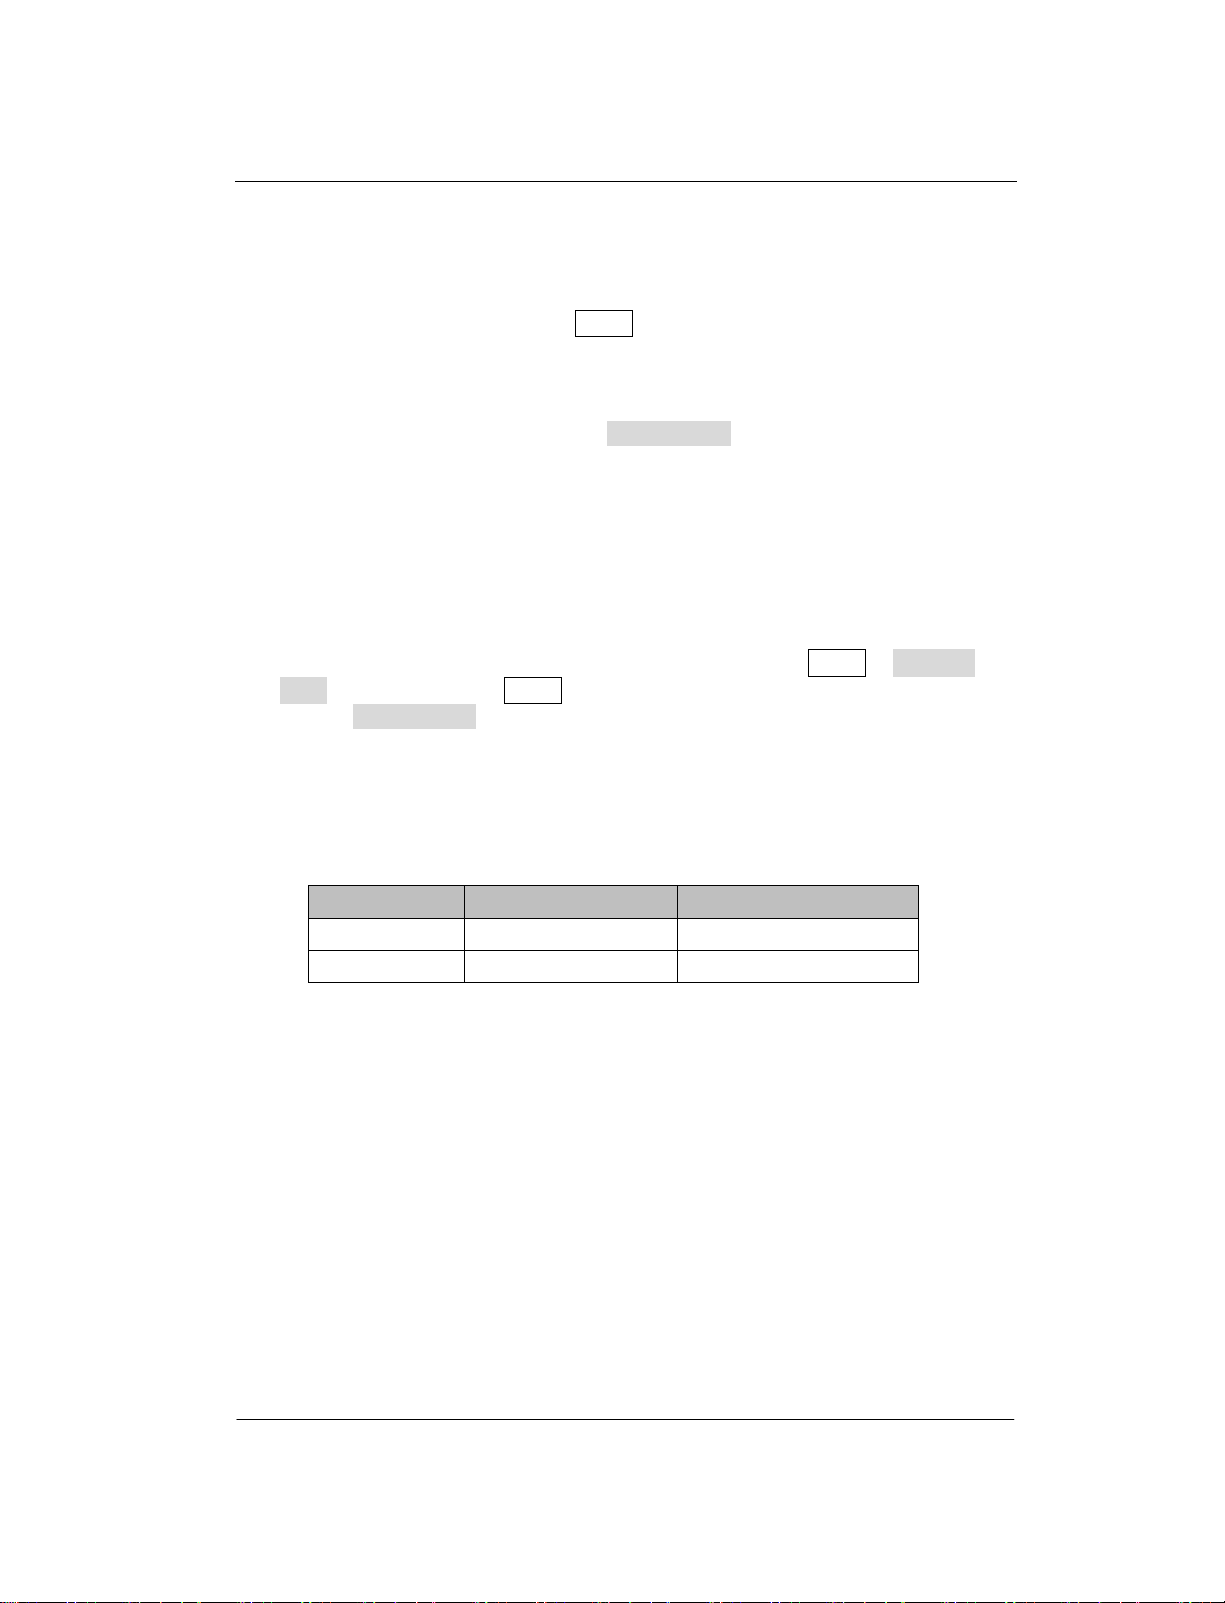
1. Keys:
The keys at the front panel are usually denoted by the format of "Key name
(Bold) +textbox". For example, FREQ denotes the FREQ k ey.
2. Menu keys:
The menu softkeys are usually denoted by the format of "Menu word (Bold)
+character shading". For example, Center Freq denotes the center
frequency menu item under the FREQ function key.
3. Connectors:
The connectors at the front or rear panel are usually denoted by the format of
"Connector name (Bold) +square brackets (Bold)", such as [GEN OUTPUT
50Ω].
4. Operation steps:
"" represents the next step of operation. For example, FREQ Center
Freq indicates pressing FREQ at the front panel and then pressing the menu
softkey Center Freq.
Content conventions in this manual:
The DSA800E series spectrum analyzer includes the following two models.
RIGOL
DSA832E 9 kHz to 3.2 GHz None
DSA832E-TG 9 kHz to 3.2 GHz 3.2 GHz
User manuals provided with this product:
User’s Guide, Quick Guide, Programming Guide, Data sheet etc. For the desired
manual, please download it from www.rigol.com.
User’s Guide for DSA800E Series
Find Quality Products Online at: sales@GlobalTestSupply.com
www.GlobalTestSupply.com

RIGOL Contents
XVI
Contents
Guaranty and Declaration ......................................................................... I
Safety Requirement ................................................................................. II
General Safety Summary........................................................................... II
Safety Notices and Symbols ...................................................................... V
Allgemeine Sicherheits Informationen ....................................................... VI
Sicherheits Begriffe und Symbole .............................................................. IX
Care and Cleaning .................................................................................... X
Environmental Considerations ................................................................... XI
DSA800E Series Overview ................................................................... XIII
Document Overview ............................................................................. XIV
Chapter 1 Quick Start ........................................................................ 1-1
General Inspection ................................................................................. 1-2
Appearance and Dimensions ................................................................... 1-3
To Prepare for Use ................................................................................. 1-4
To Adjust the Supporting Legs .......................................................... 1-4
To Connect to Power ........................................................................ 1-5
Power-on Inspection ........................................................................ 1-6
Self-calibration ................................................................................ 1-6
To Set the System Language ............................................................. 1-6
Front Panel ............................................................................................ 1-7
Front Panel Function Keys ................................................................ 1-8
Front Panel Key Backlight ............................................................... 1-10
Front Panel Connectors .................................................................. 1-11
To Use the Numeric Keyboard ......................................................... 1-13
Rear Panel ........................................................................................... 1-15
User Interface ...................................................................................... 1-17
Menu Operation ................................................................................... 1-20
Parameter Setting ................................................................................ 1-22
To Input Filename ................................................................................ 1-24
To Lock the Keyboard ........................................................................... 1-27
Use the Built-in Help ........................................................................ 1-28
To
To Use the Security Lock ....................................................................... 1-30
User’s Guide for DSA800E Series
Find Quality Products Online at: sales@GlobalTestSupply.com
www.GlobalTestSupply.com

Contents RIGOL
XVII
To Replace the Fuse ............................................................................. 1-31
Chapter 2 Front Panel Operation ........................................................ 2-1
Basic Settings ....................................................................................... 2-2
FREQ ............................................................................................. 2-2
SPAN ............................................................................................. 2-9
AMPT ............................................................................................ 2-12
Sweep and Function Settings ................................................................. 2-23
BW/Det ......................................................................................... 2-23
Sweep/Trig .................................................................................... 2-28
Trace/P/F ...................................................................................... 2-34
TG ................................................................................................ 2-41
Measurement Settings .......................................................................... 2-45
Meas ............................................................................................ 2-45
Meas Setup ................................................................................... 2-49
Demod ......................................................................................... 2-75
Marker Measurements........................................................................... 2-77
Marker .......................................................................................... 2-77
Marker-> ...................................................................................... 2-84
Marker Fctn ................................................................................... 2-86
Peak ............................................................................................. 2-89
Shortcut Key ........................................................................................ 2-93
Auto ............................................................................................. 2-93
User Key ....................................................................................... 2-95
Preset ........................................................................................... 2-96
Print ........................................................................................... 2-102
System Settings ................................................................................. 2-103
System ....................................................................................... 2-103
Print Setup .................................................................................. 2-116
Storage ....................................................................................... 2-119
Ch
apter 3 Remote Control .................................................................. 3-1
Remote Control Overview ....................................................................... 3-2
Remote Control Method ......................................................................... 3-3
User-defined Programming .............................................................. 3-3
To Use PC software ......................................................................... 3-6
Chapter 4 Troubleshooting&Message ................................................. 4-1
Troubleshooting .................................................................................... 4-2
User’s Guide for DSA800E Series
Find Quality Products Online at: sales@GlobalTestSupply.com
www.GlobalTestSupply.com

RIGOL Contents
XVIII
Messages .............................................................................................. 4-4
Information Message ....................................................................... 4-6
Error Message ................................................................................. 4-9
Status Message ............................................................................. 4-22
Chapter 5 Specifications .................................................................... 5-1
Technical Specifications*......................................................................... 5-2
Frequency ....................................................................................... 5-2
Amplitude ....................................................................................... 5-3
Distortion ........................................................................................ 5-6
Sweep ............................................................................................ 5-7
Tracking Generator (Option) ............................................................. 5-7
Trigg e r ........................................................................................... 5-7
Input /Output .................................................................................. 5-8
General Specifications ............................................................................ 5-9
Chapter 6 Appendix ........................................................................... 6-1
Appendix A: Ordering Infomation ............................................................. 6-1
Appendix B: Warranty ............................................................................. 6-2
Index ........................................................................................................ 1
User’s Guide for DSA800E Series
Find Quality Products Online at: sales@GlobalTestSupply.com
www.GlobalTestSupply.com

Chapter 1 Quick Start RIGOL
1-1
Chapter 1 Quick Start
This chapter guides users to quickly get familiar with the appearance, dimensions,
front/ rear panel and the user interface, as well as announcements during first use
of DSA800E series spectrum analyzer.
Subjects in this chapter:
General Inspection
Appearance and Dimensions
To Prepare for Use
Front Panel
Rear Panel
User Interface
Menu Operation
Parameter Setting
To Input Filename
To Lock the Keyboard
To Use the Built-in Help
To Use the Security Lock
To Rep lace the Fuse
User’s Guide for DSA800E Series
Find Quality Products Online at: sales@GlobalTestSupply.com
www.GlobalTestSupply.com

RIGOL Chapter 1 Quick Start
1-2
General Inspection
1. Inspect the packaging
If the packaging has been damaged, do not dispose the damaged packaging
or cushioning materials until the shipment has been checked for completeness
and has passed both electrical and mechanical tests.
The consigner or carrier shall be liable for the damage to the instrument
resulting from shipment. RIGOL would not be responsible for free
maintenance/rework or replacement of the instrument.
2. Inspect the instrument
In case of any mechanical damage, missing parts, or failure in passing the
electrical and mechanical tests, contact your RIGOL sales representative.
3. Check the accessories
Please check the accessories according to the packing lists. If the accessories
are damaged or incomplete, please contact your RIGOL sales
representative.
User’s Guide for DSA800E Series
Find Quality Products Online at: sales@GlobalTestSupply.com
www.GlobalTestSupply.com
Chapter 1 Quick Start RIGOL
1-3
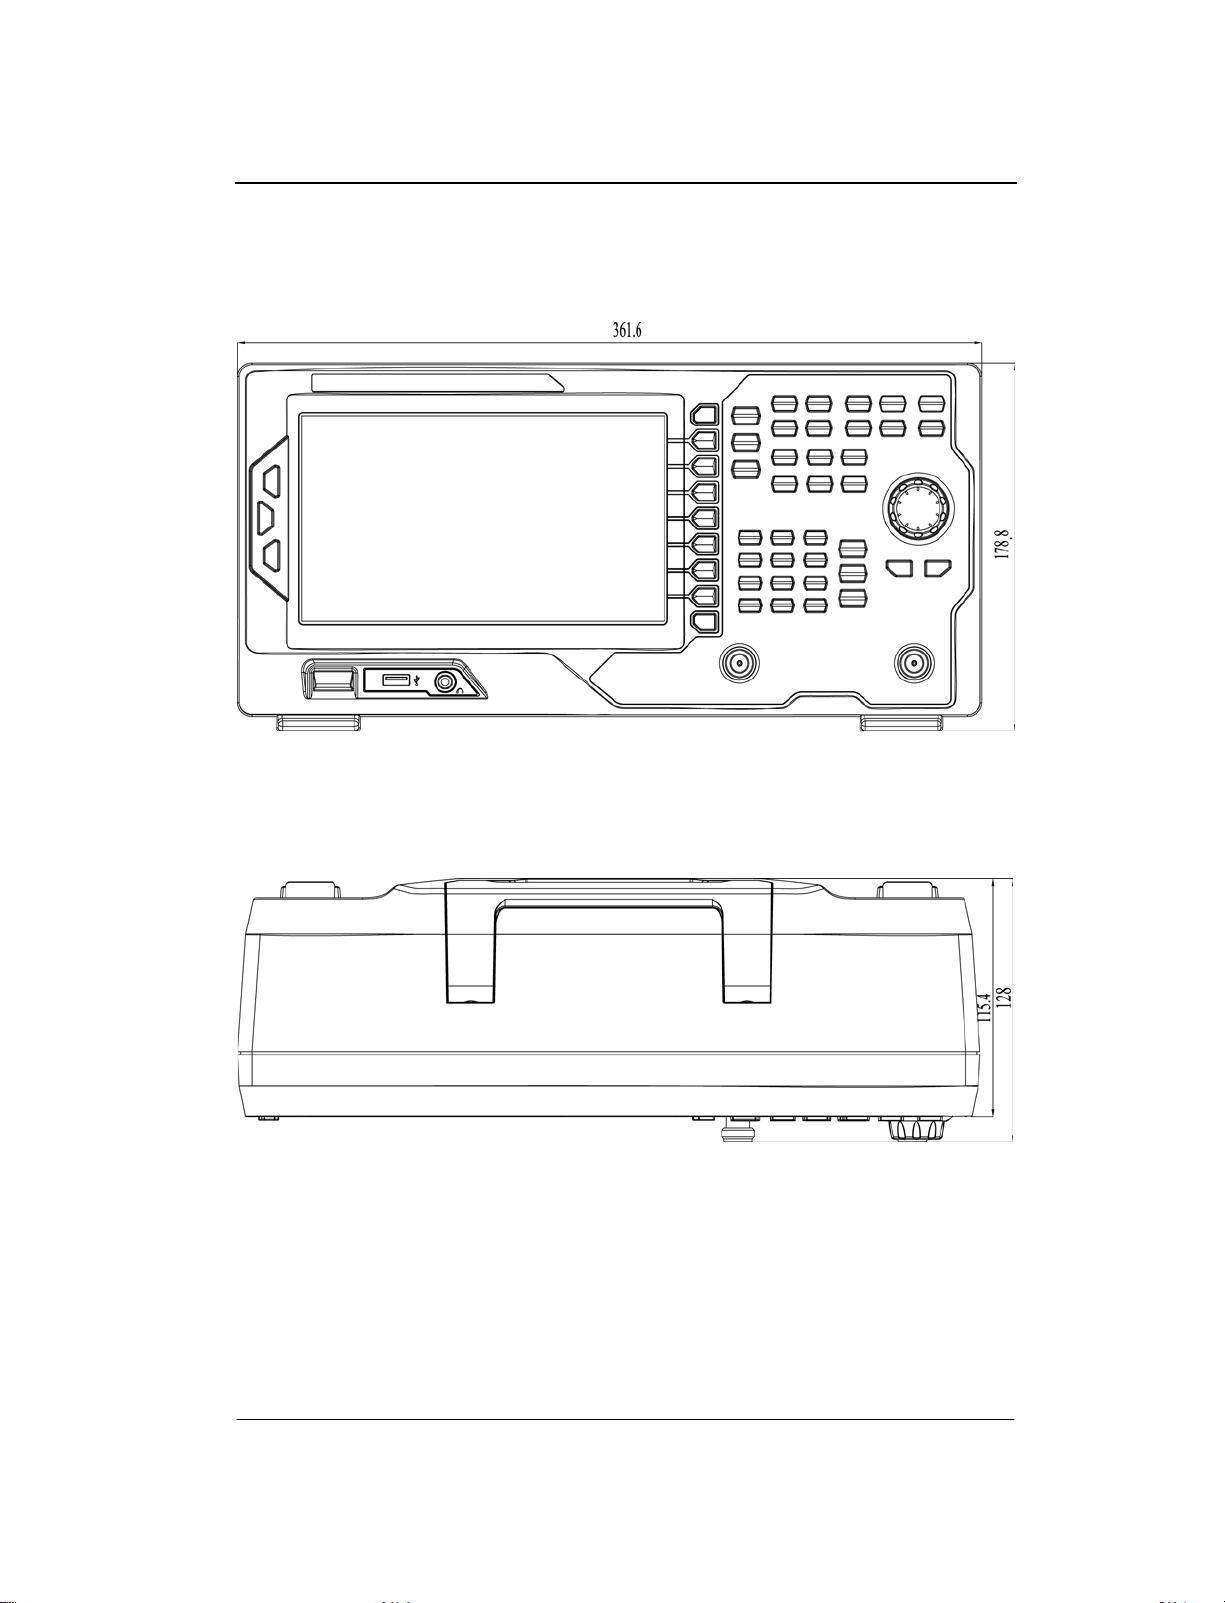
Appearance and Dimensions
Figure 1-1 Front View Unit: mm
Figure 1-2 Side View Unit: mm
User’s Guide for DSA800E Series
Find Quality Products Online at: sales@GlobalTestSupply.com
www.GlobalTestSupply.com

RIGOL Chapter 1 Quick Start
1-4
To Prepare for Use
To Adjust the Supporting Legs
Users can unfold the supporting legs to use them as stands to tilt the instrument
upwards for easier operation and observation. Users can also fold the supporting
legs when the instrument is not in use for easier storage or shipment.
To unfold the supporting legs
Figure 1-3 To Adjust the Supporting Legs
To fold the supporting legs
User’s Guide for DSA800E Series
Find Quality Products Online at: sales@GlobalTestSupply.com
www.GlobalTestSupply.com

Chapter 1 Quick Start RIGOL
1-5
CAUTION
To Connect to Power
Please use the power cord provided with the accessories to connect the spectrum
analyzer to AC power source as shown in the figure below. The AC power supply
specification of this spectrum analyzer is 100-240 V, 45-440 Hz. The power
consumption of the instrument cannot exceed 50 W. When the spectrum analyzer
is connected to AC power supply via the power cord, the instrument select the
correct voltage range automatically and users do not need to select the voltage
range manually.
Figure 1-4 Power Cord Connection
Make sure that the instrument is properly grounded to avoid electric
shock.
User’s Guide for DSA800E Series
Find Quality Products Online at: sales@GlobalTestSupply.com
www.GlobalTestSupply.com

RIGOL Chapter 1 Quick Start
1-6
Power-on Inspection
After connecting the instrument to power source correctly, press
panel to start the spectrum analyzer. Following the start-up screen which shows
the start-up initialization process information, the sweep curve is displayed.
at the front
Self-calibration
After the instrument starts, execute self-calibration.
Press System Calibrate Cal Now and the instrument will perform
self-calibration using the internal calibration source.
To Set the System Language
DSA800E series spectrum analyzer supports multiple system languages. You can
press System Language to switch the system language.
User’s Guide for DSA800E Series
Find Quality Products Online at: sales@GlobalTestSupply.com
www.GlobalTestSupply.com

Chapter 1 Quick Start RIGOL
1-7
1 2 3
14
13
12
11 10 9 8 7
Front Panel
The front panel of DSA800E is as shown in the figure below.
Figure 1-5 Front Panel
Tab le 1-1 Front Panel Description
NO. Description NO. Description
1 LCD 8 Tracking generator output*
2 Menu softkeys/menu control keys 9 Earphone jack
3 Function key area 10 USB Host
4 Knob 11 Power switch
5 Arrow keys 12 Help
6 Numeric Keyboard 13 Print
7 RF input 14
Note: *This function is only available for DSA832E-TG.
Preset
4
5
6
User’s Guide for DSA800E Series
Find Quality Products Online at: sales@GlobalTestSupply.com
www.GlobalTestSupply.com

RIGOL Chapter 1 Quick Start
1-8
Front Panel Function Keys
Figure 1-6 Function Key Area
Tab le 1-2 Function keys description
Key Description
FREQ
SPAN Set the frequency span of the sweep.
AMPT
BW/Det
Sweep/Trig Set the sweep and trigger parameters.
Trace/P/F
TG Set the tracking generator*.
Meas Select and control the measurement function**.
Meas Setup Set the parameters for the selected measurement function**.
Set the center, start and stop frequency, etc; enable the
signal tracking function.
Set the reference level, RF attenuator, scale and the unit of
Y-axis, etc.
Set the reference level offset, maximum mixing level and
input impedence.
Execute auto scale and auto range as well as turn on the RF
preamplifier.
Set the resolution bandwidth (RBW), video bandwidth (VBW)
and V/R ratio.
Set the detector and filter types.
Set the parameters related to trace.
Configure the Pass/Fail test.
User’s Guide for DSA800E Series
Find Quality Products Online at: sales@GlobalTestSupply.com
www.GlobalTestSupply.com

Chapter 1 Quick Start RIGOL
1-9
User Key
Preset
Demod Set the demodulation function.
Marker
Marker—>
Marker Fctn
Peak
Read the amplitude, frequency and sweep time of a certain
point on the trace via marker.
Set other system parameters on the basis of the current
marker value.
Special functions of the marker such as noise marker, N dB
bandwidth measurement and frequency counter.
Open the peak search menu and search for peaks
immediately.
System Set the system parameters.
Print Setup Set the print parameters.
Storage Provide file storage and recall functions.
Auto Search for signals automatically within full frequency range.
User-defined shortcut key.
Restore the system to factory settings or user-defined state.
Print or save the current screen.
Help Turn on the built-in help.
Note:
*This function is only available for DSA832E-TG.
**This function is only available for DSA800E with the corresponding option.
User’s Guide for DSA800E Series
Find Quality Products Online at: sales@GlobalTestSupply.com
www.GlobalTestSupply.com

RIGOL Chapter 1 Quick Start
1-10
Front Panel Key Backlight
The on/off state and the color of the backlights of some keys at the front panel
indicate the working state of the spectrum analyzer. The states are as listed below.
1. Power Switch
Flash on and off alternatively, in breathing state: indicate the unit is in
stand-by state.
Constant on: indicate the instrument is in normal operating state.
2. TG*
When the TG function is enabled, the backlight of TG turns on and turns off
when the function is disabled.
3. Auto
When Auto is pressed, the backlight turns on. The instrument starts sweeping
within the full frequency range, searches for the signal with the maximum
amplitude and moves it to the center of the screen. Then the backlight turns off.
4. Meas**
The backlight of Meas turns on when VSWR or any of the advanced
measurements is enabled and stays on until all measurement functions are
disabled.
Note:
*This function is only available for DSA832E-TG.
**This function is only applicable to DSA800E installed with the corresponding option.
User’s Guide for DSA800E Series
Find Quality Products Online at: sales@GlobalTestSupply.com
www.GlobalTestSupply.com

Chapter 1 Quick Start RIGOL
1-11
and gradually turn the volume up after putting on the earphone.
USB Host
RF input
Front Panel Connectors
Earphone jack
Tracking
generator
output
Figure 1-7 Front Panel Connectors
1. USB Host
The analyzer can serve as a "host" device to connect external USB devices.
This interface is available for USB storage devices and USB-GPIB interface
converter.
USB Storage Device
Read the trace or state file stored in the USB storage device, store the
current instrument state or trace in the USB storage device or store the
contents currently displayed on the screen in the USB storage device in
".bmp", ".jpg" or ".png" format.
USB-GPIB Interface Converter
Extend a GPIB interface for the analyze r.
2. Earphone Jack
The analyzer provides AM and FM demodulations. Insert the earphone to the
jack to aquire the audio output of the demodulated signal. You can turn on or
off the earphone output and adjust the volume via Demod Demod
Setup.
CAUTION
For fear of damaging your hearing, please turn the volume down to zero
User’s Guide for DSA800E Series
Find Quality Products Online at: sales@GlobalTestSupply.com
www.GlobalTestSupply.com

RIGOL Chapter 1 Quick Start
1-12
MHz. The reverse DC voltage cannot exceed 50 V.
dBm respectively.
3. GEN OUTPUT 50Ω
The output of the tracking generator can be connected to a receiver through a
cable with an N male connector. The tracking generator is only available for
DSA832E-TG.
CAUTION
To avoid damage to the tracking generator, the reverse power cannot
exceed +10 dBm when the frequency is lower than 10 MHz; the reverse
power cannot exceed +20 dBm when the frequency is greater than 10
4. RF INPUT 50Ω
The input terminal of the signal under measurement. [RF INPUT 50Ω] can
be connected to the device under measurement via a cable with an N male
connector.
CAUTION
To avoid damage to the instrument, for the signal input from the RF
input terminal, the DC voltage component and the maximum continuous
power of the AC (RF) signal component can not exceed 50 V and +20
User’s Guide for DSA800E Series
Find Quality Products Online at: sales@GlobalTestSupply.com
www.GlobalTestSupply.com

Chapter 1 Quick Start RIGOL
1-13
To Use the Numeric Keyboard
DSA800E provides a numeric keyboard at the front panel (as shown in the figure
below). The numeric keyboard which supports the Chinese characters, English
uppercase/lowercase characters, numbers and common symbols (including
decimal point, #, space and +/-) are mainly used to edit file or folder name (refer
to "To Input Filename") and set parameters (refer to "Parameter Setting").
Figure 1-8 Numeric Keyboard
The numeric keyboard consists of the following parts:
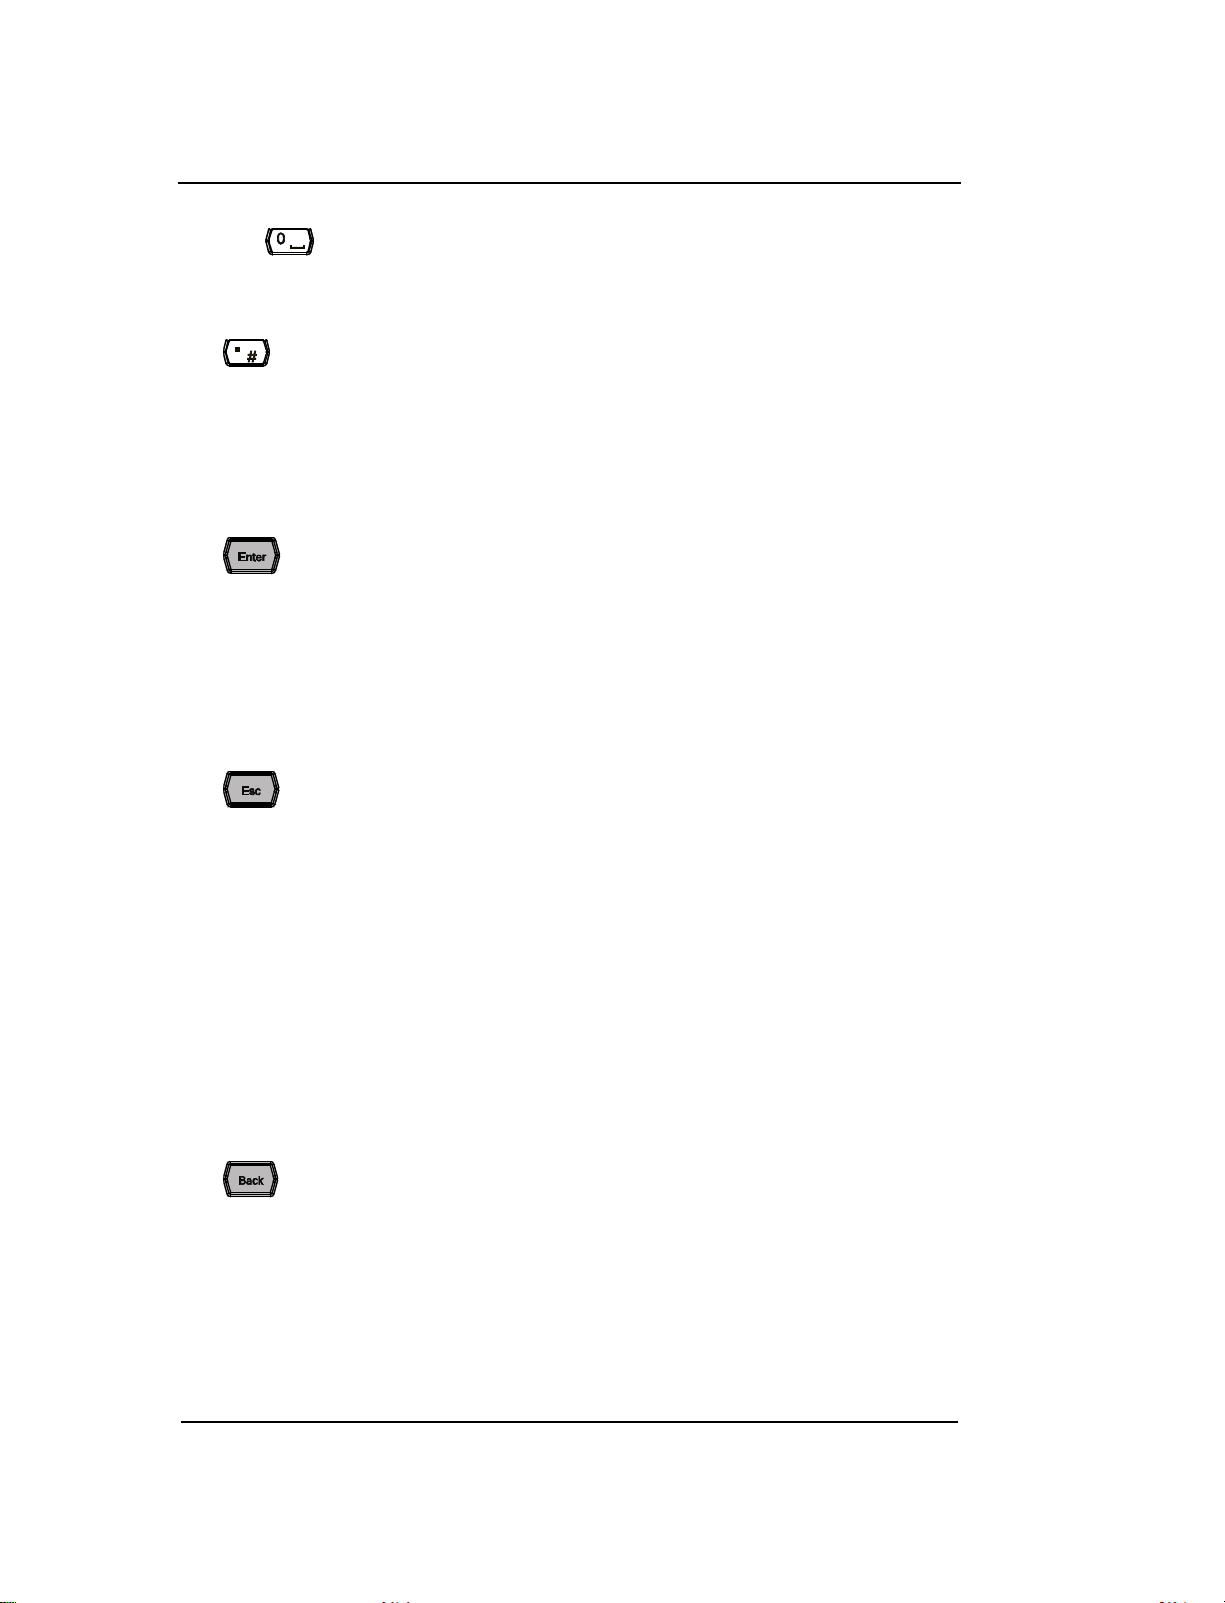
1.
2. Number/Letter
User’s Guide for DSA800E Series
The input mode is fixed at number input during parameter setting. During
parameter setting, press this key to input the symbol ("+" or "-") of the
figure. When the key is pressed for the first time, the parameter symbol
is "-" and "+" when the key is pressed again.
Press
file or folder name editing.
Multiplexing keys for numbers and letters. They are used to directly input
the desired number or letter.
uppercase and lowercase letter in English input. This key is invalid in
Chinese input.
to switch among Chinese, English and number input during
: press this key to input 1 in number input and switch between
Find Quality Products Online at: sales@GlobalTestSupply.com
www.GlobalTestSupply.com
RIGOL Chapter 1 Quick Start
1-14
is the multiplexing key for 0 and space. Press this key to input 0 in
number input and space in Chinese or English input.
3.
Press this key to input a decimal point at the current cursor position in
number input.
Press this key to input "#" in English input.
This key is invalid in Chinese input.
4.
When pressed during parameter editing process, the system will
complete the input and insert a default unit for the parameter
automatically.
While in the process of file name editing, this key is used to input the
character currently selected by the cu rs or.
5.
During parameter editing process, press this key to clear the inputs in the
active function area and exit parameter input.
While in the process of file name editing, press this key to delete
characters that have been entered.
Press this key to turn off the display of the active function area when the
main measurement screen is displayed.
Press this key to exit the current test mode in keyboard test.
Press this key to unlock the screen when it is locked.
When the instrument is in remote mode, use this key to return to local
mode.
6.
During the process of parameter editing, press this key to delete the
character on the left of the c ur so r.
While in the process of file name editing, press this key to delete the
character on the left of the c urs or.
User’s Guide for DSA800E Series
Find Quality Products Online at: sales@GlobalTestSupply.com
www.GlobalTestSupply.com

Chapter 1 Quick Start RIGOL
1-15
1 2 3
Rear Panel
The rear panel of DSA800E is as shown in the figure below.
1. AC Power Connector
The AC power supply specification of this spectrum analyzer is 100-240 V,
45-440 Hz.
2. Fuse Seat
You can replace the fuse. DSA800 supports 250V AC, T2A fuse.
3. Security Lock Hole
If needed, you can use a security lock (buy it yourself) to lock the analyzer to
a desired location.
4. Handle
Users can adjust the handle to the vertical position for easier carry of the
analyzer.
5. 10MHz IN
DSA800E can use internal or external reference source.
When a 10 MHz external clock signal is received through the [10MHz IN]
Figure 1-9 Rear Panel
9
8
7
6
5
4
User’s Guide for DSA800E Series
Find Quality Products Online at: sales@GlobalTestSupply.com
www.GlobalTestSupply.com

RIGOL Chapter 1 Quick Start
1-16
connector, this signal is used as the external reference source and "Ext
Ref" is displayed in the status bar of the user interface. When the
external reference is lost, transfinite or not connected, the instrument
swithes to its internal reference source automatically and "Ext Ref" on the
screen disappears.
The [10MHz IN] and [10MHz OUT] connectors are usually used to
build synchronization among multiple instruments.
6. 10MHz OUT
DSA800E can use internal or external reference source.
When internal reference source is used, the [10MHz OUT] connector
can output a 10 MHz clock signal generated by the analyzer. This signal
can be used to synchronize other instruments.
The [10MHz OUT] and [10MHz IN] connectors are usually used to
build synchronization among multiple instruments.
7. TRIGGER IN
In external trigger mode, the connector receives an external trigger signal
through a BNC cable.
8. LAN Interface
Through this interface, the analyzer can be connected to your local network
for remote control. An integrated testing system can be built quickly, as the
analyzer conforms to LXI Core 2011 Device instrument standards.
9. USB Device Interface
The analyzer can serve as a "slave" device to connect external USB devices.
Through this interface, a PictBridge printer can be connected to print screen
image or a PC can be connected to control DSA800E remotely through
programming or PC software.
User’s Guide for DSA800E Series
Find Quality Products Online at: sales@GlobalTestSupply.com
www.GlobalTestSupply.com

Chapter 1 Quick Start RIGOL
1-17
NO.
Name
Description
RIGOL
RIGOL
User Interface
Figure 1-10 User Interface
Tab le 1-3 User interface labels
1
2 System status
( "UNCAL" and
"Identification…"
are displayed in
different place as
others; refer to the
figure above)
3 External reference Ext Ref
4 Time System time
5 Input impedance Show "75Ω" if the current input impedance is 75Ω.
6 Printer status
User’s Guide for DSA800E Series
Logo of
Auto Tune
Auto Range
Wait for Trigger
Calibrating
UNCAL (Measurement is not calibrated)
Identification… (LXI instrument is identified)
: displayed alternatively, denote the printer
Find Quality Products Online at: sales@GlobalTestSupply.com
www.GlobalTestSupply.com

RIGOL Chapter 1 Quick Start
1-18
ursor. Note that Y indicates
connection is in process.
: denote the connection succeeds, the print
finishes or the printer is idle.
: displayed alternatively, denote the print is
in process.
: denote the print has been paused.
7 Print process Show the current print copy and total print copies.
8 USB storage device
status
is displayed when USB storage device is
installed.
9 Operation status Display "Local" (in local mode) or "Rmt" (in remote
mode).
10 Menu title Function of the current menu.
11 Menu items Menu items of the current function.
12 Reference level Reference level.
13 Active function area Current parameter and its value.
14 Attenuator settings Attenuator settings.
15 Trigger level Set the trigger level in video trigge r.
16 Display line Reading reference and threshold condition for
peak value display.
17 Average times Average times of trace.
18 Cursor X Current X value of the cursor. Note that X indicates
different physical quantities in different functions.
19 Cursor Y Current Y value of the c
different physical quantities in different functions.
20 Invalid data Current measured data is invalid as a full sweep
dosen’t complete after the system parameters
have been modified.
21 Menu page number Show the current page number and total number
of pages.
22 Sweep position Current sweep position.
23 Sweep time Sweep time.
24 Span or stop
frequency
The frequency range of the current sweep channel
can be expressed by the combination of center
frequency and span or the combination of start
frequency and stop frequency.
25 Manual setting The corresponding parameter is in manual setting
User’s Guide for DSA800E Series
Find Quality Products Online at: sales@GlobalTestSupply.com
www.GlobalTestSupply.com

Chapter 1 Quick Start RIGOL
1-19
User Key
User Key
symbol mode.
26 VBW Video bandwidth.
27 Spectrum line
Display the spectrum line.
display area
28 RBW Resolution bandwidth.
29 Center or start
frequency
The frequency range of the current sweep channel
can be expressed by the combination of center
frequency and span or the combination of start
frequency and stop frequency.
30 Y scale Label of Y scale.
31 Parameter status Icons on the left side of the screen indicate the
status of system parameters.
32 Detector type Pos peak, Neg peak, Sample, Normal, RMS Avg,
Voltage Avg and Quasi-Peak.
33 Trigger type Free, video and external.
34 Sweep mode Continuous or Single sweep (with the current
number of sweeps)
35 Correction switch Turn amplitude correction on or off.
36 Signal tracking Enable or disable the signal tracking function.
37 Preamplifier status Enable or disable the preamplifier.
38 Trace 1 type and
status
Trace types: Clear Write, Max Hold, Min Hold,
Video Avg, Power Avg and Freeze.
Trace status: yellow denotes On and gray denotes
Off.
39 Trace 2 type and
status
Trace types: Clear Write, Max Hold, Min Hold,
Video Avg, Power Avg and Freeze.
Trace status: purple denotes On and gray denotes
Off.
40 Trace 3 type and
status
Trace types: Clear Write, Max Hold, Min Hold,
Video Avg, Power Avg and Freeze.
Trace status: light blue denotes On and gray
denotes Off.
41 MATH trace type and
status
Trace types: A-B, A+Const, A-Const.
Trace status: green denotes On and gray denotes
Off.
42
User’s Guide for DSA800E Series
Find Quality Products Online at: sales@GlobalTestSupply.com
definition Display the definition of
www.GlobalTestSupply.com
.

RIGOL Chapter 1 Quick Start
1-20
of Y-axis changes to dBm.
Menu Operation
There are 7 types of menus according to their operation modes. Each type of menu
and its operation method are introduced below.
1. Parameter Input
When selected, use the numeric keys to modify the
parameters directly.
For example, select Center Freq, input the desired figure
2. State Switching
3. Enter Lower Menu (with parameter)
and press Enter to change the center frequency.
Press the corresponding menu key to switch between
the sub-options.
For example, press Signal Track to enable or disable
the signal tracking function.
Press the corresponding menu key to enter the lower
menu and change the option currently selected. The
parameter in the upper menu will change when you
4. Enter Lower Menu (without parameter)
return to the upper menu.
For example, press Units to enter the lower menu.
Select dBm and return to the previous menu. The unit
Press the corresponding menu key to enter the lower
menu.
For example, press Corrections to enter the lower
menu directly.
User’s Guide for DSA800E Series
Find Quality Products Online at: sales@GlobalTestSupply.com
www.GlobalTestSupply.com

Chapter 1 Quick Start RIGOL
1-21
5. Direct Execution
Press the key to execute the corresponding function.
For example, press Peak->CF to execute a peak search
and set the center frequency of the analyzer to the
frequency of the current peak signal.
6. Function Switch + Parameter Input
Press the corresponding menu key to switch between
functions; change the parameter directly using the
numeric keys.
For example, press CF Step to switch between Auto
and Manual; if Manual is selected, you can directly
input the desired number to change the CF Step.
7. State Selection
Press the corresponding menu key to modify the
parameter and return to the menu one level up.
For example, press Trig Type Free Run to select
free trigger and the analyzer is in Free Run state at
present.
User’s Guide for DSA800E Series
Find Quality Products Online at: sales@GlobalTestSupply.com
www.GlobalTestSupply.com

RIGOL Chapter 1 Quick Start
1-22
Parameter Setting
You can use the numeric keys, the knob, or the arrow keys to enter the desired
parameter values.
through an example (to set the center frequency to 800 MHz).
1. Use the numeric keyboard
1) Press FREQ
2) Input 800 using the numeric keys;
3) Select the desired unit (MHz) from the popup menu.
2. Use the knob
When the parameter is editable (namely when the parameter is selected),
turn the knob clockwise to increase or counterclockwise to decrease the
parameter value at the specified step.
1) Press FREQ
2) Rotate the knob until the parameter is set to the desired value (800 MHz).
This section describes the three methods of parameter setting
Center Freq;
Center Freq;
Figure 1-11 The Knob
Note: In the storage function, the knod can also be used to select the
currentpath or file.
3. Use the arrow keys
When the parameter is editable (namely when the parameter is selected), you
can use the arrow keys to increase or decrease the parameter value at the
specific step.
1) Press FREQ
2) Press the up/down arrow key until the parameter is set to the desired
value (800 MHz).
Center Freq;
User’s Guide for DSA800E Series
Find Quality Products Online at: sales@GlobalTestSupply.com
www.GlobalTestSupply.com

Chapter 1 Quick Start RIGOL
1-23
Figure 1-12 Arrow Keys
Note: In the storage function, the arrow keys can also be used to select the
current path or file.
User’s Guide for DSA800E Series
Find Quality Products Online at: sales@GlobalTestSupply.com
www.GlobalTestSupply.com

RIGOL Chapter 1 Quick Start
1-24
To Input Filename
DSA800E supports filenames consisting of Chinese characters, English letters,
numbers and #.
1. Enter the filename input interface
Press Storage and select the desired file type and storage location. Then
press Save to enter the filename input interface. You can press to
switch among English, Chinese and number input modes.
Pinyin Selecting Area Chinese Character Selecting Arear
Chinese Characters Entered Chinese Input Mode
(a) Chinese Input Mode
Letter Selecting Area Uppercase/Lowercase
Letters Entered English Input Mode
(b) English Input Mode
User’s Guide for DSA800E Series
Find Quality Products Online at: sales@GlobalTestSupply.com
www.GlobalTestSupply.com

Chapter 1 Quick Start RIGOL
1-25
Number Input Mode
Numbers Entered
(c) Number Input Mode
Figure 1-13 Filename Input Interface
Tip:
If a USB storage device is currently connected, the instrument will also enter
the filename input interface when
is pressed.
2. Input Chinese Filename
1) Press
to switch to Chinese input mode. At this point, the
corresponding label is displayed at the lower right corner of the filename
input interface.
2) Press the key of the first letter of the pinyin of the Chinese character. At
this point, the pinyins available are displayed in the pinyin selecting
area and the corresponding Chinese characters of the pinyin currently
selected are displayed in the Chinese character selecting area. If the
desired pinyin is displayed, refer to 3). Otherwise, please continue to
input the other letters in the pinyin and then refer to 3).
3) Rotate the knob until the background color of the desired pinyin becomes
brown. Then, press Enter to select the pinyin. At this point, the
corresponding Chinese characters are numbered and displayed in the
Chinese character selecting area. Use the numeric keys to select the
desired Chinese character. You can also use the the arrow keys to open
the previous or next page in the Chinese character selecting area.
4) Use the same method to input the other Chinese characters.
3. Input English Filename
1) Press
User’s Guide for DSA800E Series
Find Quality Products Online at: sales@GlobalTestSupply.com
to switch to English input mode. You can also press to
www.GlobalTestSupply.com
RIGOL Chapter 1 Quick Start
1-26
switch between upper and lower cases. At this point, the corresponding
label is displayed at the lower right corner of the filename input interface.
2) Press the key of the desired letter. At this point, the letters available are
displayed in the letter selecting area. Press this key repeatedly or
retate the knob until the desired letter is selected (the background color
of the letter becomes brown). Then press Enter to input the desired
letter.
3) Use the above method to input the other letters.
Tip:
If you need to use numbers as the filename (or part of the filename), press
to switch to number input mode and use the numeric keys to input the desired
number.
User’s Guide for DSA800E Series
Find Quality Products Online at: sales@GlobalTestSupply.com
www.GlobalTestSupply.com

Chapter 1 Quick Start RIGOL
1-27
To Lock the Keyboard
You can lock one or more function keys or all keys (except the power switch) and
knob at the front panel using keyboard lock commands.
1. The intrudction of keyboard lock commands
:SYSTem:KLOCk ON|OFF|1|0,<key> /* Lock or unlock the specified key*/
:SYSTem:KLOCk? <key> /* Query whether the specified key is
locked*/
Wherein, the parameter <key> is used to specify the keys. The range of this
parameter is as follows.
FREQ|SPAN|AMP| /*FREQ, SPAN, AMPT keys*/
BW|SWEEP|TRACE|TG| /*BW/Det, Sweep/Trig, Trace/P/F, TG
keys*/
MARK|MARKFUNC|MARKTO|PEAK| /*Marker, Marker Fctn, Marker->, Peak
keys*/
TUNE| /*Auto key*/
MEAS|MEASSET|DEMOD| /*Meas, Meas Setup, Demod keys*/
SYSTEM|PRINTSETUP|STORAGE| /*System, Print Setup, Storage keys*/
PRESET|PRINT /* Preset, Print keys*/
The parameter ON|OFF|1|0 is used to lock or unlock the key. Select ON|1
to lock the specified key; select OFF|0 to unlock the specified key. When
more than one key is locked or unlocked at the same time, please use "," to
separate the keys.
:SYSTem:KLOCk ON|1,ALL /*Lock all keys (except the power
switch) and knob at the front panel*/
:SYSTem:KLOCk OFF|0,ALL /*Unlock all keys and knob at the front
panel*/
2. Send the commands to lock or unlock the keyboard via Ultra Sigma
Build the communication between spectrum analyzer and the PC.
Start up the Ultra Sigma and search for the instrument resources.
Open the remote command control panel and send the above commands.
User’s Guide for DSA800E Series
Find Quality Products Online at: sales@GlobalTestSupply.com
www.GlobalTestSupply.com

RIGOL Chapter 1 Quick Start
1-28
To Use the Built-in Help
The built-in help system provides information about every function key at the front
panel and every menu softkey.
1. How to acquire built-in help
Press Help and a prompt about how to obtain help information will be shown
at the center of the screen. Then, press the key that you want to get help of
and the relevant help information will be shown at the center of the screen.
2. Page up and down
If there is more than one page of information, you can read the help
information on the previous or next page using the arrow keys or the knob.
3. Close the current help information
Press any key at the front panel to close the help information currently
displayed at the center of the screen.
4. Acquire the menu help
Press Help and the help information display window is displayed at the center
of the screen. Then, press the menu key and the help information of the
corresponding menu item is displayed.
5. Acquire the help information of any function key
Press Help and the help information display window is displayed at the center
of the screen. Then, press any function key and the corresponding function
help information is displayed.
User’s Guide for DSA800E Series
Find Quality Products Online at: sales@GlobalTestSupply.com
www.GlobalTestSupply.com

Chapter 1 Quick Start RIGOL
1-29
Figure 1-14 The Built-in Help Interface
User’s Guide for DSA800E Series
Find Quality Products Online at: sales@GlobalTestSupply.com
www.GlobalTestSupply.com

RIGOL Chapter 1 Quick Start
1-30
To Use the Security Lock
If necessary, use a security lock to lock the analyzer in a desired location. As shown
in the figure below, align the lock with the lock hole and plug it into the lock hole
vertically, turn the key clockwise to lock the instrument and then pull the key out.
Key
Security Lock
Security Lock Hole
Figure 1-15 To Use the Security Lock
Note: Please do not insert other articles into the security lock hole to avoid
damaging the instrument.
User’s Guide for DSA800E Series
Find Quality Products Online at: sales@GlobalTestSupply.com
www.GlobalTestSupply.com

Chapter 1 Quick Start RIGOL
1-31
To Replace the Fuse
Please replace the old fuse with specified fuse according to the following steps
when needed:
1. Turn off the instrument, cut off the power and remove the power cord.
2. Use a small straight screw driver to prize out the fuse seat.
3. Take out the fuse seat.
4. Replace the old fuse with a specified fuse.
5. Install the fuse seat.
Fuse
Fuse Seat
Figure 1-16 To Replace the Fuse
WARNING
Please ensure that the instrument has been turned off, the power source
has been cut off and the fuse to be used is a specified one before
replacing the fuse in order to avoid electric shock.
User’s Guide for DSA800E Series
Find Quality Products Online at: sales@GlobalTestSupply.com
www.GlobalTestSupply.com

Chapter 2 Front Panel Operation RIGOL
2-1
Chapter 2 Front Panel Operation
This chapter describes in detail the function keys at the front panel and the
associated functions.
Subjects in this chapter:
Basic Settings
Sweep and Function Settings
Measurement Settings
Marker Measurements
Shortcut Key
System Settings
User’s Guide for DSA800E Series
Find Quality Products Online at: sales@GlobalTestSupply.com
www.GlobalTestSupply.com

RIGOL Chapter 2 Front Panel Operation
2-2
start
f
stop
f
center
f
span
f
2)(
startstopcenter
fff +=
startstopspan
fff −=
Basic Settings
FREQ
Set the frequency parameters of the analyzer. The analyzer sweeps within a
specified frequency range and restarts sweeping every time the frequency
parameters are modified.
The frequency range of a channel can be expressed by either of two groups of
parameters: Start Frequency and Stop Frequency (
/
Frequency and Span (
). If any of the parameters is changed, the
/
); or Center
others would be adjusted automatically in order to ensure the coupling relationship
among them:
(2-1)
(2-2)
User’s Guide for DSA800E Series
Find Quality Products Online at: sales@GlobalTestSupply.com
www.GlobalTestSupply.com

Chapter 2 Front Panel Operation RIGOL
2-3
Default
Range*
Unit
Center Freq
Set the center frequency of the current channel. Press this key to switch to center
frequency/span input mode. The center frequency and span values are displayed
at the lower left and right sides of the grid respectively.
Key Points:
The start and stop frequencies vary with the center frequency when the span
is constant.
Changing the center frequency horizontally shifts the current channel and the
adjustment is limited by the specified frequency range.
In Zero Span mode, the start frequency, stop frequency and center frequency
are always the same. If one is changed, the others are updated to match.
You can use the numeric keys, the knob, or the arrow keys to modify the
parameter. Refer to "Parameter Setting" for more details.
Tab le 2-1 Center Frequency
Parameter Explanation
1.6 GHz
0 Hz to 3.2 GHz
GHz, MHz, kHz, Hz
Knob Step Span > 0, step = Span/200
Span = 0, step = RBW/100
Min = 1 Hz
Arrow Key Step CF step
Note: *The range is from 50 Hz to (3.2 GHz-50 Hz) in non-zero span.
Start Freq
Set the start frequency of the current channel. Press this key to switch to
start/stop frequency input mode. The start and stop frequencies are displayed at
the lower left and right sides of the grid respectively.
Key Points:
The span and center frequency vary with the start frequency. The change of
User’s Guide for DSA800E Series
Find Quality Products Online at: sales@GlobalTestSupply.com
www.GlobalTestSupply.com

RIGOL Chapter 2 Front Panel Operation
2-4
Knob Step
span would affect other system parameters. For more details, please refer to
"Span".
In Zero Span mode, the start frequency, stop frequency and center frequency
are always the same. If one is changed, the others are updated to match.
You can use the numeric keys, the knob, or the arrow keys to modify the
parameter. Refer to "Parameter Setting" for more details.
Tab le 2-2 Start Frequency
Parameter Explanation
Default 0 GHz
Range* 0 Hz to 3.2 GHz
Unit GHz, MHz, kHz, Hz
Span > 0, step = Span/200
Span = 0, step = RBW/100
Min = 1 Hz
Arrow Key Step CF step
Note: *The range is from 0 Hz to (3.2 GHz-100 Hz) in non-zero span.
Stop Freq
Set the stop frequency of the current channel. Press this key to switch to start/stop
frequency input mode. The start and stop frequencies are displayed at the lower
left and right sides of the grid respectively.
Key Points:
The span and center frequency vary with the stop frequency. The change of
span would affect other system parameters. For more details, please refer to
"Span".
In Zero Span mode, the start frequency, stop frequency and center frequency
are always the same. If one is changed, the others are updated to match.
You can use the numeric keys, the knob, or the arrow keys to modify the
parameter. For more details, please refer to "Parameter Setting".
User’s Guide for DSA800E Series
Find Quality Products Online at: sales@GlobalTestSupply.com
www.GlobalTestSupply.com

Chapter 2 Front Panel Operation RIGOL
2-5
Arrow Key Step
Tab le 2-3 Stop Frequency
Parameter Explanation
Default 3.2 GHz
Range* 0 Hz to 3.2 GHz
Unit GHz, MHz, kHz, Hz
Knob Step Span > 0, step = Span/200
Span = 0, step = VBW/100
Min = 1 Hz
CF step
Note: *The range is from 100 Hz to 3.2 GHz in non-zero span.
Freq Offset
You can set a frequency offset value to account for frequency conversions between
the device under test and the input terminal of the spectrum analyzer.
Key Points:
The change of this parameter only changes the display values of the center
frequency, start frequency and stop frequency; but does not impact any
hardware settings of the spectrum analyzer.
You can use the numeric keys, the knob, or the arrow keys to modify the
parameter. For more details, please refer to "Parameter Setting".
To eliminate an offset, you can perform Preset operation or set the frequency
offset to 0Hz.
Tab le 2-4 Frequency Offset
Parameter Explanation
Default 0 Hz
Range -100 GHz ~ 100 GHz
Unit GHz, MHz, kHz, Hz
Knob Step 16 MHz
Arrow Key Step CF Step
User’s Guide for DSA800E Series
Find Quality Products Online at: sales@GlobalTestSupply.com
www.GlobalTestSupply.com

RIGOL Chapter 2 Front Panel Operation
2-6
Parameter
Explanation
CF Step
Set the step of center frequency. Changing the center frequency in a fixed step
continuously switches the channel to be measured.
Key Points:
The CF step can be set in "Manual" or "Auto" mode. In Auto mode, the CF step
is 1/10 of the span in Non-zero span mode or equals the RBW while in Zero
span mode; in Manual mode, you can set the step using the numeric keys.
After you set an appropriate CF step and select Center Freq, use the up and
down arrow keys to switch between measurement channels in a specified
step in order to sweep the adjacent channel manually.
You can use the numeric keys, the knob, or the arrow keys to modify the
parameter. For more details, please refer to "Parameter Setting".
Tab le 2-5 CF Step
Default 320 MHz
Range 1 Hz to 3.2 GHz
Unit GHz, MHz, kHz, Hz
Knob Step Span > 0, step = Span/200
Span = 0, step = 100 Hz
Min = 1 Hz
Arrow Key Step in 1, 2, 5 sequence
Signal Track
Turn on or off signal track. This function is used to track and measure signal with
unstable frequency and less than 3 dB transient variation in amplitude. Place
Marker1 (see "Marker Measurements") onto the signal under measurement to
track and measure the variation of the signal continuously.
The signal track process is as shown in the figure below:
User’s Guide for DSA800E Series
Find Quality Products Online at: sales@GlobalTestSupply.com
www.GlobalTestSupply.com

Chapter 2 Front Panel Operation RIGOL
2-7
Start
Execute a
sweep
Search for
peak and
mark it as
Marker
Active Marker
exists?
N
Set marker
frequency to
center freq
Y
Execute the
next sweep
Search for and mark the
frequency point (variation
< 3dB) near the Marker
Figure 2-1 Process of Signal Track
Key Points:
When Signal Track is turned on, the ST (Signal Track) icon
is highlighted
in the status bar at the left of the screen.
If an active marker currently exists, when Signal Track is enabled, the
instrument will search for and mark the point (with no more than 3 dB
variation in amplitude) near the marker as well as set the frequency of this
point as the center frequency to hold the signal at the center of the screen.
If no marker is currently active, when Signal Track is enabled, the instrument
will activate Marker 1, execute a peak search automatically and set the
frequency of the current peak as the center frequency to hold the signal at the
center of the screen.
In continuous sweep, the system tracks the signal continuously; in single
sweep, the instrument only performs a single signal track; in Zero Span,
Signal Track is invalid.
User’s Guide for DSA800E Series
Find Quality Products Online at: sales@GlobalTestSupply.com
www.GlobalTestSupply.com

RIGOL Chapter 2 Front Panel Operation
2-8
Peak -> CF
Execute a peak search and use the frequency of the current peak as the center
frequency (CF) of the analyzer. The function is invalid in Zero Span mode.
Peak
Center Freq
Figure 2-2 Before Peak->CF
Peak
Center Freq
Figure 2-3 After Peak->CF
User’s Guide for DSA800E Series
Find Quality Products Online at: sales@GlobalTestSupply.com
www.GlobalTestSupply.com

Chapter 2 Front Panel Operation RIGOL
2-9
CF -> Step
Set the current center frequency as the CF step. At this point,
the CF step will switch to "Manual" mode automatically. This function is usually
used with channel switching. Take harmonic waveform measurement for example:
locate a signal at the center frequency of a channel, execute CF-> Step and then
press the down arrow key continuously to measure each order of harmonic in
sequence.
SPAN
Set the span of the analyzer. The change of this parameter will affect the frequency
parameters and restart the sweep.
Span
Set the frequency range of the current channel. Press this key to switch to center
frequency/span input mode. The center frequency and span are displayed at the
lower left and right sides of the grid respectively.
Key Points:
The start and stop frequencies vary with the span when the center frequency
is constant.
In manual span mode, the span can be set down to 100 Hz (the only way into
the zero-span mode is pressing the Zero Span menu option) and up to the
full span described in "
maximum, the analyzer enters full span mode.
Modifying the span in non-zero span mode may cause an automatic change in
both CF step and RBW if they are in Auto mode. Besides, the change of RBW
may influence VBW (in Auto VBW mode).
Variation in the span, RBW or VBW would cause a change in the sweep time.
In non-zero span mode, neither "Video" trigger nor "1/Δtime" readout
function is valid.
You can use the numeric keys, the knob, or the arrow keys to modify the
Specifications". When the span is set to the
User’s Guide for DSA800E Series
Find Quality Products Online at: sales@GlobalTestSupply.com
www.GlobalTestSupply.com
RIGOL Chapter 2 Front Panel Operation
2-10
Arrow Key Step
parameter. For more details, please refer to "Parameter Setting".
Tab le 2-6 Span
Parameter Explanation
Default 3.2 GHz
Range* 0 Hz to 3.2 GHz
Unit GHz, MHz, kHz, Hz
Knob Step Span/200, Min = 1 Hz
in 1, 2, 5 sequence
Note: *0 Hz is available only in zero span.
Full Span
Set the span of the analyzer to the maximum.
Zero Span
Set the span of the analyzer to 0 Hz. Both the start and stop frequencies will equal
the center frequency and the horizontal axis will denote time. The analyzer
measures the time domain characteristics of the amplitude of the corresponding
frequency point on the input signal.
Key Points:
As opposed to Non-zero span, the screen shows the time domain characteristics of
the fixed frequency component of the signal in zero span mode.
The following functions are invalid in Zero span mode:
FREQ: Peak->CF and Signal Track;
SPAN: Zoom In and Zoom Out;
Marker->: Mkr->CF, Mkr->Step, Mkr->Start, Mkr->Stop, MkrΔ->CF and
MkrΔ->Span;
Marker Readout: Frequency, Period and 1/ΔTime (valid in Delta marker
type).
User’s Guide for DSA800E Series
Find Quality Products Online at: sales@GlobalTestSupply.com
www.GlobalTestSupply.com

Chapter 2 Front Panel Operation RIGOL
2-11
Zoom In
Set the span to half of its current value. At this point, the signal on the screen is
zoomed in to observe signal details.
Zoom Out
Set the span to twice the current value. At this point, the signal on the screen is
zoomed out to gain more information about the signal.
Last Span
Set the span to the previous span setting.
X Scale
Select the scale type of X-axis to Lin or Log. The default is Lin.
Key Points:
In Log scale type, the frequency scale of X-axis is displayed in the logarithmic
form.
When the scale type of X-axis is set to Log and any advanced measurement
function (including T-P ow er, ACP (Adjacent Channel Power), Chan Pwr
(Channel Power), OBW (Occupied Bandwidth), EBW (Emission Bandwidth),
C/N Ratio, Harmo Dist (Harmonic Distortion) and TOI (Third Order
Intermodulation)) is selected, the instrument switches the scale type of X-axis
to Lin automatically.
User’s Guide for DSA800E Series
Find Quality Products Online at: sales@GlobalTestSupply.com
www.GlobalTestSupply.com

RIGOL Chapter 2 Front Panel Operation
2-12
AMPT
Set the amplitude parameters of the analyzer. Through modifying these
parameters, signals under measurement can be displayed in a proper mode for
easier obsercation and minimum error.
Auto Scale
This function enables the readout resolution of the Y-axis to be the maximum
possible while at the same time ensures the completeness of the signal. When
enabled, the system sets the reference level automatically in order to place the
peak of the signal within the topmost grid for easier observation of the trace.
Figure 2-4 Before Auto Scale
User’s Guide for DSA800E Series
Find Quality Products Online at: sales@GlobalTestSupply.com
www.GlobalTestSupply.com

Chapter 2 Front Panel Operation RIGOL
2-13
mixPARFRef
LaaL ≤+−
Ref
L
RF
a
PA
a
mix
L
Figure 2-5 After Auto Scale
Ref Level
Set the maximum power or voltage can be currently displayed in the window. The
value is displayed at the upper left corner of the screen grid.
Key Points:
The maximum reference level available is affected by the maximum mixing
level, input attenuation and preamplifier. When you adjust it, the input
attenuation is adjusted under a constant maximum mixing level in order to
fulfill the following inequality:
(2-3)
Wherein,
attenuation, preamplifier and maximum mixing level respectively.
You can use the numeric keys, the knob, or the arrow keys to modify the
parameter. For more details, please refer to "Parameter Setting".
,
,
and
denote the reference level, input
User’s Guide for DSA800E Series
Find Quality Products Online at: sales@GlobalTestSupply.com
www.GlobalTestSupply.com

RIGOL Chapter 2 Front Panel Operation
2-14
Arrow Key Step
Tab le 2-7 Reference Level
Parameter Explanation
Default 0 dBm
Range -100 dBm to 20 dBm
Unit dBm, -dBm, mV, uV
Knob Step In Log scale mode, step = Scale/10
In Lin scale mode, step = 0.1 dBm
Arrow Key Step In Log scale mode, step = Scale
In Lin scale mode, step = 1 dBm
Input Atten
Set the front attenuator of the RF input in order to ensure big signals (or small
signals) to pass through the mixer with low distortion (or low noise).
Key Points:
When the preamplifier is turned on, the input attenuation could be set up to
30 dB. You can adjust the reference level to ensure that the specified
parameter meets the inequality (2-3).
You can use the numeric keys, the knob, or the arrow keys to modify the
parameter. For more details, please refer to "Parameter Setting".
Tab le 2-8 Input Attenuation
Parameter Explanation
Default 10 dB
Range 0 dB to 30 dB
Unit dB
Knob Step 1 dB
5 dB
Scale/Div
Set the logarithmic units per vertical grid division on the display. This function is
only available when the scale type is set to "Log".
User’s Guide for DSA800E Series
Find Quality Products Online at: sales@GlobalTestSupply.com
www.GlobalTestSupply.com

Chapter 2 Front Panel Operation RIGOL
2-15
Parameter
Explanation
Default
Key Points:
By changing the scale, the amplitude range available is adjusted.
The range of the amplitude that can be displayed:
Minimum: reference level – 10 × the current scale value
Maximum: the reference level.
You can use the numeric keys, the knob, or the arrow keys to modify the
parameter. For more details, please refer to "Parameter Setting".
Tab le 2-9 Scale
10 dB
Range 0.1 dB to 20 dB
Unit dB
Knob Step Scale ≥ 1, step = 1 dB
Scale < 1, step = 0.1 dB
Arrow Key Step in 1, 2, 5 sequence
Scale Type
Set the scale type of Y-axis to Lin or Log. The default is Log.
Key Points:
In Log scale type, the Y-axis denotes the logarithmic coordinate; the value
shown at the top of the grid is the reference level and each grid represents the
scale value. The unit of Y-axis will automatically switch to the default unit
(dBm) in Log scale type when the scale type is changed from Lin to Log.
In Lin scale type, the Y-axis denotes the linear coordinate; the values shown
at the top of the grid and the bottom of the grid are the reference level and 0
V respectively. Each grid represents 10% of the reference level and the scale
setting function is invalid. The unit of Y-axis will automatically switch to the
default unit (Volts) in Lin scale type when the scale type is changed from Log
to Lin.
The scale type does not affect the unit of Y-axis.
User’s Guide for DSA800E Series
Find Quality Products Online at: sales@GlobalTestSupply.com
www.GlobalTestSupply.com

RIGOL Chapter 2 Front Panel Operation
2-16
×=
WR
Volts
B
001.0
1
log10md
2
=
V
Volts
VB
µ
µ
1
log20d
=
V
Volts
VB
m1
log20md
R
Volts
Watts
2
=
Units
Set the unit of the Y-axis to dBm, dBmV, dBuV, Volts or Watts. Wherein, dBm,
dBmV and dBuV are for Log scale; Volts and Watts are for Linear scale. The default
is dBm.
Key Points:
The conversion relationships between units are as follows.
(2-4)
(2-5)
(2-6)
(2-7)
Wherein, R denotes the reference resistance.
Ref Offset
Assign an offset to the reference level to compensate for gains or losses generated
between the device under measurement and the analyzer.
Key Points:
The change of this value changes both the reference level readout and the
amplitude readout of the marker; but does not impact the position of the
curve on the screen.
You can use the numeric keys to modify the parameter. For more details,
please refer to "Parameter Setting".
User’s Guide for DSA800E Series
Find Quality Products Online at: sales@GlobalTestSupply.com
www.GlobalTestSupply.com

Chapter 2 Front Panel Operation RIGOL
2-17
Tab le 2-10 Reference Level Offset
Parameter Explanation
Default 0 dB
Range -300 dB to 300 dB
Unit dB
Knob Step N/A
Arrow Key Step N/A
Auto Range
Adjust the amplitude parameters within the current span range automatically in
order to display the whole signal optimally on the screen.
Figure 2-6 Before Auto Range
User’s Guide for DSA800E Series
Find Quality Products Online at: sales@GlobalTestSupply.com
www.GlobalTestSupply.com
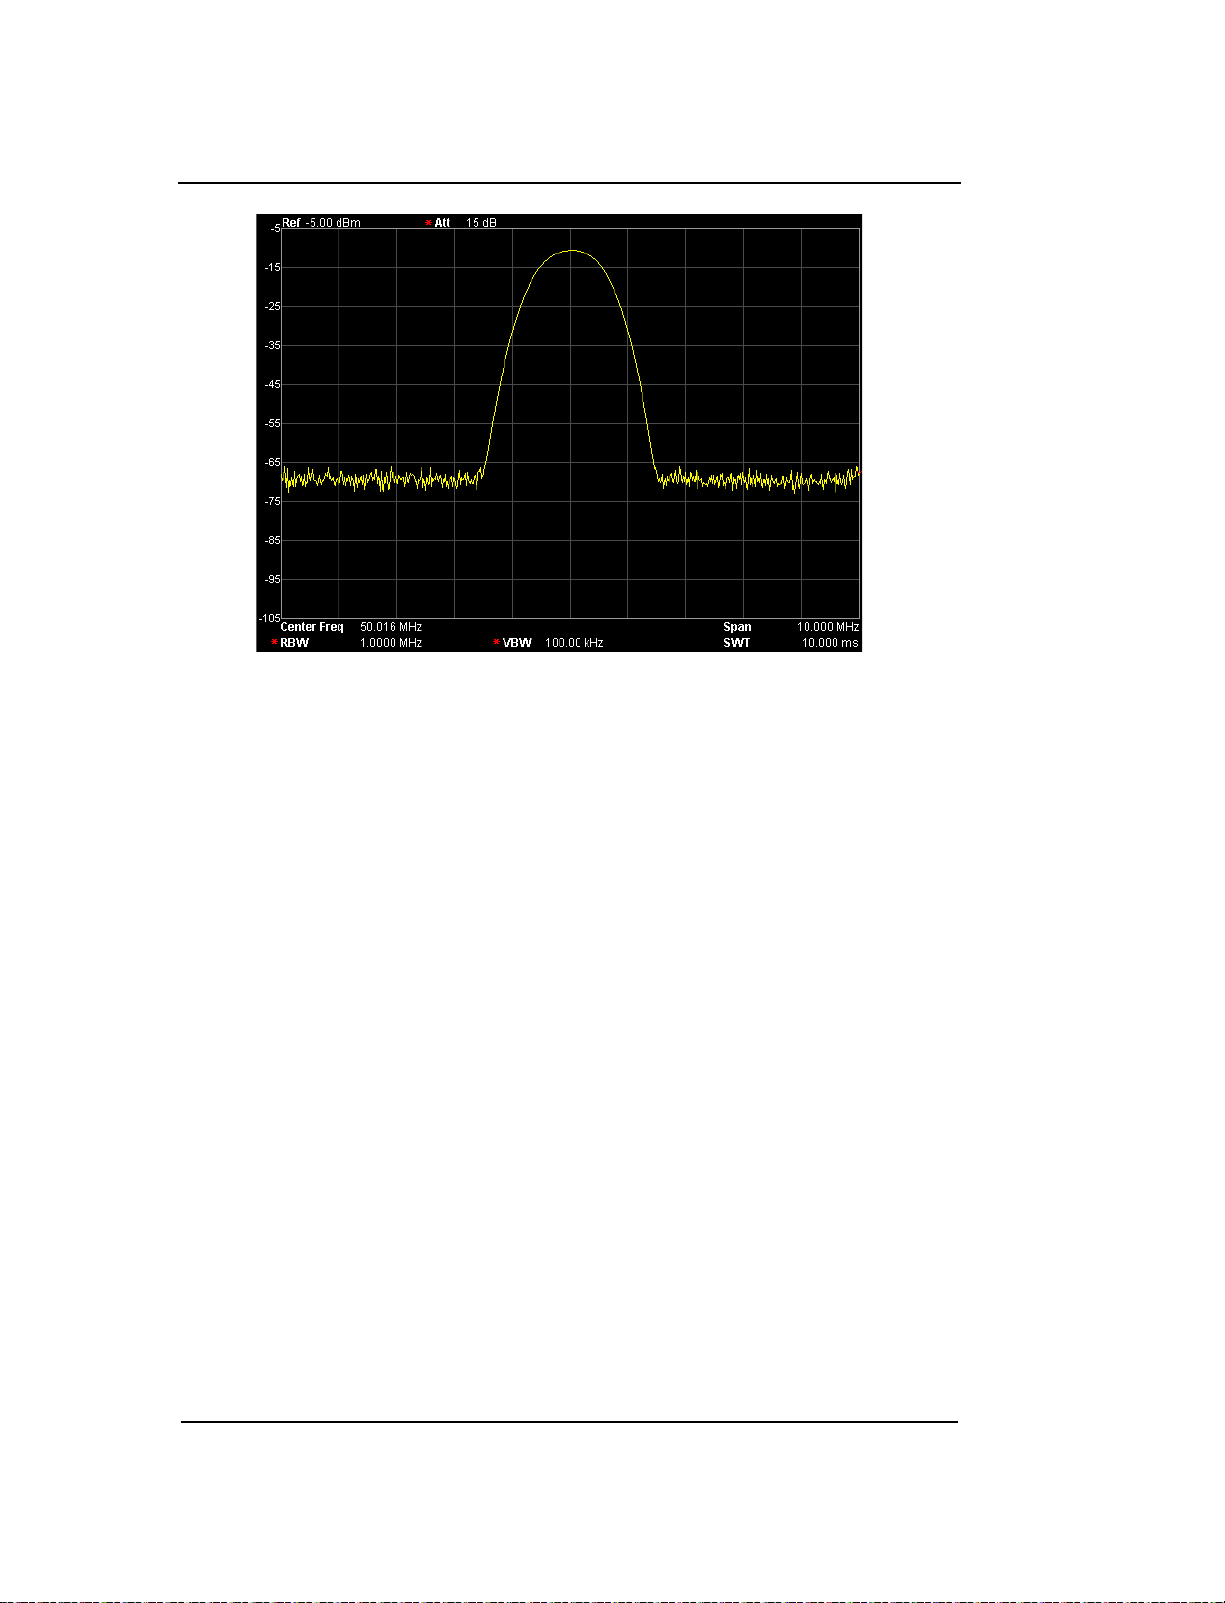
RIGOL Chapter 2 Front Panel Operation
2-18
Figure 2-7 After Auto Range
Key Points:
Unlike Auto Scale, this function can solve the problem of signal overrange due
to parameter settings and adjust the maximum mixing level according to the
signal under measurement.
Unlike Auto, this function adjusts the signal within the current channel and
does not modify the channel frequency setting. While, Auto will search for
signal within the full frequency range and locate the signal at the center
frequency.
User’s Guide for DSA800E Series
Find Quality Products Online at: sales@GlobalTestSupply.com
www.GlobalTestSupply.com

Chapter 2 Front Panel Operation RIGOL
2-19
Start
Peak Search
Adjust Ref Level
Peak > Ref Level?
Decrease maximum
mixing level
Stop
Increase maximum
mixing level
Large signal?
Auto Scale
N
N
Y
Y
Figure 2-8 Process of Auto Range
RF Preamp
Turn on or off the preamplifier located at the front of the RF signal path. When the
signal under measurement is small, turning on the preamplifier can reduce the
displayed average noise level; therefor, you can distinguish small signals from the
noise.
Key Points:
The corresponding icon
the screen when the preamplifier is turned on.
will be highlighted in the status bar at the left side of
Find Quality Products Online at: sales@GlobalTestSupply.com
User’s Guide for DSA800E Series
www.GlobalTestSupply.com

RIGOL Chapter 2 Front Panel Operation
2-20
Correction
Correct the amplitude in order to compensate for the gain or loss from external
devices such as Antenna and Cable. When using this function, you can view the
correction data table and save or load the current correction data. When amplitude
correction is turned on, both the trace and related measurement results will be
corrected; the corresponding icon
the screen.
1. Select
Select a correction factor from Antenna, Cable, Other and User for the current
correction and the default is Off (turn off all the correction factors). After
choosing the desired correction factors, press Correction to enable the
correction factors selected. Multiple correction factors can be enabled at the
same time.
2. Correction
Enable or disable amplitude correction and the default is Off.
When amplitude correction is enabled, the data of the correction factor
currently selected is used for amplitude correction. If multiple factors are
enabled, all related data will be used for amplitude correction.
3. Edit
Edit the frequency of the correction factor and the correction data of the
corresponding amplitude. You can use the numeric keys, the knob, or the
arrow keys to modify the parameter. For details, refer to the table on the next
page.
Note: The edited correction data can be stored in the internal or external
memory of the analyzer and can be recalled when needed. When correction
data editing is finished, press Storage to save the correction data using the
method introduced in "Storage". You can increase the number of point to 2
after "point 1" is edited.
is highlighted in the status bar at the left of
User’s Guide for DSA800E Series
Find Quality Products Online at: sales@GlobalTestSupply.com
www.GlobalTestSupply.com

Chapter 2 Front Panel Operation RIGOL
2-21
Frequency
Del Point
Tab le 2-11 Edit menus of amplitude correction
Menu Explanation
Point Create or edit the data point of a correction factor.
Range: 1 to 200
Set the frequency of the specified point in the correction
factor.
Amplitude
Set the amplitude correction of the specified point in the
correction factor.
Range: -120 dB to 100 dB
Delete the specified point data in the correction factor:
frequency and amplitude correction.
4. Freq Interp
Set the interpolation type of the points between two points in the correction
table during amplitude correction.
In Lin mode, the frequency and amplitude use a Lin and Log unit to
perform interpolation respectively.
In Log mode, both of the parameters use a Log unit.
5. Delete
Clear all the frequency and amplitude correction data of the selected
correction factor.
6. Corr Table
Turn on the correction table to view the correction data edited. At this
moment, the screen is divided into two parts with the upper showing the
measurement curve and the lower showing the points edited, frequency and
amplitude.
7. Corr View
All: view the data of all the correction factors.
Sel: view the data of the selected correction factor.
User’s Guide for DSA800E Series
Find Quality Products Online at: sales@GlobalTestSupply.com
www.GlobalTestSupply.com

RIGOL Chapter 2 Front Panel Operation
2-22
Knob Step
Arrow Key Step
MaxMixL
Set the max input level of the mixer according to the magnitude of the signal.
Key Points:
For a larger input signal, select a smaller maximum mixing level to increase
the input attenuation and reduce the distortion of the signal; for a smaller
input signal, select a larger maximum mixing level to reduce the input
attenuation and noise.
Parameters in inequality (2-3) are always modified on the basis of the
maximum mixing level.
You can use the numeric keys, the knob, or the arrow keys to modify the
parameter. For more details, please refer to "Parameter Setting".
Tab le 2-12 Maximum Mixing Level
Parameter Explanation
Default -10 dBm
Range -30 dBm to 0 dBm
Unit dBm, -dBm, mV, uV
1 dBm
10 dBm
Input Impedance
Set the input impedance for voltage-to-power conversions (refer to equation (2-4)).
The default is 50 Ω. To measure a 75 Ω device, you should use a 75 Ω to 50 Ω
adapter (option) supplied by RIGOL to connect the analyzer with the system
under test and then set the input impedance to 75 Ω.
Note: "75 Ω" will be shown in the status bar on the screen in this situation.
User’s Guide for DSA800E Series
Find Quality Products Online at: sales@GlobalTestSupply.com
www.GlobalTestSupply.com

Chapter 2 Front Panel Operation RIGOL
2-23
Range
Unit
Sweep and Function Settings
BW/Det
Set the RBW (Resolution Bandwidth), VBW (Video Bandwidth) and detector type
parameters of the analyzer.
RBW
Set the desired resolution bandwidth in order to distinguish between signals which
are close in frequency.
Key Points:
Reducing RBW will increase the frequency resolution, but will increase the
sweep time (Sweep Time is affected by a combination of RBW and VBW when
it is in Auto mode).
RBW varies with the span (non-zero span) in Auto RBW mode.
You can use the numeric keys, the knob, or the arrow keys to modify the
parameter. For more details, please refer to "Parameter Setting".
Note: If the detector type is "Quasi-Peak" or the filter type is "EMI", RBW can be
200 Hz, 9 kHz or 120 kHz only.
Tab le 2-13 RBW (Filter Type is Gauss)
Parameter Explanation
Default 1 MHz
10 Hz to 1 MHz
GHz, MHz, kHz, Hz
Knob Step in 1, 3, 10 sequence
Arrow Key Step in 1, 3, 10 sequence
User’s Guide for DSA800E Series
Find Quality Products Online at: sales@GlobalTestSupply.com
www.GlobalTestSupply.com

RIGOL Chapter 2 Front Panel Operation
2-24
Knob Step
Arrow Key Step
VBW
Set the desired video bandwidth in order to filter out the noise outside the video
band.
Key Points:
Reducing the VBW will smooth the spectrum line to differentiate small signals
from noise, but will increase the sweep time (Sweep Time is affected by a
combination of RBW and VBW when it is in Auto mode).
VBW varies with RBW when it is set to Auto. While in Manual mode, VBW is
not affected by RBW.
You can use the numeric keys, the knob, or the arrow keys to modify the
parameter. For more details, please refer to "Parameter Setting".
Tab le 2-14 VBW
Parameter Explanation
Default 1 MHz
Range 1 Hz to 3 MHz
Unit GHz, MHz, kHz, Hz
in 1, 3, 10 sequence
in 1, 3, 10 sequence
V/R Ratio
Set the ratio of VBW to RBW.
Key Points:
This value is different while measuring different kinds of signals:
Sine signal: use 1 to 3 (for faster sweeps)
Pulse signal: use 10 (to reduce the influence on the amplitude of transient
signals)
Noise signal: generally use 0.1 (to obtain the average of noises)
You can use the numeric keys, the knob, or the arrow keys to modify the
parameter. For more details, please refer to "Parameter Setting".
User’s Guide for DSA800E Series
Find Quality Products Online at: sales@GlobalTestSupply.com
www.GlobalTestSupply.com

Chapter 2 Front Panel Operation RIGOL
2-25
Tab le 2-15 V/R Ratio
Parameter Explanation
Default 1
Range 0.0000010 to 30000
Unit N/A
Knob Step in 1, 3, 10 sequence
Arrow Key Step in 1, 3, 10 sequence
Detector Type
The analyzer displays the sweeped signal on the screen in the form of trace.
For each trace point, the analyzer always captures all the data within a specific
time interval and processes (Peak, Average,etc.) the captuered data using the
detector currently selected, then display the processed data (one point) on the
screen .
Key Points:
Select an appropriate detector type according to the actual application in
order to ensure the accuracy of the measurement.
The available types are Pos Peak, Neg Peak, Sample, Normal, RMS Avg,
Voltage Avg and Quasi-Peak. The default is Pos Peak.
The corresponding icon (as shown in the figure below) of the detector type
selected is displayed in the status bar at the left side of the screen.
1. Pos Peak
For each trace point, Positive Peak detector displays the maximum value of
data sampled within the corresponding time interval.
2. Neg Peak
For each trace point, Negative Peak detector displays the minimum value of
data sampled within the corresponding time interval.
User’s Guide for DSA800E Series
Find Quality Products Online at: sales@GlobalTestSupply.com
www.GlobalTestSupply.com

RIGOL Chapter 2 Front Panel Operation
2-26
∑
=
×=
N
iRMS
v
N
V
1i
2
1
RMS
V
N
i
v
R
R
v
P
RMS
2
=
∑
=
×=
N
iAV
v
N
V
1i
1
AV
V
N
i
v
3. Sample
For each trace point, Sample detector displays the transient level
corresponding to the central time point of the corresponding time interval.
This detector type is applicable to noise or noise-like signal.
4. Normal
Normal detector (also called rosenfell detector) displays the maximum value and
the minimum value of the sample data segment in turn; namely for an
odd-numbered data point, the maximum value is displayed; for an
even-numbered data point, the minimum value is displayed. In this way, the
amplitude variation range of the signal is clearly shown.
5. RMS Avg
For each data point, perform mean square root operation (see equation (2-8))
of the sampled data within the corresponding time interval and display the
result. In this type, noise can be rejected and weak signals can be clearly
observed.
(2-8)
Wherein,
is the mean square root of voltage in V;
sampled values for each point displayed;
value in V. The reference impedance
is the envelop of the sampled
can be used for power calculation:
is the number of
.
6. Voltage Avg
For each data point, average (see equation (2-9)) all the sampled data within
the corresponding time interval and display the result.
(2-9)
Wherein,
is the average of voltage in V;
values for each point displayed;
is the envelop of the sampled value in V.
is the number of sampled
User’s Guide for DSA800E Series
Find Quality Products Online at: sales@GlobalTestSupply.com
www.GlobalTestSupply.com

Chapter 2 Front Panel Operation RIGOL
2-27
7. Quasi-Peak (an option for DSA800E)
It is a weighted form of peak detector. For each data point, the detector detects
the peaks within the corresponding time interval. The peaks detected are
weighted using circuit with specified charge and discharge structures as well as
the display time constant specified in the CISPR Publication 16 standards and
the result is displayed. Quasi-Peak detector is applicable to EMI testing.
Note: Compared to the discharge time, the charge time of Quasi-Peak
detector is much shorter and can reflect the amplitude as well as time
distribution of the signal.
Filter Type
Set the RBW filter type.
Key Points:
DSA800E supports two kinds of RBW filters: "Gause" (-3 dB bandwidth) and
"EMI" (-6 dB bandwidth).
When "EMI" is selected, resolution bandwidth can be 200 Hz, 9 kHz or 120
kHz only.
The default is "Gause"; the instrument will switch to "EMI" filter automatically
when "Quasi-Peak" detector is selected.
User’s Guide for DSA800E Series
Find Quality Products Online at: sales@GlobalTestSupply.com
www.GlobalTestSupply.com

RIGOL Chapter 2 Front Panel Operation
2-28
Parameter
Explanation
Default
Sweep/Trig
Set parameters about the Sweep and Trigger functions, including sweep time, auto
sweep time, sweep mode, number of sweep, trigger type, etc.
Sweep Time
Set the time needed for the spectrum analyzer to finish a sweep within the span
range. The sweep time can be set in "Auto" or "Manual" mode and the default is
"Auto".
Key Points:
In non-zero span, the analyzer selects the shortest sweep time on the basis of
the current RBW and VBW settings if Auto is selected.
Decreasing the sweep time would speed the measurement. However, an error
may be caused if the specified sweep time is less than the minimum sweep
time in Auto coupling; at this point, "UNCAL" is shown in the status bar on the
screen.
You can use the numeric keys, the knob, or the arrow keys to modify the
parameter. For more details, please refer to "Parameter Setting".
Tab le 2-16 Sweep Time
16 ms
Range* 20 us to 3200 s
Unit ks, s, ms, us, ns, ps
Knob Step Sweep time/100, Min = 1 us
Arrow Key Step in 1, 1.5, 2, 3, 5, 7.5 sequence
Note: *The minimum in non-zero span mode is 1 ms.
User’s Guide for DSA800E Series
Find Quality Products Online at: sales@GlobalTestSupply.com
www.GlobalTestSupply.com

Chapter 2 Front Panel Operation RIGOL
2-29
Auto SWT
Set the auto setting method of the sweep time to "Normal" or "Accy". The sweep
will be faster if "Normal" is selected; while in "Accy" type, higher measurement
precision can be obtained.
Mode
Set the sweep mode to "Single" or "Cont". The default is "Cont". The
corresponding icon of the sweep mode will be displayed in the status bar at the left
side of the screen.
Single Continuous
1. Single
Set the sweep mode to "Single". The number 10 on the parameter icon
denotes the current sweep number.
2. Cont
Set the sweep mode to "Cont". The character Cont on the parameter icon
denotes the analyzer is sweeping continuously.
Key Points:
If the instrument is in single sweep mode and no measurement function is
enabled, press this key and the system will enter continuous sweep mode and
sweep continuously if the trigger conditions are satisfied.
If the instrument is in single sweep mode and a measurement function is on,
press this key and the system will enter continuous sweep mode and measure
continuously if the trigger conditions are satisfied.
In continuous sweep mode, the system will send a trigger initialization signal
automatically and enter the trigger condition judgment directly after each
sweep.
User’s Guide for DSA800E Series
Find Quality Products Online at: sales@GlobalTestSupply.com
www.GlobalTestSupply.com
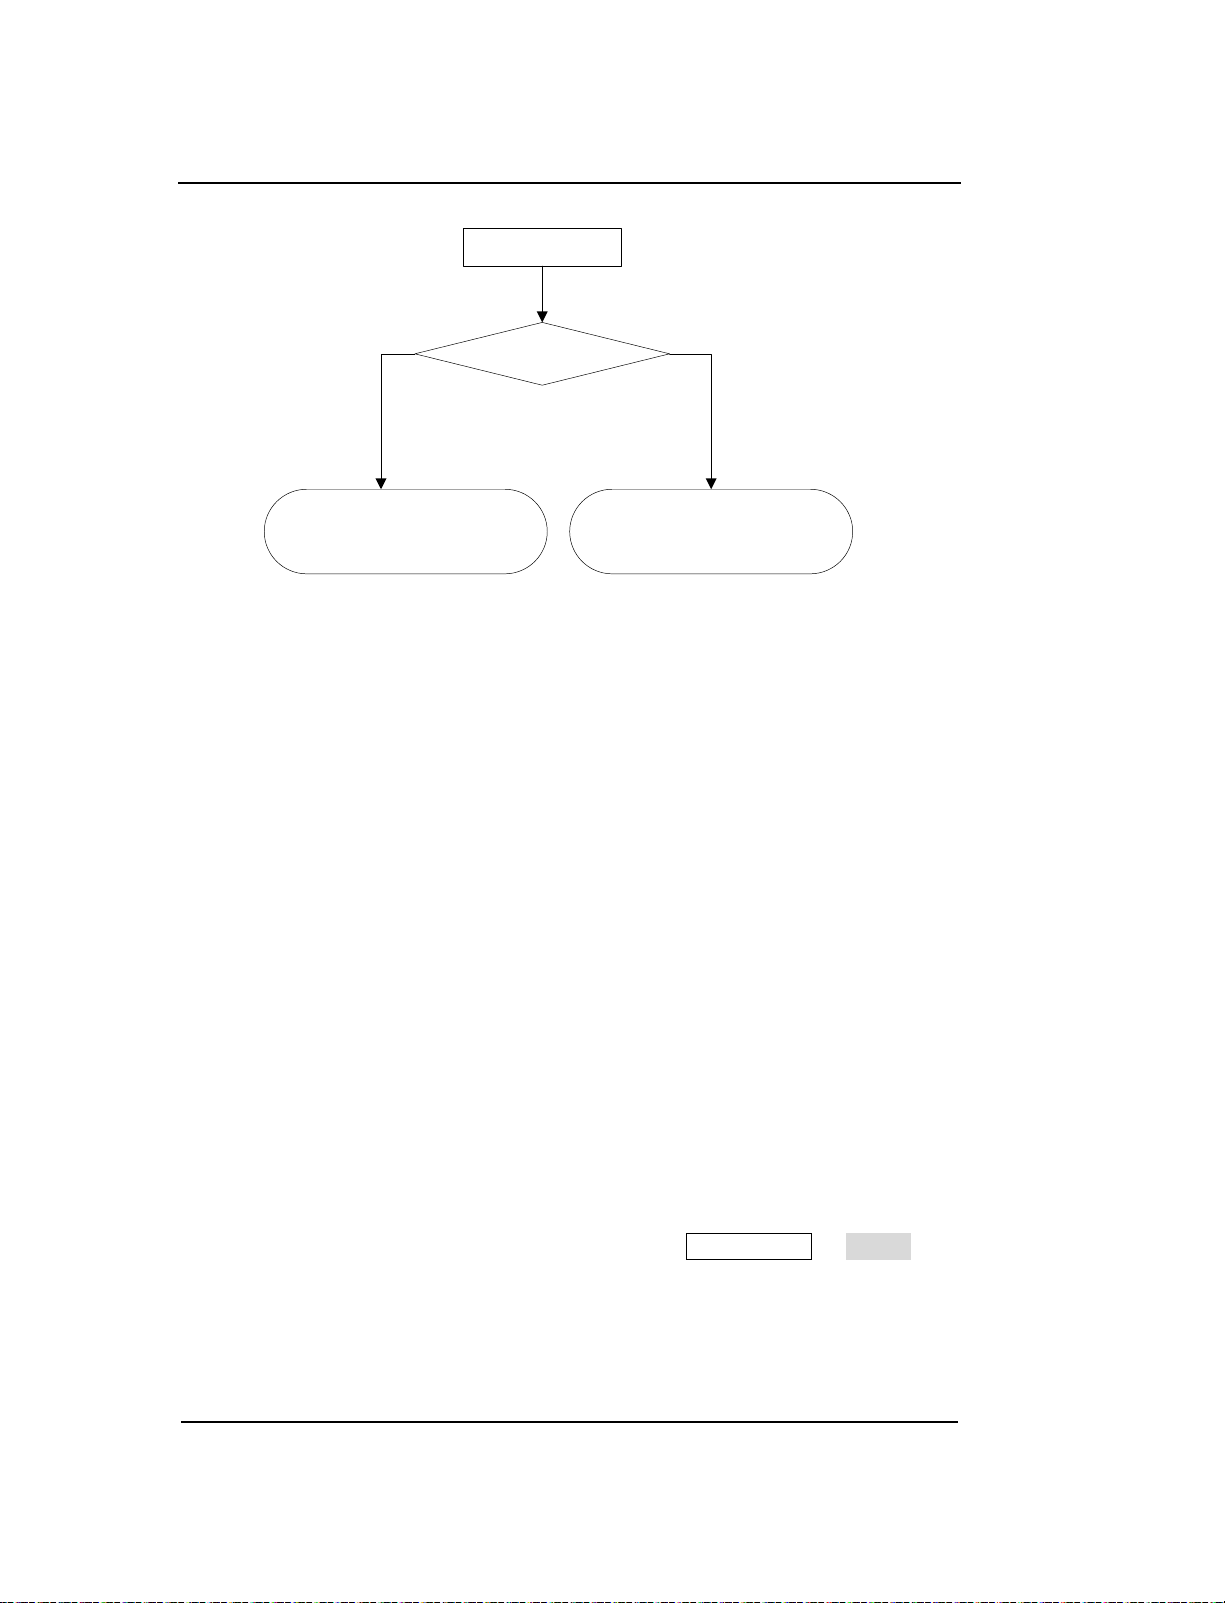
RIGOL Chapter 2 Front Panel Operation
2-30
Enter continuous sweep mode and
wait for trigger condition
Sweep again and wait for trigger
condition
Select
“
Cont
”
Single sweep status?
Y N
Figure 2-9 Process of Continuous Sweep
Single
In single sweep mode, this menu is used to execute trigger initialization. After that,
the analyzer will execute the specified number of sweeps (or measurements) if the
trigger conditions are satisfied.
Key Points:
If the instrument is in continuous sweep mode and no measurement function
is enabled, press this key and the system will enter single sweep mode and
execute the specified number of sweeps if the trigger conditions are satisfied.
If the instrument is in continuous sweep mode and a measurement function is
on, press this key and the system will enter single measurement mode and
execute the specified number of measurements if the trigger conditions are
satisfied.
If the system is already in single sweep mode, press this key and the system
will execute the specified number of sweeps (or measurements) if the trigger
conditions are satisfied.
In single sweep mode, trigger initialization (press Sweep/Trig Single or
send the ":INIT" command through the remote interface) should be executed
before trigger condition judgment.
User’s Guide for DSA800E Series
Find Quality Products Online at: sales@GlobalTestSupply.com
www.GlobalTestSupply.com

Chapter 2 Front Panel Operation RIGOL
2-31
Press
“Single”
Measurement status?
Single sweep mode?
Single sweep mode?
Enter single sweep mode
and wait for trigger
condition
Enter single sweep/
measurement mode and
wait for trigger condition
Sweep again and wait
for trigger condition
Wait for trigger condition
and make single
measurement again
N
N
N
Y
Y
Y
Unit
Knob Step
Arrow Key Step
Figure 2-10 Process of Single Sweep
Numbers
Set the number of sweeps for a single sweep. In single sweep mode, the system
executes the specified number of sweeps and the number shown on the icon in the
status bar at the left of the screen varies with the process of the sweep.
Tab le 2-17 Numbers
Parameter Explanation
Default 1
Range 1 to 9999
N/A
1
1
User’s Guide for DSA800E Series
Find Quality Products Online at: sales@GlobalTestSupply.com
www.GlobalTestSupply.com

RIGOL Chapter 2 Front Panel Operation
2-32
Trig Type
The trigger type can be Free Run, Video or External. The corresponding icon of the
trigger type will be displayed in the status bar at the left of the screen.
1. Free Run
The trigger conditions are satisfied at any time and the analyzer generates
trigger signals continuously.
2. Video
A trigger signal will be generated when the system detects a video signal of
which the voltage exceeds the specified video trigger level.
Note: This function is invalid in non-zero span mode or RMS Avg detection or
Voltage Avg detection in zero span mode.
3. External
In this mode, an external signal (TTL signal) is input from the [TRIGGER IN]
connector at the rear panel and trigger signals are generated when this signal
fulfills the specified trigger edge condition.
Trig Setup
1. Trigger Level
Set the trigger level in video trigger. At this point, the trigger level line (TL)
and value are displayed on the screen. You can use the numeric keys, the
knob, or arrow keys to modify the parameter. Please refer to "Parameter
Setting" for more details.
User’s Guide for DSA800E Series
Find Quality Products Online at: sales@GlobalTestSupply.com
www.GlobalTestSupply.com

Chapter 2 Front Panel Operation RIGOL
2-33
Parameter
Explanation
Table 2-18 Trigger level
Parameter Explanation
Default 0 dBm
Range -300 dBm to 50 dBm
Unit* dBm
Knob Step 1 dBm
Arrow Key Step 10 dBm
Note: *It is related to the specified unit of Y-axis.
2. Edge
Set the trigger edge in external trigger to the rising (Pos) or falling (Neg) edge
of the pulse.
Note: When "Free Run" is selected, Trig Setup is grayed out and disabled.
Points
Set the desired points for every sweep. That is the number of points of the current
trace.
Key Points:
Changing the points may influence the sweep time which is limited by the
sample rate of the ADC (Analog to Digital Converter). That is, the more points
used, the longer the sweep will be.
Changing the points would also influence other system parameters, thus the
instrument restarts the sweep and measurement cycle.
You can use the numeric keys, the knob, or the arrow keys to modify the
parameter. Please refer to "Parameter Setting" for more details.
Table 2-19 Points
Default 601
Range 101~3001
Unit N/A
Knob Step 1
Arrow Key Step 1
User’s Guide for DSA800E Series
Find Quality Products Online at: sales@GlobalTestSupply.com
www.GlobalTestSupply.com

RIGOL Chapter 2 Front Panel Operation
2-34
Trace/P/F
The sweep signal is displayed as a trace on the screen. In addition, DSA800E
provides the Pass/Fail (P/F) test function. Trace/P/F is used to set parameters
related to the trace and P/F test.
Select Trace
DSA800E allows for up to four traces to be displayed at the same time. Each trace
has its own color (Tr ac e 1 - yellow, Trace 2 - purple, Trac e 3 - light blue and Trace
4 - green). All traces can be set freely except Trace 4 (a math operation trace that
can only be obtained using the other three traces).
Select Trace 1, Trace 2 or Trace 3 to set the corresponding parameters. By default,
Trace 1 is selected and turned on. The default trace type is Clear Write.
Note: The trace currently displayed on the screen can be stored in the internal or
external memory of the analyzer and can be recalled when needed. Press
Storage to save the trace according to the method introduced in "Storage
".
Trace Type
Set the type of the current trace or disable it. The system calculates the sampled
data using a specific operation method according to the trace type selected and
displays the result. Trace types include Clear Write, Max Hold, Min Hold, Video Avg,
Power Avg and Freeze. The corresponding icon of the trace type will be displayed
in the status bar at the left of the screen. Take Trace 1 (yellow) as an example and
the icons are as shown in the figure below.
1. Clear Write
Set the trace data to the minimum, and display the data sampled in real-time
User’s Guide for DSA800E Series
Find Quality Products Online at: sales@GlobalTestSupply.com
www.GlobalTestSupply.com

Chapter 2 Front Panel Operation RIGOL
2-35
of each point on the trace.
2. Max Hold
Display the maximum from multiple sweeps for each point of the trace and
update the data if a new maximum is generated in successive sweeps.
3. Min Hold
Display the minimum from multiple sweeps for each point of the trace and
update the data if a new minimum is generated in successive sweeps.
4. Video Avg
Display the logarithmic average of data from multiple sweeps for each point of
the trace. Traces in this type are smoother.
5. Power Avg
Display the average of data from multiple sweeps of each point of the trace.
Traces in this type are smoother.
6. Freeze
Stop updating the trace data to observe the trace and read the measurement
data. This type is generally used by traces loaded from storage devices or
remote interface as default.
7. Blank
Disable the trace display and all measurements of this trace.
Average Times
Set the number of averages of the selected trace.
Key Points:
More averages can reduce the noise and the influence of other random signals;
thus highlighting the stable signal characteristics. The larger the number of
averages is, the smoother the trace will be.
You can use the numeric keys to modify the parameter. Please refer to
"Parameter Setting" for more details.
User’s Guide for DSA800E Series
Find Quality Products Online at: sales@GlobalTestSupply.com
www.GlobalTestSupply.com

RIGOL Chapter 2 Front Panel Operation
2-36
Range
Unit
Tab le 2-20 Average times
Parameter Explanation
Default 100
Range 1 to 1000
Unit N/A
Knob Step N/A
Arrow Key Step N/A
Trace Math
1. Function
Set the computational method of the math trace.
A-B: subtract Trace B from A
A+Constant: add a constant to Trace A
A-Constant: subtract a constant from Trace A
2. A
Select "T1", "T2" or "T3". Assign a value to A from Trace1, Trace 2 or Trace 3.
The default is Trace 1 (T1).
3. B
Select "T1", "T2" or "T3". Assign a value to B from Trace1, Trace 2 or Trace 3.
The default is Trace 2 (T2).
4. Constant
Set the value of the constant.
You can use the numeric keys to modify the parameter. Please refer to
"Parameter Setting" for more details.
Table 2-21 Constant in the math operation
Parameter Explanation
Default 0 dB
-300 dB to 300 dB
dB
User’s Guide for DSA800E Series
Find Quality Products Online at: sales@GlobalTestSupply.com
www.GlobalTestSupply.com

Chapter 2 Front Panel Operation RIGOL
2-37
5. Operate
Enable or disable the display of the math trace and the default is Off.
Note: This menu is valid only when A or B is set to the selected type of trace.
Blank All
Disable all the traces displayed on the screen. This operation will stop the current
advanced measurement as there is not valid data source.
Pass/Fail
DSA800E supports the Pass/Fail test function. In this function, the measured curve
is compared with the pre-edited curve. If the related rules are met, the result is
"Pass"; or else is "Fail". The measurement interface is as shown in the figure
below.
Figure 2-11 Interface of Pass/Fail Tes t
User’s Guide for DSA800E Series
Find Quality Products Online at: sales@GlobalTestSupply.com
www.GlobalTestSupply.com

RIGOL Chapter 2 Front Panel Operation
2-38
Result:
The results of Pass/Fail test contain the pass number and the pass ratio.
1. Switch
Turn on or off the Pass/Fail test function and the default is "Off". When the
function is enabled, the system changes to split-screen display. At this point,
T2 and T3 are used for marking the upper and lower limits separately.
2. Settings
Limit: select the desired limit line (upper or lower) for editing. Then,
press Edit to set the limit conditions.
Test: enable or disable the test function. Each limit line has its own
switch. You can test according to both together, either one or neither.
Note: Trace/P/F Pass/Fail Switch is only used to enable or
disable the setting menu of Pass/Fail test, not the test itself.
Edit: edit the properties of the limit lines.
Note: The edited limit line data can be stored in the internal or external
memory of the analyzer and can be recalled when needed. After the
editing is finished, press Storage to store the data according to the
method introduced in "Storage".
Table 2-22 Pass/Fail menu
Function Explanation
Limit Quickly select the limit line to be edited.
Point Set the number of the point to be edited. The range is from
1 to 200.
X-axis Edit the X-axis value (frequency or time) of the current
point. If the X-axis unit is frequency and the Rel Freq is
enabled, edit the frequency difference between the
frequency of the current point and the center frequency.
Amplitude Edit the amplitude of the current point. If the Rel Ampt is
enabled, edit the amplitude difference between the
amplitude of the current point and the reference level.
Connected Connect this point with the previous one or not.
Del Point
Delete the point you are editing.
User’s Guide for DSA800E Series
Find Quality Products Online at: sales@GlobalTestSupply.com
www.GlobalTestSupply.com

Chapter 2 Front Panel Operation RIGOL
2-39
X Axis: set the X-axis unit to frequency or time unit. Note that all the
points of the current limit line will be deleted when the X-axis unit
changes.
Freq Interp: set the Freq Interp to Log or Lin. In Log mode, both the
frequency and amplitude use Log unit to make interpolation operation; in
Lin mode, the frequency uses a Lin unit and the amplitude uses a Log unit
for interpolation operation.
Rel Setting: enable or disable Relative Frequency (Rel Freq) or Relative
Amplitude (Rel Ampt). When the Rel Freq is enabled, the frequency you
are editing is the difference between the frequency of the current point
and the center frequency. When the Rel Ampt is enabled, the amplitude
you are editing is the difference between the amplitude of the current
point and the reference level.
Del Limit: delete the limit line you are editing.
Fail Stop: select whether to perform the next sweep if the test fails.
Beeper: turn on or off the beeper. When the beeper is on, it beeps when
the test fails.
3. Restart
Re-execute the active or suspended test.
4. Pause
Suspend the test after the current test is finished. At this point, the
measurement data stops updating, but the sweep continues.
is displayed
in the test result display window.
5. Resume
Resume the suspended test and the test data begins updating again.
is
displayed in the test result display window.
6. Meas Mode
Set the measurement mode to single or continuous. In single mode, the
analyzer stops after the specified number of tests. After this, every time when
Single is pressed, the system executes the specified number of tests and
updates the test data. In continuous mode, the analyzer tests continuously.
User’s Guide for DSA800E Series
Find Quality Products Online at: sales@GlobalTestSupply.com
www.GlobalTestSupply.com

RIGOL Chapter 2 Front Panel Operation
2-40
7. Single
In single mode, the analyzer stops after the specified number of tests. After
this, every time when Single is pressed, the system executes the specified
number of tests and updates the test data.
Average Reset
Achieve the recalculation of the trace average.
Note: You can use this function only when the trace type is set to "Video Avg" or
"Power Avg".
User’s Guide for DSA800E Series
Find Quality Products Online at: sales@GlobalTestSupply.com
www.GlobalTestSupply.com
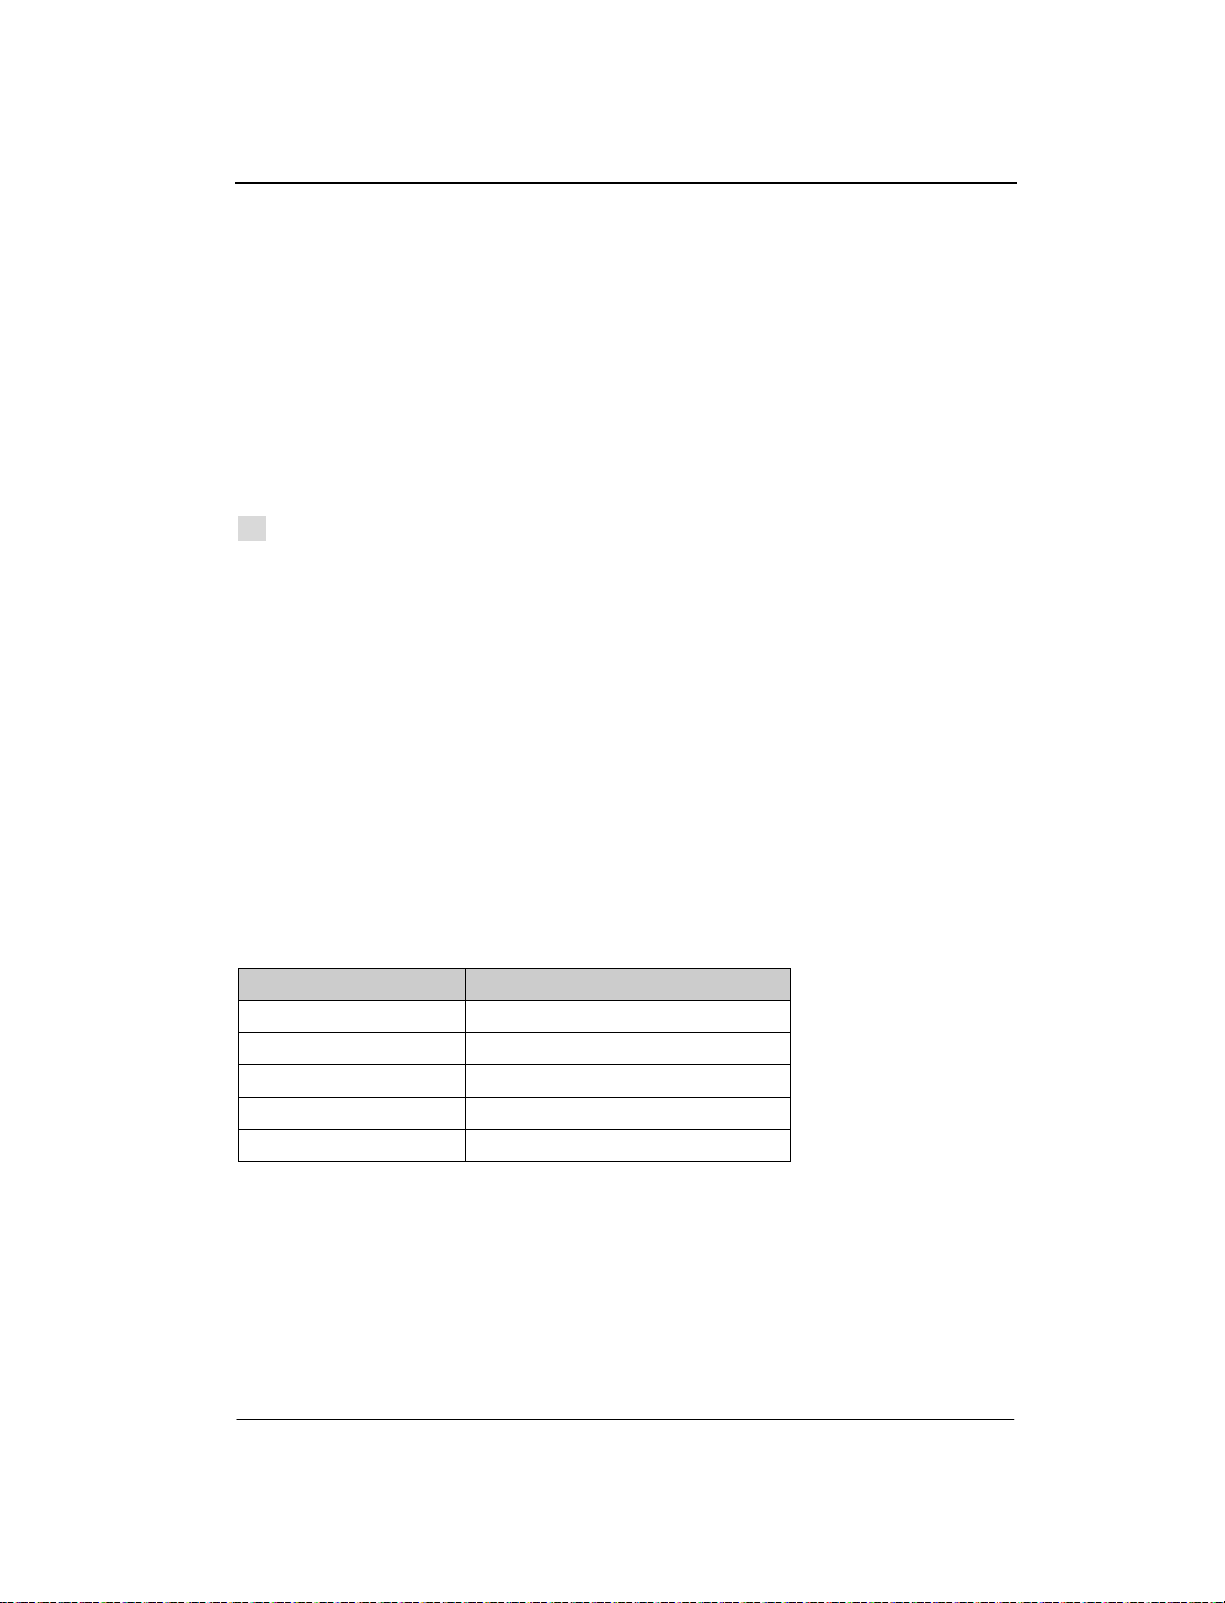
Chapter 2 Front Panel Operation RIGOL
2-41
TG
Set the parameter related to the tracking generator (TG). The TG function is only
valid when your analyzer is DSA832E-TG.
TG
TG is used to enable or disable the TG.
When the TG is enabled, a signal with the same frequency of the current sweep
signal will be output from the [GEN OUTPUT 50Ω] connector at the front panel.
The power of the signal could be set through the menu.
TG Level
Set the output power of the signal of the tracking generator.
You can use the numeric keys, the knob, or the arrow keys to modify the parameter.
For more details, please refer to "Parameter Setting".
Tab le 2-23 TG level
Parameter Explanation
Default -20 dBm
Range -40 dBm to 0 dBm
Unit dBm, -dBm, mV, uV
Knob Step 1 dBm
Arrow Key Step 10 dBm
TG Lvl Offset
Assign a certain offset to the output power of the TG when gains or losses occur
between the TG output and external device in order to display the actual power
User’s Guide for DSA800E Series
Find Quality Products Online at: sales@GlobalTestSupply.com
www.GlobalTestSupply.com

RIGOL Chapter 2 Front Panel Operation
2-42
value.
Key Points:
This parameter only changes the readout of the TG output power, rather than
the actual value of it.
The offset could be either a positive (gain in the external output) or a negative
(loss in the external output).
You can use the numeric keys, the knob, or the arrow keys to modify the
parameter. For more details, please refer to "Parameter Setting".
Tab le 2-24 TG Level Offset
Parameter Explanation
Default 0 dB
Range -200 dB to 200 dB
Unit dB
Knob Step 1 dB
Arrow Key Step 10 dB
Normalize
Nomalization can eliminate the error of TG Level. Before using this function,
connect the [GEN OUTPUT 50Ω] output terminal of the TG with the [RF INPUT
50Ω] input terminal of the analyzer.
1. Stor Ref
Save the data of Trace 1 to Trace 3 as the reference value for normalization.
This operation should be done before you enable the normalization.
2. Normalize
Enable or disable the normalization. When enabled, the reference trace will be
stored automatically after the current sweep finishes if no reference trace is
stored before. During the reference trace storage, the corresponding prompt
message is displayed. When normalization is enabled, the corresponding
value of the reference trace will be substracted from the trace data after every
sweep.
User’s Guide for DSA800E Series
Find Quality Products Online at: sales@GlobalTestSupply.com
www.GlobalTestSupply.com

Chapter 2 Front Panel Operation RIGOL
2-43
Parameter
Explanation
Default
Range
Unit
3. Norm Ref Lvl
Adjust the vertical position of the trace on the screen by adjusting the
reference level when normalization is enabled.
Being different from the Ref Level function in the AMPT menu, this
parameter has no influence on the reference level of the analyzer.
You can use the numeric keys, the knob, or the arrow keys to modify the
parameter. For more details, please refer to "Parameter Setting".
Tab le 2-25 Reference level under normalization
0 dB
Range -200 dB to 200 dB
Unit dB
Knob Step 1 dB
Arrow Key Step 10 dB
4. Norm Ref Pos
Adjust the vertical position of the normalization reference level on the screen
by adjusting the reference position when normalization is enabled.
The function of this menu is similar to that of Norm Ref Lvl. When it is
set to 0%, the normalization reference level is displayed at the bottom of
the screen grid and at the top when it is set to 100%.
You can use the numeric keys, the knob, or the arrow keys to modify the
parameter. For more details, please refer to "Parameter Setting".
Tab le 2-26 TG reference position
Parameter Explanation
Default 100%
0% to 100%
%
Knob Step 1%
Arrow Key Step 10%
5. Ref Trace
Set whether to display the reference trace or not. If "View" is selected, the
reference trace saved (Trace 3) will be shown in "Freeze" type.
User’s Guide for DSA800E Series
Find Quality Products Online at: sales@GlobalTestSupply.com
www.GlobalTestSupply.com

RIGOL Chapter 2 Front Panel Operation
2-44
Note: When normalization is enabled, the unit of Y-axis is "dB" and will not be
influenced by the definition in AMPT Units. At this point, "(dB)" is
displayed under the Y-axis scale in the user interface.
User’s Guide for DSA800E Series
Find Quality Products Online at: sales@GlobalTestSupply.com
www.GlobalTestSupply.com
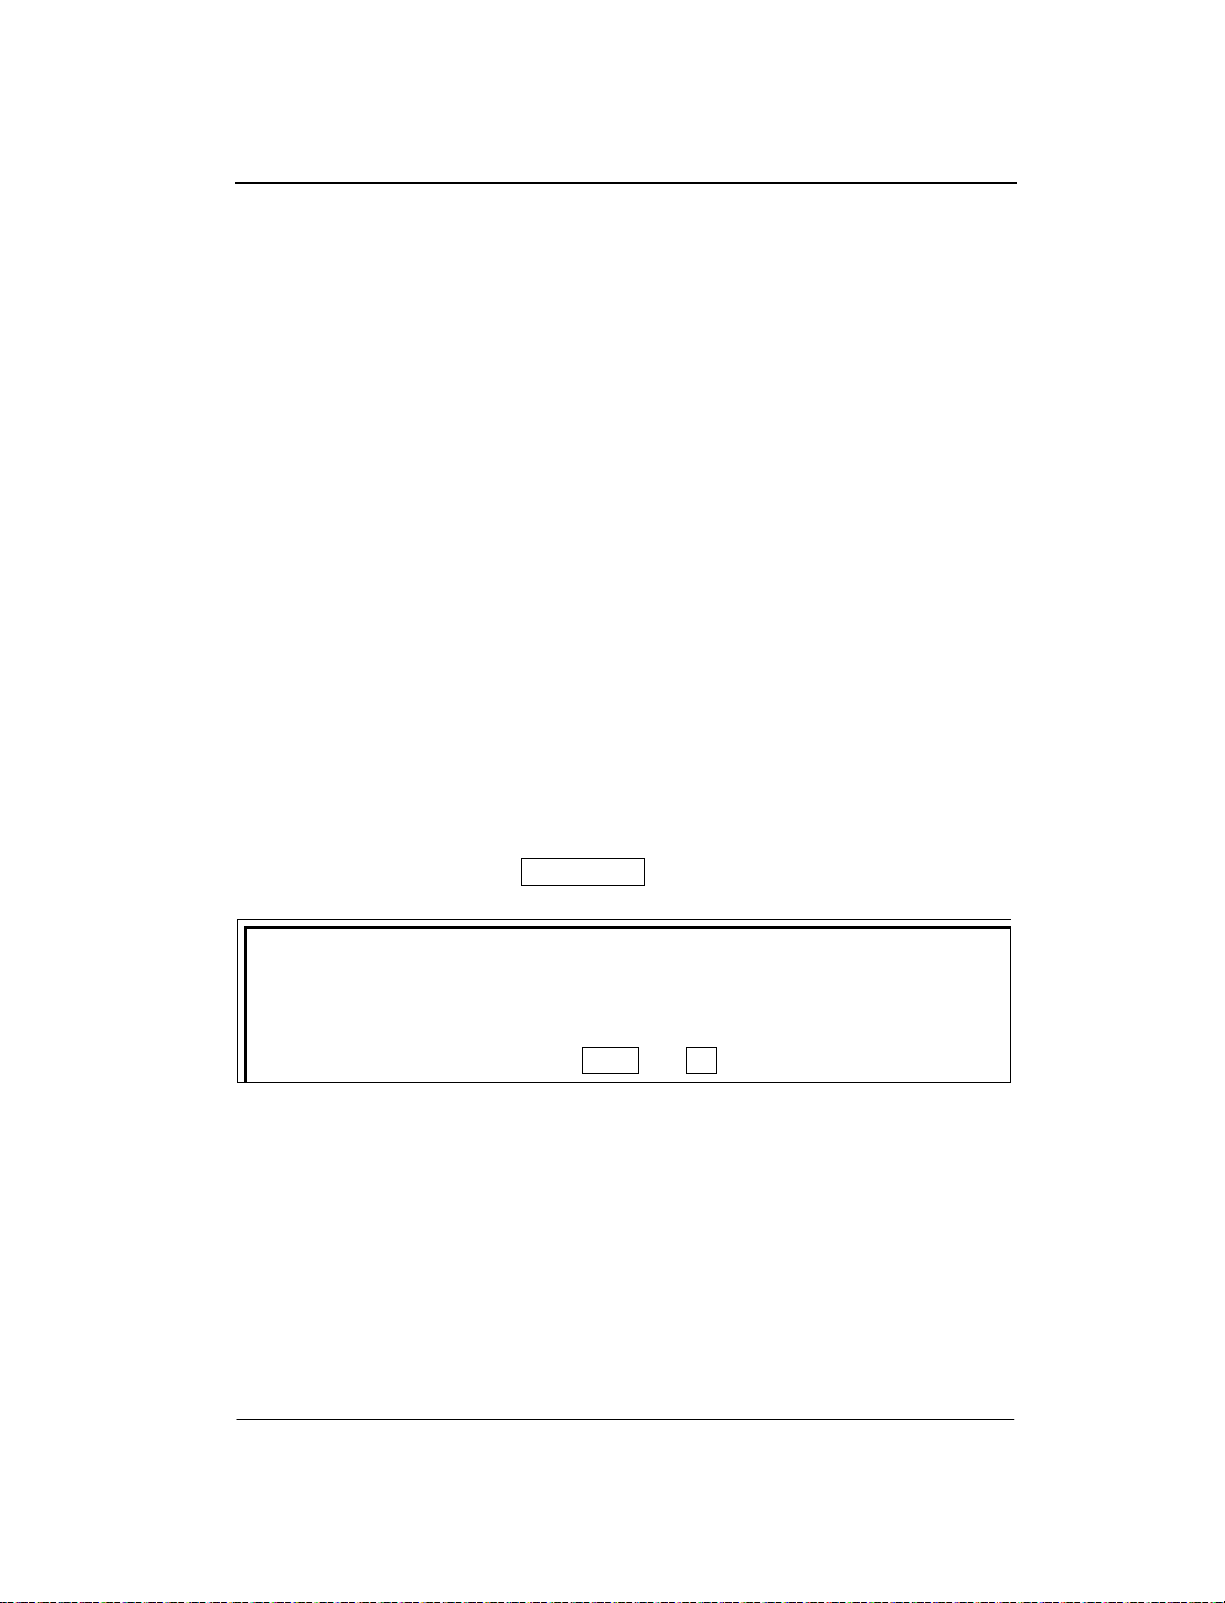
Chapter 2 Front Panel Operation RIGOL
2-45
Measurement Settings
Meas
Provide VSWR and various advanced measurement functions, including T-P ow er,
ACP (Adjacent Channel Power), Chan Pwr (Channel Power), OBW (Occupied
Bandwidth), EBW (Emission Bandwidth), C/N Ratio, Harmo Dist (Harmonic
Distortion) and TOI (Third Order Intermodulation). For advanced measurement
functions, the measurement mode can be single or continuous; you can restart,
pause and resume the measurement.
VSWR
Turn on or off the VSWR measurement function. This function is an option for
DSA800E. When the VSWR measurement function is turned on, the screen is
divided into two windows automatically (the lower window provides the
measurement wizard). At this point, you can perform the VSWR measurement
according to the wizard. Press Meas Setup to set the corresponding parameters.
Tip:
VSWR bridge and TG are required in VSWR measurement. Therefore, this
function is only available when the VSWR measurement kit, VSWR bridge and TG
are installed. When the VSWR measurement is enabled, the TG is enabled
automatically and the backlights of Meas and TG at the front panel turns on.
Measurement Function
This function is an option for DSA800E and is only available when the advanced
measurement kit is installed. When a measurement function is selected, the screen
is divided into two windows with the upper window (the basic measurement
window) displaying the sweep trace and the lower window displaying the
measurement results.
User’s Guide for DSA800E Series
Find Quality Products Online at: sales@GlobalTestSupply.com
www.GlobalTestSupply.com

RIGOL Chapter 2 Front Panel Operation
2-46
1. T-Power
Ths system enters zero span mode and calculates the power within the time
domain. The types of powers available include Peak, Average and RMS.
Select T-Power and press Meas Setup to set the corresponding
parameters.
2. ACP
Measure the powers of the main channel and adjacent channels as well as the
power difference between the main channel and each of the adjacent
channels. When this function is enabled, the span and resolution bandwidth of
the analyzer are adjusted to smaller values automatically.
Select ACP and press Meas Setup to set the corresponding parameters.
3. Chan Pwr
Measure the power and power density within the specified channel bandwidth.
When this function is enabled, the span and resolution bandwidth are
automatically adjusted to smaller values.
Select Chan Pwr and press Meas Setup to set the corresponding
parameters.
4. OBW
Integrate the power within the whole span and calculate the bandwidth
occupied by this power according to the specified power ratio. The OBW
function also indicates the difference (namely "Transmit Freq Error") between
the center frequency of the channel under measurement and the center
frequency of the analyzer.
Select OBW and press Meas Setup to set the corresponding parameters.
5. EBW
Measure the bandwidth between two points on the signal which are X dB
below the highest point within the span.
Select EBW and press Meas Setup to set the corresponding parameters.
6. C/N Ratio
Measure the powers of the carrier and noise with the specified bandwidth as
well as their power ratio.
Select C/N Ratio and press Meas Setup to set the corresponding
User’s Guide for DSA800E Series
Find Quality Products Online at: sales@GlobalTestSupply.com
www.GlobalTestSupply.com

Chapter 2 Front Panel Operation RIGOL
2-47
parameters.
7. Harmo Dist
Measure the power of each order of harmonic and THD (total harmonic
distortion) of the carrier. The highest order of harmonic available is 10 and the
fundamental wave amplitude must be greater than -50 dBm; or else the
measurement will be invalid.
Select Harmo Dist and press Meas Setup to set the corresponding
parameters.
8. TOI
Measure the parameters of the TOI production of two signals with the same
amplitude and similar frequency. Those parameters include the frequencies
and amplitudes of the Base Lower, Base Upper, 3rd Order Lower and 3rd
Order Upper signal, as well as the Intercepts of both the Base Lower and Base
Upper.
Select TOI and press Meas Setup to set the corresponding parameters.
Restart
Re-execute the active or suspended measurement. This setting is only available for
advanced measurement functions.
Pause
Suspend the measurement after the current measurement is finished. The
measurement data stops updating, but the sweep continues.
the measurement result display window. This setting is only available for advanced
measurement functions.
is displayed in
User’s Guide for DSA800E Series
Find Quality Products Online at: sales@GlobalTestSupply.com
www.GlobalTestSupply.com

RIGOL Chapter 2 Front Panel Operation
2-48
Resume
Resume the suspended measurement and the measurement data begins updating
again.
only available for advanced measurement functions.
is displayed in the measurement result display window. This setting is
Meas Mode
Set the measurement mode to single or continuous. In single mode, the analyzer
stops after the specified number of measurements. After this, every time when
Single is pressed, the system executes the specified number of measurements
and updates the measurement data. In continuous mode, the analyzer measures
continuously. This setting is only available for advanced measurement functions.
Single
In single mode, the analyzer stops after the specified number of measurements.
After this, every time when Single is pressed, the system executes the specified
number of measurements and updates the measurement data. This setting is only
available for advanced measurement functions.
User’s Guide for DSA800E Series
Find Quality Products Online at: sales@GlobalTestSupply.com
www.GlobalTestSupply.com

Chapter 2 Front Panel Operation RIGOL
2-49
)lg(10)(
ri
PPdBRL =
)(dBRL
i
P
r
P
Meas Setup
Open the parameter setting menu of the function selected in the Meas menu. This
key is only available when a measurement function is enabled.
VSWR
Measurement Interface:
Figure 2-12 VSWR Measurement Interface
Measurerment Results: return loss, reflection coefficient and VSWR.
Return Loss: the formula is
return loss,
Find Quality Products Online at: sales@GlobalTestSupply.com
Reflection Coefficient: the ratio of the reflected voltage to the incident
voltage.
VSWR: the ratio of the maximum voltage to the minimum voltage of the
standing wave.
This measurement requires the VSWR, VSWR bridge options and TG
(DSA832E-TG). Two measurements have to be performed according to the
User’s Guide for DSA800E Series
is the incident power and
www.GlobalTestSupply.com
. Wherein,
is the reflected power.
is the

RIGOL Chapter 2 Front Panel Operation
2-50
measurement wizard at the lower side of the interface: measurement with the
device under test disconnected (represented by trace 2) and measurement with
the device under test connected (represented by trace 1). The return loss
(represented by the math trace) is determined by the difference of the results of
the two measurements and the reflection coefficient and VSWR are determined by
the return loss.
1. Reset
Reset the VSWR measurement parameters.
2. Cal Open
Disconnect the device under test and then press this softkey. The instrument
executes the first measurerment and the measurement result is represented
by trace 2.
3. VSWR
Connect the device under test and then press this softkey. The instrument
executes the second measurement and the measurement result is
represented by trace 1. At the same time, the analyzer calculates the
difference between the two measurement results (represented by the math
trace) and calculates the return loss, reflection coefficient and VSWR on the
basis of the difference.
4. Marker
Select one of the four markers and the default is marker 1. When a marker is
selected, you can set its state. The marker selected is marked onto the math
trace and the measurement result at the current marker is displayed in the
measurement wizard. You can use the knob to move the marker to view the
measurement results of different positions.
5. Marker State
Set the state of the current m ar ker.
6. Ref Level
Adjust the vertical position of the trace on the screen.
Being different from Ref Level in the AMPT menu, this parameter has no
influence on the reference level of the analyzer.
User’s Guide for DSA800E Series
Find Quality Products Online at: sales@GlobalTestSupply.com
www.GlobalTestSupply.com

Chapter 2 Front Panel Operation RIGOL
2-51
Parameter
Explanation
Default
You can use the numeric keys, the knob, or the arrow keys to modify the
parameter.
Tab le 2-27 VSWR Ref Level
0 dB
Range -200 dB to 200 dB
Unit dB
Knob Step 1 dB
Arrow Key Step 10 dB
User’s Guide for DSA800E Series
Find Quality Products Online at: sales@GlobalTestSupply.com
www.GlobalTestSupply.com
 Loading...