

Page 1

To our customers,
Old Company Name in Catalogs and Other Documents
On April 1st, 2010, NEC Electronics Corporation merged with Renesas Technology
Corporation, and Renesas Electronics Corporation took over all the business of both
companies. Therefore, although the old company name remains in this document, it is a valid
Renesas Electronics document. We appreciate your understanding.
Renesas Electronics website: http://www.renesas.com
April 1
Renesas Electronics Corporation
Issued by: Renesas Electronics Corporation (http://www.renesas.com)
st
, 2010
Send any inquiries to http://www.renesas.com/inquiry
.
Page 2

Notice
1. All information included in this document is current as of the date this document is issued. Such information, however, is
subject to change without any prior notice. Before purchasing or using any Renesas Electronics products listed herein, please
confirm the latest product information with a Renesas Electronics sales office. Also, please pay regular and careful attention to
additional and different information to be disclosed by Renesas Electronics such as that disclosed through our website.
2. Renesas Electronics does not assume any liability for infringement of patents, copyrights, or other intellectual property rights
of third parties by or arising from the use of Renesas Electronics products or technical information described in this document.
No license, express, implied or otherwise, is granted hereby under any patents, copyrights or other intellectual property rights
of Renesas Electronics or others.
3. You should not alter, modify, copy, or otherwise misappropriate any Renesas Electronics product, whether in whole or in part.
4. Descriptions of circuits, software and other related information in this document are provided only to illustrate the operation of
semiconductor products and application examples. You are fully responsible for the incorporation of these circuits, software,
and information in the design of your equipment. Renesas Electronics assumes no responsibility for any losses incurred by
you or third parties arising from the use of these circuits, software, or information.
5. When exporting the products or technology described in this document, you should comply with the applicable export control
laws and regulations and follow the procedures required by such laws and regulations. You should not use Renesas
Electronics products or the technology described in this document for any purpose relating to military applications or use by
the military, including but not limited to the development of weapons of mass destruction. Renesas Electronics products and
technology may not be used for or incorporated into any products or systems whose manufacture, use, or sale is prohibited
under any applicable domestic or foreign laws or regulations.
6. Renesas Electronics has used reasonable care in preparing the information included in this document, but Renesas Electronics
does not warrant that such informatio n is error free. Renesas Electronics assumes no liability whatsoever for any damages
incurred by you resulting from errors in or omissions from the information included herein.
7. Renesas Electronics products are classified according to the following three quality grades: “Standard”, “High Quality”, and
“Specific”. The recommended applications for each Renesas Electronics product depends on the product’s quality grade, as
indicated below. You must check the quality grade of each Renesas Electronics product before using it in a particular
application. You may not use any Renesas Electronics product for any application categorized as “Specific” without the prior
written consent of Renesas Electronics. Further, you may not use any Renesas Electronics product for any application for
which it is not intended without the prior written consent of Renesas Electronics. Renesas Electronics shall not be in any way
liable for any damages or losses incurred by you or third parties arising from the use of any Renesas Electronics product for an
application categorized as “Specific” or for which the product is not intended where you have failed to obtain the prior written
consent of Renesas Electronics. The quality grade of each Renesas Electronics product is “Standard” unless otherwise
expressly specified in a Ren esas E lectronics data sheets or dat a books, etc.
“Standard”: Computers; office equipment; communications equipment; test and measurement equipment; audio and visual
equipment; home electron ic appliances; machine tools; personal electronic equipment; and industrial robots.
“High Quality”: Transportation equipment (automobiles, trains, ships, etc.); traffic control systems; anti-disaster systems; anti-
crime systems; safety equipment; and medical equipment not specifically designed for life support.
“Specific”: Aircraft; aerospace equipment; submersible repeaters; nuclear reactor control systems; medical equipment or
systems for life support (e.g. artificial life support devices or systems), surgical implantations, or healthcare
intervention (e.g. excision, etc.), and any other appl i cations or purposes that pose a d irect threat to human life.
8. You should use the Renesas Electronics products described in this document within the range specified by Renesas Electronics,
especially with respect to the maximum rating, operating supply voltage range, movement power voltage range, heat radiation
characteristics, installation and other product characteristics. Renesas Electronics shall have no liability for malfunctions or
damages arising out of the use of Renesas Electronics products beyond such specified ranges.
9. Although Renesas Electronics endeavors to improve the quality and reliability of its products, semiconductor products have
specific characteristics such as t he occu rrence o f failure at a certai n rate an d malfunct io ns under cert ain u se con dition s. Further,
Renesas Electronics prod ucts are not subject to radiation resistance design. Please be sure to implement safety measures to
guard them against the possibility of physical injury, and injury or damage caused by fire in the event of the failure of a
Renesas Electronics product, such as safety design for hardware and software including but not limited to redundancy, fire
control and malfunction prevention, appropriate treatment for aging degradation or any other appropriate measures. Because
the evaluation of microcomputer software alone is very difficult, please evaluate the safety of the final products or system
manufactured by you.
10. Please contact a Renesas Electronics sales office for details as to environmental matters such as the environmental
compatibility of each Renesas Electronics product. Please use Renesas Electronics products in compliance with all applicable
laws and regulations that regulate the inclusion or use of controlled substances, including without limitation, the EU RoHS
Directive. Renesas Electronics assumes no liability for damages or losses occurring as a result of your noncompliance with
applicable laws and regulations.
11. This document may not be reproduced or duplicated, in any form, in whole or in part, without prior written consent of Renesas
Electronics.
12. Please contact a Renesas Electronics sales office if you have any questions regarding the information contained in this
document or Renesas Electronics products, or if you have any other inquiries.
(Note 1) “Renesas Electronics” as used in this document means Renesas Electronics Corporation an d also includes its majority-
owned subsidiaries.
(Note 2) “Renesas Electronics product(s)” means any product developed or manufactured by or for Renesas Electronics.
Page 3

User’s Manual
M16C PC4701 Emulator Debugger
V.1.03
User’s Manual
Renesas Microcomputer Development
Environment System
Rev.1.00 2007.07
Page 4

Notes regarding these materials
1. This document is provided for reference purposes only so that Renesas customers may select the appropriate
Renesas products for their use. Renesas neither makes warranties or representations with respect to the
accuracy or completeness of the information contained in this document nor grants any license to any
intellectual property rights or any other rights of Renesas or any third party with respect to the information in
this document.
2. Renesas shall have no liability for damages or infringement of any intellectual property or other rights arising
out of the use of any information in this document, including, but not limited to, product data, diagrams, charts,
programs, algorithms, and application circuit examples.
3. You should not use the products or the technology described in this document for the purpose of military
applications such as the development of weapons of mass destruction or for the purpose of any other military
use. When exporting the products or technology described herein, you should follow the applicable export
control laws and regulations, and procedures required by such laws and regulations.
4. All information included in this document such as product data, diagrams, charts, programs, algorithms, and
application circuit examples, is current as of the date this document is issued. Such information, however, is
subject to change without any prior notice. Before purchasing or using any Renesas products listed in this
document, please confirm the latest product information with a Renesas sales office. Also, please pay regular
and careful attention to additional and different information to be disclosed by Renesas such as that disclosed
through our website. (http://www.renesas.com )
5. Renesas has used reasonable care in compiling the information included in this document, but Renesas
assumes no liability whatsoever for any damages incurred as a result of errors or omissions in the information
included in this document.
6. When using or otherwise relying on the information in this document, you should evaluate the information in
light of the total system before deciding about the applicability of such information to the intended application.
Renesas makes no representations, warranties or guaranties regarding the suitability of its products for any
particular application and specifically disclaims any liability arising out of the application and use of the
information in this document or Renesas products.
7. With the exception of products specified by Renesas as suitable for automobile applications, Renesas
products are not designed, manufactured or tested for applications or otherwise in systems the failure or
malfunction of which may cause a direct threat to human life or create a risk of human injury or which require
especially high quality and reliability such as safety systems, or equipment or systems for transportation and
traffic, healthcare, combustion control, aerospace and aeronautics, nuclear power, or undersea communication
transmission. If you are considering the use of our products for such purposes, please contact a Renesas
sales office beforehand. Renesas shall have no liability for damages arising out of the uses set forth above.
8. Notwithstanding the preceding paragraph, you should not use Renesas products for the purposes listed below:
(1) artificial life support devices or systems
(2) surgical implantations
(3) healthcare intervention (e.g., excision, administration of medication, etc.)
(4) any other purposes that pose a direct threat to human life
Renesas shall have no liability for damages arising out of the uses set forth in the above and purchasers who
elect to use Renesas products in any of the foregoing applications shall indemnify and hold harmless Renesas
Technology Corp., its affiliated companies and their officers, directors, and employees against any and all
damages arising out of such applications.
9. You should use the products described herein within the range specified by Renesas, especially with respect
to the maximum rating, operating supply voltage range, movement power voltage range, heat radiation
characteristics, installation and other product characteristics. Renesas shall have no liability for malfunctions or
damages arising out of the use of Renesas products beyond such specified ranges.
10. Although Renesas endeavors to improve the quality and reliability of its products, IC products have specific
characteristics such as the occurrence of failure at a certain rate and malfunctions under certain use
conditions. Please be sure to implement safety measures to guard against the possibility of physical injury, and
injury or damage caused by fire in the event of the failure of a Renesas product, such as safety design for
hardware and software including but not limited to redundancy, fire control and malfunction prevention,
appropriate treatment for aging degradation or any other applicable measures. Among others, since the
evaluation of microcomputer software alone is very difficult, please evaluate the safety of the final products or
system manufactured by you.
11. In case Renesas products listed in this document are detached from the products to which the Renesas
products are attached or affixed, the risk of accident such as swallowing by infants and small children is very
high. You should implement safety measures so that Renesas products may not be easily detached from your
products. Renesas shall have no liability for damages arising out of such detachment.
12. This document may not be reproduced or duplicated, in any form, in whole or in part, without prior written
approval from Renesas.
13. Please contact a Renesas sales office if you have any questions regarding the information contained in this
document, Renesas semiconductor products, or if you have any other inquiries.
Page 5

Overview
The High-performance Embedded Workshop is a Graphical User Interface intended to ease the
development and debugging of applications written in C/C++ programming language and assembly
language for Renesas microcomputers. Its aim is to provide a powerful yet intuitive way of accessing,
observing and modifying the debugging platform in which the application is running.
This help explains the function as a "debugger" of High-performance Embedded Workshop.
Target System
The Debugger operates on the emulator PC4701 system.
Supported CPU
This help explains the debugging function corresponding to the following CPUs.
•
M32C/80, M16C/80 Series
Note: In this help, the information which depends on this CPU is described as "for M32C".
M16C/60, M16C/30, M16C/Tiny, M16C/20, M16C/10 Series
•
Note: In this help, the information which depends on this CPU is described as "for M16C/R8C".
740 Family
•
Note: In this help, the information which depends on this CPU is described as "for 740".
Page 6

Active X, Microsoft, MS-DOS, Visual Basic, Visual C++, Windows and Windows NT are either registered trademarks or
trademarks of Microsoft Corporation in the United States and other countries.
IBM and AT are registered trademarks of International Business Machines Corporation.
Intel and Pentium are registered trademarks of Intel Corporation.
Adobe and Acrobat are registered trademarks of Adobe Systems Incorporated.
All other brand and product names are trademarks, registered trademarks or service marks of their respective holders.
For inquiries about the contents of this document or product, fill in the text file the installer generates in the following
directory and email to your local distributor.
¥SUPPORT¥Product-name¥SUPPORT.TXT
Renesas Tools Homepage http://www.renesas.com/en/tools
Page 7

Setup of Debugger 1
1. Features 1
1.1 Real-Time RAM Monitor Function...............................................................................................1
1.1.1 RAM Monitor Area ............................................................................................................1
1.1.2 Sampling Period ................................................................................................................2
1.1.3 Related Windows ...............................................................................................................2
1.2 Break Functions............................................................................................................................3
1.2.1 Software Breaks Function.................................................................................................3
1.2.2 Hardware Break ................................................................................................................4
1.2.3 Protect Break .....................................................................................................................5
1.3 Real-Time Trace Function ............................................................................................................6
1.3.1 Trace Area..........................................................................................................................6
1.3.2 Trace Condition Setting ....................................................................................................7
1.3.3 Trace Data Write Condition..............................................................................................7
1.4 Time Measurement Function .......................................................................................................8
1.4.1 The Measurement Condition ............................................................................................8
1.5 Coverage Function ........................................................................................................................9
1.5.1 Coverage Measurement Area............................................................................................9
1.5.2 Related Windows ...............................................................................................................9
1.6 Real-Time OS Debugging Function............................................................................................10
1.7 GUI Input/Output Function .......................................................................................................10
2. About the Emulator PC4701 11
2.1 Communication methods ............................................................................................................11
2.2 Function table .............................................................................................................................11
3. Before starting the debugger 12
3.1 Communication method by emulator.........................................................................................12
3.1.1 USB Interface ..................................................................................................................12
3.1.2 LAN Interface ..................................................................................................................12
3.1.3 LPT Interface...................................................................................................................12
3.1.4 Proprietary Parallel Interface.........................................................................................13
3.2 Download of Firmware................................................................................................................14
3.3 Setting before emulator starts....................................................................................................15
3.3.1 USB communication........................................................................................................15
3.3.2 LAN communication 1.....................................................................................................16
3.3.3 LAN communication 2.....................................................................................................18
3.3.4 Proprietary parallel communication...............................................................................19
4. Preparation before Use 20
4.1 Workspaces, Projects, and Files .................................................................................................20
4.2 Starting the High-performance Embedded Workshop..............................................................21
4.2.1 Creating a New Workspace (Toolchain Used)................................................................22
4.2.2 Creating a New Workspace (Toolchain Not Used).........................................................27
4.3 Starting the Debugger ................................................................................................................32
4.3.1 Connecting the Emulator ................................................................................................ 32
4.3.2 Ending the Emulator.......................................................................................................32
5. Setup the Debugger 33
5.1 Init Dialog....................................................................................................................................33
5.1.1 MCU Tab..........................................................................................................................34
5.1.2 Debugging Information Tab............................................................................................37
5.1.3 F/W and Work Area Tab..................................................................................................39
5.1.4 Memory Extension Mode Tab .........................................................................................40
i
Page 8

5.1.5 Clock Tab .........................................................................................................................43
5.1.6 Script Tab.........................................................................................................................44
5.2 Setting of the Communication Interface.................................................................................... 45
5.2.1 Setting of the USB Interface...........................................................................................45
5.2.2 Setting of the LPT Interface ...........................................................................................46
5.2.3 Setting of the LAN Interface........................................................................................... 47
5.2.4 Setting of the Parallel Interface......................................................................................49
5.2.5 Setting of the Serial Interface.........................................................................................49
5.3 Setup the Debugger for M32C....................................................................................................50
5.3.1 Emem Dialog....................................................................................................................50
5.4 Setup the Debugger for M16C/R8C............................................................................................54
5.4.1 Map Command.................................................................................................................54
5.5 Setup the Debugger for 740........................................................................................................55
5.5.1 Map Command.................................................................................................................55
5.6 Method of making MCU file .......................................................................................................56
5.6.1 Method of making MCU file (the M16C/R8C Debugger) ...............................................56
5.6.2 Method of making MCU file (the 740 Debugger) ...........................................................57
Tutorial 59
6. Tutorial 61
6.1 Introduction.................................................................................................................................61
6.2 Usage ...........................................................................................................................................62
6.2.1 Step1 : Starting the Debugger ........................................................................................62
6.2.2 Step2 : Checking the Operation of RAM.........................................................................63
6.2.3 Step3 : Downloading the Tutorial Program ...................................................................64
6.2.4 Step4 : Setting a Breakpoint...........................................................................................66
6.2.5 Step5 : Executing the Program .......................................................................................67
6.2.6 Step6 : Reviewing Breakpoints ....................................................................................... 69
6.2.7 Step7 : Viewing Register .................................................................................................70
6.2.8 Step8 : Viewing Memory .................................................................................................71
6.2.9 Step9 : Watching Variables.............................................................................................72
6.2.10 Step10 : Stepping Through a Program .........................................................................74
6.2.11 Step11 : Forced Breaking of Program Executions........................................................77
6.2.12 Step12 : Displaying Local Variables .............................................................................78
6.2.13 Step13 : Stack Trace Function ......................................................................................79
6.2.14 What Next? ....................................................................................................................80
Reference 81
7. Windows/Dialogs 83
7.1 RAM Monitor Window ................................................................................................................84
7.1.1 Extended Menus ..............................................................................................................86
7.1.2 Setting the RAM monitor area........................................................................................87
7.2 ASM Watch Window ...................................................................................................................88
7.2.1 Extended Menus ..............................................................................................................89
7.3 C Watch Window.........................................................................................................................90
7.3.1 Extended Menus ..............................................................................................................92
7.4 Coverage Window........................................................................................................................93
7.4.1 Extended Menus ..............................................................................................................94
7.4.2 Refer to the Source Line/the Executed Address.............................................................95
7.5 Script Window.............................................................................................................................96
ii
Page 9

7.5.1 Extended Menus ..............................................................................................................97
7.6 S/W Break Point Setting Window ..............................................................................................98
7.6.1 Command Button.............................................................................................................99
7.6.2 Setting and Deleting a Break Points from Editor(Source) Window............................ 100
7.7 H/W Break Point Setting Window............................................................................................101
7.7.2 Specify the Combinatorial Condition............................................................................106
7.7.3 Specify the Process ID...................................................................................................107
7.7.4 Command Button...........................................................................................................107
7.7.5 Specify the Events (Instruction Fetch).........................................................................108
7.7.6 Specify the Events (Memory Access) ............................................................................112
7.7.7 Specify the Events (Bit Access).....................................................................................136
7.7.8 Specify the Events (Interrupt) ......................................................................................138
7.7.9 Specify the Events (External Trigger Signal) ..............................................................140
7.7.10 Specify the Event Combination Condition .................................................................142
7.7.11 Specify the Process ID ................................................................................................. 145
7.8 Protect Window .........................................................................................................................146
7.8.1 Extended Menus ............................................................................................................146
7.9 Trace Point Setting Window.....................................................................................................147
7.9.1 Specify the Trace Event.................................................................................................148
7.9.2 Specify the Combinatorial Condition............................................................................151
7.9.3 Specify the Process ID...................................................................................................152
7.9.4 Specify the Trace Range................................................................................................152
7.9.5 Specify the Trace Write Condition................................................................................153
7.9.6 Command Button...........................................................................................................153
7.9.7 Specify the Events (Instruction Fetch).........................................................................154
7.9.8 Specify the Events (Memory Access) ............................................................................154
7.9.9 Specify the Events (Bit Access).....................................................................................154
7.9.10 Specify the Events (Interrupt) ....................................................................................154
7.9.11 Specify the Events (External Trigger Signal) ............................................................154
7.9.12 Specify the Event Combination Condition .................................................................154
7.9.13 Specify the Process ID ................................................................................................. 154
7.9.14 Specify the write condition..........................................................................................155
7.10 Time Measurement Window...................................................................................................159
7.10.1 Specify the Time Measurement Event........................................................................160
7.10.2 Time Measurement Condition ....................................................................................164
7.10.3 Command Button.........................................................................................................164
7.10.4 Specify the Events (Instruction Fetch).......................................................................165
7.10.5 Specify the Events (Memory Access) ..........................................................................165
7.10.6 Specify the Events (Bit Access)...................................................................................165
7.10.7 Specify the Events (Interrupt) ....................................................................................165
7.10.8 Specify the Events (External Trigger Signal) ............................................................165
7.10.9 Set the Measurement Condition .................................................................................166
7.11 Trace Window..........................................................................................................................170
7.11.1 Configuration of Bus Mode..........................................................................................170
7.11.2 Configuration of Disassemble Mode ...........................................................................172
7.11.3 Configuration of Data Access Mode............................................................................173
7.11.4 Configuration of Source Mode..................................................................................... 174
7.11.5 Extended Menus ..........................................................................................................175
7.11.6 Display of bus information on the M32C Debugger................................................... 176
7.11.7 Display of bus information on the M16C/R8C Debugger...........................................178
7.11.8 Display of bus information on the 740 Debugger....................................................... 180
7.12 Data Trace Window.................................................................................................................181
7.12.1 Extended Menus ..........................................................................................................182
7.13 GUI I/O Window......................................................................................................................183
7.13.1 Extended Menus ..........................................................................................................184
7.14 MR Window .............................................................................................................................185
7.14.2 Display the Task Status..............................................................................................187
iii
Page 10

7.14.3 Display the Ready Queue Status ................................................................................ 191
7.14.4 Display the Timeout Queue Status.............................................................................192
7.14.5 Display the Event Flag Status....................................................................................194
7.14.6 Display the Semaphore Status....................................................................................196
7.14.7 Display the Mailbox Status.........................................................................................198
7.14.8 Display the Data Queue Status ..................................................................................200
7.14.9 Display the Cycle Handler Status ..............................................................................202
7.14.10 Display the Alarm Handler Status ...........................................................................204
7.14.11 Display the Memory Pool Status ..............................................................................205
7.14.12 Display the Task Context.......................................................................................... 207
7.15 MR Trace Window...................................................................................................................209
7.15.1 Extended Menus ..........................................................................................................211
7.15.2 Refer the Execution History of Task(MRxx Window)................................................212
7.16 MR Analyze Window...............................................................................................................218
7.16.1 Configuration of CPU Occupancy Status Display Mode............................................218
7.16.2 Configuration of Ready State Duration Display Mode ..............................................219
7.16.3 Configuration of System Call History Display Mode.................................................219
7.16.4 Extended Menus ..........................................................................................................220
7.16.5 Analyze the Execution History of Task ......................................................................220
7.17 MR Task Pause Window.........................................................................................................223
7.17.1 About Task Pause Function ........................................................................................223
7.17.2 Extended Menus ..........................................................................................................224
7.17.3 Pause the Specified Task.............................................................................................225
7.18 Task Trace Window.................................................................................................................230
7.18.1 Extended Menus ..........................................................................................................231
7.18.2 Refer the Execution History of Task(Taskxx Window).............................................. 232
7.19 Task Analyze Window.............................................................................................................237
7.19.1 Extended Menus ..........................................................................................................237
7.19.2 Analyze the Execution History of Task ......................................................................238
8. Table of Script Commands 239
8.1 Table of Script Commands (classified by function) .................................................................239
8.1.1 Execution Commands....................................................................................................239
8.1.2 File Operation Commands ............................................................................................239
8.1.3 Register Operation Commands.....................................................................................240
8.1.4 Memory Operation Commands .....................................................................................240
8.1.5 Assemble/Disassemble Commands...............................................................................240
8.1.6 Software Break Setting Commands..............................................................................240
8.1.7 Hardware Break Setting Commands............................................................................241
8.1.8 Real-time Trace Commands..........................................................................................241
8.1.9 Coverage Measurement Commands .............................................................................241
8.1.10 Script/Log File Commands..........................................................................................241
8.1.11 Program Display Commands ......................................................................................241
8.1.12 Map Commands ........................................................................................................... 242
8.1.13 Clock Command...........................................................................................................242
8.1.14 WatchDog Timer Commands ......................................................................................242
8.1.15 C Language Debugging Commands............................................................................242
8.1.16 Real-time OS Command..............................................................................................242
8.1.17 Utility Commands .......................................................................................................242
8.2 Table of Script Commands (alphabetical order) ......................................................................243
9. Writing Script Files 245
9.1 Structural Elements of a Script File ........................................................................................245
9.1.1 Script Command ............................................................................................................246
9.1.2 Assign Statement...........................................................................................................246
9.1.3 Conditional Statement ..................................................................................................246
9.1.4 Loop Statement(while,endw) and Break Statement....................................................247
9.1.5 Comment statements ....................................................................................................247
iv
Page 11

9.2 Writing Expressions..................................................................................................................248
9.2.1 Constants .......................................................................................................................248
9.2.2 Symbols and labels ........................................................................................................249
9.2.3 Macro Variables.............................................................................................................250
9.2.4 Register variables ..........................................................................................................251
9.2.5 Memory variables ..........................................................................................................251
9.2.6 Line Nos. ........................................................................................................................251
9.2.7 Character constants ......................................................................................................252
9.2.8 Operators .......................................................................................................................252
10. C/C++ Expressions 253
10.1 Writing C/C++ Expressions ....................................................................................................253
10.1.1 Immediate Values........................................................................................................253
10.1.2 Scope Resolution..........................................................................................................254
10.1.3 Mathematical Operators .............................................................................................254
10.1.4 Pointers ........................................................................................................................254
10.1.5 Reference......................................................................................................................254
10.1.6 Sign Inversion..............................................................................................................255
10.1.7 Member Reference Using Dot Operator .....................................................................255
10.1.8 Member Reference Using Arrow.................................................................................255
10.1.9 Pointers to Members....................................................................................................256
10.1.10 Parentheses................................................................................................................256
10.1.11 Arrays.........................................................................................................................256
10.1.12 Casting to Basic Types ..............................................................................................256
10.1.13 Casting to typedef Types ...........................................................................................257
10.1.14 Variable Name ...........................................................................................................257
10.1.15 Function Name ..........................................................................................................257
10.1.16 Character Constants..................................................................................................257
10.1.17 Character String Literals..........................................................................................257
10.2 Display Format of C/C++ Expressions...................................................................................258
10.2.1 Enumeration Types .....................................................................................................258
10.2.2 Basic Types ..................................................................................................................258
10.2.3 Pointer Types...............................................................................................................259
10.2.4 Array Types..................................................................................................................260
10.2.5 Function Types ............................................................................................................260
10.2.6 Reference Types...........................................................................................................260
10.2.7 Bit Field Types.............................................................................................................260
10.2.8 When No C Symbol is Found ......................................................................................261
10.2.9 Syntax Errors...............................................................................................................261
10.2.10 Structure and Union Types.......................................................................................261
11. Display the Cause of the Program Stoppage 262
12. Attention 263
12.1 Common Attention..................................................................................................................263
12.1.1 File operation on Windows..........................................................................................263
12.1.2 Area where software breakpoint can be set ...............................................................263
12.1.3 Get or set C variables ..................................................................................................264
12.1.4 Function name in C++................................................................................................. 265
12.1.5 Option settings for download modules........................................................................265
12.1.6 Debugging multi modules ...........................................................................................265
12.1.7 Synchronized debugging..............................................................................................265
12.1.8 Down-load of Firmware...............................................................................................265
12.1.9 Restriction of LPT port................................................................................................266
12.1.10 Notes for coverage function.......................................................................................267
12.1.11 Emulator reset switch ...............................................................................................267
12.1.12 Debugging Resource on Emulator ............................................................................267
12.2 Attention of the M32C Debugger ...........................................................................................268
v
Page 12

12.2.1 Stack area used by the emulator ................................................................................268
12.2.2 Interrupt stack pointer when resetting the target program .....................................268
12.2.3 Option of C Compiler/Assembler/Linker ....................................................................268
12.2.4 Target MCU HOLD terminal...................................................................................... 268
12.2.5 Hardware Event ..........................................................................................................269
12.2.6 Time Measurement Resource......................................................................................269
12.2.7 CPU rewrite .................................................................................................................269
12.2.8 MR STK script command ............................................................................................269
12.3 Attention of the M16C/R8C Debugger ...................................................................................270
12.3.1 Map of stack area used by the emulator.....................................................................270
12.3.2 Options for compiler, assembler, and linker ..............................................................270
12.3.3 TASKING C Compiler .................................................................................................270
12.3.4 Target MCU HOLD terminal...................................................................................... 270
12.3.5 Hardware Event ..........................................................................................................271
12.3.6 Operating frequency of MCU ...................................................................................... 271
12.3.7 The correspondence OS version of task pause function.............................................271
12.3.8 Memory Space Expansion ...........................................................................................272
12.3.9 Watch dog timer...........................................................................................................272
12.3.10 CPU rewrite ...............................................................................................................272
12.3.11 MR STK script command ..........................................................................................272
12.4 Attention of the 740 Debugger ...............................................................................................273
12.4.1 Setting of Memory Map...............................................................................................273
12.4.2 Emulation Pod M37515T-RPD....................................................................................273
12.4.3 Stack area used by the emulator ................................................................................273
12.4.4 Specify the Clock..........................................................................................................273
12.4.5 Watch dog timer...........................................................................................................273
12.4.6 Option of C Compiler/Assembler/Linker ....................................................................273
12.4.7 About the single-step execution and the program break function in the internal RAM
area of the mcu .......................................................................................................................274
12.4.8 Debugging in the 16-Timer functions .........................................................................274
12.4.9 Hardware Event ..........................................................................................................274
12.4.10 Operating frequency of MCU ....................................................................................274
12.5 Option of C Compiler/Assembler/Linker................................................................................275
12.5.1 When Using NCxx .......................................................................................................275
12.5.2 When Using the Assembler Package for 740 Family.................................................275
12.5.3 When Using the IAR C Compiler (EW) ......................................................................276
12.5.4 When Using the IAR C Compiler (ICC)......................................................................277
12.5.5 When Using the TASKING C Compiler (EDE)..........................................................278
12.5.6 When Using the TASKING C Compiler (CM)............................................................278
12.5.7 When Using the IAR EC++ Compiler (EW) ...............................................................279
vi
Page 13

Setup of Debugger
1
Page 14

(Blank Page)
2
Page 15
1 Features
1. Features
1.1 Real-Time RAM Monitor Function
This function allows you to inspect changes of memory contents without impairing the realtime
capability of target program execution.
The PC4701 emulator system contains a 1-Kbyte RAM monitor area (which cannot be divided into
smaller areas).
This debugger supports the real time RAM monitor function which allows you to reference the
memory data without sacrificing real time performance during execution of the target program.
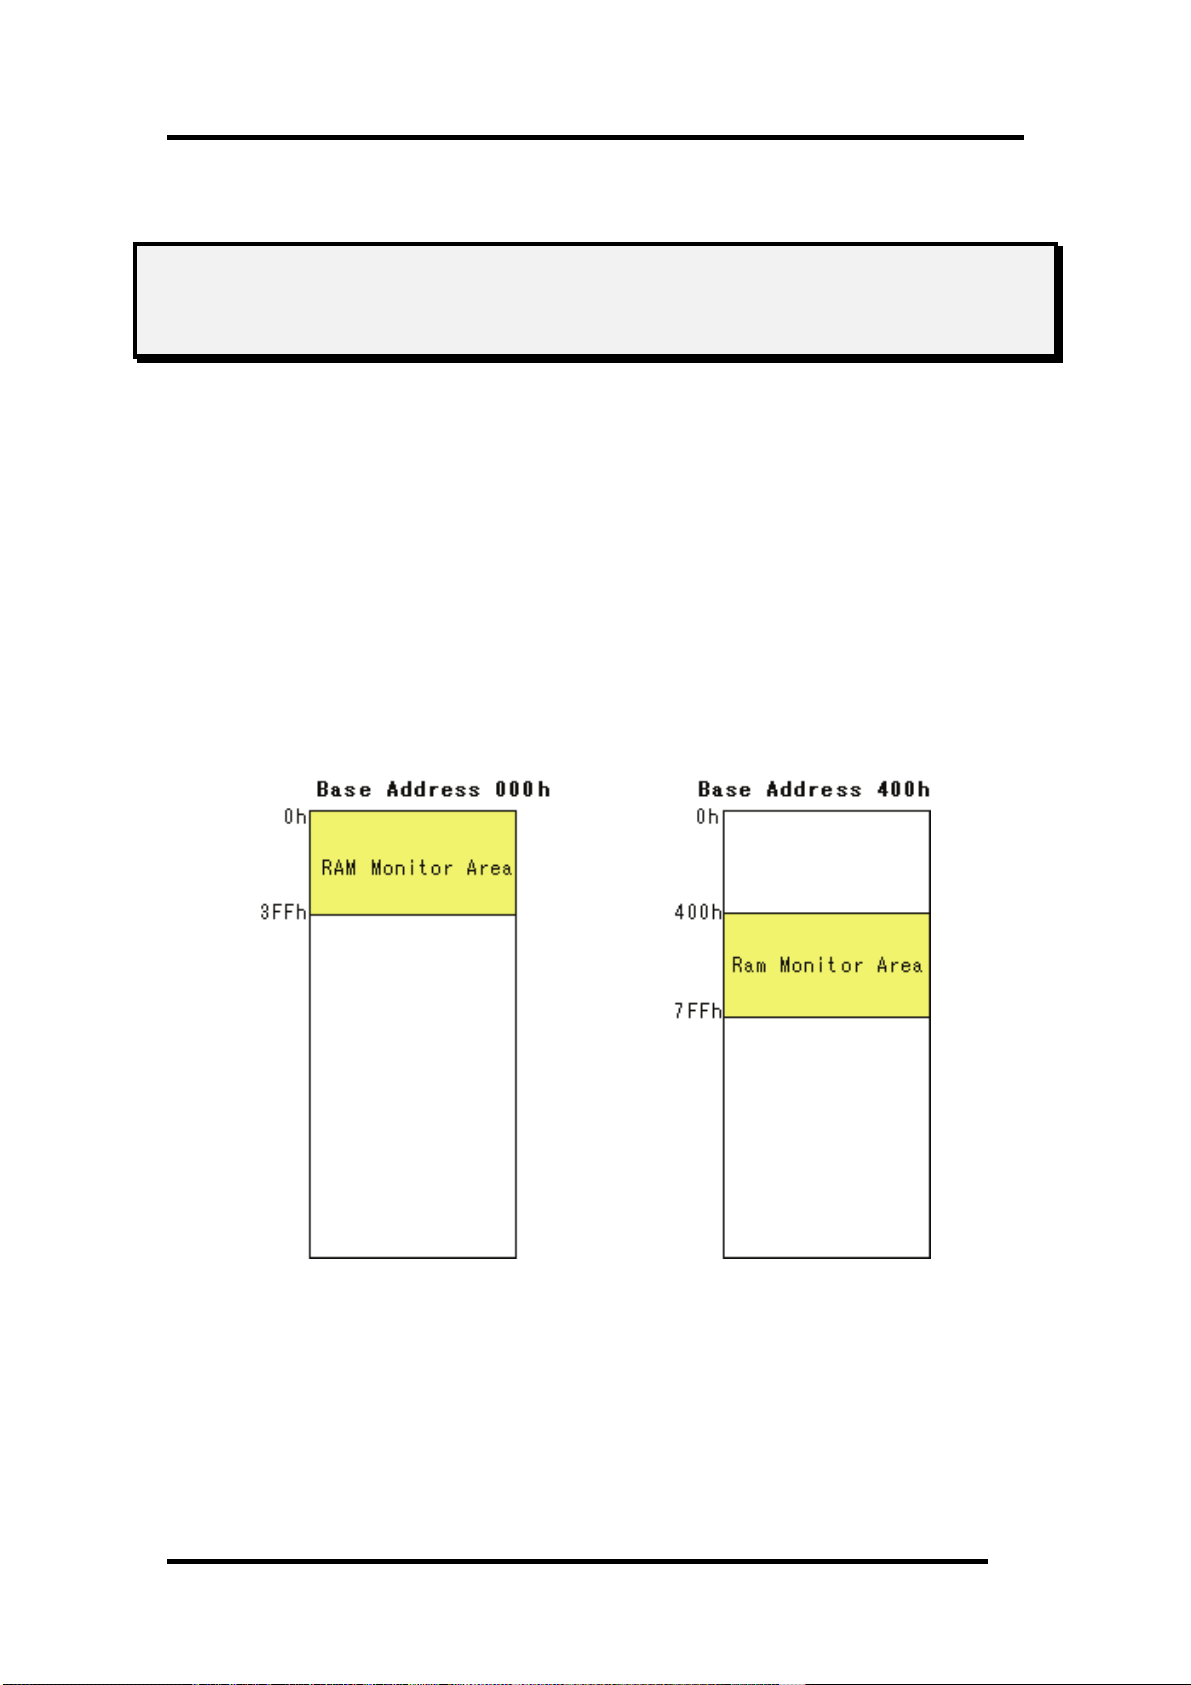
1.1.1 RAM Monitor Area
This debugger provides a 1KB of RAM monitor area, which can be placed at any continuous addresses.
1
Page 16

1.1.2 Sampling Period
Sampling cycle means the display update interval.
You can specify this function in any window which supports the RAM monitor. (The interval of 100
ms is set by default.)
The actual sampling cycle may take longer time than the specified cycle depending on the operating
environment. (Sampling cycle depends on the following environments.)
• Communication interface
• Number of the RAM Monitor windows displayed
• Size of the RAM Monitor window displayed
• Number of ASM watch points within the RAM monitor area of the ASM Watch window
• Number of C watch points within the RAM monitor area of the C Watch window
1.1.3 Related Windows
The window where the function of the real time RAM monitor function can be used is shown below.
• RAM Monitor Window
• ASM Watch Window
• C Watch Window
2
Page 17

1 Features
1.2 Break Functions
1.2.1 Software Breaks Function
Software Break breaks the target program before execution of the command at the specified address.
This break point is called software breakpoint.
The software breakpoint is set/reset in the Editor (Source) window or in the S/W Breakpoint Setting
window. You can also disable/enable a software breakpoint temporarily.
You can specify up to 64 software breakpoints. When specifying two or more software breakpoints, the
breakpoint combination is based on the OR logic. (Arrival to any one of breakpoints breaks the target
program.)
1.2.1.1 Setting of software breakpoint
The software breakpoint can be set by the following windows.
• Editor (Source) Window
• S/W Break Point Setting Window
You can double-click the mouse to set/reset the software breakpoint in the Editor (Source) window.
You can also switch to temporarily disable/enable the software breakpoint in the S/W Breakpoint
Setting window.
1.2.1.2 Area where software breakpoint can be set
The area which can be set for software breakpoint varies depending on the product.
For the areas available for software breakpoint, see the following:
"
12.1.2 Area where software breakpoint can be set"
3
Page 18
1.2.2 Hardware Break
This function causes the target program to stop upon detecting a data read/write to memory,
instruction execution, or the rising/falling edge of the input signal fed from an external trace cable.
The contents of events that can be set vary with each target MCU.
The following designations are available as break events:
• Address designation
- Instruction fetch
- Memory access
- Bit access
• External trigger designation
• Interruption
The number of events that can be specified are six events of all. For the address designation method,
instruction fetch and memory access allow the range designation and logical condition designation, in
addition to the normal one-address designation. Moreover, instruction fetch allows you to specify the
function name.
Memory access allows you to specify the comparison data to read/write data related to the specified
address in the same manner as when setting the H/W breakpoint. It also allows mask designation to
the comparison data.
These break events can be combined as below:
• Trace when all of the valid events are established (AND condition)
• Trace when all of the valid events are established at the same time (simultaneous AND condition)
• Trace when one of the valid events is established (OR condition)
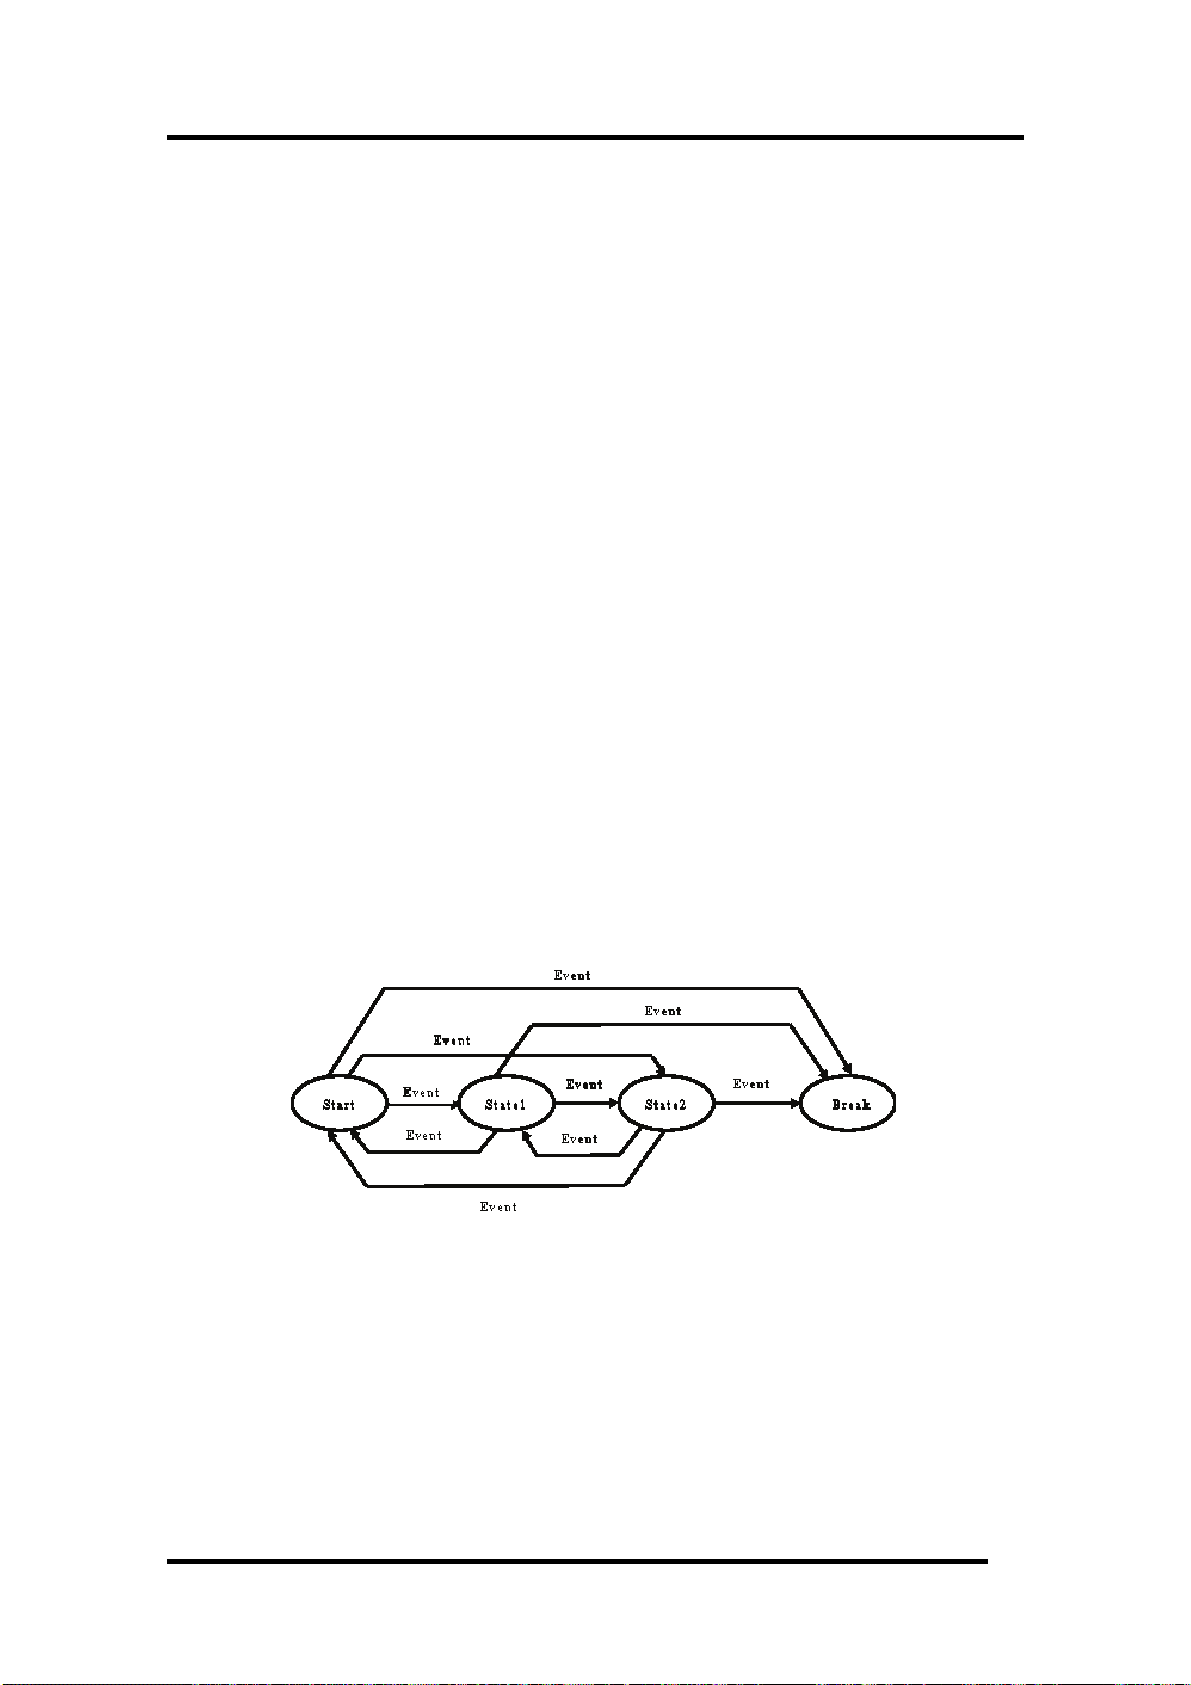
• Trace upon entering a break state during state transition (State Transition condition)
When transitional conditions set in an interstate pass are met, a state transition occurs, in which case
the target program can be made to stop upon entering a break state. The conceptual diagram shown
below depicts the relationship between state and pass.
State transition break allows you to select "specified task only" (or "other than specified task") as the
break condition to meet the real time OS.
4
Page 19
1 Features
1.2.3 Protect Break
This function causes the target program to stop upon detecting a data write to the ROM area or an
access to an unused area (read/write or instruction execution).
Protect Break is a function to detect a write of data to the ROM area and an access (read, write,
command execution) to an unused area and stop the target program.
1.2.3.1 Protect Attribute
You can specify the following attributes in byte.
• Access Disable
• Read Only
• R/W Enable
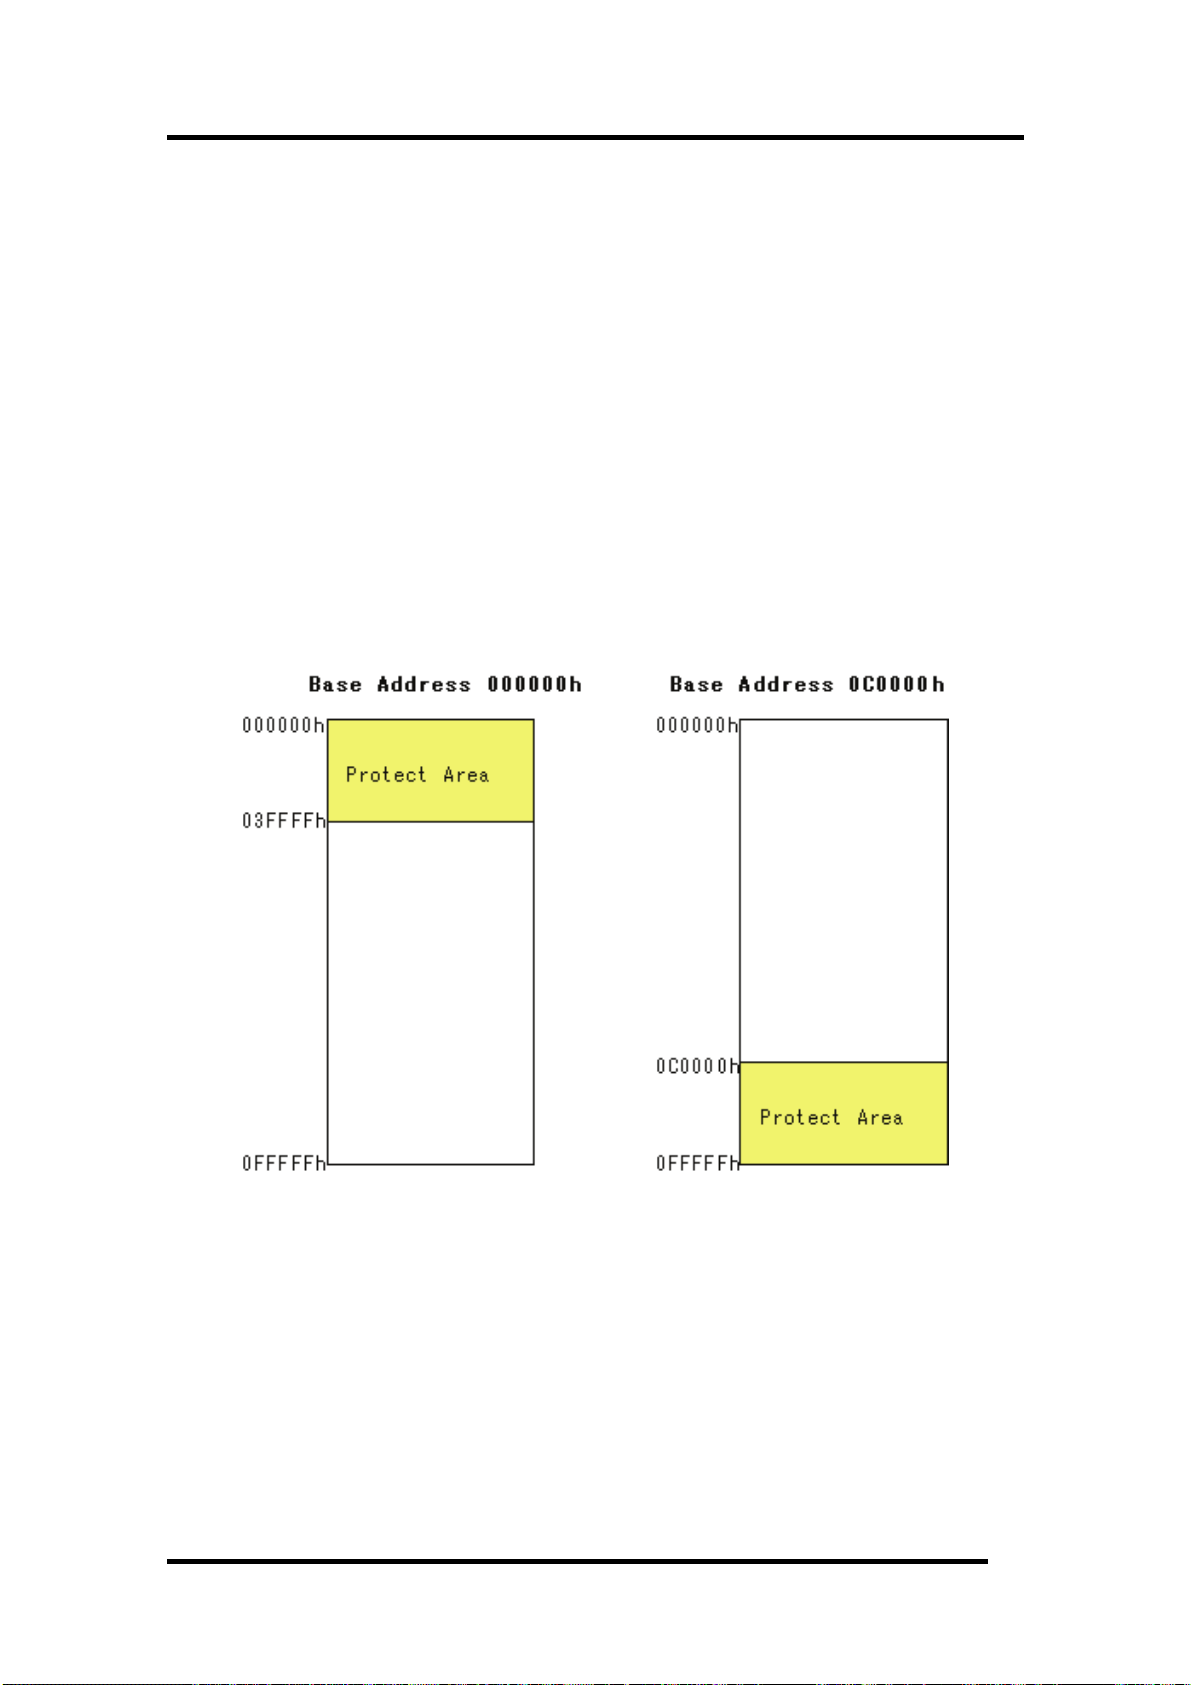
1.2.3.2 Access Protect Area
A protect area is a continuous 256-KB area starting from the 64KB boundary. Its start address is
called protect base address.
The protect base address immediately after starting the emulator is set to 0h.
The entire protect area is set to "R/W Enable" by default at start of the emulator.
1.2.3.3 Set Method of Protect Break
The two types of designation methods are provided:
• To fetch the memory attribute from the target program section information
• To specify the memory attribute of any area
5
Page 20
1.3 Real-Time Trace Function
This function records a target program execution history.
Up to 32K cycles of execution history can be recorded. This record allows inspecting the bus
information, executed instructions, and source program execution path for each cycle.
The real-time trace function records the execution history of the target program.
The execution history is referred to in the tracing window.
The execution history can be referred to in the following mode.
• BUS mode
This mode allows you to inspect cycle-by-cycle bus information. The display content depends on
the MCU and emulator system used. In addition to bus information, this mode allows
disassemble, source line or data access information to be displayed in combination.
• Disassemble mode
This mode allows you to inspect the executed instructions. In addition to disassemble information,
this mode allows source line or data access information to be displayed in combination.
• Data access mode
This mode allows you to inspect the data read/write cycles. In addition to data access information,
this mode allows source line information to be displayed in combination.
• Source mode
This mode allows you to inspect the program execution path in the source program.
1.3.1 Trace Area
The 32K cycles execution history can be referred to with this debugger.
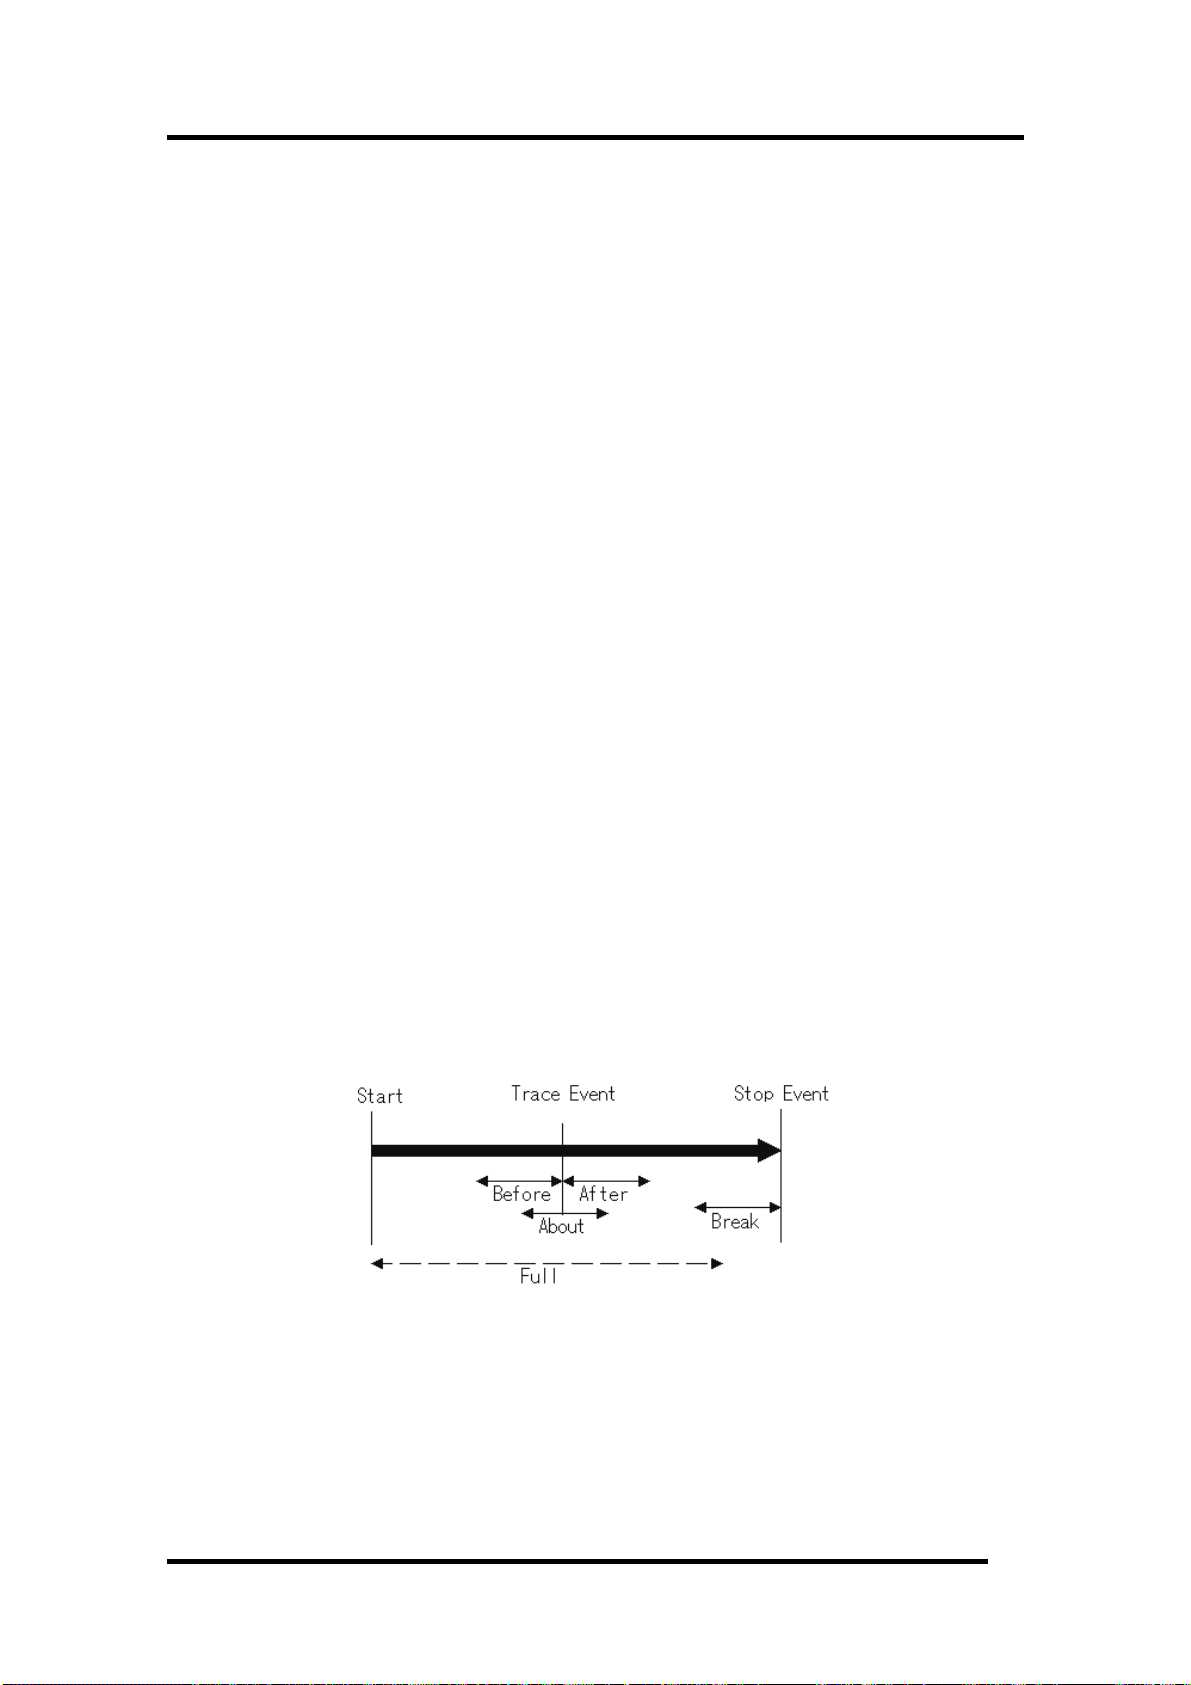
The trace area of the following 5 mode is being supported.
• Break
32K cycles before target program stops
• Before
32K cycles before trace point
• About
16K cycles either side of trace point
• After
32K cycles after trace point
• Full
Until 32K cycles are written in the trace memory
"Break" is set by default. To refer the execution history before stopping the target program, use
"Break" (designation of trace event is not required).
To refer the execution history at any position, or to continue execution of the target program, specify
the trace event and change the trance range.
6
Page 21

1 Features
1.3.2 Trace Condition Setting
The following designations are available as trace events:
• Address designation
- Instruction fetch
- Memory access
- Bit access
• External trigger designation (eight events)
• Interruption
The number of events that can be specified are six events of all. These break events can be combined
as below:
• Trace when all of the valid events are established (AND condition)
• Trace when all of the valid events are established at the same time (And(same time) comdition)
• Trace when one of the valid events is established (OR condition)
• Trace upon entering a break state during state transition (State Transition condition)
You can select "specified task only" (or "other than specified task") as the trace condition to meet the
real time OS.
1.3.3 Trace Data Write Condition
Trace data write conditions can be specified.
You can specify the following write conditions:
• Write conditions unlimited (default)
• Cycles from the start event established to the end event established
• Only cycles where the start event is established
• Cycles from the start event established to the start event unestablished
• Other than cycles from the start event established to the end event established
• Other than cycles where the start event is established
• Other than cycles from the start event established to the start event unestablished
7
Page 22

1.4 Time Measurement Function
The time measurement function allows you to measure the maximum, minimum, and average
execution times and measurement counts of a specified zone.
With this debugger, time can be measured up to four points simultaneously.
1.4.1 The Measurement Condition
The measurement condition of the zone time can specify the following in each measurement zone.
• Execution time of the specified function
• Time between two events
• Time between event establishments
• Time of event occurrence period
8
Page 23
1 Features
1.5 Coverage Function
Coverage Measurement is a function to record the addresses executed (accessed) by the target
program (C0 coverage).
After stopping execution of the target program, you can understand which addresses are not executed
yet.
By using the coverage measurement function in the test process, you can check for missing test items.
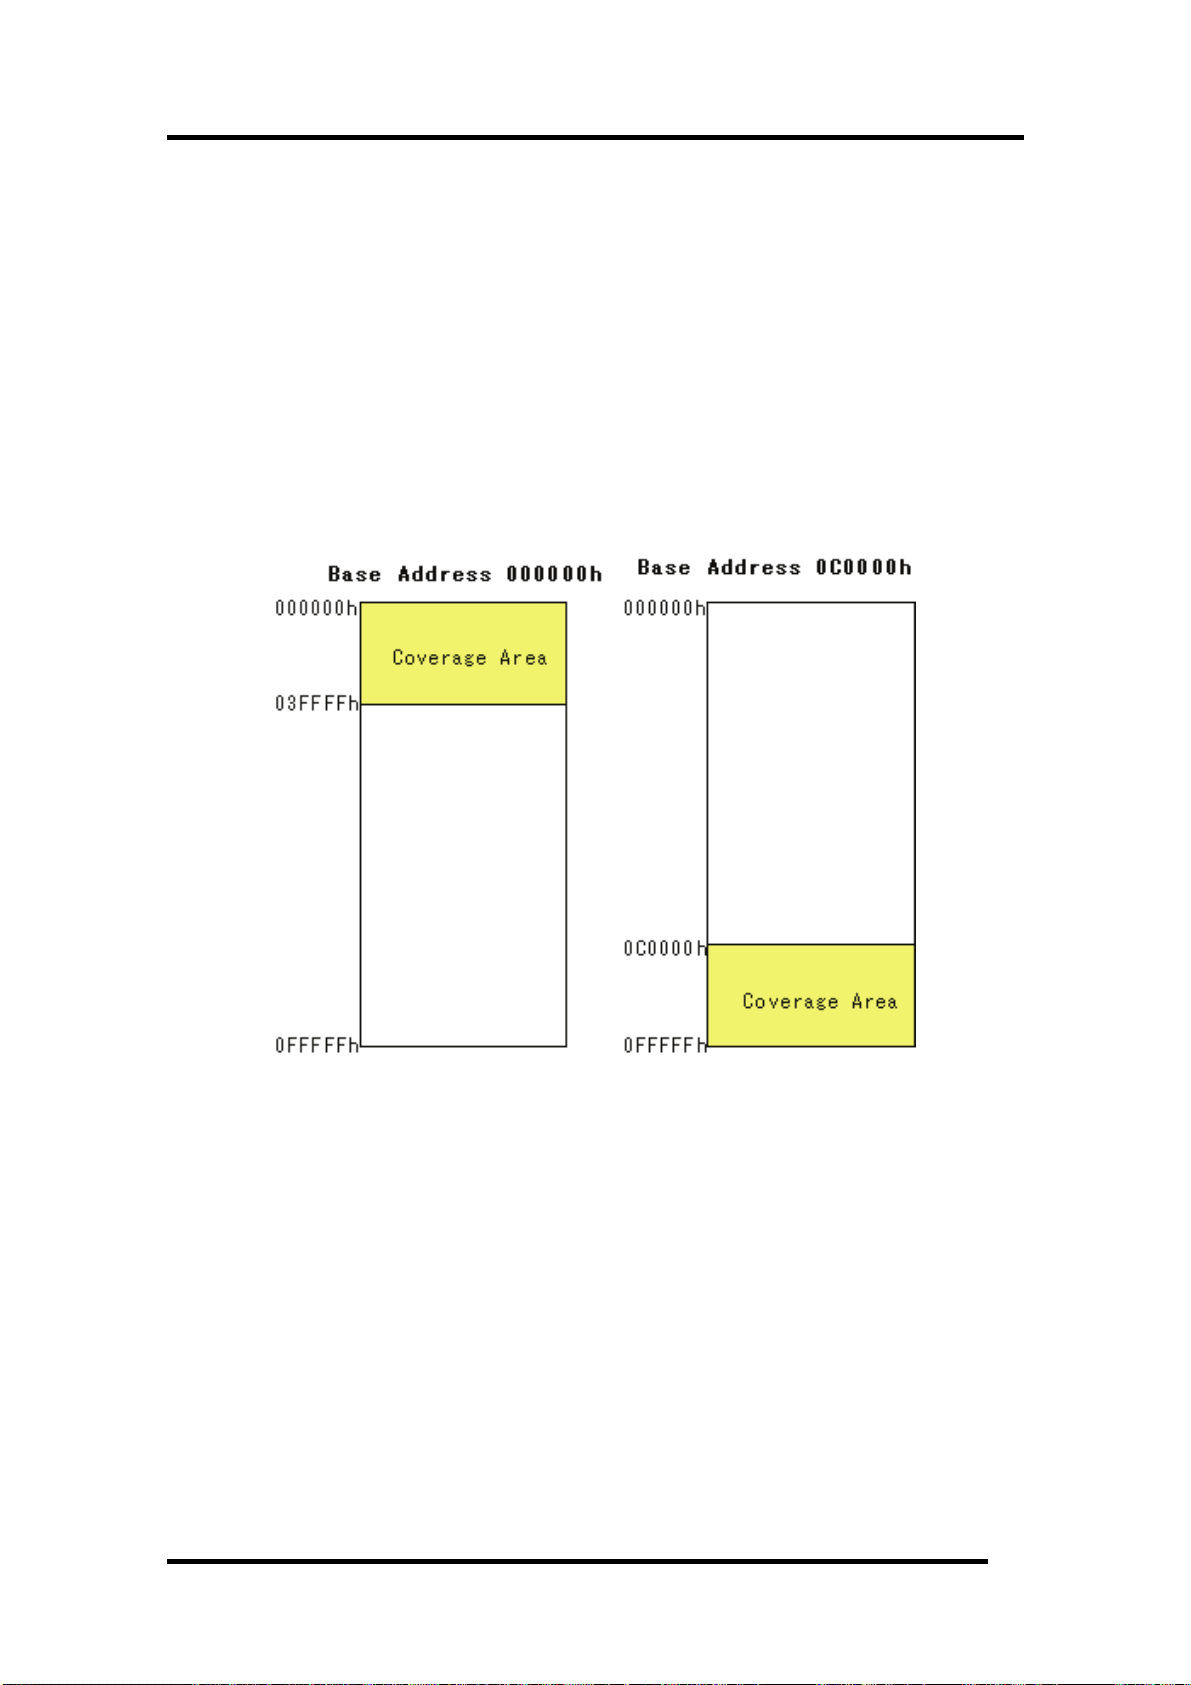
1.5.1 Coverage Measurement Area
The coverage measurement area is any continuous 256 KB area starting from the 64 KB boundary.
The starting address is called coverage base address.
The coverage base address immediately after starting the emulator is set to 0h.
1.5.2 Related Windows
Refer to the coverage measurement result in the following windows.
• Editor (Source) Window
• Memory Window
• Coverage Window
9
Page 24

1.6 Real-Time OS Debugging Function
This function debugs the realtime OS-dependent parts of the target program that uses the realtime
OS.
This function helps to show the status of the realtime OS and inspect a task execution history, etc.
The debugger for 740 can't show the status of the realtime OS.
1.7 GUI Input/Output Function
This function simulates the user target system's key input panel (buttons) and output panel on a
window.
Buttons can be used for the input panel, and labels (strings) and LEDs can be used for the output
panel.
10
Page 25

2 About the Emulator PC4701
2. About the Emulator PC4701
The PC4701 emulator system is a generic term used for the 8/16-bit MCU emulators. It can be used in
combination with the emulation pod for the PC4701 to debug application programs for each MCU.
2.1 Communication methods
The supported communication methods vary with the type of emulator used.
I/F
USB Support - -
LAN Support - Support
LPT Support Support -
Proprietary parallel - Support Support
Serial - Support Support
Depending on communication methods, it is necessary to set up some items before the debugger can
be started. Please see "
3.3 Setting before emulator starts "
Emulator
PC4701U PC4701M PC4701HS
2.2 Function table
The supported functions vary with the type of emulator used.
PC4701U/M/HS
S/W Break 64 point s
H/W Break 6 points
Real-Time Tr e ac 32K Cycles
RAM Monitor 1K bytes area
C0 Coverage 256K bytes area
Time Measurement Go to Stop / 4 points interval
Protect Break Access Protect
11
Page 26

3. Before starting the debugger
3.1 Communication method by emulator
The supported communication methods are as follows. (The supported communication methods vary
with the type of emulator used. )
USB, LAN, LPT, Proprietary parallel, Serial
3.1.1 USB Interface
Supported only when using the PC4701U emulator.
• Compliant with USB Standard 1.1.
• Connections via USB hub are not supported.
• By connecting the host computer and the emulator with USB cable, it is possible to install the
supported device drivers using a wizard.
• The necessary cable is included with the emulator.
3.1.2 LAN Interface
Supported only when using the PC4701U/HS emulator.
• The IP address, etc. must be set in the emulator before it can be connected in a LAN.
• To communicate with the emulator via a LAN on Windows, Windows' registry information must
partly be modified.
• The PC4701U emulator in a LAN can be connected to the PC4701Us on another network
connected to the LAN via a router.
• The emulators PC4701U and PC4701HS use different LAN cables. Specifically, the PC4701U
uses LAN cable (10BASE-T only) generally available on the market, whereas the PC4701HS uses
the LAN cable (10BASE-T/5) included with it.
• The host computer and the emulator can be connected directly.
3.1.3 LPT Interface
Supported only when using the PC4701U/M emulator.
• This communication uses the host computer's parallel (printer) interface.
• The necessary cable is included with the emulator.
• Four communication modes are supported that include ECP, EPP, Byte, and Nibble.
Communication modes that can be supported depend on the host computer's BIOS settings.
(Communication modes may not always be used even when they are supported by BIOS.)
12
Page 27

3 Before starting the debugger
3.1.4 Proprietary Parallel Interface
Supported only when using the PC4701HS emulator.
• The host computer must have a dedicated interface board, the PCA4202G02, incorporated in it
(only the ISA bus is supported). The necessary cable is included with the emulator.
• A device driver must separately be set.
3.1.4.1 Serial Interface
Supported only when using the PC4701M/HS emulator.
• This communication uses the host computer's serial interface.
• The necessary cable is included with the emulator.
13
Page 28
3.2 Download of Firmware
It is necessary to down-load the firmware which corresponds to connected Emulation Pod when the
debugger is started to the emulator.
• You have changed your emulation pod.
• The firmware downloaded to the emulator is unknown one.
• You have setup the debugger for the first time.
• You have upgraded emulator debugger.
Press the system reset switch within two seconds after powering up the PC4701 to establish the
maintenance mode.
This debugger searches the version of the firmware downloaded to the emulator at start. Also when
the firmware downloaded to the emulator is of old version, a mode which drives this debugger to
download firmware is set.
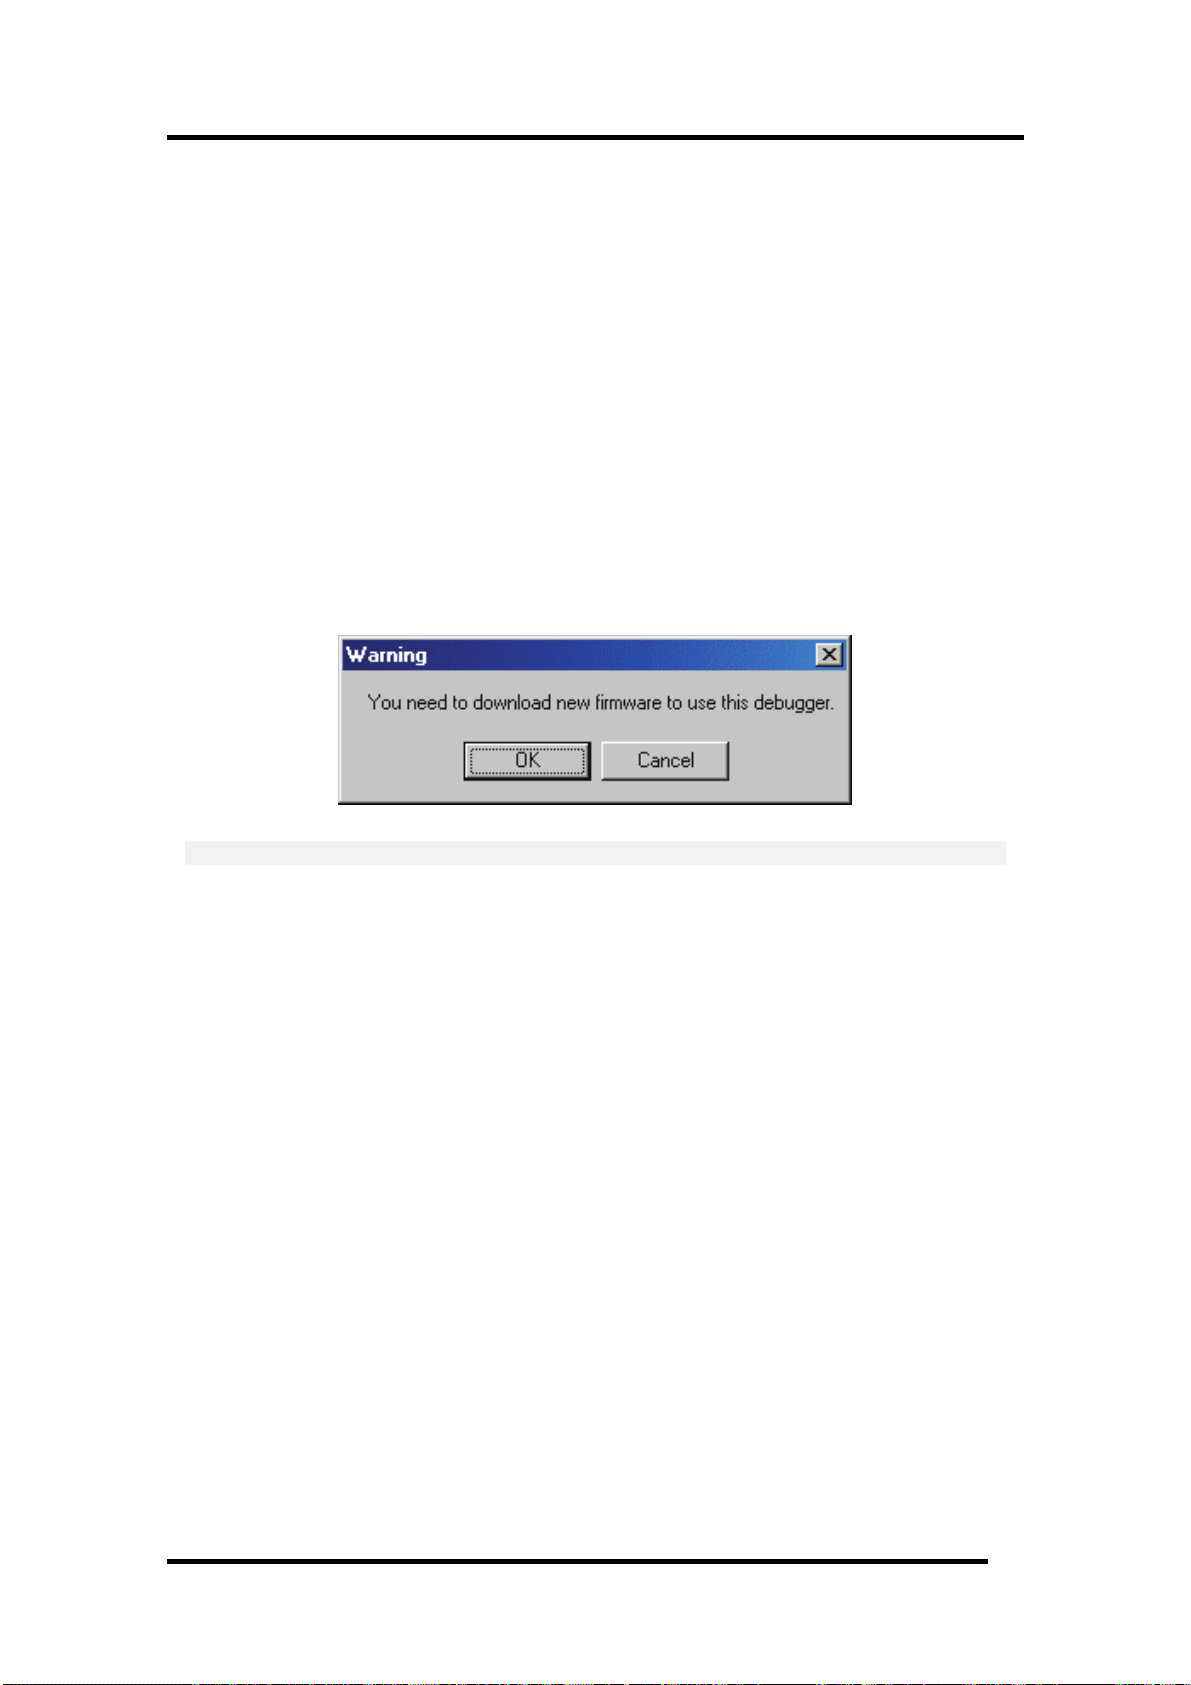
When this debugger gets started while the emulator is set in the mode which drives the debugger to
download firmware forcedly, the following dialog is opened at start.
Click the OK button to download the firmware.
ATTENTION
• If the emulator being used is the PC4701HS, use other communication methods (dedicated
parallel or serial) to download the firmware.
• Before the firmware can be downloaded by the emulator in a LAN connection, the IP address, etc.
must first be registered in the emulator.
14
Page 29
3 Before starting the debugger
3.3 Setting before emulator starts
3.3.1 USB communication
Connection of USB devices is detected by Windows' Plug & Play function. The device driver needed
for the connected USB device is automatically installed.
3.3.1.1 Install of USB device driver
The USB devices connected are detected by Windows' Plug & Play function. The installation wizard
for USB device drivers starts after the device had been detected. The following shows the procedure
for installing the USB device drivers.
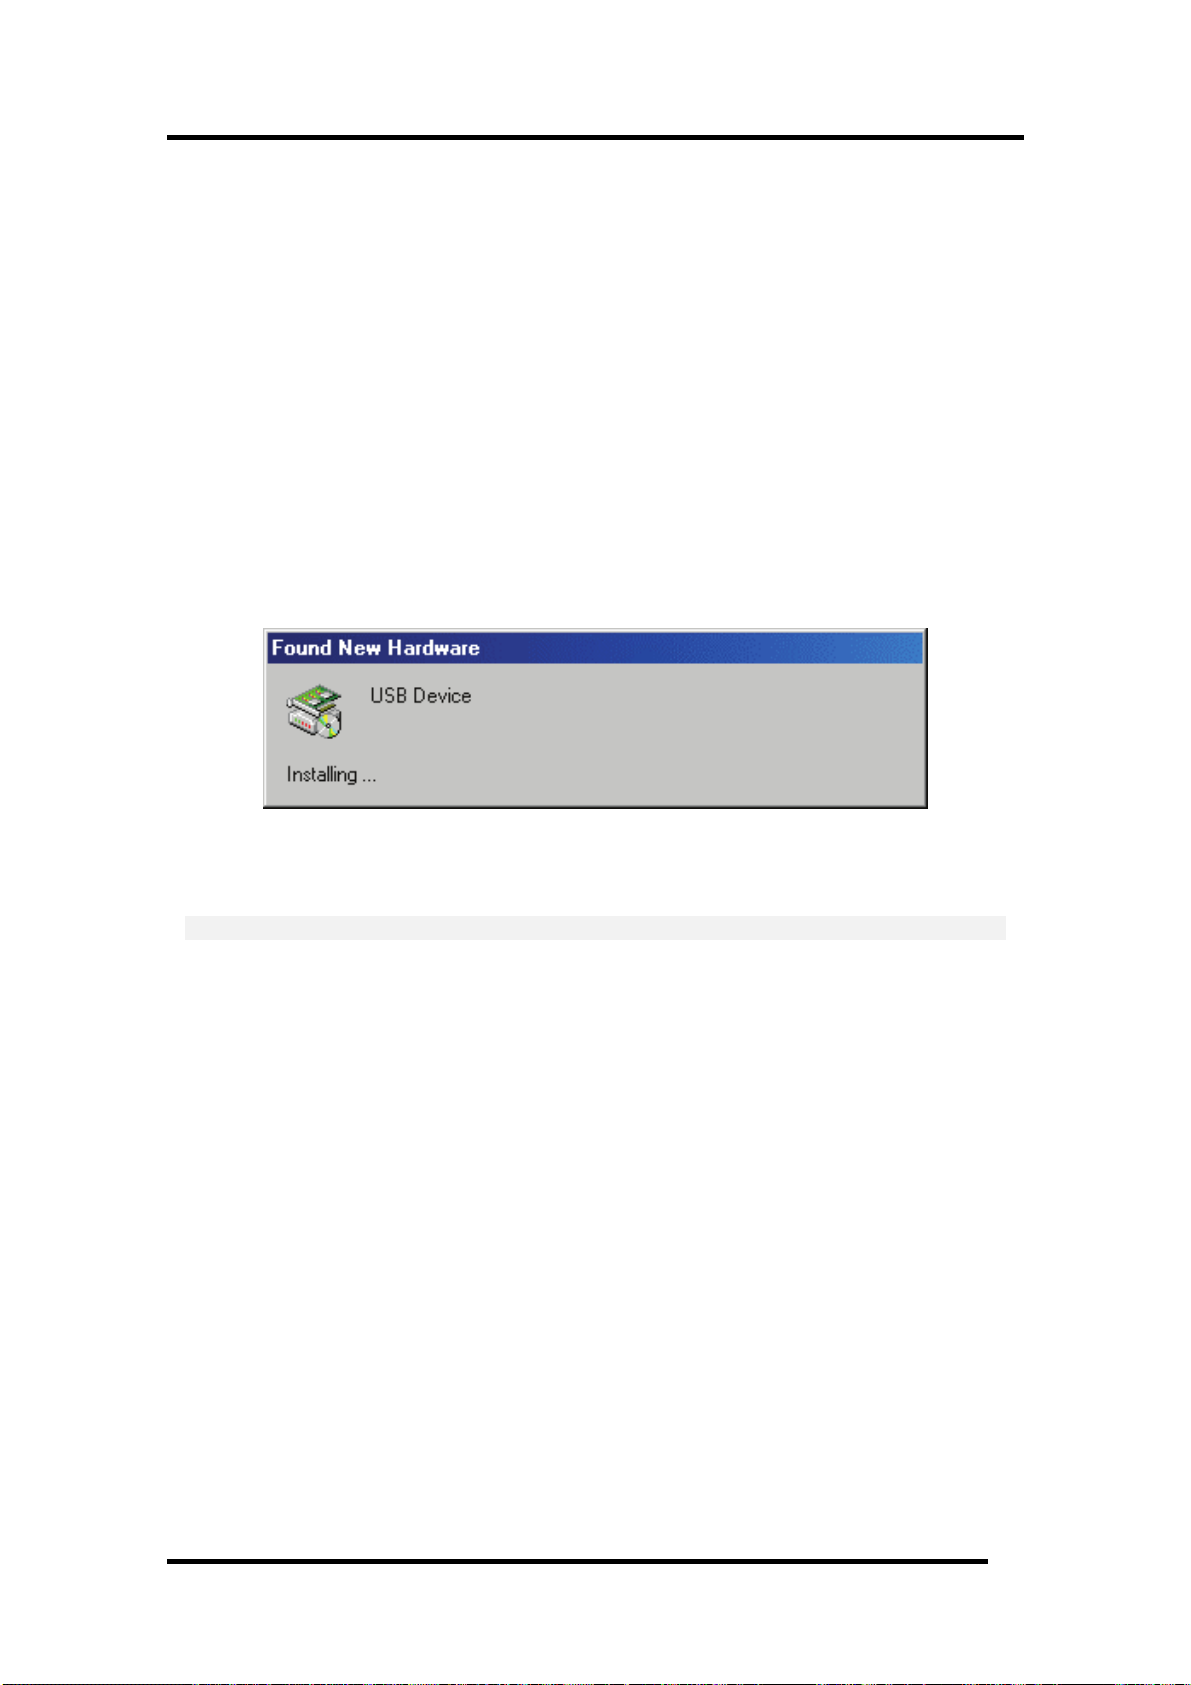
1. Connect the host computer and the emulator with USB cable.
2. Set the emulator's communication interface switch to the "USB" position. Then turn on the
power to the emulator.
3. The dialog box shown below appears.
Go on following the wizard, and a dialog box for specifying the setup information file (inf file) is
displayed. Specify the musbdrv.inf file stored in a location below the directory where this debugger is
installed.
ATTENTION
• Before the USB device drivers can be installed, the debugger you use must already be installed.
Install this debugger first.
• A user who install the USB device driver need administrator rights.
• During installation, a message may be output indicating that the device driver proper
musbdrv.sys cannot be found. In this case, specify the musbdrv.sys which is stored in the same
directory as is the musbdrv.inf file.
15
Page 30
3.3.2 LAN communication 1
Before the emulator can be connected in a LAN, the IP address, etc. must first be registered in the
emulator. For the emulator in default settings, the utility "setip.exe" included with the debugger may
be used to set the IP address, etc. in the emulator.
3.3.2.1 Setting of the LAN Interface using the SETIP.EXE
The utility "SETIP" included with this debugger may be used to set the IP address, etc. in the
emulator while in default settings. SETIP detects the Emulator's in default settings that are
connected to the same network. SETIP is stored in a location below the directory where this debugger
is installed . The file name is "setip.exe".
To register the IP address in the emulator, follow the procedure described below.
1. Connect the emulator with LAN cable to the same network (same subnet) as the host computer
is connected.
2. Set the emulator's communication interface switch to the "LAN" position. Then turn on the
power to the emulator.
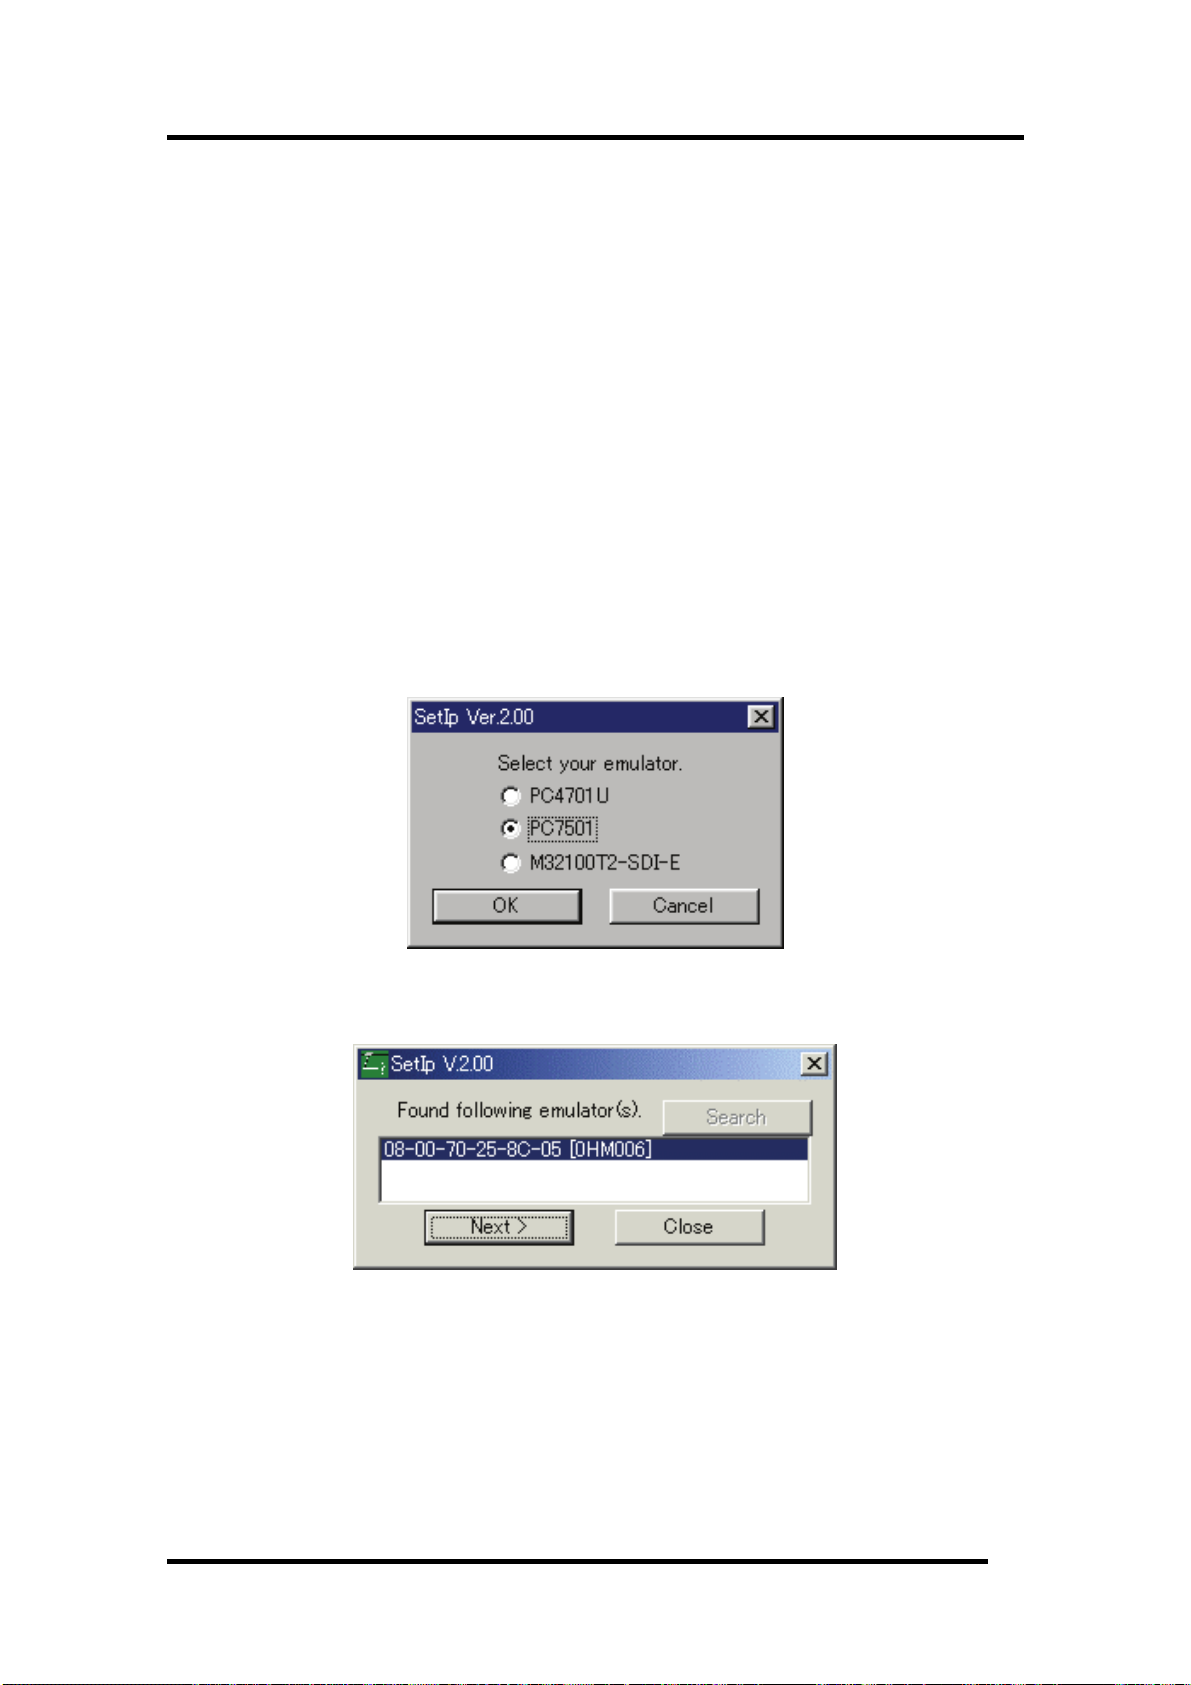
3. Start SETIP. When SETIP has started up, the dialog box shown below appears, choose the
emulator of use, click the OK button.
4. Click the OK button, and showing information on the emulator connected to the network. (This
information consists of the MAC address followed by the serial number of the emulator.)
To register the IP address, click the Next button. To cancel registration, click the Close button. If not
displayed, check whether the communication interface switch is set correctly and after temporarily
turning off the power, turn it back on again. Then click the Search button.
16
Page 31
3 Before starting the debugger
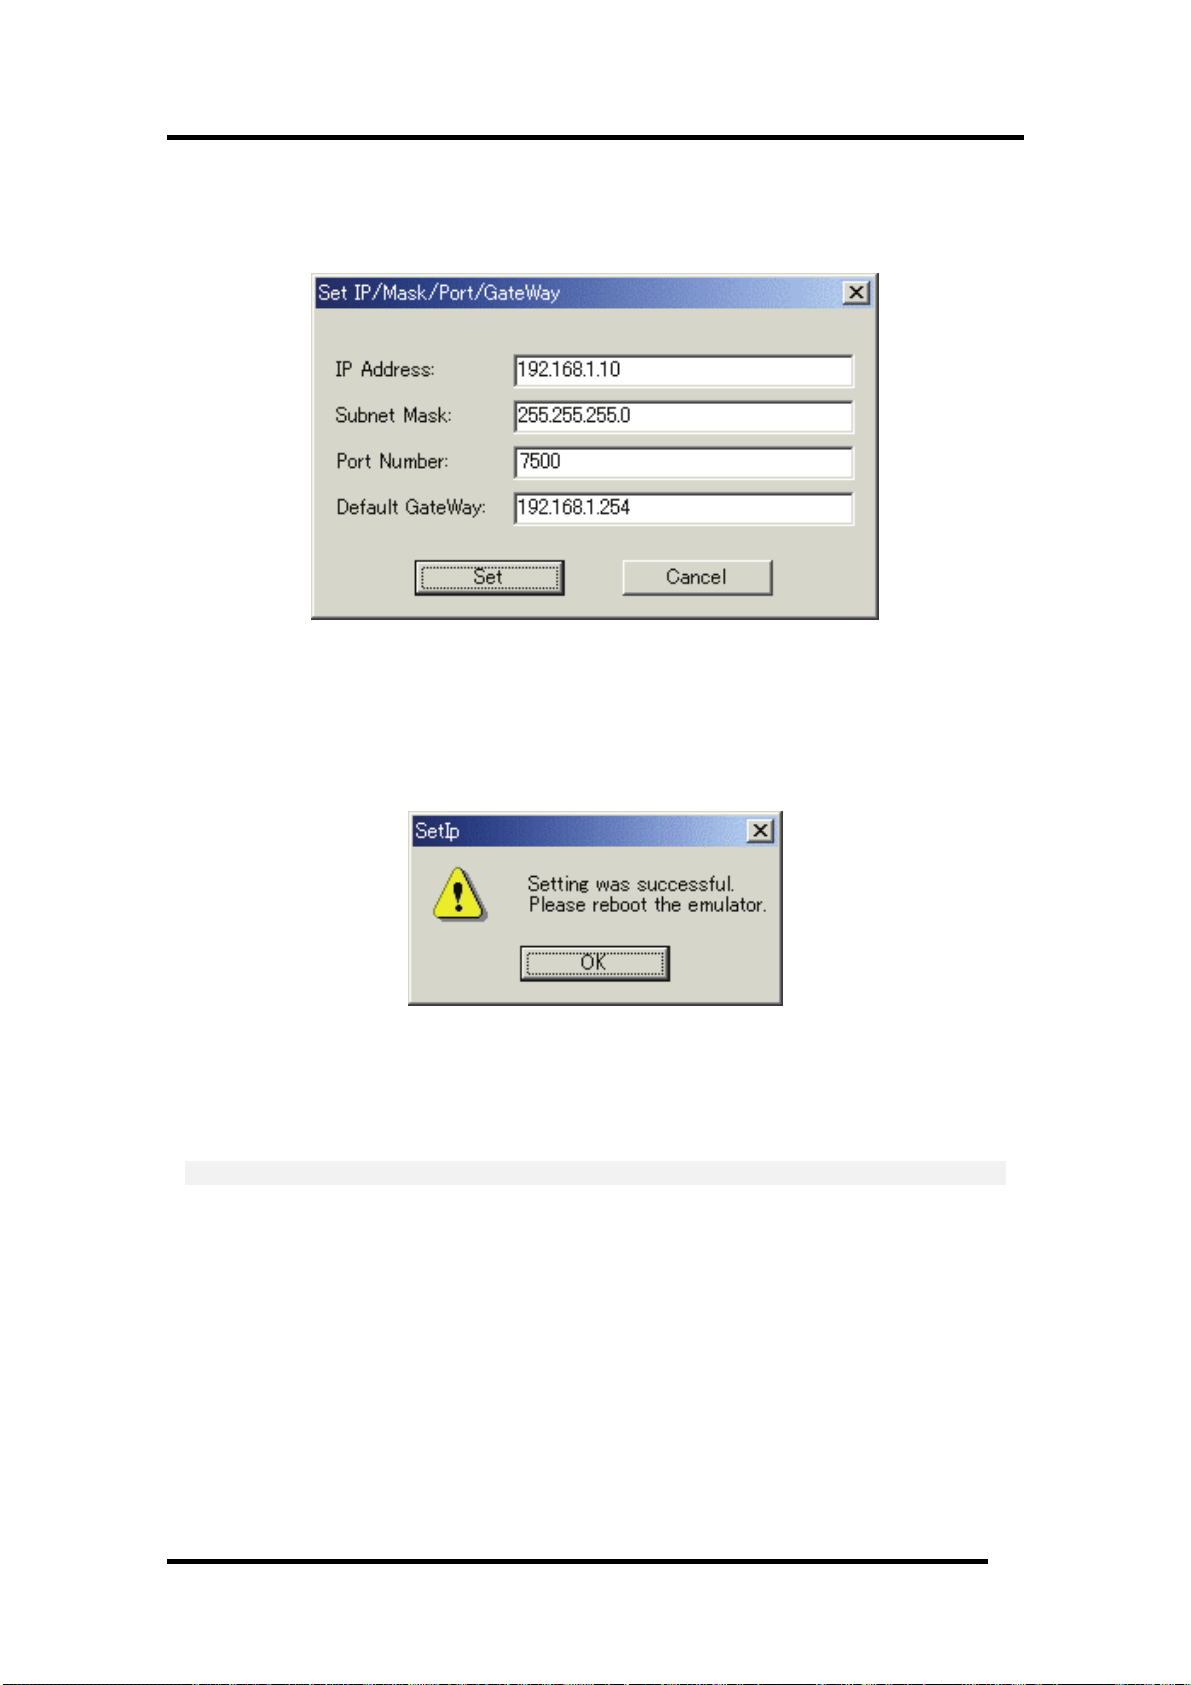
5. Click the Next button, and the dialog box shown below appears. Set the IP address, subnet mask,
port number, and default gateway IP address. When using the emulator on the same network's
same subnet mask, the default gateway IP address may be omitted.
Use any 4-digit number to specify the port number. (Enter that number when starting the debugger.)
For details about the contents of the IP address, subnet mask, and default gateway to be specified,
contact your network administrator.
6. Click the Set button on the dialog box. The IP address, etc. that have been set are registered in
the emulator. When registered correctly, the dialog box shown below appears.
After checking the contents of the dialog box, click the OK button.
7. Temporarily turn off the power to the emulator and turn it back on again. The registered IP
address becomes effective after the emulator is powered up again.
ATTENTION
• If multiple Emulators in default settings are connected on the same network, only the first
emulator detected is displayed.
• The emulators which have had an IP address already set cannot be detected by SETIP. In such a
case, connect to the emulator through another communication interface and re-register the IP
address from the Init dialog box that appears. For details on how to set IP addresses from the Init
dialog box, see "
5.2.3Setting of the LAN Interface."
17
Page 32

3.3.3 LAN communication 2
Please exexute registry setting program (Sack.exe) before starting the debugger. It is necessary for
LAN communication with emulators to set the following registry.
OS
Key Data
Windows XP/2000 HKEY_LOCAL_MACHINE¥S
YSTEM¥CurrentControlSet¥
Services¥Tcpip¥Parameters¥
SackOpts
You can clear the registry with executing the program "UnSack.exe". The above programs are
installed in the directory where this debugger is installed.
ATTENTION
Make sure Sack.exe and UnSack.exe is executed by one who is authorized as an Administrator. No
one but the user who has the authority of an Administrator can install the device driver.
Note
Windows XP/2000 TCP supports "Selective Acknowledgments (SACK)" as documented in RFC 2018.
SACK gives higher performance in the network which have high bandwidth and long round-trip
delays like satellite channels.
SACK support is enabled by default in Windows XP/2000. It is necessary for LAN communication
with emulators by Windows XP/2000 to disable SACK support. Setting the above registry can disable
SACK support.
Note that when you use the network which have high bandwidth and long round-trip delays like
satellite channels, the performance with SACK support disabled is lower than with enabled.
0(REG_DWORD)
18
Page 33

3 Before starting the debugger
3.3.4 Proprietary parallel communication
If you are using this debugger in a combination of the parallel I/F, you need to specify the start
address of I/O addresses (7 bytes) to the device driver for PCA4202G02, (The I/O address for
PCA4202G02 is set to 100h initially.) You can set this setting with setPca4202.exe included with this
debugger. The above programs are installed in the directory where this debugger is installed. At the
first time of using this debugger,or when you want to change the I/O address for PCA4202G02
because of conflict with other devices, please follow the procedure of the setting described below.
1. Execute setPca4202.exe included with this debugger. The dialog box shown below will appear.
2. Find the I/O address that is set on the PCA4202G02 parallel board and input it in hexadecimal
into the I/O Address input field. Click "OK" button.
3. Restart Windows.
ATTENTION
• Make sure setPca4202.exe is executed by one who is authorized as an Administrator. No one but
the user who has the authority of an Administrator can install the device driver.
• For detail about parallel board PCA4202G02, refer to "PCA4202G02 Instruction Manual".
19
Page 34

4. Preparation before Use
Please run the High-performance Embedded Workshop and connect the emulator .
In addition, in order to debug with this product, it is necessary to create a workspace.
4.1 Workspaces, Projects, and Files
Just as a word processor allows you to create and modify documents, this product allows you to create
and modify workspaces.
A workspace can be thought of as a container of projects and, similarly, a project can be thought of as
a container of project files. Thus, each workspace contains one or more projects and each project
contains one or more files.
Workspaces allow you to group related projects together. For example, you may have an application
that needs to be built for different processors or you may be developing an application and library at
the same time. Projects can also be linked hierarchically within a workspace, which means that when
one project is built all of its "child" projects are built first.
However, workspaces on their own are not very useful, we need to add a project to a workspace and
then add files to that project before we can actually do anything.
20
Page 35

4 Preparation before Use
4.2 Starting the High-performance Embedded Workshop
Activate the High-performance Embedded Workshop from [Programs] in the [Start] menu.
The [Welcome!] dialog box is displayed.
In this dialog box, A workspace is created or displayed.
• [Create a new project workspace] radio button:
Creates a new workspace.
• [Open a recent project workspace] radio button:
Uses an existing workspace and displays the history of the opened workspace.
• [Browse to another project workspace] radio button:
Uses an existing workspace;
this radio button is used when the history of the opened workspace does not remain.
In the case of Selecting an Existing Workspace, select [Open a recent project workspace] or [Browse to
another project workspace] radio button and select the workspace file (.hws).
Please refer to the following about the method to create a new workspace.
Refer to "
Refer to "
* When debugging the existing load module file with this product, a workspace is created by this
method.
The method to create a new workspace depends on whether a toolchain is or is not in use. Note that
this product does not include a toolchain. Use of a toolchain is available in an environment where the
C/C++ compiler package for the CPU which you are using has been installed.
For details on this, refer to the manual attached to your C/C++ compiler package.
4.2.1Creating a New Workspace (Toolchain Used)"
4.2.2Creating a New Workspace (Toolchain Not Used)"
21
Page 36

4.2.1 Creating a New Workspace (Toolchain Used)
4.2.1.1 Step1 : Creation of a new workspace
In the [Welcome!] dialog box that is displayed when the High-performance Embedded Workshop is
activated, select the [Create a new project workspace] radio button and click the [OK] button.
Creation of a new workspace is started.
The following dialog box is displayed.
1. Select the target CPU family
In the [CPU family] combo box, select the target CPU family.
2. Select the target toolchain
In the [Tool chain] combo box, select the target toolchain name when using the toolchain.
3. Select the project type
In the [Project type] list box, select the project type to be used.
In this case, select "Application" .
(Please refer to the manual attached to your C/C++ compiler package about the details of the
project type which can be chosen.)
4. Specify the workspace name and project name
- In the [Workspace Name] edit box, enter the new workspace name.
- In the [Project Name] edit box, enter the project name. When the project name is the same as
the workspace name, it needs not be entered.
- In the [Directory] edit box, enter the directory name in which the workspace will be created.
Click the [Browse...] button to select a directory.
After a setting, click the [OK] button.
22
Page 37

4.2.1.2 Step2 : Setting for the Toolchain
A wizard for the project creation starts.
4 Preparation before Use
Here, the following contents are set.
• toolchain
• the setting for the real-time OS (when using)
• the setting for the startup file, heap area, stack area, and so on
Please set required information and click the [Next] button.
The contents of a setting change with C/C++ compiler packages of use. Please refer to the manual
attached to your C/C++ compiler package about the details of the contents of a setting.
23
Page 38

4.2.1.3 Step 3: Selecting of the Target Platform
Select the target system used for your debugging (emulator, simulator).
When the setting for the toolchain has been completed, the following dialog box is displayed.
1. Selecting of the Target type
In the [Target type] list box, select the target CPU type.
2. Selecting of the Target Platform
In the [Targets] area, the target for the session file used when this debugger is activated must be
selected here.
Check the box against the target platform. (And choose other target as required.)
And click the [Next] button.
24
Page 39

4 Preparation before Use
4.2.1.4 Step4 : Setting the Configuration File Name
Set the configuration file name for each of the all selected target.
The configuration file saves the state of High-performance Embedded Workshop except for the target
(emulator, simulator).
The default name is already set. If it is not necessary to change, please click the [next] button as it is.
25
Page 40

4.2.1.5 Step5 : The check of a created file name
Finally, confirm the file name you create. The files which will be generated by the High-performance
Embedded Workshop are displayed If you want to change the file name, select and click it then enter
the new name.
This is the end of the emulator settings.
Exit the Project Generator following the instructions on the screen.
26
Page 41

4 Preparation before Use
4.2.2 Creating a New Workspace (Toolchain Not Used)
When debugging the existing load module file with this product, a workspace is created by this
method.
4.2.2.1 Step1 : Creation of a new workspace
In the [Welcome!] dialog box that is displayed when the High-performance Embedded Workshop is
activated, select the [Create a new project workspace] radio button and click the [OK] button.
Creation of a new workspace is started. The following dialog box is displayed.
1. Select the target CPU family
In the [CPU family] combo box, select the target CPU family.
2. Select the target toolchain
In the [Tool chain] combo box, select "None". In this case, toolchain is not used.
(When the toolchain has not been installed, the fixed information is displayed in this combo box.)
3. Select the project type
(When the toolchain is not used, it is displayed on a [Project Type] list box as "Debugger only Target Name". Select it. (When two or more project types are displayed, please select one of
them.)
4. Specify the workspace name and project name
- In the [Workspace Name] edit box, enter the new workspace name.
- In the [Project Name] edit box, enter the project name. When the project name is the same as
the workspace name, it needs not be entered.
- In the [Directory] edit box, enter the directory name in which the workspace will be created.
Click the [Browse...] button to select a directory.
After a setting, click the [OK] button.
27
Page 42
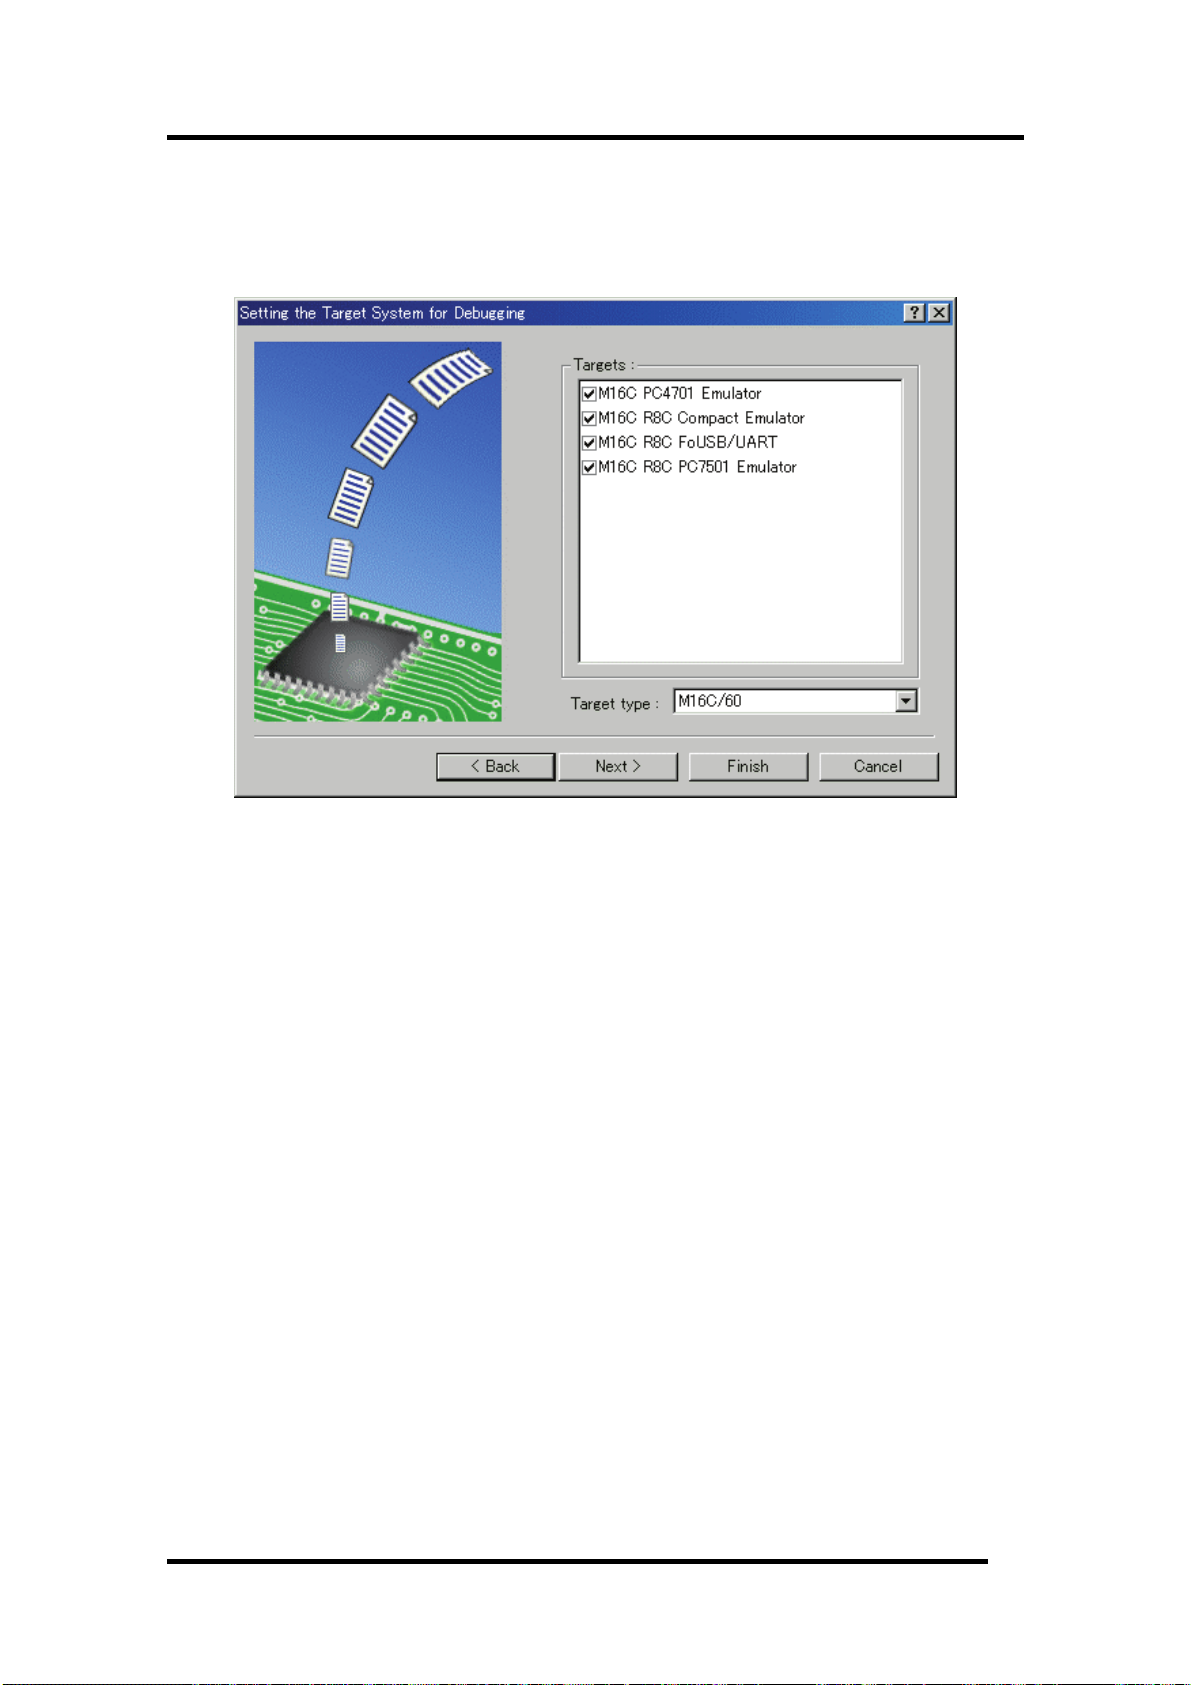
4.2.2.2 Step 2: Selecting of the Target Platform
Select the target system used for your debugging (emulator, simulator).
A wizard starts and the following dialog box is displayed.
1. Selecting of the Target type
In the [Target type] list box, select the target CPU type.
2. Selecting of the Target Platform
In the [Targets] area, the target for the session file used when this debugger is activated must be
selected here.
Check the box against the target platform. (And choose other target as required.)
And click the [Next] button.
28
Page 43
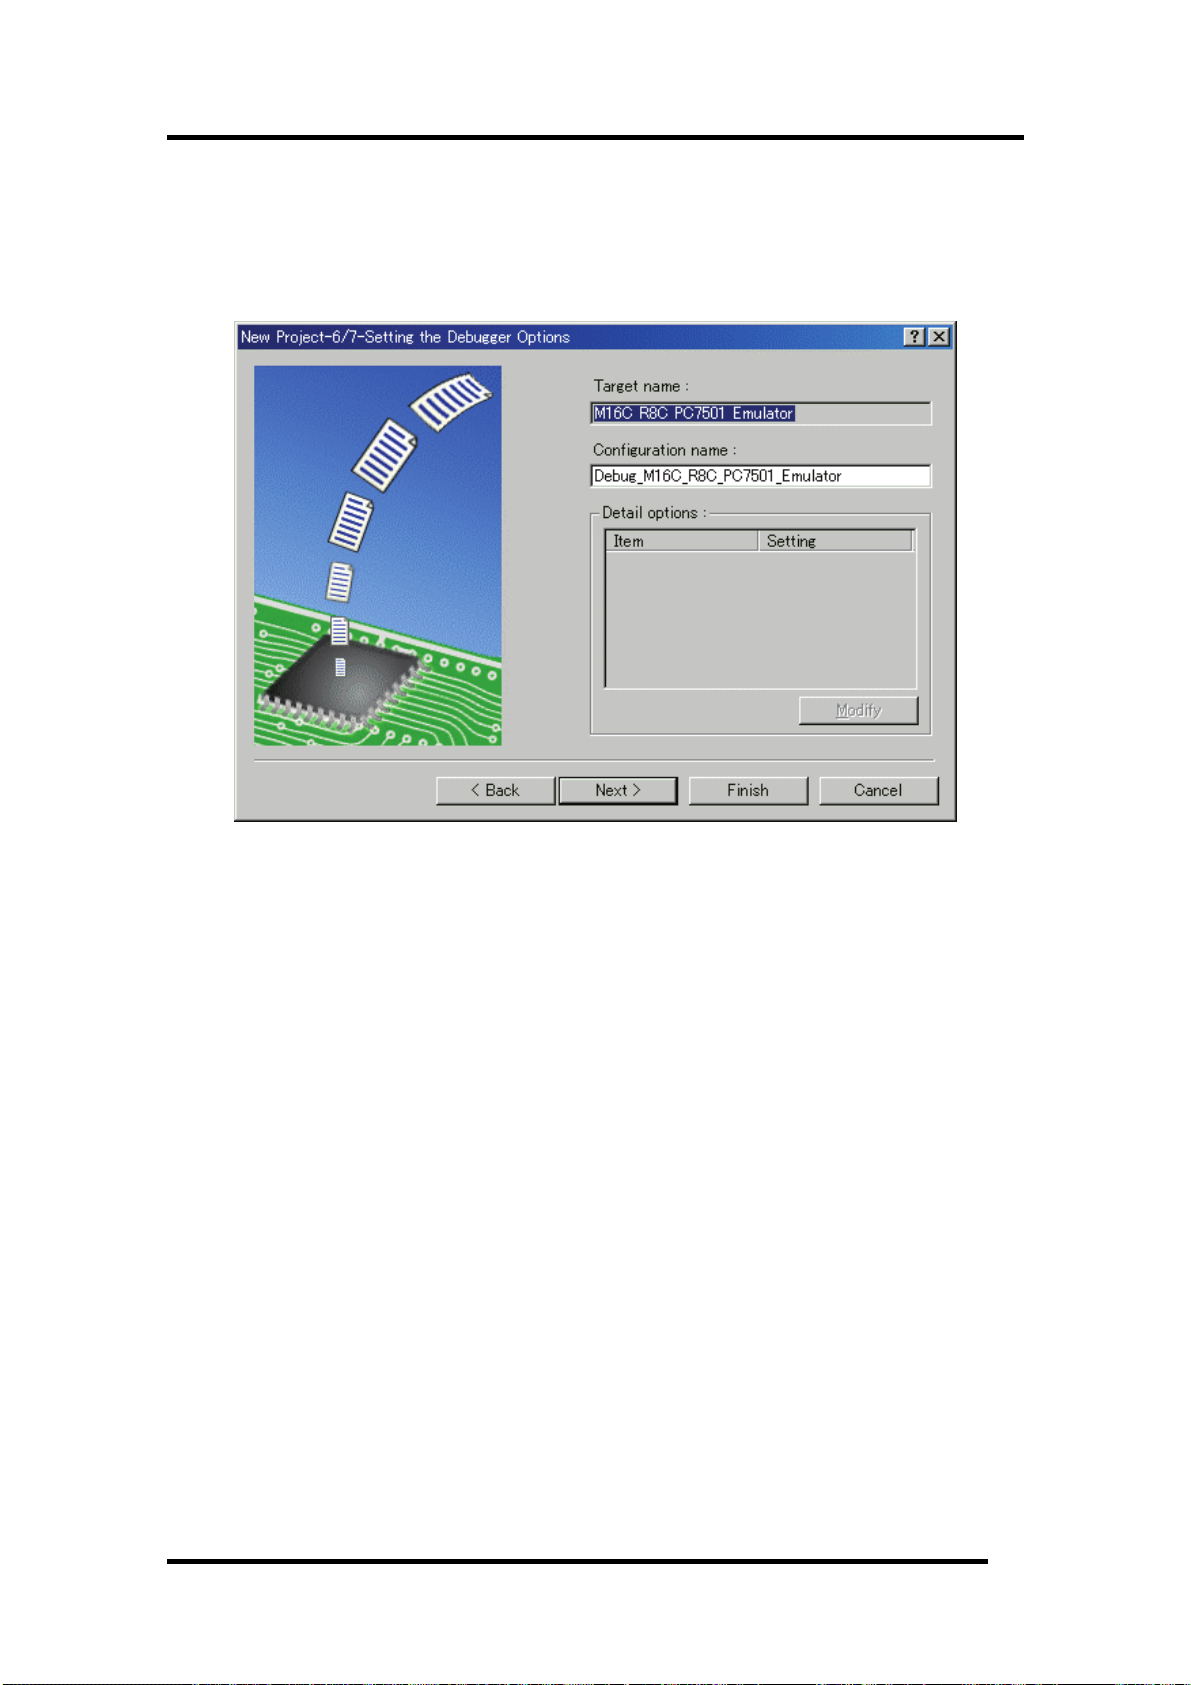
4 Preparation before Use
4.2.2.3 Step3 : Setting the Configuration File Name
Set the configuration file name for each of the all selected target.
The configuration file saves the state of High-performance Embedded Workshop except for the target
(emulator, simulator).
The default name is already set. If it is not necessary to change, please click the [next] button as it is.
This is the end of the emulator settings.
Exit the Project Generator following the instructions on the screen.
And the dialog for the setup of a debugger is also displayed at this time . If preparation of an emulator
is completed, set up the debugger in this dialog box and connect with an emulator.
29
Page 44

4.2.2.4 Step4 : Registering the Load modules to be downloaded
Finally, register the load module file to be used.
Select [Debug Settings...] from the [Debug] menu to open the [Debug Settings] dialog box.
1. Select the product name to be connected in the [Target] drop-down list box.
2. Select the format of the load module to be downloaded in the [Default Debug Format] drop-down
list box.
Format Name
IEEE695_REN S ESA IEEE-695 format file (When Using Renesas toolchain)
IEEE695_IAR IEEE-695 format file (When Using IAR toolchain)
IEEE695_TASKING IEEE-695 format file (When Using Tasking toolchain)
ELF/DWARF2 ELF/DWARF2 format file (When Using Renesas toolch in) a
ELF/DWARF2_IAR ELF/DWARF2 format file (When Using IAR toolchain)
ELF/DWARF2_TASKING ELF/DWARF2 format file (When Using Tasking toolchain)
ELF/DWARF2_KPIT ELF/DWARF2 format file (When Using KPIT toolchain)
Intel-Hex+Sym Intel Hex format file with Symbol format file (When Using Renesas
IEEE695_ICC740 IEEE-695 format file (When Using Renesas toolchain "ICC740")
This debugger does not support the object formats, which are not shown in the drop down list.
Contents
toolchain “SRA74”)
30
Page 45
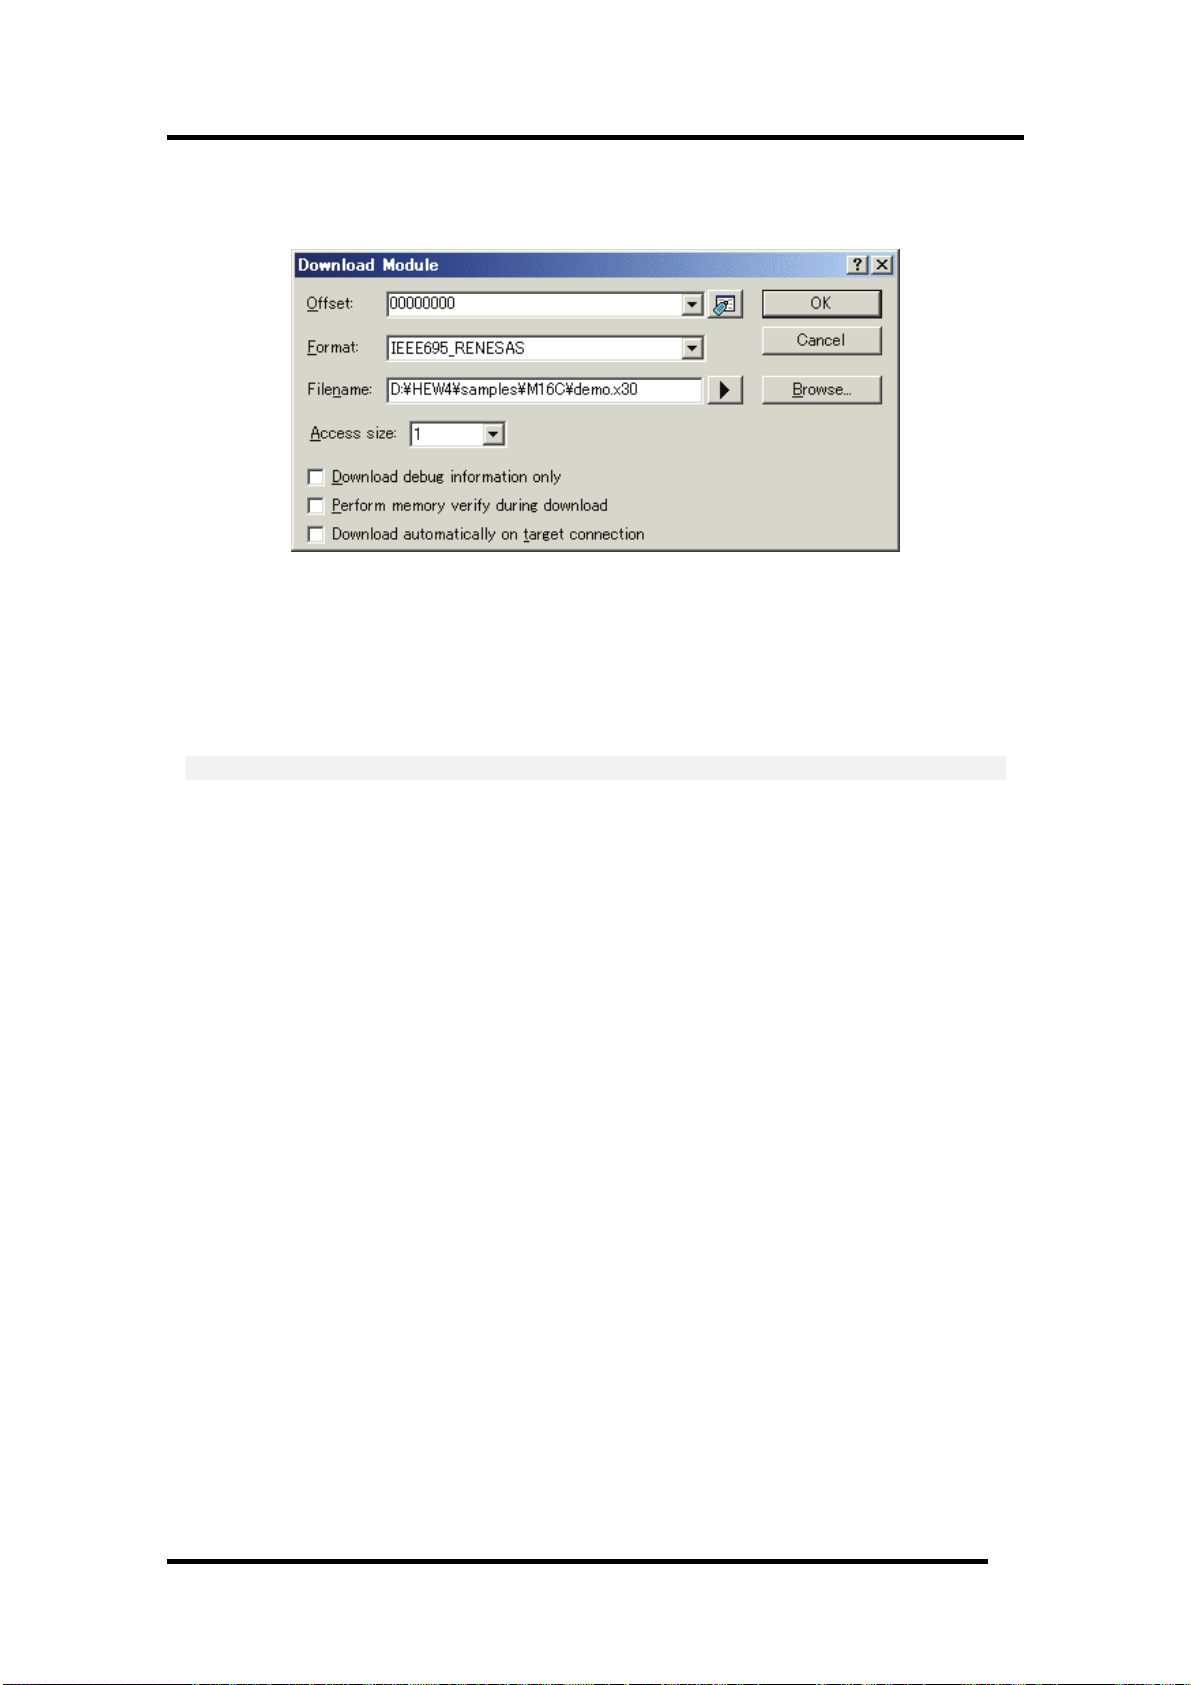
4 Preparation before Use
3. Then register the corresponding download module in the [Download Modules] list box.
A download module can be specified in the dialog opened with a [Add...] button.
- Select the format of the download module in the [Format] edit box. Please refer to the upper
table about the format name of a download module.
- Enter the full path and filename of the download module in the [Filename] edit box.
- Specifies the access size for the current download module in the [Access size] list box.
After that, click the [OK] button.
ATTENTION
"Offset", "Access size" and "Perform memory verify during download" is ignored. The offset is always
set to 0, the access size is always set to 1 and the verification does not work.
31
Page 46
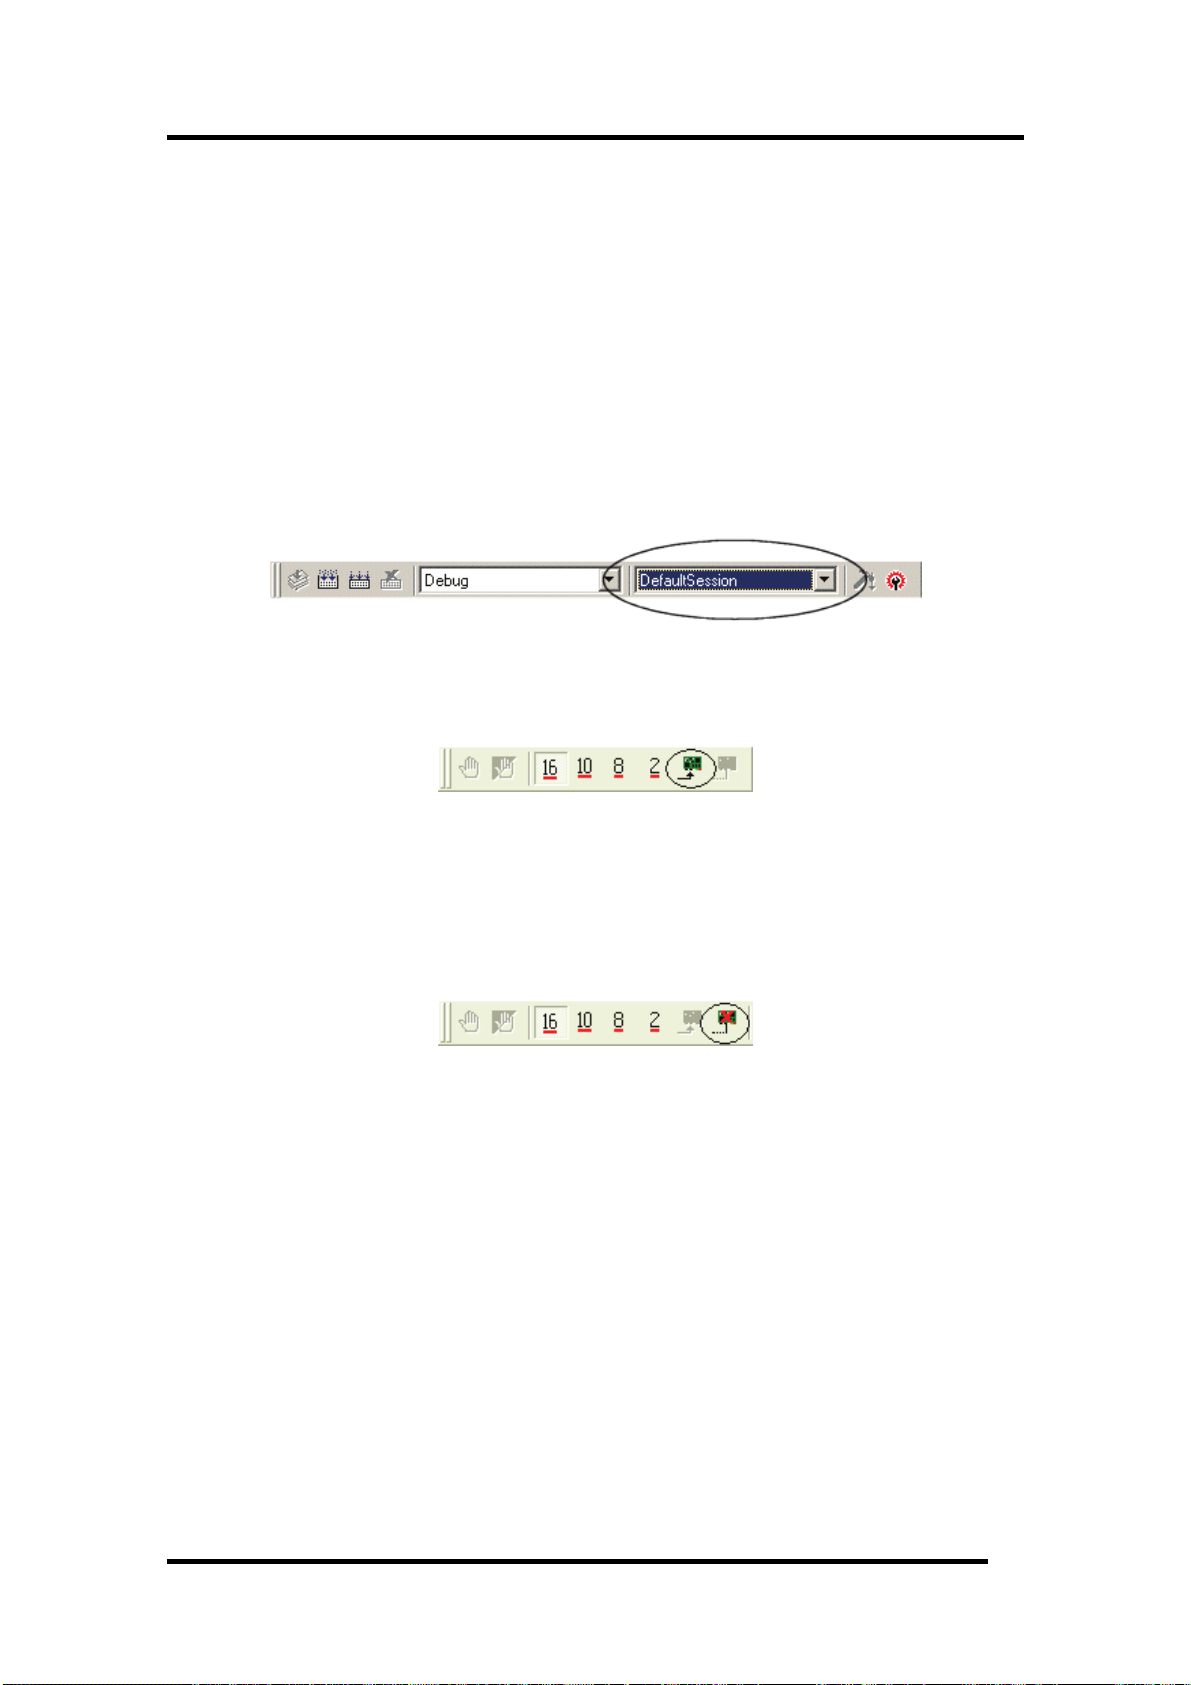
4.3 Starting the Debugger
The debugging can be started by connecting with an emulator.
4.3.1 Connecting the Emulator
Connect the emulator by simply switching the session file to one in which the setting for the emulator
use has been registered.
The session file is created by default. The session file has information about the target selected when
a project was created.
In the circled list box in the following tool bars, select the session name including the character string
of the target to connect.
After the session name is selected, the dialog box for setting the debugger is displayed and the
emulator will be connected.
When the dialog box is not displayed, select [Connect] from the [Debug] menu.
4.3.2 Ending the Emulator
The emulator can be exited by using the following methods:
1. Selecting the “Disconnect”
Select [Disconnect] from the [Debug] menu.
2. Selecting the "DefaultSession"
Select the "DefaultSession" in the list box that was used at the time of emulator connection.
3. Exiting the High-performance Embedded Workshop
Select [Exit] from the [File] menu. High-performance Embedded Workshop will be ended.
The message box, that asks whether to save a session, will be displayed when an emulator is exited. If
necessary to save it, click the [Yes] button. If not necessary, click the [No] button.
32
Page 47
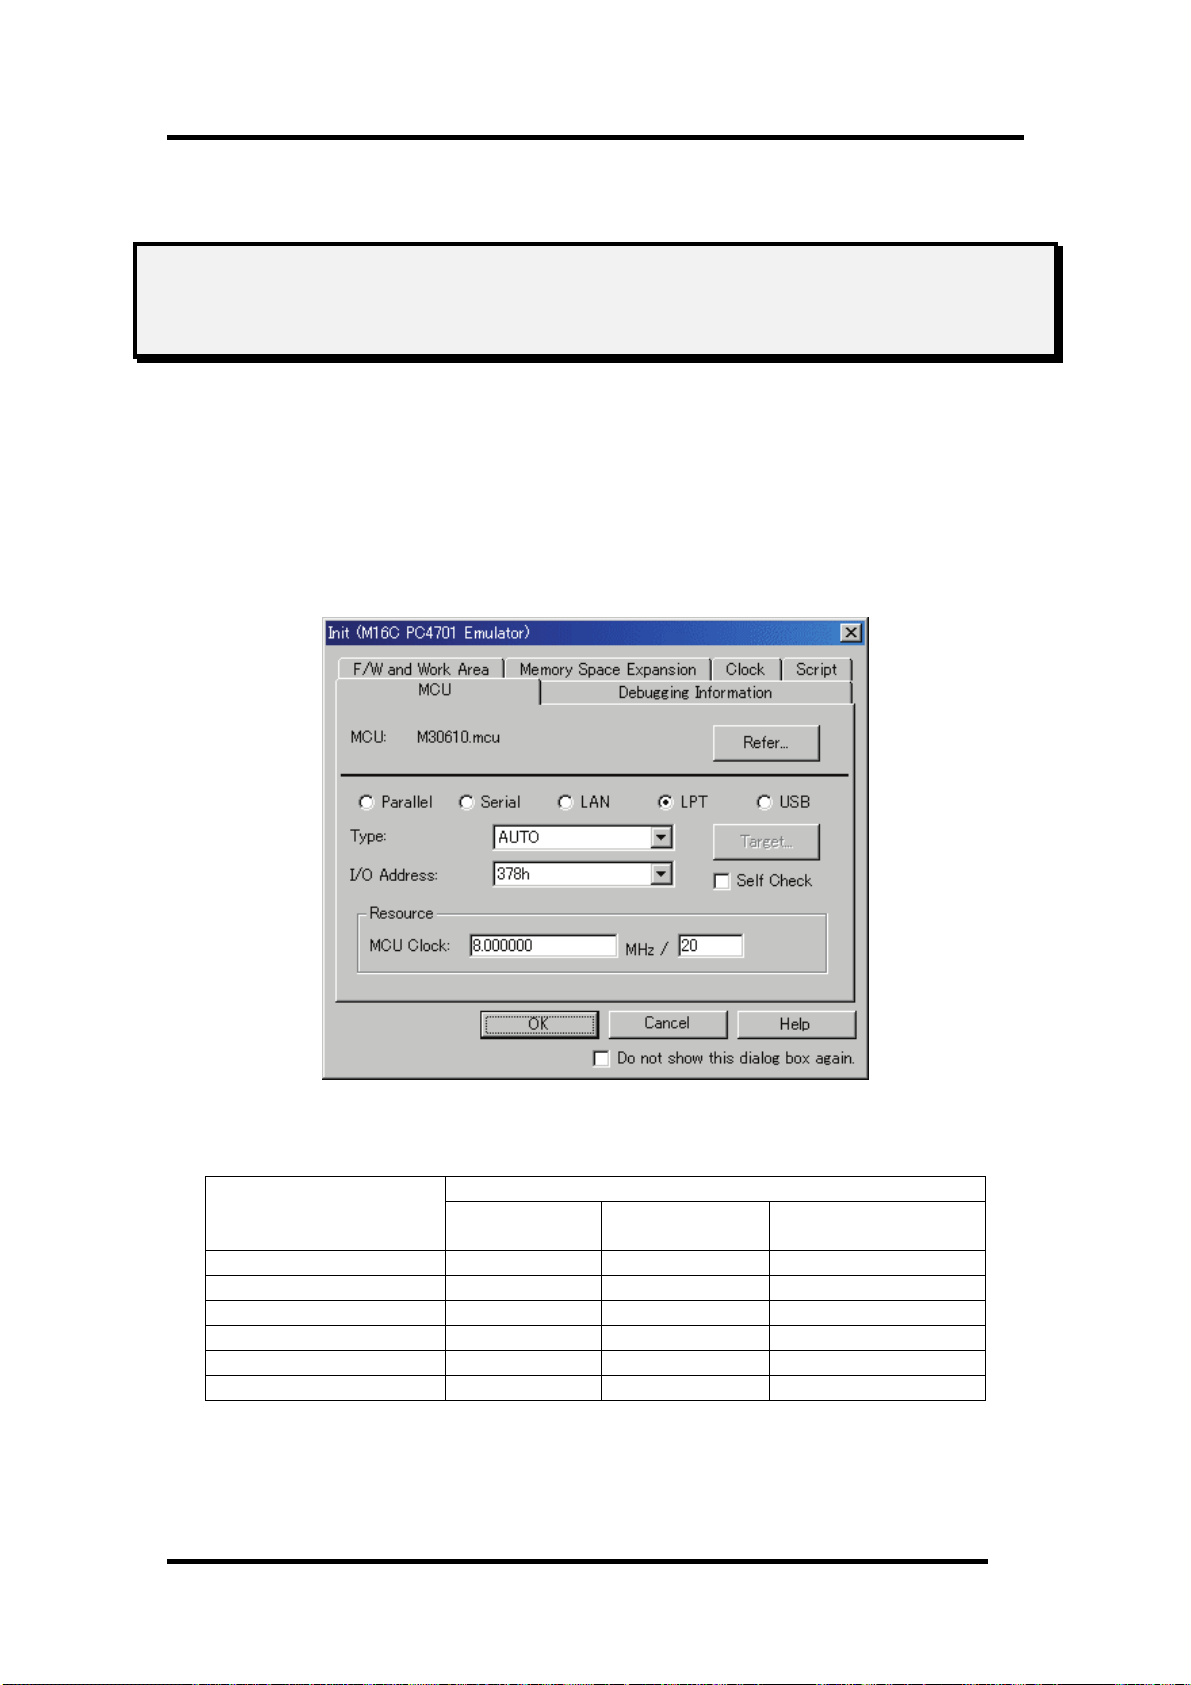
5 Setup the Debugger
5. Setup the Debugger
5.1 Init Dialog
The Init dialog box is provided for setting the items that need to be set when the debugger starts up.
The contents set from this dialog box are also effective the next time the debugger starts. The data set
in this dialog remains effective for the next start.
The tabs available on this dialog box vary with each product used. For details, click the desired tab
name shown in the table below.
Tab Name
MCU Exist exist exist
Debugging Information Ex ist exist exist
F/W and Work Area --- exist ---
Memo ension Mode ry Ext --- exist ---
Clock Exist exist exist
Script Exist exist exist
You can open the Init dialog using either one of the following methods:
• After the debugger gets started, select Menu - [Setup] -> [Emulator] -> [System...].
• Start Debugger while holding down the Ctrl key.
Product Name
The debugger
for M32C
33
The debugger for
M16 /R8C
C
The debugger for 740
Page 48

5.1.1 MCU Tab
The specified content becomes effective when the next being start.
5.1.1.1 Specifying the MCU file
Click the "Refer" button.
The File Selection dialog is opened. Specify the corresponding MCU file.
• An MCU file contains the information specific to the target MCU.
• The specified MCU file is displayed in the MCU area of the MCU tab.
If the corresponding MCU file is not contained in the debugger/emulation pod, you must create a new
MCU file. To do this, see the following:
"
5.6 Method of making MCU file "
5.1.1.2 Setting of the Communication Interface
The displayed data varies depending on the specified communication interface.
The available communication interface varies depending on the products.
The following shows the setting for each communication interface.
• Refer to "
• Refer to "
• Refer to "
• Refer to "
• Refer to "
5.2.1Setting of the USB Interface"
5.2.2Setting of the LPT Interface"
5.2.3Setting of the LAN Interface"
5.2.4Setting of the Parallel Interface"
5.2.5Setting of the Serial Interface"
34
Page 49

5 Setup the Debugger
5.1.1.3 Executing Self-Check
Specify this option to execute self-check* on the emulator when the debugger starts up.
Be sure to select the above check box only when you want to perform self-check at startup. Specify
this option in the following cases:
• When the firmware cannot be downloaded
• When although the firmware is successfully downloaded, the debugger does not start
• When the MCU goes wild or something is wrong with the trace results and you want to check
whether the emulator is operating normally.
Select the check box to close the Init dialog box. After connecting to the emulator and confirming the
firmware, the debugger will immediately start self-check on the emulator. (Self-check takes about 30
seconds to 1 minute.)
If an error is found in this self-check, the debugger displays the content of the error and is finished.
When the self-check terminated normally, the dialog box shown below is displayed. When you click
OK, the debugger starts up directly in that state.
This specification is effective only when the debugger starts up.
* Self-check refers to the function to check the emulator's internal circuit boards for memory condition,
etc. Refer to the user's manual of your emulator for details about the self-check function.
5.1.1.4 Specifying Clock Frequency
Specify the operation clock of the target MCU within the MCU Clock field in the Time Count
Resource group (in units of MHz).
Specify the MCU clock and the clock divide ratio.
If you are using the MCU at 10 MHz divided by 4, for example, enter "10" on the left side and "4" on
the right side of the text box.
If no values are set in the clock divide ratio specifying area, it is assumed that the clock is not divided
(i.e., the same as you would specify the value 1).
35
Page 50

5.1.1.5 Using/unusing the watchdog timer
Specify whether or not to use the watchdog timer. (By default, the watchdog timer is unused.)
This specification exist for the M32C debugger only.
When debugging the target system that uses a watchdog timer, select the check box shown above.
36
Page 51

5.1.2 Debugging Information Tab
The specified content becomes effective when the next being start.
5.1.2.1 display the compiler used and its object format
Display the compiler used and its object file format.
5 Setup the Debugger
Please specify the compiler used and its object file format in the dialog opened by menu [Debug] ->
[Debug Settings...].
5.1.2.2 Specify the Storing of Debugging Information
There are two methods for storing debugging information: on-memory and on-demand.
Select one of these two methods. (The on-memory method is selected by default.)
To select the on-demand method, click the On Demand check box.
The specified content becomes effective when the next being download.
• On-memory method
Debugging information is stored in the internal memory of your computer.
Usually, select this method.
• On-demand method
Debugging information is stored in a reusable temporary file on the hard disk of your computer.
Because the stored debugging information is reused, the next time you download the same load
module it can be downloaded faster.
This method is suitable when it takes so long time to download the debugging information,
because the PC has less memory against the load module file size.
Notes
• If the load module size is large, the on-memory method may be inefficient because it requires a
very large amount of time for downloading. In such a case, select the on-demand method.
• In the on-demand method, a folder in which to store a reusable temporary file is created in the
folder that contains the downloaded load module. This folder is named after the load module
name by the word "~INDEX_" to it. If the load module name is "sample.abs", for example, the
folder name is "~INDEX_sample". This folder is not deleted even after quitting the debugger.
37
Page 52

5.1.2.3 Specify whether to display the instruction format specifier
Specify whether to display the instruction format specifier in the disassembled display.
The debugger for 740 doesn't support this function.
Select the above check box when you display the instruction format specifier.
This specification can only be set or changed when you start the debugger.
5.1.2.4 To treat size of enumeration type as 1 byte
You can specify whether your debugger treat all sizes of enumeration types whose size is unknown in
the debugging information as 1 byte. For reducing memory consumption, NC30 and NC308 have an
option to treat the sizes of enumerator types as 1 byte and not as same size of 'int'. Note that NC30
and NC308 don't output the sizes of enumerator types in debugging information and debuggers
consider the size as same size of 'int'.
Therefore you may not correctly refer the values of enumeration types in the target programs which
were compiled with the above option. This function is for resolving the above issue. See the users'
manual of each compiler for details of the above option
The debugger for 740 doesn't support this function.
Check the above check box if you would like to treat all sizes of enumeration types as 1 byte. It is
necessary to load the debugging information again in order to reflect this setting.
38
Page 53
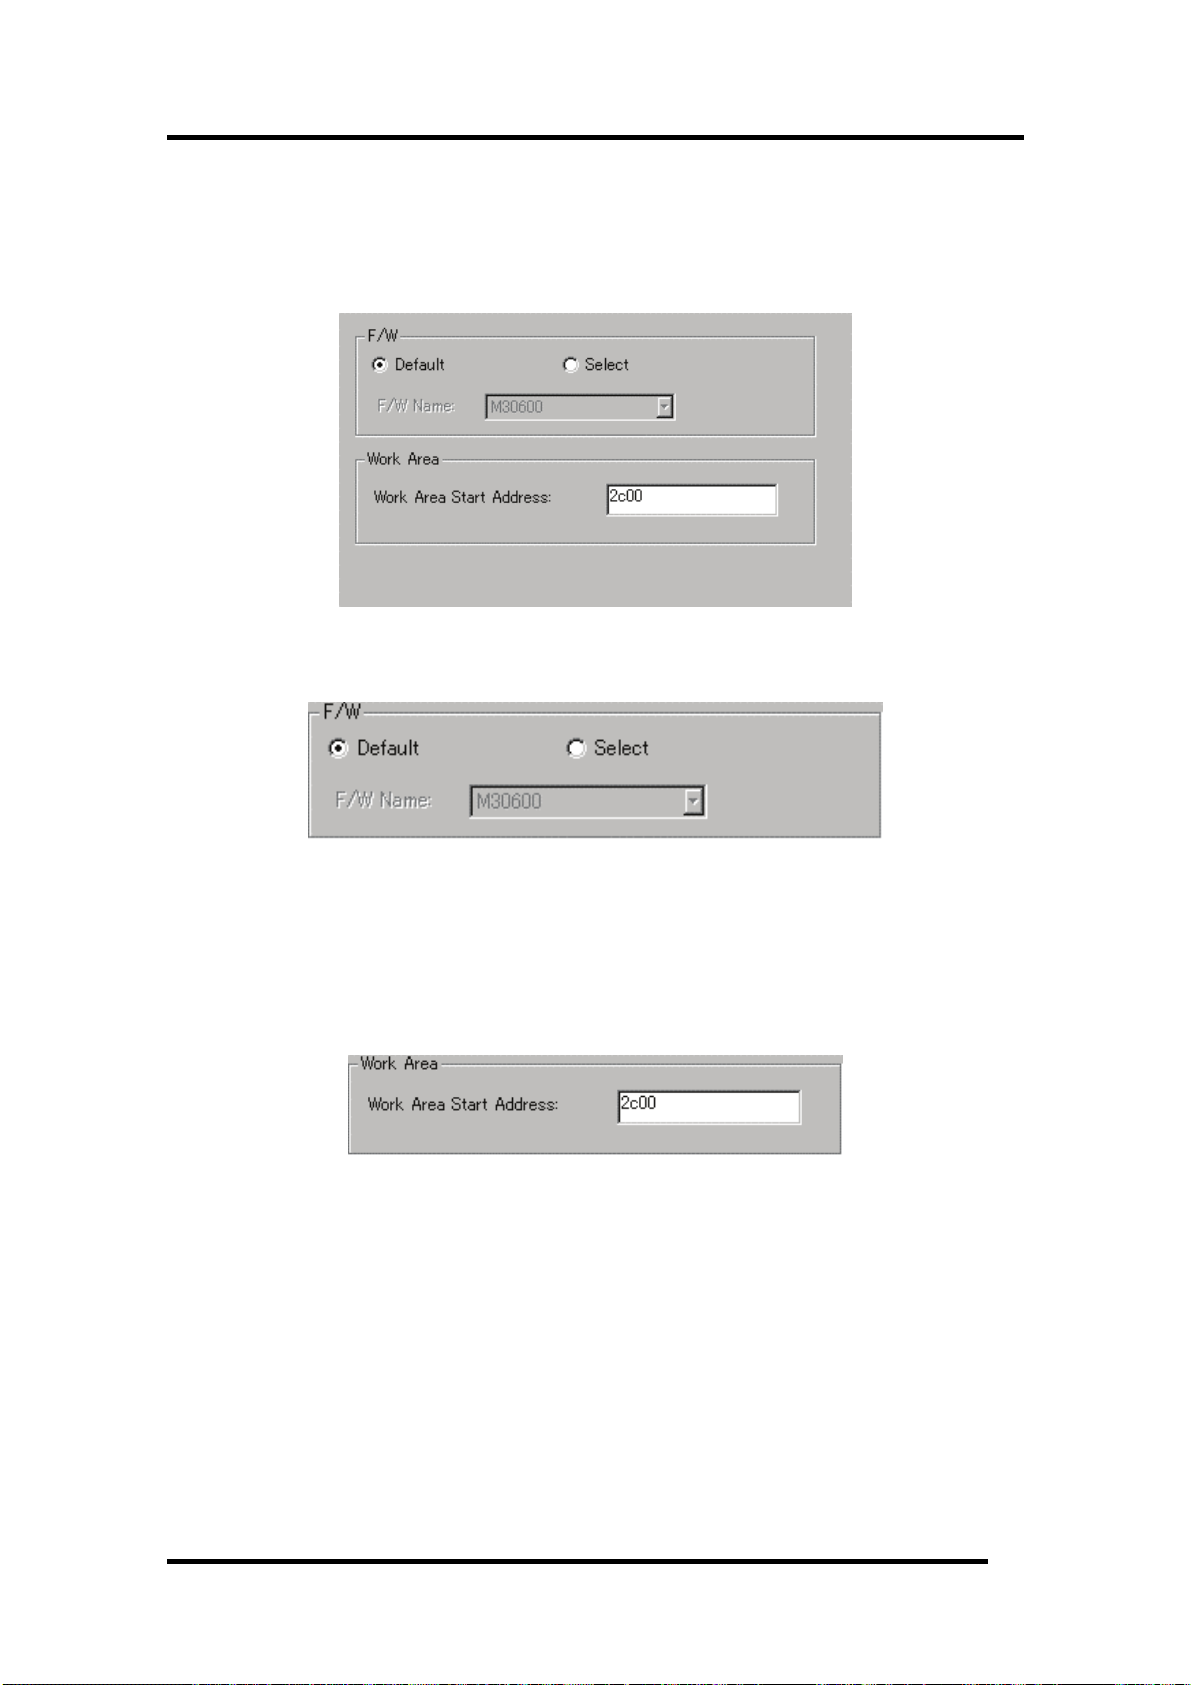
5 Setup the Debugger
5.1.3 F/W and Work Area Tab
The specified content becomes effective when the next being start. In this tab, only the debugger for
M16C/R8C exists.
5.1.3.1 Select the Firmware File
Usually, click the Default radio button in the F/W group.
Click the Select radio button when you have to download firmware different from the one described in
the MCU file.
The F/W Name list box is enabled only when you click the Select radio button.
5.1.3.2 Specify the Work Area
In the Work Area Start Address field in the Work Area group, specify the top address of the area to be
used as the work area.
The emulator uses the MCU internal reservation area (unused area) as the debugging work area
(about 10 bytes).
Specify the work area so that it is accommodated in its MCU internal reservation area.
The default work area top address is 2C00h.
To debug a microcomputer (ex. 20K-byte RAM version if the M16C/62 group) whose work area is
within the internal RAM area, you must change the work area.
39
Page 54

5.1.4 Memory Extension Mode Tab
This tab enabled only when the MCU tab in the Init dialog is used to specify the MCU file of the
microcomputer (M16C/62 group) which supports the memory space expansion function.
The specified data remains effective for the next start. In this tab, only the debugger for M16C/R8C
exists.
5.1.4.1 Select the Memory Space Extension Mode
Select the memory space extension mode.
• When you use a normal mode, Please click the "Normal" radio button.
• When you use extension mode 1, Please click the "Mode1" radio button.
• When you use extension mode 2, Please click the "Mode2" radio button.
The data of the eighth line of the selected MCU (data which specifies whether or not memory
extension mode is required) is used to determine whether or not memory extension mode has to be
selected.
If the eighth line contains a '1', The memory extension mode selection area is active. If the line
contains a '0' or nothing, the memory extension mode selection area is inactive.
40
Page 55

5 Setup the Debugger
ATTENTION
The functions may be restricted depending on the type of memory space expansion mode.
Extension Mode 1
• When the memory space expansion area is displayed in the dis-assemble mode in the Program
window or the Source window, the displayed data may be different from what you would expect
through the operation accompanying redrawing of the window, such as up/down scroll, during
execution of the target program.
• The following emulator functions are implemented by analyzing the bus information (address bus,
data bus).
- RAM monitor function (RAM Monitor window, C Watch window)
- Coverage measurement function (Coverage window, Coverage command)
- Memory protect function (Protect window, Protect command)
MCU accesses the program bank if Fetch (command) is specified for the bank duplicated area,
and the data bank if Read/Write is specified for the bank duplicated area. In above cases, a signal
which can distinguish which bank accesses the bus information is not output. Therefore, the
above function may not work as expected.
• The memory reference commands are added, which reference the internal ROM in the bank
duplicated area in the dump format (see the table below).
You cannot use the DA command during execution of the target program.
Command name Abbreviation
DumpByte2 DB2
DumpWord2 DW2
DumpLword2 DL2
• If you use the Memory Reference/Change command for the bank duplicated area before MCU is
switched from the normal mode to the memory space expansion mode1 by the target program, the
function may not work as expected.
• The memory map shows the following data after the debugger gets started.
Start Address End Address Map Attention
00000 003FF External Cannot be changed (SFR area).
00400 03FFF Internal The internal RAM area cannot be changed.
04000 2FFFF External Cannot be changed.
30000 FFFFF Internal
41
Page 56

Extension Mode 2
• The memory reference commands are added, which reference the internal ROM in the bank
duplicated area in the dump format (see the table below).
A memory reference command with the bank specification is added. The memory reference/the
change to the bank repetition area must use the following commands.
Command name Abbreviation
DumpByte2 DB2
DumpWord2 DW2
DumpLword2 DL2
SetMemoryByte2 MB2
SetMemoryWord2 MW2
SetMemoryLword2 ML2
FillByte2 FB2
FillWord2 FW2
FillLword2 FL2
Move2 MoveWord2 MoveW2
• The following emulator functions are implemented by analyzing the bus information (address bus,
data bus).
- RAM monitor function (RAM Monitor window, C Watch window)
- Coverage measurement function (Coverage window, Coverage command)
- Memory protect function (Protect window, Protect command)
- Hardware event (H/W break event*, Real-time trace event*, Time measurement event)
MCU switches the bank to be accessed based on the value in the bank selection register. A signal
which can distinguish which bank accesses the bus information is not output. Therefore, the
above function may work as expected.
*By specifying Simultaneous And (AND logic) (same time) for the hardware event and the bank
selection register, both of which are detected as the combined condition in the State Transient
Break/Trace window, the hardware event for the bank duplicated area can be detected.
• If you use the Memory Reference/Change command for the bank duplicated area before MCU is
switched from the normal mode to the memory space expansion mode 2 by the target program,
the function may not work as expected.
• The memory map shows the following data after the debugger gets started.
Start Address End Address Map Attention
00000 003FF External Cannot be changed (SFR area).
00400 3FFFF Internal The internal RAM area cannot be changed.
40000 BFFFF External Cannot be changed.
C0000 FFFFF Internal
42
Page 57

5.1.5 Clock Tab
The specified content becomes effective when the next being start.
5.1.5.1 Specify the Target Clock
5 Setup the Debugger
Change the setting by synchronizing with the clock used by the target microcomputer. (Internal is set
by default.)
(The debugger for 740 does not have designation of Sub clock.)
Select Internal to set the internal clock, and External to set the external clock.
5.1.5.2 Attempt to access memory during WAIT/STOP mode
The debugger for 740 does not have this setting.
Set this check on, when the mcu needs to access memory during WAIT/STOP mode.
When this check is ON, debugger will attempt to access memory by waiting for about 5 seconds until
the mcu returns from WAIT/STOP mode. If the mcu remains WAIT/STOP mode during this period,
the operation will receive an error. When this check is OFF, debugger will receive an error without
accessing to real memory.
43
Page 58
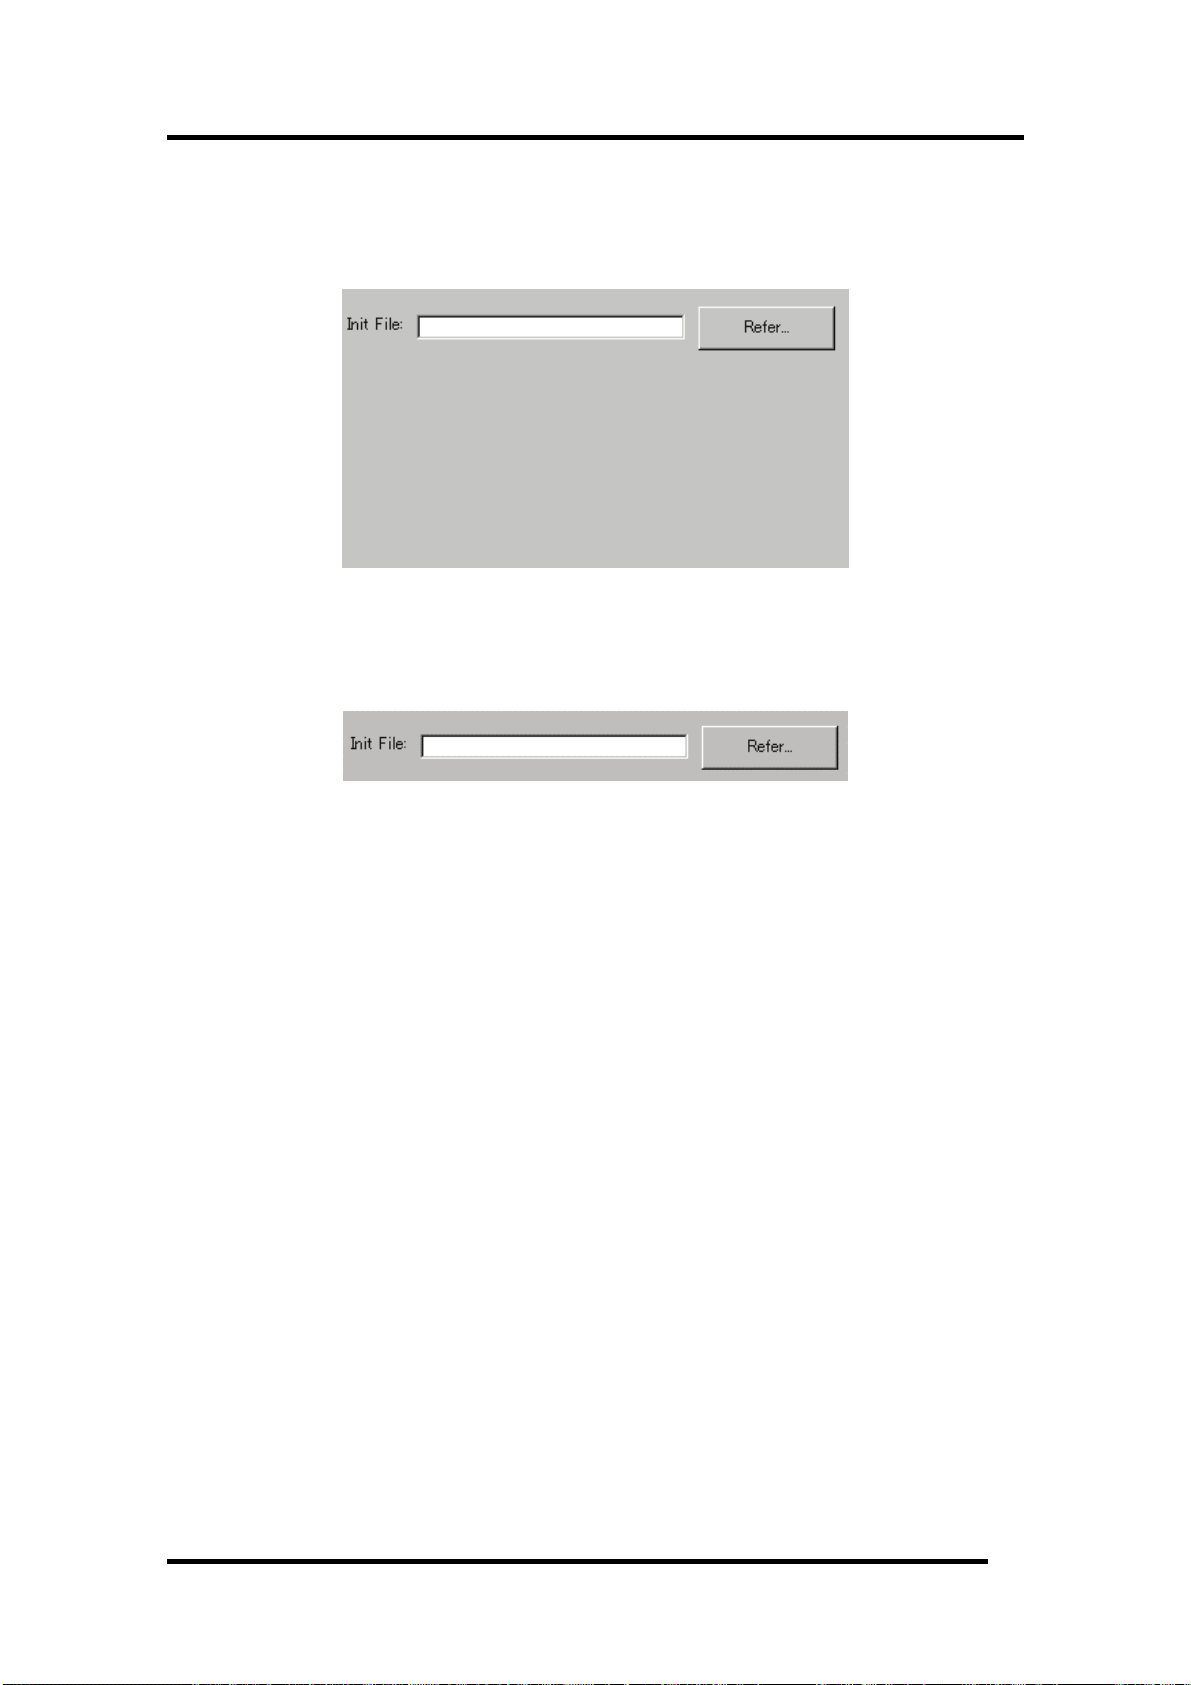
5.1.6 Script Tab
The specified content becomes effective when the next being start.
5.1.6.1 Automatically Execute the Script Commands
To automatically execute the script command at start of Debugger, click the "Refer" button to specify
the script file to be executed.
By clicking the "Refer" button, the File Selection dialog is opened.
The specified script file is displayed in the "Init File:" field.
To disable auto-execution of the script command, erase a character string displayed in the "Init File:"
field.
44
Page 59

5 Setup the Debugger
5.2 Setting of the Communication Interface
5.2.1 Setting of the USB Interface
USB communication uses the personal computer's USB interface. It is compliant with USB 1.1.
USB communication can only be used on the PC4701U emulator.
Before USB communication can be performed, the computer must have a dedicated device driver
installed in it. For details on how to install USB device drivers, see "
driver
."
For connection by USB communication, click the "USB" radio button on the MCU tab.
The currently USB-connected emulators are listed in the Serial No. area. Select the serial No. of the
emulator you want to connect.
3.3.1.1Install of USB device
45
Page 60
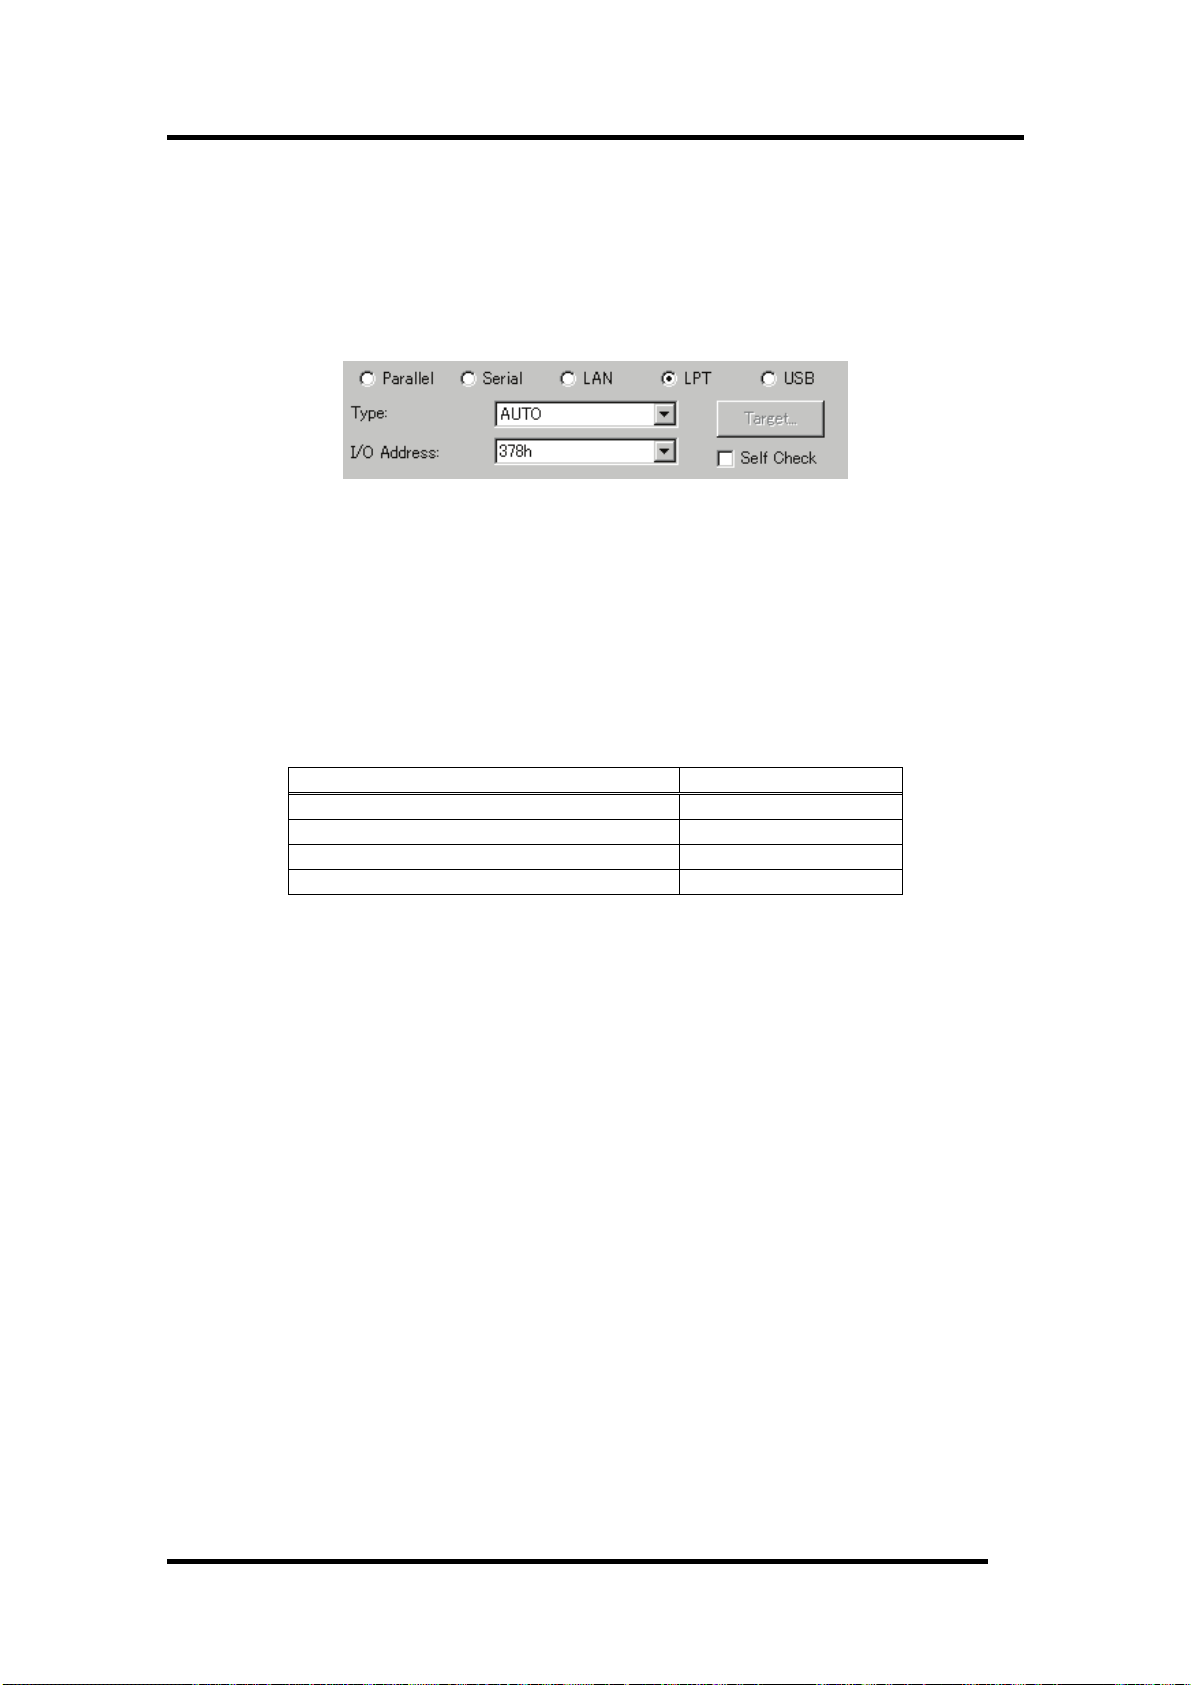
5.2.2 Setting of the LPT Interface
LPT communication uses a parallel interface (printer interface) of the personal computer.
LPT communication can only be used on the PC4701U/M emulator.
To set the LPT communication, click the "LPT" radio button of the MCU tab in the Init dialog. The
setting looks like the figure below.
Specify the mode for data transfers in the Type field.
• The LPT interface has four modes for data transfers, Nibble, Byte, ECP, and EPP. Their modes
are documented in the IEEE-1284 standard. The mode possible to use depends on the PC with
the debugger.
• When selecting AUTO, the debugger detect the LPT interface at the start and select a mode
possible to use which give better performance automatically. In some PC, the debugger cannot
detect the most suitable mode. Check the mode which the LPT interface in the PC have and
select it from Nibble, Byte, ECP or EPP, if cannot.
• Start the BIOS setup program of the PC for checking the mode possible to use. How to start and
use the BIOS setup program depends on each PC, so refer the manuals of the PC.
Display of BIOS Setup
SPP, Standard Parallel Port, Output Only Nibb le
Bidirectional, Bi-directional Byte
ECP, Extended Capabilities P rt o ECP
EPP, Enhanced Parallel Port EPP
The address displayed in the parallel port base address field is the I/O address.
Specify the I/O address set in the BIOS setup program, in the I/O Address field. (The following
addresses are possible to be specified)
• 378h
• 278h
Comm nication Mode u
46
Page 61
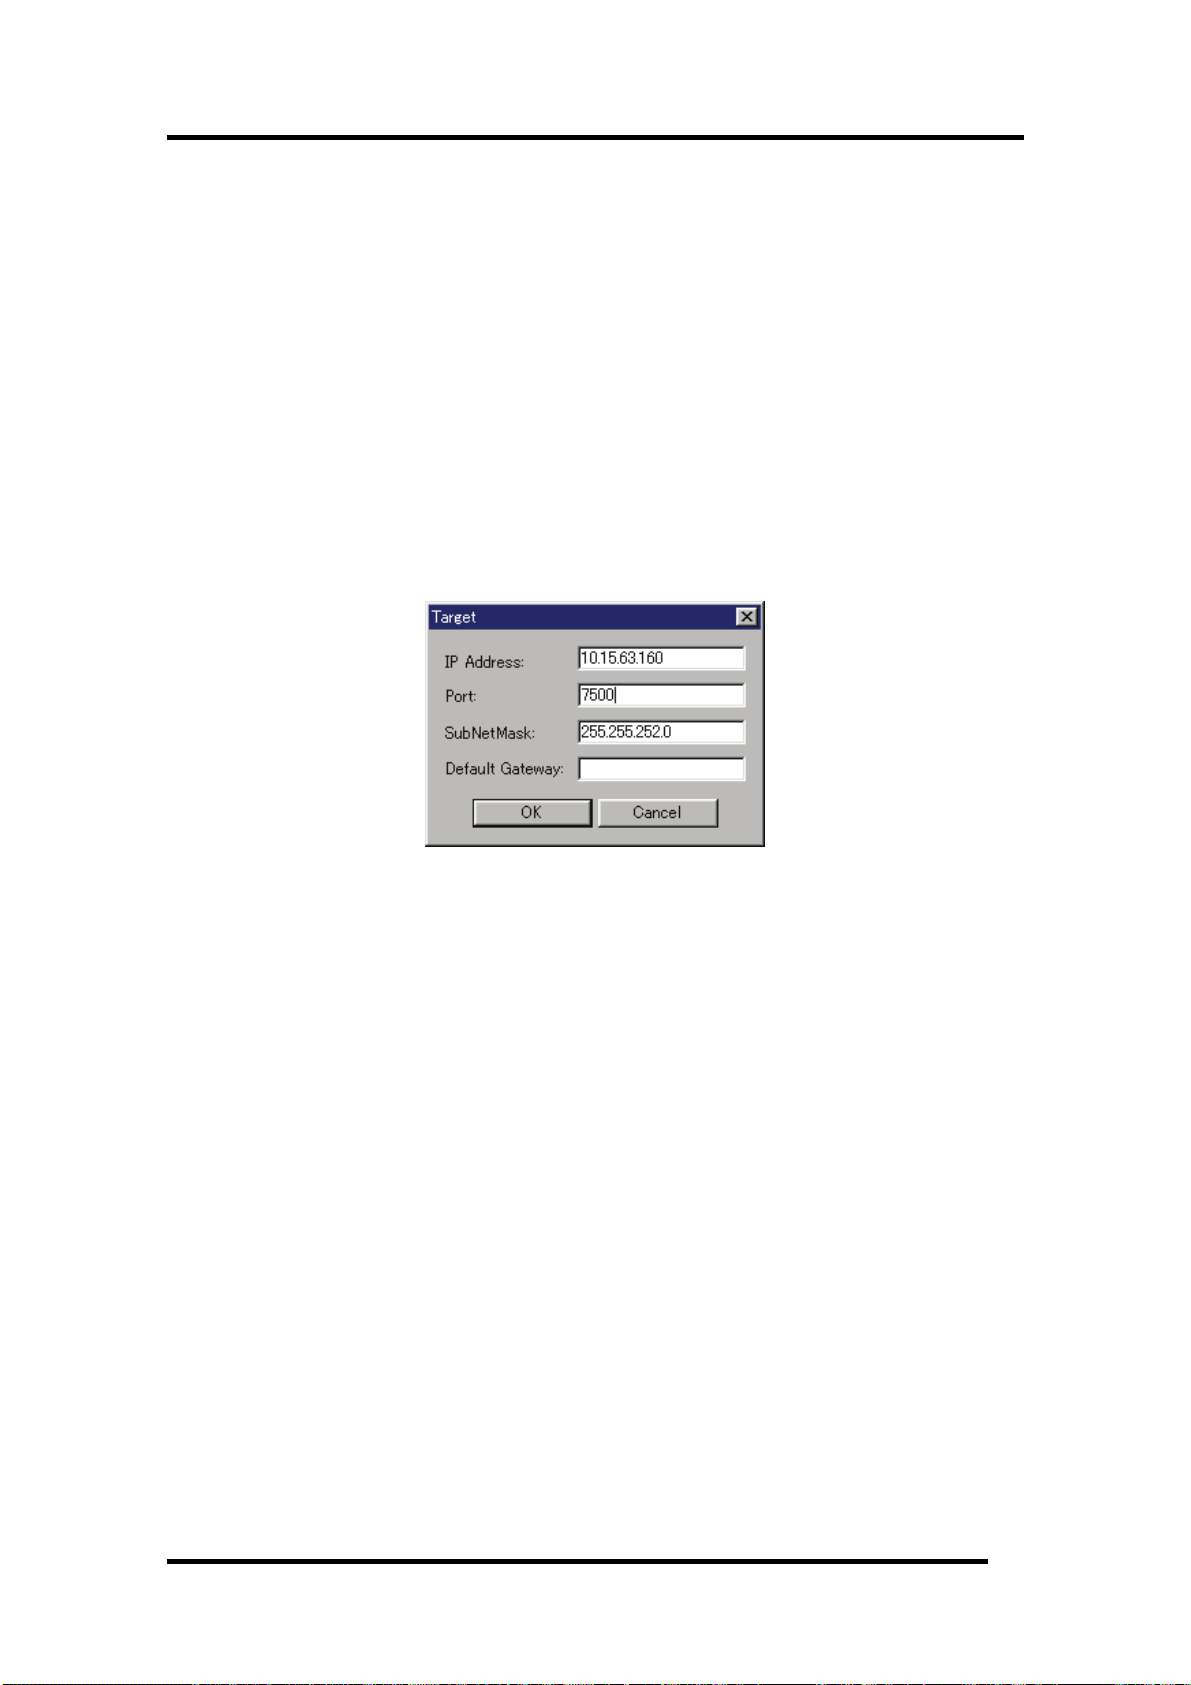
5 Setup the Debugger
5.2.3 Setting of the LAN Interface
LAN communication uses a LAN interface of the personal computer.
Before using LAN, you must register the emulator IP address, port number and subnet mask to the
emulator itself (Otherwise, LAN is not available).
Then, set LAN communication.
LAN communication can only be used on the PC4701U/HS emulator.
It is necessary for LAN communication with emulators to set the registry. For details, see "
before emulator starts
5.2.3.1 Setting the IP Address and Subnet Mask
Start the debugger using other communication method. After it gets started, select Menu [Setup]->[Emulator]->[ System...] to open the Init dialog. Then, click the Target button of MCU tab.
The Target dialog will be opened.
".
3.3 Setting
Specify the emulator IP address in the IP Address field, port number in the Port field, and subnet
mask in the SubNetMask field. (The emulator IP address must be registered in the network
environment in advance.)
When the PC7501 or PC4701U is used, the Default Gateway area becomes effective. Please specify
the IP address of the default gateway. When the PC7501 or PC4701U is used on the identical sub net
mask of identical network, it is possible to omit the IP address of the default gateway.
• Specify the IP address, subnet mask and Default Gateway in decimal byte by byte, by separating
every 4 bytes with a period. For details on the IP address and subnet mask, consult with your
network manager.
• A port number set in the Port field is used to identify the communication process of the server
(emulator) in LAN (TCP/IP) communications. Specify the port number which has been set in the
emulator in hexadecimal. (Do not add a prefix which shows a base.)
Click the "OK" button in the Target dialog. The Target dialog is then closed and the Init dialog
appears again. Click the "OK" button.
Then, exit from the debugger.
47
Page 62

5.2.3.2 Setting of the LAN Interface
To set the LAN communication, click the "LAN" radio button of the MCU tab in the Init dialog. The
setting looks like the figure below.
Specify the IP address of the connected emulator in the IP address field.
Specify the IP address, in bytes, in decimal. Delimit each 4 bytes with a period. The port No. is the ID
No. for the communication process of the server (emulator) on the LAN (TCP/IP).
Specify, in hexadecimal (Don't describe prefix which shows a cardinal number), the port No. set on the
emulator.
5.2.3.3 LAN connection by couple 1 with emulator
Emulators can be connected by LAN (TCP/IP) to a commercially available LAN card inserted in a PC
by using a cross conversion cable for 10BASE-T (also commercially available). A HUB is not necessary
in this case.
The cross conversion cable for 10BASE-T converts the male connector of the 10BASE-T of a straight
LAN cable that is included with the emulators to that of a cross LAN cable.
Connect a cross conversion cable to the male connector of the 10BASE-T of the straight LAN cable
connected to the emulator; then, connect the male connector of the cross conversion cable to the LAN
card.
The LAN communications can be set up the same way as normal one.
48
Page 63

5 Setup the Debugger
5.2.4 Setting of the Parallel Interface
Special parallel communication uses a special parallel interface board PCA4202G02 (option), which is
inserted in the extension slot (ISA bus) of the personal computer.
Special parallel communication can only be used on the PC4701HS emulator.
To set the parallel communication, click the "Parallel" radio button of the MCU tab in the Init dialog.
The setting looks like the figure below.
Specify the I/O address in the I/O Address field. which is the I/O address set on the parallel interface
board, in hexadecimal (Don't describe prefix which shows a cardinal number ).
• Please specify the value of the hexadecimal number for the I/O address. (Don't describe prefix
which shows a cardinal number)
• For detail about parallel board PCA4202G02, refer to "PCA4202G02 Instruction Manual".
ATTENTION
Combination of Windows and Parallel Interface
It is necessary to set the I/O address used for the device driver for a parallel communication.
Please refer to "Setting before emulator starts"
3.3 Setting before emulator starts"
5.2.5 Setting of the Serial Interface
Serial communication uses a serial interface (RS-232C) of the personal computer.
This communication method is available for all the PC4701 emulator series.
Serial communication can only be used on the PC4701M/HS emulator.
To set the Serial communication, click the "Serial" radio button of the MCU tab in the Init dialog. The
setting looks like the figure below.
Specify the communications port in the Port field and the baud rate in the Baud Rate field.
49
Page 64

5.3 Setup the Debugger for M32C
5.3.1 Emem Dialog
In the Emem dialog box, setting information on the user target. The Emem dialog box opens after
closing the Init dialog box.
The tabs available on this dialog box vary with each product used. For details, click the desired tab
name shown in the table below.
Tab Name
Status Specify the processor mode.
Emulation Memory Specify the emulation memory area.
To keep the Emem dialog box closed next time the debugger is started, check "Next Hide" at the
bottom of the Emem dialog box. You can open the Emem dialog using either one of the following
methods:
• After the debugger gets started, select Menu - [Setup] -> [Emulator] -> [Target...].
5.3.1.1 Status Tab
The specified content becomes effective when the next being start.
Contents
50
Page 65

5 Setup the Debugger
5.3.1.1.1. Select the Processor Mode
Specify the processor mode for the target system.
Either the following can be specified.
• Single-chip Mode
Single-chip Mode
• Memory Expansion
Memory Expansion Mode
• Microprocessor
Microprocessor Mode
5.3.1.1.2. Inspecting the MCU status
Clicking this tab displays the status of each MCU pin. It allows to check whether the MCU pin status
matches the processor mode to be set.
If the slider is at the middle position, it means that the value is indeterminate.
5.3.1.2 Emulation Memory Tab
The specified content becomes effective when the next being start.
51
Page 66

5.3.1.2.1. Debug monitor's bank address settings
This product allocates a 64-Kbyte contiguous address area as the emulator's work area for use by the
debug monitor.
Specify any bank that the target system does not use. The debug monitor uses a 64-Kbyte area from
the start address of the specified bank.
(Example: If the specified bank is "F0," then the debug monitor uses a 64-Kbyte area beginning with
address F000000h.)
• The bank specified here cannot have its contents referenced or set.
The contents of this area when displayed in the Memory window or the Program/Source window's
disassemble display mode may not be correct.
• The following bank addresses cannot be specified:
- MCU internal resources (e.g., SFR and RAM areas)
- DRAM area and multiplexed area
- Interrupt vector area
5.3.1.2.2. Automatic emulation memory allocation for the internal ROM
When single-chip or memory extension mode is selected, emulation memory is automatically allocated
to the internal ROM area.
The automatically allocated internal ROM address range is displayed in this field.
5.3.1.2.3. Emulation memory allocation for an extended area
When memory extension or microprocessor mode is selected, emulation memory can be allocated to
the extended area to be debugged (in up to four areas).
Here, allocate memory for the debug target area and specify its mapping information.
52
Page 67

5 Setup the Debugger
Follow the procedure described below.
Bank
(Set bank address)
Length
(Specify size of area)
Map
(Specify area map)
• Areas for which "No Use" is selected for Map and those not specified here are mapped into
external areas.
If compared to the case where areas are explicitly specified to be "External," the only difference is
a download speed. (Downloading into these areas is slower than downloading into the areas
specified to be "External.")
• The internal ROM area is automatically mapped into the emulation memory. Therefore, there is
no need to set here.
• Be careful that the debug areas will not overlap.
• Make sure the total size of the specified debug target areas does not exceed the emulation
memory size of the emulation pod used.
The size of emulation memory that can be allocated varies with each emulation pod. (Consult the
user's manual of your emulation pod.)
The setting of the emulation memory area varies depending on the specified processor mode.
• Single-chip Mode
You do not need to specify the area to be assigned as the emulation memory.
The internal ROM area is automatically mapped into the emulation memory. The address range
of the automatically mapped area is displayed in the Internal ROM Area: field.
• Memory Expansion Mode(8bit and 16bit)
If you have an area to be assigned as the emulation memory in addition to internal ROM area,
specify it specify it separately.
The internal ROM area is automatically mapped into the emulation memory. The address range
of the automatically mapped area is displayed in the Internal ROM Area: field.
• Microprocessor Mode(8bit and 16bit)
Specify the area to be assigned separately. (There is no area which is automatically assigned.)
Specify the bank address of the debug target area to be allocated in
hexadecimal.
If specified as C0, C00000h is the start address of the debug target area.
Specify the size of the debug target area (256 bytes or 1 Mbytes).
If Length is specified to be "256 bytes," banks 00, 04, 08, and up to FC
(every four banks) are specified for Bank; if Length is specified to be "1
Mbytes," banks 00, 10, 20, and up to F0 (every 16 banks) are specified for
Bank.
Specify the mapping information ("Internal" or "External") for the
specified area.
If no area is specified, select "No Use."
Internal The area specified to be "Internal" is mapped into the internal
area (emulation memory).
External The area specified to be "External" is mapped into the external
area (external resources in the target system).
ATTENTION
• The mapping setting data specified using the Map command is not reflected to the Emem dialog
box.
• et the emulation memory areas in the order of usage priority.
The emulation memory areas to be set by the Map command are numbered, ignoring the unused
(Not Use) areas.
Accordingly, the emulation memory areas set in the Emem dialog box and the emulation memory
area numbers set by the Map command will be mismatched.
53
Page 68

5.4 Setup the Debugger for M16C/R8C
5.4.1 Map Command
The memory map information must be altered to suit the target microcomputer's memory space by
Map command.
Area
Mapping Note
SFR External
Internal RAM Internal
Internal ROM Internal
External ROM External Memory Expansion Mode, Microprocessor Mode
Note
• The emulator temporarily uses the area from FFCh to FFFFh as a stack. Set this area as
Internal. If you want to set this area to External be sure to prepare read-/write-unprotected
memory for the area.
• When using the memory space expansion function on the M16C/62 Series microcomputer, set the
areas whose addresses are duplicated to External. (The duplicated area depends on memory.)
- Memory space expansion mode 1: 4000h to 2FFFFh
- Memory space expansion mode 2: 40000h to BFFFFh
54
Page 69

5 Setup the Debugger
5.5 Setup the Debugger for 740
5.5.1 Map Command
The memory map information must be altered to suit the target microcomputer's memory space by
Map command.
Area
Mapping Note
SFR External
RAM External
Internal ROM Internal
External ROM External Memory Expansion Mode, Microprocessor Mode
• Internal
Enables the emulator's internal resources. The internal ROM area must be set for Internal
because it is always emulated with the emulator's internal resources. If an external area is not
allocated memory, you can use the emulator's internal memory by setting that area for Internal.
• External
Enables resources external to the emulator (including the internal SFR and RAM areas). The
internal SFR and internal RAM areas must always be set for External. To enable the memory
allocated for an external area, set that area for External.
The memory map attributes immediately after the emulator has started up are External for
0h-3FFFh and Internal for 4000h-FFFFh. Use the MAP command to look up or alter the memory map
information. Execute the MAP command from the script window.
ATTENTION
• [the case that the internal ROM area is located to the address before 4000h]
If the internal ROM area of the target mcu is located to the address before 4000h, please change
the mapping of this area to INTERNAL.
Example)
when the internal ROM area is located from 1080h:
1080 to 3FFF -> Internal
• [About special settings when using the M38000TL2-FPD]
Always set the internal SFR and internal RAM areas for External. However, if the target MCU's
RAM area is larger than the RAM included in the emulator MCU, set that area for Internal.
Example)
When the RAM area included in the emulator MCU is 40-1FF and the target MCU's internal
RAM area is 40-2FF
40 to 1FF -> External
200 to 2FF -> Internal
55
Page 70

5.6 Method of making MCU file
5.6.1 Method of making MCU file (the M16C/R8C Debugger)
The following content is sequentially described in the MCU file.
Specify the MCU name to the file name, and specify "mcu" to the file extension.
1. Start address of SFR area
2. End address of SFR area
3. Start address of internal RAM area
4. End address of internal RAM area
5. Start address of ROM area
6. End address of ROM area
7. File name of the Firmware *1
8. MCU type (whether memory space extension mode has to be specified or not)*2
Specify the addresses in hex format, and don't add any prefix which describe its radix.
*1 Specify the addresses in hex format, and don't add any prefix which describe its radix.
MCU Firmware file name
M16C/60 group M30600
M16C/61 group M30600
M16C/62 group M30620B
M16C/20 series M30620B
There is a case that the emulation pod need the different firmware from the listed firmware, when the
emulation pod is re-modeled.
*2 Specify whether the MCU: supports the memory space extension function or not.
When the MCU supports the function (EX: M16C/62 group), specify "1" , the other case, specify "0".
Only when "1" is specified, the setting for memory space extension mode is available in Memory
Extension Mode tab of INIT Dialog
ATTENTION
• The areas specified as the ROM in the MCU file are write-protected from the program.
Even if the write command is executed to the area, no value is written.
However, you can use the Dump command to write values to memory.
(This is enabled only when the Internal area is mapped by the MAP command.)
• If the RAM is assigned to the same area, you must change the setting of the MCU file.
5.6.1.1 Example
0
3FF
400
2BFF
F0000
FFFFF
M30600
0
56
Page 71

5 Setup the Debugger
5.6.2 Method of making MCU file (the 740 Debugger)
The following content is sequentially described in the MCU file.
Please describe information on 1-4 referring to the data book on MCU used.
1. Number of stack page selection bit
2. Address of CPU mode register
3. End address of stack*1
4. Address of reset vector
5. POD number*2
6. Firmware name
7. MCU Information No.*3
*1
End address of stack
Specify the last address of the area to be used as the stack. Consider the initial value of the stack
page selection bit in the CPU mode register. (The initial value of the stack page selection bit depends
on the microcomputer.) For a microcomputer which sets the stack page selection bit initial value to
"0", the allowable designation range is a 0 page address range (0h to FFh). For a microcomputer
which sets the stack page selection bit initial value to "1", the allowable designation range is a 1 page
address range (100h to 1FFh).
*2
POD number
Pod Name POD No. Firmwa File re Correspondence MCU
M38000T-FPD
M38000TL-FPD
M38000TL2-FPD
M37207T-RPD 80 M38000 M37102,M37201,M372 2,M37204,M37207 0
M37515T-RPD 4 0 M38000 7515/3850/3 51 Group 8
M37610T-RPD 2 M37600 7610 Group
M37640T-RPD 4 M37600 7640 Group
M37690T-RPD 1 M37600 7690 Group
M38749T-RPD 40 M38000 3874Group
*4
MCU where emulator MCU does not exist is excluded.
Target firmware name
Omit "u.s", "h.s", or "l.s", which mean types of emulators.
*3
MCU Information No.
Please describe the MCU information No. referring to the following tables.
0 M38000 7200/7450/7470/38000/
7500Series(7507,7510,7515,7520 Group)
MCU Name
M U Information No. C
M3753x 3754x ,M 01
M376xx 02
Others 00
*4
57
Page 72

ATTENTION
For a new MCU, new POD number, new firmware name and new MCU information number may be
used.
5.6.2.1 Example
2
3B
FF
FFFC
0
M38000
00
58
Page 73

Tutorial
59
Page 74

(Blank Page)
60
Page 75

6 Tutorial
6. Tutorial
6.1 Introduction
This section describes the main functions of this debugger by using a tutorial program. The tutorial
programs are installed to the directory ¥WorkSpace¥Tutorial of the drive you installed
High-performance Embedded Workshop. There are workspaces for each targets and each MCUs.
Please select the corresponding one to your system, and open the workspace file (*.hws) from the
menu [Open Workspace...].
The tutorial program is based on the C program that sorts ten random data items in ascending or
descending order.
The tutorial program performs the following actions:
• The tutorial function generates random data to be sorted.
• The sort function sorts the generated random data in ascending order.
• The change function then sorts the data in descending order.
Note
After recompilation, the addresses may differ from those given in this section.
When using the assembler package for 740 family
The tutorial program for the assembler package for 740 family is prepared. If you use the assembler
package for 740 family, please use it.
• Please read this tutorial with replacing function names with subroutine name. (e.g. replace
"function sort()" with "subroutine sort")
• About the source file name, also please replace it with the corresponding one.
• The diagrams in this tutorial are for C program. The displayed diagram for the assembler
program may different from them.
• Step9 and Step12 are descriptions of C program.
61
Page 76

6.2 Usage
Please follow these instructions:
6.2.1 Step1 : Starting the Debugger
6.2.1.1 Preparation before Use
To run the High-performance Embedded Workshop and connect the emulator, refer to "4 Preparation
before Use
6.2.1.2 Setup the Debugger
If it connects with an emulator, the dialog box for setting up a debugger will be displayed. Please set
up the debugger in this dialog box.
To setup the debugger in this dialog box, refer to "
After the setup of a debugger, it will function as a debugger.
".
5 Setup the Debugger ".
62
Page 77
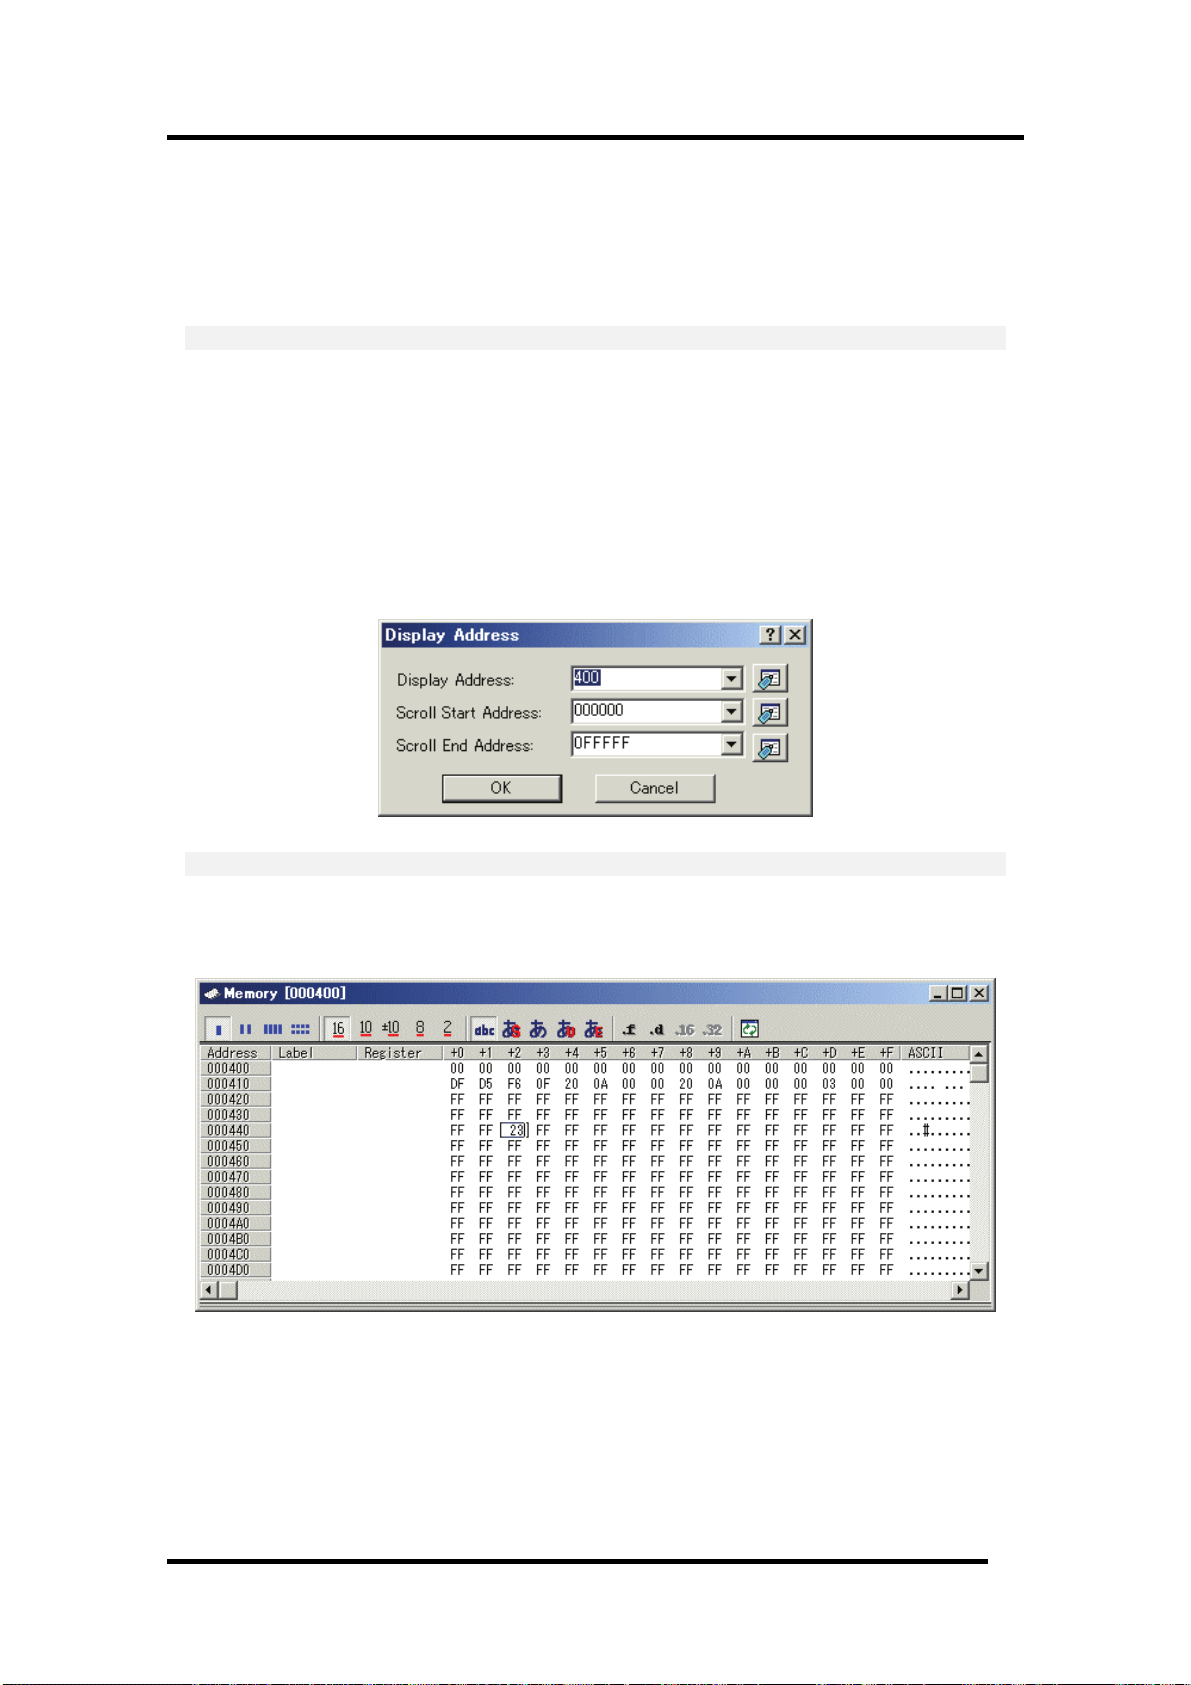
6 Tutorial
6.2.2 Step2 : Checking the Operation of RAM
Check that RAM is operating correctly. Display and edit the contents of the memory in the [Memory]
window to check that the memory is operating correctly.
Note
The memory can be installed on the board in some microcomputers. In this case, however, the above
way of checking the operation of memory may be inadequate. It is recommended that a program for
checking the memory be created.
6.2.2.1 Checking the Operation of RAM
Select [Memory] from the [CPU] submenu of the [View] menu and enter the RAM address (Here,
enter “400”) in the [Display Address] edit boxes. The [Scroll Start Address] and [Scroll End Address]
editing box is left to a default setting. (By default, the scroll range is set to 0h to the maximum
address of MCU.)
Note
The settings of the RAM area differ depending on the product. For details, refer to the hardware
manual.
Click the [OK] button. The [Memory] window is displayed and shows the specified memory area.
Placing the mouse cursor on a point in the display of data in the [Memory] window and
double-clicking allows the values at that point to be changed.
63
Page 78
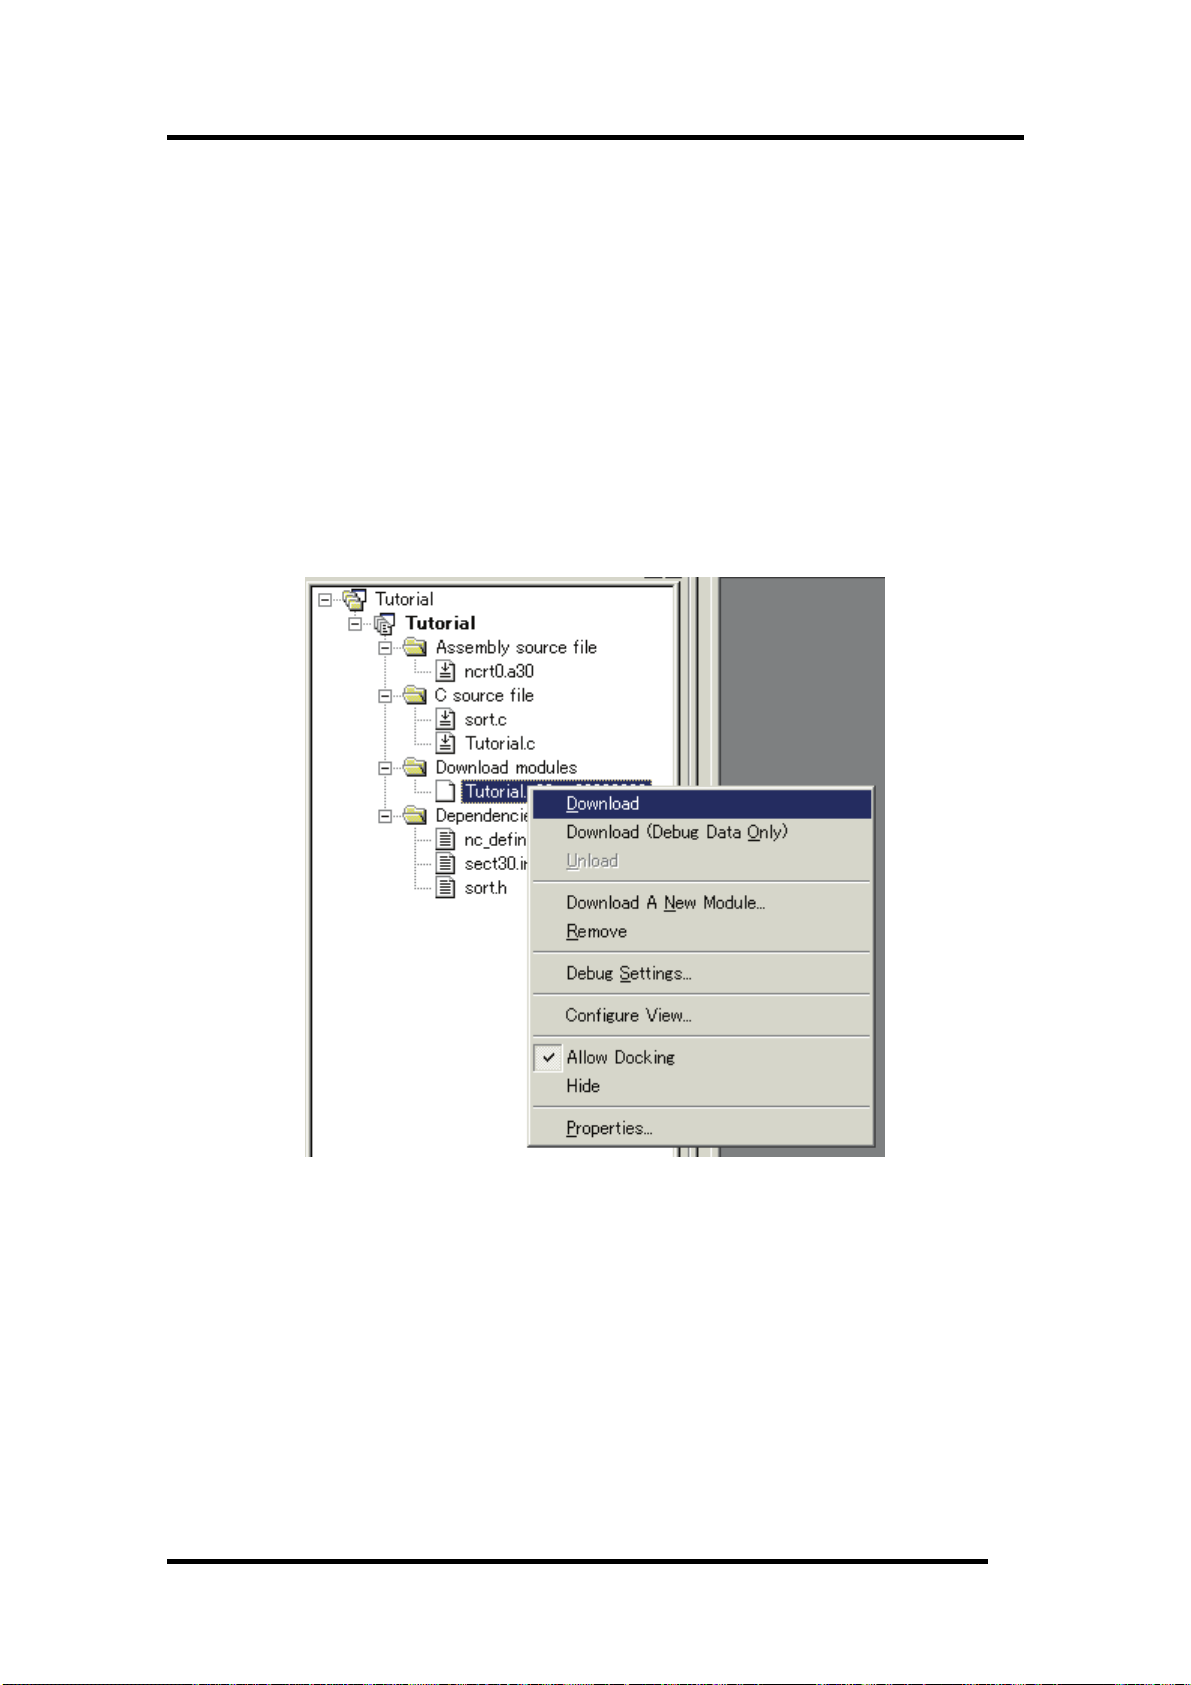
6.2.3 Step3 : Downloading the Tutorial Program
6.2.3.1 Downloading the Tutorial Program
Download the object program to be debugged. The download file and the address to be downloaded
will depends on the target mcu you uses. Please replace the screen image and addresses with
corresponding one to your target mcu.
• The Debugger for M16C/R8C or M32C
Select [Download module] from [Tutorial.x30] under [Download modules].
• The Debugger for 740
If you use the C Compiler Package for 740 Family, select [Download module] from [Tutorial.695]
under [Download modules].
If you use the Assembler Package for 740 Family, select [Download module] from [Tutorial.hex]
under [Download modules].
64
Page 79
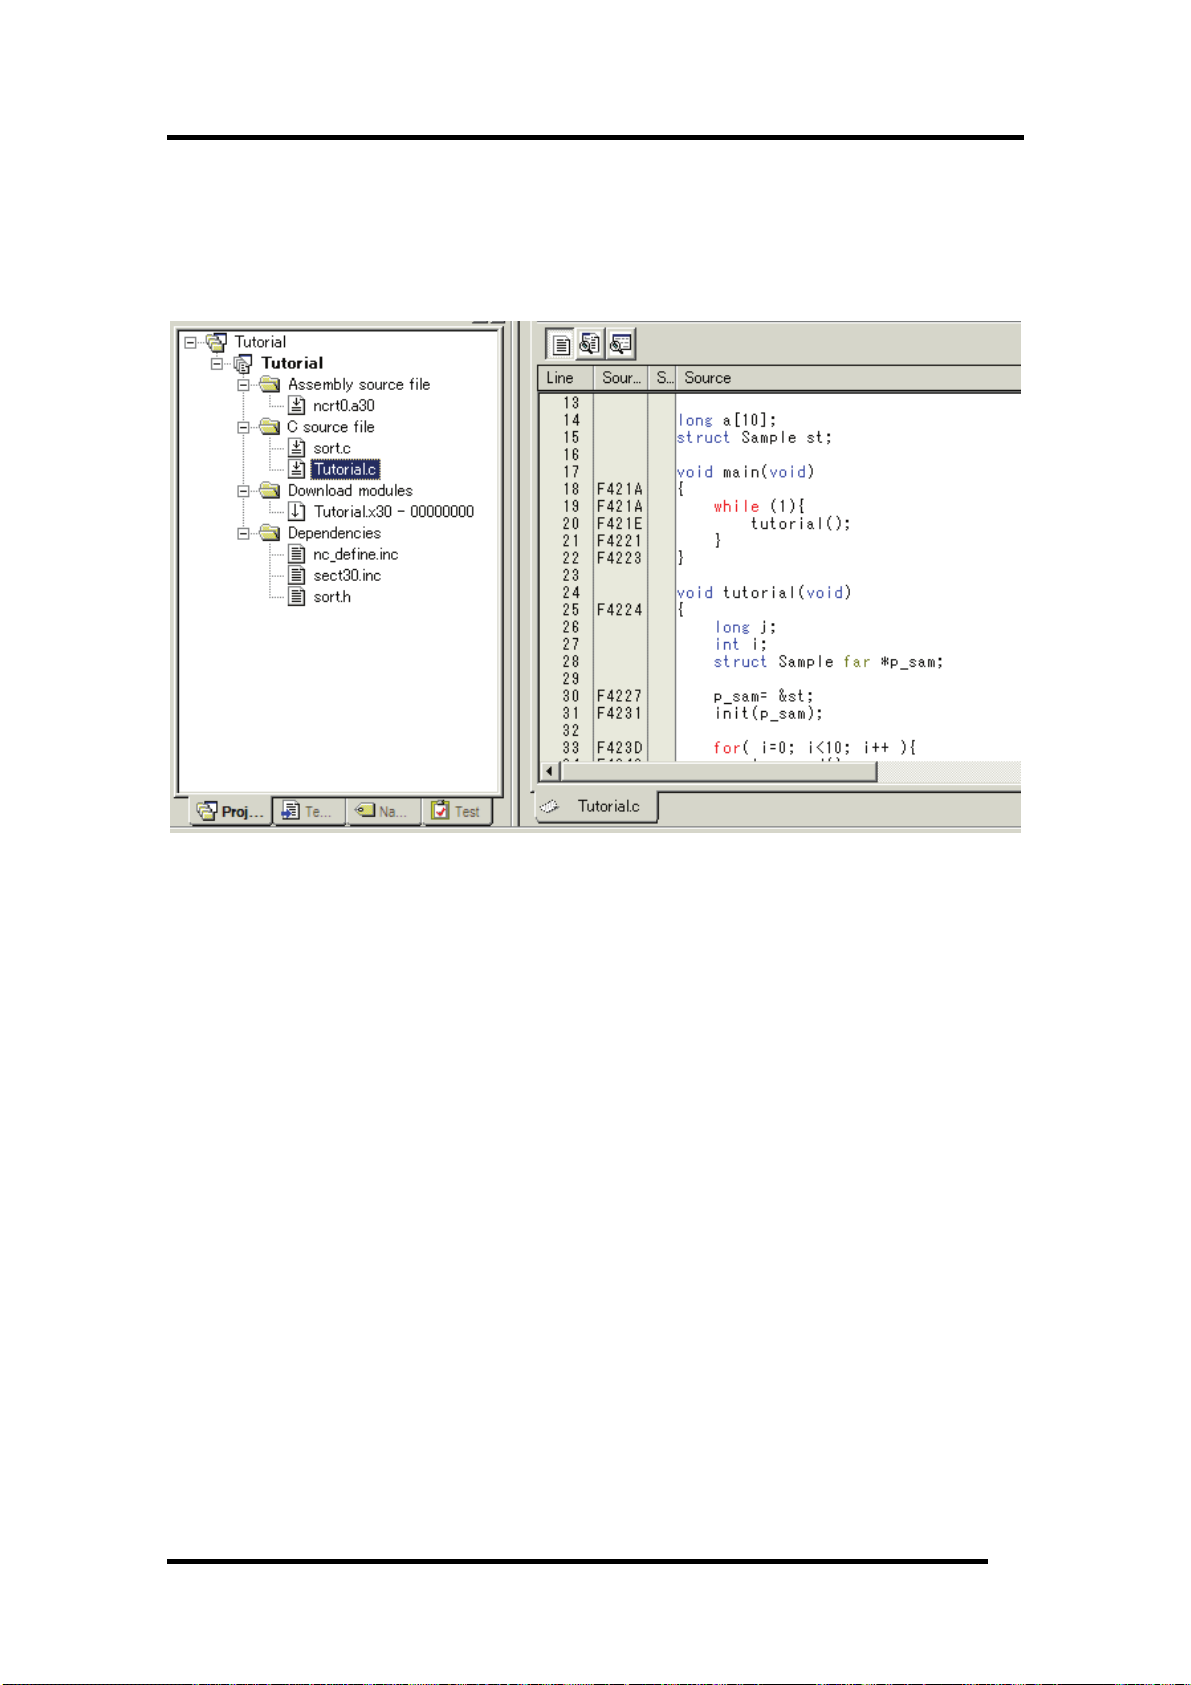
6 Tutorial
6.2.3.2 Displaying the Source Program
This debugger allows the user to debug a user program at the source level.
Double-click [tutorial.c] under [C source file]. A [Editor(Source)] window opens and the contents of a
"Tutorial.c" file are displayed.
Select the [Format Views...] option from the [Setup] menu to set a font and size that are legible, if
necessary.
Initially the [Editor(Source)] window shows the start of the user program, but the user can use the
scroll bar to scroll through the user program and look at the other statements.
65
Page 80

6.2.4 Step4 : Setting a Breakpoint
A software breakpoint is a basic debugging function.
The [Editor(Source)] window provides a very simple way of setting a software breakpoint at any point
in a program.
6.2.4.1 Setting a Software Breakpoint
For example, to set a software breakpoint at the sort function call:
Double-click the [S/W breakpoints] column on the line containing the sort function call.
The red symbol will appear on the line containing the sort function call. This shows that a
softwarebreak breakpoint has been set.
66
Page 81

6.2.5 Step5 : Executing the Program
Execute the program as described in the following:
6.2.5.1 Resetting of CPU
6 Tutorial
To reset the CPU, select [Reset CPU] from the [Debug] menu, or click the [Reset CPU] button
on the toolbar.
6.2.5.2 Executing the Program
To execute the program, select [Go] from the [Debug] menu, or click the [Go] button on the
toolbar.
The program will be executed up to the breakpoint that has been set, and an arrow will be displayed
in the [S/W Breakpoints] column to show the position that the program has halted.
Note
When the source file is displayed after a break, a path of the source file may be inquired. In this case,
please specify the location of a source file.
67
Page 82
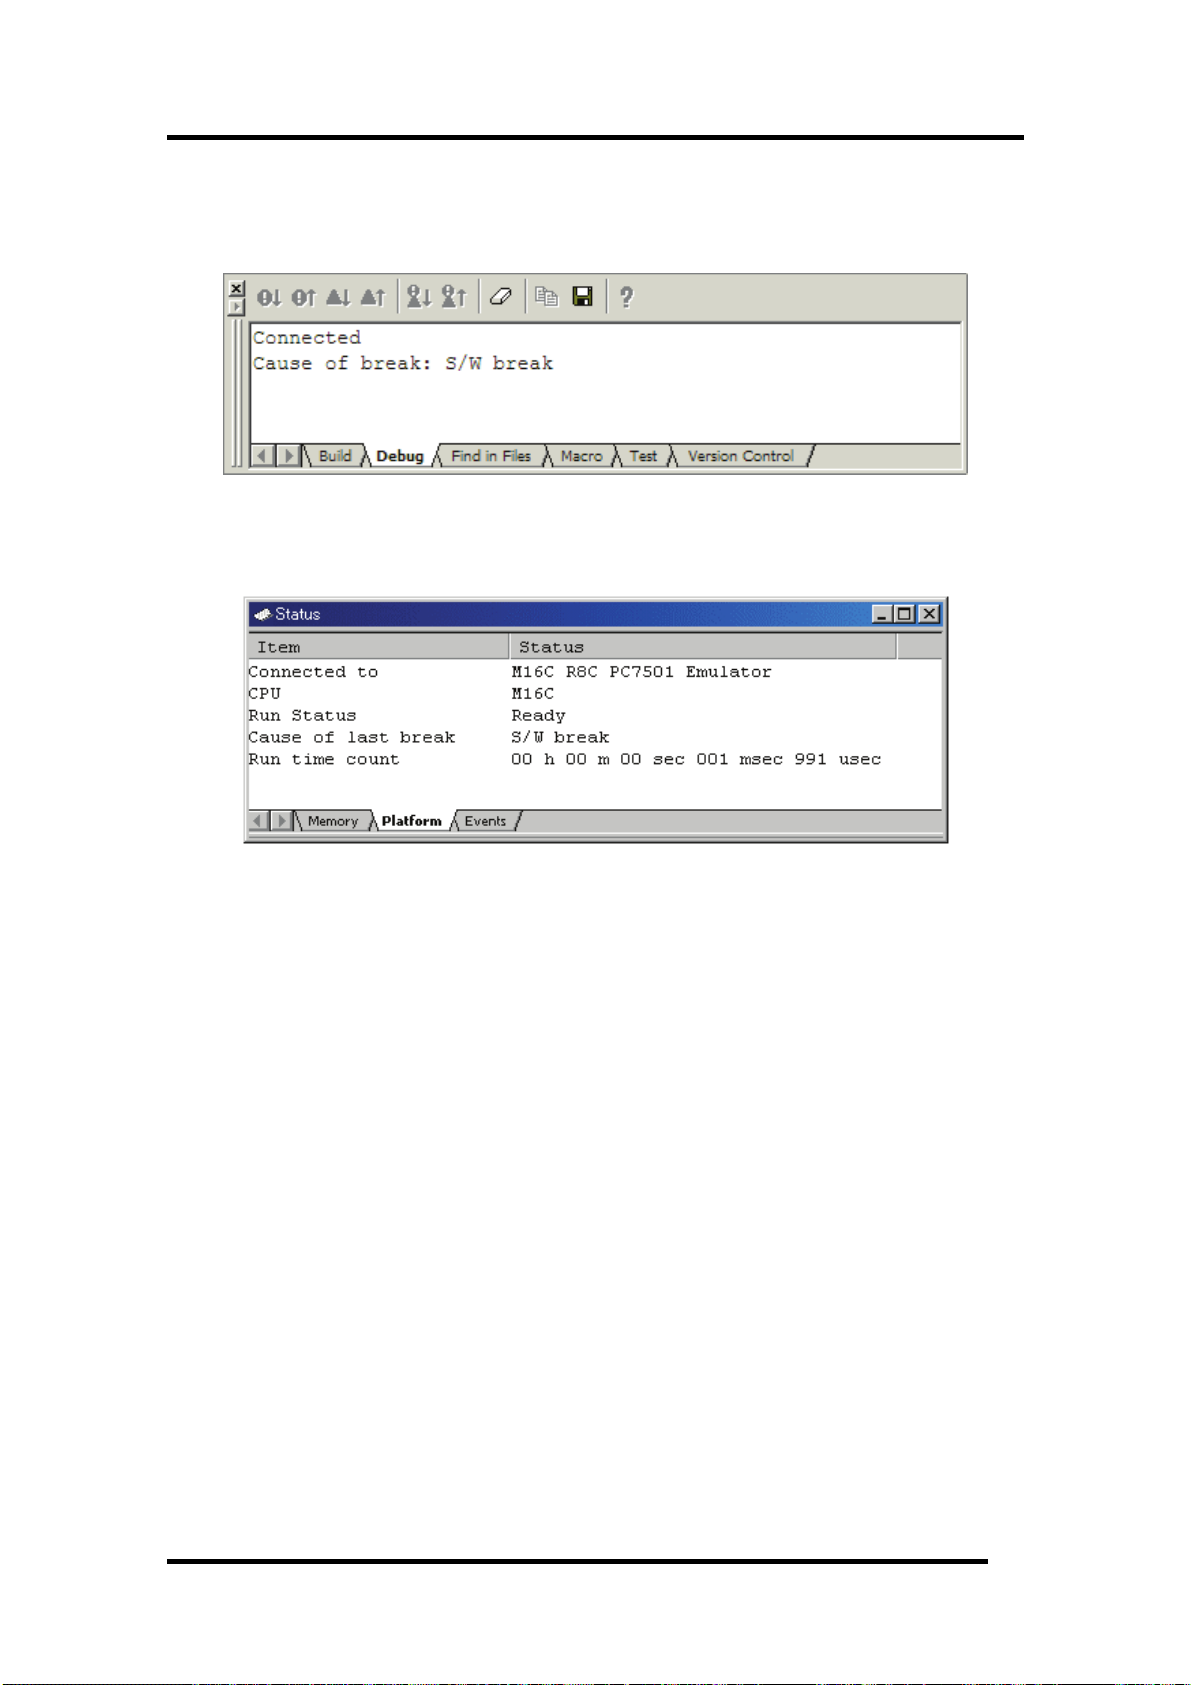
6.2.5.3 Reviewing Cause of the Break
The break factor is displayed in the [Output] window.
The user can also see the cause of the break that occurred last time in the [Status] window.
Select [Status] from the [CPU] submenu of the [View] menu. After the [Status] window is displayed,
open the [Platform] sheet, and check the Status of Cause of last break.
Please refer to "
11 Display the Cause of the Program Stoppage " about the notation of a break factor.
68
Page 83

6.2.6 Step6 : Reviewing Breakpoints
The user can see all the breakpoints set in the program in the [Breakpoints] dialog box.
6.2.6.1 Reviewing Breakpoints
Push the key Ctrl+B, and the [Breakpoints] dialog box will be displayed.
This window allows the user to delete, enable, or disable breakpoints.
6 Tutorial
69
Page 84

6.2.7 Step7 : Viewing Register
The user can see all registers/flags value in the [Register] window.
6.2.7.1 Viewing Register
Select [Registers] from the [CPU] submenu of the [View] menu. The [Register] window is displayed.
The figure below shows a Register window of the debugger for M16C/R8C.
6.2.7.2 Setting the Register Value
You can change a register/flag value from this window.
Double-click the register line to be changed. The dialog is opened. Enter the value to be changed.
70
Page 85

6 Tutorial
6.2.8 Step8 : Viewing Memory
When the label name is specified, the user can view the memory contents that the label has been
registered in the [ASM Watch] window.
6.2.8.1 Viewing Memory
For example, to view the memory contents corresponding to __msize in word size:
Select [ASM Watch] from the [Symbol] submenu of the [View] menu, open the [ASM Watch] window.
And click the [ASM Watch] window with the right-hand mouse button and select [Add...] from the
popup menu, enter __msize in the [Address] edit box, and set Word in the [Size] combo box.
Click the [OK] button. The [ASM Watch] window showing the specified area of memory is displayed.
71
Page 86

6.2.9 Step9 : Watching Variables
As the user steps through a program, it is possible to watch that the values of variables used in the
user program are changed.
If the downloaded program is the program generated by the assembler package for 740 family, you
can not watch variables in C watch window.
6.2.9.1 Watching Variables
For example, set a watch on the long-type array a declared at the beginning of the program, by using
the following procedure:
Click the left of displayed array a in the [Editor(Source)] window to position the cursor, and select
[Add C Watch...] with the right-hand mouse button. The [Watch] tab of [C watch] window in which
the variable is displayed opens.
The user can click mark '+' at the left side of array a in the [C Watch] window to watch all the
elements.
72
Page 87

6 Tutorial
6.2.9.2 Registering Variable
The user can also add a variable to the [C Watch] window by specifying its name.
Click the [C Watch] window with the right-hand mouse button and select [Add...] from the popup
menu.
The following dialog box will be displayed. Enter variable i.
Click the [OK] button. The [C Watch] window will now also show the int-type variable i.
73
Page 88

6.2.10 Step10 : Stepping Through a Program
This debugger provides a range of step menu commands that allow efficient program debugging.
1. Step In
Executes each statement, including statements within functions(subroutines).
2. Step Out
Steps out of a function(subroutine), and stops at the statement following the statement in the
program that called the function(subroutine).
3. Step Over
Executes a function(subroutine) call in a single step.
4. Step...
Steps the specified times repeatedly at a specified rate.
6.2.10.1 Executing [Step In] Command
The [Step In] command steps into the called function(subroutine) and stops at the first statement of
the called function(subroutine).
To step through the sort function, select [Step In] from the [Debug] menu, or click the [Step In] button
on the toolbar.
The PC cursor moves to the first statement of the sort function in the [Editor(Source)] window.
74
Page 89

6 Tutorial
6.2.10.2 Executing [Step Out] Command
The [Step Out] command steps out of the called function(subroutine) and stops at the next statement
of the calling statement in the main function.
To step out of the sort function, select [Step Out] from the [Debug] menu, or click the [Step Out]
button
The PC cursor slips out of a sort function, and moves to the position before a change function.
on the toolbar.
Note
It takes time to execute this function. When the calling source is clarified, use [Go To Cursor].
75
Page 90
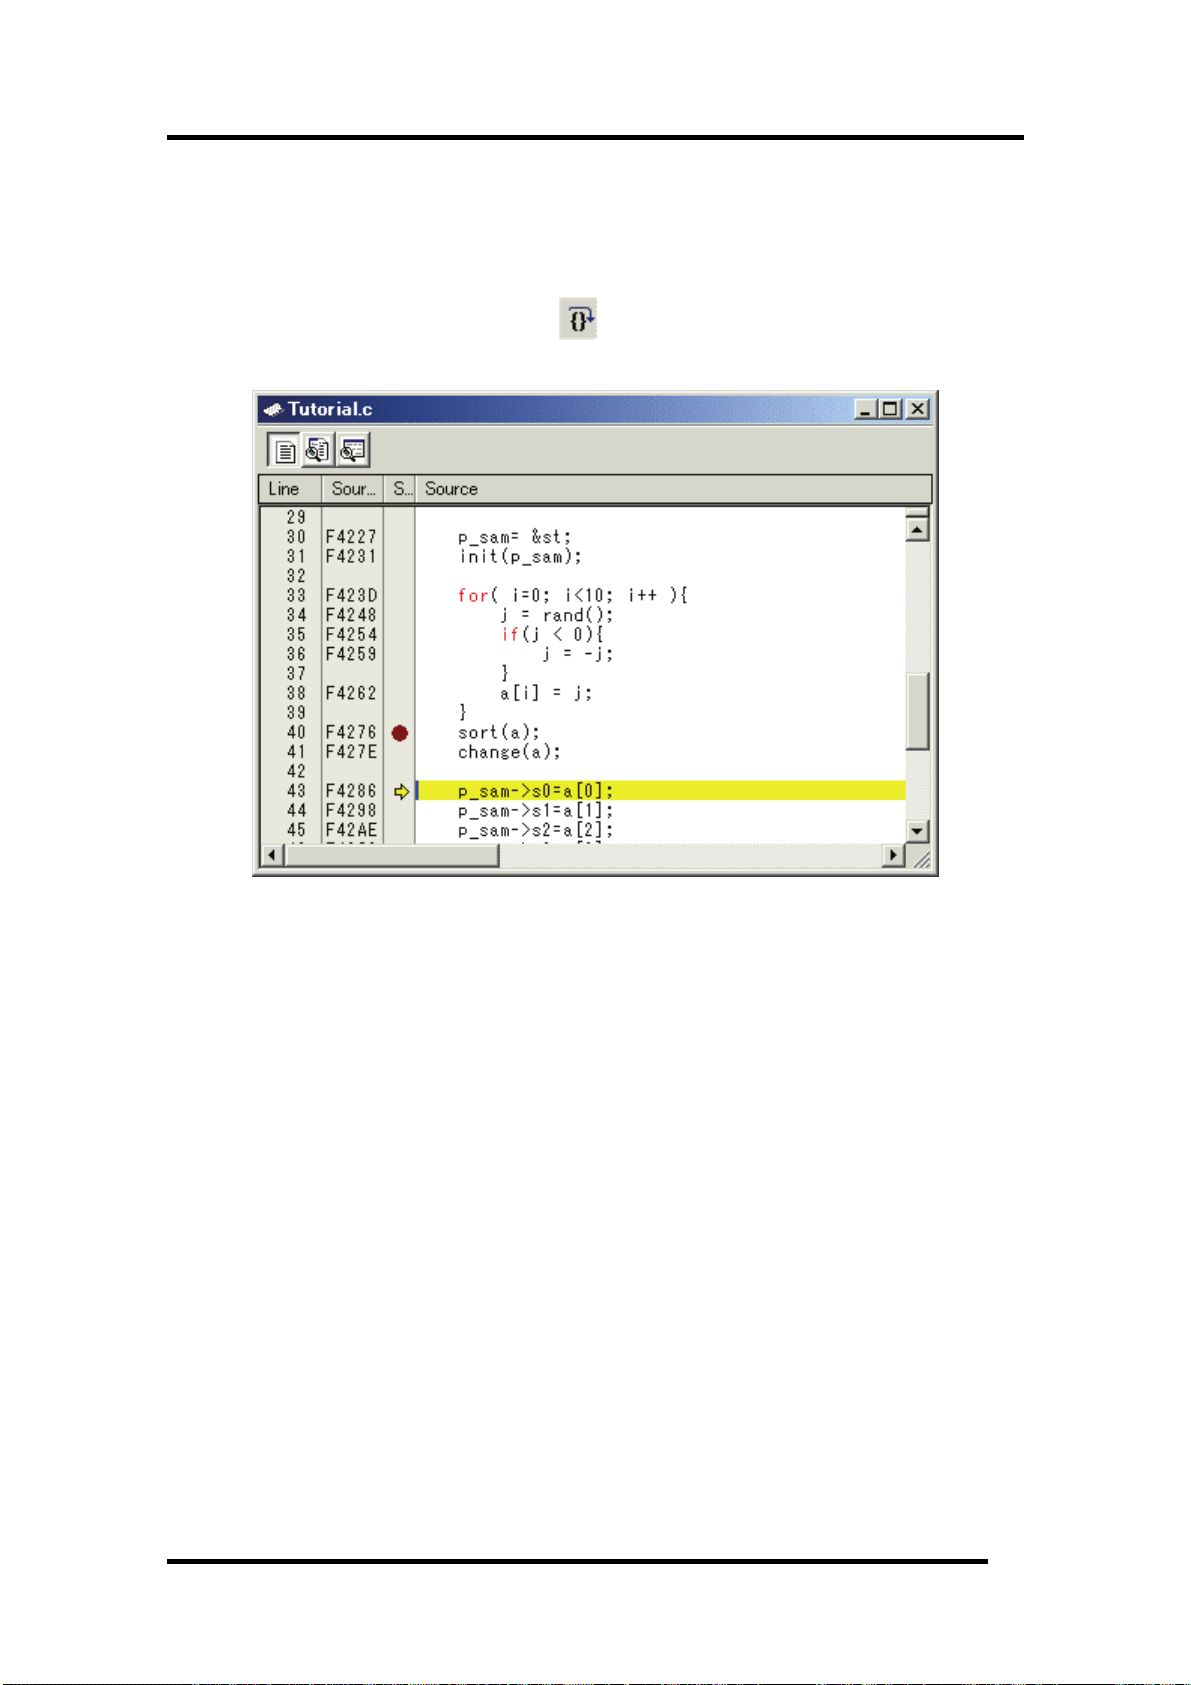
6.2.10.3 Executing [Step Over] Command
The [Step Over] command executes a function(subroutine) call as a single step and stops at the next
statement of the main program.
To step through all statements in the change function at a single step, select [Step Over] from the
[Debug] menu, or click the [Step Over] button
The PC cursor moves to the next position of a change function.
on the toolbar.
76
Page 91

6 Tutorial
6.2.11 Step11 : Forced Breaking of Program Executions
This debugger can force a break in the execution of a program.
6.2.11.1 Forced Breaking of Program Executions
Cancel all breaks.
To execute the remaining sections of the main function, select [Go] from the [Debug] menu or the [Go]
button
The program goes into an endless loop. To force a break in execution, select [Halt Program] from the
[Debug] menu or the [Halt] button
on the toolbar.
on the toolbar.
77
Page 92
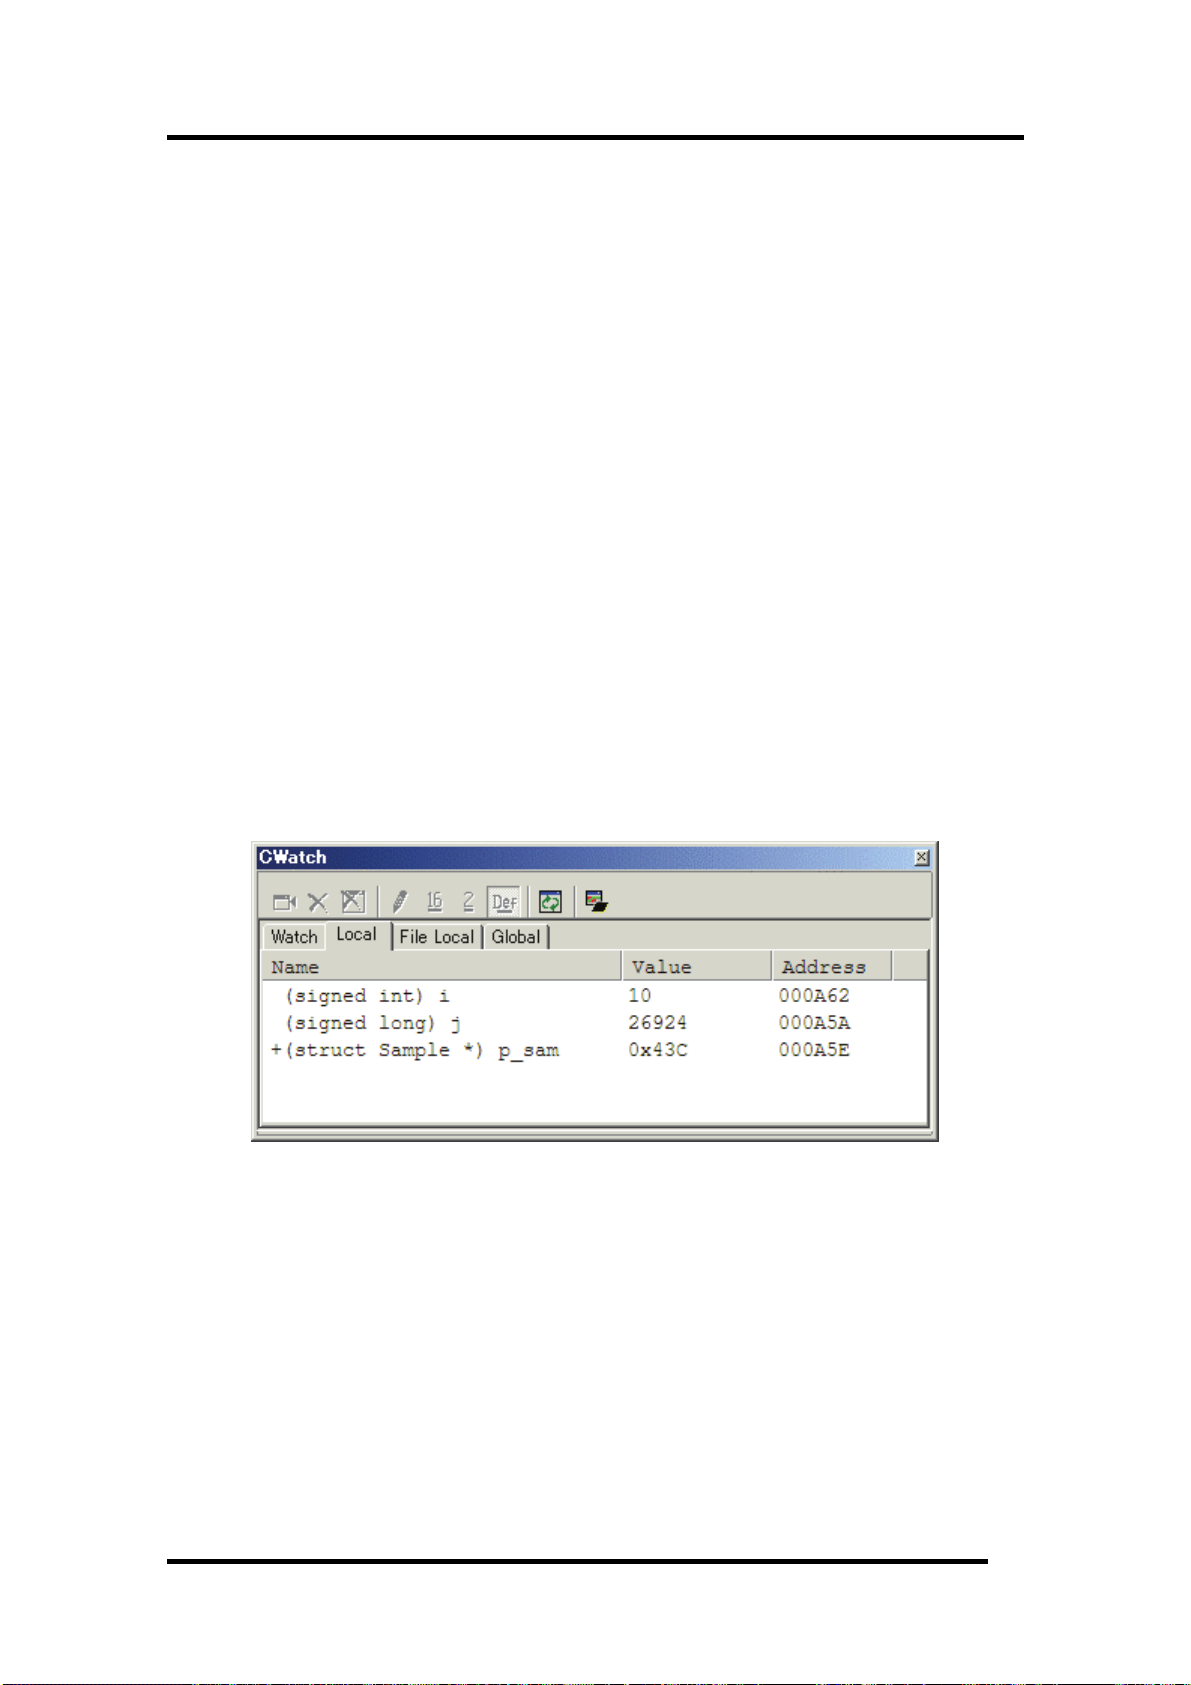
6.2.12 Step12 : Displaying Local Variables
The user can display local variables in a function using the [C Watch] window.
If the downloaded program is the program generated by the assembler package for 740 family, you
can not watch variables in C watch window.
6.2.12.1 Displaying Local Variables
For example, we will examine the local variables in the tutorial function, which declares three local
variables: i, j, and p_sam.
Select [C Watch] from the [Symbol] submenu of the [View] menu. The [C Watch] window is displayed.
By default, [C watch] window has four tabs as following:
• [Watch] tab
Only the variable which the user registered is displayed.
• [Local] tab
All the local variables that can be referred to by the scope in which the the PC exists are
displayed. If a scope is changed by program execution, the contents of the [Local] tab will also
change.
• [File Local] tab
All the file local variables of the file scope in which the PC exists are displayed. If a file scope is
changed by program execution, the contents of the [File Local] tab will also change.
• [Global] tab
All the global variables currently used by the downloaded program are displayed.
Please choose the [Local] tab, when you display a local variable.
Double-click the mark '+' at the left side of pointer p_sam in the [Locals] window to display the
structure *(p_sam).
When the user refers to the members of the structure at the end of the Tutorial function, it is clarified
that random data is sorted in descending order.
78
Page 93
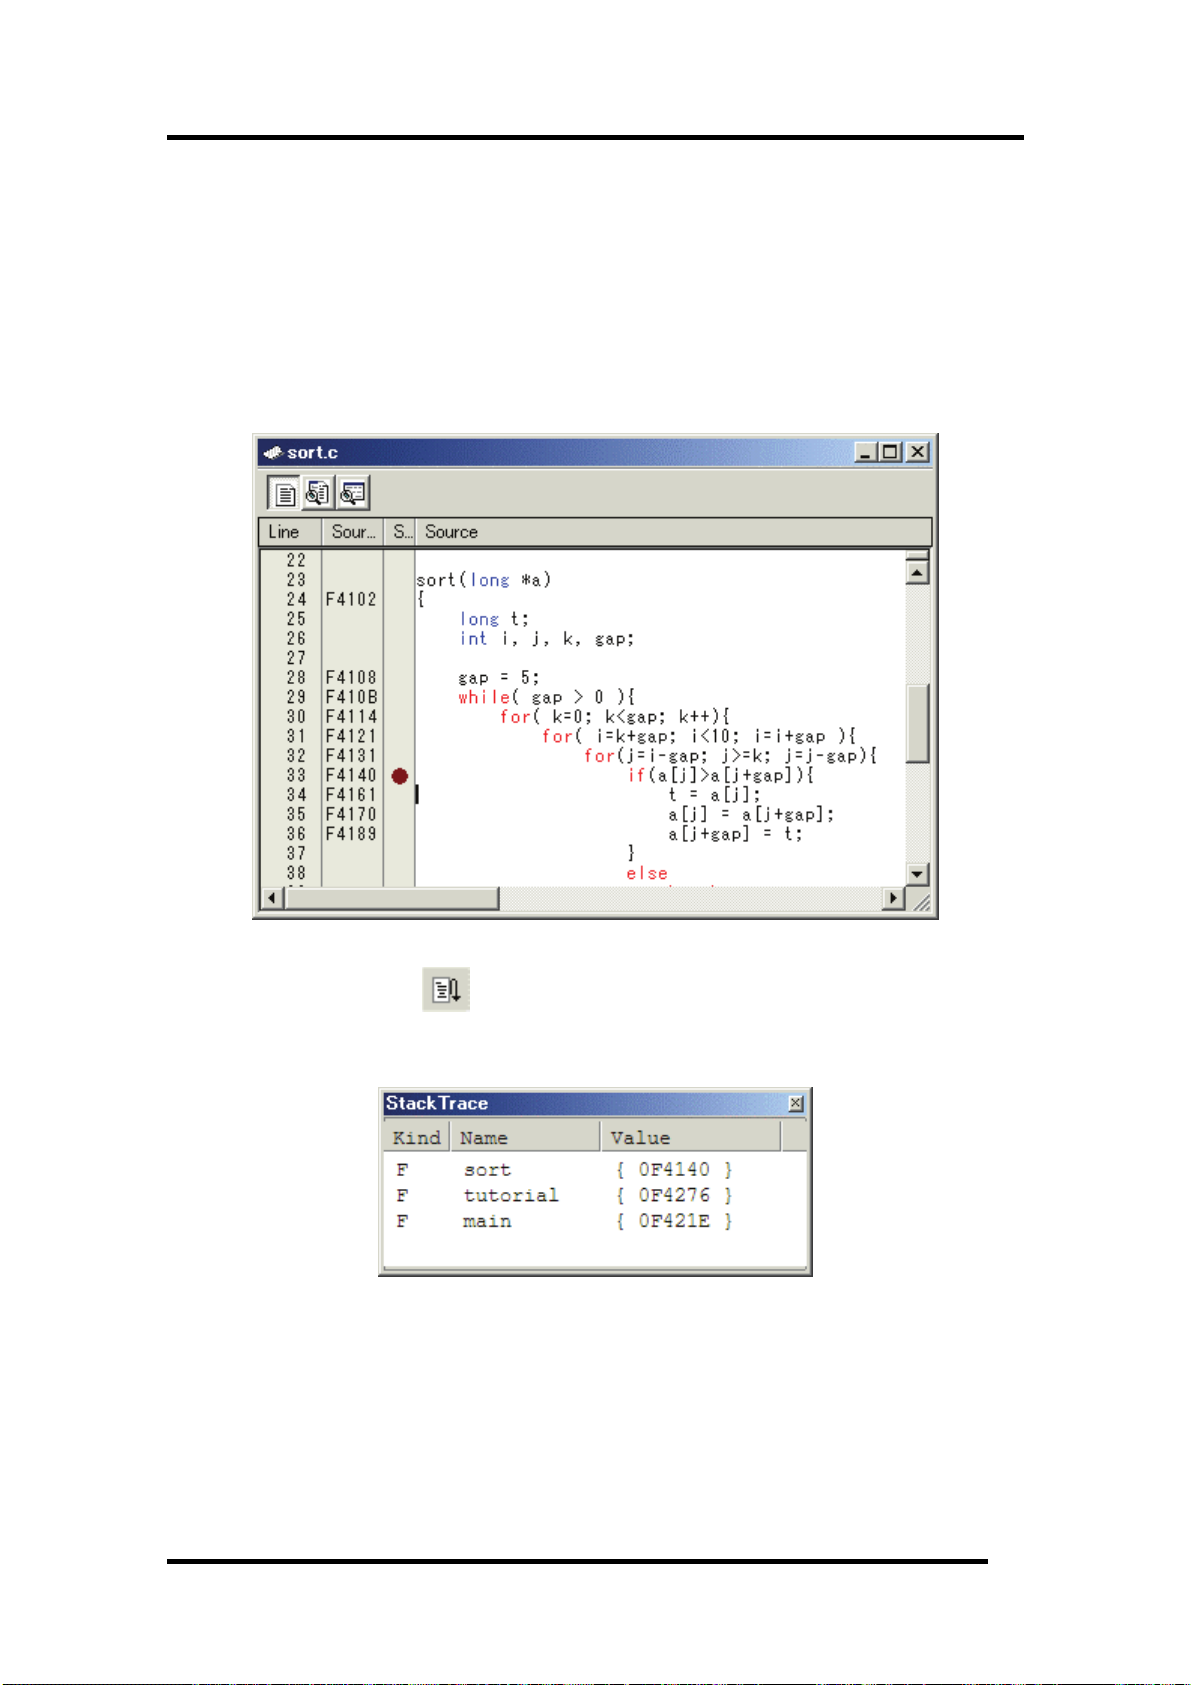
6 Tutorial
6.2.13 Step13 : Stack Trace Function
The debugger uses the information on the stack to display the names of functions in the sequence of
calls that led to the function to which the program counter is currently pointing.
The debugger for 740 doesn't support the stack trace function.
6.2.13.1 Reference the function call status
Double-click the [S/W Breakpoints] column in the sort function and set a software breakpoint.
To executes the user program from the reset vector address, select [Reset Go] from the [Debug] menu,
or click the [Reset Go] button
After the break in program execution, select [Stack Trace] from the [Code] submenu of the [View]
menu to open the [Stack Trace] window.
The upper figure shows that the position of the program counter is currently at the selected line of the
sort() function, and that the sort() function is called from the tutorial() function.
on the toolbar.
79
Page 94

6.2.14 What Next?
This tutorial has described the usage of this debugger.
Sophisticated debugging can be carried out by using the emulation functions that the emulator offers.
This provides for effective investigation of hardware and software problems by accurately isolating
and identifying the conditions under which such problems arise.
80
Page 95

Reference
81
Page 96

(Blank Page)
82
Page 97

7 Windows/Dialogs
7. Windows/Dialogs
The window of this debugger is shown below.
When the window name is clicked, the reference is displayed.
Window Name
RAM Monitor Window [View]->[CPU]->[RamMonitor]
ASM Watch Window [View]->[Symbol]->[ASMWatch]
C Watch Window [View]->[Symbol]->[CWatch]
Coverage Wind w o [View]->[Code]->[Coverage]
Script Window [View]->[Script]
S/W Break Point Setting Window [View]->[Break]->[S/W Break Points]
H/W Break Point Setting Window [View]->[Break]->[H/W Bre k Points] a
Protect Window [View]->[Break]->[Protect]
Trace Point Setting Window [View]->[Trace]->[Trace Points]
Time Measurement Window [View]->[Trace]->[Time Measure]
Trace Window [View]->[Trace]->[Trace]
Data Trace Window [View]->[Trace]->[Data Trace]
GUI I/O Wind w o [View]->[Graphic]->[GUI I/O]
MR Window * [View]->[RTOS]->[MR]
MR Trace Window * [View]->[RTOS]->[MR Trace]
MR Analyze Window * [View]->[RTOS]->[MR Analyze]
MR Task Pause Window * [View]->[RTOS]->[MR Task Pause]
Task Trace Window [View]->[RTOS]->[Task Trace]
Task Analyze Window [View]->[RTOS]->[Task Analyze]
*: The 740 debuggers are not supported.
For the reference of the following windows, refer to the help attached to a High-performance
Embedded Workshop main part.
• Differences Window
• Map Window
• Command Line Window
• Workspace Window
• Output Window
• Disassembly Window
• Memory Window
• IO Window
• Status Window
• Register Window
• Image Window
• Waveform Window
• Stack Trace Window
View Menu
83
Page 98

7.1 RAM Monitor Window
The RAM monitor window is a window in which changes of memory contents are displayed while
running the target program.
The relevant memory contents are displayed in dump form in the RAM monitor area by using the
realtime RAM monitor function. The displayed contents are updated at given intervals (by default,
every 100 ms) while running the target program.
• This system provides a 1Kbytes of RAM monitor area, which can be placed at any continuous
addresses.
• The RAM monitor area can be changed to any desired address range.
Refer to "
The default RAM monitor area is mapped into a 1-Kbyte area beginning with the start address of
the internal RAM.
• The display content updating interval can be set for each window individually.
The actual updating interval at which the display contents are actually updated while running
the target program is shown in the title field of the Address display area.
• The background colors of the data display and code display areas are predetermined by access
attribute, as shown below.
The background colors can be changed.
7.1.2 Setting the RAM monitor area" for details on how to change the RAM monitor area.
Access attribute Background color
Read accessed address Green
Write accessed address Red
Non-accessed address White
84
Page 99
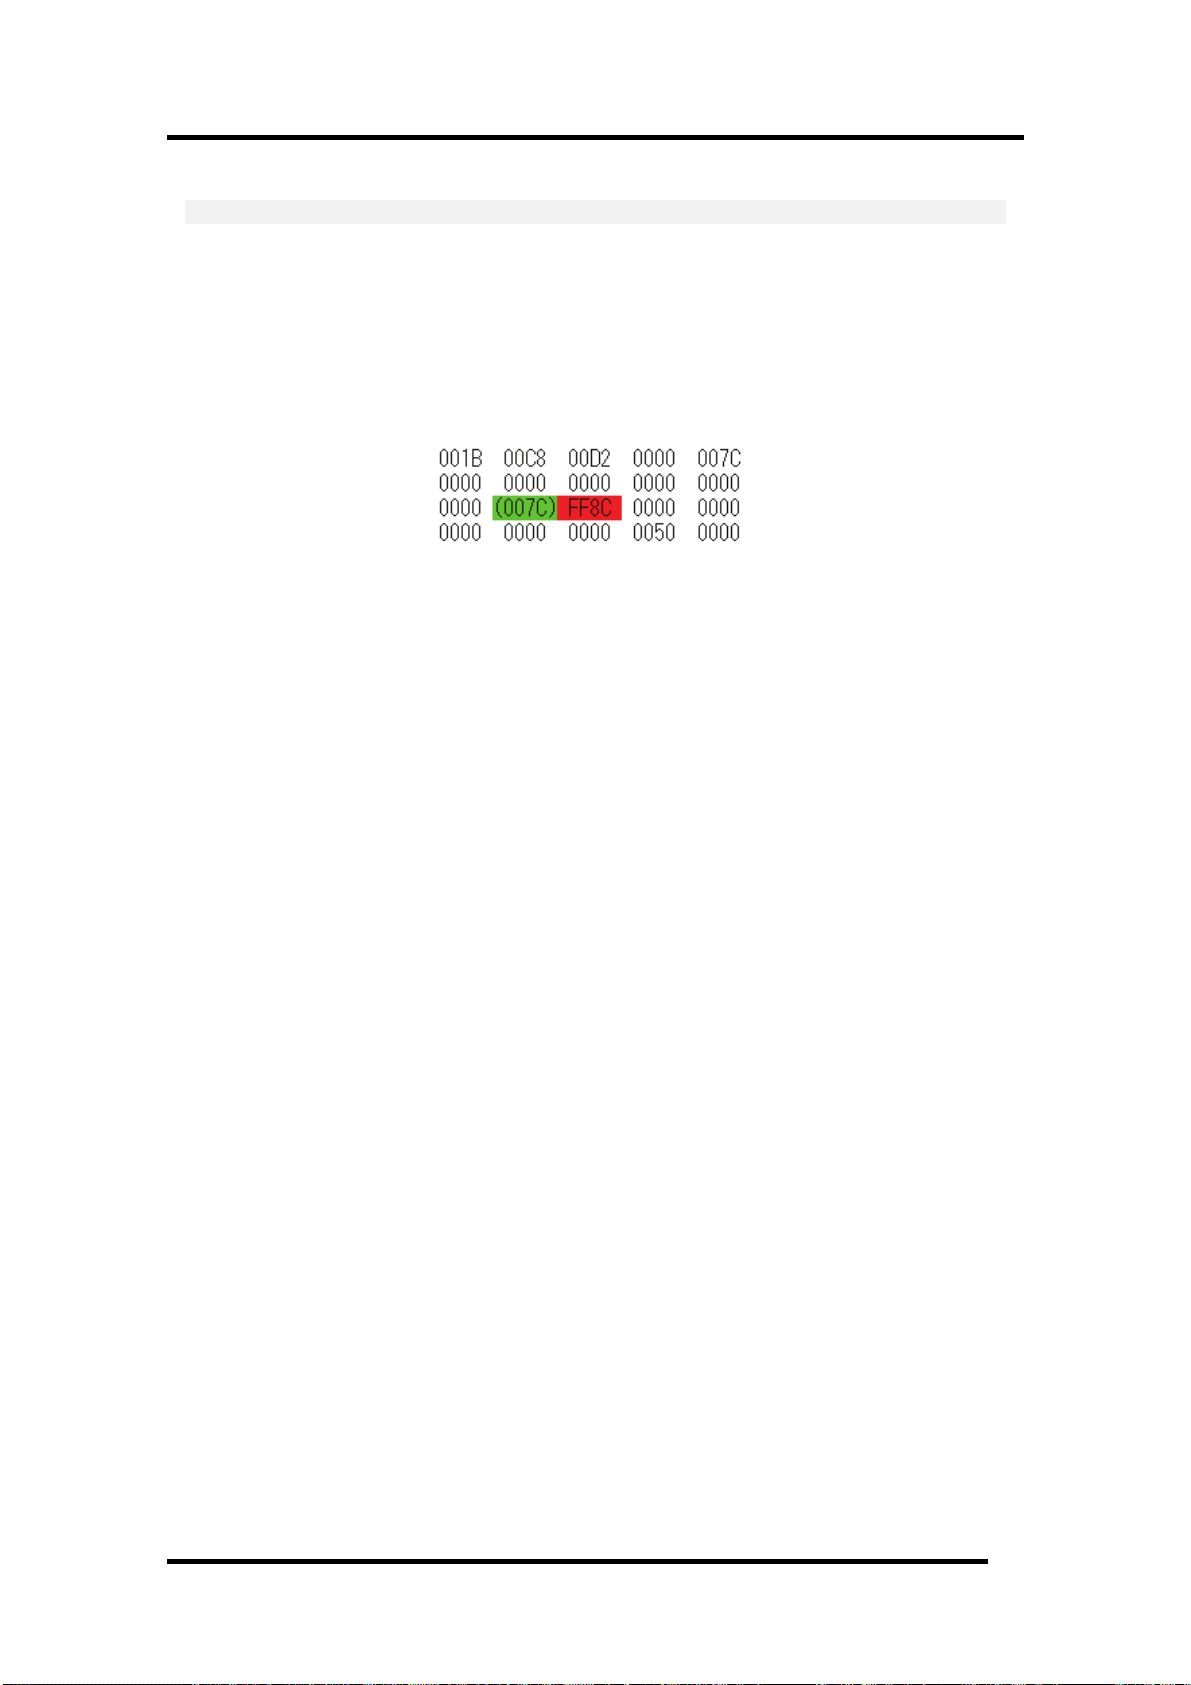
7 Windows/Dialogs
ATTENTION
• The RAM monitor window shows the data that have been accessed through the bus. Therefore,
changes are not reflected in the displayed data unless they have been accessed via the target
program as in the case where memory is rewritten directly from an external I/O.
• If the data in the RAM monitor area are displayed in lengths other than the byte, it is possible
that the data will have different memory access attributes in byte units. If bytes in one data have
a different access attribute as in this case, those data are enclosed in parentheses when displayed
in the window. In that case, the background color shows the access attribute of the first byte of
the data.
• The displayed access attributes are initialized by downloading the target program.
• The interval time at which intervals the display is updated may be longer than the specified
interval depending on the operating condition (shown below).
- Host machine performance/load condition
- Communication interface
- Window size (memory display range) or the number of windows displayed
85
Page 100

7.1.1 Extended Menus
This window has the following popup menus that can be brought up by right-clicking in the window.
Menu Function
RAM Monitor Area... Set RAM monitor base address.
Sampling Period... Set RAM monitor sampling period.
Clear Clear access attribute.
Up Moves display position to the immediately preceding RAM
monitor area (smaller address)
Down Moves display position to the immediately following RAM
monitor area (larger address)
Address... Display from specified address.
Scroll Area... Specify scroll range.
Data Length
Radix
Code
Layout
Column... Set the number of columns displayed on one line.
Split Split window.
Toolbar display Display toolbar.
Customize toolbar... Open toolbar customize dialog box.
Allow Docking Allow window docking.
Hide Hide window.
1byte Display in 1Byte unit.
2bytes Display in 2Byte unit.
4bytes Display in 4Byte unit.
8bytes Display in 8Byte unit.
Hex Display in Hexadecimal.
Dec Display in Decimal.
Single Dec Display in Signed Decimal.
Oct Display in Octdecimal.
Bin Display in Binary.
ASCII Display as ASCII character.
SJIS Display as SJIS character.
JIS Display as JIS character.
UNICODE Display as UNICODE character.
EUC Display as EUC character.
Float Display as Floating-point.
Double Display as Double Floating-point.
Label Switch display or non-display of Label area.
Register Switch display or non-display of Register area.
Code Switch display or non-display of Code area.
86
 Loading...