

Page 1

s
User Manual
Document: D5087
Part: D301418X012
November 2016
Web_BSI Manual
OpenBSI Version 5.9
Remote Automa ti on Solution
www.EmersonProcess.com/Remote
Page 2

Application Safety Considerations
Protecting Operating Processes
A failure of this application – for whatever reason -- may leave an operating process without
appropriate protection and could result in possible damage to property or injury to persons. To protect
against this, you should review the need for additional backup equipment or provide alternate means
of protection (such as alarm devices, output limiting, fail-safe valves, relief valves, emergency shutoffs,
emergency switches, etc.)
CAUTION
When implementing control using this product, observe best industry practices as suggested by applicable
and appropriate environmental, health, and safety organizations. While this product can be used as a safety
component in a system, it is NOT intended or designed to be the ONLY safety mechanism in that system.
Page 3

Table of Contents
What is Web_BSI? .......................................................................................................................... 1
Setting up the Web_BSI Software .............................................................................................. 2
Installing the Web_BSI software on your PC ............................................................................ 2
Specifying the Location of Your Web Browser ......................................................................... 2
Specifying the Startup Web Page For A Controller ................................................................... 2
Other Notes About Using Web Pages ........................................................................................ 3
Web_BSI Pages ..................................................................................................................... 5
Alarm Summary Web Page ........................................................................................................ 7
Archive Collection Web Page .................................................................................................. 19
Array Collection Web Page ...................................................................................................... 23
Array Item View Web Page ..................................................................................................... 27
Audit Collection Web Page ...................................................................................................... 33
Buffer Usage Web Page (Network 3000) ................................................................................. 36
Crash Blocks Web Page ........................................................................................................... 38
Custom PROM INFO Web Page (Network 3000) ................................................................... 39
File Transfer web page ............................................................................................................. 41
Historical Log Storage Web page ............................................................................................ 43
IP Statistics Web page .............................................................................................................. 45
Node Locator Web Page ........................................................................................................... 51
Node Routing Table Web Page ................................................................................................ 53
Port Summary Statistics Web Page .......................................................................................... 54
Security Sign-On Web Page ..................................................................................................... 64
Signal List Web Page ............................................................................................................... 66
Signal Recipe Web Page .......................................................................................................... 69
Signal Search Web Page ........................................................................................................... 73
Signal View Web Page ............................................................................................................. 87
Tele-Product Web Pages - Notes About ................................................................................ 104
Trend Web Page (Historical Trend, Signal Trend) ................................................................ 106
Version Information Web Page .............................................................................................. 123
Appendix A - ActiveX Controls ................................................................................................. A-1
Notes About Creating Your Own Web Pages ........................................................................ A-3
Standard Properties (Common to Multiple ActiveX Controls) .............................................. A-3
Use of Parameters ................................................................................................................. A-5
Notes about Specifying Colors: .............................................................................................. A-6
Specifying RGB colors as Decimal Numbers ........................................................................ A-6
Forcing a Refresh of a Web Control ...................................................................................... A-6
Troubleshooting Tip – Web Page Controls Not Functioning Properly .................................. A-6
Resetting the Internet Security Settings ................................................................................. A-6
Verifying that Javascript is enabled ....................................................................................... A-7
Alarm Summary ................................................................................................................. A-9
Page 4

SECTION 2 – EVEN HEADER
Archive Collection Control ....................................................................................................... A-12
Array Collection Control .......................................................................................................... A-13
Audit Collection Control .......................................................................................................... A-15
Buffer Usage Control ............................................................................................................... A-17
CPROM Control (Custom PROM) ........................................................................................... A-17
Crash Block Control ............................................................................................................... A-18
File Transfer Control ............................................................................................................... A-18
Historical Array Item View Control ......................................................................................... A-20
Historical Log Storage Control ................................................................................................. A-24
IP Statistics Control ............................................................................................................... A-32
Node Routing Control ............................................................................................................... A-32
OpenBSI Version Control ......................................................................................................... A-32
Port Summary Control .............................................................................................................. A-33
Recipe Control ............................................................................................................... A-33
RTU Locator Control ............................................................................................................... A-35
Security Control (Sign On) ....................................................................................................... A-36
Signal List Control ............................................................................................................... A-37
Signal Search ............................................................................................................... A-38
Signal View Control ............................................................................................................... A-41
Trend ............................................................................................................... A-53
Version Information Control .................................................................................................... A-58
Write Signal Control ............................................................................................................... A-59
Examples - Configuring ActiveX Controls in HTML .............................................................. A-62
Appendix B – File Tabs for Calibration Web Pages .................................................................. B-1
Addendum
Page 5

What is Web_BSI?
What is Web_BSI?
Web_BSI consists of a set of standard web pages and ActiveX controls which may be used to
configure a newly installed ControlWave series process automation controller, or to modify
certain configuration parameters in an existing ControlWave unit. Some web page functions are
also supported for Network 3000-series controllers.
The key components of the Web_BSI, from a user's point of view are:
Standard Set of Web Pages - A series of data collection web pages, compatible with
Microsoft® Internet Explorer (Version 5.0 or newer), are provided to view data from arrays,
archives, audit files, and lists. Some of the standard web pages may be used with both
Network 3000 and ControlWave series controllers, others will function with only one product
series.
NOTE: Separate sets of web pages are also available for configuration/calibration operations
for particular ControlWave or TeleFlow products. For information on these, please consult
the help files in those web pages.
The easiest way to access the web pages is through LocalView or NetView, after you have
added the controller to the OpenBSI network.
The Web_BSI standard set of web pages (HTML) are stored on the OpenBSI workstation.
ActiveX Controls for use in User-Created Web Pages - In addition to this standard set of
web pages, users can create their own web pages. To support the user-created web pages, a
series of ActiveX controls specific to ControlWave and Network 3000 controllers are
provided for web page developers. User-created web pages are stored on the OpenBSI
Workstation.
LocalView - Allows local communication with a controller. Also allows configuration
parameters to be set. See Chapter 5 of the the OpenBSI Utilities Manual (document# D5081)
for details.
1 Web_BSI Manual
Page 6

Setting up the Web_BSI Software
Setting up the Web_BSI Software
Installing the Web_BSI software on your PC
Web_BSI is automatically included when you install either the OpenBSI Network Edition, or the
OpenBSI Local Edition. See Chapter 2 of the OpenBSI Utilities Manual (document# D5081) for
details.
IMPORTANT
The Web_BSI software should only be run on Windows® 2008 Server, Windows® 7
Professional, or Windows
under Windows
for Windows
®
95, because of unpredictable results. There is no longer support
®
98, Windows® NT, Windows® 2000, or Windows® XP Professional.
Specifying the Location of Your Web Browser
®
10. Users are warned NOT to attempt to run this software
If the path of your web browser is other than the default (\Program Files\Internet Explorer\) you
will need to use a text editor to edit the WEB_BROWSER_PATH parameter in your NDF file to
reflect the web browser’s location.
WEB_BROWSER_PATH=C:\Program Files\Internet Explorer
Specifying the Startup Web Page For A Controller
During OpenBSI system configuration, you must specify a
startup HTML web page for each controller. This can be done
in the RTU Wizard of NetView when the controller is initially
added to the network, or from the RTU Properties dialog box,
after it is already in the network.
To access the RTU Properties dialog box, right click on the
icon for the controller, and choose “Properties” from the
pop-up menu.
The startup web page resides on the PC workstation, so a full path and filename must be
entered in the “Startup” field of the RTU Properties dialog box.
If you would like access to the standard web page set, specify web_bsi.htm as the startup
page. This web page is referred to as the Main Menu, and contains links to all of the
standard web pages.
Web_BSI Manual 2
Page 7

Setting up the Web_BSI Software
Specify the complete path and filename on the PC, of the
startup web page here. (Use the “Browse” push button to
locate the web page, if desired.)
Other Notes About Using Web Pages
For optimum results, screen resolution should be set to 1024 x 768 when using our web
pages.
You can use the tab key to move between fields on web pages. (OpenBSI 5.8 and newer.)
If you need to enter a value in a field on a web page, you must press the [Enter] key to save
the value. You can use the [Esc] key to leave the field unchanged.
If you need make a selection from a drop-down menu (combo box), you must press the
[Enter] key to save the value, unless you have OpenBSI 5.8 Service Pack 1 or newer in
which case your selection is sent to the RTU automatically.
You can have multiple web pages open simultaneously, for example, to look at different
types of data from the same RTU. To do this, just open a new instance of Internet Explorer
(or open a new window in IE using the FileNew command). Note, however, that if you
terminate one instance (or window) communicating with a particular RTU, you will
3 Web_BSI Manual
Page 8

Setting up the Web_BSI Software
terminate all instances or windows communicating with that same RTU.
If your ControlWave-series controller is part of a BSAP network, it will be treated as a
BSAP controller; and only those configuration facilities and features available for a BSAP
controller will be available. This will prevent web page configuration of Audit/Archive and
certain security features.
NetView software must be registered in order to be used beyond the 60 day evaluation
period. See Chapter 2 of the OpenBSI Utilities Manual (document# D5081) for more
information on the registration process.
The standard set of web pages for Web_BSI are stored in the directory:
\openbsi_installation_path\WebPages
where openbsi_installation_path is whatever directory you chose for the installation of
OpenBSI data files. The default is \ProgramData\Bristol\OpenBSI\.
Other folders of web pages are also available for various other ControlWave or TeleFlow
products.
Web_BSI Manual 4
Page 9

Calling up Web_BSI Pages
Web_BSI Pages
There are two different methods for calling up the Web_BSI web pages:
IMPORTANT
If this is the first time you are calling up the Web_BSI web pages, you will need to use
the Node Locator page, described later in this manual, to identify the nodes with which
you want to communicate. After that, you should not need to use it again, unless you
are communicating with different nodes, or if your network configuration has changed.
IMPORTANT
You must log in with Administrative privileges in order to use certain configuration
web pages, in particular the Node Locator.
Method 1
With NetView or LocalView running, click as follows:
StartProgramsOpenBSI ToolsWeb Page AccessStandard Pages
Method 2
In order to call up the web page(s) associated with
a particular controller, right click on the icon for
the controller in the OpenBSI NetView tree, and
choose RTUWebPage Access from the pop-up
menu. Internet Explorer will be started, and
whichever startup web page associated with the
controller will be displayed.
5 Web_BSI Manual
Page 10

Calling up Web_BSI Pages
To call up other web pages, click on a category, and then
select from the choices that appear below it.
The Main Menu page in the standard set is shown, above, however, the startup page for your
controller may be different. Typically, the Security Sign-On always appears on the Main Menu
page.
The various web pages include category buttons along the left hand side, for calling up
additional pages; when you click your cursor on a category button, a list of pages belonging in
that category will appear below it. The category buttons are named Security, Statistics, Signal
Data, and Historical Data.
A “Node Name” field displays the name of the current controller from which data is being
viewed on the web page.
.
Web_BSI Manual 6
Page 11

ALARM SUMMARY Web Page
Alarm Summary Web Pa ge
The Alarm Summary Web Page allows you to view all current alarm messages received from a
controller (or multiple controllers) in the network.1
To access the Alarm Summary web page, click on the "Signal Data" category button, then
choose the "Alarm Summary" drop-down menu selection.
The most recent alarms appear at the top of the window; older alarms are automatically
Alarms appear in different colors based on the Alarm Priority. The colors are set in the
The choice of which columns are included for the alarm entries can be specified from the
Alarms can be filtered so that only alarms meeting certain criteria are displayed. This can be
Alarms can be sorted alphabetically based on a particular column, by clicking on the column
Right-click on
Date/time entry
Pop-up menu
moved towards the bottom. If there are more alarms than can fit in the window, a scroll bar
will appear, which you can use to view the additional alarms. By clicking on the ‘Date/Time’
column heading, you can sort alarms already displayed from newest to oldest, or oldest to
newest, however, any new alarms coming in will always appear at the top.
‘Colors’ page of the Alarm Properties dialog box.
‘Alarm Summary’ page of the Alarm Properties dialog box.
specified from the ‘Filtering’ page of the Alarm Properties dialog box.
heading. (NOTE: This does not apply to certain columns, such as the value or limit.)
1
The initial release of the Alarm Summary Control in Version 5.3 only supported alarms from RTUs
communicating via BSAP. Beginning with OpenBSI 5.4, alarms from RTUs communicating via IP are also
supported, provided the RTU firmware is 4.40 or newer.
7 Web_BSI Manual
Page 12

ALARM SUMMARY Web Page
Optionally, alarms can also be saved in a log file, for viewing at a later time. This can be
configured from the ‘Logging’ page of the Alarm Properties dialog box.
If you want to view alarms from more than one controller in the Alarm Summary, you must
be logged onto each of these controllers, prior to opening the Alarm Summary web page.
(This could be accomplished via the Sign On control, or via a login script in your web page
which uses the Sign On Control). To view a list of which controllers you are currently logged
onto, right click outside of the Alarm Summary window, but within the boundaries of the
control, and click on “Rtu List” in the pop-up menu
Acknowleging Alarms
To acknowlege an alarm visible in the Alarm Summary, click on the timestamp for the alarm,
then right-click outside of the Alarm Summary window, but within the boundaries of the control,
and click on “Ack” in the pop-up menu. If you want to select multiple alarms for
acknowlegement, hold down the [Ctrl] key as you select the alarms, then click on “Ack”. If you
want to acknowlege all alarms in the control, click on “Ack All”. NOTE: Once an alarm has
returned to normal, and has been acknowleged by the operator, it will be removed from the
alarm summary. Change of state alarms are removed once they are acknowledged.
Alarm Control Properties Dialog Box
The Alarm Control Properties dialog box allows you to configure which types of alarm message
data should be displayed in the Alarm Summary. The dialog box is divided into multiple pages,
accessible by clicking on tabs.
To call up the Alarm Properties dialog box, right-click outside of the Alarm Summary window,
but within the boundaries of the control, and click on “Properties” in the pop-up menu.
Web_BSI Manual 8
Page 13

ALARM SUMMARY Web Page
Alarm Summary Page
The ‘Alarm Summary’ page allows you to specify what parts of the alarm message you want to
display in the columns of the Alarm Summary. NOTE The RTU’s node name, the signal name,
and the timestamp when the alarm occurred are always displayed, and so are not included as
options.
Columns Which May be Included in the Alarm Summary:
To include a particular type of alarm message data in the Alarm Summary, check the appropriate
box. The boxes are:
Signal’s Value
Engineering Units
Alarm’s Priority
Alarm’s State
The value of the signal at the moment the alarm was generated.
The engineering units for the signal, such as gallons, inches, degrees
celsius, etc.
The priority indicates the importance of the alarm. The priorities, in
order of most importance to least importance are: Critical, NonCritical, Operator Guide (Op. Guide), and Event.
For analog alarms the possible states are ‘High-High’, ‘High’, ‘Low’
and ‘Low-Low’. These states indicate which alarm limit has been
most recently exceeded. For logical alarms, the state indicates the
type of boolean value change which occurred to generate the alarm.
‘True’ indicates the signal changed from ‘False’ to ‘True’. ‘False’
indicates the signal changed from ‘True’ to ‘False’, and ‘Change of
State’ indicates the signal simply changed from ‘True’ to ‘False’ or
‘False’ to ‘True’.
9 Web_BSI Manual
Page 14

ALARM SUMMARY Web Page
Report Type
Limit Exceeded
Ack State
Descriptor
Global Sequence
Number
Local Sequence
Number
Signal’s Index
Global Address
Load Version
Push Buttons and Other Controls
The report type indicates the number of times the signal has gone into
an alarm condition as part of this particular alarm message. ‘Single’
indicates it went ‘in alarm’ once. ‘Momentary’ indicates that it
momentarily went ‘in alarm’, but then returned to normal. ‘Multiple’
indicates that the signal has gone into and out of alarm more than
once.
This is the alarm limit which was exceeded.
This shows whether the alarm has been acknowleged by the operator,
or not.
This is the textual descriptor of the alarm signal.
The Global Sequence Number of the alarm, used internally, for
identifying alarm, audit, and archive files, within this RTU.
The Local Sequence Number, used internally, for identifying alarms
within this RTU.
For Network 3000: The Master Signal Directory (MSD) Address. For
ControlWave: The PDD Index. These are internal numbers used by
the firmware.
The global address of this RTU.
The version of the ACCOL load or ControlWave project executing in
this RTU.
[Select All]
[Clear All]
[Save As Defaults]
[Restore Defaults]
[OK]
[Cancel]
Selects all items for inclusion as columns in the Alarm Summary.
Users can then de-select any they do not want.
Clears all selections on this page.
Saves the selections in the Alarm Control’s Properties dialog box to a
defaults file.
Restores the saved selections from the defaults file.
Exits the Alarm Control’s Properties dialog box, saving all changes.
Exits the Alarm Control’s Properties dialog box, without saving
Web_BSI Manual 10
Page 15

ALARM SUMMARY Web Page
changes, except for changes saved to the defaults file.
[Help]
Calls up a help file.
Filtering Page
Sometimes, the user may wish to limit the alarm summary to only signals which satisfy certain
criteria, for example, they may want to exclude ‘Event’ and ‘Op. Guide’ alarms so that the
summary only shows ‘Critical’ and ‘Non-Critical’ alarms, or they may want to exclude ‘Logical
Alarms’ so that the summary will only show ‘Analog Alarms’. The Filtering page allows users to
specify this filtering criteria.
Exclude Alarm Type
This allows you to limit the alarm summary to only analog alarms, or
only logical alarms.
Selecting “Analog Alarms” prevents display of analog alarms in the
Alarm Summary.
Selecting “Logical Alarms” prevents display of logical (BOOL) alarms
in the Alarm Summary.
Apply Filtering
while in offline mode
The contents of the Alarm Summary can be saved in an alarm snapshot
(*.ALM) file, for off-line viewing, even when communications are not
active with the RTU network. If, when viewing the off-line alarm
summary, you want to continue to filter alarms, based on the criteria
defined on this page, select the “Apply Filtering while in offline
mode” box.
11 Web_BSI Manual
Page 16

ALARM SUMMARY Web Page
Exclude Priority
Exclude Limit
Exclude Logical
Type
This allows you to limit the priorities of alarms which are displayed in
the Alarm Summary.
Selecting “Event” prevents display of event priority alarms in the
Alarm Summary.
Selecting “Op. Guide” prevents display of operator guide alarms in the
Alarm Summary.
Selecting “Non-Critical” prevents display of non-critical alarms in the
Alarm Summary.
Selecting “Critical” prevents display of critical alarms in the Alarm
Summary.
This allows you to restrict analog alarms which are displayed in the
Alarm Summary based on which alarm limits have been exceeded, for
example, you could exclude low and high alarms, and only show lowlow and high-high alarms in the Alarm Summary.
Selecting “Low” prevents display of analog alarms in the Alarm
Summary which have exceeded their low alarm limit.
Selecting “High” prevents display of analog alarms in the Alarm
Summary which have exceeded their high alarm limit.
Selecting “Low-Low” prevents display of analog alarms in the Alarm
Summary which have exceeded their low-low alarm limit.
Selecting “High-High” prevents display of analog alarms in the Alarm
Summary which have exceeded their high-high alarm limit.
This allows you to restrict logical alarms which are displayed in the
Alarm Summary based on which logical state triggered the alarm.
Selecting “False” prevents alarms generated by a signal becoming
FALSE, from being displayed in the Alarm Summary.
Selecting “True” prevents alarms generated by a signal becoming
TRUE, from being displayed in the Alarm Summary.
Selecting “Change of State” prevents alarms generated by a signal
changing state from FALSE-to-TRUE or TRUE-to-FALSE, from being
displayed in the Alarm Summary.
Web_BSI Manual 12
Page 17

ALARM SUMMARY Web Page
Exclude Report
Push Buttons and Other Controls
[Exclude All]
[Include All]
[Save As Defaults]
[Restore Defaults]
[OK]
[Cancel]
[Help]
This allows you to restrict alarms which are displayed in the Alarm
Summary based on how the alarms are reported.
Select “Single” to prevent alarms generated based on a signal entering
an alarm condition once from appearing in the Alarm Summary.
Select “Momentary” to prevent alarms generated based on a signal
momentarily entering an alarm condition and then returning to normal,
from appearing in the Alarm Summary.
Select “Multiple” to prevent alarms generated based on a signal
entering an alarm condition more than once for a given alarm message
from appearing in the Alarm Summary.
Causes all boxes on the Filtering page to be selected, thus excluding all
alarms from the Alarm Summary.
Clears all boxes on the Filtering page, thereby turning off filtering, and
allowing all alarms to be displayed in the Alarm Summary.
Saves the selections in the Alarm Control’s Properties dialog box to a
defaults file.
Restores the saved selections from the defaults file.
Exits the Alarm Control’s Properties dialog box, saving all changes.
Exits the Alarm Control’s Properties dialog box, without saving
changes, except for changes saved to the defaults file.
Calls up a help file.
13 Web_BSI Manual
Page 18

ALARM SUMMARY Web Page
Colors Page
The Colors page allows you to choose which colors you want displayed for alarm messages of a
particular priority, for example, critical alarms appear in RED, etc. The page also lets you define
the background color for the Alarm Summary window.
How to set colors:
The current colors for each alarm priority are displayed next
to a button for that priority. To specify the colors which will
be displayed for alarm messages of a particular priority,
click on the button for that priority, and the color pallette
will appear.
Choose the desired color, and then click on [OK].
Web_BSI Manual 14
Page 19

ALARM SUMMARY Web Page
[Event]
[Op. Guide]
[Non-Critical]
[Critical]
[Return-to-Normal]
[Alarm Summary
Background]
[Save As Defaults]
[Restore Defaults]
[OK]
[Cancel]
[Help]
Click here to call up the color pallette and specify the color in which
Event alarm messages will be displayed in the Alarm Summary.
Click here to call up the color pallette and specify the color in which
Operator Guide alarm messages will be displayed in the Alarm
Summary.
Click here to call up the color pallette and specify the color in which
Non-Critical alarm messages will be displayed in the Alarm Summary.
Click here to call up the color pallette and specify the color in which
Critical alarm messages will be displayed in the Alarm Summary.
Click here to call up the color pallette and specify the color in which
Return-to-Normal alarm messages will be displayed in the Alarm
Summary.
Click here to call up the color pallette and specify the background color
of the Alarm Summary window.
Saves the selections in the Alarm Control’s Properties dialog box to a
defaults file.
Restores the saved selections from the defaults file.
Exits the Alarm Control’s Properties dialog box, saving all changes.
Exits the Alarm Control’s Properties dialog box, without saving
changes, except for changes saved to the defaults file.
Calls up a help file.
15 Web_BSI Manual
Page 20

ALARM SUMMARY Web Page
Logging Page
The Logging page allows the user to specify the name of a log file into which alarm summary
data will be stored. This allows users to keep a historical record of alarms, even after they have
been removed from the Alarm Summary.
Enable Logging
File to log Alarm
Reports
Append
Overwrite
Dump Extra alarm
data
When checked, causes entries in the Alarm Summary to also be stored
in a ASCII-text log file on your computer’s hard disk.
This specifies the path and name of the log file where the alarm data
will be stored. If a file already exists, use the [Browse] button to locate
it. Log files have the extension of *.LOG.
When selected, any new alarm summary entries are appended to the end
of the existing log file, preserving earlier data in the log file.
When this is selected, the Alarm Summary log file will be emptied
whenever the control starts, thereby deleting any previous entries.
By default, the local and global sequence numbers, the global address,
the load version, the descriptor, and the PDD index are omitted from the
log file. When this box is selected, however, they are all included in the
Alarm Summary log file. All other types of Alarm Summary Data
(signal value, engineering units, etc.) are always included in the Alarm
Summary Log file.
Web_BSI Manual 16
Page 21

ALARM SUMMARY Web Page
Apply filtering while
logging
When selected, filtering criteria specified in the ‘Filtering’ page of the
Alarm Properties dialog box, will be used to limit the types of alarms
stored in the Alarm Summary Log file. When this is not selected,
filtering criteria will only apply to the alarms appearing on the screen in
the Alarm Summary.
[Save As Defaults]
Saves the selections in the Alarm Control’s Properties dialog box to a
defaults file.
[Restore Defaults]
Restores the saved selections from the defaults file.
[OK]
Exits the Alarm Control’s Properties dialog box, saving all changes.
[Cancel]
Exits the Alarm Control’s Properties dialog box, without saving
changes, except for changes saved to the defaults file.
[Help]
Calls up a help file.
Example of an Alarm Summary Log File:
An example of an Alarm Summary Log File is shown below. These files may be viewed in
Notepad or any other ASCII text editor.
23-JAN-2004 13:43:00.560 Portland LOOP7.INP. 0.000000 PSIA
Critical Single
23-JAN-2004 13:43:00.560 Portland LOOP8.INP. 0.000000 RPM
Critical Single
23-JAN-2004 13:43:06.580 Portland LOOP8.INP. 6.000000 RPM
Non-Critical
23-JAN-2004 13:43:11.560 Portland LOOP7.INP. 11.000000 PSIA
Critical
23-JAN-2004 13:43:16.560 Portland LOOP8.INP. 16.000000 RPM
(Normal)
17 Web_BSI Manual
Page 22

ALARM SUMMARY Web Page
Saving a ‘snapshot’ of the current alarms into an Alarm Snapshot File
An Alarm Snapshot File is different from the Alarm Summary Log File discussed, earlier. Alarm
Snapshot Files have a file extension of (*.ALM) and are used to store a ‘snapshot’ of all current
alarms visible in the Alarm Summary. They are binary files, and so cannot be viewed in a text
editor.
To save the current alarms appearing on the screen in an existing Alarm Snapshot file, right-
click outside of the Alarm Summary window, but within the boundaries of the control, and click
on “Save” in the pop-up menu. If there is no existing Alarm Snapshot file, you will be prompted
for a path and filename, for the Alarm snapshot file.
If you store the Alarm data in an all new snapshot file, choose “Save As” instead of save, and
provide the path and filename for the file.
Viewing an Alarm Snapshot File
An Alarm Snapshot file can only be viewed when the Alarm Summary Window is in off-line
mode.
To view the snapshot file, right-click outside of the Alarm Summary window, but within the
boundaries of the control, and click on “Open”, then navigate to the alarm snapshot (*.ALM)
file, and open the file. The Alarm Summary Window will automatically go off-line, and no new
alarms will be displayed or logged while it is off-line. (You can tell the Alarm Summary is offline because while in off-line mode, the word OFFLINE appears on a status line at the bottom of
the window, along with the path and name of the Alarm Snapshot file currently being viewed.)
When you have finished viewing the Alarm Snapshot file, you can close it and return to on-line
mode by right-clicking outside of the Alarm Summary window, but within the boundaries of the
control, and then clicking on “Online”. The Alarm Summary control will now resume
displaying active alarms.
Web_BSI Manual 18
Page 23

ARCHIVE COLLECTION Web Page
Archive Collection Web Page
The Archive Collection page allows you to view the contents of archive files stored in the
controller.
To access the Archive Collection page, click on the "Historical Data" category button, then
choose the "Archive Collection" drop-down menu selection.
Archive Collection Parameters
Collect by Name
If the type of controller you are communicating with supports access
to Archive files using the Archive file's name, you can check this
box, and then enter the desired archive file's name in the "File
Name" field. Otherwise, you must access the file through its file
number.
Start from oldest record
If you would like the oldest archive file entries to appear first, select
this option.
Freeze Date/Time
19 Web_BSI Manual
As you scroll through the archive file window, the first column
Page 24

ARCHIVE COLLECTION Web Page
(which may contain date/time stamps) may disappear from the
window as higher numbered columns are brought into the window.
To prevent this, select this option.
File Number
File Name
Stats
Fields Collected
Records Collected
This is the unique ID number for the Archive File you want to view.
To enter the file number, the "Collect by Name" check box must
NOT be selected.
This is the archive file name of the Archive File you want to view.
To enter the archive file name, you must have checked the "Collect
by Name" box.
Displays the number of fields (columns) in the archive file which
have been collected.
Displays the number of records (rows) in the archive file which have
been collected.
Push Buttons and Other Controls
Collect Data
Save Parameters
Click on this button to collect archive data based on your entries in
the "Archive Collection Parameters" section.
This button calls up the Save Parameters dialog box. You can save
the archive data you have viewed into a file on your PC hard disk.
To save the archive data, check the "Save Archive Data" check
box, then enter a filename in the "Filename" field, or choose the
[…] button to locate a path and filename of a file. NOTE: This only
saves a snapshot of the data you have actually viewed on the screen;
it does NOT save the entire archive file. As you scroll to bring new
data on the screen, it will be added to the specified file. If you want
to save an entire Archive File, you should use a tool such as the
OpenBSI Harvester or the Historical Log Storage control.
Web_BSI Manual 20
Page 25

ARCHIVE COLLECTION Web Page
Click on [OK] when finished.
Search Criteria
Floating Point Format
This button calls up the Select Data Collection Criteria dialog box.
This dialog box allows you to filter the archive data which will be
displayed.
"Collect All Available Information" specifies that all archive data
from this archive file should be collected.
"Collect by specified Date" specifies that only archive data with
timestamps between the "Begin Date" and "End Date" entries you
specify should be collected.
"Collect by specified Period" specifies that only archive data
collected during the period you specify should be collected. Choices
are 'Today', 'This Week', or 'This Month'.
Click on [OK] when you have finished selecting the search criteria.
Calls up the Float Format dialog box. In this dialog box, you can
specify the precision with which analog (floating point) values are
displayed.
21 Web_BSI Manual
Page 26

ARCHIVE COLLECTION Web Page
Use the "Width" list box to specify the total number of characters
in the field (including the decimal point) when displaying a floating
point number. This can range from 1 to 15. The default is 12.
Use the "Precision" list box to choose the number of places to the
right of the decimal point which should be displayed. This can range
from 0 to 15. The default is 6.
Use the "Exponent" list box to choose the floating point format 'f',
exponential notation 'e', or choose 'g' to have the Archive Collection
control choose the best fit format.
Click on [OK] when finished.
File Definition
This button displays certain configuration parameters for this
archive file, e.g. number of records. NOTE: These parameters
CANNOT be changed here, they are only displayed.
Web_BSI Manual 22
Page 27

ARRAY COLLECTION Web Page
Array Collection Web Page
The Array Collection Page allows you to view the contents of data arrays stored in the controller.
To access the Array Collection page, click on the "Historical Data" category button, then
choose the "Array Collection" drop-down menu selection.
Array Collection Parameters
Number
Start Row
Type
23 Web_BSI Manual
Enter the number of the array you want to view.
Enter the number of the first row of data in the array you want to
view. This is useful in the case of very large arrays, in which you
want to skip earlier rows, and start with a particular row.
This list box is used to choose the type of array to be viewed (real,
etc.)
Page 28

ARRAY COLLECTION Web Page
Array Info
Rows
Columns
Rows Collected
Read, Read/Write
This displays the total number of rows in this array.
This displays the total number of columns in this array.
This displays the number of rows which have been collected for
display in the current window.
This indicates the array access type. Read means this is a read-only
array; read/write means it is a read/write array.
Push Buttons and Other Controls
Load Array
Save Parameters
Click on this button to view the array specified based on your entries
in the "Array Collection Parameters" section.
This button calls up the Write Array Collection dialog box. You can
save the array data you have viewed into a file on your PC hard
disk.
To save the array data, enter a filename in the "Filename" field, or
choose the […] button to locate a path and filename of a file.
NOTE: This only saves a snapshot of the data you have actually
viewed on the screen; it does NOT save the entire array. As you
scroll to bring new data on the screen, it will be added to the
specified file.
If you want to save the entire array, enter a "Start Row" of 1, and
check the "Collect All" box.
If you want to only save certain rows of the array, make sure
"Collect All" is not selected, and choose a starting row in "Start
Row", and enter the total number of rows (beginning with the
Web_BSI Manual 24
Page 29

ARRAY COLLECTION Web Page
starting row) that you want to store in the "Max # of Rows to
Write" field.
Click on [OK] when finished.
Floating Point Format
Calls up the Float Format dialog box. In this dialog box, you can
specify the precision with which analog (floating point) values are
displayed.
Use the "Width" list box to specify the total number of characters
in the field (including the decimal point) when displaying a floating
point number. This can range from 1 to 15. The default is 12.
Use the "Precision" list box to choose the number of places to the
right of the decimal point which should be displayed. This can range
from 0 to 15. The default is 6.
Use the "Exponent" list box to choose the floating point format 'f',
exponential notation 'e', or choose 'g' to have the Array Collection
control choose the best fit format.
Click on [OK] when finished.
25 Web_BSI Manual
Page 30

ARRAY COLLECTION Web Page
Freeze First Column
View First Column as
Date / Time
Changing Array Values
If desired, you can change the value of individual
elements in the data array. To do so, click on the
element you want to change, enter the new value in
the Change Value dialog box, and click on [OK].
As you scroll through the array window, the first column (which
may contain date/time stamps) may disappear from the window as
higher numbered columns are brought into the window. To prevent
this, select this option.
Depending upon how your data array is configured, it may include a
numerical total used by the system to store the date / time, instead of
the Julian date / time stamp. Use this button to toggle between the
two formats.
Web_BSI Manual 26
Page 31

ARRAY ITEM VIEW Web Page
Array Item View Web Page
The Array Item View page allows the value of a specific array cell to be displayed on the screen.
In order to successfully use this page, you must have already signed on to the controller which
contains the array you want to display.
To access the Array Item page, click on the "Historical Data" category button, then choose the
"Array Item View" drop-down menu selection.
Configuring the Array Item View Control
If a signal has not been configured, already, the Array Item View Control will present a series of
question marks on the screen '?????'.
Right-click on the question marks, and choose "Configure Array" from the pop-up menu. The
Configuration page of the Configure Array dialog box will appear:
NOTE: The Configure Array dialog box contains multiple pages. The dialog box displays the
number of the array you configure in the title bar. To move between the various pages,
click on the tab for that page. Clicking on [OK] in any of the pages will exit the dialog
box, therefore, you should only click on [OK] when you have finished with all of the
necessary pages. Clicking on [Reset] erases your entries, and replaces them with
defaults.
27 Web_BSI Manual
Page 32

ARRAY ITEM VIEW Web Page
Configuration Page
Select the controller from the "Node
Name" list box. Then specify
whether this is an "Analog" or
"Logical" array.
Specify the number of the array in the
"Array Number" field. Then,
identify which cell of the array you
want to display by filling in the
"Array Row" and "Array Column"
fields.
Refresh Rate Page
The Refresh Rate page specifies how
often data will be updated on the
screen for an item of array data.
No Refresh 'No Refresh' means the value will only be presented once, and will not be
updated.
Slow Refresh 'Slow Refresh' means the value will be updated at the slow rate; this varies
depending upon the type of controller, for Network 3000 series nodes this
would be 5 seconds.
Fast Refresh 'Fast Refresh' means the value will be updated at the fast rate; this varies
depending upon the type of controller. The update will be as fast as possible.
NOTE: The default refresh rates are specified in the DATASERV.INI initialization file for
OpenBSI.
Web_BSI Manual 28
Page 33

ARRAY ITEM VIEW Web Page
Display Format Page
The Display Format page allows you to specify how the array data will be presented. The
appearance of the 'Properties' section will vary, somewhat, based on the display format you
choose. You have a choice of three different items which can be displayed. Only ONE of the
three can be selected:
If you want to display the array data as a numerical value, choose "ASCII" as the display
type.
If, you want to depict the array data as a bar graph, choose "Bar Graph"as the display type.
If you want to depict the array data using a pair of bitmaps, choose "Bitmap".
A description of the 'Properties' fields for each possible choice is included, below:
ASCII:
If your chosen display format is "ASCII" you can specify the horizontal and vertical alignment
of the value on the screen. The default is 'Center' for both the horizontal and vertical alignment.
If this array value is a timestamp, you should check the "Show Date Time" box; otherwise the
timestamp will be displayed as a numerical value.
The [Floating Point Format] button calls up a dialog box which lets you specify the number of
decimal places used to present the signal value. This dialog box is shared by many different
controls. See page 91 for details.
29 Web_BSI Manual
Page 34

ARRAY ITEM VIEW Web Page
Bar Graph
If your chosen display type is "Bar Graph" you must enter the "Zero" and "Span" values
which define the range of the array item value.
The "Base Position" determines
the direction in which the bar graph
moves. The default is 'BOTTOM',
which means the "Zero" is at the
bottom of the graph, and the full
"Span" is at the top of the graph.
'TOP' means the "Zero" is at the
top of the graph, and the full
"Span" is at the bottom of the
graph. 'LEFT' means the left edge
of the bar is the "Zero" value for
the graph and the full "Span" is at
the right edge of the bar.
'LEFT' means the left edge of the bar is the "Zero" value for the graph and the full "Span" is at
the right edge of the bar. 'RIGHT' means the right edge of the bar is the "Zero" value for the
graph and the full "Span" is at the left edge.
Bitmap
If your chosen display type is
"Bitmap" use the "ON Bitmap"
[…] push button to specify the
picture (bitmap) to be displayed
when the array value is in its ON
state (logical data) or its non-zero
state (analog data).
Use the "OFF Bitmap" […] push
button to specify the picture
(bitmap) to be displayed when the
array value is in its OFF state
(logical data) or is zero (analog
data).
Web_BSI Manual 30
Page 35

ARRAY ITEM VIEW Web Page
General Page
The General page sets various colors and properties.
The "Text Display Colors" section
allows you to specify the colors in
which the array value will be
presented. The "Text" color is only
used when "ASCII" is chosen as the
Display type on the Display Format
page. The "Background" color
specifies the background color of the
text, or if "Bar Graph" is chosen as
the Display type on the Display
Format page, the background color
behind the bar of the bar graph.
The "Bar Fill" specifies the color of the bar graph when the array value is in the normal range.
The Border"Visible" selection allows you to specify whether or not a box should appear
surrounding the area where the array data will be presented. You can also specify the "Width"
and "Color" of the border.
Changing the Value of an Array Item (through a dialog box)
Right-click on the value, and choose "Change
Array Value" from the pop-up menu. The Change
Value dialog box will appear.
For analog values, enter the new value, in the
"New Value" field and click on [OK].
For logical signals, either choose the new state of
the array value, or use the [Toggle Value] button
to choose the new state, then click on [OK].
31 Web_BSI Manual
Page 36

ARRAY ITEM VIEW Web Page
Changing the Value of an Array Item (in-line edit) (OpenBSI 5.8 and newer)
An alternative to changing the value in a dialog box is to
click on the array value. This opens an in-line change
box around the value. You can then type in the new
value and press the [Enter] key on the keyboard to send
the new value to the array in the RTU. To exit the in-
line change box, press the escape key [Esc].
Verifying That Communications Are Possible to the Array
Right-click on the array value, and choose "Show Array Status" from the pop-up menu. The
Array Status dialog box will appear. 'Success' will be displayed if the signal can be accessed;
otherwise an error message will appear. Click on [OK] to exit the dialog box.
Web_BSI Manual 32
Page 37

AUDIT COLLECTION Web Page
Audit Collection Web Page
The Audit Collection Page allows you to view the contents of the alarm and event buffers in the
controller.
To access the Audit Collection page, click on the "Historical Data" category button, then
choose the "Audit Collection" drop-down menu selection.
NOTE: Any audit entries which have already been collected from a controller via the Historical
Log Storage control, or the OpenBSI Harvester, will NOT be accessible through the Audit
Collection web page.
Push Buttons and Other Controls
Collect Data
Click on this button to collect audit data based on your entries in
the Data Storage Parameters and Search Criteria dialog boxes.
Data Storage
Click on this button to call up the Data Storage Parameters dialog
boxes.
You can save the audit data you have viewed into a file on your PC
hard disk.
33 Web_BSI Manual
Page 38

AUDIT COLLECTION Web Page
To save a snapshot of the audit data, first, select the “Store Data
on Collection” option.
Storage Parameters:
Next, enter a filename in the "File" field, or choose the […] button
to specify a path and filename of the snapshot file. If you are
creating an all-new file, choose "Create File"; if you are
appending to an existing file, choose "Append File".
Choose a format for the way the audit data entries will be separated
in the snapshot file using the "Data Delimiter" field. Choices
include a space, comma, or semi-colon.
Selecting the “Convert Data to Extended Format” option stores a
longer version of the audit data.
NOTE: This only saves a snapshot of the data you have actually
viewed on the screen; it does NOT save the entire contents of the
audit buffers. As you scroll to bring new data on the screen, it will
be added to the specified file. If you want to save ALL Audit data,
you should use a tool such as the OpenBSI Harvester or the
Historical Log Storage control.
Click on [OK] when finished.
Web_BSI Manual 34
Page 39

AUDIT COLLECTION Web Page
Search Criteria
This dialog box allows you to filter the audit data which will be
displayed.
Records:
“Both Alarms & Events” specifies that both alarm and event data
will be displayed
“Events Only” specifies that only event data will be displayed.
“Alarms Only” specifies that only alarms will be displayed.
Search Method:
"Collect All Available Records" specifies that all audit data from
this alarm and event buffer should be collected.
"Start Date" specifies that only audit data with timestamps newer
than the date you specify should be collected.
"Specified Period:" specifies that only audit data collected during
the period you specify should be collected. Choices are 'Today',
'This Week', or 'This Month'.
Click on [OK] when you have finished selecting the search criteria.
Total # of Records
Collected
This displays the total number of audit records collected by the
Audit Collection control for the current window.
uffer Usage Web Page (Network 3000)
35 Web_BSI Manual
Page 40

BUFFER USAGE Web Page (Network 3000)
Communication buffers are pre-allocated portions of memory, in the Network 3000-series
controller, that are used to hold communication input / output (I/O) messages. The system
automatically allocates a certain number of buffers. The total number of additional buffers is
defined, by the user, in the *COMMUNICATIONS section of the ACCOL source file.
Information on how many communication buffers are in use, at a given time, is presented on the
Buffer Usage Statistics Page.
To access the Buffer Usage Statistics page, click on the "Statistics" category button, then
choose the "Buffer Usage" drop-down menu selection.
The fields on the page represent a snapshot of the current buffer usage in the controller:
Total Buffers
Allocated
Total Buffers Used
Up Buffers Used,
Down Buffers Used,
Generic Buffers Used
Min, Max The "Min" and "Max" values represent the minimum and maximum
Tasks Waiting for
Buffer
represents the total number of communication I/O buffers in the
controller. This value can only be altered by editing the
*COMMUNICATIONS section of the ACCOL source file, and redownloading the unit.
represents the total number of buffers currently in use.
Each of the buffers currently being used is either an "Up Buffer", a
"Down Buffer", or a "Generic Buffer".
number of buffers which have been used since the last time the
controller was downloaded, or the counts were reset using the [Reset]
push button.
represents the number of tasks which are waiting for buffers to be
freed-up for their use.
Web_BSI Manual 36
Page 41

BUFFER USAGE Web Page (Network 3000)
Indications of Buffer Shortages
If the "Total Buffers Used" is consistently close to the "Total Buffers Allocated" value, there
are probably not enough buffers allocated.
Similarly, if the "Task Waiting for Buffers" is frequently a non-zero value, more buffers may
need to be allocated.
Edit the number of Communication I/O Buffers defined in the *COMMUNICATIONS section
of the ACCOL Load, and re-download the Network 3000 unit.
Resetting the Min, Max Counts
The count of the "Min" and "Max" buffers used can be reset to 0 by clicking on the [Reset] push
button. You must be signed on with sufficient security privileges in order to perform the reset.
37 Web_BSI Manual
Page 42

CRASH BLOCKS Web Page
Crash Blocks Web Page
A crash block is an area of memory in the controller which retains a 'snapshot' of the state of the
unit immediately prior to a system failure. This information can be used by Emerson Application
Support and/or Development personnel to help diagnose the cause of the failure. NOTE: Not all
failures result in useable crash block information.
To access the Crash Block Statistics page, click on the "Statistics" category button, then choose
the "Crash Blocks" drop-down menu selection.
The contents of the crash block should be recorded and provided to Emerson personnel for
analysis. (You can copy the screen to the Windows™ Clipboard by the Windows™
[Alt][Printscreen] command, and then paste it into another document, which can then be
printed.) Once this has been done, all five of the crash blocks can be cleared (by clicking on the
[Reset] push button) to allow any new crash information to be captured.
Web_BSI Manual 38
Page 43
CUSTOM PROM INFO Web Page (Network 3000)
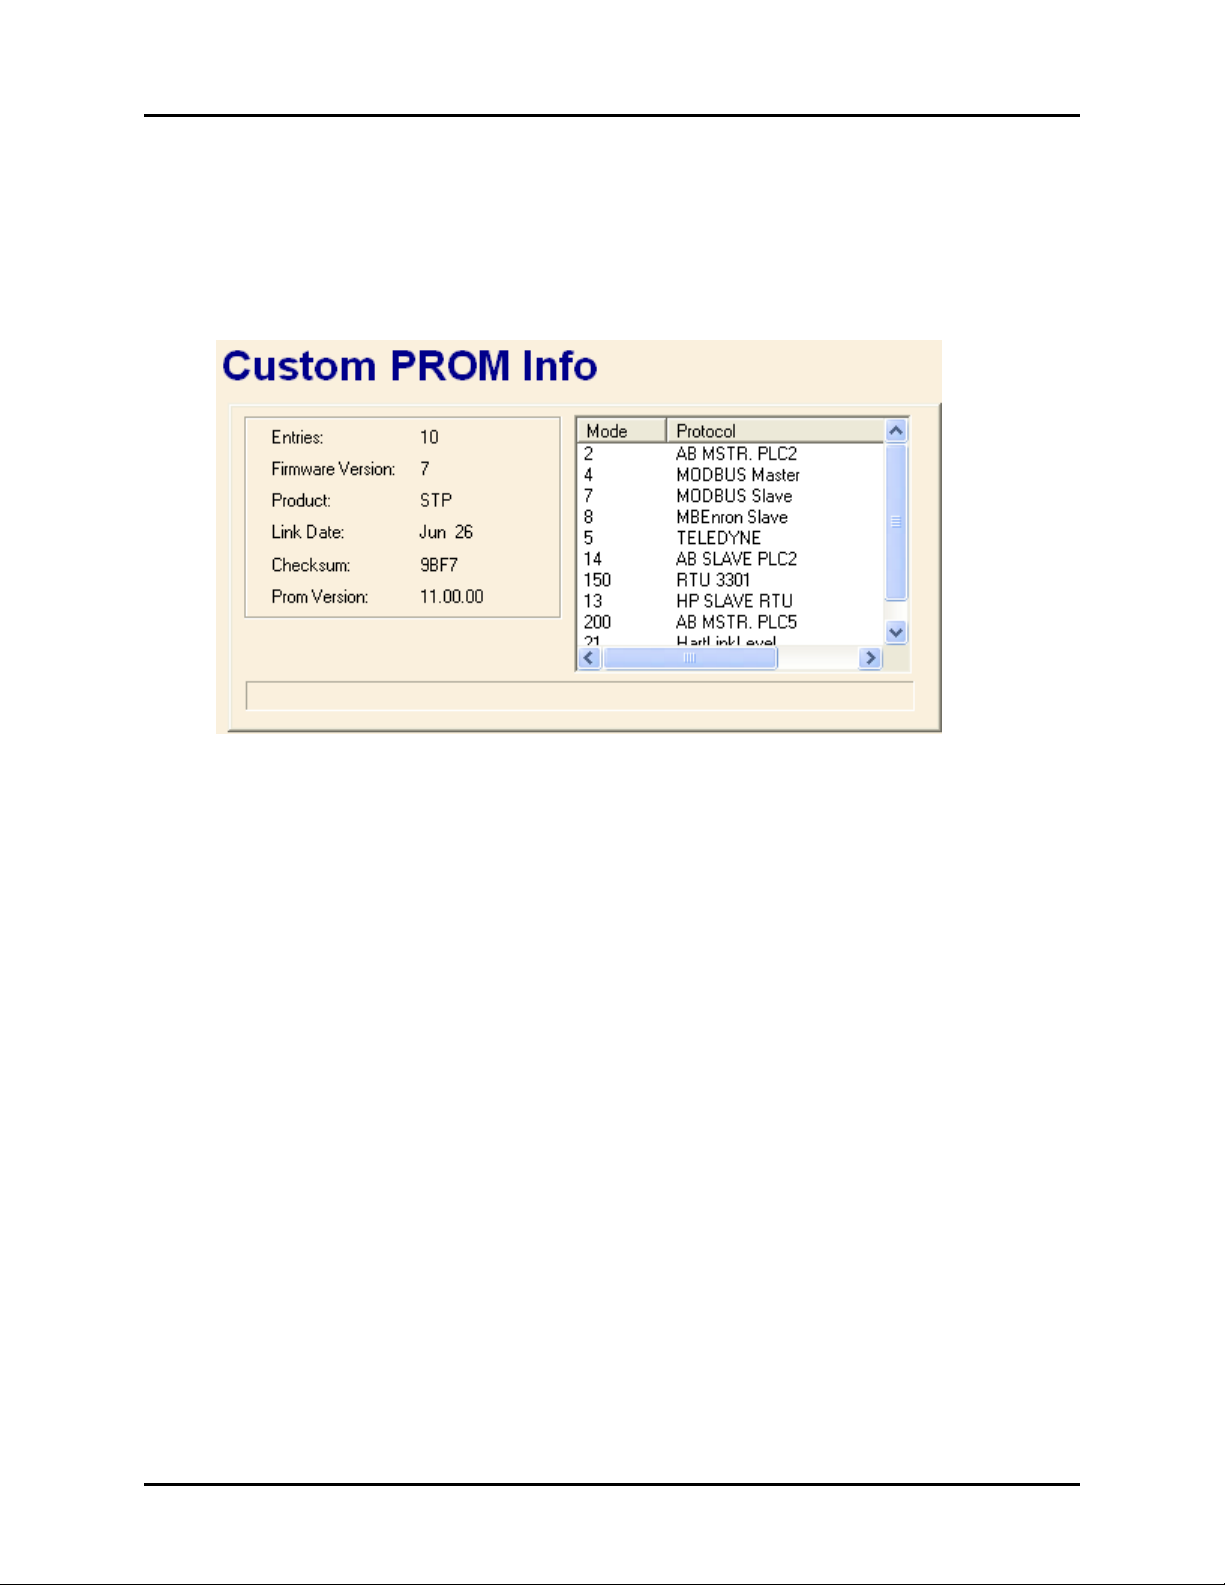
Custom PROM INFO Web Page (Network 3000)
The Custom PROM Statistics Page displays the contents of the Custom PROM area.
To access the Custom PROM Statistics page, click on the "Statistics" category button, then
choose the "Custom Prom" drop-down menu selection.
The window displays, in abbreviated form, the name of each custom communication "Protocol"
which is installed in the custom area of the controller. The number of protocols installed appears
in the "Entries" field. Use the scroll bar to view entries which do not fit in the window. The
"Mode" value is the number which must be entered in the ACCOL Custom Module to designate
which protocol is to be used. Users can find the mode values for the most popular protocols, and
configuration information for those protocols, in the ACCOL II Custom Protocols Manual
(document# D4066).
"Product" is an identification string for the custom firmware, as specified in the Custom PROM
area. 'PCP' is the proper identification string for custom firmware.
"Firmware Version" provides information about the type of custom firmware, and is typically
one of the following values:
3 firmware is 186-based pre-version AE.00
5 firmware is 186-based, version AE.00 through AJ.10
7 firmware is 186-based AK or newer or 386EX Real Mode
8 firmware is 386EX Protected Mode
"Link Date" and "Checksum" are the firmware link date and data checksum value. This
information can be used by Emerson personnel to verify PROM revision information.
"Prom Version" version is encoded as:
39 Web_BSI Manual
Page 44

CUSTOM PROM INFO Web Page (Network 3000)
aa.bb.cc
where: 'aa' is the firmware version
'bb' is the update revision
'cc' indicates the beta revision
for example PCP00 with no updates or beta revisions would appear as 00.00.00.
Web_BSI Manual 40
Page 45
FILE TRANSFER Web Page
File Transfer web page
The File Transfer web page allows user files (web pages, initialization files, etc.) to be
transferred to and from the ControlWave’s FLASH memory area. NOTE: This utility is NOT
intended for downloading the ControlWave project itself, since that goes to a different area of
memory.
This control is available in OpenBSI 5.6 Service Pack 1 (and newer).
To access the File Transfer web page, choose the “Misc” category button, and then select either
“File Upload” or “File Download”.
File Download mode transfers files from the PC to the ControlWave. File Upload mode transfers
files from the ControlWave to a specified location on the PC.
The fields are as follows:
PC File Location
In Download mode, this is the path, and filename of the file on the PC to
be downloaded to the ControlWave. In Upload mode, this is the
destination path on the PC where the file uploaded from the
ControlWave will be sent. If not set, the default OpenBSI installation
directory will be used as the location. The [Browse] button may be used
to specify the location.
41 Web_BSI Manual
Page 46

FILE TRANSFER Web Page
Device Filename
(Upload Mode ONLY)
[Start]
This is the name of the file to be transferred from the ControlWave to
the PC. Only one file can be transferred at a time.
This starts the file transfer.
[Stop]
This aborts the file transfer. If sending to the ControlWave, any partial
file transferred will be automatically deleted from its destination. If
sending to the PC, any partial file will remain.
Once you have initiated a file transfer you must stay on the File Transfer page until the
transfer completes successfully. If, instead, you go to a different page before successful
completion, the transfer will be automatically aborted, and you will be prevented from
transferring that file again because it will be locked for 10 minutes.
IMPORTANT
Downloading a File from the PC to the ControlWave’s FLASH Memory
Choose “File Download” from the “Misc” item in the menu.
Use the [Browse] button to specify the path and name of the file you want to download, or type
it in directly in the “PC File Location” field.
Click on [Start] and the file will be sent to the ControlWave. The status bar will indicate when
the transfer has completed.
Uploading a File from the ControlWave’s FLASH Memory to the PC
Choose “File Upload” from the “Misc” item in the menu.
Specify the name of the file you want to transfer in the “Device Filename” field.
Specify the path on the PC where you want the file to be sent in the “PC File Location” field.
Use the [Browse] button to do this, if desired. If nothing is specified, the default OpenBSI
installation directory will be used. NOTE: If you want the destination file to have a different
name, specify the new filename at the end of the path statement, e.g:
C:\MYFILES\NEWNAME.TXT
Click on [Start] and the file will be sent from the ControlWave to the specified directory on the
PC. The status bar will indicate when the transfer has completed.
Web_BSI Manual 42
Page 47

HISTORICAL LOG STORAGE Web Page
Some of our products maintain logs which may be accessed by the user. They can be stored in
files on the PC using the Historical Log Storage page. Data for these logs is extracted from the
Archive, Audit, and List files.
istorical Log Storage Web page
Storage Folder
Log selection
window
This is the directory on the PC where the log files will be stored. This
directory must exist.
The window in the center of the page displays details of the available data
in the RTU which can be used to create log files. Included are the "Type"
of data (audit, archive, list), a "Description" of the data, a "Log Number"
which identifies the archive file number or list number (not applicable to
audit), and an "Extension" which shows the file extension which will be
used for the log file.
This window is also used to specify which logs you want to collect, view, or
convert to CSV. To select a log, click on it. You can select multiple logs for
collection by holding down the [Ctrl] key as you select. Once you have
selected the logs, you can start the collection by clicking on [Start
Collection]. The view and convert options can only be used on one log at a
time.
43 Web_BSI Manual
Page 48

HISTORICAL LOG STORAGE Web Page
Click on a line to select a log
[Start Collection]
[Stop Collection]
[View Storage]
[Convert to
CSV]
Status box
This is the
archive file
number
When clicked will start collections of all selected logs. This button is
disabled if collections are already in progress.
When clicked, will terminate all underway collections. Note: This can result
in incomplete data being stored in log files.
When clicked, will display the contents of the currently selected log file in a
separate window on the screen.
When clicked, will generate a comma separated variable (CSV) file, from
the contents of the currently selected log file(s). To select more than one log
file, hold down the [Ctrl] key (OpenBSI 5.8 and newer). This file will be
created in the folder specified in the “Storage Folder” field. The filename
will be the original file basename, followed by an underscore, followed by
the original file extension, then (.CSV) for the extension. For example, the
CSV file generated from the log file DAILY.DLY would be named
DAILY_DLY.CSV.
This displays error and status information about collections. The most
recent error/status message appears, however, you can scroll down to view
previous messages.
This is the file extension
which will be used for the
log file
Web_BSI Manual 44
Page 49

IP STATISTICS Web Page
IP Statistics Web Page
The Internet Protocol (IP) Statistics Window displays information on IP communication activity.
NOTE
Much of this information is not of interest to typical users. Advanced users,
however, who are attempting to implement non-standard IP network
configurations, may find this information useful.
To access the IP Statistics page, click on the "Statistics" category button, then choose the "IP
Statistics" drop-down menu selection.
IP statistics are divided up into categories because IP communications involves several different
inter-related communication protocols. All of these protocols must function together properly in
order for data to be transferred through the network intact.
The "Selected Protocol" list box allows you to choose which portion of the IP statistics you
would like to access.
Users can reset all Internet Protocol statistics by clicking on the [Reset All] push button.
The various categories of statistics are described, below:
45 Web_BSI Manual
Page 50

IP STATISTICS Web Page
IP Statistics Decription
IP stands for Internet Protocol; it is a specification which defines the most basic packets of
information transported in a TCP/IP network. IP provides addressing and packet routing
mechanisms. The statistics maintained are as follows:
Packets Received
Received with Header
Error
Received with invalid IP
Address
Packets Forwarded
Received with invalid
protocol
Packets delivered
to stack
Packet send attempts
Send Packets
discarded
Send Packets
(No Route)
Packet Fragments
received
Packets assembled from
fragments
Reassembly of packet
Number of data packets received from the Data Link. Invalid
packets and packets destined for 'pass-thru' are included in this
count. Not counted are packets discarded by the data link due to
checksums or length checks performed at that layer.
Discards due to header errors: these include invalid IP data length,
invalid IP version, and IP header checksum errors.
Number of times which a packet was received which is not for the
current RTU and the current RTU does not know how to route the
packet to the contained address.
Number of receive packets not for the current RTU, which have
been forwarded to another machine for processing.
Discards due to an unrecognized protocol code in the header.
Number of packets properly received, and sent on to be processed by
a protocol handler.
Number of packets which the IP layer has been asked to send. This
includes discards. Note: This count does not include send attempts
which are discarded by UDP or other higher-level layers.
Packets discarded due to badly formed packets (length errors, bad
destination, etc.)
Packets discarded because there is no known route to the destination
address. Also, increments the `discarded' statistic.
A data link does not support sending of an entire large packet in one
section; therefore, the source machine has broken it into fragments.
This is the total number of these fragments received.
The number of packets which have been put together from
fragments.
The number of times a packet has been discarded due to not
Web_BSI Manual 46
Page 51

IP STATISTICS Web Page
failed
receiving all of its fragments within the allotted time.
Send Packet
fragmented OK
A data link on the current RTU cannot support sending of full-size
packets. This is the number of packets which have been split into
fragments for sending.
Failed to get packet for
fragment
The number of times which a packet has been discarded due to the
IP layer not being able to allocate a send packet for the fragment.
Number of send
fragments
The number of packet fragments which have been sent out a datalink.
Default time to live
The number of "hops" (sends over data links) a packet can have
before it is discarded. This is not a statistic; but, a display of the
default value used by this RTU.
Timeout for packet
reassembly
The time between the arrival of the first fragment of a packet to
when all fragments must arrive. If the fragments all do not arrive,
the fragments are discarded. This is not a statistic; but, a display of
the default value used by this RTU.
ICMP Statistics Description
ICMP is a low-level IP protocol which performs notification of communication events. The
statistics defined are:
Packets received
Protocol packets received. This includes discards.
Receive packets
discarded
Packets discarded due to length error, ICMP checksum, or invalid
request type.
Destination unreachable
packet received
Notifications of the following: A packet was sent from this RTU to a
destination (either IP address or Protocol Port) which could not be
reached.
Time to Live Exceeded
packet received
Notifications of the following: A packet was sent from this RTU
which was transmitted over too many data links on the way to its
destination (and was discarded).
Redirect packets
received
Requests received to modify internal routing information based on a
routing machine determining a better path for a previously sent
message.
Echo Request packets
PING requests received. PING is a program which sends a simple
47 Web_BSI Manual
Page 52

IP STATISTICS Web Page
received
Echo Reply packets
received
Time stamp request
packet received
Packets Sent
Out packets discarded
Destination unreachable
packets sent
Time to live exceeded
packets sent
Redirect packets sent
Echo request packets
sent
Echo reply packets sent
UDP Statistics Description
UDP stands for User Datagram Protocol - A method of transmitting user data from one Protocol
Port on a computer to another (either on the same or another computer). UDP provides a
checksum on the data sent; but, does not guarantee delivery. UDP is connectionless, there is no
need to establish a connection before sending data.
Statistics available are as follows:
Packets received
Port not present
Receive packet discarded
ECHO packet to another IP machine to determine if communications
is possible.
Number of replies received to `PING' requests made by this RTU.
Requests for timestamp received. Note: This is not the RTU timesynch request.
Total ICMP packets sent. Does not include discards.
Message discarded due to not being able to allocate send packet.
A packet could not be delivered or forwarded. A notification was
sent back to the originator of the packet.
When forwarding a packet, its time-to-live count was exhausted; a
notification was sent back to the originator of the packet.
When forwarding a packet out the same line it was received over, a
notification is sent back to the originating node that a better path is
available.
PING requests sent by this RTU.
PING responses sent by this RTU.
Packets received and processed. Does not include discards.
A packet was discarded because it was destined for an undefined
Port. An ICMP error packet is returned.
Packets discarded due to header or checksum errors.
Web_BSI Manual 48
Page 53

IP STATISTICS Web Page
Packets sent
Packets sent to IP layer for processing.
IBP Statistics Description
IBP stands for Internet Bristol Protocol. It is the protocol used inside UDP packets to perform
reliable data communication between OpenBSI workstations and ControlWave/Network 3000 IP
RTUs. This communication method allows both detection and retry of missed packets, and
proper ordering of requests. In addition, multiple request (sub-packets) can be combined into a
single network packet.
The statistics defined are:
No connection available
Number of packets dropped due to not being able to find an inactive
connection.
Total discards based
on mult ACK tmo
The number of packets discarded due to exceeding the ACK timeout
limit.
ACK timeouts
The number of times that an ACK for a packet was not received
within the timeout
Discarded by purge
operations
Packets discarded due to connection inactivity.
Discarded due to quota
Packets discarded at the RTU due to a shortage of available network
packets.
Discarded due to
sequence #
Packets discarded due to sequence #s which were not in the proper
range. Note: This can include packets which were re-sent due to
timeout, but already received.
Invalid form or packet
Invalid identifier for
sub-packet
Packets received with an invalid header length.
Number of sub-packets detected with invalid type code.
Packets received out-oforder
The number of packets which were received out of sequence (and
thus loaded onto the out-of-order list). Items are removed from the
list when the preceding packets are received.
Packets accepted
The number of IBP packets accepted for processing.
49 Web_BSI Manual
Page 54

IP STATISTICS Web Page
Packets sent
Restart connection
Errors attempting to
send packet
Sub-packets received
Sub-packets sent
The number of IBP packets given to the IP stack for send.
Number of times an IBP packet was received which indicated that
the local sequence number should be reset.
The number of times the IP stack issued an error while trying to send
a packet
Number of IBP sub-packets received from IP stack.
Number of IBP sub-packets given to IP stack for sending.
Web_BSI Manual 50
Page 55
NODE LOCATOR Web Page
Node Locator Web Page
The Locator page is used to identify which controller(s) you would like to communicate with,
from this PC. The controllers can be identified either by loading proxy files, or by loading
OpenBSI information. In either case, they will be displayed as icons in a tree on the left side of
the page.
IMPORTANT:
You will need to run the Node Locator page the first time you use the web pages to identify
nodes. After that, you should not need to use it again, unless you are communicating with
different nodes, or if your network configuration has changed.
The Node Locator Page is accessible by clicking on the "Security" category button and
choosing the "Locate Nodes" drop-down menu selection.
Network Host Address
Displays the primary IP address of the Network Host PC (NHP).
Click on the icon for the Network Host PC in the tree at left, if the
address is not visible.
[Load Proxy File Info]
Loads all proxy files (.PXY) from the specified directory. These files
identify those controllers (RTUs) to which this PC should have
access. NOTE: Proxy files are created through the "Proxy Export"
feature in NetView. See 'Creating and Exporting A Proxy File' in
Chapter 6 of the OpenBSI Utilities Manual (document# D5081).
[Load OpenBSI Info]
Loads information about accessible controllers from the OpenBSI
NETDEF database. NOTE: This button is inaccessible if a proxy file
51 Web_BSI Manual
Page 56

NODE LOCATOR Web Page
has already been loaded.
[Delete Selected]
[Reset RTU Info] Deletes the entire tree. This allows you to re-define the accessible
Deletes the currently selected RTU from the tree, thereby eliminating
access to that RTU from this PC.
RTUs, either by loading a proxy file, or loading OpenBSI
information.
Web_BSI Manual 52
Page 57

NODE ROUTING TABLE Web Page
Node Routing Table Web Page
The Node Routing Table is generated by the NetView software, and specifies the addresses of
each node in the network. This information is essential for network communications to function.
Each node in the network holds a unique copy of the Node Routing Table, which has been
specifically modified for that node. The Node Routing Table Window presents details on the
Node Routing Table residing in this controller including the current node's global address,
version number, as well as up/down routing information for global messages.
To access the Node Routing Table Statistics Page, click on the "Statistics" category button, then
choose the "NRT Table" drop-down menu selection.
The global address of this controller (node) appears in the "GLAD" field. The level of the node
appears in the "Current Level" field.
The remaining information in the window may be useful to Emerson support personnel when
trouble-shooting network communication problems at a particular customer site.
53 Web_BSI Manual
Page 58

PORT SUMMARY STATISTICS Web Page
Port Summary Statistics Web Page
Information on the communication ports of a controller can be viewed on the Port Summary
Statistics page.
To access the Port Summary Statistics page click on the "Statistics" category button, then
choose the "Port Summary" drop-down menu selection.
The fields are described, below:
Port
is the name of the port. If a particular port has not been configured, it will not appear
on the Port Summary Statistics page. NOTE: For ControlWave-series users, unused
ports will be displayed as ‘BSAP Slave’, since unused ports default to that type.
Protocol
is the type of port configuration. For ports configured with a Custom Protocol, the
name 'Custom' appears, followed by the mode value for the particular type of custom
2
protocol.
MsgSent
is the total number of messages sent out through this port. Note: Not all port types
maintain this statistic. If they do not, the value will remain 0.
2
Information on the most popular custom protocols, used with Network 3000-series controllers, and the mode
values which identify them, are included in the ACCOL II Custom Protocols Manual (document# D4066).
Currently, ControlWave only supports MODBUS custom protocols.
Web_BSI Manual 54
Page 59

PORT SUMMARY STATISTICS Web Page
MsgRcv
is the total number of messages received through this port. Note: Not all port types
maintain this statistic. If they do not, the value will remain 0.
The send and receive counts can be reset, for all ports in the page, by clicking on the [Reset]
push button.
Port Detail Statistics
For more detailed information on a particular port, click on the name of the port, and the Port
Detail Statistics Window will appear. Information appearing in this window varies depending
upon what type of port is defined.
The Port Detail Statistics Window is divided into two parts. The top part of the window displays
statistics about the messages going through the port. These statistics may be reset by clicking on
the [Reset] push button (users must be signed on with sufficient security to perform the reset.)
The bottom part of the window displays port characteristics, such as the baud rate.
The pages that follow describe the statistics maintained for the various port types.
55 Web_BSI Manual
Page 60

PORT SUMMARY STATISTICS Web Page
Master/Expanded Addressing Master Port Statistics
Messages Sent
Messages Received
Response Timeouts
Consecutive Response
Timeouts
NAKs Received
CRC Errors
Message Discarded
ACKs Received
Protocol Errors,
Overflow Errors, Serial
Number Errors
is the total number of messages sent out through this port.
is the total number of messages received through this port.
A message or poll was sent to a slave but no response was received
within the timeout period. The #NDARRAY should be used to
eliminate polling of any nonexistent nodes.
This problem is similar to response timeouts (see above), however,
if this number is larger than the number of slaves on the line, the line
has failed.
A message from the master node is NAKed if it must be discarded
because a buffer is not available. Increasing the number of buffers
may help. Ensure that the master's poll period is set appropriately for
maximum throughput.
A message was received with correct framing; however, it failed the
CRC check and was discarded. Usually this is due to noise on the
line. The message is not lost; the slave will repeat the message
because it did not receive an ACK.
A message which is received by the slave but whose ACK is not
received by the master is retransmitted by the master. The slave
discards the duplicate message and advises the master by issuing an
'ACK, msg discarded' response. This is commonly caused by noise
on the line.
These are miscellaneous problems usually caused by noise on the
line.
Slave, Pseudo-Slave, Pseudo-Slave with Alarms, Serial CFE or VSAT Slave Port
Statistics
Messages Sent
Messages Received
Messages Aborted for
Transmit Queue
Web_BSI Manual 56
is the total number of messages sent out through this port.
is the total number of messages received through this port.
When the poll period for the slave line expires without reception of a
poll message from the master, messages queued to the slave port are
Page 61

PORT SUMMARY STATISTICS Web Page
discarded in order to free up buffers. The slave port's poll period
setting should be 1.5 to 3 times the poll period for the master node
on this line to avoid unnecessary errors of this type.
NAKS issued
Message Discarded
ACKs Issued
RIOR Master Port Statistics (Network 3000 ONLY)
RIO 3331 Remote I/O Racks (RIOR) may only be used with DPC 3330, DPC 3335, or RTU
3310 units which support synchronous communication, and have AD or newer firmware.
When viewing the Port Detail Statistics for an RIOR Master Port, a 'transaction' refers to a
message sequence in which the RIOR master node transmits a data request (or other message) to
the RIO 3331, for which it expects an appropriate response. A 'transaction attempt' typically
consists of 1 to 3 tries to complete a single transaction. A 'successful completion' means the
transaction attempt was successful - i.e. the RIOR master node was responded to with a valid
data message. In cases where the number of transaction attempts is greater than the number of
successful completions, then errors have occurred which will be reflected in the error counts on
the display.
The other statistics are:
CRC Events
CRC Errors
A message from the master node is NAKed if it must be discarded
because a buffer is not available. Increasing the number of buffers
may help. Ensure that the master's poll period is set appropriately for
maximum throughput.
A message which is received by the slave but whose ACK is not
received by the master is retransmitted by the master. The slave
discards the duplicate message and advises the master by issuing an
'ACK, msg discarded' response. This is commonly caused by noise
on the line.
A message received has failed its CRC check. This is usually due to
noise on the line. "CRC Events" indicates the number of tries that
have been made to complete a single message transaction which
failed on the CRC check. Up to three tries will be made to complete a
single transaction for any particular message. If three CRC events
occur for any particular message, the CRC Errors count will be
increased by 1, and the Transaction Attempts count will also be
increased by 1.
The CRC check has failed on three occasions to complete a
transaction (for a particular message) and so that message must be
discarded. Usually this occurs because of noise on the line. When an
57 Web_BSI Manual
Page 62

PORT SUMMARY STATISTICS Web Page
error such as this occurs, the transaction attempt was unsuccessful.
Overflow Events
Overflow Errors
Timeout Events
Timeout Errors
Data is arriving at the RIOR master node faster than it can be
processed. "Overflow Events" indicates the number of tries made to
complete a message transaction which failed because of an overflow.
If three such events occur for a message, the Overflow Errors count
will be increased by 1, and the Transaction Attempts count will also
be increased by 1.
An Overflow Event has occurred on three tries to complete a
particular message transaction. That message must be discarded. This
condition is almost always caused by a hardware failure in the RIOR
master node. When an error such as this occurs, the transaction
attempt was unsuccessful.
The RIOR master node has transmitted a data request (or other
message) to an RIO 3331 node, and a response has not been received
within the specified timeout period. This can be caused by many
things - the 3331 node is not powered on, the communication line has
been unplugged, noise on the line, etc. Depending upon the number
of Timeout Events which occur for any particular message, a Timeout
Error may be generated, which causes the Transaction Attempts
count to increase by 1, and the Timeout Errors count to be increased
by 1.
Unsuccessful tries (referred to as Timeout Events) have been made to
complete a message transaction with an RIO 3331 Remote I/O Rack.
This can be caused by many things - the 3331 node is not powered
on, the communication line has been unplugged, noise on the line,
etc. The number of Timeout Events which generate a Timeout Error
varies depending on the circumstances. If an RIO 3331 node has been
unresponsive on several previous transaction attempts, a single
Timeout Event at the start of a transaction will cause the transaction
attempt to be abandoned without retries. This will cause a Timeout
Error to be generated, and increase the Timeout Errors count by 1,
and the Transaction Attempts count by 1. If the RIO 3331 node is
only occasionally unresponsive, retries will be made after a single
Timeout Event, and up to three Timeout Events can occur before the
Timeout Errors count will be increased and the Transaction Attempts
count increased. In either case, a timeout error indicates the
transaction attempt was not completed successfully.
Web_BSI Manual 58
Page 63

PORT SUMMARY STATISTICS Web Page
RIOR Slave Port Statistics (Network 3000 ONLY)
RIO 3331 Remote I/O Racks (RIOR) may only be used with DPC 3330, DPC 3335, or RTU
3310 units which support synchronous communication, and have AD or newer firmware.
RIOR Slave Port statistics are only available when the OpenBSI Workstation is plugged in
locally to Port A of the RIO 3331.
The statistics are:
Configuration
Messages Received
Data Request Messages
Received
Set Output Messages
Received
Set PDM Data
Messages Received
Set PDO Pulses
Messages Received
Messages with
Communications
Errors
Invalid Messages
Heartbeat Timeouts
Typically this number should be 1, since configuration messages are
only sent when communication starts up.
This is a normal communication transaction.
This is a normal communication transaction for RIO 3331 nodes
having outputs.
This is a normal communication transaction for RIO 3331 nodes
having pulse duration modulation inputs.
This is a normal communication transaction for RIO 3331 nodes
having pulse duration outputs.
A message could not be successfully received due to a CRC check
failure (typically caused by noise on the line), an overflow error or
some other unspecified problem.
An unrecognizable message was received and discarded. This could
be caused by noise on the line.
The RIO 3331 has not heard the once per second heartbeat (data
request) from the 3310/3330/3335 RIOR master node.
59 Web_BSI Manual
Page 64

PORT SUMMARY STATISTICS Web Page
LIU Master Port Statistics (Network 3000 – CFE 3385 / UCS 3380 ONLY)
NOTE: LIU Master Ports are ONLY available on the Auxiliary Ports (Aux 1 and Aux 2) of a
CFE 3385 or UCS 3380 unit.
Timeouts due to No
Ack
Consecutive Response
Timeouts
Poll Timeout Errors
Frame Check Errors
Transmit Underruns
Transmit Link 1
Errors
Transmit Link 2
Errors
Receive Overruns
Receive Aborts
Receive Buffer
Overflows
Receive Link 1 Errors
A message was sent to a slave but the automatic ACK generated by
the LIU hardware was not received. The target node may have lost
power or been disconnected from the network.
This problem is similar to the preceding case, however, if this number
is larger than the number of slaves on the line, the line has failed.
The target node generated an automatic hardware ACK on reception
of a poll (i.e., it exists and is powered up), but it did not generate a
response. Target node probably requires a download.
A message was received which failed a consistency check which uses
a CRC code. Usually this is due to a loose connector or noise on the
line (arc welder nearby, etc.).
A data byte was not available quickly enough. Typically this is a
problem with the LIU hardware.
The LIU found a difference between the information it was
attempting to transmit and the information it actually transmitted.
Typically this is a problem with the LIU or modem hardware.
This is similar to the preceding error, but affects the alternate link's
hardware in a system which uses dual redundant communications
hardware.
A data byte was received before the hardware was ready to accept it.
Since all data transfers are via DMA, this is a hardware error.
A message abort request was detected. Usually this is due to noise;
BSAP devices never deliberately transmit an abort.
More data was received than would fit in the buffer supplied. Usually
this is due to noise on the line.
Carrier detect was present on link 2 but not on link 1. This will cause
failover of communications to the alternate link. This may be a bad
transmitter (this error will then occur at all nodes with which it
communicates) or due to a bad receiver.
Web_BSI Manual 60
Page 65

PORT SUMMARY STATISTICS Web Page
Receive Link 2 Errors
LIU Slave Port Statistics (Network 3000 – CFE 3385, UCS 3380 ONLY)
NOTE: LIU Slave Ports are ONLY available on the Auxiliary Ports (Aux 1 and Aux 2) of a CFE
3385 or UCS 3380 unit.
Messages Aborted for
Transmit Queue
Transmit Underruns
No Acknowledges
Transmit Link 1 Errors
Transmit Link 2 Errors
Receive Frame Check
Errors
Receive Overruns
Receive Aborts
Receive Buffer
Overflows
Receive Link 1 Errors
Carrier detect was present on link 1 but not on link 2. This is similar
to the preceding error, but for the alternate link.
When the poll period for the slave line expires without reception of a
poll message from the master, messages queued to the slave port are
discarded in order to free up buffers. The slave port's poll period
setting should be 1.5 to 3 times the poll period for the master node
on this line to avoid errors of this type.
A data byte was not available quickly enough. Typically this is a
problem with the LIU hardware.
A message was sent to a slave but was not acknowledged by the
slave. The target node may be off line or it may be out of buffers.
The LIU found a difference between the information it was
attempting to transmit and the information it actually transmitted.
Typically this is a problem with the LIU or modem hardware.
This is similar to the preceding error, but affects the alternate link's
hardware in a system which uses dual redundant communications
hardware.
A message was received which failed a consistency check which
uses a CRC code. Usually this is due to a loose connector or noise on
the line (arc welder nearby, etc.).
A data byte was received before the hardware was ready to accept it.
Since all data transfers are via DMA, this is a hardware error.
A message abort request was detected. Usually this is due to noise;
BSAP devices never deliberately transmit an abort.
More data was received than would fit in the buffer supplied.
Usually this is due to noise on the line.
Carrier detect was present on link 2 but not on link 1. This will
61 Web_BSI Manual
Page 66

PORT SUMMARY STATISTICS Web Page
cause failover of communications to the alternate link. This may be a
bad transmitter (this error will then occur at all nodes with which it
communicates) or due to a bad receiver.
Receive Link 2 Errors
Communications Front End (CFE) AUX Port Statistics – (Network 3000 – UCS
3380, CFE 3385 ONLY)
NOTE: The CFE statistics described, below, are strictly for CFE 3385 or UCS 3380 units which
use the IEEE-488 interface. Statistics for serial CFEs are identical to those for BSAP Slave units.
NAKs issued
Message Discarded
ACKs Issued
CRC Errors
Timeout Hardware
Resets
Out of Memory
Carrier detect was present on link 1 but not on link 2. This is similar
to the preceding error, but for the alternate link.
A message from the Console node is NAKed if it must be discarded
because a buffer is unavailable. Increasing the number of buffers may
help. Unfortunately, the VAX systems can overrun the CFE. The
VAX knows it did not get through and will retry; nothing is lost.
A message which is received by the CFE but whose ACK is not
received by the Console is retransmitted by the Console. When the
CFE detects this, it discards the duplicate message and advises the
Console by issuing an 'ACK, msg discarded' response. This can be
caused by noise on the line.
An incorrect CRC was received from the Console. The message was
discarded and therefore retried from the Console. This is probably
caused by noise or a temporarily unplugged cable.
The CFE has not received any message from the Console for 3 poll
periods. All upgoing messages are flushed (like 'aborted for transmit
queue') and the IEEE hardware is reset. This is probably caused by
the cable being unplugged or the VAX Communications Task going
down.
The IEEE multibus interface is having a memory access problem.
This is a serious hardware problem with the CFE system or the IEEE
488 card.
Web_BSI Manual 62
Page 67

PORT SUMMARY STATISTICS Web Page
Internet Protocol (IP) Port Statistics
The Internet Protocol (IP) Port statistics are described, below. These statistics are maintained for
each IP communications port (either serial or Ethernet). In addition, RTU-wide statistics are
maintained for IP communications (see the IP Statistics Page, later in this section).
Packets Received
(Unicast)
Packets Sent (Unicast)
Characters Received
Packets Received
(Multi)
Rcv Messages
Discarded
Rcv Messages (Errors)
Rcv Messages (Bad
Protocol)
Characters Transmitted
Packets Sent (Multi)
Send Errors
The number of non-broadcast packets received at the current port.
NOTE: Packets received will count both invalid packets (see RCV
errors, below), and packets being routed through the RTU, in
addition to packets intended for this RTU.
The number of non-broadcast packets sent from the current port.
The number of characters received at the port. This includes all
protocol characters, and characters included within badly formed
packets.
The number of broadcast packets received. These are mostly found
on LANs such as Ethernet, and are information requests, such as
locating a specific IP address.
The number of packets discarded due to frame-check errors (such as
invalid check-sums).
A catch-all error for invalid frames, which have been discarded.
The number of messages, with valid format and checksums, which
have been discarded due to containing an invalid protocol.
The number of characters sent out the port. This includes all protocol
characters.
The number of broadcast packets sent. These are mostly found on
LANs such as Ethernet.
A catch-all error for invalid send frames. These frames are
discarded. Errors in this type include attempting to send a packet
which is too large.
63 Web_BSI Manual
Page 68

SECURITY SIGN ON Web Page
Security Sign-On Web Page
The Security Sign-on Page is accessible by clicking on the "Security" category button and
choosing the "Sign On" drop-down menu selection.
Selecting a Controller and Signing on
Choose the controller you want to sign-on to from the “RTU Name” list box. Next, enter the
“Password” (or “Username” and “Password” depending upon how security was configured
for this controller
successful, the message ‘Access Granted’ will appear in the message area, in green text. Failure
messages appear in red text, and informational messages appear in black text.
NOTE: To sign on to a 3808 transmitter, only enter the password; the 3808 does not support
usernames, so leave the username blank.
3
). Finally, click on the [Sign On] push button. If the sign-on attempt is
3
ControlWave requires both a username and password. Most other controllers require only a password (username
is left blank).
Web_BSI Manual 64
Page 69

SECURITY SIGN ON Web Page
Signing Off from the Controller
Click on the [Sign Off] push button.
IMPORTANT
When terminating web page activity, you should always sign-off. Signing off is necessary to
terminate the service 'Bservice' which facilitates web page communications.
If you attempt to shut down OpenBSI (or Internet Explorer) without signing off first, Bservice
will continue to run until a 15 minute timeout has expired, and will prevent a full shutdown of
OpenBSI during that period.
Changing the Password (ControlWave-series ONLY)
To change the password for the currently signed on user,
click on the [Change Password] push button. The
Password Modification dialog box will appear. Enter the
new password in the “New Password” field, then enter
it in the “Verify” field, and click on [OK].
NOTE: If you attempt to change the password of a Network 3000-series controller, it will be
rejected as an ‘Illegal request’.
Timeout Occurs If There is No Data Request Within 15 Minutes
If, after logging on with Web_BSI, you do NOT issue a new data request within 15 minutes, i.e.,
the web pages sit idle, you will be logged off, automatically.
65 Web_BSI Manual
Page 70

SIGNAL LIST Web Page
Signal List Web Page
The Signal List page allows the contents of a signal list to be displayed on the screen. In order to
successfully use this page, you must have already signed on to the controller which contains the
signal list you want to display.
To access the Signal List page, click on the "Signal Data" category button, then choose the
"Signal List" drop-down menu selection.
The Signal List page will display the signal name, data type, and current value for signals in the
list. Use the scroll bar to bring additional elements of the list into view, if necessary.
Signal List Information:
Number
Start Index
Max Signals to
Collect
Web_BSI Manual 66
Enter the number of the signal list you want to view, here.
If it is a long signal list, and you want to start viewing from a location
other than the beginning, enter the number of the first element of the
list you want to view, here.
If you don't want to view the entire list, enter the maximum number of
signals you want to display, here.
Page 71

SIGNAL LIST Web Page
Display Descriptors
Push Buttons:
Collect List
Floating Point Format
If you check this, signal descriptive text, if it exists, appears in the
Signal Name field, instead of the signal name. Once you check this,
the control re-collects the list. (OpenBSI 5.8 and newer.)
Click here to have the web page retrieve the signal list from the
controller.
Calls up the Float Format dialog box. In this dialog box, you can
specify the precision with which analog (floating point) values from
the list are displayed.
Use the "Width" list box to specify the total number of characters in
the field (including the decimal point) when displaying a floating point
number. This can range from 1 to 15. The default is 12.
Use the "Precision" list box to choose the number of places to the
right of the decimal point which should be displayed. This can range
from 0 to 15. The default is 6.
Use the "Exponent" list box to choose the floating point format 'f',
exponential notation 'e', or choose 'g' to have the Signal List control
choose the best fit format.
Click on [OK] when finished.
67 Web_BSI Manual
Page 72

SIGNAL LIST Web Page
Changing A Signal's Value
If desired, you can change the value of individual
signals in the list. To do this, either double-click
directly on the value, or right-click anywhere on the
line for a particular element and choose "Change
Signal Value" from the pop-up menu. Enter the new
value in the dialog box, and click on [OK].
Web_BSI Manual 68
Page 73

SIGNAL RECIPE Web Page
Signal Recipe Web Page
The Recipe page allows the user to save a set of initial values for a collection of signals in a file
at the PC. The values to be saved in the recipe file can be loaded from the control strategy
running in the controller, or the user can type them in manually. This user can open this file at a
later time, and load the values to the signals in the RTU. This can be useful, for example, if
various tuning parameters for the optimum performance of a process have been determined, and
they should be saved for later use.
To access the Recipe page, click on the "Signal Data" category button, then choose the "Signal
Recipe" drop-down menu selection.
69 Web_BSI Manual
Page 74

SIGNAL RECIPE Web Page
Creating a Recipe
To create a recipe you must first specify the signals you want included in the recipe. One way to
do this is to either right-click on the grid in the center of the Recipe page and choose "Insert
Signal" from the pop-up menu, or click on the [Insert Signal] button.
In either case, a dialog box will appear in which
you can enter the signal's name. If desired, you
can also enter a value for the signal. Click on
[OK] when you are finished. Repeat for each
additional signal. The maximum number of
signals in a recipe varies depending on the
OpenBSI version. See the table, below for
details:
OpenBSI Version Maximum number signals
allowed in a recipe
5.4 and earlier 500
5.5 1000
5.6 and newer 5000
5.8 Service Pack 1 and newer 10,000
If you don't enter values for the signal when you insert the signal, you can load the current values
in the running control strategy for all signals in the recipe by clicking on [Read From RTU].
Another way to specify signals for the recipe is to load the
signals from a signal list. To do this, click on the [Load
Signal List from RTU] button, then specify the number of
the signal list and click on [OK].
If, as you are creating the recipe, you decide you
want to change a signal or value for a particular
entry, either right click on the entry and choose
"Edit Signal" from the pop-up menu, or click
on the [Modify Signal] button. Make changes,
as desired, and click on [OK].
If you want to delete a signal in the recipe, either right-click on the line for that signal and
choose "Delete Signal" from the pop-up menu, or click on the [Delete Signal] button. You will
be prompted to confirm the signal deletion.
Web_BSI Manual 70
Page 75

SIGNAL RECIPE Web Page
Changing the Floating Point Format of Values
If desired, you can change the format in which values
are displayed in the recipe window by clicking on the
[Floating Point Format] button.
Use the "Width" list box to specify the total number
of characters in the field (including the decimal point)
when displaying a floating point number. This can
range from 0 to 15. The default is 12.
Use the "Precision" list box to choose the number of places to the right of the decimal point
which should be displayed. This can range from 0 to 15. The default is 6.
Use the "Exponent" list box to choose the floating point format 'f', exponential notation 'e', or
choose 'g' to have the Recipe control choose the best fit format.
Click on [OK] when finished.
Saving the Recipe
Type the path and filename for your recipe file in the "Filename" field or click [Change
Filename] to select a recipe from the default recipe area. Standard recipe files are stored with a
file extension of (.RCP). You also have the option of saving the file as a .CFG file (which is
intended for use with Coastal Flow Measurement Inc. Flow-Cal™ software.)
71 Web_BSI Manual
Page 76

SIGNAL RECIPE Web Page
Once you have specified the path and filename, click on the [Write to File] button; answer Yes
to the confirmation prompt, and the control writes the recipe to the specified file.
Recalling a Saved Recipe, and Sending Its Values to the Controller
To recall a recipe which you have saved previously, use the [Browse] button to locate it, or type
its path and filename in directly in the "Filename" field. Finally, click on the [Read From File]
button, and the recipe will be brought into the web page.
Once the recipe file has been loaded, you can send the recipe values to the controller by clicking
on the [Write to RTU] button; answer Yes to the confirmation prompt, and the control writes
the recipe to the RTU.
Web_BSI Manual 72
Page 77

SIGNAL SEARCH Web Page
Signal Search Web Page
The Signal Search page allows you to search for all signals which satisfy a user-defined criteria.
In order to successfully use this page, you must have already signed on to the controller which
contains the signals you want to display.
To access the Signal Search page, click on the "Signal Data" category button, then choose the
"Signal Search" drop-down menu selection.
The main Signal Search window will appear. The push buttons in the window are described,
below. In addition, the Search Criteria dialog box will appear (described later in this section).
NOTES:
If you are communicating with a TeleFlow/TeleRTU series unit (3530-xx), you can
search for a specific signal, or all signals, but other search criteria are not supported.
If search criteria has already been specified in an HTML script, the search will start
automatically, and the Search Criteria dialog box will NOT appear.
73 Web_BSI Manual
Page 78

SIGNAL SEARCH Web Page
Push Buttons:
Restart Search
New Search
Configure Data This calls up the Configure Grid Data dialog box, from which you can
Click here to re-run the search with the currently defined parameters.
This allows data on the screen to be refreshed.
This calls up the Search Criteria dialog box, from which you can
specify the characteristics of the signals for which you want to search.
The appearance of the Search Criteria dialog box varies depending
upon whether you are communicating with a Network 3000 controller,
or a ControlWave controller. See 'Search Criteria – Signal Search
Properties' for more information.
specify the background colors which should be used when displaying
signals which have passed particular alarm limits, as well as the
floating point format which should be used for displaying numerical
data.
Use the […] buttons to call up a
color palette from which you can
select the color in which low and
high alarms, and low-low and high
high alarms should be displayed in
the Signal Search window.
Web_BSI Manual 74
Page 79

SIGNAL SEARCH Web Page
Use the [Floating Point Format]
button to call up the Float Format
dialog box, and specify the
precision with which analog
(floating point) values are
displayed in the Signal Search
window.
Use the "Width" list box to specify the total number of characters in
the field (including the decimal point) when displaying a floating point
number. This can range from 1 to 15. The default is 12.
Use the "Precision" list box to choose the number of places to the
right of the decimal point which should be displayed. This can range
from 0 to 15. The default is 6.
Use the "Exponent" list box to choose the floating point format 'f',
exponential notation 'e', or choose 'g' to have the Signal Search control
choose the best fit format.
Click on [OK] when finished.
Search Criteria – Signal Search Properties
You can search for signals or variables based on
their name in one of three possible search modes,
and/or based on their alarm status or signal inhibit
status.
75 Web_BSI Manual
Page 80

SIGNAL SEARCH Web Page
e
Select Search Type:
ControlWave Instance/Variable Search Mode:
For ControlWave controllers you can
search based on the POU “Instance”
name(s), and/or the “Variable” name.
Wildcards may be used in either of these
fields.
There can be multiple instance names associated with the same variable, for example, an
instance for the program, followed by the instance for a function block, etc. Each instance is
followed by a period ‘.’ character, therefore an instance name is always to the left of the last
period. The portion to the right of the last period is considered to be the variable name. Any
variable must have been marked as ‘PDD’ in order to be found by the signal search.
Instance The “Instance” name portion may be up to 32 characters long. If you do NOT use
wildcard characters, the instance name must match exactly to be considered a
valid match. For global variables the POU instance name would be ‘@GV’. If
you leave the “Instance” field blank, any instance name is considered valid, and
only the “Variable” field will be used in the search.
Variable The “Variable” name may be up to 32 characters long. If you do NOT use
wildcard characters, the variable name must match exactly to be considered a
valid match. If you leave the “Variable” field blank, only the “Instance” field will
be used in the search.
Some Examples:
Let’s say you have a set of variables with the following names:
multiple
instance
names
instance
name
@GV.PRESSURE_READING
@GV.MYFB.STATION1_FLOW
@GV.MYFB.STATION2_FLOW
@GV.MYFB.STATION3_FLOW
@GV.MYFB.STATION4_FLOW
@GV.MYFB2.STATION1_FLOW
@GV.MYFB2.STATION2_FLOW
@GV.MYFB2.STATION3_FLOW
@GV.MYFB2.STATION4_FLOW
PROG1.TEMP_HIGH
PROG1.TEMP_LOW
PROG1.TEMP_CURRENT
variable name
variable nam
instance
variable name
name
Web_BSI Manual 76
Page 81

SIGNAL SEARCH Web Page
Here are some resulting matches based on this set of variables:
If you enter this in the
“Instance” field:
* STATION1* @GV.MYFB.STATION1_FLOW
leave blank
@GV.MYFB* STATION2* @GV.MYFB.STATION2_FLOW
PROG TEMP*
PROG*
@GV.MYFB2
*.* STATION3* @GV.MYFB.STATION3_FLOW
*
*.*
*.MYFB2
and you enter this in the
“Variable” field:
The following variables will be
returned from the set of variables
shown previously:
@GV.MYFB2.STATION1_FLOW
TEMP* PROG1.TEMP_HIGH
PROG1.TEMP_LOW
PROG1.TEMP_CURRENT
@GV.MYFB2.STATION2_FLOW
No matches; because no wildcard
following ‘PROG’.
leave blank
PROG1.TEMP_HIGH
PROG1.TEMP_LOW
PROG1.TEMP_CURRENT
leave blank
@GV.MYFB2.STATION1_FLOW
@GV.MYFB2.STATION2_FLOW
@GV.MYFB2.STATION3_FLOW
@GV.MYFB2.STATION4_FLOW
@GV.MYFB2.STATION3_FLOW
leave blank
@GV.PRESSURE_READING
@GV.MYFB.STATION1_FLOW
@GV.MYFB.STATION2_FLOW
@GV.MYFB.STATION3_FLOW
@GV.MYFB.STATION4_FLOW
@GV.MYFB2.STATION1_FLOW
@GV.MYFB2.STATION2_FLOW
@GV.MYFB2.STATION3_FLOW
@GV.MYFB2.STATION4_FLOW
PROG1.TEMP_HIGH
PROG1.TEMP_LOW
PROG1.TEMP_CURRENT
leave blank
@GV.MYFB.STATION1_FLOW
@GV.MYFB.STATION2_FLOW
@GV.MYFB.STATION3_FLOW
@GV.MYFB.STATION4_FLOW
@GV.MYFB2.STATION1_FLOW
@GV.MYFB2.STATION2_FLOW
@GV.MYFB2.STATION3_FLOW
@GV.MYFB2.STATION4_FLOW
leave blank
@GV.MYFB2.STATION1_FLOW
@GV.MYFB2.STATION2_FLOW
77 Web_BSI Manual
Page 82

SIGNAL SEARCH Web Page
If you enter this in the
“Instance” field:
leave blank
or
*
*.MYFB2* STATION2_FL?W @GV.MYFB2.STATION2_FLOW
PROG?
@GV.MYFB?
and you enter this in the
“Variable” field:
STATION?_FLOW @GV.MYFB.STATION1_FLOW
leave blank
leave blank
The following variables will be
returned from the set of variables
shown previously:
@GV.MYFB2.STATION3_FLOW
@GV.MYFB2.STATION4_FLOW
@GV.MYFB.STATION2_FLOW
@GV.MYFB.STATION3_FLOW
@GV.MYFB.STATION4_FLOW
@GV.MYFB2.STATION1_FLOW
@GV.MYFB2.STATION2_FLOW
@GV.MYFB2.STATION3_FLOW
@GV.MYFB2.STATION4_FLOW
PROG1.TEMP_HIGH
PROG1.TEMP_LOW
PROG1.TEMP_CURRENT
@GV.MYFB.STATION1_FLOW
@GV.MYFB.STATION2_FLOW
@GV.MYFB.STATION3_FLOW
@GV.MYFB.STATION4_FLOW
@GV.MYFB2.STATION1_FLOW
@GV.MYFB2.STATION2_FLOW
@GV.MYFB2.STATION3_FLOW
@GV.MYFB2.STATION4_FLOW
Web_BSI Manual 78
Page 83

SIGNAL SEARCH Web Page
e
ControlWave Full String Search Mode:
For this search, you can enter a string that is in
either the instance name or variable name.
The search string you enter can include wildcards to establish a pattern to be matched.
Here are some examples, using the same set of variables included in the previous sub-section.
multiple
instance
names
If you enter this in the “String” field: The following variables will be returned from the
*STATION?_F* @GV.MYFB.STATION1_FLOW
*MYFB?.STATION2* @GV.MYFB.STATION2_FLOW
*1* @GV.MYFB.STATION1_FLOW
@GV.P* @GV.PRESSURE_READING
instance
name
@GV.PRESSURE_READING
@GV.MYFB.STATION1_FLOW
@GV.MYFB.STATION2_FLOW
@GV.MYFB.STATION3_FLOW
@GV.MYFB.STATION4_FLOW
@GV.MYFB2.STATION1_FLOW
@GV.MYFB2.STATION2_FLOW
@GV.MYFB2.STATION3_FLOW
@GV.MYFB2.STATION4_FLOW
PROG1.TEMP_HIGH
PROG1.TEMP_LOW
PROG1.TEMP_CURRENT
instance
variable name
variable name
name
set of variables shown previously:
@GV.MYFB.STATION2_FLOW
@GV.MYFB.STATION3_FLOW
@GV.MYFB.STATION4_FLOW
@GV.MYFB2.STATION1_FLOW
@GV.MYFB2.STATION2_FLOW
@GV.MYFB2.STATION3_FLOW
@GV.MYFB2.STATION4_FLOW
@GV.MYFB2.STATION2_FLOW
@GV.MYFB2.STATION1_FLOW
PROG1.TEMP_HIGH
PROG1.TEMP_LOW
PROG1.TEMP_CURRENT
variable nam
79 Web_BSI Manual
Page 84

SIGNAL SEARCH Web Page
ACCOL Base, Extension, and Attribute Search Mode:
NOTE: Do NOT enter wildcard characters in this mode.
For Network 3000 controllers, you
can search based on a portion of the
signal’s name. The "Base",
"Extension" and "Attribute" fields
include list boxes which allow easy
selection from the available base
names, extensions, and attributes in a
given load.4
NOTE: You must search using the complete “Base”, “Extension”, or “Attribute”, not part of it.
For example, to search for an attribute of “FLOW,” you must enter “FLOW,” not
“FLO,” “FL,” or “F.”
If the Signal Search control is communicating with a ControlWave and the
_USE_ACCOL_NAME system variable in your ControlWave project is set to TRUE, you can
also use the “Base”, “Extension” and “Attribute” fields. To work properly in this case, though,
the signal names you search for must fit the ACCOL II signal naming convention, i.e. no more
than 8 alpha-numeric characters for the base, no more than 6 for the extension, and no more than
4 for the attribute. In addition, characters such as the at sign ‘@’ cannot be included. The
underscore ‘_’ may work if it’s at the end of the search parameter, but it will not work at the
beginning of the search parameter.
Notes For ControlWave Users:
To see all variables in the load (both global and local variables marked as ‘PDD’) start the search
with only the “Node” name specified; leave all other fields blank.
Because your signals must follow naming conventions carefully in this mode, we recommend
that when communicating with ControlWave that you use one of the other search modes, and
leave _USE_ACCOL_NAME set at FALSE.
The standard IEC62591 STRING data type allows up to 80 characters. You can also create string
variables using user-defined STRING data types of varying lengths. Be aware that in either case,
4
Network 3000 User Note: DataView uses the ACO and ACL files on the PC hard disk to create the
Node, Base, Extension, and Attribute lists. Because not all versions of the EGM 3530 TeleFlow include
an ACCOL load, some TeleFlow users must type the Node, Base, Extension, or Attribute directly; there
is no list to choose from. This situation also occurs if the ACO/ACL file base name has not been specified
as the Node Load File Name in the currently released NETDEF files.
Web_BSI Manual 80
Page 85

SIGNAL SEARCH Web Page
there are restrictions on displaying strings in programs outside of ControlWave Designer.
ControlWave RTUs do not report strings that exceed 127 characters and behave as if the
variable does not exist when data requests come in for that variable from software.
Web_BSI web pages communicating over a serial connection can only display the first
64 characters of a ControlWave string variable.
Web_BSI web pages communicating over IP can display up to 127 characters of a string
variable’s value.
In Alarm and Quality Bits
You can limit your search to only signals which are currently in a particular alarm state, or have
inhibit/enable bits in a particular state.
If you are searching for analog alarms, you can specify that you only want alarms that have
exceeded one or more of the four alarm limits by choosing one of the appropriate boxes ("High",
"High-High", "Low", or "Low-Low"). If you only want to search for logical alarms, choose
"Logicals".
Another criteria you can use to limit your search is to specify that you only want signals that
have certain inhibit/enable bits set.
For example, only signals that are control-inhibited, or only signals that are manually enabled.
Use the "Alarm", "Control" or "Manual" list boxes to specify either 'Enable' or 'Inhibit' to limit
the search to signals in those inhibit/enable states. Similarly, you can limit the search to only
signals which have been marked questionable by setting the "Questionable" list box to 'Set'.
Click on the ‘ControlWave Extras’ tab to further refine your search.
81 Web_BSI Manual
Page 86

SIGNAL SEARCH Web Page
ControlWave Extras Page
The ‘ControlWave Extras’ page includes
additional search options, that are supported
only for ControlWave controllers you are
communicating to via IP.
You can use the "Boolean State" to limit
the search to Boolean variables that are
currently 'True' or are currently 'False'. If no
choice is made, both of these states will be
included in the search criteria.
For analog signals, you can specify a "Min"
and "Max" value to define a range of signal
values. Only signals which are currently
within the defined range will be returned in
the search.
To search only for signals of a particular data type, for example only 'Boolean' or only 'Short Int'
choose the desired type in the "Data Type" field. If no selection is made, all data types will be
included in the search criteria.
If desired, you can limit the search to signals which share a particular “Alarm Priority”, such as
“critical”, “non-critical”, “operator guide”, or “event.”
For Boolean signals, you can specify that you only want those activated when they are in a
particular state, i.e. those that are ‘in alarm’ when they are set to TRUE, or are ‘in alarm’ when
they are set to FALSE, or are ‘in alarm’ when they change state.
Starting the Search:
If you are satisfied with your search criteria, and do not want to further refine the search criteria
on the 'Signal Search Properties' and 'ControlWave Extras' pages, click on [OK] to start the
search.
Alternatively, to erase all the criteria you have chosen, and start again, click on [Reset All].
Once you have started the search, a signal window of all signals/variables which share the
selected characteristics will appear. See 'Viewing Entries in the Signal Window' for information
Web_BSI Manual 82
Page 87

SIGNAL SEARCH Web Page
on using the entries in this window to change signal values, or to alter inhibit / enable bits. See
'Viewing Data for a Single Signal' (later in this manual) for information on viewing more
detailed signal information. NOTE: Only the first 5000 signals found can be displayed.
Viewing the Results of Your Search
After you have clicked on [OK] or [Apply] in the Search Criteria dialog box, the search will be
initiated. The results of the search will be displayed in the Signal Search main window.
Clicking on a signal
name calls up the
Signal Detail wind ow
for this signal.
Clicking on the signal's
value brings up a dialog
box which allows you
to change its value.
Clicking on any of the inhibit/enable
bits allows you to change their value.
The total number of signals collected will be displayed in the "Signals Collected" field.
The fields included for each signal / variable in the window are:
Signal Name The ACCOL signal name or IEC 61131 variable name.
Type The data type of the signal or variable.
Alarm The current status of the alarm inhibit/enable flag. This flag determines whether
or not alarms will be reported for this signal (assuming it is an alarm signal). AI
= alarm inhibited, AE = alarm enabled. NOTE: For ControlWave users, alarm
inhibiting a variable only has effect if no value is copied to the alarm function
block during alarm processing.
Control The current status of the control inhibit/enable flag. Control inhibited means
83 Web_BSI Manual
Page 88

SIGNAL SEARCH Web Page
that this signal's value is frozen and cannot be changed by logic in the control
strategy program/application load, control enabled means that this signal's value
can be changed by logic in the control strategy program/application load. CI =
control inhibited, CE = control enabled.
Manual The current status of the manual inhibit/enable flag. Manual inhibited prevents
operator changes to the signal; manual enabled allows operator changes to the
signal: MI = manual inhibited, ME = manual enabled. NOTE: For ControlWave
users, manual inhibiting a variable does NOT prevent it being changed by an
operator running ControlWave Designer in on-line mode.
Value The current value of the signal / variable.
Units The engineering units for the signal. NOTE: For IEC 61131-3 users,
engineering units only apply for alarm signals. Engineering units for alarm
signals are specified within alarm function blocks.
Changing Inhibit / Enable Status Flags
If signals have been configured to use them, you can alter the
value of the inhibit/enable status flags by clicking in the
"Alarm", "Control" or "Manual" fields for the particular
signal. You will be prompted to confirm the change; then
click on [Yes].
Viewing Detailed Information About a Signal
To view detailed information about a signal, click on its name in the Signal Search main
window, and a Detailed display about the signal will appear. This window will display the
signal's current value, current inhibit/enable status bit values, and (if configured) a descriptor. If
the signal is an alarm, alarm deadbands and limits also appear.
To change the signal's value, click on the value, and a dialog box will appear allowing you to
enter a new value.
To change inhibit/enable bits, click on the Control Inhibit/Enable 'CI/CE', Manual
Inhibit/Enable 'MI/ME' button of your choice.
In addition to the aforementioned items, if this signal is an alarm signal, its value is displayed
with a background color corresponding to its alarm priority. In this case, you can:
● Optionally acknowledge the alarm by clicking on the [Ack Alarm] button.
Web_BSI Manual 84
Page 89

SIGNAL SEARCH Web Page
Alter its Alarm Inhibit/Enable status from the 'AI/AE' button.
View/hide alarm limit and deadband information by clicking on the [Show Alarms] or [Hide
Alarms] buttons.
Signal / Variable name
Master signal
directory (MSD)
or PPD address.
Current Value (Click on a
value if you want to change
it, and a dialog box opens.)
Click here to acknowledge
the selected alarm.
Click on these
buttons to toggle
the alarm, control,
or manual
inhibit/enable
status flags.
If this is an alarm, its alarm
priority color appears.
You can display or hide
the alarm deadbands and
limits if you click the Show
Alarms / Hide Alarms
button.
85 Web_BSI Manual
Page 90

SIGNAL SEARCH Web Page
Changing Signal Values
To change a signal's value, either click on its value in the Signal Search main window, or in the
Signal Detail window. In either case, a dialog box will appear which will allow you to change
the signal's value.
For analog signals, enter the new signal value in the "New Value" field. Optionally, you can
also change the value of the inhibit/enable and questionable data bits from the list boxes
provided. When you have finished making changes, click on [OK].
Enter the new signal value
here, then click OK.
The current status of inhibit flags
(and the questionable data flag) of a
signal can be changed here.
For logical (boolean) signals, either use the "New Value" list box to specify the new state of the
signal, and click on [OK], -or- use the [Toggle] button to change the state of the signal.
Either use the
“New Value” list
box to specify the
new state, then
click on [OK].
-or- use the [Toggle]
button to change the
state directly.
Web_BSI Manual 86
Page 91

SIGNAL VIEW Web Page
Signal View Web Page
The Signal View page allows the value of a specific signal/variable to be displayed on the
screen. In order to successfully use this page, you must have already signed on to the controller
which contains the signal you want to display.
To access the Signal View page, click on the "Signal Data" category button, then choose the
"Signal View" drop-down menu selection.
Configuring A Signal to Be Displayed in the Signal View Control
If a signal has not been configured, already, the Signal View Control will present a series of
question marks on the screen '?????'.
Right-click on the question marks, and choose "Configure Signal" from the pop-up menu. The
Configuration page of the Configure Signal dialog box will appear:
NOTE: The Configure Signal dialog box contains multiple pages. To move between the various
pages, click on the tab for that page. Clicking on [OK] in any of the pages will exit the
dialog box, therefore, you should only click on [OK] when you have finished with all of
the necessary pages. Clicking on [Reset] erases your entries, and replaces them with
defaults.
87 Web_BSI Manual
Page 92

SIGNAL VIEW Web Page
Configuration Page
Select the controller from the "Node Name"
list box, then enter the signal name using the
"Signal Name" field.
If this is an alarm signal, for which you would
like to collect alarm information (limits,
deadbands from the RTU), check the "Collect
Alarms from RTU" box.
Refresh Rate Page
The Refresh Rate page specifies how often data
will be updated on the screen for this signal.
No Refresh 'No Refresh' means the signal
value will only be presented
once, and will not be
updated.
Slow Refresh 'Slow Refresh' means the
signal value will be updated
at the slow rate; this varies
depending upon the type of
controller, for Network 3000
series nodes this would be 5
seconds.
Fast Refresh 'Fast Refresh' means the signal value will be updated at the fast rate; this
varies depending upon the type of controller. The update will be as fast as
possible.
NOTE: The default refresh rates are specified in the DATASERV.INI initialization file for
OpenBSI.
Web_BSI Manual 88
Page 93

SIGNAL VIEW Web Page
When running a single web page that has a large number of Signal View controls (typically
greater than 50), not all signal values may be displayed, and you may see question marks. A
faster refresh rate may be necessary. If a faster refresh rate cannot be supported by the
network, you may need to reduce the number of Signal View controls on that web page.
IMPORTANT
Display Format Page
The Display Format page allows you to specify how the signal data will be presented. The
appearance of the 'Properties' section will vary, somewhat, based on the display format you
choose. You have a choice of several different items which can be displayed for the signal.These
are included in the 'Value' and 'Inhibits' and 'Custom' section of the Display Format page. Only
ONE of the items can be selected.
If you want to display the signal's numerical value, choose "ASCII" as the display type.
If, you want to depict the signal's value as a bar graph, choose "Bar Graph"as the display
type.
If you want to depict the signal's value using a pair of bitmaps, choose "Bitmap".
If you want to depict the signal's alarm inhibit bit, choose "Alarm".
If you want to depict the signal's control inhibit bit, choose "Control".
If you want to depict the signal's manual inhibit bit, choose "Manual".
If you want to display different text strings based on an analog value, choose "String
Translate".
If you want to display text on a button, choose "Button".
89 Web_BSI Manual
Page 94

SIGNAL VIEW Web Page
A description of the 'Properties' fields for each possible choice is included, below:
ASCII Value:
If your chosen display format is "ASCII" you can specify the horizontal and vertical alignment
of the signal on the screen. The default is 'Center' for both the horizontal and vertical alignment.
If this is a Network 3000 controller, you can check the "Show Units" box to display engineering
units for the signal.
If “Convert to Timestamp” is checked, the signal value will be displayed as a timestamp, in the
same format as #TIME.000., _TIME_000, or _JULIAN_TIME i.e. MM/dd/yyyy hh:mm:ss where
MM is the two digit month, dd is the two digit day, yyyy is the four digit year, hh is the two digit
hour in 24-hour format, mm is the two digit minute, and ss is the two digit second. NOTE: If
using a ControlWave unit and BSAP communication, you must use _JULIAN_TIME for your
timestamp signal here.
If “Convert to Hexadecimal” is checked, the signal value will be displayed in hexadecimal
(base 16) format. Note: If you use this option, the value is read-only; the user cannot edit it.
(OpenBSI 5.8 and newer.)
Web_BSI Manual 90
Page 95

SIGNAL VIEW Web Page
If “Display Alarm Descriptor” is checked, and the signal is an alarm, the alarm descriptive text
will be displayed. whether or not the signal is currently in an alarm state
If "Show Jogging Controls" is checked, both [+] and [-] jog buttons will be displayed to
increase or decrease, respectively, the value of the signal. If "Constant" is chosen, the "Jog
Value" specifies a fixed value by which each click of the jog button will increase or decrease the
value. If "Percentage" is chosen, the "Jog Value" is a percentage of the current signal value.
"Jog Low Limit" specifies the lowest value the signal can be set to by the user clicking on the
[-] jog button. "Jog High Limit" specifies the highest value the signal can be set to by the user
clicking on the [+] button. NOTE: If a negative value is enter for the "Jog Value" it will be
treated as a positive value.
Floating Point Format:
The [Floating Point Format] button calls up a dialog
box which lets you specify the number of decimal
places used to present the signal value.
Use the "Width" list box to specify the total number
of characters in the field (including the decimal point)
when displaying a floating point number. This can
range from 1 to 15. The default is 12.
Use the "Precision" list box to choose the number of places to the right of the decimal point
which should be displayed. This can range from 0 to 15. The default is 6.
Use the "Exponent" list box to choose the floating point format 'f', exponential notation 'e', or
choose 'g' to have the Archive Collection control choose the best fit format.
Scaling and Bit Isolation (OpenBSI 5.8 and newer only):
Optionally, you can modify the ASCII value
before you display it.
If you specify a “Scale Factor” SignalView
multiplies the ASCII value by the scaling
factor, and then displays the result. For
example, if the ASCII value is 5.0 and the
scale factor is 3.0, the value displays as 15.0.
If you specify an “Offset Factor” SignalView adds the offset factor, and then displays it. For
example, if the ASCII value is 34.0, and the offset factor is 4.0, the value displays as 38.0.
91 Web_BSI Manual
Page 96

SIGNAL VIEW Web Page
Bit isolation is useful only if the variable you display is in a non-floating point format and you
want to extract a single bit from it and display that. If, for example, a variable in your
ControlWave project is of type WORD, and you want to display the second bit of the first byte
of the WORD, you would choose “0” for “Byte Selection” to choose the first byte (bytes are
numbered 0 to 3), and you would choose “1” for “Bit Selection” to choose the second bit (bits
are numbered 0 to 7).
NOTE: If you use scaling and bit isolation, the value displayed is read-only; the user cannot edit
the value.
Bar Graph
If your chosen display type is "Bar Graph" you must enter the "Zero" and "Span" values
which define the range of the signal.
If "Show Jogging Controls" is checked, both [+] and [-] jog buttons will be displayed to
increase or decrease, respectively, the value of the signal associated with the bar graph. If
"Constant" is chosen, the "Jog Value" specifies a fixed value by which each click of the jog
button will increase or decrease the value.
NOTE: If a negative value is enter for the "Jog Value" it will be treated as a positive value.
If "Percentage" is chosen, the "Jog Value" is a percentage of the current signal value. "Jog
Low Limit" specifies the lowest value the signal can be set to by the user clicking on the [-] jog
Web_BSI Manual 92
Page 97

SIGNAL VIEW Web Page
button. "Jog High Limit" specifies the highest value the signal can be set to by the user clicking
on the [+] button.
The "Base Position" determines the direction in which the bar graph moves. The default is
'BOTTOM', which means the "Zero" is at the bottom of the graph, and the full "Span" is at the
top of the graph. 'TOP' means the "Zero" is at the top of the graph, and the full "Span" is at the
bottom of the graph. 'LEFT' means the left edge of the bar is the "Zero" value for the graph and
the full "Span" is at the right edge of the bar. 'LEFT' means the left edge of the bar is the
"Zero" value for the graph and the full "Span" is at the right edge of the bar. 'RIGHT' means
the right edge of the bar is the "Zero" value for the graph and the full "Span" is at the left edge.
Bitmap
If your chosen display type is "Bitmap" use the "ON Bitmap" […] push button to specify the
picture (bitmap) to be displayed when the signal is in its ON state (logical signals) or its nonzero state (analog signals).
Use the "OFF Bitmap" […] push button to specify the picture (bitmap) to be displayed when
the signal is in its OFF state (logical signals) or is zero (analog signals).
Inhibits: Alarm, Control, or Manual
If your chosen display type is one of the inhibit bits, either "Alarm", "Control", or "Manual",
the status of the chosen inhibit/enable bit will be shown. For example, if you choose "Control",
93 Web_BSI Manual
Page 98

SIGNAL VIEW Web Page
either 'CE' or 'CI' will be displayed (or user defined text, if you change the text in the Inhibit
page), depending upon whether the signal is control enabled, or control inhibited, respectively.
You can specify the horizontal and vertical alignment of the inhibit/enable text on the screen.
The default is 'Center' for both the horizontal and vertical alignment.
Web_BSI Manual 94
Page 99

SIGNAL VIEW Web Page
String Translate
If your chosen display type is "String Translate", the truncated analog value of the signal will
be used to select a text string for display. The text string must come from a pre-defined list of
text strings, called the Translation String File. The path and name of this file must be specified in
the “Translation String File”field.
Format of Translation File (OpenBSI 5.8 and newer):
An example translation
string file is shown at right.
[STRINGS]
0 = string to display when truncated signal value is 0
10 = string to display when truncated signal value is 10
4 = string to display when truncated signal value is 4
7 = string to display when truncated signal value is 7
3 = string to display when truncated signal value is 3
The first entry in the file specifies the first string displayed in the drop-down menu, the second
entry in the file specifies the second string displayed in the drop-down menu, and so on.
NOTE:Beginning with OpenBSI 5.8 you can have blank lines and gaps in your numbering
scheme and you only need to define the strings you want to display for particular values. If the
truncated value of a signal does not correspond to one of the entries in the file, SignalView
displays the string “String Not Found.”
95 Web_BSI Manual
Page 100

SIGNAL VIEW Web Page
Format of Translation File (OpenBSI 5.7 and earlier):
Prior to OpenBSI 5.8, there could be no
blank lines or gaps in values in the
strings file, and the number had to be
sequential and contiguous, i.e. if you
had strings you want displayed when
the signal value is 3 or 5, you must also
specify strings to be displayed when the
value is 0, 1, 2, and 4.
You can specify the horizontal and vertical alignment of the displayed text string on the screen.
cThe default is 'Center' for both the horizontal and vertical alignment.
Custom: Button
If your chosen display type is "Button" a button will be displayed. The action performed in
response to the user's clicking on the button are determined based on the "Custom Button
Mode" and "Custom Button Function" list boxes.
[STRINGS]
0 = string to display when truncated signal value is 0
1 = string to display when truncated signal value is 1
2 = string to display when truncated signal value is 2
3 = string to display when truncated signal value is 3
: :
: :
n = string to display when truncated signal value is n
The "Custom Button Modes" choices determine what aspect of the signal is affected when the
button is clicked.
Custom Button Mode Description
Digital State In this mode, clicking on the button may change the state of a logical
Web_BSI Manual 96
 Loading...