

Remote Automation Solutions Guide: OpenEnterprise Trend View Reference Guide Manuals & Guides
Page 1

Reference Guide
D301544X412
April 2012
OpenEnterprise Trend View Reference
Guide (V2.83)
Remote Automation Solutions
Website: www.EmersonProcess.com/Remote
Page 2

Reference Guide
w
D301544X412
APRIL 2012
Trend Vie
Contents
1 Trend V iew................................................................................................................................1
1.1 Overview .............................................................................................................................1
1.2 Realtime and Historical Tags..............................................................................................1
1.2.1 Creation of Realtime Pens............................................................................................2
1.2.2 Creating Standard Historical Pens...............................................................................2
1.2.2.1 Using the Tag Browser ..........................................................................................2
1.2.2.2 Setting up the Default Pen to convert dropped realtime to historical tags.............3
1.2.3 Historical Backfill Tags .................................................................................................4
1.2.4 Historical Backfill Tags with Performance Mode..........................................................4
2 Configuration...........................................................................................................................5
2.1 Accessing the Property Pages............................................................................................5
2.1.1 The Configure Menu.....................................................................................................5
2.1.1.1 The OpenEnterprise Desktop ................................................................................5
2.1.1.2 The Trend View Container.....................................................................................5
2.1.2 The Keyboard option....................................................................................................5
2.1.2.1 The Context Menu..................................................................................................5
2.2 General Page......................................................................................................................5
2.2.1 Display Type.................................................................................................................6
2.2.2 Create Menu Button .....................................................................................................6
2.2.3 Use Sub Menu..............................................................................................................6
2.2.4 Allow Runtime Configuration........................................................................................7
2.2.5 Hide Unresolvable Pens and Limits .............................................................................7
2.2.6 Force Save As..............................................................................................................7
2.2.7 Optimize for Data..........................................................................................................7
2.2.8 Optimize for Performance.............................................................................................8
2.2.9 Performance Optimization............................................................................................8
2.2.9.1 Resolution .............................................................................................................. 8
2.2.9.2 Zooming with Optimization.....................................................................................8
2.2.9.3 Optimization and the HDA Server..........................................................................9
2.2.9.3.1 Historical Streams Triggered by Value Changes .............................................9
2.2.9.4 Visible and Non-visible Data..................................................................................9
2.2.9.5 Showing all Data....................................................................................................9
2.2.9.6 Data Subset Warning...........................................................................................10
2.2.10 Advanced Optimization Dialog................................................................................10
2.2.10.1 Current X Axis Width ..........................................................................................11
2.2.10.2 Maximum Number ..............................................................................................11
2.2.10.3 Pixels Per Sample ..............................................................................................11
2.2.10.4 Samples Per Pixel ..............................................................................................11
2.2.10.5 Maximum Samples Possible...............................................................................11
2.2.11 Detail Sub Page - General Tab...............................................................................11
2.2.11.1 Background Color...............................................................................................12
2.2.11.2 Text Color...........................................................................................................12
2.2.11.3 Number of Decimal Places.................................................................................12
2.2.11.4 Show Milliseconds..............................................................................................12
2.2.11.5 Visible.................................................................................................................12
2.2.11.6 Autosize Columns...............................................................................................12
- i -
Page 3

Reference Guide
w
D301544X412
APRIL 2012
Trend Vie
2.2.11.7
2.3 Pens Page.........................................................................................................................13
2.3.1 List of Current Pens....................................................................................................14
2.3.2 Characteristics of the Default Pen..............................................................................14
2.3.2.1 General Characteristics .......................................................................................14
2.3.2.2 Color and the Default Pen....................................................................................15
2.3.2.3 The TVD File........................................................................................................15
2.3.2.4 The Automation Interface.....................................................................................15
2.3.3 Example Use of the Default Pen ................................................................................15
2.3.3.1 Adding Pens Dynamically to a Trend...................................................................15
2.3.3.2 Converting Dropped Realtime tags into Historical tags .......................................16
2.3.4 Remove ......................................................................................................................16
2.3.5 Remove All .................................................................................................................17
2.3.6 Add and Modify Buttons .............................................................................................17
2.3.7 Pen Configuration Data Page.....................................................................................17
2.3.7.1 Data Source .........................................................................................................17
2.3.7.2 Data Field Browse Button ....................................................................................18
2.3.7.3 Convert Realtime Data Sources to Historical ...................................................... 18
2.3.7.4 Device ..................................................................................................................20
2.3.7.5 Status...................................................................................................................20
2.3.7.6 Name....................................................................................................................20
2.3.7.7 Description ...........................................................................................................20
2.3.7.8 Units.....................................................................................................................20
2.3.7.9 Auto Populate with Signal Data ...........................................................................20
2.3.7.10 Advanced Button ................................................................................................21
2.3.7.11 Advanced Dialog.................................................................................................21
2.3.8 Pen Configuration Ranges Page................................................................................23
2.3.8.1 Override Global Time Settings.............................................................................24
Detail Sub Page - Attributes Tab........................................................................12
2.2.11.7.1 Available Attributes.......................................................................................13
2.2.11.7.2 Add button....................................................................................................13
2.2.11.7.3 Add All button...............................................................................................13
2.2.11.7.4 Remove button.............................................................................................13
2.2.11.7.5 Remove All button........................................................................................13
2.2.11.7.6 Selected Attributes .......................................................................................13
2.2.11.7.7 Re-ordering Selected Attributes...................................................................13
2.3.3.1.1 Using 'Load File with Parameters...................................................................16
2.3.3.1.2 Using 'Load file with Data Access Tags'.........................................................16
2.3.7.1.1.1 Hint:..........................................................................................................17
2.3.7.1.2 How to place an Alias within a tag: -...............................................................17
2.3.7.1.2.1 Normal Tag (Without Alias)......................................................................17
2.3.7.1.2.2 Tag With Alias Inserted............................................................................17
2.3.7.11.1 Auto Populate Field List................................................................................22
2.3.7.11.2 Selected Field...............................................................................................22
2.3.7.11.3 Auto Populate Field Enabled........................................................................22
2.3.7.11.4 Auto Populate Field Attribute........................................................................22
2.3.7.11.5 Convert Auto Populate Tag..........................................................................23
2.3.7.11.6 Show Gap for Missing Data..........................................................................23
2.3.7.11.6.1 Extrapolation and Performance Mode ...................................................23
2.3.7.11.7 Default Maximum Gap..................................................................................23
2.3.7.11.8 Use Double Compressed Rate.....................................................................23
- ii -
Page 4

Reference Guide
w
D301544X412
APRIL 2012
Trend Vie
2.3.8.2
2.3.8.3 Range Period .......................................................................................................24
2.3.8.4 Minimum Y-Axis...................................................................................................24
2.3.8.5 Maximum Y-Axis ..................................................................................................25
2.3.9 Pen Configuration Limits Page...................................................................................25
2.3.9.1 Currently Configured Limits .................................................................................25
2.3.9.2 Limit Configuration Dialog....................................................................................25
2.3.10 Pen Configuration Styles Page...............................................................................27
2.3.10.1 Styles Dialog.......................................................................................................28
2.3.10.2 Pen Axis Configuration Dialog General Page.....................................................32
2.4 Common Ranges Page.....................................................................................................34
2.4.1 Use Time Period Relative to Current Workstation Time ............................................35
2.4.2 Range Period..............................................................................................................35
2.4.3 Common Minimum Y-Axis..........................................................................................35
2.4.4 Common Maximum Y-Axis.........................................................................................36
2.5 Common Data Page..........................................................................................................36
2.5.1 Display Range ............................................................................................................36
2.5.2 Display Refresh Period...............................................................................................36
2.5.3 Advanced Data Retrieval Settings Dialog ..................................................................36
2.5.3.1 When to Change the Advanced Data Retrieval Settings.....................................37
2.5.3.2 Data Update Collection Interval...........................................................................37
2.5.3.3 Maximum Samples per Pen.................................................................................37
2.5.3.4 Maximum Pages of Data......................................................................................37
2.6 Graph Page.......................................................................................................................38
2.6.1 Border Style................................................................................................................38
2.6.2 File Style.....................................................................................................................39
Use Time Period Relative to Current Workstation Time......................................24
2.3.9.2.1 Limit Type.......................................................................................................26
2.3.9.2.2 Value/Data Source..........................................................................................26
2.3.9.2.3 Limit Line Styles Dialog..................................................................................26
2.3.9.2.3.1 Line Visibility.............................................................................................26
2.3.9.2.3.2 Line Plot Style..........................................................................................26
2.3.9.2.3.3 Line Width................................................................................................26
2.3.9.2.3.4 Line Style..................................................................................................26
2.3.9.2.3.5 Line Color.................................................................................................27
2.3.10.1.1 Marker Style..................................................................................................28
2.3.10.1.2 Marker Color.................................................................................................29
2.3.10.1.3 Constant.......................................................................................................29
2.3.10.1.4 Expression Selected.....................................................................................29
2.3.10.1.5 Expression Editor..........................................................................................29
2.3.10.1.5.1 Expression Editor Dialog........................................................................30
2.3.10.2.1 X-Axis Placement.........................................................................................33
2.3.10.2.2 Y-Axis Placement.........................................................................................33
2.3.10.2.3 Autoscale......................................................................................................33
2.3.10.2.4 Deadband.....................................................................................................33
2.3.10.2.5 Pen Axis Configuration Dialog Styles Page .................................................34
2.3.10.2.5.1 Label Angle............................................................................................34
2.3.10.2.5.2 Label Font..............................................................................................34
2.3.10.2.5.3 Label Color.............................................................................................34
2.3.10.2.5.4 Label Visibility.........................................................................................34
2.3.10.2.5.5 Show Full Details on Axis.......................................................................34
- iii -
Page 5

Reference Guide
w
D301544X412
APRIL 2012
Fill Color......................................................................................................................39
2.6.3
2.6.4 Fill Angle.....................................................................................................................39
2.6.5 Show Multiple X-Axis..................................................................................................39
2.6.6 Show Multiple Y-Axis..................................................................................................39
2.6.7 Grid Configuration Dialog...........................................................................................39
2.6.8 Marker Configuration Dialog.......................................................................................40
2.6.9 Common Axis Configuration Dialog General Page....................................................40
2.6.9.1 X-Axis Placement.................................................................................................41
2.6.9.2 Y-Axis Placement.................................................................................................41
2.6.9.3 Autoscale .............................................................................................................41
2.6.9.4 Deadband.............................................................................................................41
2.6.9.5 Independent Scaling (IS) .....................................................................................42
2.6.9.6 Common Axis Configuration Dialog Styles Page.................................................44
2.6.9.6.1 Label Angle.....................................................................................................44
2.6.9.6.2 Label Font.......................................................................................................44
2.6.9.6.3 Label Color.....................................................................................................44
2.6.9.6.4 Visible.............................................................................................................44
2.6.9.6.5 Show Full Details on Axis...............................................................................44
2.7 Common Limits Page........................................................................................................45
2.7.1 List of Limits................................................................................................................45
2.7.2 Limit Configuration Dialog ..........................................................................................45
2.7.2.1 Limit Type.............................................................................................................45
2.7.2.2 Value/Data Source...............................................................................................45
2.7.2.3 Line Style Dialog..................................................................................................46
2.7.2.3.1 Line Visibility...................................................................................................46
2.7.2.3.2 Line Plot Style.................................................................................................46
2.7.2.3.3 Line Width.......................................................................................................46
2.7.2.3.4 Line Style........................................................................................................46
2.7.2.3.5 Line Color.......................................................................................................47
2.8 Parameters Page ..............................................................................................................47
2.8.1 Permanently Resolving Aliases..................................................................................47
2.8.2 The Parameter Name.................................................................................................48
2.8.3 The Current Value of the Parameter..........................................................................48
2.8.4 The Default Value of the Parameter...........................................................................48
2.9 Time Zone Page................................................................................................................48
2.9.1 Adjust Time Values.....................................................................................................48
2.9.2 Time Zone...................................................................................................................49
Trend Vie
3 Runtime Mode........................................................................................................................49
3.1 1) Graph Pane...................................................................................................................49
3.2 2) Pen Traces....................................................................................................................49
3.3 3) Sample Tooltip..............................................................................................................50
3.4 4) Sample Marker Bar.......................................................................................................50
3.5 5) Date - Time Scroll Bar...................................................................................................50
3.6 6) Block Pan and Time Adjustment Buttons .....................................................................50
3.7 7) Value Scroll Bar (zoomed)............................................................................................51
3.8 8) Details Pane..................................................................................................................51
3.9 9) Multiple Axes.................................................................................................................51
3.10 10) Graph - Details Splitter............................................................................................52
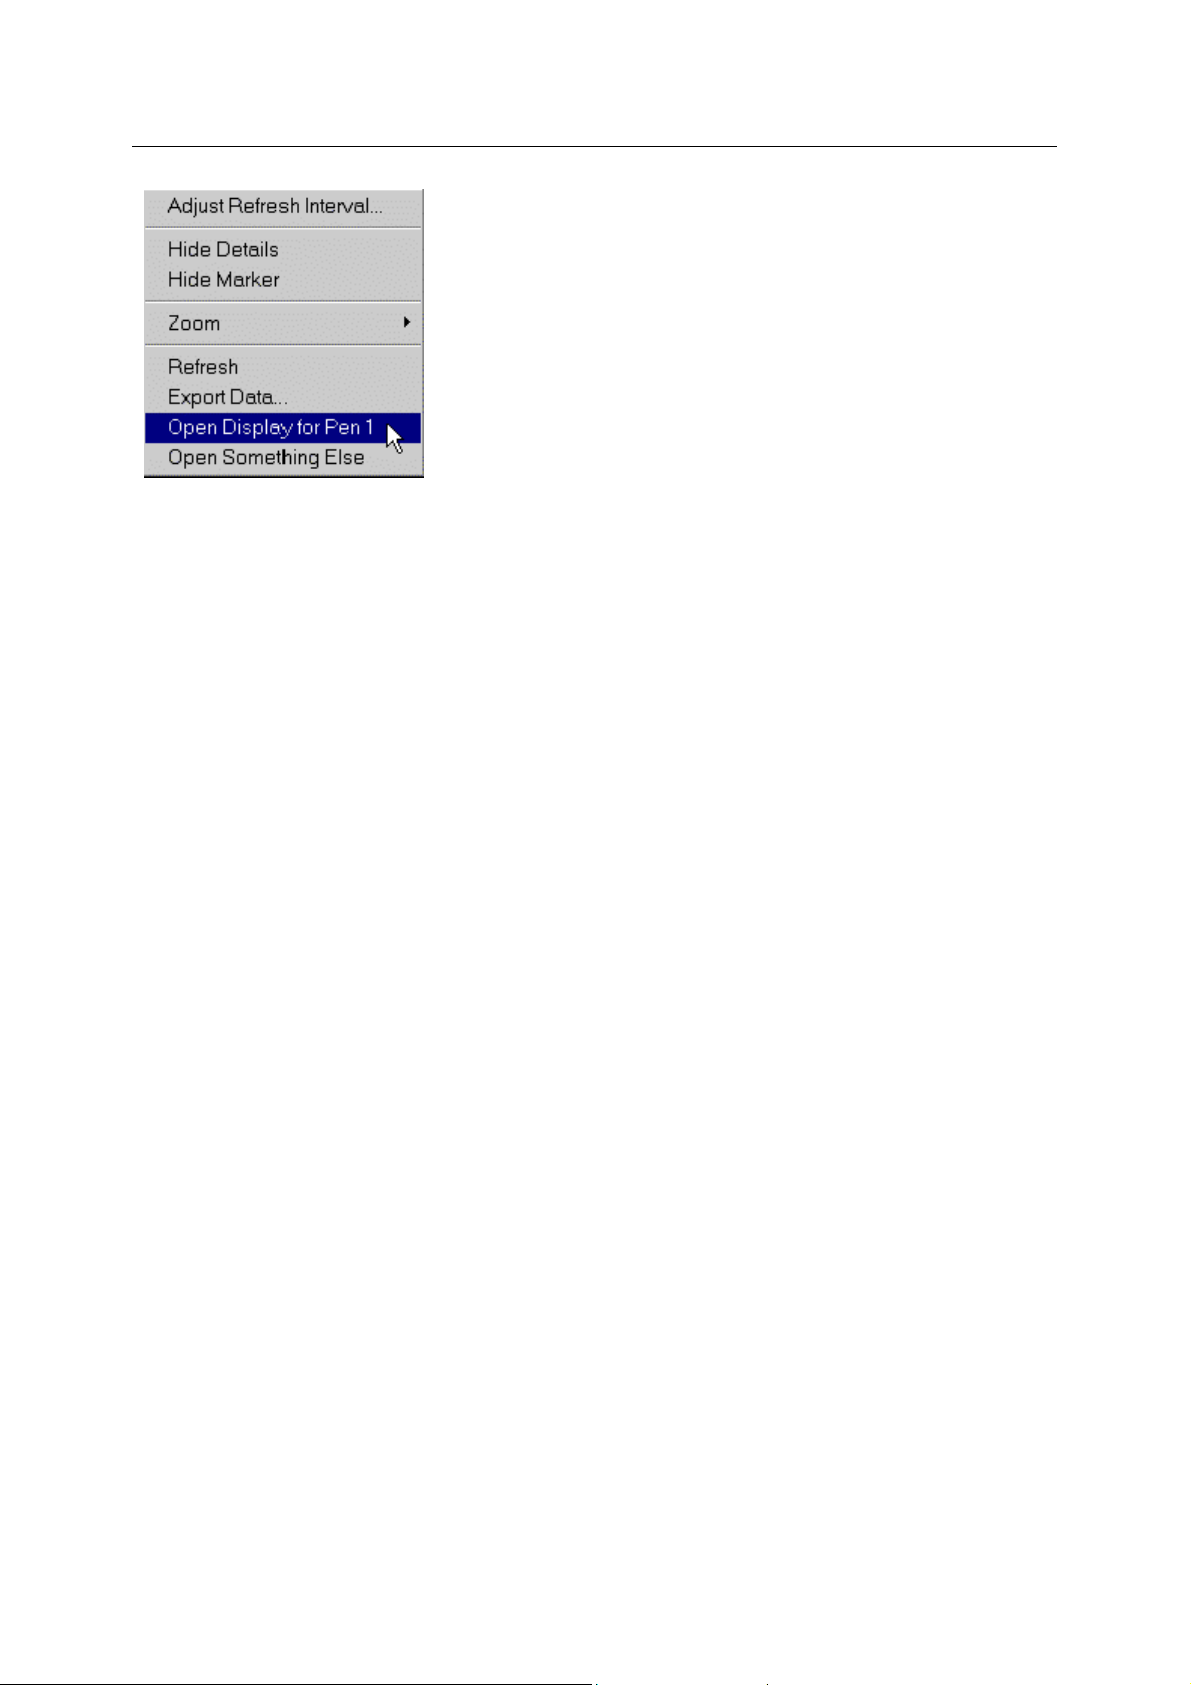
3.11 Graph Pane Context Menu............................................................................................52
- iv -
Page 6

Reference Guide
w
D301544X412
APRIL 2012
Adjust Refresh Interval............................................................................................53
3.11.1
3.11.2 Hide Details.............................................................................................................53
3.11.3 Hide Marker.............................................................................................................53
3.11.4 Zooming ..................................................................................................................53
3.11.5 Refresh....................................................................................................................54
3.11.6 Export Data .............................................................................................................54
3.11.7 Showing all Data .....................................................................................................54
3.12 Details Pane Context Menu...........................................................................................54
3.12.1 Modify Pen ..............................................................................................................55
3.12.2 Add Pen...................................................................................................................55
3.12.3 Remove Pen............................................................................................................55
3.12.4 Remove All Pens.....................................................................................................55
3.12.5 Hide Pen..................................................................................................................55
3.12.6 Hide X-Axis..............................................................................................................55
3.12.7 Hide Y-Axis..............................................................................................................55
3.12.8 Adjust Time Range..................................................................................................55
4 Worked Examples..................................................................................................................56
4.1 Add a Realtime Pen in Runtime Mode..............................................................................56
4.1.1.1 Method .................................................................................................................56
4.2 Performance Optimization Example .................................................................................57
4.3 Marker Bar Example .........................................................................................................57
4.4 Changing the Display Period ............................................................................................ 57
4.4.1.1.1.1 Method.....................................................................................................57
4.5 Trend Overlay (Same Source Pens).................................................................................57
4.5.1.1.1.1 Method.....................................................................................................57
Trend Vie
5 Index .......................................................................................................................................59
- v -
Page 7
Reference Guide
w
D301544X412
APRIL 2012
Trend Vie
1 Trend View
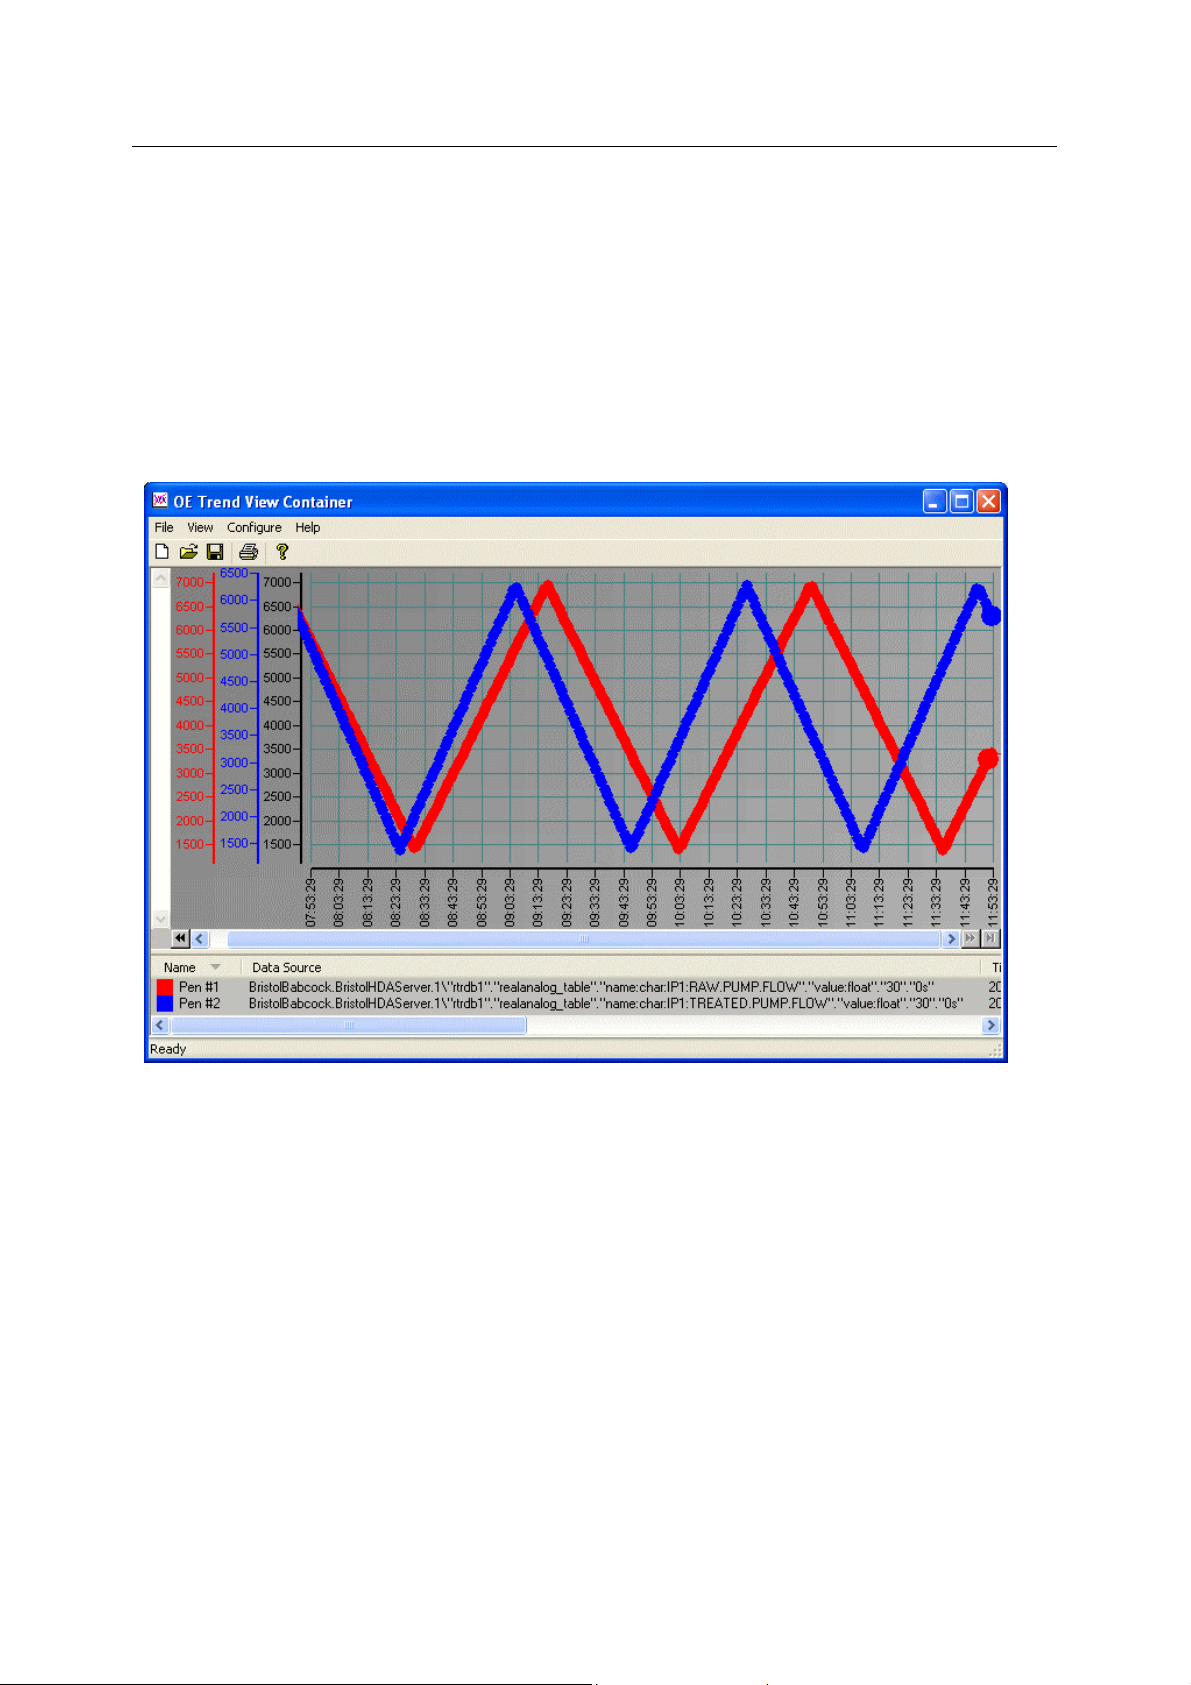
1.1 Overview
The Trend View provides the user with the ability to configure and view Realtime and Historical
Trends either inside the OpenEnterprise Desktop, embedded in a display, or within its own containe r
as shown below.
1.2 Realtime and Historical Tags
A pen on a trend can either be a realtime or an historical pen:
The realtime pen uses Data Access OPC tags to plot the current value of a signal from the
moment the trend is opened. It does not show any data from before that time.
The historical pen uses Historical Data Access OPC tags to plot a range of values stored in
the database from a time in the past.
OPC stands for OLE for Process Control, and it is the agreed standard for displa ying process control
data on a computer. The client OPC control requests the data from an OPC server using OPC tags.
There are two separate OPC standards used by the trend view; one for requesting realtime data (this
is called the Data Access standard) and one for requesting historical data (called the Hi storical Data
Access standard). The BristolOPCServer serves realtime process control data to the OE trend view
client and the BristolHDAServer serves it historical data.
- 1 -
Page 8

Reference Guide
w
D301544X412
APRIL 2012
Trend Vie
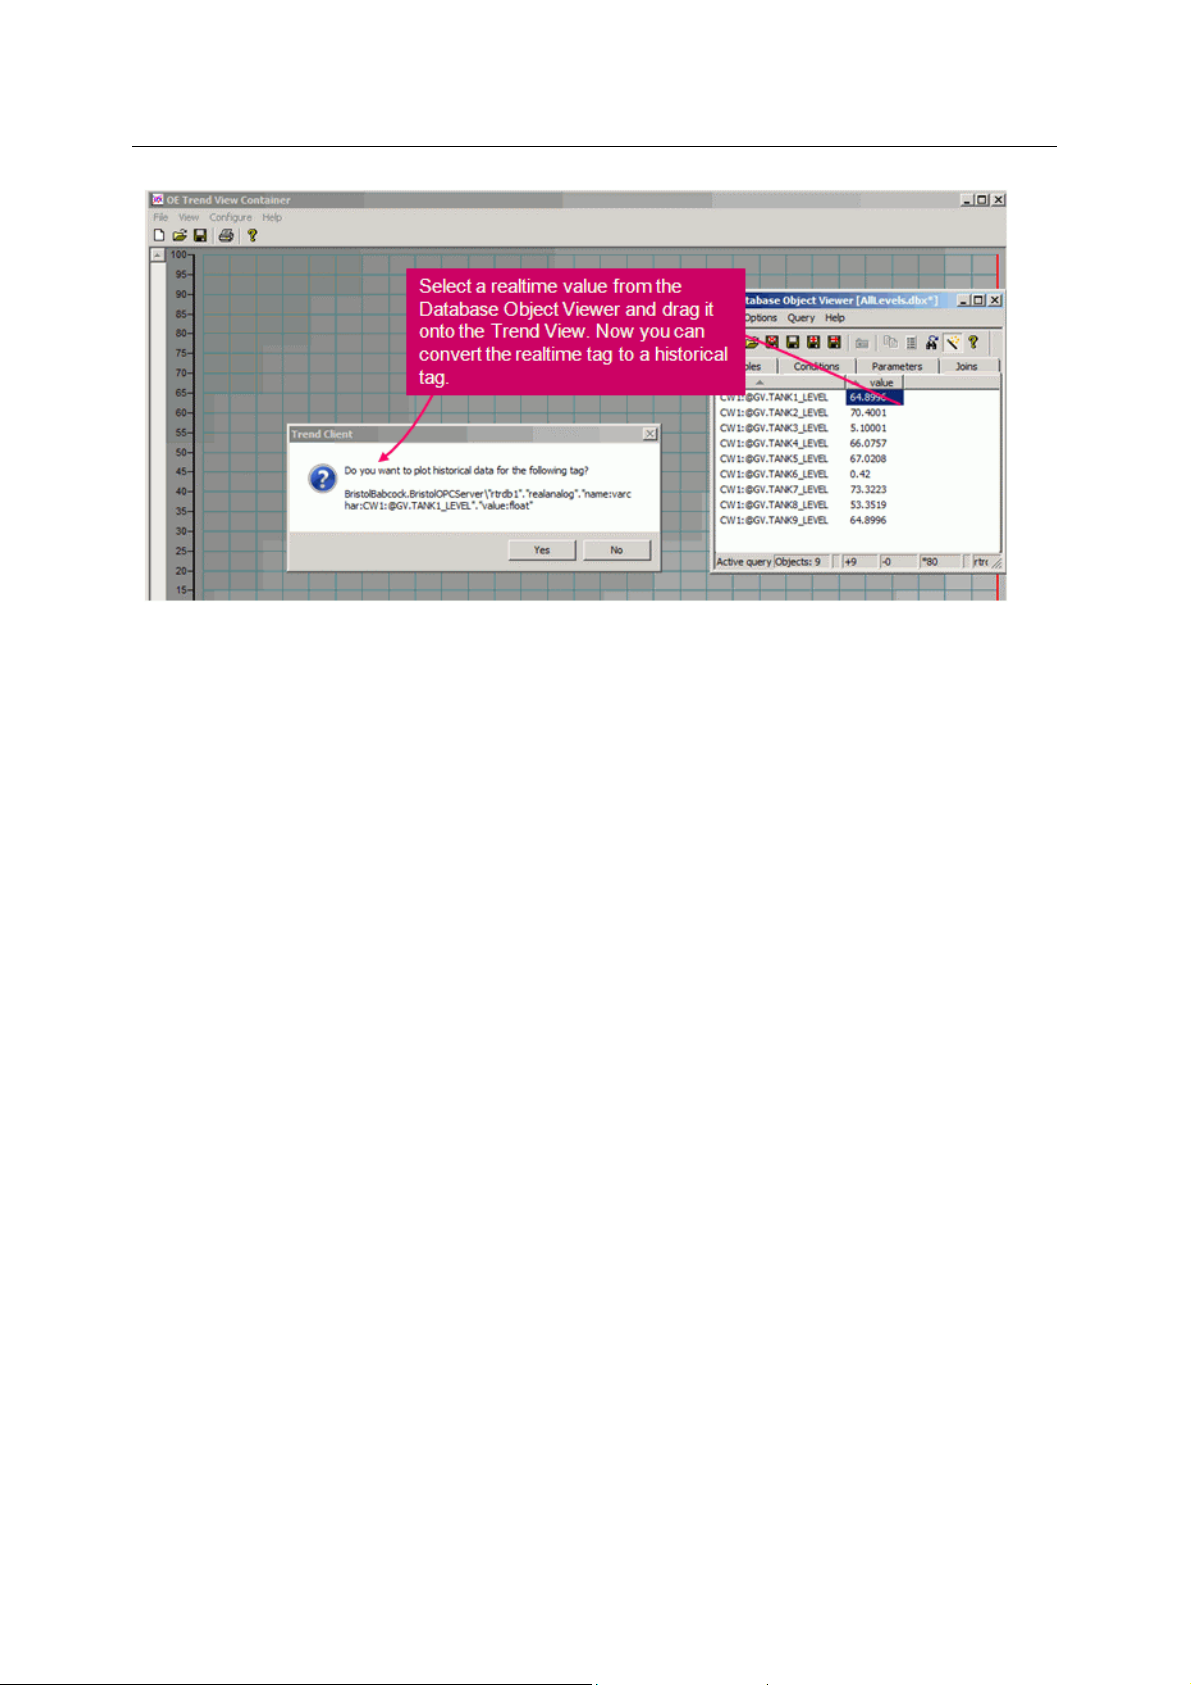
1.2.1 Creation of Realtime Pens
To create a realtime pen you can configure a query using the Database Object Viewer and then dragdrop a value onto a trend as shown below. The value is converted to a realtime (Data Acess) OPC tag
in the trend.
1.2.2 Creating Standard Historical Pens
Using the 'drag-drop' method described above does not create historical pens, as the Database
Object Viewer only sources realtime tags.
To create historical pens, you can either use the Tag Browser or make the trend convert dragged
realtime tags to historical tags.
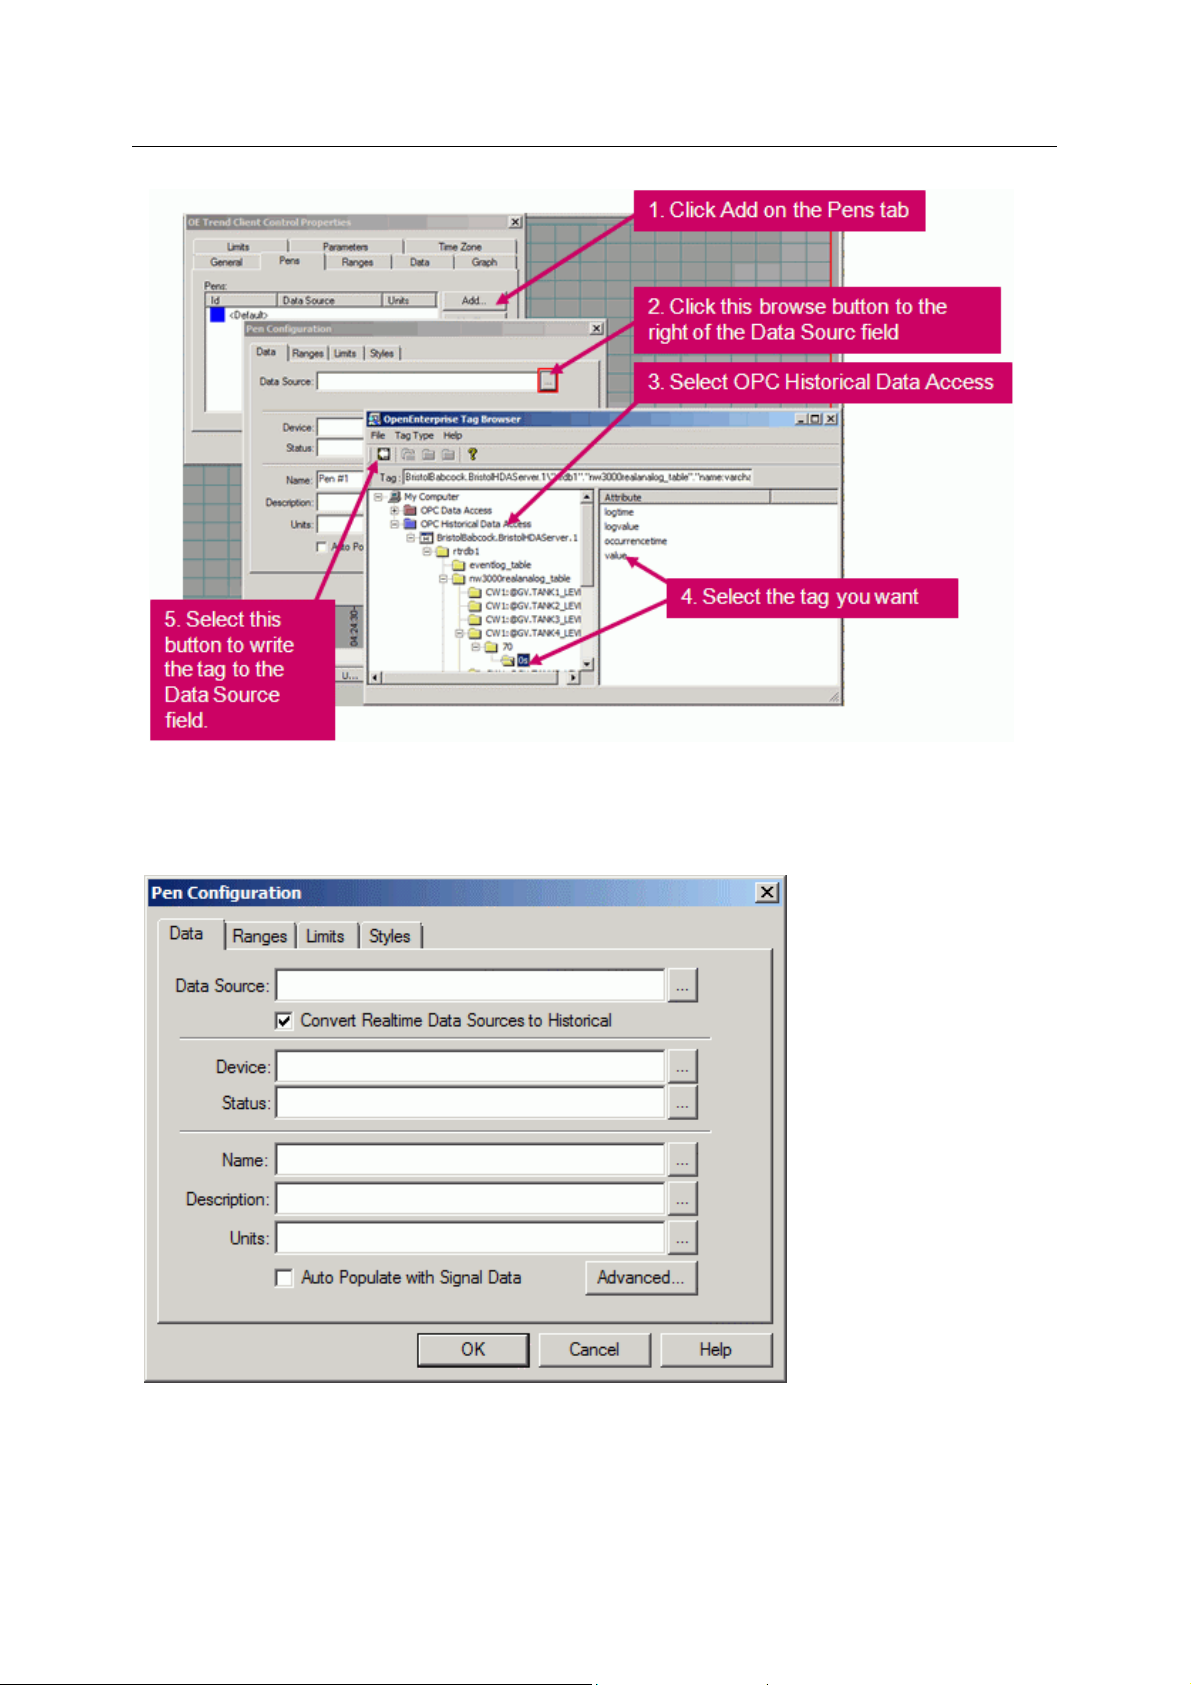
1.2.2.1 Using the Tag Browser
The Tag Bro
the Data Source field for a pen.
wser is accessed from the small browse button marked with three dots [...], to the right of
- 2 -
Page 9
Reference Guide
w
D301544X412
APRIL 2012
Trend Vie
1.2.2.2 Setting up the Default Pen to convert dropped realtime to historical tags
Put the trend view into co
tab and click Modify. Check the "Convert Realtime Data Sources to Historical" box. Then click OK.
nfiguration mode, right click and select the Properties menu. Select the Pens
Now, when you drag a realtime value onto the trend from the Database Object Viewer, you can
choose to convert it to a historical OPC tag.
- 3 -
Page 10
Reference Guide
w
D301544X412
APRIL 2012
For more information on this, see the Pen Configuration Data Page topic.
Trend Vie
1.2.3 Historical Backfill Tags
For SCADA systems that may encounter periodic loss in communications with RTUs OpenEnterprise
can be set up to use historical backfill. This enables OE to collect historical data collected at the RTU
during the communication downtime and backfill it into its history tables. In this way no data is ever
lost.
In order for the Trend to plot historical data that has been backfilled from the RTU, you need to modify
the standard historical tag to add ".timecolumn:logtime" at the end of the tag as in this example:
BristolBabcock.BristolHDAServer.1\"rtrdb1"."nw3000realanalog_table".
"name:varchar:NORTH:V1.ASV.DPRS.VALUE"."logvalue:<coltype>"."2"."0s".
"timecolumn:logtime"
Note: The tag has no spaces or new lines. It is presented in this way for ease of viewing.
1.2.4 Historical Backfill Tags with Performance Mode
The trend view offers two modes of operation. Data mode is the default (see the Optimize for Data
topic). This displays all requested samples. However, when there are likely to be many thousands of
samples returned, the trend's performance may be affected.
Performance mode (see the Optimize for Performance topic) reduces the number of samples i nitially
requested, speeding up the process.
In order to use Performance mode with historical backfill tags you need to add a further expression to
the end of the historical backfill tag (e.g. "rate:1m") which specifies the logging frequency that you
wish the trend to use as it calculates what samples to request. Here is an example:
BristolBabcock.BristolHDAServer.1\"rtrdb1"."nw3000realanalog_table".
"name:varchar:XWUSLAAH26100:V1.ASV.DPRS.VALUE"."logvalue:<coltype>"."2"."0s
".
"timecolumn:logtime"."rate:1m"
The rate expression can refer to seconds, minutes or hours. For example:
- 4 -
Page 11

Reference Guide
w
D301544X412
APRIL 2012
"rate:15s" = 15 seconds
"rate:1m" = 1 minute
"rate:1h" = 1 hour
Note: The tag has no spaces or new lines. It is presented in this way for ease of viewing.
Trend Vie
2 Configuration
2.1 Accessing the Property Pages
Configuration of the Trend View, as with all other Views requires that the user accesses the 'Property'
pages for the component. To access the Trend View's Property Pages, it is necessary to place it into
configuration mode. There are two ways to do this.
2.1.1 The Configure Menu
This is method is slightly different depending where the Trend View is being displayed: -
2.1.1.1 The OpenEnterprise Desktop
Select the Trend View to
menu item from the OpenEnterprise Desktop.
2.1.1.2 The Trend View Container
If the Trend View is runni
Trend View Container's menu bar.
make it the active window. Then select the File>Mode>Configure
ng within its own container, then select the Configure menu from the
2.1.2 The Keyboard option
Whether the Trend View is running within the Desktop or its own container, it can be toggled in and
out of configure mode by selecting the [Ctrl] and [M] keys together on the computer's keyboard.
2.1.2.1 The Context Menu
Once in co
nfigure mode, use the mouse and right click on the Trend View reveal its context menu :-
Select 'Properties' to display the Property Pages for the Trend View.
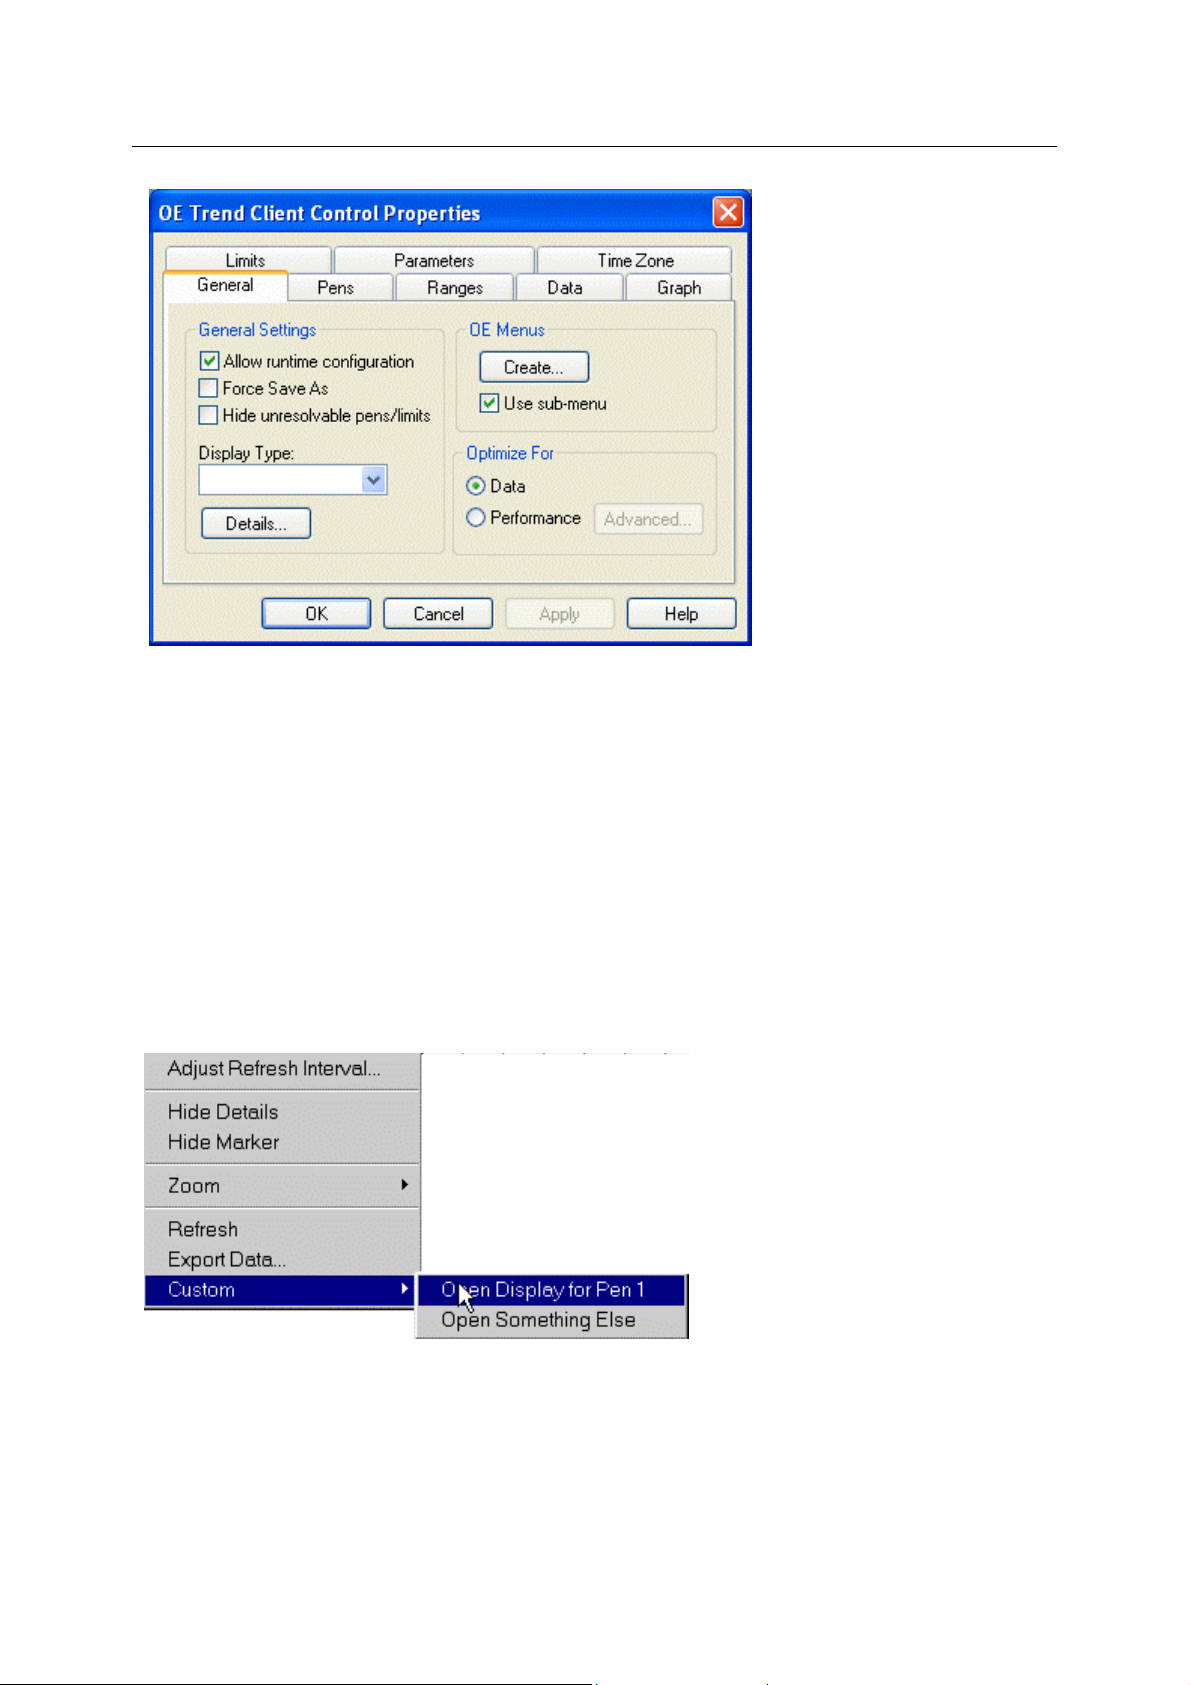
2.2 General Page
The General Page enables you to select the Trend display type, create context sensitive menu items
for the Trend View, configure the 'Details' section of the Trend View and toggle Runtime configuration
availability.
- 5 -
Page 12
Reference Guide
w
D301544X412
APRIL 2012
Trend Vie
.
2.2.1 Display Type
This drop-down list will enable the user to select the type of Trend display. Currently, only 'Graph' type
is available.
2.2.2 Create Menu Button
Select the [Create...] button to open the Menu Editor.
This enables the user to configure context sensitive menu items for the Trend View. Refer to the
Menu Editor help for further information on how to configure Context Menus.
2.2.3 Use Sub Menu
When checked, a separate sub-menu, entitled 'Custom' is used for custom context menu items. See
the OEMenus Help file for more information.
When the [Use sub-menu] box is left unchecked any Custom Menu items configured for this Trend
View will be added directly on to the bottom of the Trend View context menu as shown below.
- 6 -
Page 13
Reference Guide
w
D301544X412
APRIL 2012
Trend Vie
2.2.4 Allow Runtime Configuration
If this is checked, then the 'Properties' option on the Trend View context menu is available during
runtime operation.
2.2.5 Hide Unresolvable Pens and Limits
If this box is checked, any Pens or Limits containing unresolved aliases will be hidden both in the
Graph pane and the Details pane.
2.2.6 Force Save As
This option enables the TVD file to be set up as a ‘template’ and then ‘locked’. If the box is ticked and
the file is then saved it will be impossible to save to this file again until the Force Save As functionality
is turned off. In order to allow the user to turn it off, when the checkbox is un-ticked, it will be
immediately possible to save to it again.
When the Force Save As is enabled and the file is saved, the file’s attributes will be modified to set it
as read-only. When it is disabled and saved, the read-only attribute will be unchecked.
When a File->Save on a Trend in Desktop invoked, OpenEnterprise will check to see if the Trend has
Force Save As enabled. If it has, it will produce a Save As dialog forcing the user to save the file
somewhere else. The Save As dialog will be populated with a different name from the current TVD
file, preventing the user from trying to write straight back over the top of the file. This new name will
be the original filename with a 1 appended to the end. E.g. MyTrend.tvd will become MyTrend1.tvd.
Once a file with Force Save As enabled is saved to a new location, Force Save As will automatically
be disabled in the new file. This will allow the new ‘copy’ of the original to be saved over.
If a user selects File->SaveAs in Desktop for a Force Save As enabled file, the new file will still have
Force Save As enabled. This is because the user will have chosen to copy this file to a new location.
Also, selecting File->SaveAs will not result in the new filename being generated.
It will be possible to enable and disable the Force Save As functionality from the Trend Client’s
Automation Interface.
General Page
2.2.7 Optimize for Data
The default option for Trends. When selected, the Trend will get all data that falls within the Range
specified on either the Common Ranges page, or the Pen Ranges page, and will attempt to display it.
- 7 -
Page 14

Reference Guide
w
D301544X412
APRIL 2012
When trending large time ranges, the maximum number of samples defined on the Advanced Data
Retrieval Settings dialog must be set to a realistic figure. Trend performance could be affected when
very large numbers of samples are being requested. In these circumstances, it is advisable to select
the [Performance] option, in order to work out a satisfactory data granularity to display area ratio.
Trend Vie
2.2.8 Optimize for Performance
Allows fine tuning between the available display area and sample granularity for optimum Trend
performance. Select the [Advanced...] button, which becomes enabled when this button is selected to
open the Advanced Optimization dialog.
For further help on how Performance Optimization works, see the Performance Optimization section.
2.2.9 Performance Optimization
The following pages explain how Performance Optimization works and how it affects the use of the
Trend generally. Read these pages to gain a better understanding of the ramifications of using the
Performance Optimization feature.
Note: If the historical dataset for the pen is using historical backfill, you will need to modify the OPC
tag manually. See the Historical Backfill Tags with Performance Mode section of the Realtime and
Historical Tags topic for more information.
2.2.9.1 Resolution
In Performa
Client’s Resolution. E.g. if the Resolution is 5 minutes and a sample is drawn at time T, no other
sample can be drawn in the range T +/- 5 minutes.
Due to the way that optimised data is returned from the HDA Server this is based on the first sample
received rather than an average of all the samples that are available within an interval.
The Resolution is calculated automatically using these specific formulae:
Resolution = X Axis display range time / (pixels on X Axis / pixels per sample) OR
Resolution = X Axis display range time/(pixels on X Axis * samples per pixel)
It is calculated when the Trend is initially drawn and when the user zooms in and out. A recalculation
will result in new requests on the HDA Server due to the fact that not all the data may be present (see
the ‘Optimization and the HDA Server’ page).
2.2.9.2 Zooming with Optimization
n a Trend is in the default Data mode, after a zoom-in operation, the visible area changes to be
Whe
the selected zoom area. However, the full range of the Trend stays the same. Therefore the handles
on the scroll bars shrink to indicate more data is available off-screen and any part of the original total
area of the Trend can be viewed through scrolling.
nce Mode, the minimum space permitted between each sample is termed the Trend
However, when the user zooms in under Performance Mode, the granularity of the data increases and
so there will potentially be more points to return and draw. This in turn means the performance of the
Trend has the potential to decrease. The further the user zooms in, the bigger the potential decrease
in performance until eventually the Trend performance will be the same as it is in data mode.
- 8 -
Page 15

Reference Guide
w
D301544X412
APRIL 2012
In order to avoid this scenario, when the user zooms under Performance Mode, the total X Axis of the
Trend shrinks to the zoomed in area. For example, a Trend is set up to display 1 day’s worth of data.
If the user highlight’s 1 hour’s worth of data, the Trend’s X axis will be clipped to display ONLY that 1
hour’s worth of data.
This in turn means that no X-Axis scrolling is available under Performance Mode zooming. The only
way to move left and right will be to block pan. However, once the user has block-panned they will be
able to scroll within the new block-panned range.
The original X Axis time range is restored only when the user completely undoes all zooming. This is
achieved by selecting ‘Zoom Undo’, ‘Zoom Undo Full’ or ‘Refresh’ from the Graph context menu.
2.2.9.3 Optimization and the HDA Server
Trend Vie
When the Trend is in Performance Optimization m
return a number of records relevant to the current Resolution.
2.2.9.3.1 Historical Streams Triggered by Value Changes
Note that in order for Performanc
collect samples on value changes (triggered collection) you need to add a rate section at the end of
the tag in the trend. This is because triggered streams have no fixed data collection rate, so you need
to specify a rate that the trend can use so that it can calculate which samples to request. See the
Realtime and Historical Data topic for more information.
2.2.9.4 Visible and Non-visible Data
n in Performance Optimization mode, the query mechanism is modified to query only the
Whe
requested visible data initially. Once this has been returned the rest of the data will be returned. By
splitting the non-visible data up into chunks (or ‘sub-pages’), filling in data becomes more of a
background task.
For example, if a Trend is set up for 1 day’s with 8 hour’s data visible, the visible 8 hours will be
queried for first. Once this is returned the rest of the data will be retrieved.
This also applies to block panning left and right. Rather than a whole new page being fetched in one
go, it will be fetched in sub-pages.
When non-visible data is being fetched, the user will still be able to interact with the Trend e.g.
perform a rubber-band zoom.
e Optimization to work for historical streams that are configured to
ode, the HDA Server will optimise its queries to only
2.2.9.5 Showing all Data
In Performa
to the fact that only a subset of the data is being displayed. The Show All Data option on the Trend's
context menu provides a solution to this problem while still maintaining performance improvements.
When this option is selected, the current visible range of data is refreshed, applying no resolution
restriction. This returns and displays all available data for the visible range. De-selecting this option
re-applies the current resolution setting and restricts the amount of data shown a gain.
When all data is currently being shown the context menu will be ticked. When it is only showing a
subset, it will be un-ticked.
This menu option is controlled by a Trend View Application Token called Show All Data.
nce Mode, it is possible that certain peaks and troughs in the data may not be shown due
- 9 -
Page 16

Reference Guide
w
D301544X412
APRIL 2012
The Show All Data context menu option is a runtime only option and is not saved to the TVD file.
Selecting Show All Data could potentially cause a large performance hit in the Trend View. For
example, if a month’s worth of data were on view a potentially very large set of samples could be
returned. To guard against this , when the user selects this option, a dialog is displayed warning the
user that this may affect Trend performance. It asks if the user wishes to continue. If they select [Yes]
the switch to showing all data is allowed. If they select [No] the operation is cancelled.
There is a checkbox on this dialog allowing the user to specify that it should not be shown again. This
will set a value called DisableShowAllDataWarning to 1 under the OpenEnterprise\Tasks\Trend Client
key in the OpenEnterprise settings file. To enable the dialog again, this value must be reset to 0
(zero) using the Settings Editor.
Trend Vie
2.2.9.6 Data Subset Warning
To indicate to the user that not all of the data availabl
be shown in the bottom left hand corner of the Trend Grid (in the intersection of the scroll bars):
This new icon will be tied to what data is being displayed, not whether Performance mode is enabled.
In other words, when all potential data is being displayed there will be no icon in the area, and when
Performance Mode is initially enabled, the icon will appear.
However, if the user were to select Show All Data from the runtime context menu, although
Performance Mode is currently still enabled all the data in the current visible range is being displayed.
Therefore the warning icon will be removed. If the user were to deselect Show All Data, then it would
return.
e is currently being displayed, a warning icon will
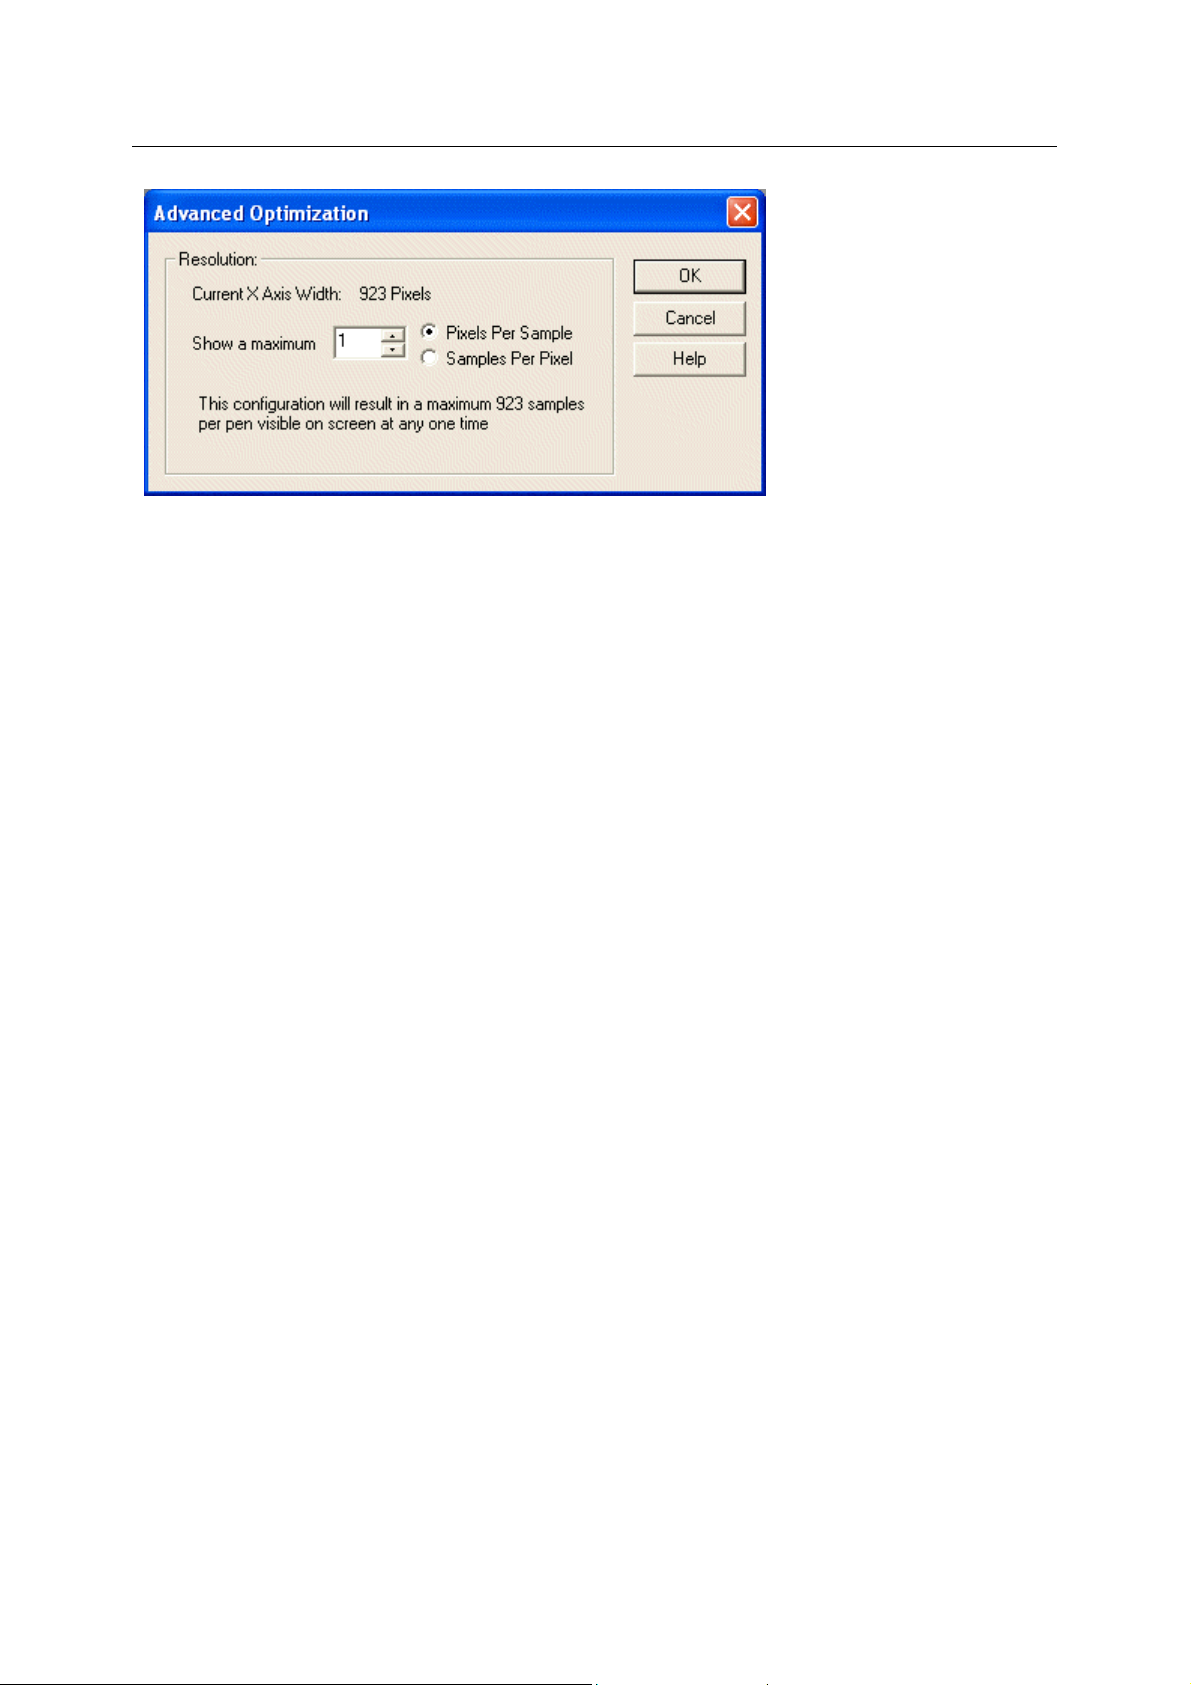
2.2.10 Advanced Optimization Dialog
The Advanced Optimization dialog enables you to fix a ratio between the available display area on
the Trend, measured as pixels on the X Axis against the number of samples to display per pixel. Click
the hotspots on the image below for further help on this dialog.
It is not possible to change these settings when the Trend is in Runtime mode. However, there is a
context menu item available from the Trend Graph area called Show All Data. This enables the user
to toggle between seeing the Performance Mode optimised data and viewing all the available data for
the selected range (as it would appear in Data Mode).
Note: Although the Show All Data option displays data in the same way as Data Mode, the Trend in
fact remains in Performance Mode. This means that the Performance Mode zooming functionalit y still
applies.
- 10 -
Page 17
Reference Guide
w
D301544X412
APRIL 2012
General Page
2.2.10.1 Current X Axis Width
Trend Vie
Displays the
only. The X axis width when this dialog is displayed may well change depending on the size of the
grid area at runtime. For instance, if you show more axes then there will be less pixels available.
2.2.10.2 Maximum Number
The sp
selected. Enter a numerical value between 1 and 9999.
2.2.10.3 Pixels Per Sample
This optio
512 and 2 pixels per sample is chosen, there will be a maximum 256 samples visible per pen a t any
one time. Using this option, the number of pixels available determines the maximum number of
samples which can be displayed. The default setting is 1 pixel per sample.
This option trades faster display of data against lower granularity of data.
2.2.10.4 Samples Per Pixel
This optio
in pixels is 512 and 2 samples per pixel is chosen, there will be a maximum 1024 samples visible per
pen at any one time.
This option trades finer granularity of data against slower display of data.
2.2.10.5 Maximum Samples Possible
amount of pixels currently available for display on the X Axis. This is shown as a guide
ecified maximum number of pixels per sample or samples per pixel, depending on the option
n assigns a number of pixels to each sample. For example, if the current width in pixels is
n assigns a maximum number of samples to a single pixel. For example, if the current width
The text displ
given the current settings.
Note that this number is given as a guide only. The X axis width when this dialog is displayed may
well change depending on what happens at runtime. For instance, if the user adds a Pen to the Trend
at runtime, then more axes are displayed, making less pixels available, and therefore less samples
can be displayed.
ayed here indicates the highest number of samples that can be displayed on the Trend
2.2.11 Detail Sub Page - General Tab
This dialog enables you to configure the visual aspects of the Details Pane.
- 11 -
Page 18

Reference Guide
w
D301544X412
APRIL 2012
2.2.11.1 Background Color
Trend Vie
Click on the
changed.
2.2.11.2 Text Color
Click on the
changed.
2.2.11.3 Number of Decimal Places
This field will
'Details' section of the Trend View. Select the check box to enable the 'Decimal Places' field. Change
the number of decimal places with the spin control or type the number directly in the field.
2.2.11.4 Show Milliseconds
If checked, the Detail
2.2.11.5 Visible
Checking thi
2.2.11.6 Autosize Columns
When this box is checked the col
Runtime operation.
colored square for a palette that enables the background color of the Details pane to be
colored square for a palette that enables the color of the text within the Details pane to be
determine how many decimal places are displayed for real number values within the
s pane will display time based attributes to millisecond resolution.
s box will hide the Details pane.
umns will auto resize themselves to fit the text within them during
2.2.11.7 Detail Sub Page - Attributes Tab
This dial
og enables you to configure the attributes that will be displayed within the Details Pane.
- 12 -
Page 19

Reference Guide
w
D301544X412
APRIL 2012
2.2.11.7.1 Available Attributes
Trend Vie
This is
will not appear in the Details pane in runtime. When an attribute from this list is added to the Selected
attributes pane, it no longer appears as an available attribute until it is removed from the Selected list.
2.2.11.7.2 Add button
Selecting thi
attributes list.
2.2.11.7.3 Add All button
Selecting thi
selected or not into the Selected attributes list.
2.2.11.7.4 Remove button
This button m
attributes list.
2.2.11.7.5 Remove All button
All attributes
attributes list.
2.2.11.7.6 Selected Attributes
Any attributes within this list will be displ
a list of the attributes available for inclusion within the Details pane. Any attributes in this list
s button adds any attributes selected from the Available attributes list to the Selected
s button places all attributes from the Available attributes list, whether they are currently
oves any highlighted attributes from the Selected attributes list back into the available
will be removed from the Selected attributes list and be placed back into the Available
ayed in the Details pane in runtime.
2.2.11.7.7 Re-ordering Selected Attributes
Attributes in the Selecte
in the list. Attributes in the list from top to bottom are placed into the Details pane in order from left to
right.
d attributes list can be rearranged by clicking and dragging them up or down
2.3 Pens Page
The Pens page enables you to add, modify and remove pens from the Trend. Pens are defined by
OPC tags. As such, pens can be drag-dropped from the Database Object Viewer into the Current
Pens list. Click here to view an animation of this operation.
- 13 -
Page 20

Reference Guide
w
D301544X412
APRIL 2012
Trend Vie
2.3.1 List of Current Pens
This list shows the Pens that have been configured. In a newly opened Trend, the only pen showing
is the Default Pen. The Default Pen should be used as a template for creating all other pens. It allows
a user to create a set of basic preferences (e.g. a particular line style) that they wish to be used
whenever they create a pen.
The Default Pen will always be the first Pen listed. It can be identified by the '<Default>' value in the
ID attribute.
Selecting the Default Pen in the Pens List will enable the Modify button as it would for a Standard
Pen. However it will not enable the ‘Remove’ or ‘Remove All’ buttons. Pressing the ‘Modify’ button
with the Default Pen highlighted will display the Pen Configuration dialog in the same way that it
would for a Standard Pen.
Example Use of the Default Pen
2.3.2 Characteristics of the Default Pen
Since the Default Pen is there to be used as a template for all other pens has certain characteristics
which set it apart from what we call Standard Pens.
2.3.2.1 General Characteristics
The Defa
Trend. It is not displayed in the Details list on the main Trend control. There is only one Default Pen in
a given Trend. All other Pens that get created will be Standard Pens.
ult Pen never has any of its Tags resolved and never has any of its data plotted on the
Whenever a user adds a Standard Pen it will be created as a copy of the Default Pen. This includes
• Pens added from the Context Menus in the Trend Client
• Pens dynamically added to a Trend via OEMenus
• Pens dragged and dropped from Database Object Viewer
• Pens added by the Automation Interface.
- 14 -
Page 21

Reference Guide
w
D301544X412
APRIL 2012
All data in the Default Pen will be copied to the new Standard Pen. This includes the Default Pen’s
Axes, Limits and any Expressions defined.
All Pens are assigned a unique Pen ID. For Standard Pens this will start at ‘Pen 0’ and increment
upwards. The Default Pen’s ID will be ‘<Default>’. This means that the Pen ID will be the only
property of a Standard Pen that will not be copied from the Default Pen.
It will not be possible to delete the Default Pen from the Pen list.
2.3.2.2 Color and the Default Pen
Trend Vie
Each Stand
both the Details List Control and the Pens List Control. If the Pen has a color rather than an
Expression defined for its Line Color, then this will be used as the Pen’s Main Color. However, if the
Pen does have an Expression defined as its Line Color, the Pen’s Y-Axis color will be used as the
Pen’s Main Color.
When a standard Pen is created, all of its colors will be copied from the Default Pen. That is, the Line
Color, Marker Color and Axis Colors.
The Default Pen will then change its Main Color to prevent two Pens from having the same color. This
will mean changing the Line Color, the Marker Color and the two Axis Colo rs. However, each color
will only be changed it if matches the current Main Color. This is so that a user may alter one of the
colors in the Default Pen and not have this color changed every time a new Pen is created.
For example, if the Default Pen’s current Main Color is red and the new Main Color will be blue, the
Marker Color will only be changed to blue if it is currently Red.
The color change in the Default Pen will take effect as soon as a new Pen is created. If a user
decides to cancel the creation of a New Pen (by cancelling the Pen configuration dialog) then the
Default Pen’s Main Color will return to its previous Main Color.
The Default Pen does not need to have a Data Source defined, although it's main usefulness will be in
defining a Data Source containing an alias for the Signal name, so that new Pens can be added from
OpenEnterprise Custom menus or dragged and dropped from the Database Object Viewer in runtime
mode. For configured Standard Pens a Data Source still needs to be defined.
ard Pen has what is known as a 'Main Color'. This 'Main Color is displayed for the Pen in
Otherwise the Default Pen will be edited in exactly the same way as a Standard Pen.
2.3.2.3 The TVD File
The Defa
configuration to be saved.
2.3.2.4 The Automation Interface
It will be possible to access the Default Pen programm
Interface. However, just as it will be impossible to remove the Default Pen from within the Trend's
User Interface, it will not be possible to remove the Default Pen from the Automation Interface.
ult Pen will be serialized to and from the TVD file along with Standard Pens allowing its
atically through the Trend Client’s Automation
2.3.3 Example Use of the Default Pen
The default pen allows you to add pens dynamically to a Trend from OE Custom Menus, and to be
able to convert realtime tags that are dragged from a DBX file onto the Trend into historical tags.
2.3.3.1 Adding Pens Dynamically to a Trend
The two meth
with Parameters’ and 'Load File With Data Access Tags’. Each method works slightly differently with
the Default Pen.
ods of passing data values dynamically from Custom OEMenus to Trends are ‘Load File
- 15 -
Page 22

Reference Guide
w
D301544X412
APRIL 2012
Just like a normal Pen, the Default Pen allows multiple aliases to be defined within each of its data
fields (Data Source, Name, Description etc). If new values are received for one or more of any aliases
defined within the Default Pen’s Data Source, a new Pen will be created.
The new pen will be a copy of the Default Pen but with its aliases permanently resolved to the new
values.
2.3.3.1.1 Using 'Load File with Parameters
Trend Vie
The followi
2.3.3.1.2 Using 'Load file with Data Access Tags'
This
this option is that it will use the whole Data Access Tag as the newly created Pen’s Data Source.
When a new tag value is received, a new Pen will be created as a copy of the Default Pen. The Data
Source of the new Pen will then be permanently set to the new tag’s value.
The following example should illustrate this:
ng is a worked example of this scenario:
• A Trend has a Default Pen with the following Data Source tag:
BristolBabcock.BristolOPCServer\"rtrdb1"."nw3000realanalog"."name:char:<<NAME>>"."valu
e:float"
• The Trend receives a new value (from a Custom OEMenu) for the Tag <<NAME>>. This
value is ‘NORTH:TANK3.LEVEL.’
• Trends identifies that <<NAME>> is contained within the Default Pen’s Data Source and
creates a new pen. It copies the Default Pen’s settings but sets the new Pen’s Data Source
tag to: BristolBabcock.BristolOPCServer\"rtrdb1"."nw3000realanalog"."name:char
NORTH:TANK3.LEVEL."."value:float".
• The Trend now has a new Pen plotting the requested value and in the requested style.
functionality is very similar to that of the previous OEMenus option. However, the difference with
• A Trend has a Default Pen with the following Data Source tag (as in the above example):
BristolBabcock.BristolOPCServer\"rtrdb1"."nw3000realanalog"."name:char:<<NAME>>"."valu
e:float"
• A Data Access tag is received with the value of:
'"BristolBabcock.BristolOPCServer\"rtrdb1"."nw3000realanalog"."name:char:NORTH:SINE.VA
LUE.002"."value:float"’
• Trends will create a new pen and copy the default pen’s configuration but ignore whatever is
in the Pen’s Data Source field. Instead it will replace it with the Data Access Tag passed in by
the Action DLL.
• The Trend now has a new Pen plotting the requested value and in the requested style.
2.3.3.2 Converting Dropped Realtime tags into Historical tags
See the Pen Config
Pens Page
uration Data Page topic for an explanation of how to do this.
2.3.4 Remove
Removes the currently selected Pen from the list of Current Pens.
- 16 -
Page 23

Reference Guide
w
D301544X412
APRIL 2012
Trend Vie
2.3.5 Remove All
Removes all of the Pens from the list of current Pens.
2.3.6 Add and Modify Buttons
The [Add] and [Modify] buttons invoke the same Pen configuration dialog.
2.3.7 Pen Configuration Data Page
This dialog enables you to configure the Data Source and other related tags for a single Pen. Tags
can be drag-dropped from the Database Object Viewer into any of the fields on this dialog.
2.3.7.1 Data Source
The 'Data So
Pen with the value of a selected signal in the Database. The tag in this field may also contain aliases.
2.3.7.1.1.1 Hint:
Once a tag is entered into
deleting the name string and inserting an alias (surrounded by double chevrons). Please see the topic
on configuring the Default Pen for an example of how aliases on the Default Pen can aid the end user
in building useful Trend files.
2.3.7.1.2 How to place an Alias within a tag: -
This hi
2.3.7.1.2.1 Normal Tag (Without Alias)
BristolBabcock.BristolHDAServer.1\"oeserv1:rtrdb1,oeserv2:rtrdb1"."realanal
og_table"."name:char:CFE1:ARBE.001."."value:<coltype>"."40"."0s"
2.3.7.1.2.2 Tag With Alias Inserted
BristolBabcock.BristolHDAServer.1\"oeserv1:rtrdb1,oeserv2:rtrdb1"."realanal
og_table"."name:char:<<SIGNAL>>"."value:<coltype>"."40"."0s"
urce' field for the Pen must contain a Bristol OPC or HDA tag. This field associates the
a Pen's Data Source field, the Name attribute may be made into an alias by
storical tag may be alias driven by deleting the name attribute and replacing it with an alias -
- 17 -
Page 24

Reference Guide
w
D301544X412
APRIL 2012
Once an alias is added to a tag, it will be displayed on the 'Parameters' Page, where a default value
can be assigned to it. It will now be possible to set up an OpenEnterprise Graphics display with a Pick
point added to a Process Point. The Pick point can have a Custom Menu action assigned which will
open this Trend View, passing the Signal's name as a parameter.
2.3.7.2 Data Field Browse Button
Trend Vie
Selection of this Bro
select a suitable tag to enter into the field to the left of it.
For more information on how to use the Tag Browser, see the Tag Browser help file.
Pen Configuration Data Page
2.3.7.3 Convert Realtime Data Sources to Historical
This optio
tag to a historical tag on a Pen which is dragged from the Database Object Viewer onto a Trend View
window which is in Runtime mode.
Be aware that if this option is chosen, and you also have opted to have realtime tags in the Device,
Status, Name, Description or Units fields of the Pen Configuration Data Page, you may need to set
some or all of these other tags to Convert to OPC tag if datasource is HDA tag. See the Pen Data
Advanced dialog for further details.
n is only available when configuring the Default Pen. It enables conversion from a realtime
wse button displays the OpenEnterprise Tag Browser, which enables the user to
If the option is checked, when a new Pen is added to the Trend from an OEMenu or by drag-dropping
a tag from the Database Object Viewer, the user will be given the option to convert the tag at that
time. The following prompt will be displayed:
If the user selects [Yes], Trends will request any available historical data for the signal from the
historical OPC Server. During this phase, a dialog will inform the user of progress:
- 18 -
Page 25

Reference Guide
w
D301544X412
APRIL 2012
When the historical data has been retrieved, the 'Realtime Tag to Historical Tag' dialog will be
displayed, which allows the user to select the required historical Dataset:
Trend Vie
In the example above, the Raw dataset is selected. Should compressed datasets be available, they
can be viewed and selected by selecting an alternative 'Sample Rate' from the drop-down list. The
types of compression will be shown in the 'Historical Data Type' list. When a selection h as been made
from the list, selection of the [Details] button displays more details about the dataset for the user's
information:
Selecting the [OK] button will return the user to the 'Realtime Tag to Historical Tag' dialog. Selection
of the [OK] button on that dialog will place the historical Pen into the Trend.
Note:
If a user drags and drops an item into the Data Source field on the Pen Configuration dialog in
configuration mode, the realtime OPC Tag to historical OPC Tag conversion process will not operate.
This is because the user is already performing configuration on the Trend and it will be assumed that
if they had required a historical OPC Tag, then they would have used the Tag Browser.
- 19 -
Page 26

Reference Guide
w
D301544X412
APRIL 2012
Similarly, if a user manually browses for a realtime OPC Tag using the Tag Brower from the Pen
Configuration dialog, they will NOT be asked if they wish to look for historical data. The assumption
here is that if they have used the Tag Browser they could have looked for historical data at this point
and have chosen not to.
Pen Configuration Data Page
2.3.7.4 Device
Trend Vie
This is
contents of this field will be displayed in the 'Details' pane on the Trend for each Pen. A plain text
entry may be made, such as 'IP1', or a tag may be specified. The Tag may contain aliases, and may
be set to 'Auto Populate'.
2.3.7.5 Status
This field is m
field will be displayed in the 'Details' pane on the Trend for each Pen. A plain text entry may be made,
or a tag may be specified. The tag may contain aliases, and may be set to 'Auto Populate'.
2.3.7.6 Name
This field is in
the 'Details' pane on the Trend for each Pen. A plain text entry may be made, or a tag may be
specified. The tag may contain aliases, and may be set to 'Auto Populate'.
2.3.7.7 Description
This field is in
displayed in the 'Details' pane on the Trend for each Pen. A plain text entry may be made, or a tag
may be specified. The tag may contain aliases, and may be set to 'Auto Populate'.
2.3.7.8 Units
This field is in
displayed in the 'Details' pane on the Trend for each Pen. A plain text entry may be made, or a tag
may be specified. The tag may contain aliases, and may be set to 'Auto Populate'.
an optional field. It represents the field device on which the Signal is being logged. The
eant to show the status of each Signal represented in the Trend. The contents of this
tended to show the selected signal's name. The contents of this field will be displayed in
tended to show the description attribute of the Signal. The contents of this field will be
tended to show the units attribute of the Signal. The contents of this field will be
2.3.7.9 Auto Populate with Signal Data
n this box is checked, Auto Populate operation occurs. The Tag in the 'Data Source' field will be
Whe
copied to each of the other fields but with the ‘value’ or ‘readvalue’ part of the tag replaced with the
relevant column in the signal table or the user-specified column.
For example, by default the Data Source tag
"BristolBabcock.BristolOPCServer\"rtrdb1"."nw3000realanalog"."name:char:NORTH:SINE.VALUE.00
2"."value:float"
will be copied to the description field as:
"BristolBabcock.BristolOPCServer\"rtrdb1"."nw3000realanalog"."name:char:NORTH:SINE.VALUE.00
2"."description:char"’
- 20 -
Page 27

Reference Guide
w
D301544X412
APRIL 2012
Trend Vie
If the tag cannot be identified as a signal value then the other fields will NOT be populated from the
Data Source field.
It will be possible to enable and disable the Auto-Populate functionality on a per-Trend basis. The
setting will be saved to the TVD file and loaded when a Trend is loaded.
It will be possible to enable and disable Auto-Population on a per-field basis. By default all the fields
on the Data Tab will be Auto-Populated.
When a field is Auto-Populated it will scroll to the end of the Text. This will allow the user to see the
attribute name that has been inserted into the Tag. The Data Source field will also scroll to the end
when an Auto-Populate operation occurs.
Pen Configuration Data Page
2.3.7.10 Advanced Button
The Advan
Pen’s Auto-Populate settings.
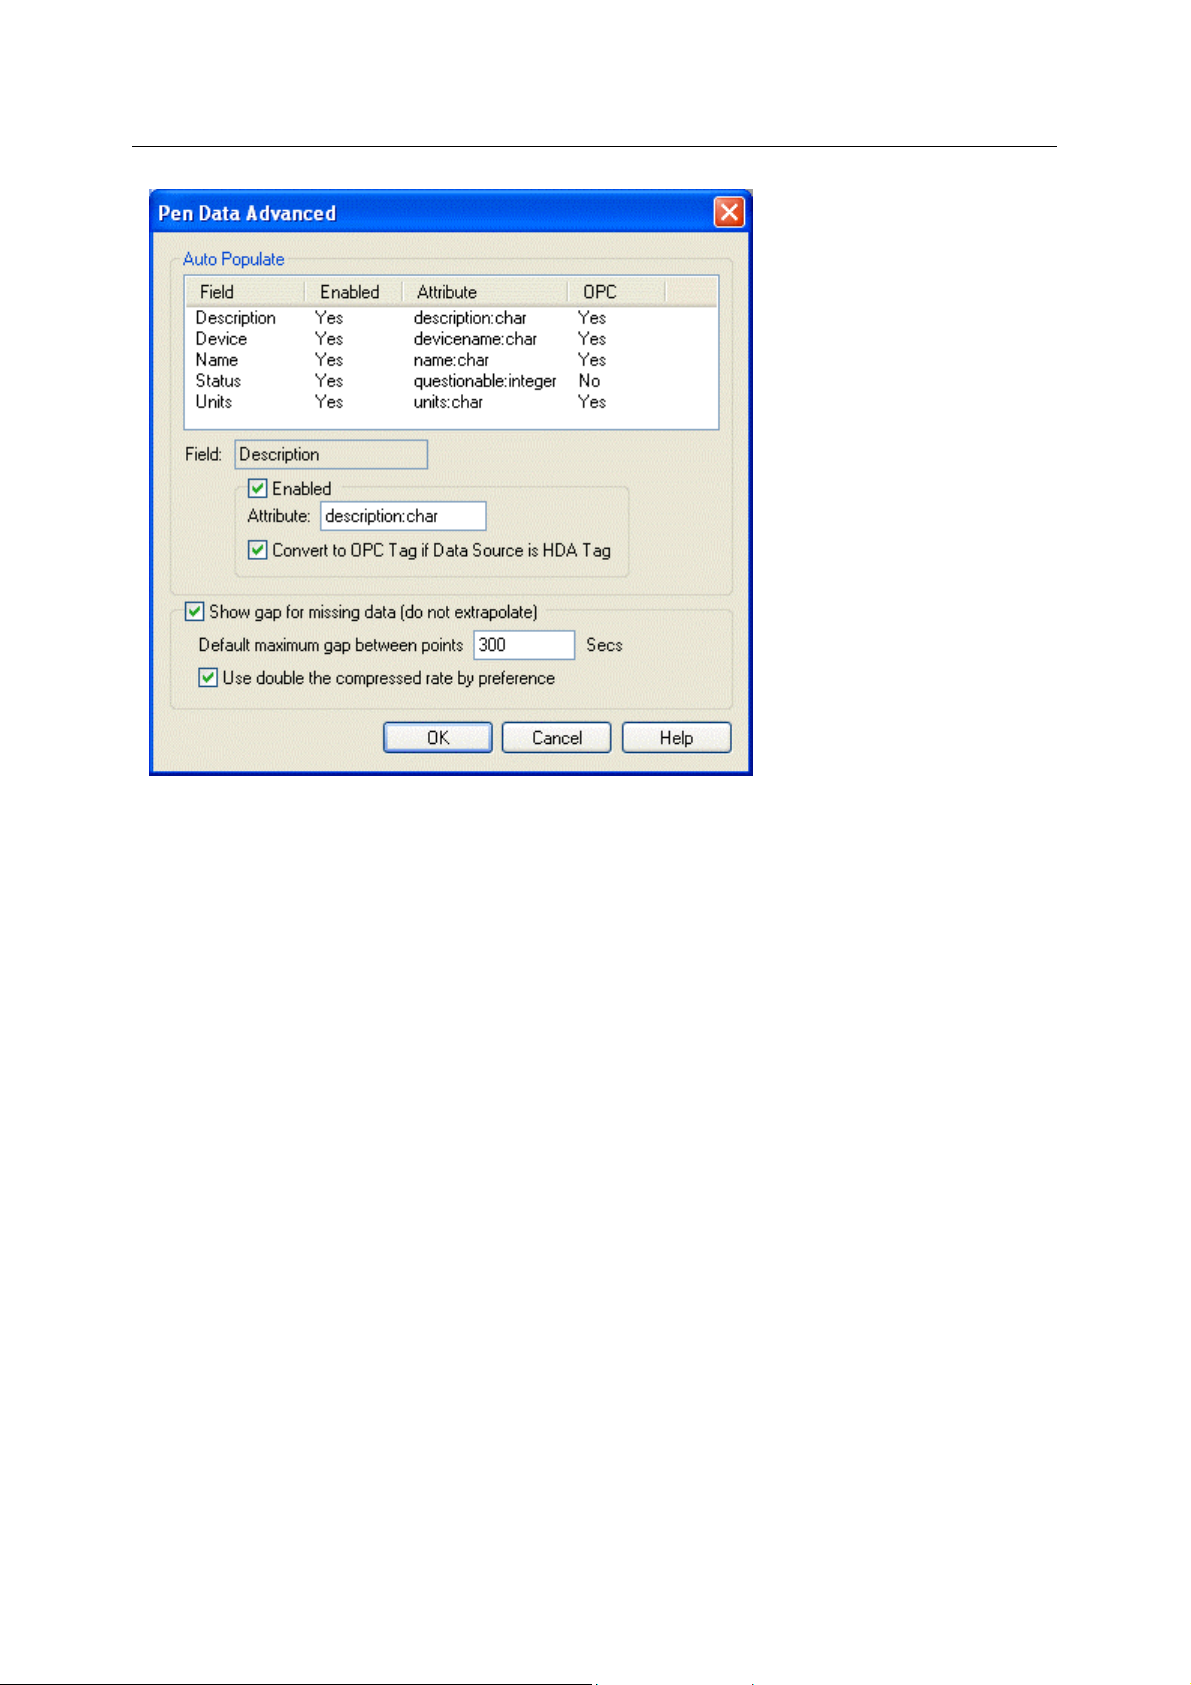
2.3.7.11 Advanced Dialog
The Pen Data Advance
fields, and also to specify whether missing data should be shown on the Trend as a gap.
ced Button opens the 'Pen Data Advanced Dialog', which enables you to edit the current
d dialog enables the user to change the default settings for the Auto-Populate
- 21 -
Page 28
Reference Guide
w
D301544X412
APRIL 2012
Trend Vie
.
2.3.7.11.1 Auto Populate Field List
This list di
label (not editable), it's Enabled status, the Attribute that can be selected as a basis for the tag, and
whether the field will be converted to a realtime tag if the Data Source is historical.
2.3.7.11.2 Selected Field
This no
2.3.7.11.3 Auto Populate Field Enabled
This box is
Configuration dialog changes, whether in realtime or configuration mode, Trends will automatically
populate this 'Auto Populate' field with the tag defined in the 'Attribute' field on this dialog.
If this field is unchecked, then this 'Auto Populate' field will not be updated when any changes are
made to the 'Data Source' field on the Pen Configuration dialog. For example, if the 'Auto Populate
with Signal Data' option was selected for the Default Pen on the Pen Configuration dialog, and the
'Description' field for the Default Pen was set to be disabled on this dialog, when a new Pen is added
to the Trend in runtime mode, the Description field will not be automatically updated.
Also, when this field is unchecked, the 'Attribute' and 'Convert to OPC Tag...' fields become disabled.
2.3.7.11.4 Auto Populate Field Attribute
splays data about each of the fields that can be auto-populated. The list contains the Field
n-editable field displays the Auto-Populate field that has been selected from the list above it.
checked by default, meaning that when the Tag in the 'Data Source' field on the Pen
n the 'Enabled' field is checked, this field is available for editing. A new attribute can be specified,
Whe
which will change the Tag that is automatically placed into this 'Auto Populate' field when the Data
Source Tag is changed.
For instance, if the 'Attribute' for the Description 'Auto Populate' field was changed to name:char, for
the Default Pen, when a new Pen is added to the Trend, this field would be automatically populated
with the new signal's name, rather than what is in it's description attribute.
- 22 -
Page 29

Reference Guide
w
D301544X412
APRIL 2012
2.3.7.11.5 Convert Auto Populate Tag...
Trend Vie
If this box is checke
Source Tag will become a historical OPC tag), this field will be automatically converted to a realtime
Tag.
This option is necessary because if the 'Auto Populate with signal data' functionality has been
enabled on the Pen Data Configuration dialog, Trends would attempt to copy the historical OPC Tag
from the Data Source Tag into this field, and an error may occur if the selected attribute is not
included in the historical stream.
2.3.7.11.6 Show Gap for Missing Data
If this option is sel
(extrapolation), the Trend will leave a gap where there is no data. The Extrapolation Gap values for
each Pen will be saved to the Trend’s TVD file.
2.3.7.11.6.1 Extrapolation and Performance Mode
The Trend wil
configured gap time PLUS the current resolution time. For example, if the extrapolation gap is
configured to be 5 minutes for a Pen, and the Trend is displayed in Data optimized mode, if two points
are more than five minutes apart no line will be drawn between them. However, if the Trend is
displayed in Performance optimized mode and the resolution is worked out to allow one point every
30 minutes, the gap between two points would need to be 35 minutes or more before no line is drawn.
2.3.7.11.7 Default Maximum Gap
This is
received before this time is up, then a line will be drawn between the last sample and the new one.
a period in seconds, which the Trend will consider to merit treatment as a gap in data. If data is
d, and a new historical Pen is added to the Trend (which means that the Data
ected, then instead of drawing a line between a gap in the data for a Pen
l only show a gap between points if the distance between them is greater than the
2.3.7.11.8 Use Double Compressed Rate
This optio
Maximum Gap value.
For example, if the Pen’s Data Source indicates it is from a 300 second compressed stream (it has
“300s” in it), the maximum gap between points will be 600 seconds. If the Pen does not have a
compressed rate in its Data Source, this value will be ignored and the value specified in the standard
Maximum Gap value will be used instead.
By default this option will be enabled.
n is provided to force the Pen to use double the compressed rate of its Data Source as the
2.3.8 Pen Configuration Ranges Page
The Pen Ranges page enables you to configure range overrides for individual pens.
- 23 -
Page 30

Reference Guide
w
D301544X412
APRIL 2012
Trend Vie
2.3.8.1 Override Global Time Settings
If this box is checke
overridden for this Pen.
2.3.8.2 Use Time Period Relative to Current Workstation Time
If the Use time perio
X-Axis on the left of the window at: - Current Time - Period.
The X-Axis will end on the right hand side of the window at the Current Time.
If this box is unchecked, the user is able to specify a start time for the Trend View. The time and date
fields will become enabled. Use the spin arrows to adjust the time and/or the drop-down arrow on the
date, which exposes a Calendar for date selection. Alternatively, a starting time and date may be
typed directly into the relevant fields. The start time indicates the time which will be specified as the
start of the x-axis for the selected Pen.
That means that the x-axis will start at:- Start Time.
The x-axis will end at: - Start Time + Period.
If Start Time + Period is greater than the Current Time, then the x-axis will start at Start Time and
end at the Current Time.
d the Common Time period settings set on the Common Ranges Page are
d relative to Current Workstation time box is checked, then the Trend will start its
2.3.8.3 Range Period
This is th
Current Time back or the Start Time forward, depending on whether the 'Use time period relative to
current workstation time' button has been chosen.
2.3.8.4 Minimum Y-Axis
The Minimum
on the Common Ranges Page, but may be overridden by the auto-scale setting available from the
[Axis...] button on the Pen Configuration Styles Page for the selected Pen.
e time period for which the HDA server searches for data in the Database from either the
setting for the y-axis for this Pen may be set here.This setting will override the setting
- 24 -
Page 31

Reference Guide
w
D301544X412
APRIL 2012
A tag may be drag dropped into this field via the Database Object viewer. Click here to view a
demonstration of this operation.
2.3.8.5 Maximum Y-Axis
Trend Vie
The Maximum setting for the y-axis for t
on the Common Ranges Page, but may be overridden by the auto-scale setting available from the
[Axis...] button on the Pen Configuration Styles Page for the selected Pen.
A tag may be drag dropped into this field via the Database Object viewer. Click here to view a
demonstration of this operation.
his Pen may be set here. This setting will override the setting
2.3.9 Pen Configuration Limits Page
The Pen Limits page enables you to configure Limits for individual pens.
2.3.9.1 Currently Configured Limits
The list of cu
2.3.9.2 Limit Configuration Dialog
This dial
rrently configured limits showing the limit type, visibility and value.
og enables you to configure values for the selected Pen Limit.
- 25 -
Page 32

Reference Guide
w
D301544X412
APRIL 2012
2.3.9.2.1 Limit Type
sabled field displays the selected limit's type.
This di
2.3.9.2.2 Value/Data Source
Trend Vie
The "Value / Data Sou
field. Alternatively, an realtime or historical OPC Tag may be used to link the value of the limit to the
value of a signal in the Database.
For an example of how to drag-drop a realtime tag into a field see the Drag Drop Realtime Tag into
Data Source Field topic.
For an example of how to drop a historical tag into this field see the Drag Drop a Historical Tag into a
Field topic.
2.3.9.2.3 Limit Line Styles Dialog
This dial
og enables you to configure the line style for the selected Pen Limit.
rce" field can be configured as a constant by typing a value directly into the
2.3.9.2.3.1 Line Visibility
This
check box toggles the visibility of the line, whether it be a Pen or a Limit.
2.3.9.2.3.2 Line Plot Style
The style of the plot. Possi
Style Description
None Show no data.
Line Show all data in Line format
Stair Show all data in Step format
2.3.9.2.3.3 Line Width
The Width is measured in point sizes and ranges from 1 to 6. When a width of greater than 1 is
selected, the line style will automatically be set to solid line and the Style option will be disabled.
2.3.9.2.3.4 Line Style
ble Line Style choices are shown below:
Possi
ble choices are shown in the table, below:-
- 26 -
Page 33
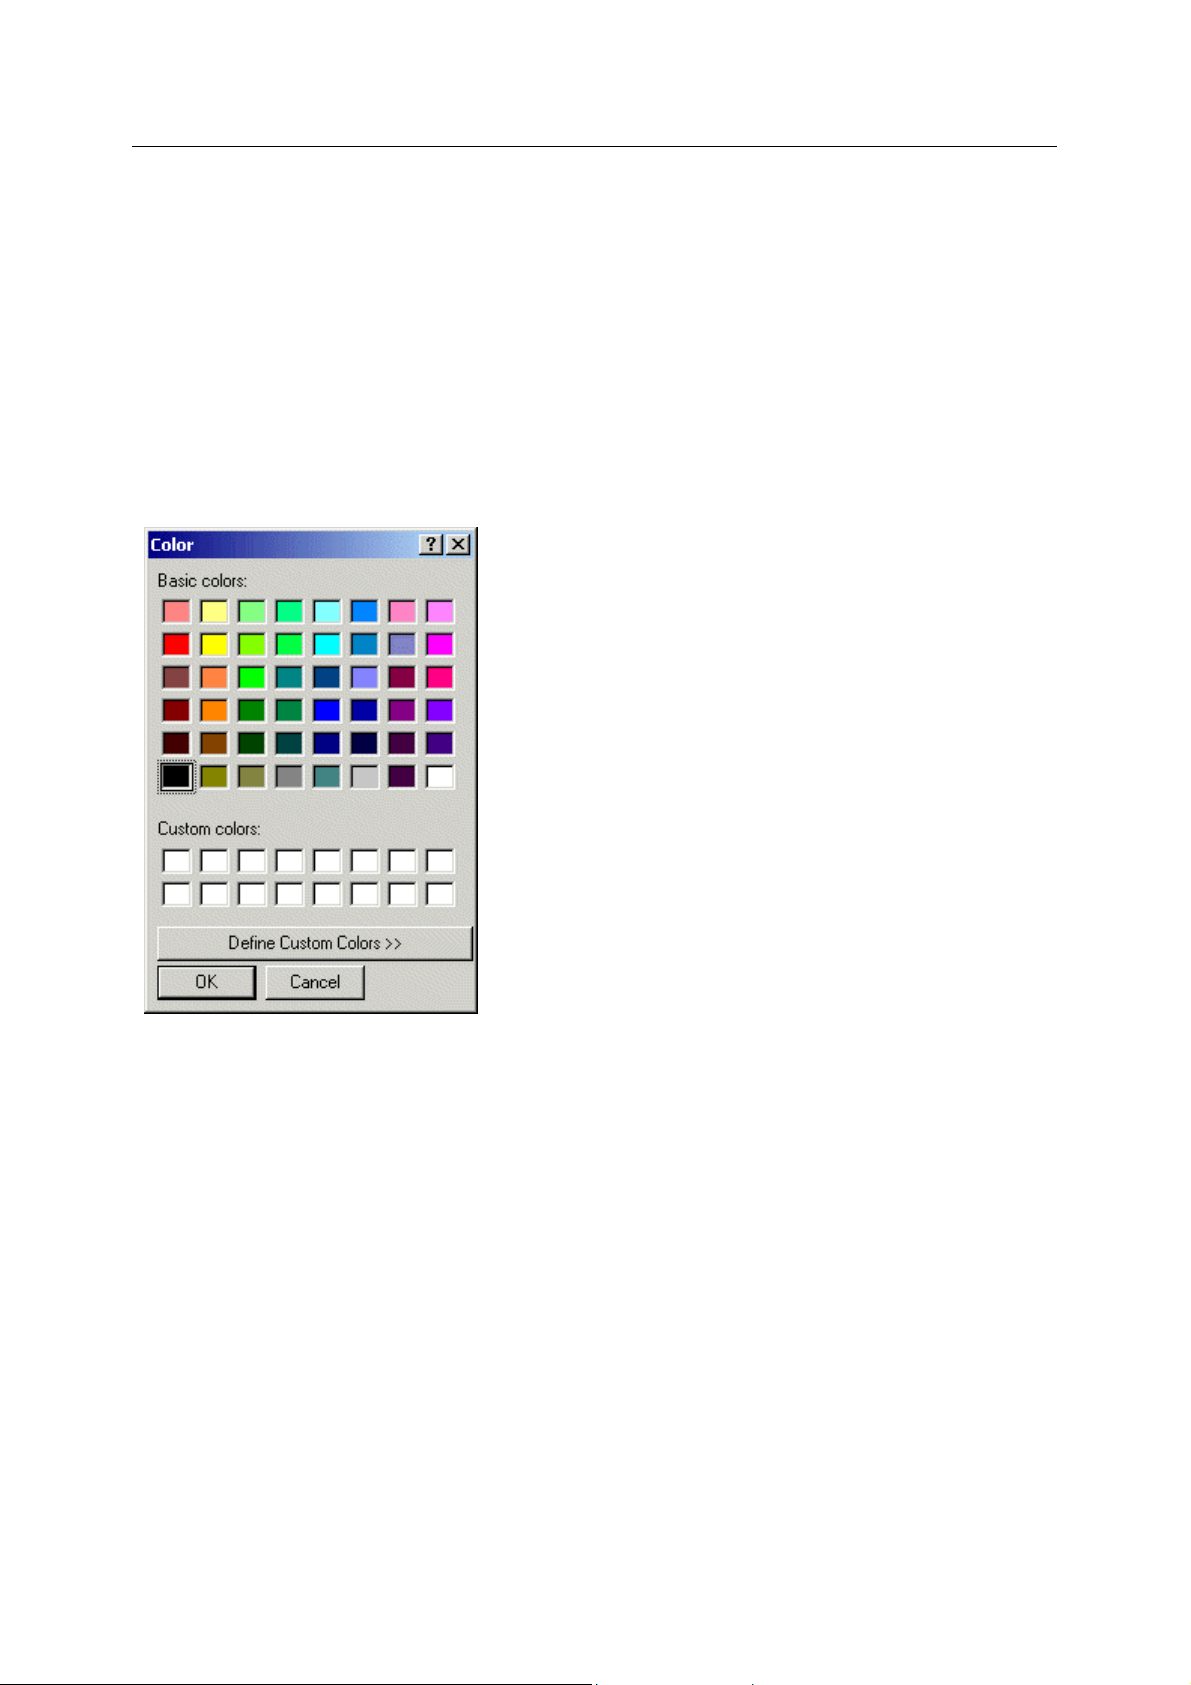
Reference Guide
w
D301544X412
APRIL 2012
• None
• Solid
• Dashed
• Dot
• Dash-Dot
• Dash-Dot-Dot
2.3.9.2.3.5 Line Color
Selection of this color b
Trend Vie
ox opens a color palette, from which a new line color can be chosen.
2.3.10 Pen Configuration Styles Page
This dialog has two buttons, giving access to other dialogs which enable you to configure the
individual line style and axes settings for a selected Pen.
- 27 -
Page 34
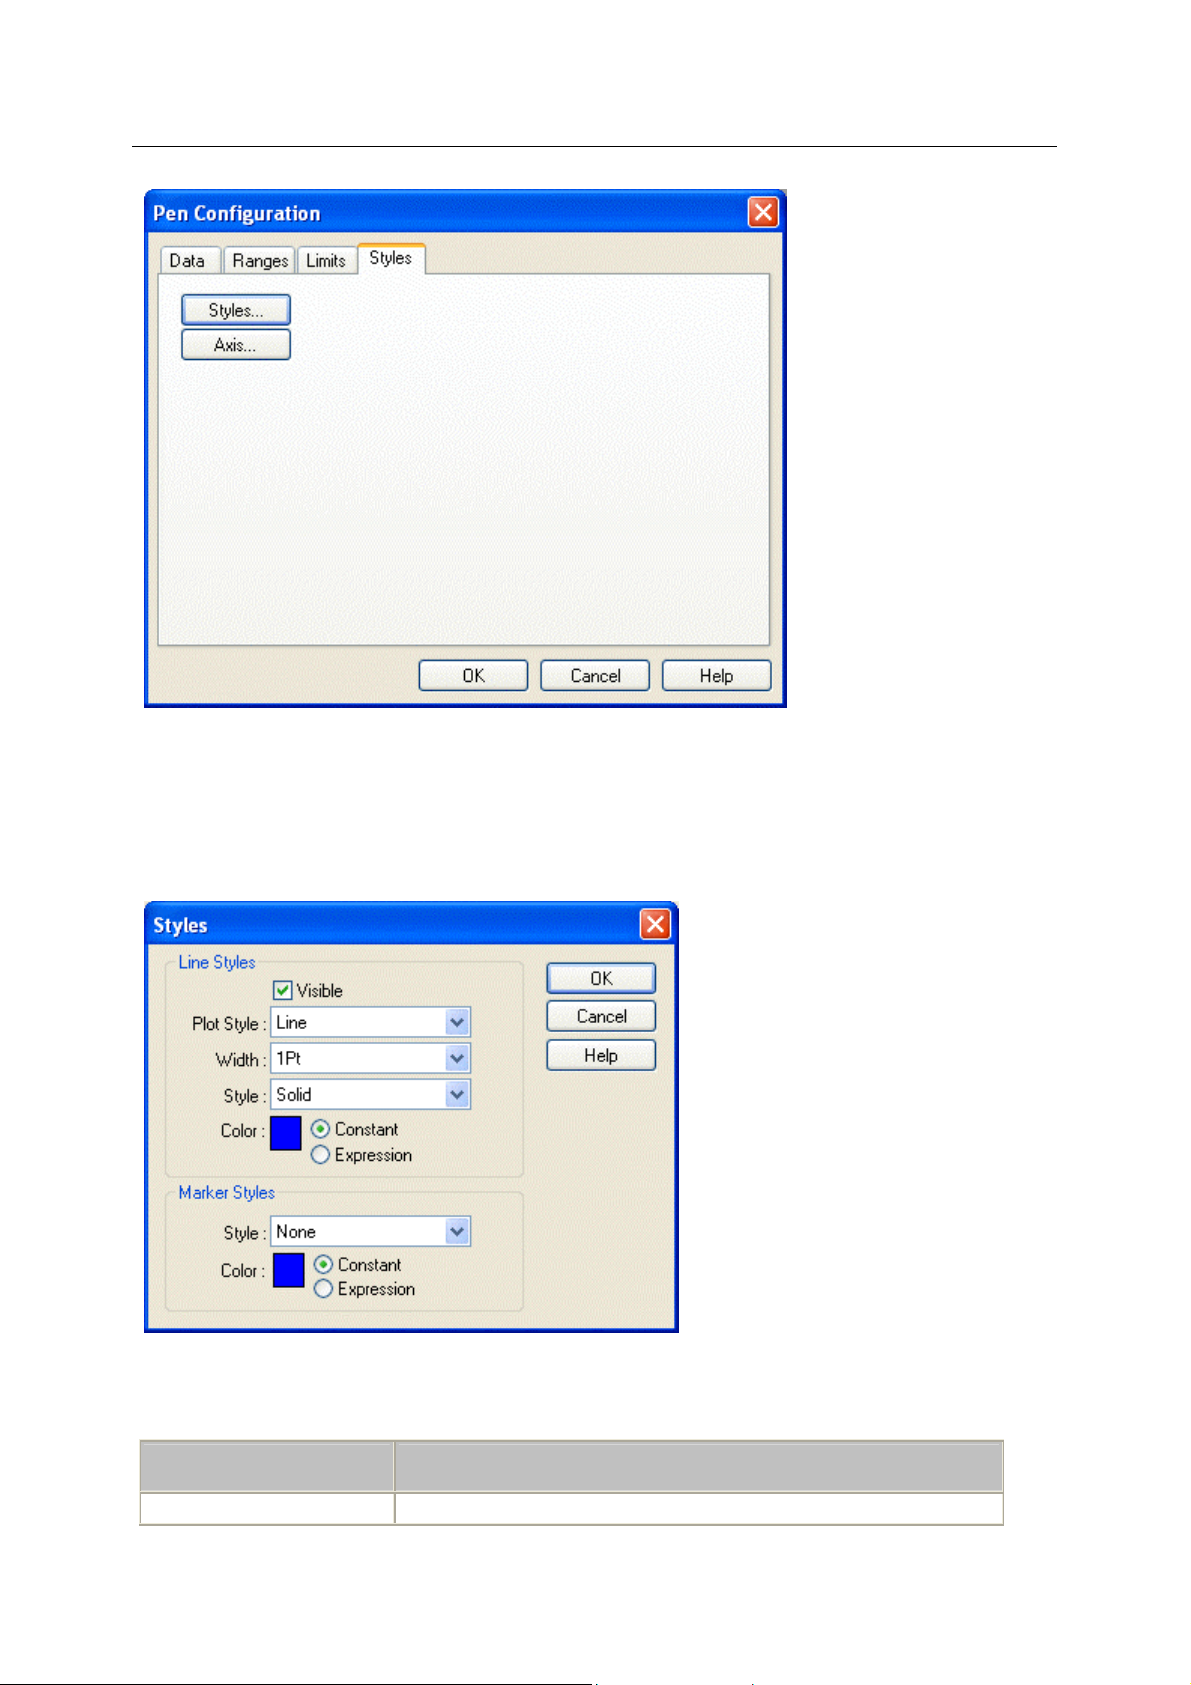
Reference Guide
w
D301544X412
APRIL 2012
Trend Vie
Pens Page
2.3.10.1 Styles Dialog
This dial
to the Expression Editor dialog, which enables different colors to be configured for ranges of values
for the Pen.
og enables you to configure the individual line style for a selected Pen, and provides access
2.3.10.1.1 Marker Style
This
sets the marker style of the Pen. Possible choices are shown in the list below.
Style Description
None Show Trend as a line with no sample marks.
- 28 -
Page 35

Reference Guide
w
D301544X412
APRIL 2012
Dot Shows samples as dots
Square Show sample as squares
Triangle Show samples as triangles
Star Show samples as stars
Hexagon Show samples as hexagons
Diamond Show samples as diamonds
Cross Show samples as crosses
Plus Show samples as plus signs
2.3.10.1.2 Marker Color
Selection of this color box opens a color palette, from which a new marker color can be chosen.
Trend Vie
2.3.10.1.3 Constant
With this opti
this dialog.
2.3.10.1.4 Expression Selected
n the 'Expression' option is selected, the color square becomes a browse button.
Whe
Selection of this button opens the Expression Editor dialog.
2.3.10.1.5 Expression Editor
The Expre
built up using a graphical interface, an 'expression' is created.
on selected, the marker style and color remain at the settings which are configured on
ssion editor allows the user to configure conditions to an OPC tag. As the conditions are
- 29 -
Page 36

Reference Guide
w
D301544X412
APRIL 2012
In programming terms, a typical expression could have the meaning - "If the value of the OPC tag is
greater than X then this property equals Y, if the value of the OPC tag equals A then this property
equals B, else this property equals C". Simply, then, by selecting a tag and attaching conditions to it,
an 'expression' is built.
Currently, the only OpenEnterprise component that makes use of the Expression editor is the Trend
View. OpenEnterprise Trends uses expressions to control the colour of a pen's line and markers (see
the example below).
In the display below, the pen and the marker are drawn in green while the value is greater than 75 or
while the value is less than -50, otherwise they default to red.
Trend Vie
2.3.10.1.5.1 Expression Editor Dialog
This dial
its value.
og enables you to configure Expressions which will control the color of the Pen depending on
- 30 -
Page 37
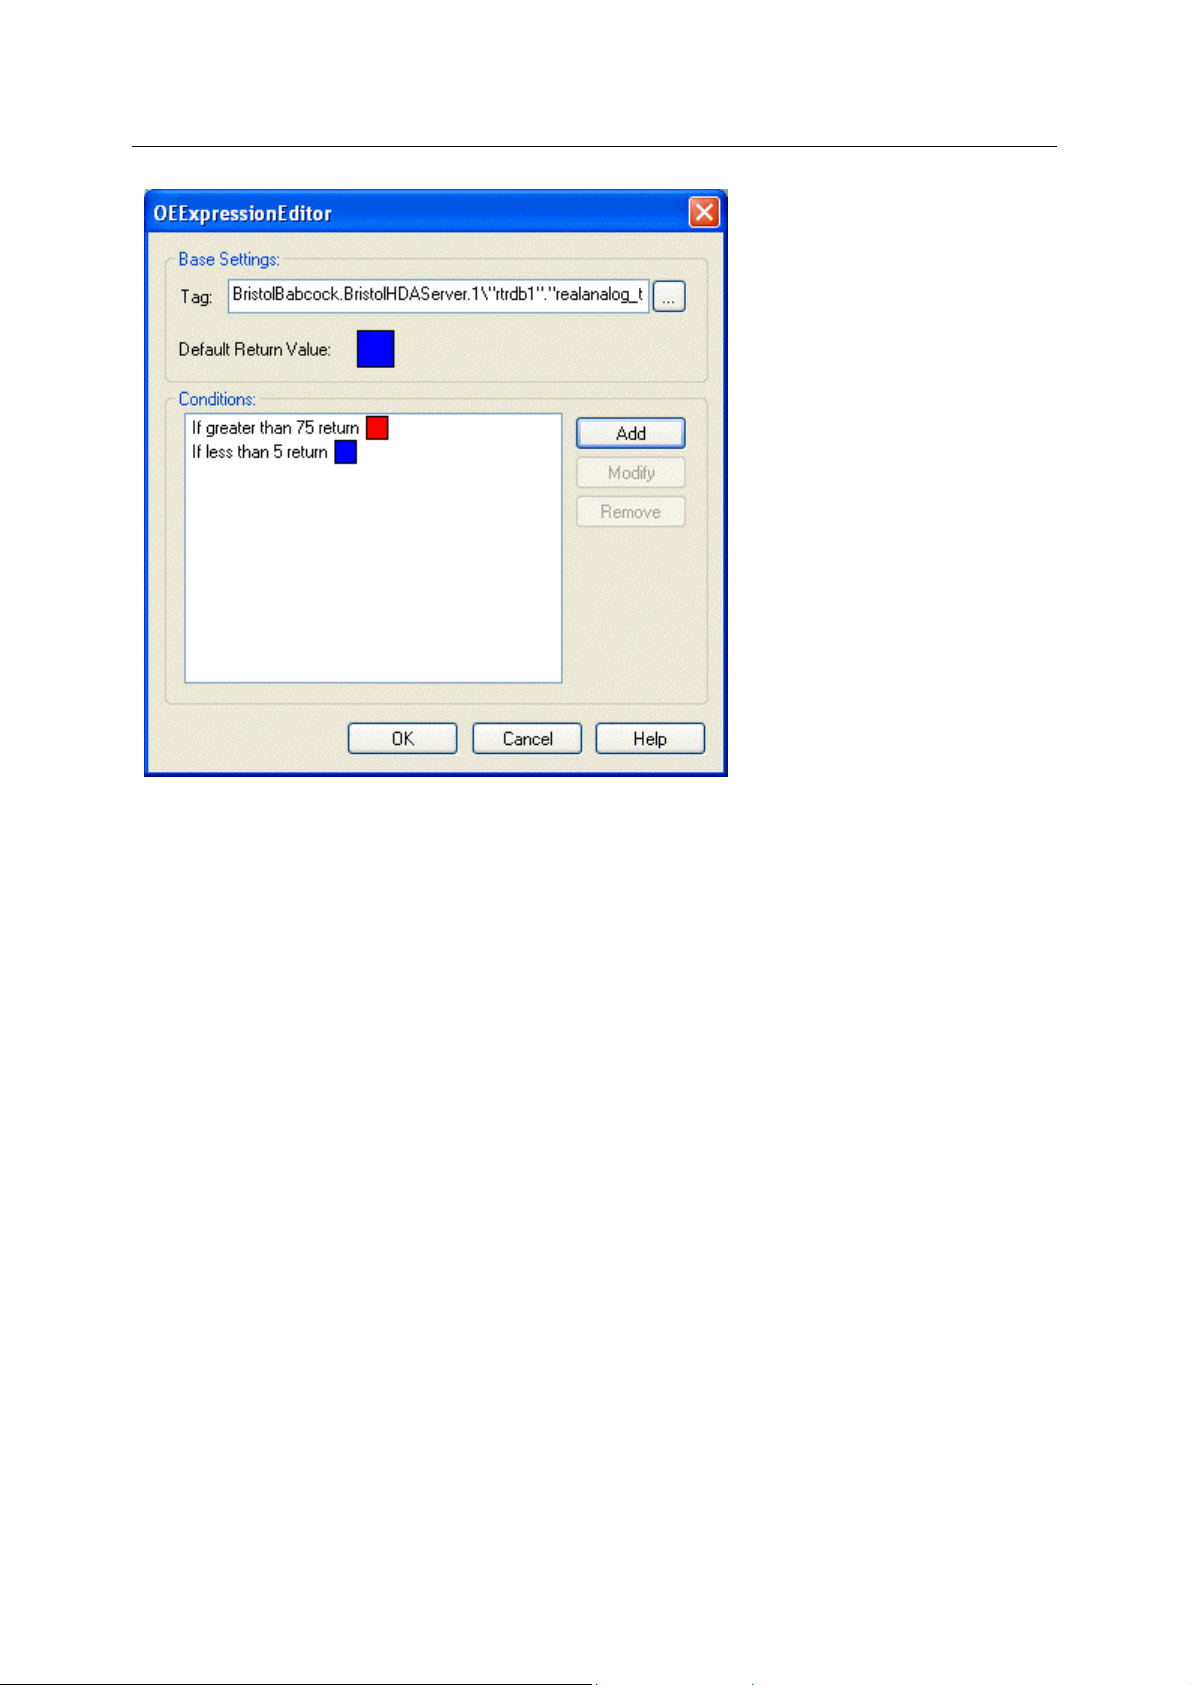
Reference Guide
w
D301544X412
APRIL 2012
Trend Vie
Tag
This edit box contains the OPC/HDA tag that describes the expressions data source. Tags can be
entered manually, dragged and dropped from other applications or obtained from the Tag Browser by
clicking on the browser button to the right of this edit box.
For an example of how to drag-drop a realtime tag into a field see the Drag Drop Realtime Tag into
Data Source Field topic.
For an example of how to drop a historical tag into this field see the Drag Drop a Historical Tag into a
Field topic.
Alias Support
Expressions may contain aliases in either the tag edit box or the comparison value edit box. Aliases
enable tags to be passed dynamically, based on user selection from one OpenEnterprise Co mponent
to another. More information on passing aliases as parameters between Components may be found
in the Menus help file.
Default Return Value
If none of the conditions are true then the returned value of the expression will be this value, which is
the colour property of the selected Pen. Selection of the colour square will open a colour selector,
which enables the user to change the default colour.
Conditions List Box
This list box details the conditions that are attached to the expression. The conditions are evaluated in
the order they appear going from top to bottom. This list box allows the user to change the order of
the conditions (and hence the order of precedence) by dragging and dropping each condition to a new
location in the list.
Remove Condition
- 31 -
Page 38

Reference Guide
w
D301544X412
APRIL 2012
Removes the currently selected condition from the Conditions List.
Edit Condition Dialog
This dialog enables you to configure the condition, value and returned Pen color for an Expression.
Condition Operator
This list provides a selection of conditions or operators for the expression. The conditions available
are:-
Trend Vie
• Equal to;
• Greater than;
• Greater than or equal to;
• Less than;
• Less than or equal to;
• Not equal to.
Comparison Value
This should be typed into the Comparison value field. It is the value that the Expression Editor will use
to compare the current value of the tag in the Tag field using the Condition Operator.
Return Value
If the coloured button is selected, a colour selection dialog is opened, and the user may choose a
different Return Value colour.
2.3.10.2 Pen Axis Configuration Dialog General Page
This dial
og enables you to configure placement and auto-scaling for an individual Pens axes.
- 32 -
Page 39

Reference Guide
w
D301544X412
APRIL 2012
Trend Vie
2.3.10.2.1 X-Axis Placement
There are two option
• Top - this option places the x-axis at the top of the Trend window.
• Bottom - this option places the x-axis at the bottom of the Trend window.
2.3.10.2.2 Y-Axis Placement
There are two option
• Left - this option places the y-axis on the left side of the Trend window.
• Right - this option places the y-axis on the right side of the Trend window.
2.3.10.2.3 Autoscale
This option al
determined by the highest and lowest values of the Pen plotted to date, plus a percentage according
to the Deadband setting.
2.3.10.2.4 Deadband
This en
lows the user to turn y-axis auto scaling on, which means that Y-Axis scaling will be
ables the user to specify a percentage by which the range of the Y-Axis will be extended.
s here: -
s here: -
For instance, a Pen having a highest value of 100 and a lowest value of 0 with individual auto-scaling
on, and a deadband of five percent will have a Y-Axis of 105 to -5. That is, the range of the Y-Axis will
be extended at top and bottom by five percent of the true range between the highest and lowest value
of the Pen.
- 33 -
Page 40

Reference Guide
w
D301544X412
APRIL 2012
2.3.10.2.5 Pen Axis Configuration Dialog Styles Page
Trend Vie
This dial
og enables you to configure the axis labels for an individual Pen.
2.3.10.2.5.1 Label Angle
This field det
against the axis, 90 degrees equals perpendicular to the axis and 180 degrees equals flat against the
axis on the other side of the perpendicular.
2.3.10.2.5.2 Label Font
Select the browse button t
2.3.10.2.5.3 Label Color
A double cli
2.3.10.2.5.4 Label Visibility
If this box is checke
2.3.10.2.5.5 Show Full Details on Axis
If this box is checke
y-axis.
ails the degrees of angle for the text labels of the x or y-axis. Zero degrees equals flat
o invoke a font selection dialog.
ck on the Colour Square displays a colour selection dialog.
d, the axis for this Pen will be made visible. Default is off for individual Pen axes.
d, the x-axis will contain date as well as time details. It will not add anything to the
2.4 Common Ranges Page
This page enables you to configure the Common historical and Y-Axis range settings for the Trend.
These settings can be overridden for individual Pens.
- 34 -
Page 41

Reference Guide
w
D301544X412
APRIL 2012
Trend Vie
2.4.1 Use Time Period Relative to Current Workstation Time
If the Use time period relative to Current Workstation time box is checked, then the Trend will start its
X-Axis on the left of the window at: - Current Time - Period.
The X-Axis will end on the right hand side of the window at the Current Time.
If this box is unchecked, the user is able to specify a start time for the Trend View. The time and date
fields will become enabled. Use the spin arrows to adjust the time and/or the drop-down arrow on the
date, which exposes a Calendar for date selection. Alternatively, a starting time and date may be
typed directly into the relevant fields. The start time indicates the time which will be specified as the
start of the x-axis for the selected Pen.
That means that the x-axis will start at:- Start Time.
The x-axis will end at: - Start Time + Period.
If Start Time + Period is greater than the Current Time, then the x-axis will start at Start Time and
end at the Current Time.
2.4.2 Range Period
This is the time period for which the HDA server searches for data in the Database from either the
Current Time back or the Start Time forward, depending on whether the 'Use time period relative to
current workstation time' button has been chosen.
2.4.3 Common Minimum Y-Axis
The default common maximum and minimum setting for the y-axis may be set here. This setting is
overridden by the autoscale settings available on the Common Axis Configuration Dialog which is
accessed by selecting the [Axis...] button on the Graph Property Page.
For a demonstration of how to add a realtime tag to this type of field Click here. For a demonstration
of how to add a historical tag to this field Click here.
- 35 -
Page 42

Reference Guide
w
D301544X412
APRIL 2012
Trend Vie
2.4.4 Common Maximum Y-Axis
The default common maximum and minimum setting for the y-axis may be set here. This setting is
overridden by the autoscale settings available on the Common Axis Configuration Dialog which is
accessed by selecting the [Axis...] button on the Graph Property Page.
For a demonstration of how to add a realtime tag to this type of field Click here. For a demonstration
of how to add a historical tag to this type of field Click here.
2.5 Common Data Page
This page enables you to reduce the Common displayed X-Axis set on the Ranges Page for the
Trend. For instance, if the X-Axis Period was set to 3 Hours on the Ranges page, the Trend would
fetch 3 Hours of data from the database, but the Trend could be configured to display only 1 Hour of
that data by setting this value to 1 Hour. The scroll bar would be enabled, and the user would be able
to use the single scroll bars to scroll backwards and forwards through the 3 Hour period without the
Trend having to re-query the database. Click the
2.5.1 Display Range
The Range display period allows the user to configure the viewable time window (i.e. the viewable xaxis). This enables the Trend scroll bar if the Period value on the Ranges page is greater than the
value set here. If set to 0, the Range value is taken to be the Period setting on the Ranges page.
2.5.2 Display Refresh Period
If the Trend is dynamically updating (i.e. the end time of the Trend is the current time), the Trend will
refresh its display every n seconds when n is defined by the "Refresh" interval. This defaults to a
value of 5 seconds. This must be carefully tuned to the actual logging interval in the database to
prevent the workstation from being overloaded.
2.5.3 Advanced Data Retrieval Settings Dialog
The Advanced Data Retrieval Settings dialog enables the configuration of additional settings that
normally do not need to be adjusted.
- 36 -
Page 43

Reference Guide
w
D301544X412
APRIL 2012
2.5.3.1 When to Change the Advanced Data Retrieval Settings Work
station System Considerations
It may be advantageous on some systems to enlarge or decrease the settings on this dialog as
they have a direct relationship on the performance of the Workstations.
Time Display Considerations
Longer time display periods may require a greater Maximum Samples per Pen setting. For
instance, a time display of 24 hours would require that the Trend View request 24 hours worth
of data from the HDA Server. Assuming that the Signal is being logged every 30 seconds (for
an Historical Pen this becomes the 'sample' rate), then there would need to be 2,880 samples
displayed in the Trend window. Therefore, the Maximum Samples per Pen would have to be
increased, in the example above, from 2000 to 3000 in order to display enough samples for a
24-hour time period.
Trend Vie
2.5.3.2 Data Update Collection Interval
The "Data
Servers. With a Realtime Pen this setting is the 'sample' rate, but Historical Pens take their 'sample'
rate from the logging rate of the dataset to which they belong.
Note: This value is different from the refresh interval - the refresh interval is when a data redraw
occurs, which could include several data samples.
2.5.3.3 Maximum Samples per Pen
Provide
prevents the Trend from using up too many system resources. Entering a value of 0 indicates no limit.
2.5.3.4 Maximum Pages of Data
The "Maximu
are stored or displayed on a per pen basis.
A page or block of data is the amount of data that is retrieved from the Database by the Trend View
as defined by the Ranges Page 'Period' value.
If a maximum of three pages of data is set for the Trend, then the Trend keeps up to three pages of
data in the computer's memory at any one time. A new page of data is only retrieved when a user
selects the double arrowhead 'New Page' transport button at the bottom of the Trend window as
shown below.
Update/Collection interval" is the interval that the data is to be requested from the OPC
s a limit to be placed on the number of samples stored/displayed on a per pen basis. This
m Pages of Data" field allows for a limit to be placed on the number of blocks/pages that
- 37 -
Page 44

Reference Guide
w
D301544X412
APRIL 2012
With a setting of three for the maximum pages of data, and a 'page' size of two hours, the user would
be able to obtain the first page of data plus two others.
The scroll bar could then be used to see six hours of data back from the current time. If data from
eight hours past were required, another page of data would be required from the HDA Server. As a
result of the maximum pages setting, the user would still be able to view six hours worth of data, but
the data would now stretch from eight hours ago to two hours prior to the current time.
Trend Vie
Advanced Data Retrieval Settings Dialog
2.6 Graph Page
This page enables you to configure the general look of the Graph area of the Trend.
2.6.1 Border Style
Sets the Graph border style to one of the following:
Style Description
None No Graph pane border
Thin Raised Thin Raised border around the Graph pane
Thin Sunken Thin Sunken border around the Graph pane
- 38 -
Page 45

Reference Guide
w
D301544X412
APRIL 2012
Thin 3D Thin 3D border around the Graph pane
Thick Raised Thick Raised border around the Graph pane
Thick Sunken Thick Sunken border around the Graph pane
Thick 3D Thick 3D border around the Graph pane
Trend Vie
2.6.2 File Style
Sets the fill style to one of the following:
Style Description
None No background fill
Solid Single colour background fill
Vertical Vertical shaded background fill from colour 1 to colour 2
Horizontal Horizontal shaded background fill from colour 1 to colour 2
Angle Angled shaded background fill from colour 1 to colour 2 for a specified
angle
Image Fill the background using the specified image file, either tile or stretch the
image.
2.6.3 Fill Color
Double click on the colour squares to select and set the start and finish gradient colours
2.6.4 Fill Angle
Enter the degree of angle for the gradient fill.
2.6.5 Show Multiple X-Axis
It is possible to allow multiple x / y-axes to be visible at the same time. This is desirable if different
Pens have different scales of values or have been configured to have different Period settings.
If this is unchecked, and the Pens individual axes are set to visible, clicking on a Pen will show the
selected Pen's axis in place of the global axis.
2.6.6 Show Multiple Y-Axis
It is possible to allow multiple x / y-axes to be visible at the same time. This is desirable if different
Pens have different scales of values or have been configured to have different Period settings.
If this is unchecked, and the Pens individual axes are set to visible, clicking on a Pen will show the
selected Pen's axis in place of the global axis.
2.6.7 Grid Configuration Dialog
Selection invokes the Grid Configuration dialog box. The Grid Configuration dialog box allows for the
x and y-axis Grids to be configured. The visibility and colour of the gridlines and the axis tick mark
settings may be changed.
- 39 -
Page 46

Reference Guide
w
D301544X412
APRIL 2012
Trend Vie
2.6.8 Marker Configuration Dialog
This button invokes the Marker Configuration dialog box, where the colour of the Marker can be
changed. The Marker is the vertical line, which appears within the Trend window when the user
double clicks on the Trend area. It is also possible to disable the marker by unchecking the 'Show
Marker' box.
2.6.9 Common Axis Configuration Dialog General Page
This dialog enables you to configure global placement and scaling for the X and Y axis of the Trend
View.
- 40 -
Page 47
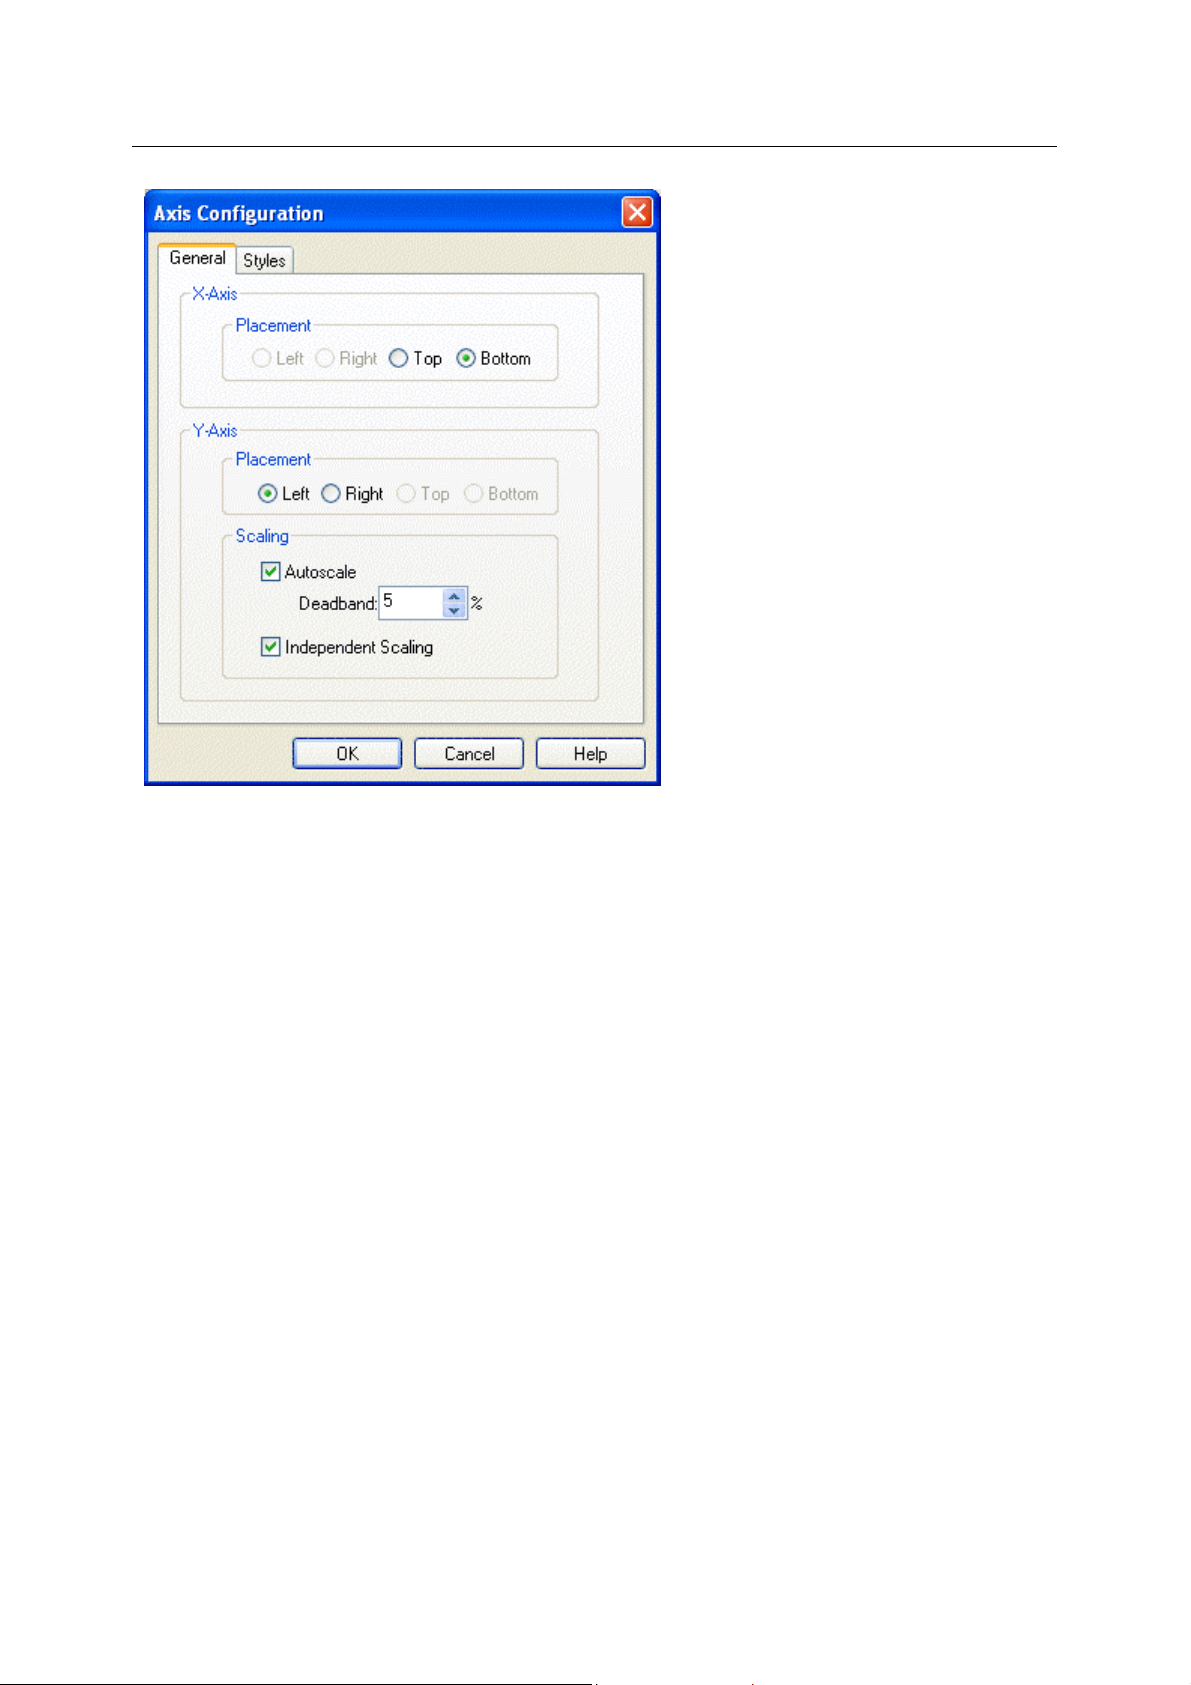
Reference Guide
w
D301544X412
APRIL 2012
Trend Vie
2.6.9.1 X-Axis Placement
There are two option
• Top - this option places the x-axis at the top of the Trend window.
• Bottom - this option places the x-axis at the bottom of the Trend window.
2.6.9.2 Y-Axis Placement
There are two option
• Left - this option places the y-axis on the left side of the Trend window.
• Right - this option places the y-axis on the right side of the Trend window.
2.6.9.3 Autoscale
This option al
determined by the highest and lowest values of the Pen plotted to date, plus a percentage according
to the Deadband setting.
2.6.9.4 Deadband
This en
lows the user to turn y-axis auto scaling on, which means that Y-Axis scaling will be
ables the user to specify a percentage by which the range of the Y-Axis will be extended.
s here: -
s here: -
For instance, a Pen having a highest value of 100 and a lowest value of 0 with individual auto-scaling
on, and a deadband of five percent will have a Y-Axis of 105 to -5. That is, the range of the Y-Axis will
be extended at top and bottom by five percent of the true range between the highest and lowest value
of the Pen.
- 41 -
Page 48
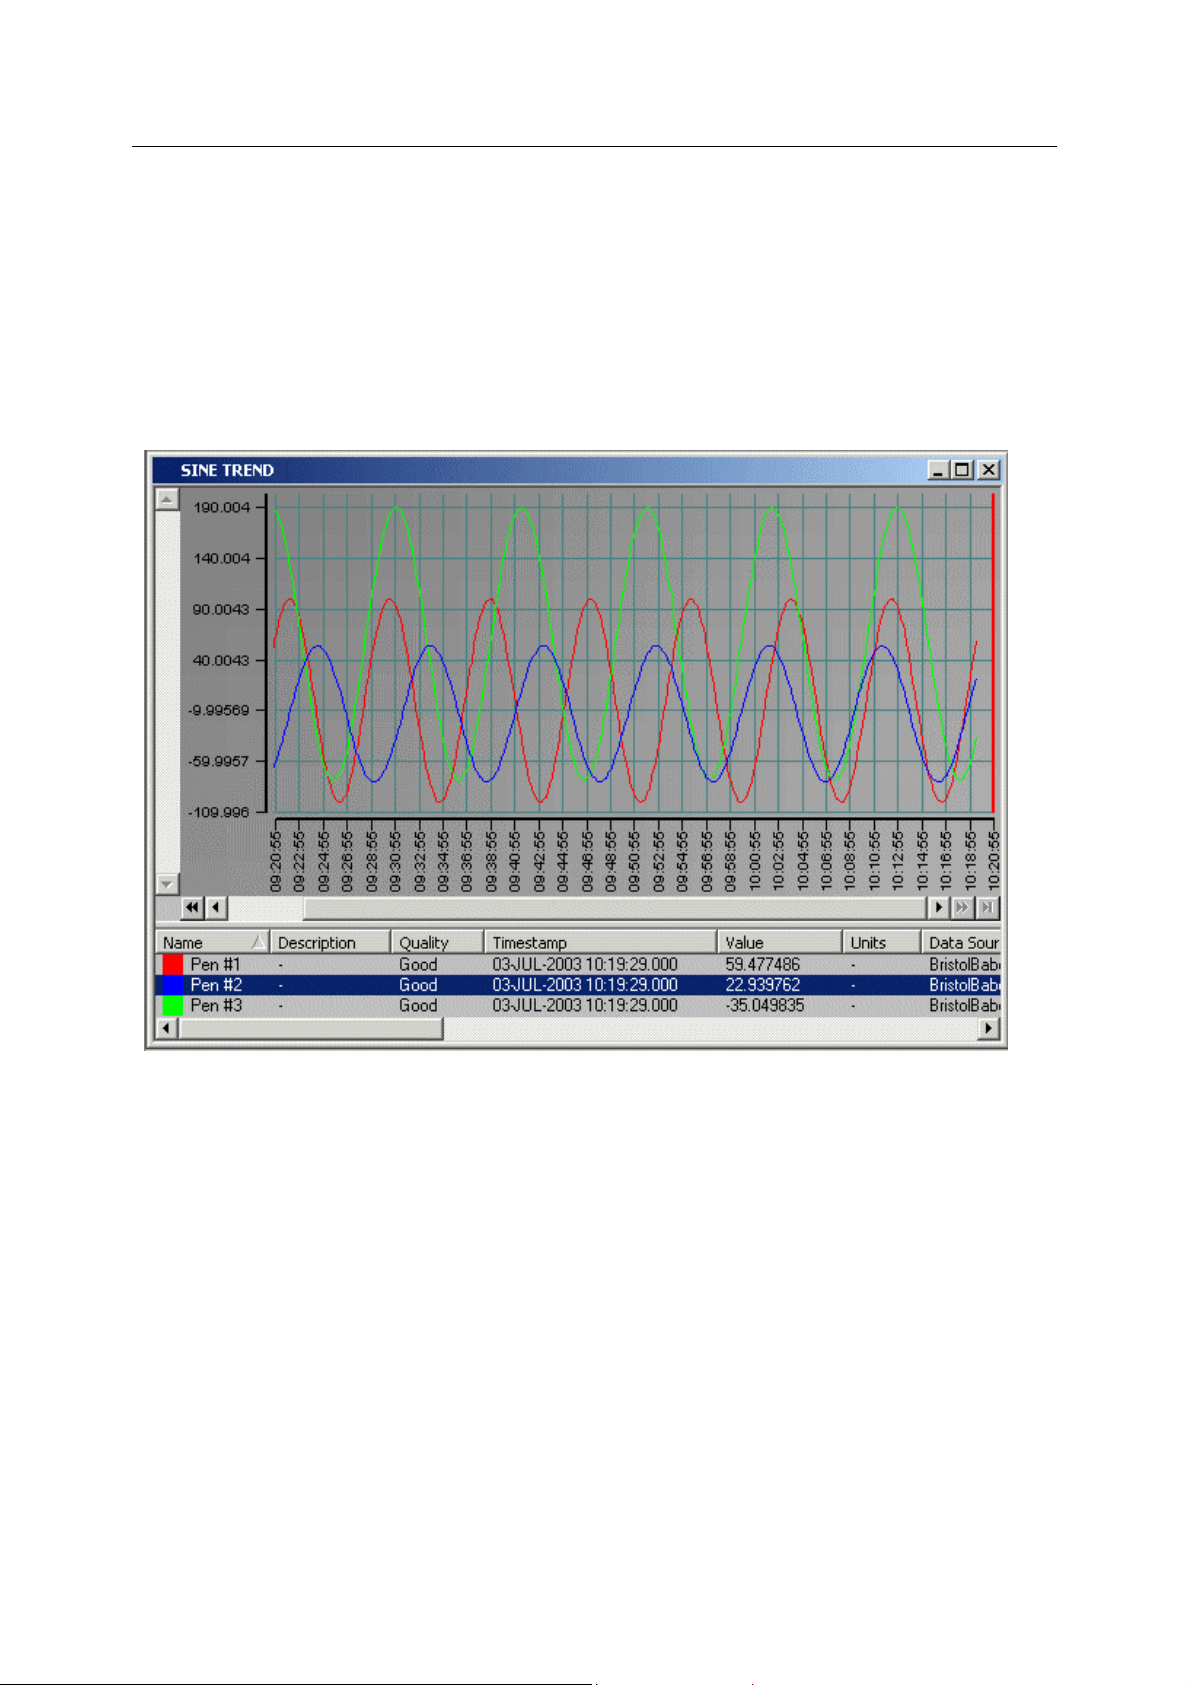
Reference Guide
w
D301544X412
APRIL 2012
2.6.9.5 Independent Scaling (IS)
n checked, each Pen is drawn according to the settings on its own y-axis. If not checked, each
Whe
Pen trace is drawn according to the settings on the common y-axis.
Together with Auto-Scale feature, Independent Scaling settings determine how the Pen is dra wn
within the Graph pane. The following examples demonstrate this: -
Independent Scaling Off
Independent Scaling is off, and Common Auto-scaling is enabled.
Trend Vie
Independent Scaling On
Independent Scaling is on, and each individual Pen is set to autoscale. The Common y-axis only is
displayed.
- 42 -
Page 49

Reference Guide
w
D301544X412
APRIL 2012
Trend Vie
Single Pen Axis Displayed
The Blue Pen's y-axis is shown alongside the Common y-axis. Note that the Blue Pen is actually
being drawn according to it's own autoscaled y-axis.
- 43 -
Page 50

Reference Guide
w
D301544X412
APRIL 2012
2.6.9.6 Common Axis Configuration Dialog Styles Page
Trend Vie
This dial
for the X and Y Axis of the Trend View.
og enables you to configure global line angle, label font, label color, visibility and label detail
2.6.9.6.1 Label Angle
This field det
against the axis, 90 degrees equals perpendicular to the axis and 180 degrees equals flat against the
axis on the other side of the perpendicular.
2.6.9.6.2 Label Font
Select the browse button t
2.6.9.6.3 Label Color
A double cli
2.6.9.6.4 Visible
Checking thi
2.6.9.6.5 Show Full Details on Axis
If this box is checke
y-axis.
ails the degrees of angle for the text labels of the x or y-axis. Zero degrees equals flat
o invoke a font selection dialog.
ck on the Colour Square displays a colour selection dialog.
s box will hide the Details pane.
d, the x-axis will contain date as well as time details. It will not add anything to the
- 44 -
Page 51

Reference Guide
w
D301544X412
APRIL 2012
Trend Vie
2.7 Common Limits Page
This page enables you to configure the visibility and color of Common Limits. Each individual Pen
may also have its own limits, which are configured from the Pen Configuration Limits Page.
2.7.1 List of Limits
Type topic text here.
2.7.2 Limit Configuration Dialog
This dialog enables you to configure values for the selected Pen Limit.
2.7.2.1 Limit Type
This di
sabled field displays the selected limit's type.
2.7.2.2 Value/Data Source
The "Value / Data Sou
field. Alternatively, an realtime or historical OPC Tag may be used to link the value of the limit to the
value of a signal in the Database.
For an example of how to drag-drop a realtime tag into a field see the Drag Drop Realtime Tag into
Data Source Field topic.
For an example of how to drop a historical tag into this field see the Drag Drop a Historical Tag into a
Field topic.
rce" field can be configured as a constant by typing a value directly into the
- 45 -
Page 52

Reference Guide
w
D301544X412
APRIL 2012
2.7.2.3 Line Style Dialog
Trend Vie
This dial
2.7.2.3.1 Line Visibility
This
2.7.2.3.2 Line Plot Style
og enables you to configure the line style for the selected Pen Limit.
check box toggles the visibility of the line, whether it be a Pen or a Limit.
The style of the plot. Possi
Style Description
None Show no data.
Line Show all data in Line format
Stair Show all data in Step format
2.7.2.3.3 Line Width
The Width is measured in point sizes and ranges from 1 to 6. When a width of greater than 1 is
selected, the line style will automatically be set to solid line and the Style option will be disabled.
2.7.2.3.4 Line Style
ble Line Style choices are shown below:
Possi
• None
• Solid
• Dashed
• Dot
ble choices are shown in the table, below:-
• Dash-Dot
• Dash-Dot-Dot
- 46 -
Page 53

Reference Guide
w
D301544X412
APRIL 2012
2.7.2.3.5 Line Color
Trend Vie
Selection of this color b
ox opens a color palette, from which a new line color can be chosen.
2.8 Parameters Page
Any aliases (parameters) placed into appropriate dialog fields will appear on this page. Parameters
may be given a default value on this page.
2.8.1 Permanently Resolving Aliases
If "Permanently Resolve Aliases" is selected, then the aliases/parameters will be permanently
replaced by their current value when saving the file.
- 47 -
Page 54

Reference Guide
w
D301544X412
APRIL 2012
Trend Vie
2.8.2 The Parameter Name
This is the name of the parameter or alias. Note the double chevrons enclosing it. Any View passing a
parameter value to the Trend View must match the name given here. Parameters are automatically
added into the list when a new parameter is placed in any of the editable fields.
2.8.3 The Current Value of the Parameter
This field is not editable. Unless a default value is provided, it will normally be empty. If a default value
is provided, this will be copied to the Current Value field.
In runtime it will contain the value of any parameters passed to it by other Views matching the
parameter names on this page.
2.8.4 The Default Value of the Parameter
A default parameter value may be typed here. This will ensure that if the Trend View file is started
without having any parameters passed to it by another View, that it will contain default values for any
aliases in the Pen tags, and will therefore display a Trend.
Any parameters passed to the Trend View in runtime will override the default parameters provided
here.
2.9 Time Zone Page
This page enables you to set the time zone for the application.
2.9.1 Adjust Time Values
When this is checked the 'Time Zone' drop down list becomes enabled, and the user can select a new
time zone for the Trend View. All Date/Time values on the Trend View will be converted from the GMT
of the OpenEnterprise database to the time according to the time zone selected here.
Default setting is GMT. Once set, there is no need to change this to allow for DST (Daylight Saving
Time), since a table in the Database (DstOffset) contains the Dates, Times and DST offsets (forward
or back) for the time zone where the system is installed for the next 10 years.
If the button is unchecked then all times displayed in the Trend View will be in GMT at all times.
- 48 -
Page 55
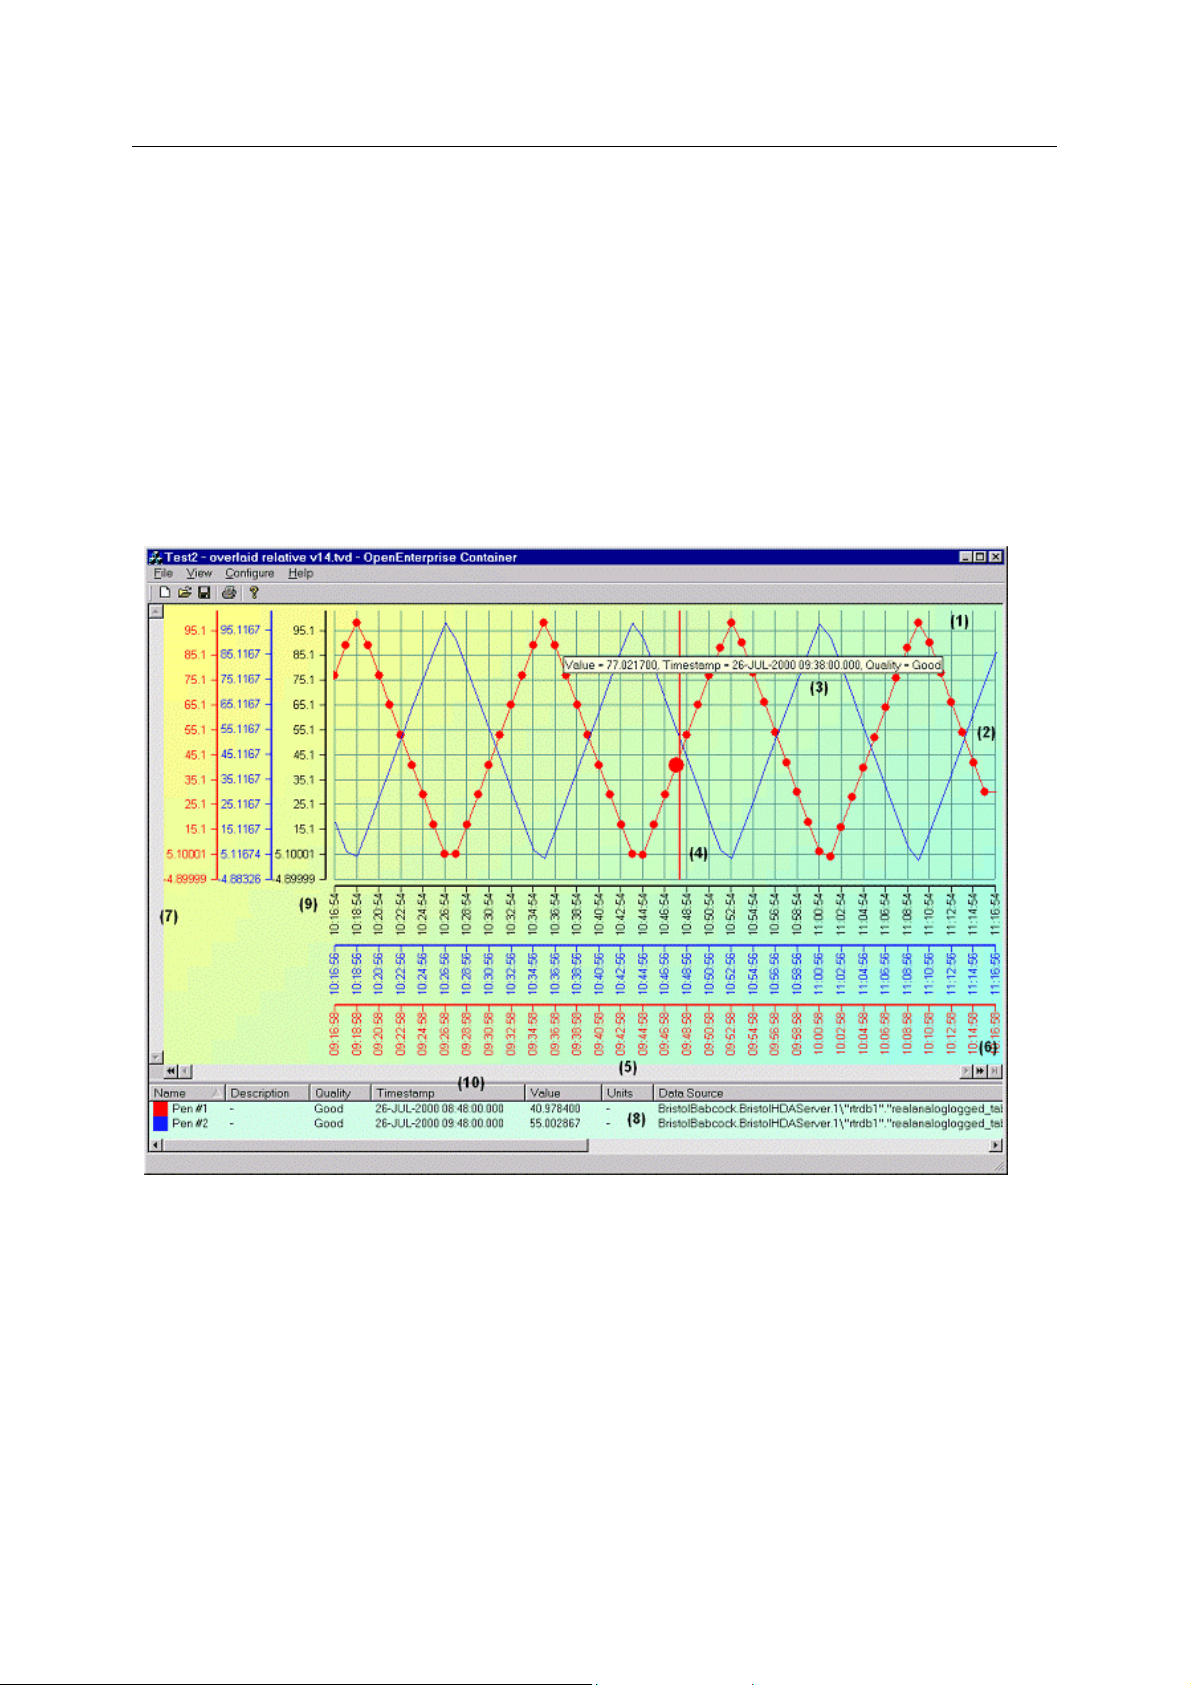
Reference Guide
w
D301544X412
APRIL 2012
Trend Vie
2.9.2 Time Zone
This is a drop down list of all time zones. The default time zone for all Views is GMT. If the
OpenEnterprise application is for another time zone than this, then each View will need to have it's
time zone changed here.
Time is governed in an View component by the Time Server rather than the Workstation's operating
system time. It is recommended that the user refers to the "Time Zones and Daylight Savings Time"
help file for further explanation.
3 Runtime Mode
Below is a screen shot of a configured Trend in runtime mode. An explanation is given for each
numbered feature.
3.1 1) Graph Pane
The Graph Pane is the main display that will be provided by the Trend View. Its purpose is to plot the
values of each pen.
3.2 2) Pen Traces
Each pen trace displays values for a particular database object over a period of time. The colour and
style of the each pen trace is configurable to allow it to be easily distinguished from other pen traces.
- 49 -
Page 56
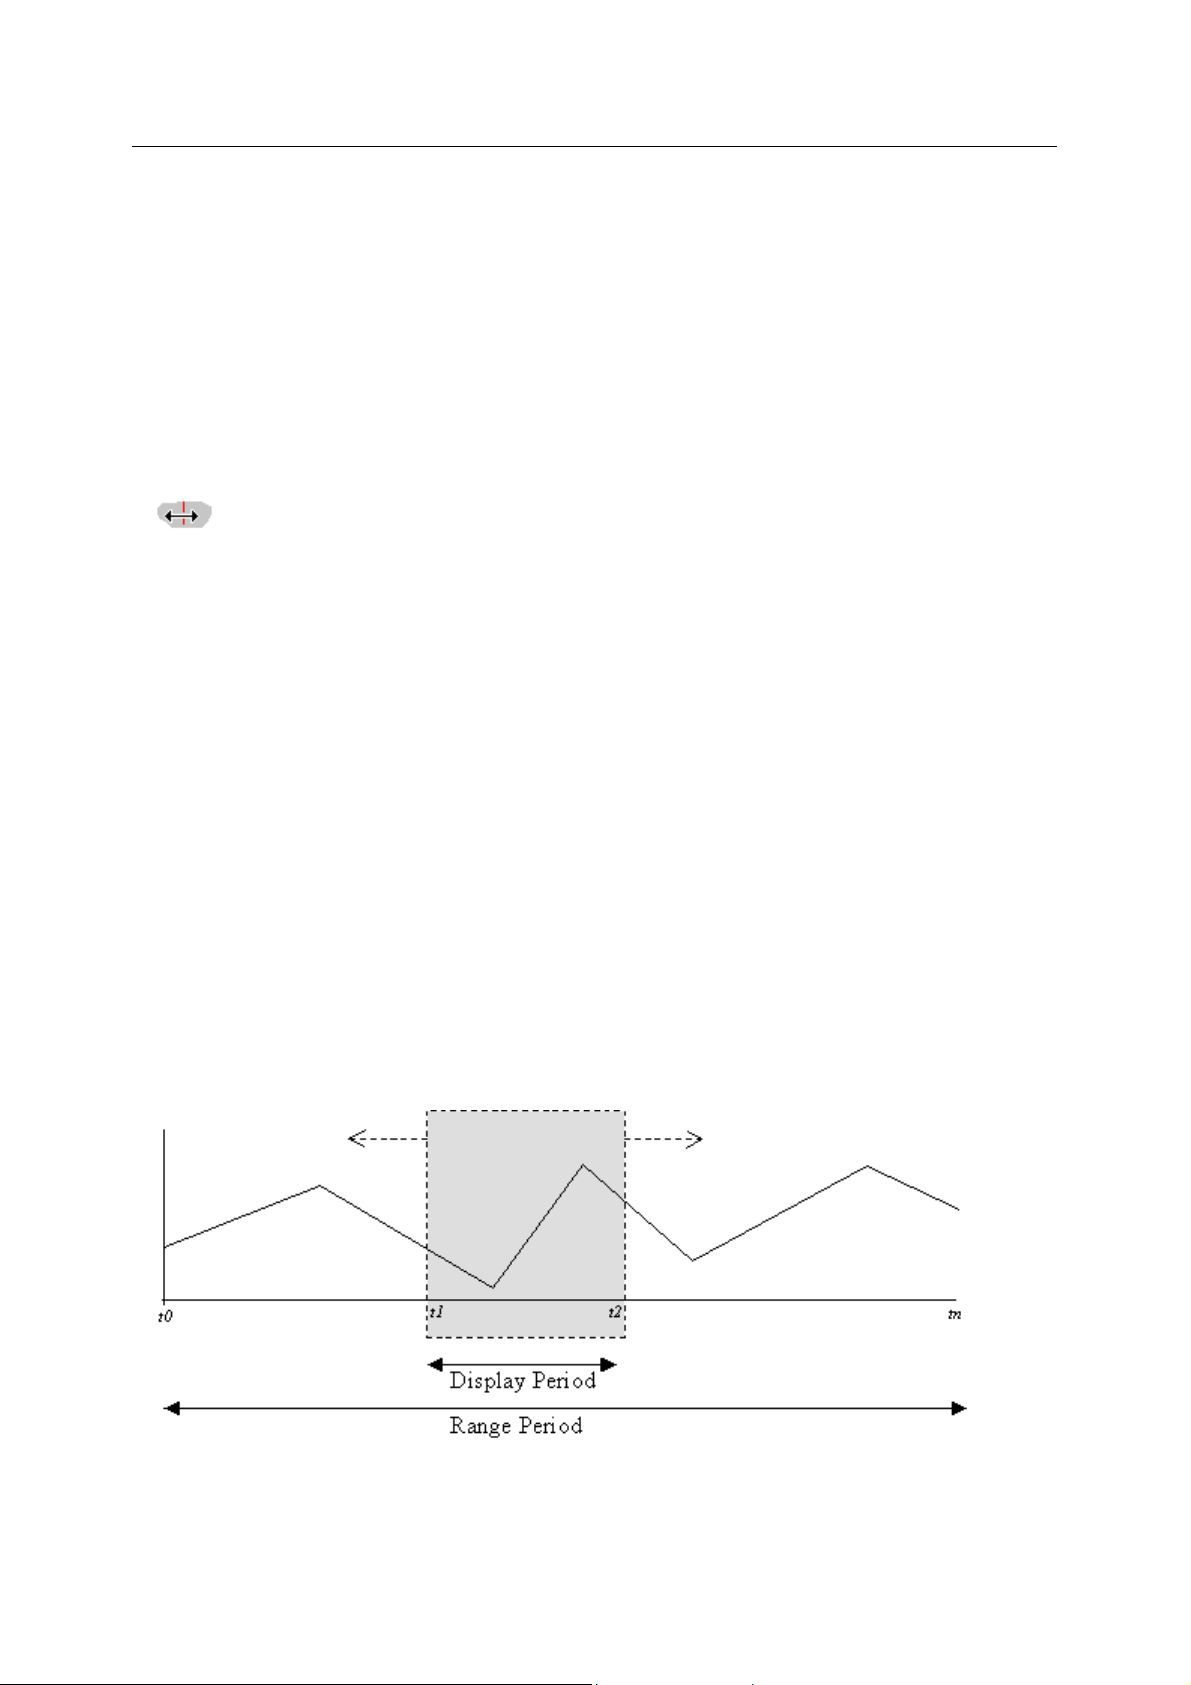
Reference Guide
w
D301544X412
APRIL 2012
Trend Vie
3.3 3) Sample Tooltip
To assist the user further, it is possible to move the mouse cursor over a sample, leaving it stationary
for a short time and a ToolTip will be displayed. This ToolTip will show the value, timestamp and
quality of the sample under the cursor.
3.4 4) Sample Marker Bar
The marker bar is used to follow/highlight pen values. It is closely linked to the Details Window. The
Marker Bar by default is attached at the right hand side of the Graph window. It can be quickly moved
to a new position by double clicking on the Graph area. Also, when the mouse is held over the Marker
Bar, the cursor changes to a horizontal arrow to indicate that dragging left and right is an option:-
The Marker Bar can then be dragged with the mouse to another position. The samples closest to the
Marker Bar's left are highlighted for each pen. The details of these samples are displayed in the
Details Window. The highlighted samples are also highlighted as the Marker Bar is dragged, allowing
the user to scroll through the sample values as the Marker Bar moves.
The Marker Bar can be re-attached to the right hand side of the Graph Window by double-clicking on
the right of the Trend, just outside the Grid Area.
Note: The overlaid marker bar time will be different for each pen if Pens have been set up to use
different X axis times.
3.5 5) Date - Time Scroll Bar
The Date/Time Scroll Bar is attached at the bottom of the Graph window and is used to control the
display of the Trend data.
3.6 6) Block Pan and Time Adjustment Buttons
The [<] [>] buttons scroll along the length of the 'Display Period' (configured on the Common Data
Page). This is shown in the diagram below. The [<<] [>>] buttons load a 'new page' of data into the
Trend View Graph pane. The display period now contains two pages of data. The default number of
pages that can be loaded into the Trend display is three, but this can be changed from the Advanced
Data Retrieval Settings Dialog.
The diagram above shows a Trend from t0 to tn. This is defined as the range of the Trend, and is
configured using the "Period" on the Common Ranges Page. This range can be either absolute (e.g.
from a start time to an end time) or relative (e.g. the last 1 hour).
- 50 -
Page 57

Reference Guide
w
D301544X412
APRIL 2012
The time period t1 to t2 is the viewable time window. This is defined using the "Display Period" on the
Data Property Page. If the display period is left at 0, the display period will be set to the same size as
the range period. If the display period is defined as a smaller period than the Range Period, the scroll
bar will be activated to allow the user to scroll the viewable time window throughout the length of the
Range Period.
When the viewable window is at the tn position, i.e. at the right hand side, then the display will auto
scroll along at each refresh interval (see Data Property Page).
When a display has been zoomed, the vertical (Y-axis) scroll bar will also become enabled.
Whilst in overlay mode (see Example 4 - Trend Overlay (Same Source Pens), the horizontal scroll bar
will move each pen as it is selected in the Details window relative to its own time range.
Whilst the Trend window is dynamically collecting data the Trend will scroll and the new data will be
displayed on each refresh interval. When in overlay mode, the scrolling will be disabled and the Trend
will fill in the time period, until the pen reaches the right hand side of the window. At this point, its
dynamic mode is cancelled and made static. To retrieve the next block of data the [>>] button must be
selected.
Runtime Mode
Trend Vie
3.7 7) Value Scroll Bar (zoomed)
The Value scroll bar is only enabled when zooming has taken place. With both scroll bars enabled, it
is possible to move around the entire Trend window with a much greater magnification, allowing
easier identification of samples. See the 'Zooming' sub-section for further information.
3.8 8) Details Pane
The Details Pane provides the user with the ability to view the latest value for all the configured pens.
When the marker bar is used, in relation to one or more pens, then the last sample value will be
displayed in the Details window.
It is also possible to select a pen (by double clicking on it in the Details window), and make the Y-axis
scale reflect the range minimum/maximum of the pen. Other pens are then scaled accordingly. To
allow this the Common Ranges must be disabled (see the Common Ranges Page).
3.9 9) Multiple Axes
This provides the ability to view separate axes for each pen as well as the common axes. When
multiple axes are configured, the axes display from the outside in as shown below. Any axis may be
removed from the Graph display.
- 51 -
Page 58

Reference Guide
w
D301544X412
APRIL 2012
Trend Vie
Runtime Mode
3.10 10) Graph - Details Splitter
The Splitter Bar gives the operator/user the ability to move/resize the Graph/Details window.
3.11 Graph Pane Context Menu
If you right click on the Graph Pane, this context menu will appear.
- 52 -
Page 59

Reference Guide
w
D301544X412
APRIL 2012
Trend Vie
3.11.1 Adjust Refresh Interval
Displays the 'Adjust Trend Refresh Interval' dialog, allowing the user to adjust the Refresh Interval of
the Trend. This item is only available at Runtime when in Dynamic Collection Mode.
3.11.2 Hide Details
Toggles the Details window on/off. This will depend on the current state of the Details window.
3.11.3 Hide Marker
Toggles the marker bar on/off. This will depend on the current state of the marker bar.
3.11.4 Zooming
Zooming allows the user to zoom into the display to view more detail about a particular area of
interest. Zooming can be undertaken using a 'rubber band' operation, using the predefined zo om
options or the zoom in/out functionality. Alternatively, it is possible to use a combination of these
zoom options.
Zoom Context Menu
The Zoom Context sub-menu option enables the user to apply zooming to the Trend View's Graph
pane.
Rubber Band Zoom
A rubber band zoom is achieved by holding down the left mouse button and dragging the mouse over
a selected area of the Trend. Releasing the mouse button will perform the zoom. The scroll bars (X/Y)
will become active allowing scrolling at the current zoom level.
To zoom out, the Zoom Undo from the context menu should be selected. This will revert back to the
previous zoomed level.
- 53 -
Page 60

Reference Guide
w
D301544X412
APRIL 2012
Trend Vie
3.11.5 Refresh
Refreshes the current Trend.
3.11.6 Export Data
Export the data visible in the Trend to either Bitmap (BMP), JPEG (JPG) or EXCEL (XLS) formats.
Holding down the [Shift] key will export to a temporary file and automatically load Microsoft® Excel, if
installed.
3.11.7 Showing all Data
In Performance Mode, it is possible that certain peaks and troughs in the data may not be shown due
to the fact that only a subset of the data is being displayed. The Show All Data option on the Trend's
context menu provides a solution to this problem while still maintaining performance improvements.
When this option is selected, the current visible range of data is refreshed, applying no resolution
restriction. This returns and displays all available data for the visible range. De-selecting this option
re-applies the current resolution setting and restricts the amount of data shown a gain.
When all data is currently being shown the context menu will be ticked. When it is only showing a
subset, it will be un-ticked.
This menu option is controlled by a Trend View Application Token called Show All Data.
The Show All Data context menu option is a runtime only option and is not saved to the TVD file.
Selecting Show All Data could potentially cause a large performance hit in the Trend View. For
example, if a month’s worth of data were on view a potentially very large set of samples could be
returned. To guard against this , when the user selects this option, a dialog is displayed warning the
user that this may affect Trend performance. It asks if the user wishes to continue. If they select [Yes]
the switch to showing all data is allowed. If they select [No] the operation is cancelled.
There is a checkbox on this dialog allowing the user to specify that it should not be shown again. This
will set a value called DisableShowAllDataWarning to 1 under the OpenEnterprise\Tasks\Trend Client
key in the OpenEnterprise settings file. To enable the dialog again, this value must be reset to 0
(zero) using the Settings Editor.
3.12 Details Pane Context Menu
If you right click on the Details Pane, this context menu will appear.
- 54 -
Page 61

Reference Guide
w
D301544X412
APRIL 2012
3.12.1 Modify Pen
Modify the selected pen via the Pen Configuration property page.
3.12.2 Add Pen
Trend Vie
Adds a new pen to the Trend.
3.12.3 Remove Pen
Removes the selected pen(s) from the Trend.
3.12.4 Remove All Pens
Removes all the pens from the Trend
3.12.5 Hide Pen
Shows or hides the selected pen's trace. This does not stop the data being collected o r sh own via the
Details window.
3.12.6 Hide X-Axis
Shows or hides the selected pen's X-axis. The pen will still scale and draw correctly even if axes are
not visible.
3.12.7 Hide Y-Axis
Shows or hides the selected pen's Y-axis. The pen will still scale and draw correctly even if axes are
not visible.
3.12.8 Adjust Time Range
Displays the 'Adjust Trend Time Range' dialog, enabling the user to adjust the Time Range of the pen.
- 55 -
Page 62

Reference Guide
w
D301544X412
APRIL 2012
4 Worked Examples
Here are some examples of Trend configuration.
1. Adding a Realtime Pen in Runtime Mode (Animation)
2. Drag Drop Pen to Pens Page (Animation)
3. Performance Optimization (Animation)
Trend Vie
4. Using the Marker Bar (Animation)
5. Changing the Display Period
6. Trend Overlays (Same Source Pens)
Overview
4.1 Add a Realtime Pen in Runtime Mode
The aim of this example is to demonstrate how a user can add a Realtime Pen to a Trend in runtime
simply by dragging and dropping a tag from Database Explorer directly onto the Trend View Graph
pane.
4.1.1.1 Method
With the Trend running in the OEDesktop, open the Database Explorer and then invoke the
1.
Database Object Viewer (DOV).
2. Query the table of interest (e.g. realanalog), and select the name and value attributes, then
run the query within the DOV.
3. Move the DOV window so that you can see the Trend also.
4. Select a value from the DOV and drag it with the mouse over the Trend.
5. The tag is placed into the Trend automatically, and the Trend begins to show the Pen.
Note: If you have configured the default pen to convert realtime tags to historical and the dataset you
choose uses historical backfill, you will need to modify the standard historical tag yourself . See the
"Historical Backfill Tags" and "Historical Backfill Tags with Performance" sections of the Realtime and
Historical Tags topic for more information.
- 56 -
Page 63

Reference Guide
w
D301544X412
APRIL 2012
Trend Vie
4.2 Performance Optimization Example
The image below is an animation. To run it again, right click on the image and select play. It
demonstrates configuring Performance Optimization on a Trend which is displaying too much data for
its size. Applying the configuration causes only a subset of samples to be plotted, with the result that
the graph is less cluttered and draws faster. All the available samples are then shown again by
selecting the Show All Data option on the Graph area context menu.
Note: If the dataset uses historical backfill, in order to use Performance optimization you will need to
add a timecolumn and logging rate section to the end of the standard historical tag yourself . Here is
an example:
BristolBabcock.BristolHDAServer.1\"rtrdb1"."nw3000realanalog_table".
"name:varchar:XWUSLAAH26100:V1.ASV.DPRS.VALUE"."logvalue:<coltype>"."2"."0s
".
"timecolumn:logtime"."rate:1m"
Note: The tag has no spaces or new lines. It is presented in this way for ease of viewing.
See the Realtime and Historical Tags topic for more information.
4.3 Marker Bar Example
This is an example of the use of the Trend Marker Bar.
4.4 Changing the Display Period
The aim of this example is to change the display period for a given Trend. The following settings will
be used:
4.4.1.1.1.1 Method
Add a Histo
• Configure the Display Range on the Global Data Page to be Days = 0, Hours = 0, Minutes =
• Switch into Runtime mode. The Trend should then be shown.
• The scroll bar should be active at the right hand side of the display. The data will scroll as
• Notice that the time window should be 10 minutes, with the ability to scroll the full 2hours+
rical Pen
10, Seconds = 0.
new data is retrieved.
worth of data.
4.5 Trend Overlay (Same Source Pens)
The aim is to set-up an overlay between two pens (of the same source) and request one h ours worth
of data for now and exactly one day in the past.
4.5.1.1.1.1 Method
• Add a new
• Leave the Common Range Period at 1 Hour.
• Select the Styles tab for this pen and select the [Axis] button. Then select the 'Styles' tab and
ensure the x and y-axes are visible for this pen.
Historic pen.
- 57 -
Page 64

Reference Guide
w
D301544X412
APRIL 2012
• Also on the pen Axis Styles Page set the x-axis to Show Full Details on Axis, and set the
Label Angle to 45 degrees.
• Add another pen, linking to the same tag.
• On the individual Ranges tab for this pen, override the time settings, leave the 'Use time
period relative to current Workstation' check box selected, and set the Period to 1 Day.
• Select the Styles tab for this Pen and select the [Axis] button. Then select the 'Styles' tab and
ensure the x and y-axes are visible for this Pen.
• On the same Axis Styles Page set the x-axis to Show Full Details on Axis, and the Label
Angle to 45 degrees.
• Put the Trend into runtime.
• The pens should both be displayed and scaled independently with axis ranges being different.
• The Trend should be showing 1 hours worth of data for the same signal, but the first Pen will
be showing data for today, and the second Pen will be showing data for the same time period
yesterday. The Trend window may be scrolled backwards or forwards in time by using the
double arrow 'New Page' transport buttons to the left and right of the scroll bar.
Trend Vie
- 58 -
Page 65

Reference Guide
w
D301544X412
APRIL 2012
5 Index
1
A
Accessing........................................................... 8
Property Pages............................................... 8
Add............................................................. 19, 58
Realtime Pen................................................ 58
Add All button................................................... 16
Add button........................................................ 16
Add Pen............................................................ 57
Adjust Refresh Interval.....................................54
Adjust Time Range........................................... 57
Adjust Time Zone............................................. 50
Advanced Button.............................................. 24
Advanced Data Retrieval Settings Dialog........ 38
Allow Runtime Configuration............................ 10
Auto Populate................................................... 23
Auto Populate Field Attribute........................... 25
Auto Populate Field Enabled............................ 25
AutoPopulateFieldList...................................... 25
Autoscale.................................................... 36, 43
Autosize Columns............................................ 15
Available Attributes .......................................... 16
B
Background Color ............................................ 15
Block Pan......................................................... 52
Border Style ..................................................... 40
C
Changing.......................................................... 58
Display Period .............................................. 58
Characteristics ................................................. 17
Default Pen................................................... 17
Common Axis Configuration Dialog General
Page ............................................................. 42
Common Axis Configuration Dialog Styles
Page ............................................................. 45
Common Data Page......................................... 38
Common Limits Page....................................... 46
Common Maximum Y-Axis............................... 38
Common Minimum Y-Axis................................ 37
Common Ranges Page....................................37
Comparison Value............................................ 35
Condition Operator........................................... 34
Conditions List Box .......................................... 34
Trend Vie
Convert Auto Populate Tag ..............................26
Realtime........................................................26
Convert Realtime Data Sources.......................21
Historical........................................................21
Create Menu Button............................................9
Current Pens.....................................................17
Current Value....................................................50
Parameter......................................................50
Current Workstation Time...........................27, 37
Use..........................................................27, 37
Currently Configured Limits ..............................28
D
Data ..................................................................39
Maximum Pages............................................39
Data Field Browse Button.................................20
Data Source....................................20, 26, 29, 47
Data Update Collection Interval........................39
Date Time Scroll Bar.........................................52
Deadband ...................................................36, 43
Decimal Places.................................................15
Number..........................................................15
Default Maximum Gap......................................26
Default Pen.................................................17, 18
Characteristics...............................................17
Example Use.................................................18
Default Return Value.........................................34
Default Value ....................................................50
Parameter......................................................50
Description........................................................23
Details Pane......................................................53
Details Pane Context Menu..............................56
Details Splitter...................................................54
Device...............................................................23
Display Period...................................................58
Changing.......................................................58
Display Range...................................................38
Display Refresh Period.....................................38
Display Type.......................................................9
E
Edit Condition Dialog ........................................34
Example......................................................58, 59
Example Use.....................................................18
Default Pen....................................................18
- 59 -
Page 66

Reference Guide
w
D301544X412
APRIL 2012
Trend Vie
Export Data ...................................................... 55
Expression Editor Dialog..................................33
Expression Editor Overview............................. 32
Expression Selected ........................................ 32
F
Fill Angle........................................................... 41
Fill Color........................................................... 41
Force Save As.................................................. 10
G
General Detail Attributes Page ........................ 15
General Detail Sub Page ................................. 15
General Page..................................................... 9
Graph ............................................................... 54
Graph Page...................................................... 40
Graph Pane...................................................... 51
Graph Pane Context Menu .............................. 54
Grid Configuration Dialog................................. 41
H
Hide Details...................................................... 55
Hide Marker...................................................... 55
Hide Pen........................................................... 57
Hide Unresolvable Pens................................... 10
Hide X-Axis ...................................................... 57
Hide Y-Axis ...................................................... 57
Historical..................................................... 21, 26
Convert Realtime Data Sources................... 21
Historical Pens................................................... 5
I
Independent Scaling ........................................ 43
L
Label Angle................................................ 36, 46
Label Color................................................. 36, 46
Label Font .................................................. 36, 46
Label Visibility .................................................. 36
Limit Configuration Dialog.......................... 28, 47
Limit Type................................................... 28, 47
Limits.......................................................... 10, 47
Line Color................................................... 30, 48
Line Plot Style ............................................ 29, 48
Line Style.................................................... 29, 48
Line Style Dialog........................................ 29, 47
Line Visibility .............................................. 29, 48
Line Width...................................................29, 48
M
Marker Color.....................................................31
Marker Configuration Dialog.............................42
Marker Style......................................................31
Maximum Pages...............................................39
Data...............................................................39
Maximum Samples per Pen..............................39
Maximum Y-Axis...............................................28
Minimum Y-Axis................................................27
Missing Data.....................................................26
Show Gap......................................................26
Modify Buttons..................................................19
Modify Pen........................................................57
Multiple Axes.....................................................53
N
Name ................................................................23
Number.............................................................15
Decimal Places..............................................15
O
Override Global Time Settings..........................27
Overview.............................................................5
P
Parameter.........................................................50
Current Value................................................50
Default Value.................................................50
Parameter Name...............................................49
Parameters Page..............................................49
Pen Axis Configuration Dialog General Page...35
Pen Axis Configuration Dialog Styles Page......36
Pen Configuration Data Page...........................20
Pen Configuration Limits Page.........................28
Pen Configuration Ranges Page......................26
Pen Configuration Styles Dialog.......................31
Pen Configuration Styles Page.........................30
Pen Data Advanced Dialog...............................24
Pen Traces........................................................51
Pens Page ........................................................16
Permanently Resolving Aliases........................49
Property Pages...................................................8
Accessing........................................................8
R
Range Period..............................................27, 37
- 60 -
Page 67

Reference Guide
w
D301544X412
APRIL 2012
Trend Vie
Realtime....................................................... 5, 26
Convert Auto Populate Tag.......................... 26
Realtime Pen.................................................... 58
Add ............................................................... 58
Refresh............................................................. 55
Remove............................................................ 19
Remove All....................................................... 19
Remove All button............................................ 16
Remove All Pens.............................................. 57
Remove button................................................. 16
Remove Condition............................................ 34
Remove Pen .................................................... 57
Re-ordering Selected Attributes....................... 16
Return Value.................................................... 35
Runtime Mode............................................ 51, 58
S
Same Source Pens.......................................... 59
Sample Marker Bar.......................................... 51
Sample Tooltip................................................. 51
Selected Attributes........................................... 16
Selected Field .................................................. 25
Show Full Details on Axis........................... 36, 46
Show Gap......................................................... 26
Missing Data................................................. 26
Show Milliseconds............................................ 15
Show Multiple X-Axis ....................................... 41
Show Multiple Y-Axis ....................................... 41
Signal Data....................................................... 23
Status................................................................23
Style..................................................................41
T
Tag....................................................................33
Text Color .........................................................15
Time Adjustment Buttons..................................52
Time Zone.........................................................50
Time Zone Page ...............................................50
Trend Overlay...................................................59
U
Units..................................................................23
Use..............................................................27, 37
Current Workstation Time.......................27, 37
Use Double Compressed Rate.........................26
Use Sub Menu..................................................10
V
Value...........................................................29, 47
Value Scroll Bar................................................53
Visible .........................................................15, 46
X
X-Axis Placement........................................35, 43
Y
Y-Axis Placement........................................35, 43
Z
Zoomed.............................................................53
Zooming............................................................55
- 61 -
Page 68

Reference Guide
D301544X412
APRIL 2012
DISCLAIMER
Bristol, Inc., Bristol Babcock Ltd, Bristol Canada, BBI SA de CV and the Flow Computer Division , are wholly owned subsidiaries of Emerson Electric Co. doing business
as Remote Automation Solutions (“RAS”), a division of Emerson Process Management. ROC, FloBoss, ROCLINK, Bristol, Bristol Babcock, ControlWave, TeleFlow and
Helicoid are trademarks of RAS. AMS, PlantWeb and the PlantWeb logo are marks of Emerson Electric Co. The Emerson logo is a trademark and service mark of the
Emerson Electric Co. All other marks are property of their respective owners.
The contents of this publication are presented for informational purposes only. While every effort has been made to ensure informational accuracy, they are not to be
construed as warranties or guarantees, express or implied, regarding the products or services described herein or their use or applicability. RAS reserves the right to
modify or improve the designs or specifications of such products at any time without notice. All sales are governed by RAS’ terms and conditions which are available upon
request. RAS does not assume responsibility for the selection, use or maintenance of any product. Responsibility for proper selection, use and mainten ance of any RAS
product remains solely with the purchaser and end-user.
Engineered and supported by:
Remote Automation Solutions,
Blackpole Road, Worcester, WR3 8YB, UK
Registered office: Meridian East, Leicester, LE19 1UX
Registered in England and Wales, Registration No. 00671801
VAT Reg No. GB 705 353 652
Emerson Process Management
Remote Automation Solutions
1100 Buckingham St
Watertown, CT 06795
T 1 (860) 945 2200
F 1 (860) 945 2278
www.EmersonProcess.com/Remote
binfo@EmersonProcess.com
© 2001-2012 Remote Automation Solutions, division of Emerson Process Management. All rights
reserved.
Emerson Process Management
Remote Automation Solutions
Blackpole Road
Worcester, WR3 8YB
T 44 (0) 1905 856848
F 44 (0) 1905 856930
www.EmersonProcess.com/Remote
oedsupport@EmersonProcess.com
 Loading...