

Remote Automation Solutions Guide: OpenEnterprise Reporting Overview Reference Guide Manuals & Guides
Page 1

Reference Guide
D5092
11-Dec-2007
Reporting Overview
Bristol OpenEnterprise Reference Guide
Reporting Overview
Remote Automation Solutions
Website: www.EmersonProcess.com/Remote
Page 2

Reference Guide
D5092
11-Dec-2007 - Page 2
Reporting Overview
Contents
1 OpenEnterprise Report Suite Overview ................................................................................ 6
1.1 Report Examples.................................................................................................................6
1.2 The Report Plug-in ..............................................................................................................6
1.3 The Report Configuration Tool............................................................................................ 6
1.4 The Report Scheduler ......................................................................................................... 7
2 A Simple Report....................................................................................................................... 9
2.1 Open the Report Configuration Tool ...................................................................................9
2.2 Report Configuration Tool Interface.................................................................................. 10
2.3 Create a new Report Template ......................................................................................... 11
2.3.1 Manual Report Template Creation ............................................................................. 12
2.3.2 General Configuration Page .......................................................................................12
2.3.3 Report Properties Data Service .................................................................................. 12
2.3.4 Report Properties Report Period ................................................................................ 13
2.3.5 Report Properties Event Logging ............................................................................... 14
2.3.6 Create a Query ........................................................................................................... 15
2.3.6.1 New Query from Context Menu ........................................................................... 16
2.3.6.2 New Query from Menu Bar .................................................................................. 16
2.3.6.3 New Query from Query Manager ......................................................................... 17
2.3.6.4 The Query Wizard ................................................................................................ 18
2.3.6.4.1 Query Name Page .......................................................................................... 18
2.3.6.4.2 Query Dataservice Page ................................................................................ 19
2.3.6.4.3 Query Dataset Page ....................................................................................... 20
2.3.6.4.4 Query Signals Page........................................................................................ 21
2.3.6.4.4.1 Signal Browse Dialog ...............................................................................22
2.3.6.4.5 Query Period Page ......................................................................................... 24
2.3.6.4.5.1 Verifying the Report Period ...................................................................... 24
2.3.6.4.6 Query Transform Page ................................................................................... 25
2.3.6.4.7 Query Output Page......................................................................................... 26
2.3.7 Final Touches - Renaming Sheets ............................................................................. 27
2.3.7.1 Change the Sheet name ...................................................................................... 27
2.3.7.2 Delete the other sheets ........................................................................................ 30
2.3.7.3 Make the headings bold .......................................................................................30
2.3.8 Test Run the Query .................................................................................................... 30
2.3.8.1 Test Run the Query.............................................................................................. 30
2.3.8.2 The Simple Report Output ................................................................................... 31
2.4 Create the Report.............................................................................................................. 32
2.4.1 Report Configuration General Page ........................................................................... 33
2.4.2 Alias Values Page ...................................................................................................... 34
2.4.3 Publishing Page.......................................................................................................... 35
2.4.4 Formats Page ............................................................................................................. 36
2.4.5 Schedules Page ......................................................................................................... 37
2.4.6 Credentials Page ........................................................................................................38
Remote Automation Solutions
Website: www.EmersonProcess.com/Remote
Page 3

Reference Guide
D5092
11-Dec-2007 - Page 3
Alarm Conditions Page ...............................................................................................39
2.4.7
2.4.8 Creating a Schedule ................................................................................................... 40
2.4.8.1 Schedule W izard General Page........................................................................... 41
2.4.8.2 Schedule Type Properties.................................................................................... 42
2.4.8.3 Schedule Associated Reports ..............................................................................42
2.4.8.4 Alarm Conditions.................................................................................................. 43
3 Advanced Reporting Techniques......................................................................................... 45
3.1 Advanced Report Example ............................................................................................... 45
3.2 The Report Template ........................................................................................................ 46
3.2.1 Advanced - Create the Report Template.................................................................... 46
3.2.2 Advanced - Configure First Query .............................................................................. 46
3.2.3 Advanced - Configure Second Query......................................................................... 48
3.2.4 Initial Preparation of Output Sheet ............................................................................. 50
3.2.4.1 Change Sheet Name............................................................................................ 50
3.2.4.2 Report Title........................................................................................................... 50
3.2.4.3 From and To Values - Inserting Functions........................................................... 51
3.2.4.4 Add the Labels ..................................................................................................... 51
3.2.4.5 Add the Function .................................................................................................. 52
3.2.4.6 Column Headings................................................................................................. 53
3.2.4.7 Report Borders .....................................................................................................54
3.2.5 Automatic Data Array Naming .................................................................................... 56
3.2.5.1 Example Named Array ......................................................................................... 57
3.2.6 Using Array Formulas ................................................................................................. 58
3.2.6.1 Get the Data Array Name .................................................................................... 58
3.2.6.1.1 Select the Data Array...................................................................................... 58
3.2.6.1.2 Copy the Data Array Name ............................................................................ 59
3.2.6.2 Select the Target Cell Array ................................................................................. 59
3.2.6.3 Build the Array Function....................................................................................... 60
3.2.6.3.1 Get the Source Data Array Name................................................................... 61
3.2.6.3.2 Select Target Cell Range ............................................................................... 62
3.2.6.3.3 Build the Array Function ................................................................................. 62
3.3 The Report Schedule ........................................................................................................ 63
3.3.1 Open the Report Configuration Tool .......................................................................... 63
3.3.2 Create a new Schedule .............................................................................................. 63
3.3.3 Schedule Configuration General Settings .................................................................. 64
3.3.4 Timed Schedule Settings............................................................................................ 65
3.3.5 Associated Reports .................................................................................................... 66
3.3.6 Alarm Conditions ........................................................................................................ 67
3.4 The Report Format............................................................................................................ 68
3.4.1 Open the Report Configuration Tool .......................................................................... 69
3.4.2 Create a new Format .................................................................................................. 69
3.4.3 Format General Settings ............................................................................................ 70
3.4.4 Format Purging ........................................................................................................... 71
3.4.5 Recipient Associations ............................................................................................... 71
3.4.6 Alarm Conditions ........................................................................................................ 72
Reporting Overview
Remote Automation Solutions
Website: www.EmersonProcess.com/Remote
Page 4

Reference Guide
D5092
11-Dec-2007 - Page 4
The Report ........................................................................................................................ 73
3.5
3.5.1 Open the Report Configuration Tool .......................................................................... 74
3.5.2 Create a new Report .................................................................................................. 74
3.5.3 Report General Page.................................................................................................. 75
3.5.4 Report Alias Values .................................................................................................... 75
3.5.5 Report Publishing ....................................................................................................... 76
3.5.6 Report Formats........................................................................................................... 77
3.5.7 Report Schedules ....................................................................................................... 78
3.5.8 Report Credentials...................................................................................................... 79
3.5.9 Report Alarm Conditions ............................................................................................ 80
4 Real World Example Report ................................................................................................. 82
4.1 Raw Water Pumpage ........................................................................................................ 82
4.2 Treated Water Pumpage................................................................................................... 82
4.3 Raw Water Turbidity.......................................................................................................... 83
4.4 Raw Water Alkalinity ......................................................................................................... 83
4.5 Settled Water Turbidity...................................................................................................... 83
4.6 Finished Water Turbidity ................................................................................................... 83
4.7 Monthly Pumpage Totals .................................................................................................. 83
4.8 Turbidity Historical Stream ................................................................................................ 83
4.8.1 Raw Pumpage ............................................................................................................ 84
4.8.2 Treated Pumpage ....................................................................................................... 84
4.8.3 Raw Turbidity.............................................................................................................. 84
4.8.4 Raw Alkalinity ............................................................................................................. 84
4.8.5 Settled Turbidity.......................................................................................................... 84
4.8.6 Finished Turbidity ....................................................................................................... 84
4.8.7 Create the Stream ...................................................................................................... 84
4.8.7.1 Select the Columns and Define the Compressed Values.................................... 86
4.8.7.2 Define the Raw Dataset ....................................................................................... 87
4.8.7.3 Define the Compressed Dataset .......................................................................... 88
4.8.7.4 Select the Signals ................................................................................................ 89
4.9 Turbidity Report Template................................................................................................. 90
4.9.1 Change the First Sheet Name .................................................................................... 92
4.9.2 Configure the Turbidity Query .................................................................................... 93
4.9.3 Turbidity Name, Dataservice and Dataset.................................................................. 93
4.9.4 Turbidity Objects......................................................................................................... 94
4.9.5 Turbidity Query Period................................................................................................ 94
4.9.6 Turbidity Data Transform............................................................................................ 95
4.9.7 Turbidity Query Output ............................................................................................... 96
4.9.8 Prepare the Turbidity Output Sheet............................................................................ 96
4.9.8.1 The Turbidity Report Title .................................................................................... 97
4.9.8.2 Automating the Month and Year .......................................................................... 98
4.9.8.3 Block Borders ..................................................................................................... 102
4.9.8.4 Finished Turbidity Modifications......................................................................... 104
4.9.9 Mapping the Turbidity Arrays.................................................................................... 106
4.9.9.1 Getting the Source Array ................................................................................... 106
Reporting Overview
Remote Automation Solutions
Website: www.EmersonProcess.com/Remote
Page 5

Reference Guide
D5092
11-Dec-2007 - Page 5
Reporting Overview
4.9.9.2
4.9.9.3 Including IF Formulas......................................................................................... 108
4.9.10 The Finished Turbidity Report Template............................................................... 110
4.10 Turbidity Report Schedule ........................................................................................... 111
4.10.1 Turbidity Schedule Name and Type...................................................................... 112
4.10.2 Turbidity Schedule Type Configuration ................................................................. 113
4.10.3 Turbidity Schedule Associated Report .................................................................. 113
4.11 Turbidity Report Format............................................................................................... 114
4.11.1 Turbidity Format Name, Type and Destination ..................................................... 115
4.12 Turbidity Report ........................................................................................................... 116
4.12.1 Turbidity Report General Page ............................................................................. 117
4.12.2 Turbidity Report Publishing Page ......................................................................... 118
4.12.3 Turbidity Report Formats Page ............................................................................. 118
4.12.4 Turbidity Report Schedules Page ......................................................................... 119
5 Index ..................................................................................................................................... 121
Defining the Target Array................................................................................... 108
4.9.9.3.1 Average Without an IF Formula.................................................................... 108
4.9.9.3.2 Creating and Including the IF Formula ......................................................... 109
4.9.9.3.3 Avarage after Including the IF Formula ........................................................ 109
Remote Automation Solutions
Website: www.EmersonProcess.com/Remote
Page 6

Reference Guide
D5092
11-Dec-2007 - Page 6
Reporting Overview
1 OpenEnterprise Report Suite Overview
The Report Suite enables the creation, scheduling, publication and distribution of reports. The three
components of the OpenEnterprise Report Suite are: -
1. The Report Plug-in
2. The Report Configuration Tool
3. The Report Scheduler
1.1 Report Examples
To help you in learning how to use the Report Suite to configure real world reports, two example
reports are detailed here. The first is a simple example, designed to take you step by step in detail
through the process of creating a basic report. The second example shows a more advanced method
of report creation using multiple queries.
1. A Simple Report
2. Advanced Reporting Techniques
3. A Real World Report
1.2 The Report Plug-in
This is an Excel add-in that enables Report Templates to be configured by directly importing
OpenEnterprise historical data into Excel. Each historical data import is associated with a selected
cell. A Query is then constructed by means of a wizard. More than one query can be configured within
a single Report Template. The Excel file with the configured Report Plug-in Query or Queries is
saved, and becomes a Report Template. It can then be used when configuring an OpenEnterprise
Report.
The Report Plug-in can be installed on an OpenEnterprise Server as part of the Reporting Suite, but
can also be installed separately on a computer that is neither an OpenEnterprise Server or
Workstation. This enables any computer to be used to configure Report Templates.
Note: for the Report Plug-in to work, Excel 2003 (Microsoft Office 2003 Professional or standalone
Excel 2003) must be installed on the host machine.
1.3 The Report Configuration Tool
This tool enables all aspects of report configuration, including access to the Report Plug-in for
creation of Report Templates. A configured OpenEnterprise Report must have an associated
Template and Schedule, and optionally a number of Formats and Recipients.
Remote Automation Solutions
Website: www.EmersonProcess.com/Remote
Page 7

Reference Guide
D5092
11-Dec-2007 - Page 7
The Template defines the data that is in the Report, the Schedule defines when the Report will be run,
the Format defines the form in which the Report is to be published, and the Recipient defines where
the published report will be delivered.
Reporting Overview
1.4 The Report Scheduler
The Report Scheduler is used to run, publish and deliver all configured Reports. Without it, properly
configured reports will not run. It should be configured to run as part of an OpenEnterprise Session,
either part of an existing OpenEnterprise Session or a standalone Report Session.
Remote Automation Solutions
Website: www.EmersonProcess.com/Remote
Page 8

Reference Guide
D5092
11-Dec-2007 - Page 8
Reporting Overview
The Report Scheduler's user interface provides the administrative user with information on the report
configuration found in the database, statistics on the reports that have been run and events related to
the running of reports. This information keeps the administrative user informed of all reporting issues.
Remote Automation Solutions
Website: www.EmersonProcess.com/Remote
Page 9

Reference Guide
D5092
11-Dec-2007 - Page 9
Reporting Overview
2 A Simple Report
This example shows how to configure a simple Report that will capture the previous hour's raw data
for some Tank Levels. Its main purpose is to walk you through and familiarize you with the process of
report creation. This is what the report will look like. You can use any number of analog signals from a
raw or compressed dataset in your database to create this report. In this example we are using four
signals.
There are three main steps to configuring a report.
1. Step 1 - Open the Report configuration Tool
2. Step 2 - Create and Configure the Report Template
3. Step 3 - Configure the Report
2.1 Open the Report Configuration Tool
The Report Configuration Tool resides in the OpenEnterprise Toolbox. To access the Toolbox, select
the Windows Start button and select Start>Programs>OpenEnterprise>Toolbox. Then select the
Report Configuration Tool, which is circled in the image below.
Remote Automation Solutions
Website: www.EmersonProcess.com/Remote
Page 10

Reference Guide
D5092
11-Dec-2007 - Page 10
Reporting Overview
When you have created the initial Report Template return to the Report Properties Data Service
within this documentation.
page
2.2 Report Configuration Tool Interface
When the Report Configuration Tool first loads, it displays this Welcome page, which provides an
initial example of how to create a Report using the Report Configuration tool, but contains no detailed
information on the process of creating a Report Template. You can stop this Welcome message
appearing the next time you open the Report Configuration Tool by un-checking the Show this form
on startup box. Then click the Close button.
When the Welcome page has closed, you will see the Report Configuration Tool's main user
interface:-
Remote Automation Solutions
Website: www.EmersonProcess.com/Remote
Page 11

Reference Guide
D5092
11-Dec-2007 - Page 11
Note the tree view in the left pain has a list of empty headings underneath the main Report
Configuration object. We need to create a new Report, but if you right click on The Configured
Reports object, and select New Report, you will get this message:-
Reporting Overview
So, we first need to create a new Report Template object.
2.3 Create a new Report Template
Since we have no existing Report configuration, the first thing we need to do is create a Report
Template.
Select the Template icon and right click on the mouse. Then select the New Report Template option
from the context menu as shown below. This will open the General Template Configuration page.
Alternatively, you can click the Edit menu and select the New Template option.
Remote Automation Solutions
Website: www.EmersonProcess.com/Remote
Page 12

Reference Guide
D5092
11-Dec-2007 - Page 12
Reporting Overview
2.3.1 Manual Report Template Creation
A new Report Template can also be created manually. Instructions for creating a Report Template
manually are given in the Report Plugin documentation
.
2.3.2 General Configuration Page
If you are using the Report Configuration tool to configure a new Report Template, the General
Template Configuration page is shown. Type the new template's name into the Name: field. The
Create button will be enabled. Click the Create... button, circled in the image below. This will launch a
new instance of Microsoft Excel as a new OpenEnterprise Report Template.
2.3.3 Report Properties Data Service
When a new Report Template opens for the first time, a Report Properties wizard prompts for some
global Report properties. The first Report property required is the Data Service of the OpenEnterprise
Server database to import data from. The default setting is rtrdb1. Change this value so that you can
connect to your own database. You can test the connection to the data service by clicking the Test
Connection button. For the purposes of this example, this is the correct data service, so leaving this
setting as it is, we move to the next page by selecting the Next>
button.
Remote Automation Solutions
Website: www.EmersonProcess.com/Remote
Page 13

Reference Guide
D5092
11-Dec-2007 - Page 13
Reporting Overview
2.3.4 Report Properties Report Period
The next page is the Report Period page, which defines a default query period for the Report. The
default query period is Today. Our query period is for the previous hour, so click on the drop-down
Calendar Period list and select the Previous Hour option. Then move to the next page by selecting
the Next>
button.
Remote Automation Solutions
Website: www.EmersonProcess.com/Remote
Page 14

Reference Guide
D5092
11-Dec-2007 - Page 14
Reporting Overview
2.3.5 Report Properties Event Logging
This page enables us to determine if and how we want our Report Template to log events. Event
logging is useful for troubleshooting when creating and running a Report. The default is for Event
Logging to be enabled, using the same name as the Report Template, a new Log file being created in
the same directory as the actual Template each time it is opened. This is fine, so we will leave the
default settings as they are. Click the Finish
the Report Properties wizard.
button to finalize the global Report properties and close
Remote Automation Solutions
Website: www.EmersonProcess.com/Remote
Page 15

Reference Guide
D5092
11-Dec-2007 - Page 15
Reporting Overview
2.3.6 Create a Query
Once the Report properties have been configured, you will be returned to the open Report Template.
Remote Automation Solutions
Website: www.EmersonProcess.com/Remote
Page 16

Reference Guide
D5092
11-Dec-2007 - Page 16
From here you can begin creating a query to import OpenEnterprise historical data by right clicking on
a cell and selecting the OpenEnterprise>Import Signal History
which enables you to create a query for the Report Template.
Reporting Overview
option. The Query wizard will begin,
You could also use the OpenEnterprise menu on the Excel menu bar
import the OpenEnterprise historical data.
2.3.6.1 New Query from Context Menu
Select a cell where you wan to run the query from (usually the top left cell). Then locate the
OpenEnterprise option at the bottom of the context menu, and select OpenEnterprise>Import
Signal History>New Query, as shown in the image below.
, or the Query Manager to
2.3.6.2 New Query from Menu Bar
Select OpenEnterprise>Import Signal History>New Query from the Excel menu bar as shown in
the image below.
Remote Automation Solutions
Website: www.EmersonProcess.com/Remote
Page 17

Reference Guide
D5092
11-Dec-2007 - Page 17
2.3.6.3 New Query from Query Manager
Select OpenEnterprise>Query Manager from the Excel menu bar as shown in the image below.
Reporting Overview
Then select the Add button from the Query Manager dialog, as shown here.
Remote Automation Solutions
Website: www.EmersonProcess.com/Remote
Page 18

Reference Guide
D5092
11-Dec-2007 - Page 18
Reporting Overview
2.3.6.4 The Query Wizard
The Query Wizard enables you to create a new query for the Report Template. In our test database,
we have four tanks with level signals, which are ramping up and down fairly quickly. We have
configured a dataset for these tank levels which takes a raw data sample every minute. This simple
query is going to display all level values logged by the Historian for the four tanks during the previous
hour.
There are seven pages of the Query Wizard. As you configure each page, select the Next button to
move to the next page. The pages are listed down the left hand side. Each time you move on, the
next page is highlighted and the previous page name is italicized. The seven pages are:-
1. The Query Name page.
2. The Dataservice page.
3. The Dataset page
4. The Signals page.
5. The Query Period page.
6. The Transform page.
7. The Output and Data Formatting page.
2.3.6.4.1 Query Name Page
This is the first of the Query configuration pages. It enables you to give the new Query a name. The
name of each query defaults to Query<n>, where <n> is a unique serial number automatically given to
each query as it is configured within the Report Template. This name can be changed if required by
entering a new name. We will leave the default Query name in there. Click the Next button to go to
the Query configuration Dataservice page
.
Remote Automation Solutions
Website: www.EmersonProcess.com/Remote
Page 19

Reference Guide
D5092
11-Dec-2007 - Page 19
Reporting Overview
2.3.6.4.2 Query Dataservice Page
The Query configuration Dataservice page enables you to select the default data service or enter a
different service. We will also leave this as it is, since we are actually connecting to the default Report
DataService. Click the Next button to go to the Query Dataset Page
.
Remote Automation Solutions
Website: www.EmersonProcess.com/Remote
Page 20

Reference Guide
D5092
11-Dec-2007 - Page 20
Reporting Overview
2.3.6.4.3 Query Dataset Page
This is where we select the actual dataset that we want to query. The major historical groups are
shown next to a plus sign on the left of the list. In the example below they are listed as "control id =
<ControlID>". These represent the historical 'streams' that have been configured in our database.
Remote Automation Solutions
Website: www.EmersonProcess.com/Remote
Page 21

Reference Guide
D5092
11-Dec-2007 - Page 21
Reporting Overview
Raw sample datasets are marked with 0s (zero seconds). Compressed datasets have larger rates
than zero.
In this example we have selected the raw dataset for control id 2. You can select any raw dataset that
has been configured in your OpenEnterprise database. Select the dataset first, then click the
Selected button. This places the selected dataset into the Currently selected data set field.
Now click the Next button to go to the Query Signals Page
2.3.6.4.4 Query Signals Page
This is where we select the signals to be displayed on the report. The All Signals radio button is
selected by default, but we only want a subset of the signals in the dataset we selected, so we have
selected the Named Signals Only... radio button. To create a filter, we now need to access the
Signal Browse dialog
by clicking on the Add Signals... button.
.
Remote Automation Solutions
Website: www.EmersonProcess.com/Remote
Page 22

Reference Guide
D5092
11-Dec-2007 - Page 22
Reporting Overview
2.3.6.4.4.1 Signal Browse Dialog
This dialog enables us to find and select the signals we are interested in. We are looking for all the
Tank Level signals in the dataset we selected. The unique Extension for these signals is 'LEVEL', so
we type this string into the Extension filter box. Then click the Find Signals button.
Remote Automation Solutions
Website: www.EmersonProcess.com/Remote
Page 23

Reference Guide
D5092
11-Dec-2007 - Page 23
Reporting Overview
All signals having the 'LEVEL' extension are shown in the found signals list.
We can then select the signals we want and click the Add Signals button before closing the dialog by
selecting the Close button.
Remote Automation Solutions
Website: www.EmersonProcess.com/Remote
Page 24

Reference Guide
D5092
11-Dec-2007 - Page 24
When the Signal Browser dialog has closed, we are returned to the Signal Selector Page. We can see
that the signals have now been entered into the Selected Signals list. Click the Next button to go to
the Query Period Page.
Reporting Overview
2.3.6.4.5 Query Period Page
This is where we configure the period covered by this query i.e. how much data do we want to request
from the database and display on the report? We set the default Report Period to the Previous Hour
option from the Calendar Period drop-down list, so we can leave this as it is. This will retrieve the
previous hours worth of data whenever we run the Report. We will leave the Offset from midnight
setting to zero.
2.3.6.4.5.1 Verifying the Report Period
We can verify that the query period is going to give us the data we want by looking at the If the
Report were run on Date/Time fields, then comparing these with the From: and To: fields. We can
see that if the Report was run between 1PM and 2PM that the Report would contain data from the
previous hour (12PM to 1PM).
Remote Automation Solutions
Website: www.EmersonProcess.com/Remote
Page 25

Reference Guide
D5092
11-Dec-2007 - Page 25
Reporting Overview
2.3.6.4.6 Query Transform Page
The Transform page enables us to define how the data will be transformed before sending it to the
Report. We will leave the defaults, which means that the Plug-in will use the Timestamp column itself
as timestamp values, and that the timestamps will be displayed in ascending order. We have selected
the raw value column for display, have enabled timestamp rounding to the nearest second, and have
opted to insert missing records into the Report.
Remote Automation Solutions
Website: www.EmersonProcess.com/Remote
Page 26

Reference Guide
D5092
11-Dec-2007 - Page 26
Reporting Overview
2.3.6.4.7 Query Output Page
The Output page enables us to define where and how the Report data will be output. We will leave
the defaults on this page also, meaning that the data will appear on the sheet where the query has
been configured. Column widths will be adjusted to fit the data, the object names (the Tank Level
signals) will be shown, as will the column headers. Any null values returned will be displayed as an
empty cell, but we could choose here to display null values as a string, for instance - 'NO-DATA'.
Remote Automation Solutions
Website: www.EmersonProcess.com/Remote
Page 27

Reference Guide
D5092
11-Dec-2007 - Page 27
Reporting Overview
When we click on the Finish button, a small message box appears informing us that the query was
created successfully, and asking us if we want to run the query now.
Click the No button for the moment. We will run our query later, because we have something else
do first.
to
2.3.7 Final Touches - Renaming Sheets
The report will not look very good if it is called 'Sheet1', and with empty worksheets attached to it, so
we need to do a few final things.
2.3.7.1 Change the Sheet name
Right click on the tab at the bottom of 'Sheet1' and select the Rename option...
Remote Automation Solutions
Website: www.EmersonProcess.com/Remote
Page 28

Reference Guide
D5092
11-Dec-2007 - Page 28
Type in a more appropriate name for the report...
Reporting Overview
Now we need to reconfigure the Report Template, because we have changed the name of the
worksheet where it outputs its data. First select the OpenEnterprise>Query Manager menu option...
Then select the Query from the Query Manager dialog, and click the Modify button.
Remote Automation Solutions
Website: www.EmersonProcess.com/Remote
Page 29

Reference Guide
D5092
11-Dec-2007 - Page 29
Reporting Overview
Then select the 'Output and Data Formatting' page from the 'Modify Query' dialog, indicated here by
the red arrow.
As you can see, the Report Plug-in is expecting to output to 'Sheet1', which no longer exists, so now
click the browse button to the right of this field, which we outlined in red here...
This small dialog appears with the new name of the worksheet...
Remote Automation Solutions
Website: www.EmersonProcess.com/Remote
Page 30

Reference Guide
D5092
11-Dec-2007 - Page 30
Select the OK button and you will be returned to the Output page. Now you will see the new
worksheet name and cell reference (NORTH TANK LEVELS!A1)in place of 'Sheet1!A1' in the
Existing Worksheet - cell reference: field.
2.3.7.2 Delete the other sheets
Now delete the other two sheets from the workbook by right clicking on them and selecting the Delete
option...
Reporting Overview
2.3.7.3 Make the headings bold
Finally, we will give all the headings in our report a bold font by selecting the first two rows of the
report and clicking the B on the toolbar to make the font bold.
Now we can actually test our simple report.
2.3.8 Test Run the Query
2.3.8.1 Test Run the Query
Once the query has been created, it is time to test it. Select the OpenEnterprise>Run Report option
from the Excel menu bar.
Remote Automation Solutions
Website: www.EmersonProcess.com/Remote
Page 31

Reference Guide
D5092
11-Dec-2007 - Page 31
2.3.8.2 The Simple Report Output
This is how the Report Template output looks without any further formatting at all. The left column
displays the timestamp values. As we asked, the Plug-in has displayed all timestamps, even where
there is no corresponding value. The full signal names are printed along the first row, and the columns
we asked for are printed below their signal names. Where there is a corresponding value for a
timestamp, it is displayed under the column heading for the signal.
Reporting Overview
Remote Automation Solutions
Website: www.EmersonProcess.com/Remote
Page 32

Reference Guide
D5092
11-Dec-2007 - Page 32
Reporting Overview
Save the Report Template and close Excel. Now that we have created the Report Template, we can
go ahead and create the actual Report using the Report Configuration Tool.
2.4 Create the Report
We can now continue with creating our Report, because we have created a Report Template for it.
When the Report Template is saved and closed, we are returned to the Report Configuration Tool's
main interface. The difference is that now we can see our configured Template.
The first thing we should do now is select the "The Configured Reports" icon, right click and then click
the "New Report" context menu.
Remote Automation Solutions
Website: www.EmersonProcess.com/Remote
Page 33

Reference Guide
D5092
11-Dec-2007 - Page 33
This will open the Report Configuration wizard at the General Page.
Reporting Overview
2.4.1 Report Configuration General Page
The General Report Configuration page enables us to create a name for the Report, together with a
more informative description, and to associate the Report with a Report Template. In our example
below we have used the name of the Report Template, but have added "PH" (short for "Previous
Hour"). When you have finished the page, select the Next
button to go to the next page of the wizard.
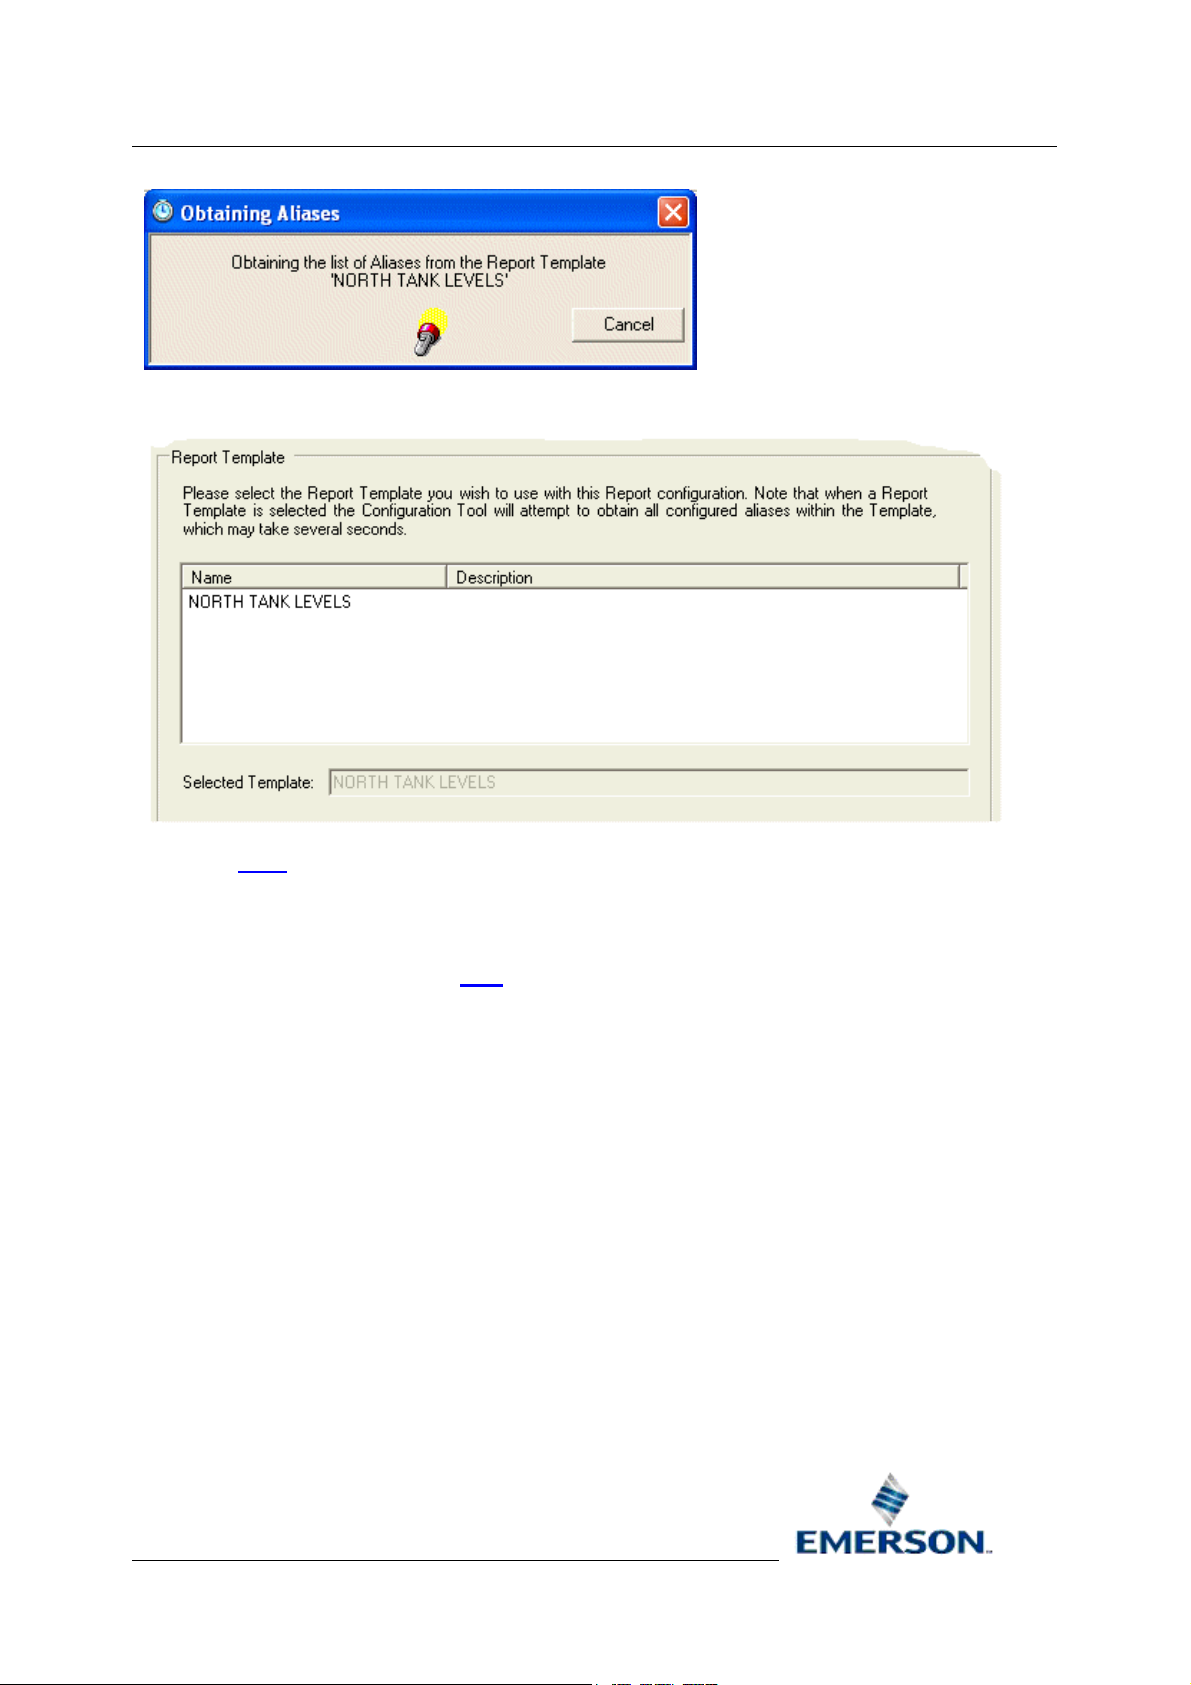
Now we need to select the Report Template from the list of Templates to associate it with our Report.
Of course there is only the one Template at the moment. When we select it we see this message...
Remote Automation Solutions
Website: www.EmersonProcess.com/Remote
Page 34
Reference Guide
D5092
11-Dec-2007 - Page 34
Then the Report Template is added to the non-editable field Selected Template.
Reporting Overview
Select the Next
button to go to the next page of the wizard.
2.4.2 Alias Values Page
The Alias Values page enables us to create, define and delete Aliases. We are going to leave the
Aliases as they are, so we click the Next
button.
Remote Automation Solutions
Website: www.EmersonProcess.com/Remote
Page 35

Reference Guide
D5092
11-Dec-2007 - Page 35
Reporting Overview
2.4.3 Publishing Page
The Publishing page enables us to define where we want reports to be published initially, before we
apply formatting to them and distribute them to Recipients. We will keep all our reports in the Report
folder on the D: drive, so we type this path into the default Directory field.
We are not going to purge (delete) reports automatically from this directory as soon as they have
been successfully distributed, so we do not check the Purge Reports box. We leave the default
option to remove the Report Plug-in from the published report. When you have finished the page,
select the Next
button to go to the next page of the wizard.
Remote Automation Solutions
Website: www.EmersonProcess.com/Remote
Page 36

Reference Guide
D5092
11-Dec-2007 - Page 36
Reporting Overview
2.4.4 Formats Page
This page enables us to associate a Report Format with our report. Since we have no configured
Report Formats at the moment, we will move on to the next page by selecting the Next
button.
Remote Automation Solutions
Website: www.EmersonProcess.com/Remote
Page 37

Reference Guide
D5092
11-Dec-2007 - Page 37
Reporting Overview
2.4.5 Schedules Page
This page enables us to associate a Report Schedule with our report. Since we have no configured
Report Schedules at the moment, we will move on to the next page by selecting the Next
button.
Remote Automation Solutions
Website: www.EmersonProcess.com/Remote
Page 38

Reference Guide
D5092
11-Dec-2007 - Page 38
Reporting Overview
2.4.6 Credentials Page
The Credentials page enables us to specify a particular user to be associated with the running of
Reports. For our purposes, we shall accept the default setting. When you have finished the page,
select the Next
button to go to the final page of the wizard.
Remote Automation Solutions
Website: www.EmersonProcess.com/Remote
Page 39

Reference Guide
D5092
11-Dec-2007 - Page 39
Reporting Overview
2.4.7 Alarm Conditions Page
The Alarm Conditions page enables us to define alarm conditions for our report. We will accept the
defaults on this page. Then we click the Finish button to complete the configuration of the report
itself. However, if we were to leave the report as it is it would never be run because it has no
associated Schedule. So now we need to create a Schedule
which we can associate with the report.
Remote Automation Solutions
Website: www.EmersonProcess.com/Remote
Page 40

Reference Guide
D5092
11-Dec-2007 - Page 40
Reporting Overview
2.4.8 Creating a Schedule
Creating a Report Schedule is like creating a report, in that we can begin in two ways. Firstly, by right
clicking on the main Report Schedule object in the Report Configuration tools left pane, and selecting
the New Report Schedule context menu:-
Or we can select the Edit menu, and choose the same option from the list.
Remote Automation Solutions
Website: www.EmersonProcess.com/Remote
Page 41

Reference Guide
D5092
11-Dec-2007 - Page 41
Then the first page of the Schedule creation wizard will appear.
2.4.8.1 Schedule Wizard General Page
The name of the Schedule will be HOURLY, because it will be configured to run every hour. Note we
have selected the Timed option from the Schedule Type section. This creates a timed schedule
which can be associated with any report. We can move to the next page by selecting the Next>
button.
Reporting Overview
Remote Automation Solutions
Website: www.EmersonProcess.com/Remote
Page 42

Reference Guide
D5092
11-Dec-2007 - Page 42
2.4.8.2 Schedule Type Properties
This page enables us to define the properties for the particular Schedule type we have chosen. We
have changed the default time unit from 1 day to 1 hour. We have not introduced any offset, so the
Schedule will run every hour on the hour. We have left the Time Base settings at the default Local
DST adjusted time. We can now select the Next>
button to go to the next page.
Reporting Overview
2.4.8.3 Schedule Associated Reports
This page allows us to select the report object that will be triggered by this Schedule. From here we
can associate this Schedule with multiple report objects. Here we have selected the report we have
just created from the Available Reports list, and have moved it to the Selected Reports list. We can
now select the Next>
button to move to the next page.
Remote Automation Solutions
Website: www.EmersonProcess.com/Remote
Page 43

Reference Guide
D5092
11-Dec-2007 - Page 43
Reporting Overview
2.4.8.4 Alarm Conditions
From this page we could define an alarm condition that would be generated if the Schedule failed.
This would be generated as well as the alarm condition we created for the actual report itself. We
have decided not to generate an alarm condition, so we have left the default settings as shown in the
image below. Then we click the Finish
configuration process.
button to close the wizard and complete the Schedule
Remote Automation Solutions
Website: www.EmersonProcess.com/Remote
Page 44

Reference Guide
D5092
11-Dec-2007 - Page 44
Reporting Overview
We have now created an actual OpenEnterprise report that will run every hour and be deposited in
the D:\Reports directory. It will be an Excel file, which will be created with the same name as the
report, with the date added at the end in the form YYYYMMDD (e.g. '20060506' = 6th MAY 2006). If
the report is run more than once a day, a serial number will be added to the end after the date. Note
that the serial numbers begin with a zero, so a file named 'NORTH TANK LEVELS200060506_3.xls'
would indicate that it was the fourth report for the day.
If we wanted to publish the report in any other format (e.g. as a PDF file), we would now have to
create a Report Format object, and associate it with our report. Furthermore, if we wanted to deliver
our report to users in another location on our LAN or WAN, we would need to create a File Copy type
Recipient, that copies the Report to the required shared directory on our network.
However, since our report is only a simple one we do not need to do this here. We shall create a
Format and Recipient for our next example, which demonstrates more advanced techniques of report
configuration and formatting.
Remote Automation Solutions
Website: www.EmersonProcess.com/Remote
Page 45

Reference Guide
D5092
11-Dec-2007 - Page 45
Reporting Overview
3 Advanced Reporting Techniques
Many reporting requirements are a lot more complex than the simple report example. What if, for
instance, you wanted to set the results for two separate database queries side by side on the page?
What if we wanted to display the monthly average tank level for the current month right beside the
corresponding value for last month on the same report?
The extra skills and knowledge required for us to do this are:-
• Creation of multiple queries on different named sheets
• More Excel page formatting skills
• Knowledge of the Plug-in's own cell functions and named arrays
• Use of Excel array formulas to manipulate the named arrays
• Knowledge of how to create a PDF Report Format
Now we can actually look at the Report that will be created using these extra skills.
3.1 Advanced Report Example
This report has been published in PDF format. Last month's average value has been placed right
alongside this month's value for comparison.
You could not do this using the basic simple query technique, because the results of the two queries
would overwrite each other. How do we do it?
What we need is to create the two queries on separate pages (separate worksheets) and then import
the results of these queries onto the actual report output page.
We can do this by combining the Report Plug-in's Excel Name functionality together with Excel's
Array Functions. Also, we need to associate a Report Format of the PDF type with the report. Let’s
break this into the following four main tasks.
1. Create the Report Template.
Remote Automation Solutions
Website: www.EmersonProcess.com/Remote
Page 46

Reference Guide
D5092
11-Dec-2007 - Page 46
2. Create a Schedule for the report.
3. Create a PDF Format for the report.
4. Create the Report with its associated Template, Schedule and Format.
Reporting Overview
3.2 The Report Template
These are the steps required to create the Advanced Report Template:-
1. Create a new Report Template.
2. Configure the first Query
3. Configure the second Query
4. Prepare layout on the output sheet
5. Automatic Data Array naming
6. Using Array Functions
3.2.1 Advanced - Create the Report Template
This is the list of tasks required to create the Intermediate Report Template.
1. Open the Report Configuration Tool. Please review the Open the Report Configuration
Tool page.
2. Create the Intermediate Report Template. Please review the Create a new Report
Template page.
3. Configure the General Template Page. Please review the General Template Configuration
Page. This time, make the name of the Template 'MONTHLY TANK LEVELS'.
4. Set the Report Properties. Review the Report Properties Data Service
correct dataservice. Accept the defaults for the Report Period and Event Logging
When the Report Template is created, we can begin configuring the first query for the report.
page, entering the
pages.
3.2.2 Advanced - Configure First Query
These are the tasks required to configure the first query of the Advanced Report. You will be
encouraged to review how we created the Simple Report's Query, but please follow the additional
instructions on this page that are required for creating this new Query. With the new Report Template
open, do the following...
1. Start the Query wizard. Review the Create a Query
the Query wizard.
page, and choose any method to begin
2. Give the Query a name. On the Query Name Page
a new name - "Last Month" without the quotes.
3. Accept the Report Data Service. On the Query Dataservice Page
that you configured for the Report (assuming that you configured the correct Data Service
there).
, delete the default Query name and type
Remote Automation Solutions
Website: www.EmersonProcess.com/Remote
, accept the Data Service
Page 47

Reference Guide
D5092
11-Dec-2007 - Page 47
Reporting Overview
4. Select the correct Data Set. Select the correct data set from the Query Dataset Page
this example query, that will be a compressed data set that is sampled on a daily basis. The
compressed data set must be applying an average value to the raw data. The actual data set
is shown in the image below.
5. Select the signals. For this particular query, we are using the same signals that we used for
the Simple Report. As long as the signals we choose belong to a compressed data set that
averages raw values, that will be alright. Review the Query Signals Page
Dialog to see how we filter the signals of interest from the data set.
6. Define the Query Period. We shall have to override the default Report Period, which was
accepted as Today, and instead select Last Month from the drop-down list. Review the
Query Period Page
, if necessary.
and Signal Browse
. For
7. Select the Average Value. Select the Average value from the Transform page
8. Send the query results to a Temporary Worksheet. Instead of sending the Query results to
the default 'Sheet1!A1' as we did for the Simple Query, we now need to define a Temporary
worksheet with the name "LastMonth_data". Review the Output page
necessary.
for the Simple Report if
.
Remote Automation Solutions
Website: www.EmersonProcess.com/Remote
Page 48

Reference Guide
D5092
11-Dec-2007 - Page 48
When you run this query now, it will be placed on a new sheet that it creates for you, and the
sheet will be named "LastMonth_data".
Reporting Overview
We can now continue by configuring Query 2 for the Advanced Report.
3.2.3 Advanced - Configure Second Query
The second query is almost identical to the first one. You can begin this second query by selecting
any cell on the first query page except the first cell, and selecting the New Query option from the
context menu
new temporary worksheet that will be created when this second query is run.
1. Start the Query wizard. Review the Create a Query
2. Query Name - This is configured on the Query Name Page
3. Accept the Report Data Service. On the Query Dataservice Page
4. Select the correct Data Set. Select the correct data set from the Query Dataset Page
. The second query will not overwrite the first one, because we are going to output it to a
page, and choose any method to begin
the Query wizard.
, and it should be set to
"ThisMonth" for this second query.
, accept the Data Service
that you configured for the Report (assuming that you configured the correct Data Service
there).
. For
this example query, that will be a compressed data set that is sampled on a daily basis. The
compressed data set must be applying an average value to the raw data. The actual data set
is shown in the image below.
Remote Automation Solutions
Website: www.EmersonProcess.com/Remote
Page 49

Reference Guide
D5092
11-Dec-2007 - Page 49
5. Select the signals. For this particular query, we are using the same signals that we used for
the Simple Report. As long as the signals we choose belong to a compressed data set that
averages raw values, that will be alright. Review the Query Signals Page
Dialog to see how we filter the signals of interest from the data set.
Reporting Overview
and Signal Browse
6. Define the Query Period - This is configured on the Query Period Page
"This Month" rather than "Last Month", as shown in this image.
7. Select the Average Value. Select the Average value from the Transform page
8. Query Output Location - configured on the Query Output Page
"ThisMonth_data" as shown below.
, this should be set to
, and should be set to
.
Now we need to prepare the actual output sheet so that the query results are displayed as we want
them to appear on the actual published report.
Remote Automation Solutions
Website: www.EmersonProcess.com/Remote
Page 50

Reference Guide
D5092
11-Dec-2007 - Page 50
Reporting Overview
3.2.4 Initial Preparation of Output Sheet
We will now attend to the initial formatting and placement details of the sheet on which we want to
place our actual report. These are the tasks required to do this.
1. Change the Output Sheet name
2. Enter the Report Title
3. Enter the From and To values
4. Column Headings
5. Report Borders
Now, before we actually set up the import of the data from the other sheets, we need to know about
the extra hidden work that the Report Plug-in does when it runs a query.
3.2.4.1 Change Sheet Name
We first need to change its name, so we right click on the tab and select the Rename option ...
Then we type in the new name, which is Monthly...
3.2.4.2 Report Title
The report title should appear at the top of the page, and be in a large bold font. First, select the first
cell of the output worksheet and type in the report title...
Make the font size 14 point, and make its style Bold...
Remote Automation Solutions
Website: www.EmersonProcess.com/Remote
Page 51

Reference Guide
D5092
11-Dec-2007 - Page 51
Finally, because the title overwrites cells B, C and D, we will merge cells A to D. Select them first,
then right click and select Format Cells... from the context menu. Select the Alignment tab from the
Format Cells dialog, and then check the Merge Cells box as highlighted in the example below.
Reporting Overview
3.2.4.3 From and To Values - Inserting Functions
In our report, we have shown the From and To values for the Report data at the top of the page. To
do this we are using a cell formula provided by the Report Plug-in. It is the OEQueryVariable
function. It retrieves any alias value from a named query used in the report.
The parameters for the OEQueryVariable function are OEQueryVariable(QueryName as string,
VariableName as string). Therefore, we need to provide the query name and the alias name as
strings.
3.2.4.4 Add the Labels
First add the labels for the From and To values, making them bold and right aligned...
Remote Automation Solutions
Website: www.EmersonProcess.com/Remote
Page 52

Reference Guide
D5092
11-Dec-2007 - Page 52
3.2.4.5 Add the Function
Now select the cell immediately to the right of the From: label and right click on the mouse to reveal
the context menu. Select the OpenEnterprise>Insert Function... option, shown in the example
below:-
Reporting Overview
From the Insert Function dialog, select the OEQueryVariable function, then select 'Last Month'
from the queryID drop-down list and 'STARTTIME' from the name drop-down list. These options are
shown selected in the example below:-
Remote Automation Solutions
Website: www.EmersonProcess.com/Remote
Page 53

Reference Guide
D5092
11-Dec-2007 - Page 53
Now click the OK button to insert the function into the selected cell. Help on the actual selected
function can be obtained by selecting the 'Help on this function' link underneath the function list on
the dialog. Help on all the features of the dialog can be obtained by clicking the Help button on the
dialog.
Reporting Overview
The formula bar at the top of the sheet should now have the following function entered:-
Notice the query name is "Last Month", and the alias we want the value for is "STARTTIME". The
Report Plug-in looks for the value in the query named "Last Month". Then it finds the resolved value of
the "STARTTIME" alias for that query.
Now select the cell immediately to the right of the To: label and enter the function for the end time of
the report like this...
3.2.4.6 Column Headings
We are going to use the first column for timestamps, then for each signal, we need to have a column
for the average value of the Tank level for this month and beside it a column for the average value for
last month.
Remote Automation Solutions
Website: www.EmersonProcess.com/Remote
Page 54

Reference Guide
D5092
11-Dec-2007 - Page 54
Just under the From and To values for the report, we enter the names of the Tanks, followed by the
units, followed by the This Week and Next Week headings. We have merged the Tank name and
Units fields over two cells, and made them bold and centred. We made the This Month and Last
Month headings 8 point and italicized.
Now we can add borders to the output page.
3.2.4.7 Report Borders
Reporting Overview
Here is a simple technique for adding borders to the final report using Excel 2003. First, select the
area that you want to add borders to...
Remote Automation Solutions
Website: www.EmersonProcess.com/Remote
Page 55

Reference Guide
D5092
11-Dec-2007 - Page 55
Reporting Overview
Then, while it is still selected go to the Borders icon on the Toolbar. If the Borders icon is not available
enable it by selecting the View>Toolbars>Formatting menu item. Now select the All Borders option
shown below...
Remote Automation Solutions
Website: www.EmersonProcess.com/Remote
Page 56

Reference Guide
D5092
11-Dec-2007 - Page 56
Finally, select the Thick Box Border option, shown in the example below...
This will cause all the cells in the selected area to have a border, but the outer lines of the selected
cells will have a thicker border as shown in this example...
Reporting Overview
Now we can use Array Formulas to import the data from the two queries into this output sheet.
3.2.5 Automatic Data Array Naming
When the Report Plugin returns data from a query to a worksheet, it automatically names that column
of data from the first to the last value as a data array. The basic naming convention it uses is
<SheetName>.<ObjectName>.<ColumnName> for a signal array, or <Sheetname>.<ColumnName>
for the timestamp array.
This named array of values can then be used in an Excel array formula to apply a formula to each of
the values in the named array. Formulas can be applied to this array from other worksheets in the
workbook.
Remote Automation Solutions
Website: www.EmersonProcess.com/Remote
Page 57

Reference Guide
D5092
11-Dec-2007 - Page 57
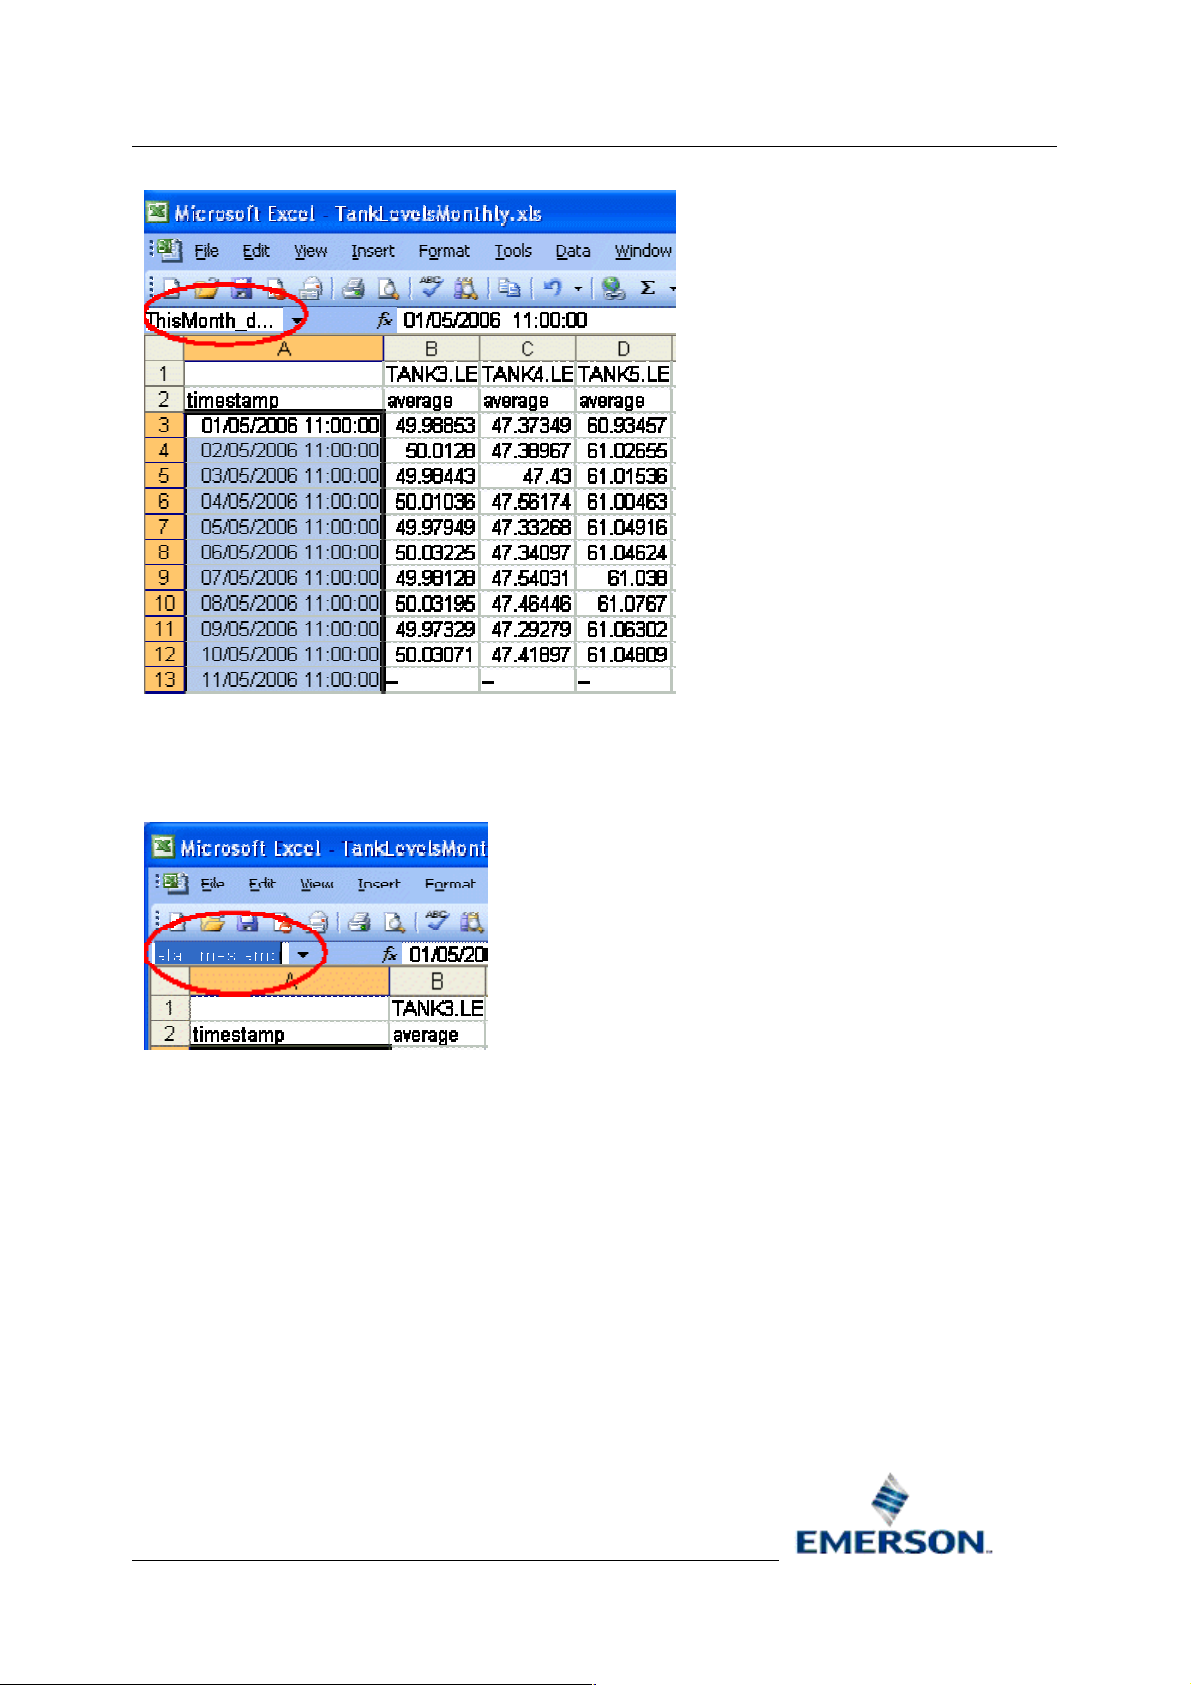
3.2.5.1 Example Named Array
The image below is taken from the page which contains the query data for Last Months Tank levels.
This first image shows what happens when a group of cells is selected that belongs to a named Data
Array, but does not include all of the members of that named array. As you can see, the selected cell
becomes the first cell, and its name is entered into the cell name field in the box outlined in red on the
image below...
Reporting Overview
However, when the same group of cells is extended to include the whole of the data array, you can
now see that instead of a single cell name in the highlighted field, there is the Data Array Name that
was given to the column of data by the Report Plug-in...
We can't read the full name here, so we have to open the Define Name dialog using the
Insert>Name>Define item from the Excel menu bar.
Remote Automation Solutions
Website: www.EmersonProcess.com/Remote
Page 58

Reference Guide
D5092
11-Dec-2007 - Page 58
The Array Group's full name is LastMonth_data.NORTH_TANK3_LEVEL..average. We can see by
looking at the Refers to: field that this name refers to cells B3 to B32 collectively. So now we can see
that the Report Plug-in has named all returned columns from our queries so that we can refer to these
values from any sheet in the Excel workbook by using this name. Now we can show how these arrays
can be used to combine the results from different queries into another single worksheet using an
Array Formula.
Reporting Overview
3.2.6 Using Array Formulas
Now that we know about the named Arrays of the Report Plug-in, we can utilize Excel's Array
Functionality to bring those values across from another worksheet. There are three main steps to do
this...
1. Get the Data Array name
2. Select the target Cell array
3. Build the Array Function
3.2.6.1 Get the Data Array Name
The Data Array name can get quite long, so it is better to copy it to the clipboard before trying to use it
to create the Array Function on the target sheet. These are the steps to accomplish this task...
3.2.6.1.1 Select the Data Array
Click on the ThisMonth worksheet and select the timestamp value column from the first value to the
last value. You can tell you have the whole array, by looking at the cell name field, outlined in the
image below. When you see the array name appear here, stop extending the selection.
Remote Automation Solutions
Website: www.EmersonProcess.com/Remote
Page 59
Reference Guide
D5092
11-Dec-2007 - Page 59
Reporting Overview
3.2.6.1.2 Copy the Data Array Name
Now click in the field where the array name appears. The array name should now be highlighted in
blue...
Select the Ctrl and C keys on the keyboard simultaneously to copy the name to the clipboard.
3.2.6.2 Select the Target Cell Array
Back on the target sheet, firstly click on the cell where you will begin the import of data:-
Remote Automation Solutions
Website: www.EmersonProcess.com/Remote
Page 60

Reference Guide
D5092
11-Dec-2007 - Page 60
Now, holding down the [Shift] key on the keyboard, drag the mouse down to cell 40 (to cover the 31
days needed for a month), and leave the cells selected.
Reporting Overview
3.2.6.3 Build the Array Function
Then go back to the cell value field, and type in the equals sign. Then select the Ctrl and V keys on
the keyboard together to paste the data array name containing the Timestamp values from the
ThisMonth sheet.
Now, this next instruction is important - to enter the Array Formula correctly, you must select the Ctrl,
Shift and Enter keys together. Then Excel will add two curly brackets at either end of the formula,
and you will know that the formula has been entered correctly...
Remote Automation Solutions
Website: www.EmersonProcess.com/Remote
Page 61

Reference Guide
D5092
11-Dec-2007 - Page 61
Now do the same thing for each of the Tank average value arrays...
3.2.6.3.1 Get the Source Data Array Name
Go to the correct sheet for the source Data Array name and select all the values for the first signal.
Here we are getting this months average for TANK3. When you have all the values, the Data Array
will appear in the cell name field. Select it and then copy it to the Windows clipboard by pressing Ctrl
and C together on the keyboard.
Reporting Overview
Remote Automation Solutions
Website: www.EmersonProcess.com/Remote
Page 62

Reference Guide
D5092
11-Dec-2007 - Page 62
3.2.6.3.2 Select Target Cell Range
Then open the target sheet, and select the same number of cells in the place where you want the
source values to appear...
Reporting Overview
3.2.6.3.3 Build the Array Function
Type the equals sign into the cell value field at the top of the worksheet, and then press the Ctrl and
V keys on the keyboard together to paste the copied array name to the cell value field...
Remote Automation Solutions
Website: www.EmersonProcess.com/Remote
Page 63

Reference Guide
D5092
11-Dec-2007 - Page 63
Finally, press the Ctrl, Shift and Enter keys together on the keyboard to enter the Array Formula into
the selected target range.
Reporting Overview
3.3 The Report Schedule
This is how to create a Report Schedule using the Report Configuration tool.
1. Open the Report Configuration tool
2. Create a new Schedule
3. Configure Schedule Time
4. Associate with a Report
5. Schedule Alarm Conditions
3.3.1 Open the Report Configuration Tool
The Report Configuration Tool resides in the OpenEnterprise Toolbox. To access the Toolbox, select
the Windows Start button and select Start>Programs>OpenEnterprise>Toolbox. Then select the
Report Configuration Tool, which is circled in the image below.
When you have created the initial Report Template return to the Report Properties Data Service
within this documentation.
page
3.3.2 Create a new Schedule
Select the Schedule icon and right click on the mouse. Then select the New Report Schedule option
from the context menu as shown below. This will open the General Schedule Configuration page.
Remote Automation Solutions
Website: www.EmersonProcess.com/Remote
Page 64

Reference Guide
D5092
11-Dec-2007 - Page 64
Alternatively, you could click the Edit menu and select the New Schedule option...
Reporting Overview
3.3.3 Schedule Configuration General Settings
Firstly, we give the new Schedule a name and an informative description. Then we select the desired
type of Schedule from the three options before selecting the Next
Demand, Timed or Change of Value. We need a Timed Schedule.
button. The three options are On
Remote Automation Solutions
Website: www.EmersonProcess.com/Remote
Page 65

Reference Guide
D5092
11-Dec-2007 - Page 65
Reporting Overview
3.3.4 Timed Schedule Settings
We need to run the report, say every day at 6PM, so we select 1 Day as the time period and enter
18:00 in the At field. We will leave the Time Base at Local DST Adjusted. Move on by selecting the
Next
button.
Remote Automation Solutions
Website: www.EmersonProcess.com/Remote
Page 66

Reference Guide
D5092
11-Dec-2007 - Page 66
Reporting Overview
3.3.5 Associated Reports
We use this page to associate the Schedule with a Report. As we have not yet created our Report
object, we cannot do this, so we will just select the Next
button.
Remote Automation Solutions
Website: www.EmersonProcess.com/Remote
Page 67

Reference Guide
D5092
11-Dec-2007 - Page 67
Reporting Overview
3.3.6 Alarm Conditions
From this page we could define an alarm condition that would be generated if the Schedule failed.
This would be generated as well as the alarm condition we created for the actual report itself. We
have decided not to generate an alarm condition, so we have left the default settings as shown in the
image below. Then we click the Finish
configuration process.
button to close the wizard and complete the Schedule
Remote Automation Solutions
Website: www.EmersonProcess.com/Remote
Page 68

Reference Guide
D5092
11-Dec-2007 - Page 68
Reporting Overview
We have now created an actual OpenEnterprise report that will run every hour and be deposited in
the D:\Reports directory. It will be an Excel file, which will be created with the same name as the
report, with the date added at the end in the form YYYYMMDD (e.g. '20060506' = 6th MAY 2006). If
the report is run more than once a day, a serial number will be added to the end after the date. Note
that the serial numbers begin with a zero, so a file named 'NORTH TANK LEVELS200060506_3.xls'
would indicate that it was the fourth report for the day.
If we wanted to publish the report in any other format (e.g. as a PDF file), we would now have to
create a Report Format object, and associate it with our report. Furthermore, if we wanted to deliver
our report to users in another location on our LAN or WAN, we would need to create a File Copy type
Recipient, that copies the Report to the required shared directory on our network.
However, since our report is only a simple one we do not need to do this here. We shall create a
Format and Recipient for our next example, which demonstrates more advanced techniques of report
configuration and formatting.
3.4 The Report Format
We now need to create a new Report Format object that will convert our Report to PDF format before
delivering it to any Recipients. This is done via a wizard and takes the following steps...
1. Open the Report Configuration Tool
2. Create a new Report Format
3. Format General page
Remote Automation Solutions
Website: www.EmersonProcess.com/Remote
Page 69

Reference Guide
D5092
11-Dec-2007 - Page 69
4. Purging Page
5. Recipient Associations page
6. Format Alarm Conditions
Reporting Overview
3.4.1 Open the Report Configuration Tool
The Report Configuration Tool resides in the OpenEnterprise Toolbox. To access the Toolbox, select
the Windows Start button and select Start>Programs>OpenEnterprise>Toolbox. Then select the
Report Configuration Tool, which is circled in the image below.
When you have created the initial Report Template return to the Report Properties Data Service
within this documentation.
page
3.4.2 Create a new Format
Select the Schedule icon and right click on the mouse. Then select the New Report Format option
from the context menu as shown below. This will open the General Format Configuration page.
Alternatively, click the Edit menu and select the New Format option.
Remote Automation Solutions
Website: www.EmersonProcess.com/Remote
Page 70

Reference Guide
D5092
11-Dec-2007 - Page 70
Reporting Overview
3.4.3 Format General Settings
On the Format General page, firstly type in the name of the Format, giving it an optional description
for easier understanding of what it can be used for.
Select the format type from the Type: drop-down list. Type in the destination - where you want
Reports having this Format to be created prior to any final distribution to Recipients.
Type the file name into the File Name: field, adding a space at the end, then select an appropriate
Date/Time format to add to the end of the name from the drop-down list off the <<Formats button.
Leave the Ensure Unique File Name box checked if there is any chance that the Report filename
may be duplicated. Then click the Next
button.
Remote Automation Solutions
Website: www.EmersonProcess.com/Remote
Page 71

Reference Guide
D5092
11-Dec-2007 - Page 71
Reporting Overview
3.4.4 Format Purging
We have chosen to delete any Reports created with this format after 7 days. Note this does not purge
Reports published in any other format.
3.4.5 Recipient Associations
Any Recipients that we wish to associate with a published Report Format can be chosen here. Since
we have not yet created any Recipients we can leave this page by selecting the Next button.
Remote Automation Solutions
Website: www.EmersonProcess.com/Remote
Page 72

Reference Guide
D5092
11-Dec-2007 - Page 72
Reporting Overview
3.4.6 Alarm Conditions
We can create alarm conditions for this Format here, generated on the success and/or failure of the
Format creation. We are not going to configure a Format alarm, so click the Next button.
Remote Automation Solutions
Website: www.EmersonProcess.com/Remote
Page 73

Reference Guide
D5092
11-Dec-2007 - Page 73
Reporting Overview
3.5 The Report
We now need to create a new Report object that will be associated with our Report Template, Report
Schedule and Report Format. This is done via a wizard and takes the following steps...
1. Open the Report Configuration Tool
2. Create a new Report
3. Report General page
4. Report Alias Values
5. Report Publishing Page
6. Report Formats
7. Report Schedules
8. Report Credentials
9. Report Alarm Conditions
Remote Automation Solutions
Website: www.EmersonProcess.com/Remote
Page 74

Reference Guide
D5092
11-Dec-2007 - Page 74
Reporting Overview
3.5.1 Open the Report Configuration Tool
The Report Configuration Tool resides in the OpenEnterprise Toolbox. To access the Toolbox, select
the Windows Start button and select Start>Programs>OpenEnterprise>Toolbox. Then select the
Report Configuration Tool, which is circled in the image below.
When you have created the initial Report Template return to the Report Properties Data Service
within this documentation.
page
3.5.2 Create a new Report
Select the Configured Reports icon and right click on the mouse. Then select the New Report
option from the context menu as shown below. This will open the General Report Configuration
page.
Alternatively, you could click the Edit menu and select the New Report option.
Remote Automation Solutions
Website: www.EmersonProcess.com/Remote
Page 75

Reference Guide
D5092
11-Dec-2007 - Page 75
Reporting Overview
3.5.3 Report General Page
Type the name of the Report and a more user friendly Description of what the Report does. Then
select the correct Template for the Report from the list of available Templates. When this is done,
click the Next
button.
3.5.4 Report Alias Values
Leave the settings on this page as they are and click the Next button.
Remote Automation Solutions
Website: www.EmersonProcess.com/Remote
Page 76

Reference Guide
D5092
11-Dec-2007 - Page 76
Reporting Overview
3.5.5 Report Publishing
This page enables us to define a directory to which all Published Reports are created. Settings on this
page are overridden by settings that are configured for an associated Format. If no settings are
defined here, an Excel Report with the Plug-in removed will still be created in the working directory of
the Report Scheduler when the Report is run, even though no Formats are associated with this
Report.
We will not define any Publishing settings here, so click the Next
button.
Remote Automation Solutions
Website: www.EmersonProcess.com/Remote
Page 77

Reference Guide
D5092
11-Dec-2007 - Page 77
Reporting Overview
3.5.6 Report Formats
Select the available PDF Format and transfer it to the Selected Formats list using the > button. Then
click the Next
button.
Remote Automation Solutions
Website: www.EmersonProcess.com/Remote
Page 78

Reference Guide
D5092
11-Dec-2007 - Page 78
Reporting Overview
3.5.7 Report Schedules
Select the available DAILY Schedule and transfer it to the Selected Schedules list by using the >
button. Then click the Next
button.
Remote Automation Solutions
Website: www.EmersonProcess.com/Remote
Page 79

Reference Guide
D5092
11-Dec-2007 - Page 79
Reporting Overview
3.5.8 Report Credentials
We are going to use the credentials of the local OpenEnterprise Server administrative user to
generate and publish the Report, so click the Next
button.
Remote Automation Solutions
Website: www.EmersonProcess.com/Remote
Page 80

Reference Guide
D5092
11-Dec-2007 - Page 80
Reporting Overview
3.5.9 Report Alarm Conditions
We want to raise an alarm if the generated Report encounters any errors Check the Generate Alarm
if any Error occurs box. Accept the range of errors and the alarm priority that are provided. Click the
Finish button. The Advanced Report
is now configured.
Remote Automation Solutions
Website: www.EmersonProcess.com/Remote
Page 81

Reference Guide
D5092
11-Dec-2007 - Page 81
Reporting Overview
Remote Automation Solutions
Website: www.EmersonProcess.com/Remote
Page 82

Reference Guide
D5092
11-Dec-2007 - Page 82
Reporting Overview
4 Real World Example Report
This is a real world example of a Report that could be created using the Report Plugin. It is a Report
that is required for the Water industry in the USA. It provides daily Turbidity readings of treated water
for the previous month. Turbidity is a measure of debris in the water.
Below is an example of a standard Turbidity Report. Any similarity to real place names is not
intentional.
4.1 Raw Water Pumpage
The volume of raw water in millions of gallons (MGD) that is pumped into the treatment system each
day.
4.2 Treated Water Pumpage
The volume of treated water in millions of gallons (MGD) that is delivered to storage and distribution
each day.
Remote Automation Solutions
Website: www.EmersonProcess.com/Remote
Page 83

Reference Guide
D5092
11-Dec-2007 - Page 83
Reporting Overview
4.3 Raw Water Turbidity
The maximum value recorded each day for raw water turbidity.
4.4 Raw Water Alkalinity
Maximum daily raw water alkalinity reading.
4.5 Settled Water Turbidity
Maximum reading of settled water turbidity before filtration. A separate reading is taken for each
basin.
4.6 Finished Water Turbidity
Finished daily water turbidity reading after filtration. If there is one filter, a turbidity reading must be
taken at 4 hourly intervals, so that there are 6 readings per day. If there are two filters, a combined
filter effluent reading is taken at 15 minute intervals.
In OpenEnterprise we would go beyond this, taking a reading every minute. Then instead of having
six actual Turbidity readings in the Report, we would show the minimum, maximum and average
finished water turbidity values recorded for each day.
4.7 Monthly Pumpage Totals
Below the Raw and Treated pumpage values for the month there are cells which calculate the Total,
Minimum, Maximum and Average pumpage for the month.
4.8 Turbidity Historical Stream
In this example, the signals associated with Turbidity will be part of a single Historical stream, or
logging group. The Turbidity signals will be part of a stream that logs values at one minute intervals.
The raw values will be stored in a Raw Dataset. A compressed Dataset will be added that is fed from
this Dataset, and which provides Minimum, Maximum, Average and Total values on a daily basis for
each of the signals in the Dataset. The Compressed Dataset will contain daily compressed values for
one month for all the signals related to Turbidity.
The signals that require logging for this Report are:-
1. Raw Pumpage
2. Treated Pumpage
3. Raw Turbidity
4. Raw Alkalinity
5. Settled Turbidity
6. Finished Turbidity
We will use the Historian Configuration Tool to create this Historical stream.
Remote Automation Solutions
Website: www.EmersonProcess.com/Remote
Page 84

Reference Guide
D5092
11-Dec-2007 - Page 84
Reporting Overview
4.8.1 Raw Pumpage
The volume of raw water pumped into the treatment system each day. Signal name:
IP1:RAW.PUMP.FLOW.
4.8.2 Treated Pumpage
The volume of treated water delivered to storage and distribution each day. Signal name:
IP1:TREATED.PUMP.FLOW.
4.8.3 Raw Turbidity
The Turbidity of the raw water entering the system. If multiple samples are taken, this should be the
Maximum value recorded each day. Signal name: IP1:RAW.TURB.VAL.
4.8.4 Raw Alkalinity
The alkalinity of the raw water entering the system. Signal name: IP1:RAW.ALK.VAL.
4.8.5 Settled Turbidity
The turbidity of the raw water entering the system once it has settled. Again, this would be the
maximum reading recorded each day. There are two basins, so the two Signal names are:
IP1:SETTLED.TURB1.VAL and IP1:SETTLED.TURB2.VAL.
4.8.6 Finished Turbidity
The turbidity of the treated water after passing through the filtration system. Normally, a reading would
have to be provided every 4 hours during the day. However, with OpenEnterprise this could be taken
more frequently, and a Maximum, Minimum and Average value for each day can be provided. Signal
name: IP1:FILTER1.TURB..
4.8.7 Create the Stream
We will use the Historian Configuration Tool to create the Turbidity historical stream, which we will use
for the Report. Follow these steps:-
1. With the database running, go to the Start button and select the Toolbox application. On
Windows XP this would be Start>All Programs>OpenEnterprise>Toolbox.
2. Login, then double click on the Historian icon within the Toolbox window.
Remote Automation Solutions
Website: www.EmersonProcess.com/Remote
Page 85

Reference Guide
D5092
11-Dec-2007 - Page 85
3. To create a new Logging Stream click the Add button on the Historian Configuration Tool:-
Reporting Overview
4. Select the realanalog table as the source table from the list at the top of the 'Logging Group'
page of the wizard. Leave 'name' as the name column.
5. Enter a number for the Group ID that no other logging group has:-
Remote Automation Solutions
Website: www.EmersonProcess.com/Remote
Page 86

Reference Guide
D5092
11-Dec-2007 - Page 86
6. Enter the estimated number of signals that will be in the group. If in doubt enter slightly more
than you expect. Also remove the check from the 'Log All Objects' box.
Reporting Overview
Then click the [Next] button -
4.8.7.1 Select the Columns and Define the Compressed Values
Now we need to select the columns that we want to log historically, and check the compressed values
that we will want to log also.
1. Select the readvalue column from the 'Available Fields' list.
2. Then click the double arrow button -
3. The readvalue field will automatically be entered into the Analog part of the 'Fields to be
logged' section, with the 'Raw' compression rate selected.
.
4. We will need to also log Maximum, Minimum, Average and Total compression values for our
signals. Select each option so that it turns blue with a cross in the middle:-
Remote Automation Solutions
Website: www.EmersonProcess.com/Remote
Page 87

Reference Guide
D5092
11-Dec-2007 - Page 87
To select the 'Total' compression option, click the right scroll bar, highlighted above. The 'Total'
option is last in the list:-
The 'Total' compression rate adds all 'Raw' values for logged signals in the group over a given
period. This will be used to provide the final daily Raw and Treated water pumpage.
Reporting Overview
Now click the [Next] button -
4.8.7.2 Define the Raw Dataset
1. First, accept the default settings on the 'Logged Fields' page:-
Click the [Next] button on this page -
Now we come to the 'Define Datasets' page where we must define the actual 'Datasets' that
will belong to this 'Logging Group', or 'Historical Stream'. The 'Datasets' that we define
determine the size of the log files that the Historian creates to store the logged historical values
for the Stream.
.
2. Click the [Add] button on the 'Define Datasets' page -
3. Define the polling rate of the Raw Dataset by setting it to '1 minute' as shown:-
Remote Automation Solutions
Website: www.EmersonProcess.com/Remote
Page 88

Reference Guide
D5092
11-Dec-2007 - Page 88
Leave the 'Starting From:' box checked. You can change start time for the raw dataset, or leave
it as it is.
4. Set the 'Keep For At Least' period to '1 Day', and the 'Maximum Unsaved Data' period to '1
Hour'. These values are used to calculate the 'BufferSize' and 'BufferCount' values of the
Dataset.
Reporting Overview
5. Define the Log file directory by using the 'Browse' button:-
Click the [OK] button -
4.8.7.3 Define the Compressed Dataset
1. The Raw Dataset now appears in the window on the 'Define Datasets' page.
We now need to create the Compressed Dataset, which will hold the Maximum, Minimum,
Average and Total values. With the Raw Dataset selected, click the [Add] button again -
2. This time, the 'Fed From Dataset' field has '0s' in it. This shows us that the current Dataset
will be fed by values from the Raw Dataset, and the Historian will apply the selected
compression to these values.
3. Set the Polling Rate for the Compressed Dataset to '1 Day' as shown:-
Remote Automation Solutions
Website: www.EmersonProcess.com/Remote
Page 89

Reference Guide
D5092
11-Dec-2007 - Page 89
Leave the 'Starting From:' box checked. If you changed the start time for the raw dataset,
change the start time for the compressed dataset to match it.
4. Set the 'Keep For At Least' and 'Maximum Unsaved Data' fields to '2 Months' and '2 Hours'
respectively:-
This will allow us to store two month's worth of data in the Compressed Stream.
5. Define the Log Directory again:-
Reporting Overview
Then click the [OK] button -
At this point, we should configure archiving for the Logging Group, but to save time, we will
move on and just create the Logging Group. For more information on configuring archiving
behaviour, see the documentation for the Historian Configuration Tool
4.8.7.4 Select the Signals
1. Accept the defaults on the 'View Names' page:-
Click the 'Next' button -
2. On the 'Select Objects' page, use the 'name' filter to create a filter for the signals list, then
click the 'Refresh' button:-
.
Remote Automation Solutions
Website: www.EmersonProcess.com/Remote
Page 90

Reference Guide
D5092
11-Dec-2007 - Page 90
Reporting Overview
3. When you have finished, you should have all the signals for the Group selected in the right
pane:-
Click the [Next] button, then the [Finished] button on the 'Summary Page'.
4.9 Turbidity Report Template
To configure an OpenEnterprise Report, you must use the Report Configuration Tool to create a
Report Template.
Remote Automation Solutions
Website: www.EmersonProcess.com/Remote
Page 91

Reference Guide
D5092
11-Dec-2007 - Page 91
1. With the database running, go to the Start button and select the Toolbox application. On
Windows XP this would be Start>All Programs>OpenEnterprise>Toolbox.
2. Login, then double click on the Reporting icon within the Toolbox window.
Reporting Overview
3. Right click on the 'Templates' icon, then select the 'New Report Template' context menu
option.
4. Type the name of the Report Template then click the [Create] button:-
Remote Automation Solutions
Website: www.EmersonProcess.com/Remote
Page 92

Reference Guide
D5092
11-Dec-2007 - Page 92
Reporting Overview
The Report Properties wizard opens. Accept the defaults by clicking the [Next] button on all 3
pages.
5. Excel will then be available with the Report Plugin added. We can continue configuring the
Report by configuring the Query for the Report.
4.9.1 Change the First Sheet Name
1. Before configuring the Report Query, it may be a good idea to change the name of the first
worksheet, since we will be using this sheet to output the results of the Turbidity Query. First,
from the Excel menu bar, select Format>Sheet>Rename.
Remote Automation Solutions
Website: www.EmersonProcess.com/Remote
Page 93

Reference Guide
D5092
11-Dec-2007 - Page 93
2. Type in the new name of the sheet.
Reporting Overview
4.9.2 Configure the Turbidity Query
1. We are going to use the first Sheet of the Report for the actual displayed output of the report,
so click on Sheet2, and ensure the first cell in the sheet is selected. Then from the Excel
menu bar select OpenEnterprise>Import Signal History>New Query...
2. This opens the New Query wizard.
4.9.3 Turbidity Name, Dataservice and Dataset
1. Firstly, type in the name of the Query that will define the Turbidity Report:-
Avoid spaces in the name. Click the [Next] button to go to the 'Dataservice' page.
2. Accept the default Database and click the [Next] button on the 'Dataservice' page.
3. On the 'Dataset' page, open the Turbidity Stream, and select the Daily Dataset. Then click the
[Select] button. The selected dataset should be in the 'Currently selected data set' field. Now
click the [Next] button to go to the 'Objects' page.
Remote Automation Solutions
Website: www.EmersonProcess.com/Remote
Page 94

Reference Guide
D5092
11-Dec-2007 - Page 94
4.9.4 Turbidity Objects
Reporting Overview
1. On the 'Signal Selector' page, since we require all the signals which are in the Dataset to
create the Report Template, leave the 'All signals' option selected.
2. Click the [Next] button.
4.9.5 Turbidity Query Period
1. Check the 'Override default report period' box, then select the LastMonth period from the
Calendar Period drop-down list.
Remote Automation Solutions
Website: www.EmersonProcess.com/Remote
Page 95

Reference Guide
D5092
11-Dec-2007 - Page 95
Reporting Overview
2. Then click the [Next] button.
4.9.6 Turbidity Data Transform
1. Select the Minimum, Maximum, Average and Total values from the 'Available Columns' list
and add them to the 'Display Columns' list.
Remote Automation Solutions
Website: www.EmersonProcess.com/Remote
Page 96

Reference Guide
D5092
11-Dec-2007 - Page 96
Reporting Overview
2. Click the [Next] button.
4.9.7 Turbidity Query Output
1. We need to change the Query output sheet to be a temporary worksheet. Temporary
worksheets do not appear in the actual Report when it is published by the Report Scheduler.
We do not want the raw data to be shown in the Report. Select the 'Temporary worksheet'
radio button and type a name for the temporary sheet as shown below.
2. To finish configuring the query, click the [Finish] button on the 'Output' page. We can now
begin preparing the Turbidity Report Sheet. This is the first sheet, which we re-named
'Monthly Turbidity Report'.
4.9.8 Prepare the Turbidity Output Sheet
Here are some of the Excel procedures required to create and modify the main Report page.
1. Merge Cells and Center the Report Title
Remote Automation Solutions
Website: www.EmersonProcess.com/Remote
Page 97

Reference Guide
D5092
11-Dec-2007 - Page 97
2. Change the Month and Year Options
3. Create Block Borders
4. Modify the Finished Turbidity Section
4.9.8.1 The Turbidity Report Title
1. The Report Title is centered along a number of merged cells. To do this, first select all of the
Cells across the top of the Report. Then right click and select the 'Format Cells' option, shown
below.
Reporting Overview
2. Now, on the 'Alignment' tab, set the Horizontal and vertical alignment to Center, and check
the 'Merge Cells' box. Then click the [OK] button.
Remote Automation Solutions
Website: www.EmersonProcess.com/Remote
Page 98

Reference Guide
D5092
11-Dec-2007 - Page 98
Reporting Overview
3. Type the Report title into the merged fields:-
4. Then select the font size and type:-
4.9.8.2 Automating the Month and Year
1. In most Reports of this type, the Month and Year are contained in selectable Excel lists. The
Month and Year must be selected manually from the Lists:-
Remote Automation Solutions
Website: www.EmersonProcess.com/Remote
Page 99

Reference Guide
D5092
11-Dec-2007 - Page 99
2. With our OpenEnterprise Report we could eliminate this necessity, by having the Report's
month and year entered automatically using the Report Plugin's 'Insert Function' context
menu. Here's how to do it.
3. Remove the lists by selecting each list. Then from the Excel menu bar select the
Data>Validation option.
Reporting Overview
4. To remove the list, select the Settings tab and then select 'Any Value' from the 'Allow' dropdown list.
Remote Automation Solutions
Website: www.EmersonProcess.com/Remote
Page 100

Reference Guide
D5092
11-Dec-2007 - Page 100
5. Now to add the OpenEnterprise Functions which contain the Date information for the used
Query, select the target cells where the lists were, right click and select the
OpenEnterprise>Insert Function option.
Reporting Overview
6. Select the 'OEQueryVariable' function, then select the queryID - in this case 'Last_Month',
then the variable name - 'STARTTIME', or 'ENDTIME'.
7. Change the format for the Month value field to display the text for the month of the Query.
Right click on the cell and select the 'Format Cells' option from the context menu. Then create
a 'Custom' Category that just displays the text of the month:-
Remote Automation Solutions
Website: www.EmersonProcess.com/Remote
 Loading...