


Pantone 534 Blue
Pantone 123 Yellow
Pantone 485 Red
Pantone 123 Yellow
Pantone 534 Blue
Black
Model
C-322
Datalogging
Sound Level Meter
Instruction
Manual
Tripod sold separately (Model BS-6)
www
reedinstruments
www.GlobalTestSupply. com
com

Pantone 534 Blue
Pantone 123 Yellow
Pantone 485 Red
Pantone 123 Yellow
Pantone 534 Blue
Black
Rich Black -
20/20/20/100
Blue - 100/80/30/5
Yellow - 0/27/100/0
Red - 10/100/100/5
Yellow - 0/27/100/0
Blue - 100/80/30/5
Table of Contents
Features ......................................................................................... 3
Specications ................................................................................ 3
Instrument Description ...............................................................4-5
Operating Instructions ................................................................6-7
Power and Backlight ................................................................... 6
Frequency and Time Weighting Selection .................................... 6
Level Range ................................................................................ 6
Taking a Measurement ................................................................ 7
MAX/MIN Hold ............................................................................ 7
Auto Power Off ........................................................................... 7
Datalogging ................................................................................... 8
Clock Setup ................................................................................ 8
Recording Interval Setup ............................................................. 8
Erasing the Memory .................................................................... 8
Calibration Procedures .................................................................. 9
Setup TestLink RS232 Interface Software ................................9-13
Tutorial - Quick Start to Use SE322 TestLink .........................13-15
Frequently Asked Questions ....................................................... 15
Battery Replacement ................................................................... 16
www
www.GlobalTestSupply. com
reedinstruments
com
2

Pantone 534 Blue
Pantone 123 Yellow
Pantone 485 Red
Pantone 123 Yellow
Pantone 534 Blue
Black
Rich Black -
20/20/20/100
Blue - 100/80/30/5
Yellow - 0/27/100/0
Red - 10/100/100/5
Yellow - 0/27/100/0
Blue - 100/80/30/5
Features
• IEC651 Type II
• Auto-ranging from 30 to 130 dB
• Dynamic range of 50 dB
• 32,000 record datalogger
• User selectable sampling intervals
• Real-time clock logs each data point with time and date
• 4-digit backlit LCD display with analog bar graph
• AC and DC output
• Max/Min function
• Auto power off
Specifications
Measuring Range: 32 to 80 dB, 50 to 100 dB, 80 to 130 dB
Resolution: 0.1 dB (1dB analog)
Accuracy: ±1.5 dB @ 94 dB
Frequency Range: 31.5 Hz to 8 kHz
Microphone: 1/2” electret condenser microphone
Operating Conditions: 0 to 40°C ( 32 to 104°F), 10 to 90%RH
Storage Conditions: -10 to 60°C (14 to 140°F), 10 to 75%RH
Power Supply: 1 x 9V alkaline battery
Dimensions: 275 × 64 × 30mm (10.8 × 2.5 × 1.2”)
Weight: 285g (0.55lb)
Includes: Calibration screwdriver, windshield ball, RS232
cable, Windows datalogging software, carrying
case, and battery
Optional Accessories: Sound Calibrator (R8090),
USB Cable (USB-300), Tripod (BS-6),
AC Adapter (CFD00120V-09V10)
www
www.GlobalTestSupply. com
reedinstruments
com
3

Pantone 534 Blue
Pantone 123 Yellow
Pantone 485 Red
Pantone 123 Yellow
Pantone 534 Blue
Black
Rich Black -
20/20/20/100
Blue - 100/80/30/5
Yellow - 0/27/100/0
Red - 10/100/100/5
Yellow - 0/27/100/0
Blue - 100/80/30/5
Instrument Description
1. Windshield ball
2. LCD display
3. Power & backlight button
4. MAX/MIN hold button
5. Record button
6. Frequency weighting button
7. Time weighting button
8. Level range control button
www
reedinstruments
www.GlobalTestSupply. com
9. Microphone
10. CAL potentiometer
11. RS232 interface
12. Signal output terminal
13. External power supply terminal
14. Tripod mounting screw
15. Battery cover
com
4

Pantone 534 Blue
Pantone 123 Yellow
Pantone 485 Red
Pantone 123 Yellow
Pantone 534 Blue
Black
Rich Black -
20/20/20/100
Blue - 100/80/30/5
Yellow - 0/27/100/0
Red - 10/100/100/5
Yellow - 0/27/100/0
Blue - 100/80/30/5
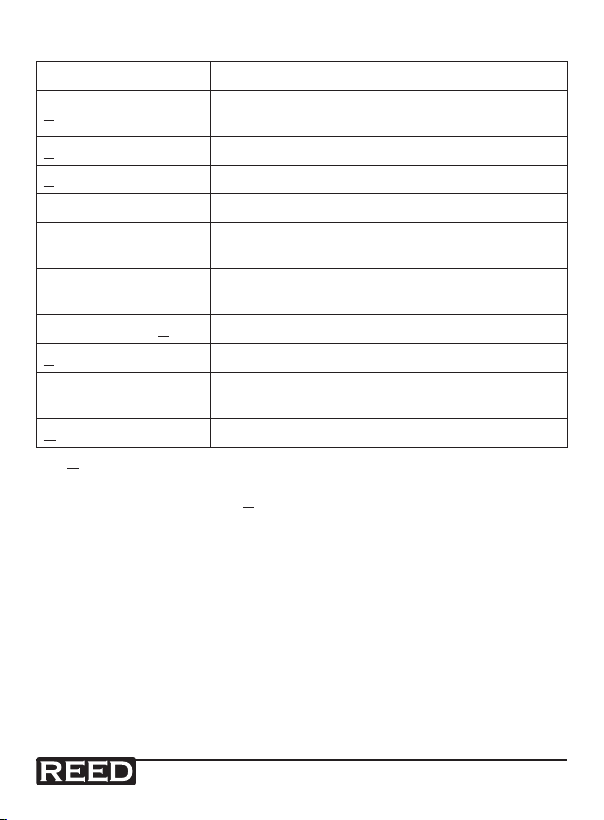
Display Description
Symbol Function
MAX Maximum indication
MIN Minimum indication
FAST Fast response
SLOW Slow response
-
REC Recording datalogger
FULL Memory is full
dBA A-Weighting
dBC C-Weighting
Range indication
Auto Power OFF is active
Auto level range selective
www
www.GlobalTestSupply. com
reedinstruments
Under range 20dB
Under range
Over range
Low battery
com
5

Pantone 534 Blue
Pantone 123 Yellow
Pantone 485 Red
Pantone 123 Yellow
Pantone 534 Blue
Black
Rich Black -
20/20/20/100
Blue - 100/80/30/5
Yellow - 0/27/100/0
Red - 10/100/100/5
Yellow - 0/27/100/0
Blue - 100/80/30/5
Operating Instructions
Wind noise in the microphone can cause measurement errors. Use the
windshield ball to reduce any wind effect on your measurement.
Power and Backlight
Press the Power button to turn the meter on. When the meter is turned
on, the LCD will show how much memory is currently available. Press and
hold the Power button to turn the meter off. While the meter is on, press
the Power button to turn the backlight on and off.
Frequency and Time Weighting Selection
Selecting the proper Frequency and Time Weighting is essential in
obtaining accurate measurements.
Press the A/C button to switch between A and C Frequency Weighting.
• A Frequency: General sound level measurement
• C Frequency: Low-frequency sound level measurement
Press the Fast/Slow button to switch between fast and slow Time
Weighting measurements.
• Fast: Normal measurements (125mS)
• Slow: Checking average level of uctuating noise (1s)
Level Range
Press the LEVEL button to select the appropriate measuring range.
• LO: 30 - 80dB
• MED: 50 - 100dB
www
www.GlobalTestSupply. com
• HI: 80 - 130dB
• AUTO: 30 - 130dB
reedinstruments
com
6

Pantone 534 Blue
Pantone 123 Yellow
Pantone 485 Red
Pantone 123 Yellow
Pantone 534 Blue
Black
Rich Black -
20/20/20/100
Blue - 100/80/30/5
Yellow - 0/27/100/0
Red - 10/100/100/5
Yellow - 0/27/100/0
Blue - 100/80/30/5
Taking a Measurement
1. Turn the power on and select the desired Frequency, Time, and
Level
2. Point the microphone at the noise source to be measured
3. The sound level will be displayed on the LCD screen
MAX/MIN Hold
Select the proper level range before using MAX/MIN mode to ensure that
the reading value will not exceed the measurement range. Press the MAX/
MIN button to enter the maximum and minimum recording mode. Press
the button once to select MAX value. Press it again to select MIN value,
and press it once again to select current value with MAX MIN symbol
blinking. Press the MAX/MIN button and hold it down for 2 seconds to
exit the MAX/MIN mode.
Note: If the sound level range or change A-C weight are changed, the
MAX/MIN mode will be cleared.
Auto Power Off
By default, the meter is in auto power off mode. The meter will power itself
off after 30 minutes without operation (button operation, RS232 communication and no recording operation). To disable the auto power off, press
and hold the FAST/SLOW button and turn the meter on. The
symbol
will NOT appear. This indicates that the auto power off has been disabled.
www
www.GlobalTestSupply. com
reedinstruments
com
7
Pantone 534 Blue
Pantone 123 Yellow
Pantone 485 Red
Pantone 123 Yellow
Pantone 534 Blue
Black
Rich Black -
20/20/20/100
Blue - 100/80/30/5
Yellow - 0/27/100/0
Red - 10/100/100/5
Yellow - 0/27/100/0
Blue - 100/80/30/5
Datalogging
When the REC button is pressed, the meter will start recording.
Pressing the REC button again will stop recording.
Clock Setup
1. With the meter off, press and hold the A/C button
2. Turn on the meter
3. Press the MAX/MIN button
4. Press REC to increase or LEVEL to decrease the number
5. Press the MAX/MIN button to adjust next item. The adjusting
order is Year month day hour minute
6. Press the MAX/MIN button to nish the setup
7. If you want cancel setup at any time, press power button
Recording Interval Setup
1. With the meter off, press and hold the A/C button and turn the
meter on
2. Press the FAST/SLOW button
3. Press REC to increase or LEVEL to decrease the number
4. Press the FAST/SLOW button to adjust next item
5. Press the FAST/SLOW to nish the setup
6. If you want cancel setup at any time, press power button
Erasing the Memory
1. Turn off the meter
2. Press and hold REC button
3. Press power button and hold for at least 5 seconds
4. The LCD will then show “CLR” and “SURE” to clear the memory
www
www.GlobalTestSupply. com
reedinstruments
com
8

Pantone 534 Blue
Pantone 123 Yellow
Pantone 485 Red
Pantone 123 Yellow
Pantone 534 Blue
Black
Rich Black -
20/20/20/100
Blue - 100/80/30/5
Yellow - 0/27/100/0
Red - 10/100/100/5
Yellow - 0/27/100/0
Blue - 100/80/30/5
Calibration Procedures
Calibrate the instrument before operation if the instrument was not in use
for a long time or it was operated in a bad environment
1. Make the following switch settings:
Display: dBA
Time weighting: FAST
Measurement mode: MAX MIN Mode function disabled
Level range: 50 to 100dB
2. Insert the microphone housing carefully into the insertion hole of
the calibrator.
3. Turn on the switch of calibrator and adjust the CAL potentiometer
of the unit. The level display will indicate the desired level.
4. This meter was calibrated before shipment. In order to ensure
the accuracy of the sound level meter for a long period of time it
should be calibrated once a year.
Setup TestLink RS232 Interface Software
System Requirements: Windows 98/NT 4.0/NT2000/XP/VISTA
Minimum Hardware Requirements: PC or NoteBook with Pentium 90MHz
or higher, 32 MB RAM. At least 5 MB hard drive space available to install
TestLink. The recommended resolution is 800 x 600.
Installing TestLink
1. Close all other applications before installing TestLink
2. Insert setup CD into the CD drive.
3. Choose the Start button on the Taskbar and then select Run
4. Type E:\SETUP and click OK, then it will copy SE322.exe
(executable le) as well as the help le to your hard drive
(default is c:\program les\TestLink\SE322)
5. For other operation instruction details, refer to the online help
while executing SE322
www
www.GlobalTestSupply. com
reedinstruments
com
9
Pantone 534 Blue
Pantone 123 Yellow
Pantone 485 Red
Pantone 123 Yellow
Pantone 534 Blue
Black
Rich Black -
20/20/20/100
Blue - 100/80/30/5
Yellow - 0/27/100/0
Red - 10/100/100/5
Yellow - 0/27/100/0
Blue - 100/80/30/5
Main Menu
File/Open Retrieves les from the disk
Save
Print
Printer Setup Selects printer
File/Exit Terminates TestLink program
View/Control Panel
View/Real-Time Graph
Real Time Data/Run Starts collecting real time data
Stop Stops collecting real time data
DataLogger
Output To Graph Graphing tabular data
The Underlines indicate the keyboard shortcuts to get to this actions.
Simply use the Control key on your keyboard with the Underlined caracter.
IE: The keyboard shortcut to Save is Control S.
Saves the active window (when the caption bar
is highlighted) data to the hard drive
Prints the data of the active window (graph or list)
By opening the Panel Window, the user can
control meter via the button in this window
Opens Real-Time Graph display to a graph of
the present data
By opening the DataLogger Window, the user can
load recorded data of meter to PC in this window
www
www.GlobalTestSupply. com
reedinstruments
com
10

Pantone 534 Blue
Pantone 123 Yellow
Pantone 485 Red
Pantone 123 Yellow
Pantone 534 Blue
Black
Rich Black -
20/20/20/100
Blue - 100/80/30/5
Yellow - 0/27/100/0
Red - 10/100/100/5
Yellow - 0/27/100/0
Blue - 100/80/30/5
Graph
You can choose a rectangle area on the graph to
zoom in for detail. There
are two vertical lines (Cursor A and Cursor B) in the
graph. Time and value are
displayed on the top and
right side of each cursor.
You can move the mouse
cursor over Cursor A or
B and click to select and
drag the mouse cursor to
move these cursors left or
right. Right below Cursor A and B is a slider. You can also click and drag
slider to move Cursor A or B.
At the top of this screen are the statistics/values for the Start Time, Sampling Rate, Data Number, Maximum and Minimum values of the graph. At
the bottom of the screen are the statistics/values for the maximum and
minimum average between Cursor A and B. This data will update automatically when Cursor A or B are moved.
You can double click the graph to call up the option dialog. In the option
dialog, you can customize your graph style.
You can also right click the graph (real time graph is not allowed) to call up
the popup menu.
To Zoom into this graph using the mouse, Left click (click the left mouse
button) and drag the cursor to select the new extents and release the
mouse button.
To Undo the Zoom, Right click on the graph, you will see a pop-up menu,
select Undo Zoom.
www
www.GlobalTestSupply. com
reedinstruments
com
11

Pantone 534 Blue
Pantone 123 Yellow
Pantone 485 Red
Pantone 123 Yellow
Pantone 534 Blue
Black
Rich Black -
20/20/20/100
Blue - 100/80/30/5
Yellow - 0/27/100/0
Red - 10/100/100/5
Yellow - 0/27/100/0
Blue - 100/80/30/5
Tool Bar
DataLogger
Display or hide Statistic 1
Display or hide Statistic 2
Normal cursor
When selected, the mouse cursor will become a cross sign
when moving to the graph, click on the graph to mark a cross
sign on the graph.
When selected, the mouse cursor will become a “I” sign when
moving to the graph, click on the graph to annotate.
Color graph
Monochrome graph
Once the meter is connected to the PC, either select “DataLogger” from
the main menu or click on
the meter, the progress indicator will display the loading progress. If an
error occus, simply click on “DataLogger” again.
in the tool bar. This will load the data from
www
www.GlobalTestSupply. com
reedinstruments
continued ...
com
12

Pantone 534 Blue
Pantone 123 Yellow
Pantone 485 Red
Pantone 123 Yellow
Pantone 534 Blue
Black
Rich Black -
20/20/20/100
Blue - 100/80/30/5
Yellow - 0/27/100/0
Red - 10/100/100/5
Yellow - 0/27/100/0
Blue - 100/80/30/5
After the data has been loaded, the left hand side of the computer
screen will show how many data sets were loaded as well as the detail
information for each data set: Start Date, Start Time, Recording Rate and
Record Numbers. Here is an example:
The data set will be transfered to the
graph on the right hand side of the
screen, each time after you load your
recorded data from the meter. The
waveform graph and statistics on the
right hand side of the screen displays
the information of the data set you
have chosen. Therefore, you can click
any data sets to the change the data
set displayed in the graph.
Tutorial - Quick Start to Use SE322 TestLink
Recording real time data in waveform
1. First turn the meter on and connect it to a PC RS232 serial port
using the cable (SE-300) provided.
2. Start SE322 program.
3. If the connection is successful the panel will
display the same value as the Sound Level
Meter. If the connection between the meter
and the PC has failed, it will display “No
Connection” in the panel window in
TestLink SE322.
4. When the connection is successful, click
time data and there will be a waveform on the Real Time Graph
Window.
5. Click
to stop recording.
www
www.GlobalTestSupply. com
reedinstruments
to start recording real
com
13

Pantone 534 Blue
Pantone 123 Yellow
Pantone 485 Red
Pantone 123 Yellow
Pantone 534 Blue
Black
Rich Black -
20/20/20/100
Blue - 100/80/30/5
Yellow - 0/27/100/0
Red - 10/100/100/5
Yellow - 0/27/100/0
Blue - 100/80/30/5
How to save the recorded real time data to a file?
1. Click the graph window you want to save and the graph window
will become active, then choose File/Save from main menu or
click
2. In the save dialog window, choose the le name and le type you
wish to save. Your choices are: Binary le (*.ghf), Text le (*.txt)
and Microsoft Excel le (*.csv). The Binary format (*.ghf) will create
a much smaller le size however, it can only be used in TestLink
SE322. The Text format (*.txt) can be opened by TestLink SE322
and any other word processor program such as Microsoft Word,
Notepad etc. The Microsolt Excel format (*.csv) can be opened by
TestLink SE322 and Microsoft Excel.
from the tool bar.
an active window a non active window
www
www.GlobalTestSupply. com
reedinstruments
com
14

Pantone 534 Blue
Pantone 123 Yellow
Pantone 485 Red
Pantone 123 Yellow
Pantone 534 Blue
Black
Rich Black -
20/20/20/100
Blue - 100/80/30/5
Yellow - 0/27/100/0
Red - 10/100/100/5
Yellow - 0/27/100/0
Blue - 100/80/30/5
How to load the recorded data from the memory of the meter
and save it to a file?
1. Turn the meter on
2. Press the “REC” button of the meter to start recording data
3. After a while, press “REC” button again to stop recording data
4. Connect the meter to a PC
5. Start the SE322 program
6. Choose Data Logger from the main menu or click from tool
bar
Frequently Asked Questions
Question: I connected the meter to a PC serial port and turned meter on, but it still
shows “NO CONNECTION”.
Answer: It could be that all serial port you’re using is occupied by another application, close all other applications. If it still don’t work. Restart your computer and run
TestLink SE322 again.
Question: How can I save the graph to a le which can be used in Microsoft Excel?
Answer: When you save a graph to a le, the default le format is *.ghf and you can
also select *.csv. CSV is an Microsoft Excel le format. You can then open it using
Microsoft Excel.
Question: How do I uninstall TestLink SE322?
Answer: Launch the Add/Remove Programs applet out of the Control Panel, high-
lighting the SE322, and clicking on the Add/Remove button. This will remove the
SE322 folder and les from your computer.
Question: Why would loading data fail?
Answer: This might be caused by the slow response from some of the PC.
Question: How do I zoom into the graph?
Answer: Left click (click the left mouse button) and drag the cursor to select the new
extents and release the mouse button.
Question: When I setup the real time sampling with a fast rate (eg. 0.1 sec), some of
the sampling data might be lost.
Answer: This might be caused by the slow response from some of the PC.
www
www.GlobalTestSupply. com
reedinstruments
com
15

Pantone 534 Blue
Pantone 123 Yellow
Pantone 485 Red
Pantone 123 Yellow
Pantone 534 Blue
Black
Rich Black -
20/20/20/100
Blue - 100/80/30/5
Yellow - 0/27/100/0
Red - 10/100/100/5
Yellow - 0/27/100/0
Blue - 100/80/30/5
Battery Replacement
When the battery voltage drops below the operating voltage, this symbol
will appear
9V Battery. Verify that the polarity is correct.
Notes _________________________________________
________________________________________________
________________________________________________
________________________________________________
________________________________________________
________________________________________________
________________________________________________
________________________________________________
________________________________________________
________________________________________________
________________________________________________
. Remove the battery cover on the back and insert a new
________________________________________________
________________________________________________
________________________________________________
www
www.GlobalTestSupply. com
reedinstruments
com
16
 Loading...