

Page 1
Technical Data Studio Master Tape
(
)
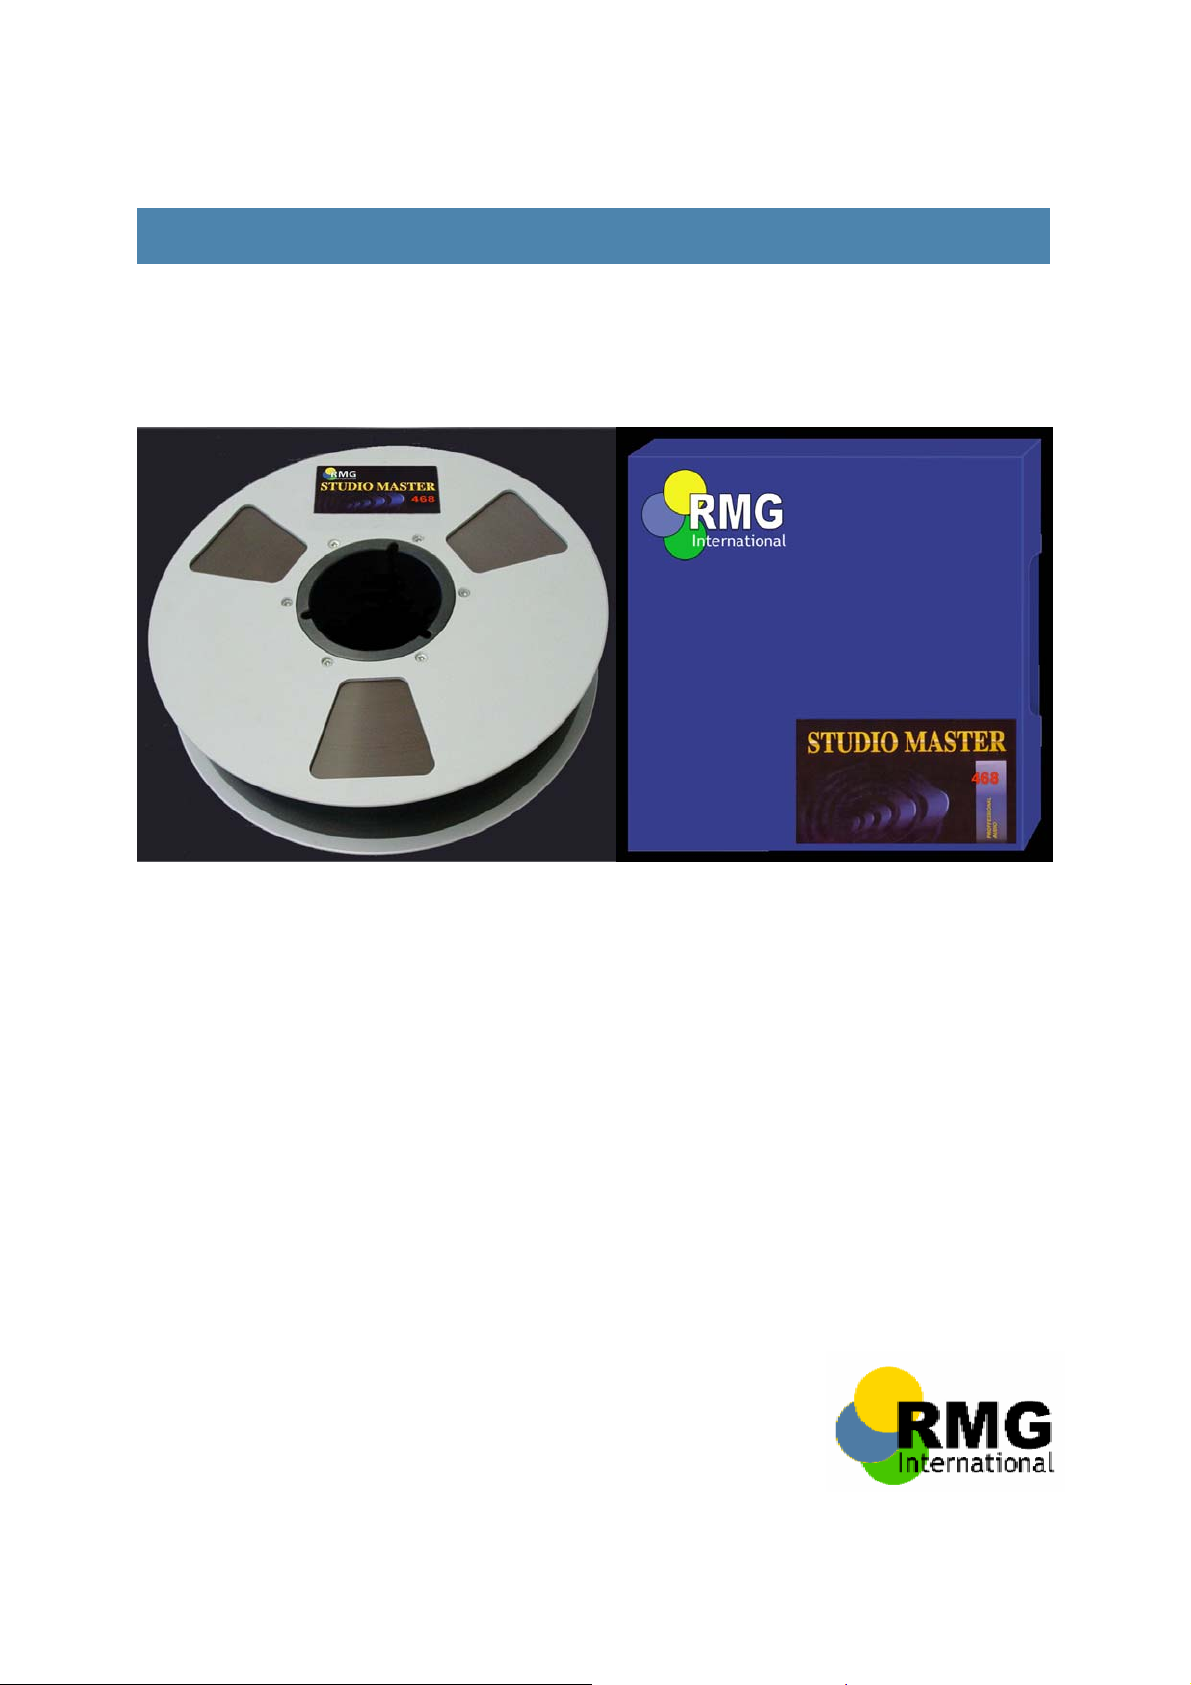
Studio Master 468
High bias studio tape for use in
music studios, broadcasting and archives.
¾ for multitrack and mastering operation.
Offering
¾ excellent dynamic range over the entire
frequency spectrum.
¾ minimal print-through.
¾ high level uniformity up to the highest
frequencies.
¾ excellent winding even at high speeds, allows
flangeless operation.
¾ archiveability, long term stability, worldwide
proven.
04/06
03
Audio Studio
Page 2
Technical Data Studio Master SM 468
(
)
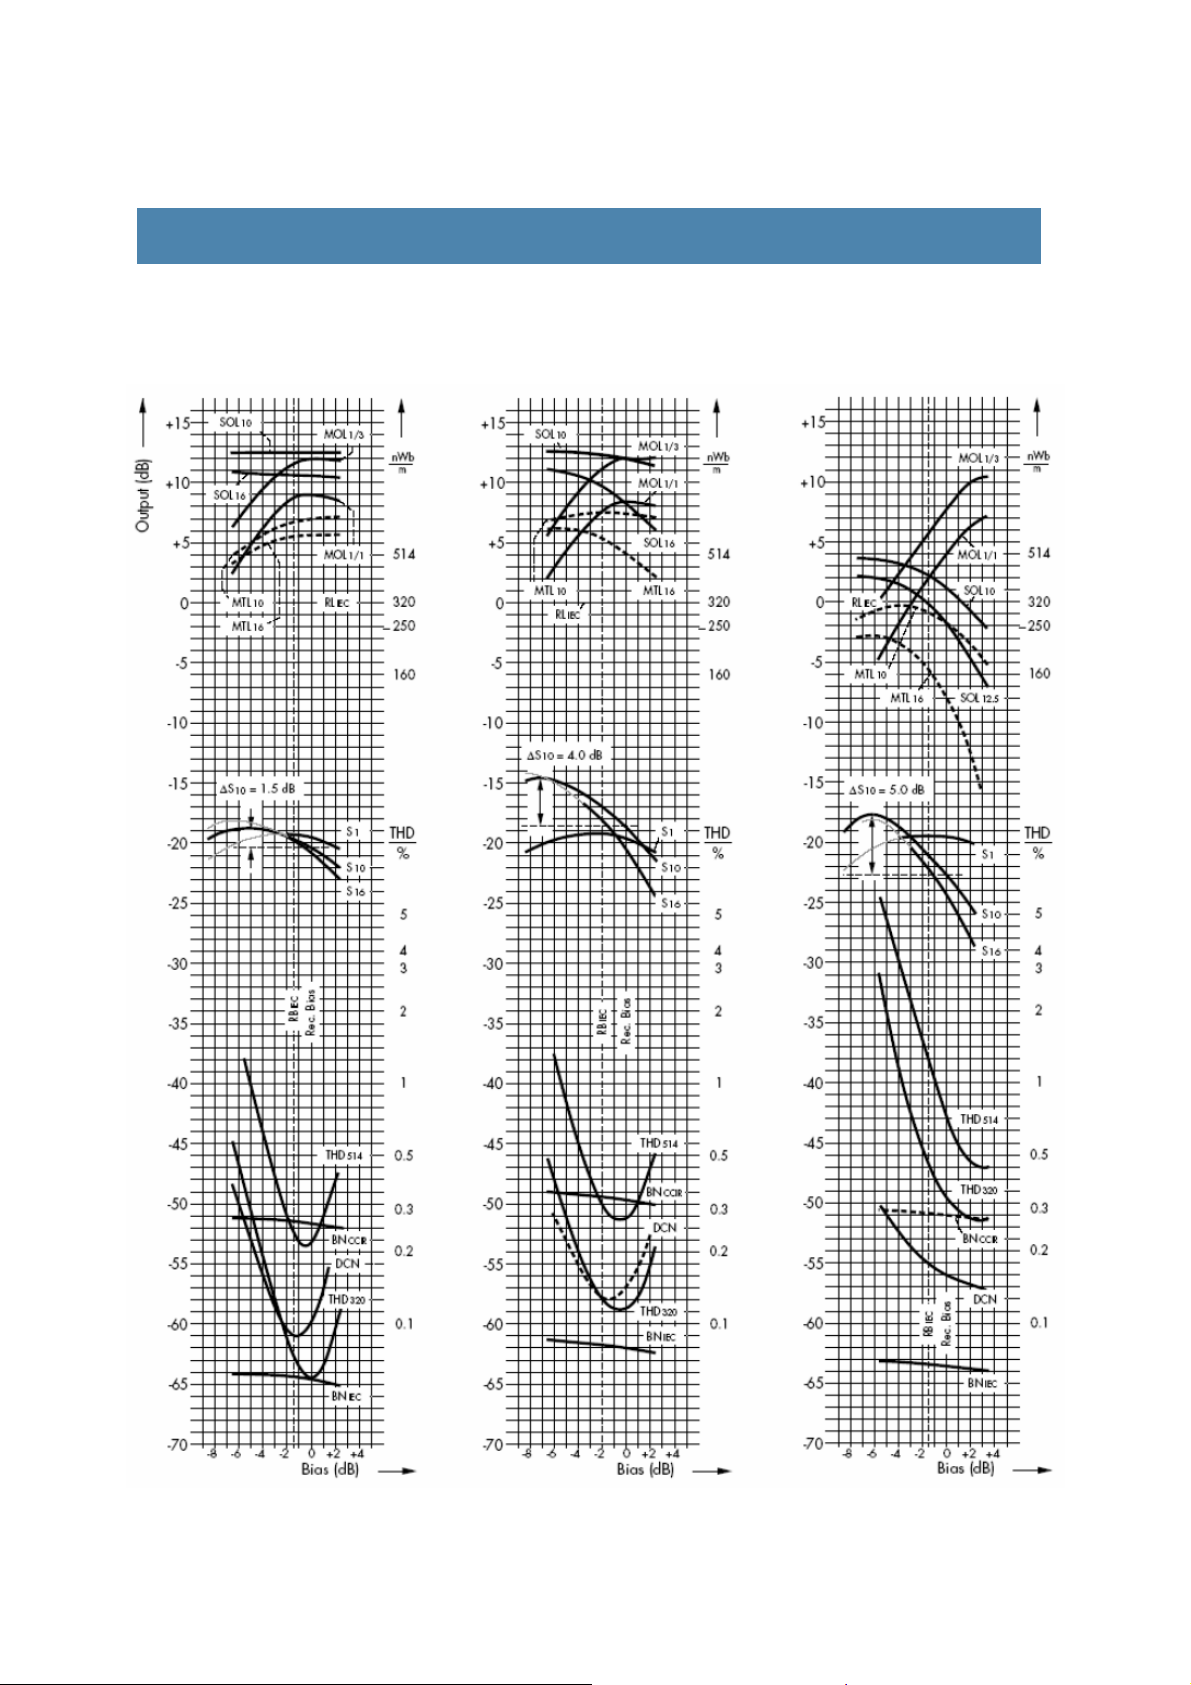
1. Recording Performance Specifications (depending on bias settings)
Tape speed 76.2 cm/s
Recording head gap length 7.0 µm
Playback head gap length 3.0 µm
Equalisation 17.5 ms
Reference level 320 nWb/m
Tape speed 19.05 cm/s
Recording head gap length 7.0 µm
Playback head gap length 3.0 µm
Equalisation 50 + 3180 µs
Reference level 320 nWb/m
Tape speed 38.1 cm/s
Recording head gap length 7.0 µm
Playback head gap length 3.0 µm
Equalisation 50 + 3180 µs
Reference level 320 nWb/m
04/06
03
Page 3
Technical Data Studio Master SM 468
(
)
04/06
03
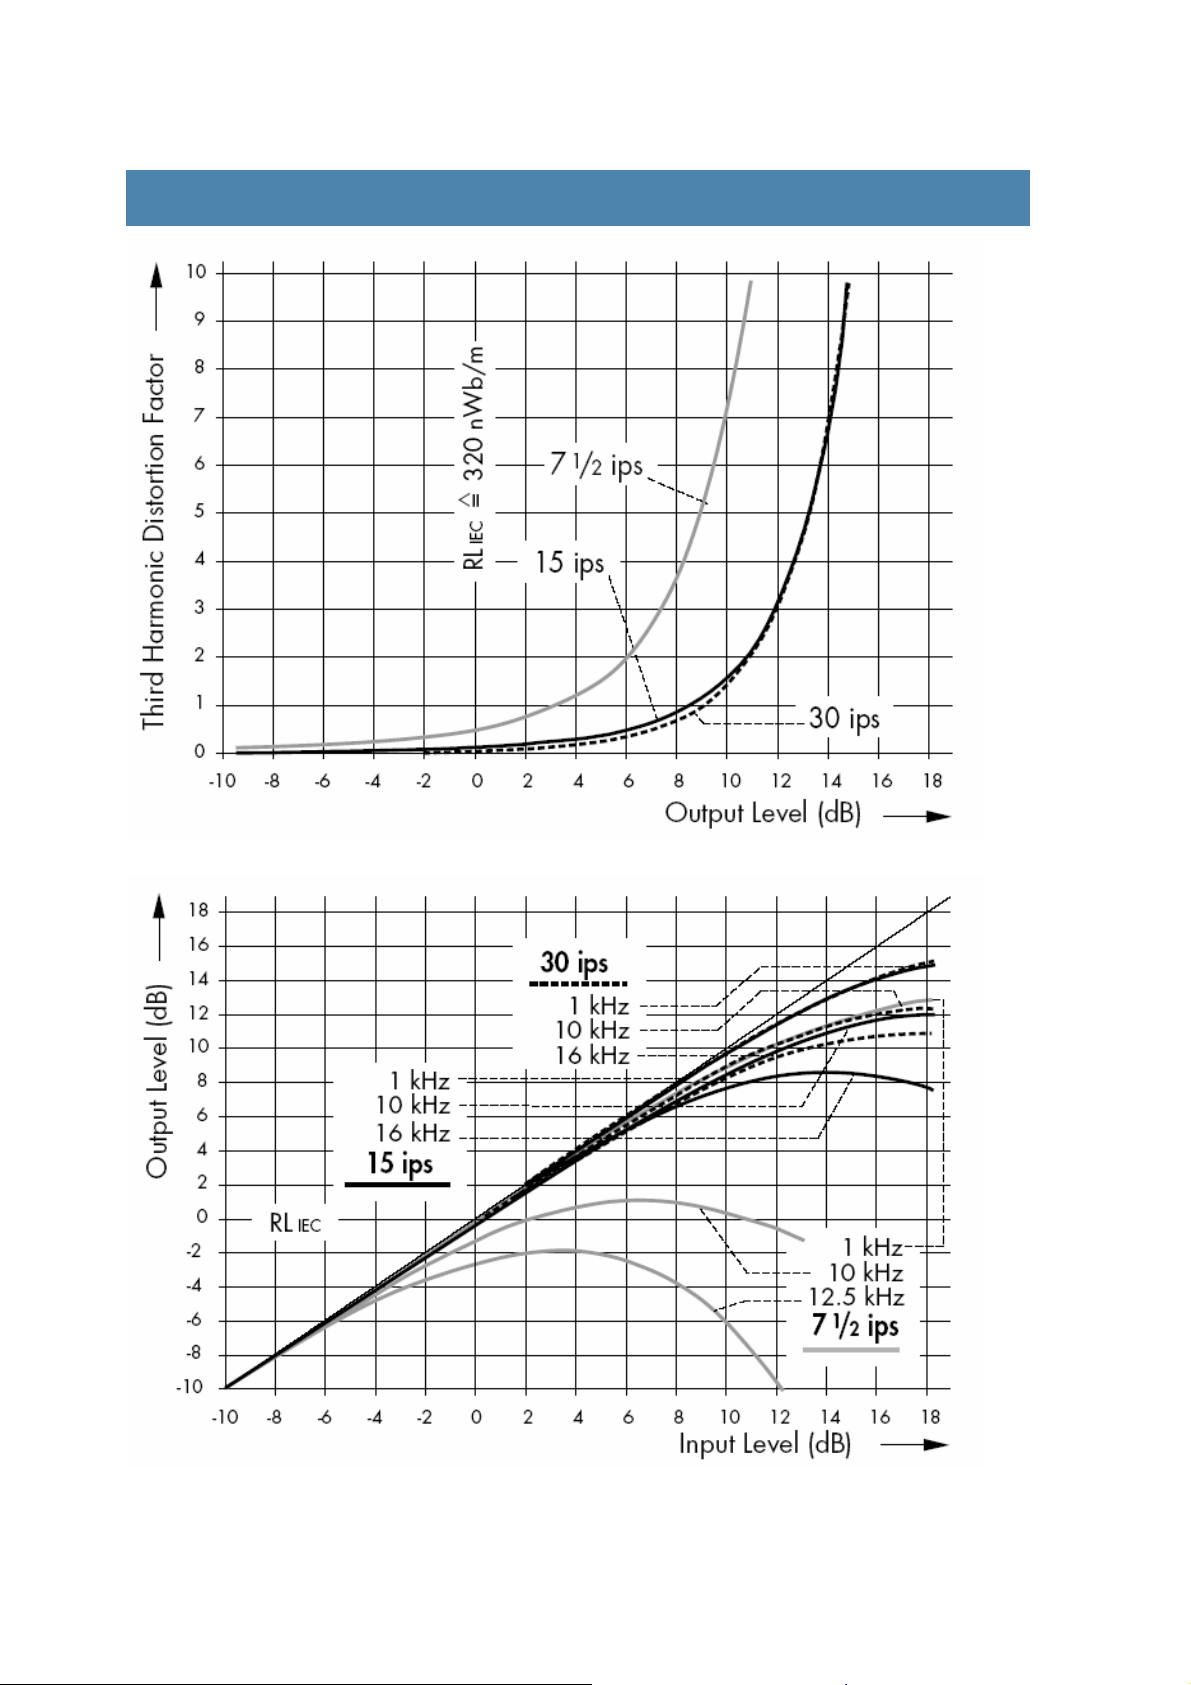
Output level versus Third Harmonic Distortion Factor at frequency 1 kHz and tape speeds
30 ips (76.2 cm/s), 15 ips (38.1 cm/s) and 7
1/2 ips (19.05 cm/s). See also Reference 2.1.
Input Level versus Output Level at frequencies 1 kHz, 10 kHz and 16 kHz (12.5 kHz at 7 1/2 ips)
and tape speeds 30 ips (76.2 cm/s), 15 ips (38.1 cm/s) and 7
1/2 ips (19.05 cm/s).
Page 4

Technical Data Studio Master SM 468
(
)
2. Measurement Conditions Ref.
Tape speed 76.2 cm/s 38.1 cm/s 19.05 cm/s
30 ips 15 ips 7.5 ips
Record head: Studer Studer Studer 1.1
Gap length 7.0 µm 7.0 µm 7.0 µm
0.25 mil 0.25 mil 0.25 mil
Track width 6.3 mm 6.3 mm 6.3 mm
¼” ¼” ¼”
Playback head:
Gap length
0,12 mil 0,12 mil 0,12 mil
Track width 2.575 mm 2.575 mm 2.575 mm
Playback equalisation NAB NAB NAB
RLIEC IEC Reference Level at 1kHz 320 nWb/m 320 nWb/m 320 nWb/m 1.3
IEC reference tape: batch MT 82472 MT 82472 A 342 D
IEC reference tape bias definition Min. THD320 Min. THD320 Min. THD320 1.4
RB
IEC reference bias -1.5 dB -2.0 dB -1.5 dB 1.5
IEC
Rec. Bias Recommended bias setting 0.0 dB 0.0 dB 0.0 dB
∆S10 Sensitivity drop for
recommended bias setting 1.5 dB 4.0 dB 5.0 dB 1.6
3. Recording Performance Specifications
The table belowpresents the main parameters in the recommended bias setting. All figures given represent nominal values.
1/1 Maximum Output Level at 1 kHz, THD = 3 % 12.0 dB 12.0 dB 7.5 dB
MOL
MOL1/3 Maximum Output Level at1 kHz, THD = 1 % 9.0 dB 8.5 Db 4.5 dB
SOL10 Saturation Output Level at 10 kHz 12.5 dB 12.0 dB 1.0 dB
SOL12.5 Saturation Output Level at 12.5 kHz -2.0 dB
16 Saturation Output Level at 16 kHz 10.5 dB 8.5 dB
SOL
MTL10 Maximum Twin tone Level at 10 kHz 7.0 dB 7.5 dB -2.0 dB 2.1
MTL16 Maximum Twin tone Level at 16 kHz 5.5 dB 4.0 dB -8.0 dB 2.1
1 Relative tape Sensitivity at 1 kHz 0.5 dB 0.5 dB 0.5 dB 2.2
S
S10 Relative tape Sensitivity at 10 kHz 1.5 dB 1.5 dB 1.5 dB 2.2
S12.5 Relative tape Sensitivity at 12.5 kHz 1.5 dB 2.2
S16 Relative tape Sensitivity at 16 kHz 2.5 dB 1.5 dB 2.2
THD
Third Harmonic Distortion factor at RLIEC 0.06 % 0.12 % 0.34 % 2.1
THDRL+4dB Third Harm. Dist. ratio at RLIEC+4dB -53.0 dB -51.0 dB -43.0 dB 2.1
Third Harm. Dist. factor at RL
DCN DC noise level, weighted, rel. to RLIEC -60.0 dB -57.0 dB -56.0 dB
BNIEC Bias Noise level (IEC 94; A-weighted) -64.5 dB -62.5 dB -64.0 dB 2.3
BN
MOL/BNIEC Dynamic range 76.5 dB 74.5 dB 71.5 dB 2.4
MOL/BNCCIR Dynamic range 63.5 dB 61.5 dB 58.5 dB 2.4
P Print-through (print-effect) 60.0 dB 58.0 dB 59.0 dB 2.5
Third Harmonic Distortion ratio at RLIEC -64.5 dB -58.5 dB -49.5 dB 2.1
IEC+4dB 0.26 % 0.28 % 0.72 % 2.1
CCIR Bias Noise level (CCIR 468/3-weighted) -51.5 dB -49.5 dB -51.0 dB 2.3
Studer Studer Studer 1.1
3.0 µm 3.0 µm 3.0 µm
17.5 µs 50+3180 µs 50+3180 µs 1.2
04/06
03
Page 5

Technical Data Studio Master SM 468
(
)
04/06
03
4. Magnetic Properties Ref.
C Coercivity 30.0 kA/m 380 Oe 3.1
H
B
RS Retentivity 140 mT 1400 G 3.2
ØRS Saturation flux 1990 nWb/m 199 mM/mm 3.3
Orientation
longitudinal
5. Physical Properties
Base material
Polyester
Tape widths available 6.3 / 12.7 / 25.4 / 50.8 mm 4.1
¼” / ½” / 1” / 2”
Tolerances of tape width
+0.0 / -0.06 mm +0.0 / -2.4 mil 4.1
Base thickness
30.0 µm 1.18 mil 4.2
Coating thickness 14.5 µm 0.57 mil 4.2
Total thickness 48.5 µm 1.89 mil 4.2
Back coating black
Surface resistance of the magnetic coating
Surface resistance of the back coating
< 10,000 MΩ/ < 10 GΩ/
< 100 kΩ/
Load for elongation of 3 % (F3) per 6.3 mm (1⁄4") tape
≥ 20 N ≥ 61 MPa 4.3
Breaking tensile strength per 6.3 mm (1⁄4") tape ≥ 30 N ≥ 91 MPa 4.3
6. References
The data in this publication are based on test methods
described inIEC Publication 94. References are given only
in the case of deviationsor particularities.
1.1 For the measurements magnetic heads are used
whose propertiesare very similar to the standard reference
heads specified in IECPublication 94-5. Record heads with
a gap length of 7 µm (0.25 mil) and playback heads with a
gap length of 3 µm (0.12 mil) are required.
1.2 Playback equalisation on the tape testing equipment is
adjusted to provide a flat frequency response of the
output voltage when playing back the frequency response
section of the relevant calibration tape for the selected
tape speed and equalisation.
1.3 RL
obtained when playing back the reference level section of
the relevant IEC calibration tape for the selected tape
speed. The reference level corresponds to a magnetic flux
in the tape per metre trackwidth of 320 nWb/m.
1.4 IEC reference tape bias definition: Using the relevant
IEC reference tape and heads according to Ref. 1.1, the
bias current providing the minimum third harmonic
distortion ratio for a 1 kHz signal recorded at the
reference level is the reference bias setting.
1.5 RB
ratio of the bias for the relevant IEC reference tape (see
Ref. 1.4) to the recommended bias for the tape under test
(see Ref. 1.6).
1.6 ∆S
Operationally, the recommended bias is set while
recording an input signal of 10 kHz at –20 dB. Based on
the peak of the sensitivity curve S
until the playback level is reduced by the given value
∆S10.
(IEC reference level): The reference level is
IEC
(IEC reference bias): These data represent the
IEC
(Sensitivity drop for recommended bias setting):
10
, the bias is increased
10
2.1 MTL and THD (Maximum Twin tone Level and Third
Harmonic Distortion): For MTL measurement the
frequency distance of the primary tones is 40 Hz. During
the THD measurement the playback output is held both at
IEC reference level (see Ref. 1.3), and at the increased
output level RL+...dB. From the corresponding curves the
distortion factor can be obtained directly as a percentage
of the output level. (The dBscale can only be used for RL
as the output level. In order to derive the distortion ratio
in dB for increased output levels at RL+...dB, this output
level has to be subtracted from the value read in dB.
These resulting values in dB are given in the table).
2.2 S (Sensitivity): All the sensitivity curves are measured
using a constant record current, which is necessary to
obtain an output level of approximately –20 dB for a 1 kHz
input signal. A record equalisation is not used. The
distances between the sensitivity curves thus reflect the
record equalisation necessary to achieve a flat frequency
response. The values given in the table represent the
sensitivity of the tape under test at the recommended
bias. As relative sensitivity values they refer to the the
corresponding values of the relevant IEC reference tape at
its own reference bias corresponding to the definition in
Ref. 1.4.
2.3 BN (Bias Noise level): The index ...IEC refers to
measurement using the weighting A-filter specified in IEC
Publication 651, while ...CCIR refers to the use of the
weighting filter and quasi peak meter specified in CCIR
468-3.
2.4 MOL/BN (Dynamic range): The signal to bias noise
level ratio MOL/BN results from the difference of the
maximum output level MOL and the bias noise level BN.
Regarding the index IEC or CCIR respectively see Ref. 2.3.
IEC
Page 6
Technical Data Studio Master SM 468
(
)
2.5 P (Print-through): Print-through is the ratio of a
reference level recording to the highest signal level
transferred to the next tape layer after 24 hours storage
at 20°C (68°F).
3 The magnetic measurements are made by means of a
magnetic field having a strength of 100 kA/m (1,250 Oe)
in order to obtain a practically saturated magnetisation in
the magnetic material of the sample.
(Coercivity): The coercitive magnetic field strength
3.1 H
C
is required to reduce the longitudinal magnetisation in the
magnetic material to zero after the sample has been
magnetised to saturation.
(Retentivity): Retentivity is the remaining
3.2 B
RS
magnetic flux density in the magnetic material when the
magnetising field is reduced to zero after the sample has
been magnetised to saturation.
All data given in the specification are subject to change without prior notice due to technical progress.
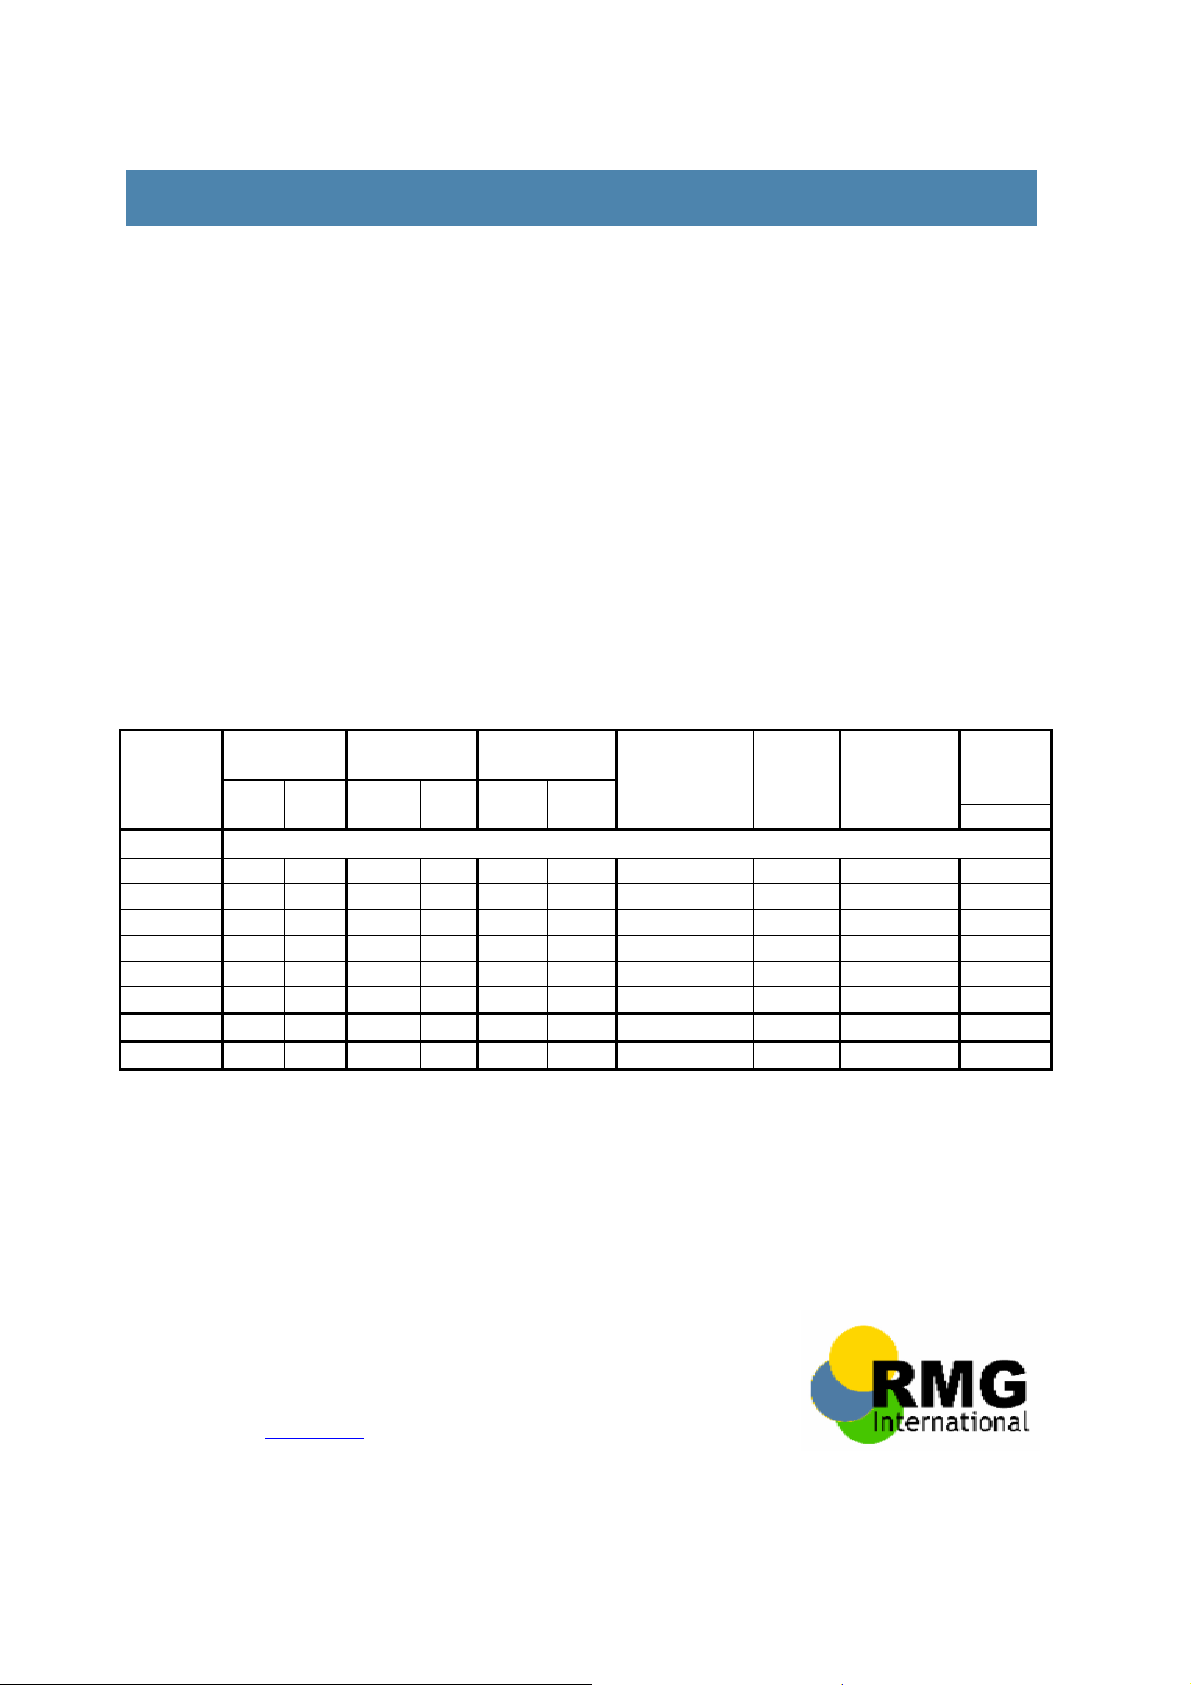
7. Ordering Information
RMGI
Product
Code
SM 468
35110 0,25 6,3 600 183 5 130 Plastic Reel Trident Hinged 20
35111 0,25 6,3 1.200 366 7 180 Plastic Reel Trident Hinged 20
35112 0,25 6,3 2.500 762 10,5 265 Plastic Reel Trident ECO Pack 10
35113 0,25 6,3 2.500 762 10,5 265 Plastic Reel Trident Eco Pack 20
35120 0,25 6,3 2.500 762 10,5 265 Metal Reel NAB Hinged 10
35130 0,25 6,3 2.500 762 Pancake NAB ECO Pack 20
35220 0,5 12,7 2.500 762 10,5 265 Metal Reel NAB Hinged 6
35420 2 50,8 2.500 762 10,5 265 Prec. Reel NAB Hinged 2
Tape
Width
Inch mm ft m Inch mm
Tape
Length
Reel
Diameter
Recordable Media Group International B.V.
P.O. Box 137
4900 AC Oosterhout
The Netherlands
Telephone: +31-(0)162-40 89 50
Fax: +31-(0)162-46 26 11
e-mail [email protected]
Internet www.rmgi.nl
(Remanent, or residual saturation flux): the so-
3.3 Ø
RS
called "residual saturation flux" is the retentivity multiplied
by the thickness of the magnetic coating.
4.1 Tape width and its tolerances correspond to the
specifications given in IEC Publication 94-4.
4.2 Thicknesses: Values given are mean averages.
4.3 Yield strength (F3) and breaking tensile strength:
According to the methods specified in IEC publication 94-4
the force necessary to produce 3% elongation, or to break
the tape using a test sample length of 200 mm and an
elongation rate of 100 mm/min. The value given in MPa
results from the measured strength related to the cross
section of the tape sample. The strengths increase a little
less than proportionally with tape width.
Reel Type
or Pancake
Hub
Type
Box
Type
Tapes/
Carton
pcs
04/06
03
 Loading...