


RAK LoRaWAN
Industrial Gateway
WisDevice Series
RAK7249/RAK7258
Version 1.5 | July, 2019
www.RAKwireless.com
Visit our website for the latest copy of this manual.
31 PAGES
Configuration Guide for
Table of Contents

RAK7249/58
2
RAK LoRaWAN Industrial Gateway Configuration Guide
Table of Contents
1 Overview
2 Gateway Start-up...................................................................................................................................... 3
3 Web Management Platform................................................................................................................... 4
3.1 Status
3.2 Network
3.3 LoRa Gateway................................................................................................................................. 11
3.4 LoRa Network Server
3.5 Services............................................................................................................................................ 25
3.6 System.............................................................................................................................................. 26
3.7 SD card Backup and packet recovery
.....................................................................................................................................................
...................................................................................................................................................
3.1.1 Overview
3.1.2 LoRaWAN Packet Logger.................................................................................................... 5
3.1.3 System Log.............................................................................................................................6
3.1.4 Firewall
...............................................................................................................................................
3.2.1 WAN Interface........................................................................................................................7
3.2.2 Cellular Interface................................................................................................................... 7
3.2.3 Wi-Fi........................................................................................................................................ 8
3.2.4 Firewall....................................................................................................................................8
3.2.5 Diagnostics
3.2.6 Ping Watchdog
3.3.1 LoRa Packet Forwarder..................................................................................................... 11
3.4.1 General
3.4.2 Gateway................................................................................................................................17
3.4.3 Applications.......................................................................................................................... 19
3.4.4 Global Integration................................................................................................................23
3.5.1 System
3.5.2 Administration
3.5.3 Backup / Flash Firmware................................................................................................... 27
3.5.4 Reboot...................................................................................................................................28
3.5.1 File Browser
.................................................................................................................................
....................................................................................................................................
.............................................................................................................................
.......................................................................................................................
......................................................................................................................
.................................................................................................................................
..................................................................................................................................
......................................................................................................................
.........................................................................................................................
..........................................................................................
16
16
26
27
28
29
3
4
4
6
7
9
9
4 Contact Information...............................................................................................................................30
5 Revision History..................................................................................................................................... 31
6 Document Summary
..............................................................................................................................
31

RAK7249/58
3
RAK LoRaWAN Industrial Gateway Configuration Guide
1 Overview
This document describes in detail the functionality of the Web Management UI. The interface
builds on top of OpenWRT and all gateway products of the RAK72xx line share it.
The document gives instructions on configuring WAN, the LoRa Packet Forwarder and Gateway
MQTT Bridge. It explains how to do system-monitoring, update of the firmware and reset the
device. Last, but not least in provides information on using the built-in LoRa Server.
This guide functions as reference for several products with similar functionality. Thus, some
sections will apply to certain products and not others.
2 Gateway Start-up
Make sure all the antennas are connected before powering the Gateway.
For RAK7258 use the included adapter. RAK7249 comes with a PoE injector, which you
need to connect to the grid on one side and to the Gateway on the other (Ethernet cable not
included).
The Gateway comes configured in such a way that you can use either the Ethernet port or
the Wi-Fi in AP mode to connect to the Management platform.
In both modes you can access the Management UI via a web browser pointing to the IP
address of the Gateway (check your router DHCP list). Alternately, the IP Address
(192.168.230.1) is preconfigured as the one to use for access to the device provided you are
directly connected to it.
WiFi AP mode
By default the Gateway is configure to work in Access Point (AP) mode. It has the following
parameters:
Wi-Fi
SSID: RAK72XX_xxxx (no password is required to connect via Wi-Fi)
Web UI
Connect via a browser to the IP address assigned to the gateway, which is 192.168.230.1
by default. You should see the login window in Figure 1. Use the credentials below:
UI user: root
UI password: root
RAK7249/58
4
RAK LoRaWAN Industrial Gateway Configuration Guide
Figure 1 | Login window
WAN port (DHCP IP) mode
Connect the Ethernet cable to the port marked “ETH” and the other end to your Router. Use
the same credentials for the Web UI as for AP mode.
3 Web Management Platform
After you have entered the correct credentials, you can start exploring the configuration and
monitoring interface of the RAK LoRa Gateway.
Status
3.1
This is where statistics about the Gateway behavior can be monitored in real time.
3.1.1 Overview
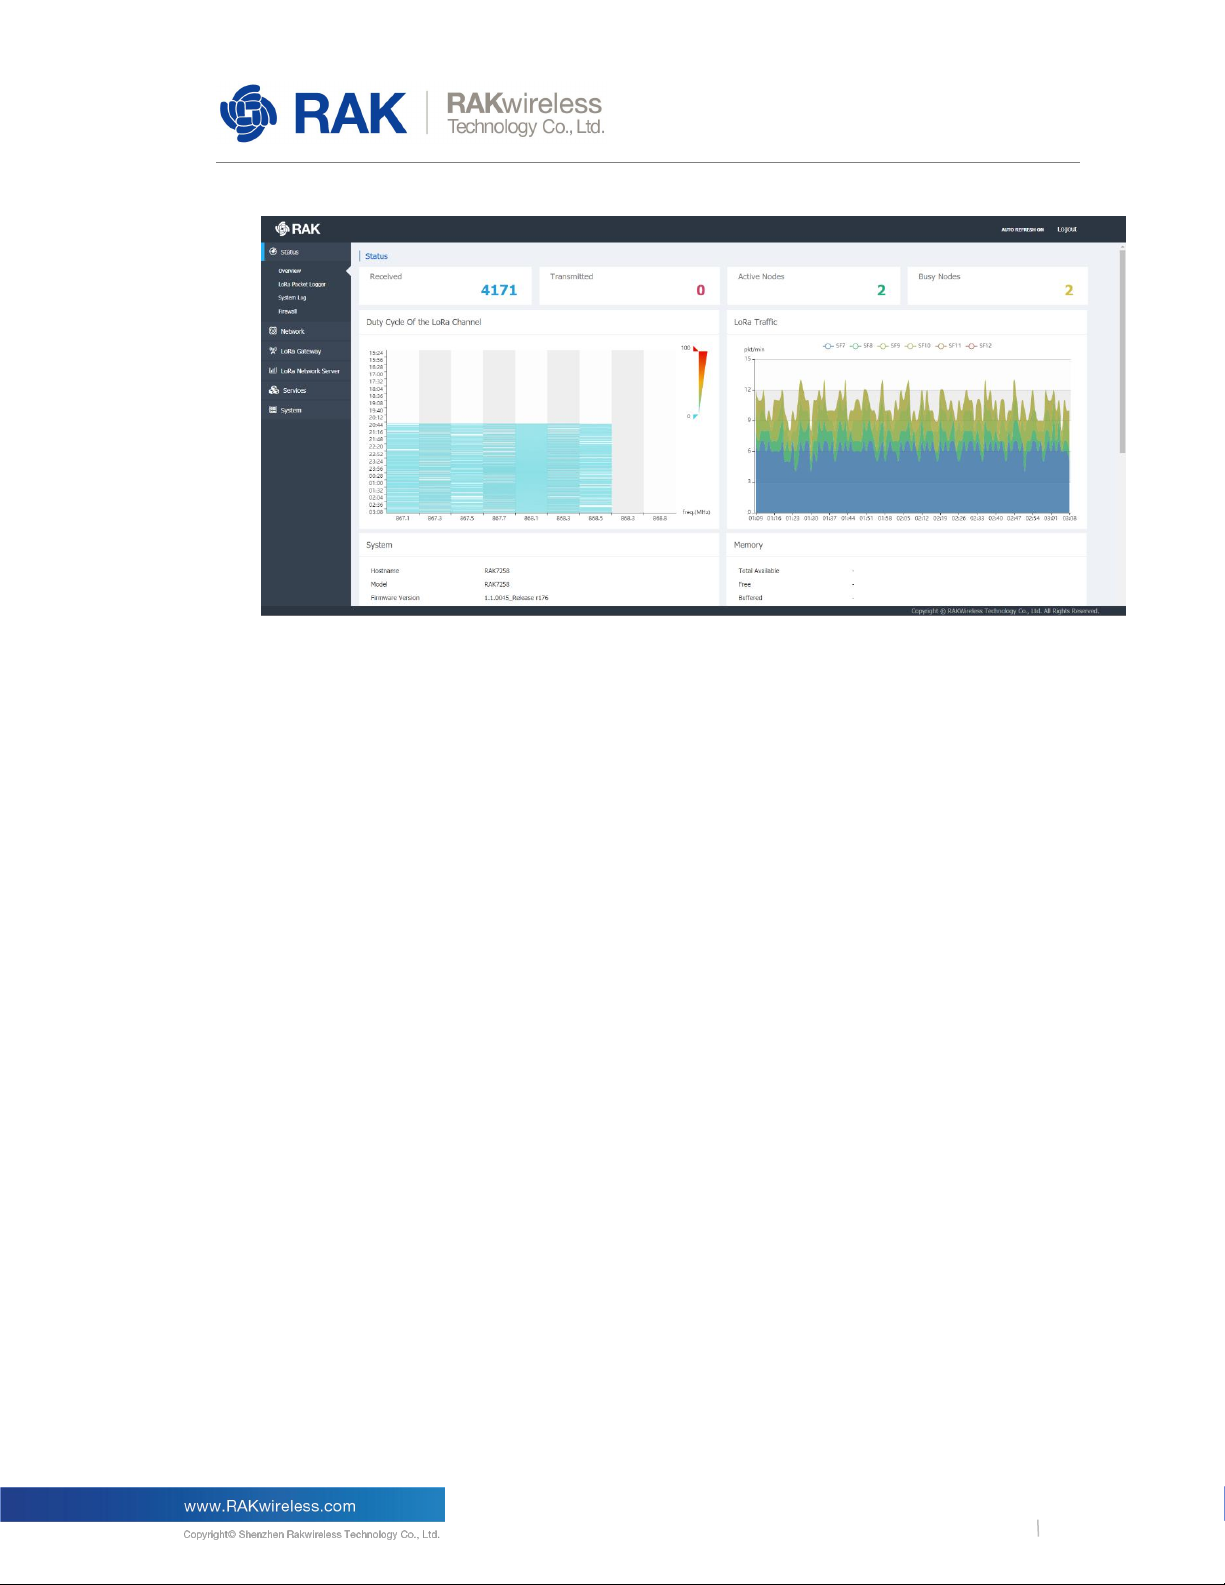
Upon logging in the browser displays the page in Figure 2.
The following are the parts of the Overview window:
Received:
Shows the total number of uplink LoRa messages received by the gateway.
Transmitted:
Shows the total number of downlink LoRa message sent by the gateway.
RAK7249/58
5
RAK LoRaWAN Industrial Gateway Configuration Guide
Figure 1 | Status Overview page
Active Nodes:
Shows the number of active LoRa nodes within the LoRa gateway coverage (those that
have sent no data for more than 10 min are discarded from the count).
Busy Nodes:
Shows the number of busy nodes within the LoRa gateway coverage (nodes with an
average message spacing of less than 60s).
Duty Cycle of the LoRa Channel
The graph represents the Duty Cycle load by frequency channel (Data is kept for the last 12
hours). The minimum resolution along the time axis is 60s. Each value is an average over
60s. The values are color code – green to red, low to high.
LoRa Traffic:
The graph shows the packet per minute rate as a function of time. Above the image, one
can see the color-coding of the different Spreading Factors, where the actual height of the
values is a sum of all the packets over all spreading factors for the time sample.
Additionally you have sub-windows displaying the System, Memory, LoRa Netowrk Server,
Network (WAN). Cellular, and Wi-Fi information. Those have their separate sections and will
be discussed in detail further down.
LoRaWAN Packet Logger
3.1.2
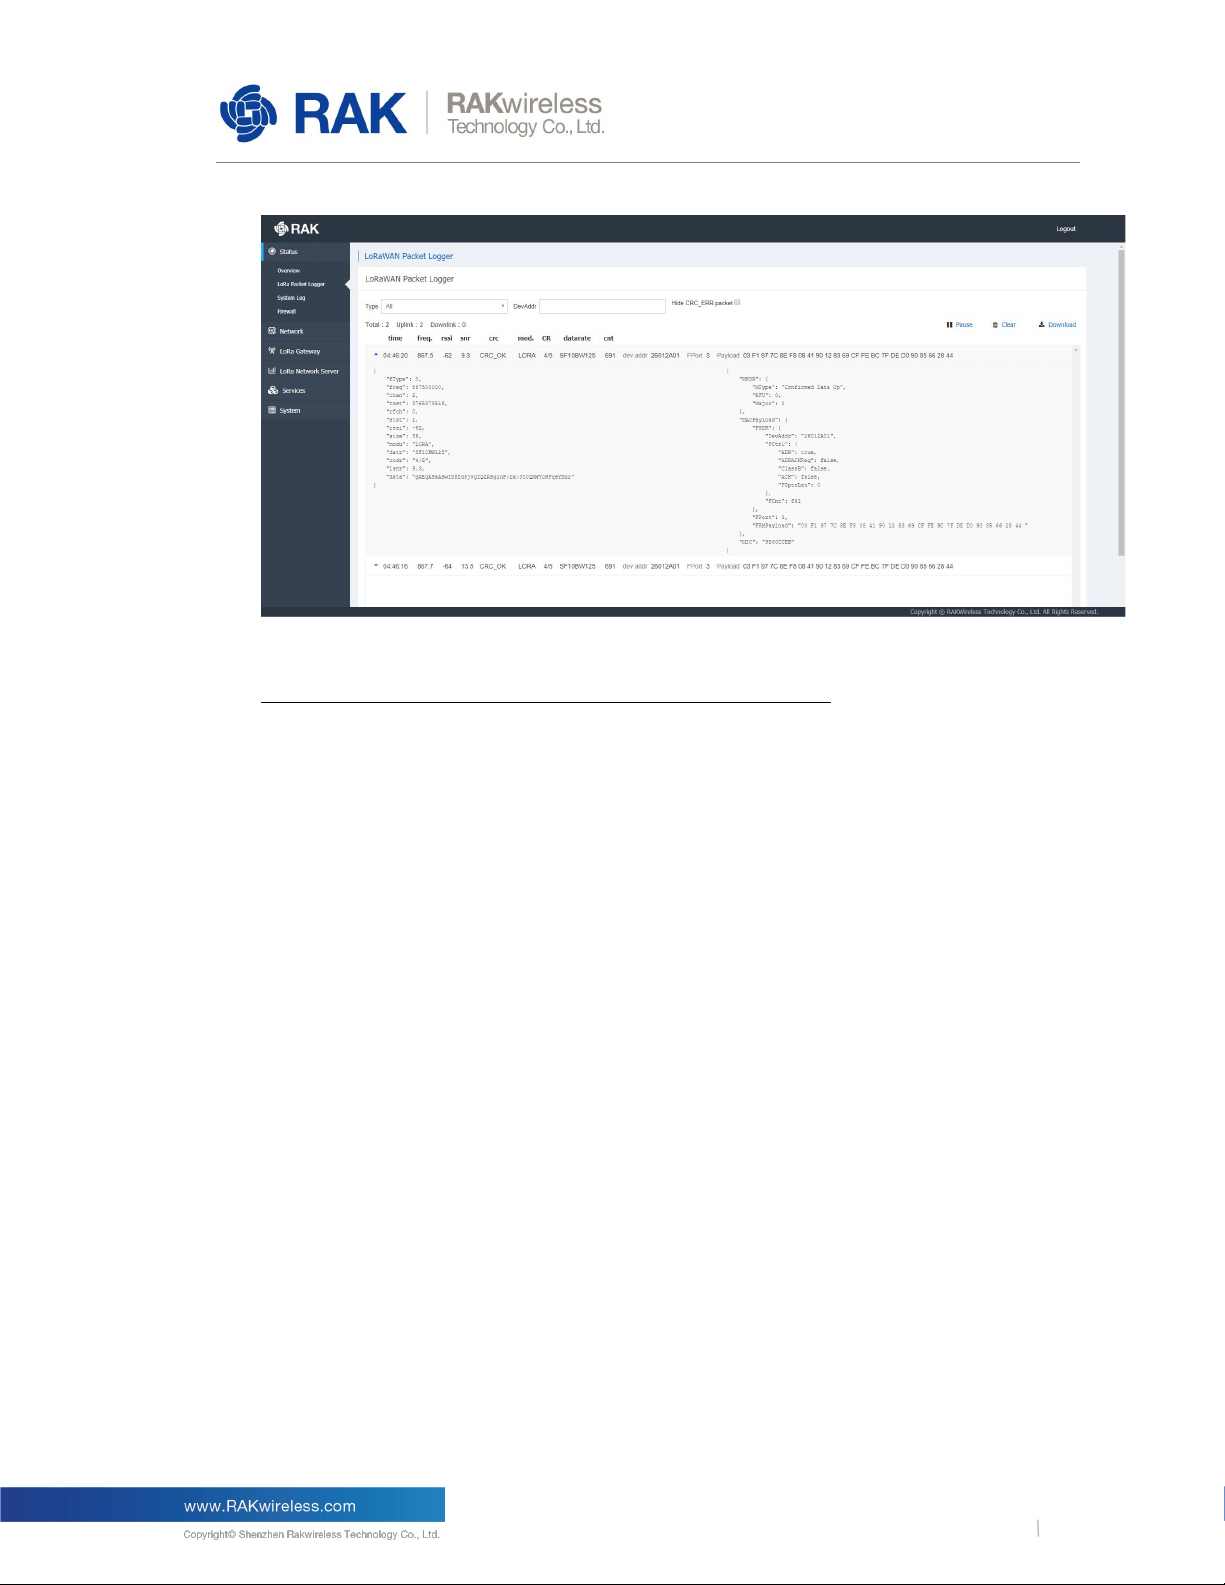
This is where a log of the LoRa messages is shown in real time. There are several options
for filtering as well as the possibility to download the statistics in a file. Additionally there is a
summary (Total, Uplink, and Downlink), below the filter fields.
RAK7249/58
6
RAK LoRaWAN Industrial Gateway Configuration Guide
Figure 2 | LoRa Packet Logger page
The user can choose to filter the packets by one of the following:
Type:
Filter by message type. By default ALL messages are displayed, where possible options are:
Join Request/Accept, Unconfirmed Data Up/Down, and Confirmed Data Up/Down
DevAddr:
Filter messages based on the Device Address in order to single out a node.
Hide CRC_ERR packet:
This check box hides messages that are corrupted in some way and will not be forwarded.
The buttons for Pause/Play, Clear and Download of the data are in the top right over the list.
If the user clicks on a given packet the window is expanded detailed information about the
contents of the message is displayed
3.1.3 System Log
The complete system log. It is useful mainly for debugging purposes.
3.1.4 Firewall
Statistics for the Gateway Firewall
RAK7249/58
7
RAK LoRaWAN Industrial Gateway Configuration Guide
3.2 Network
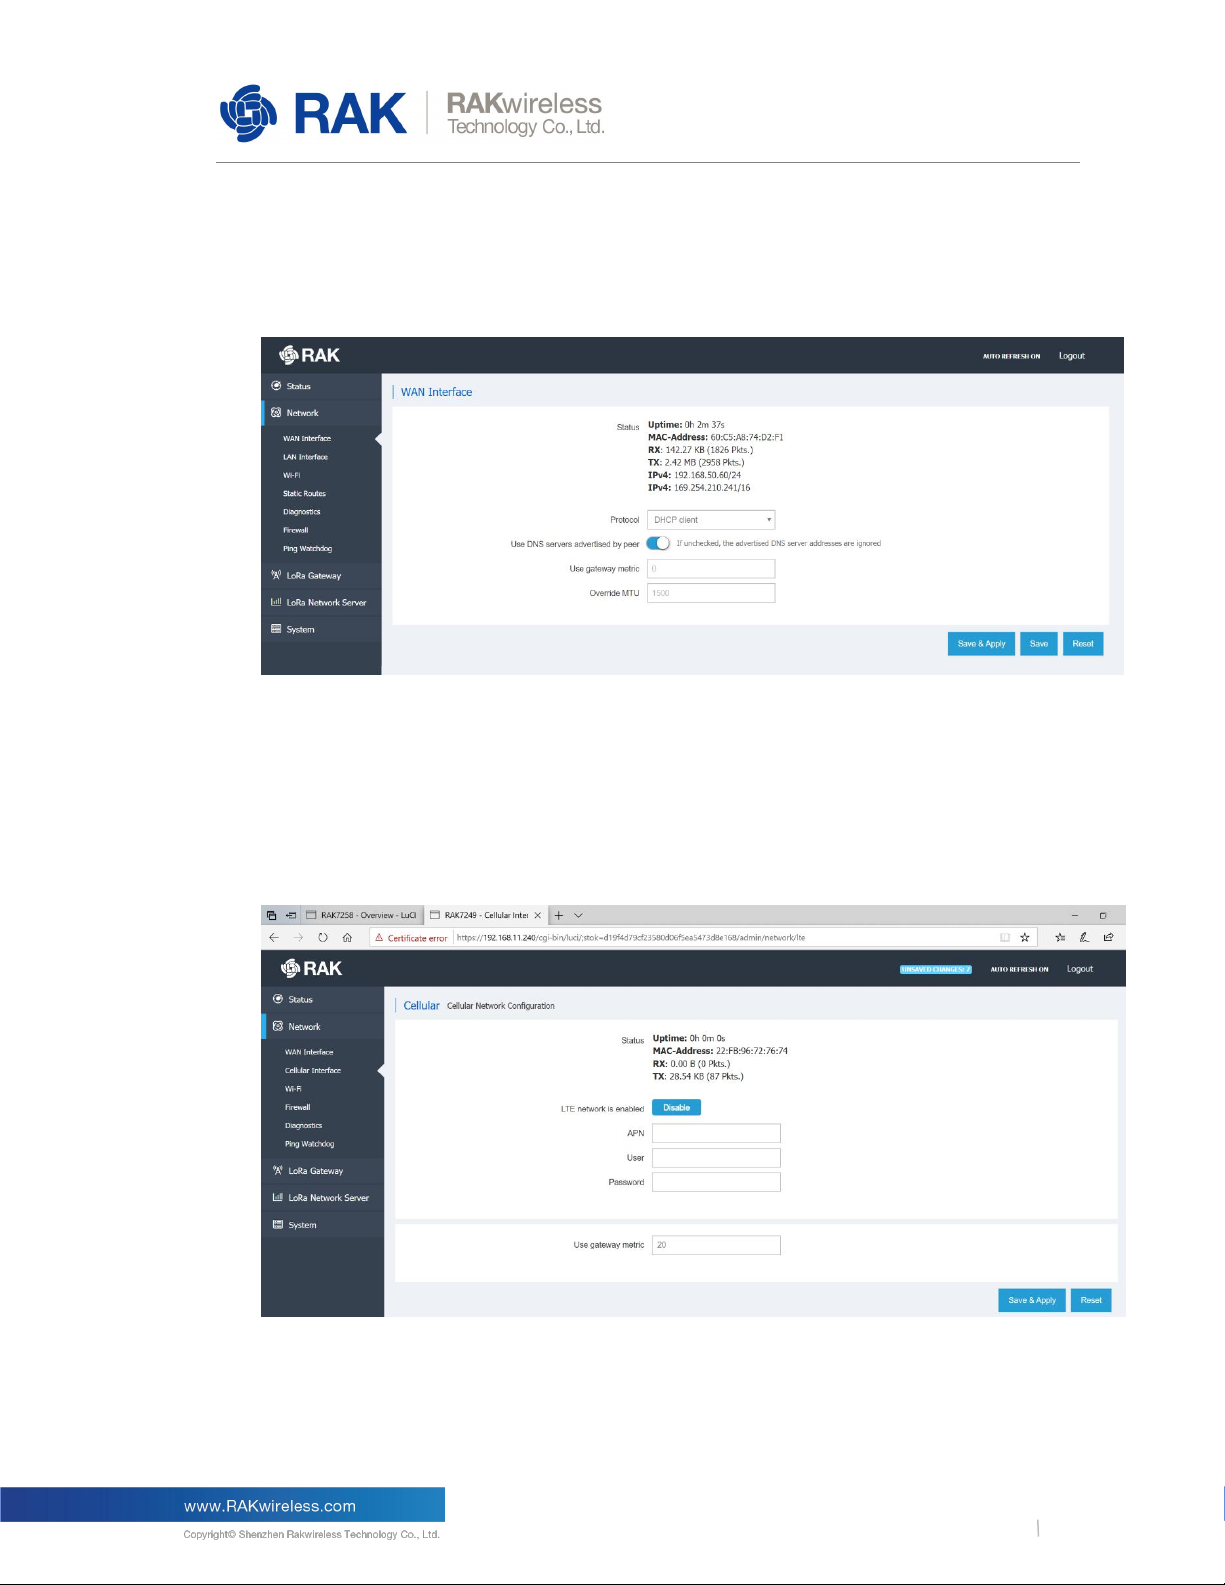
3.2.1 WAN Interface
Figure 3 | WAN Interface
The user can check the Status (Uptime, IPv4 Address, etc.), or configure the protocol to be
used for connecting to your provider’s network.
The following options are available: DHCP/PPPoE/Static address.
Cellular Interface
3.2.2
Figure 4 | Cellular Interface

RAK7249/58
8
RAK LoRaWAN Industrial Gateway Configuration Guide
The same statistics as with the WAN Interface are available. It is here that you set
the APN, User, and Password. The gateway metric determines the priority of this interface,
compared with the other connectivity options. The lower the value the higher the priority.
Wi-Fi
3.2.3
Figure 5 | Wi-Fi Interface
Enabling/Disabling the Wi-Fi is done from this page via the blue button at the top.
Additionally you can pick a radio channel or leave it on Auto configuration. The Wi-Fi can
work in one of two modes:
Access Point:
By default, there is no password. One can access the Web UI via the IP address:
192.168.230.1 once connected to the AP. The SSID is RAK72xx_xxxx by default.
Client:
Choose this option to use Wi-Fi as a backhaul for the Gateway. You need to manually enter
the SSID, Encryption method and the Key itself.
Note: Make sure to click the “Switch mode” button first in order to input the corresponding
parameters, before saving and applying the changes.
Firewall
3.2.4
You can configure a number of settings including, but not limited to: Zones, Port Forwarding,
NAT, etc.

RAK7249/58
9
RAK LoRaWAN Industrial Gateway Configuration Guide
Figure 6 | Firewall Settings
3.2.5 Diagnostics
Figure 7 | Diagnostics
This is where you can perform checks via the built-in tools: Ping, Traceroute, Nslookup.
You can enter either an URL or an IP Address in the text box and execute the command
with the button. Both IPv4 and IPv6 are supported. The results are conveniently displayed in
a CLI box.
3.2.6 Ping Watchdog
Ping Watchdog monitors the quality of network links by constantly pinging the specified IP
Address or Domain name on the specified uplink network interface. When network link
failures are detected, scheduled measures are taken automatically. Those include: Interface
restart, Interface priority reduction, Device restart, etc.
Note: Reducing the priority of an uplink interface only works when the LoRa Gateway uses
both Ethernet and Cellular as uplink methods at the same time.

RAK7249/58
10
RAK LoRaWAN Industrial Gateway Configuration Guide
WAN interface represents the Ethernet uplink interface and WWAN represents the LTE
cellular network uplink interface.
For example if Ping Watchdog is enabled for both uplink interfaces at the same time and the
response to degradation of the link quality is set as Increase Gateway Metric the two uplink
interfaces work as backups for each other. In the event of significant degradation on one,
the Gateway switches to the other.
The Gateway Metric determines the priority of interfaces. The default value can be adjusted
in the Network menu for the corresponding interface. The lower the Gateway metric, the
higher the priority of the link.
Figure 8 | Ping Watchdog Interface Configuration

RAK7249/58
11
RAK LoRaWAN Industrial Gateway Configuration Guide
3.3 LoRa Gateway
All the LoRa Settings reside in this section.
LoRa Packet Forwarder
3.3.1
Figure 9 | Packet Forwarder General Setup
As this is the most important part of the LoRaWAN Gateway, the number of settings and
options is greatest here. Thus, this section will be larger and provide information in more
detail than previous ones. For the aforementioned reasons this section has several
configuration tabs, which are listed in the following paragraphs. Additionally some of the
configuration options have their own documents, with detailed explanation of the
configuration process.
General Setup
This is where the core settings are: Gateway EUI, Frequency channels, etc.
Gateway EUI:
The value in this field is necessary for registering your gateway with any LoRaWAN Network
Server.
Protocol:
You have three options, which define how the Gateway will function:
Semtech UDP GWMP Protocol:
By default, this is the Semtech Packet Forwarder, which sends packets to the Server
Address of your choice (IP or URL). By default it points to the local TTN router.
The default port value is 1700 used by TTN.
One can also set parameters as the Push Timeout (ms), Statistic Interval (s), Keep Alive
Interval (s) and the Auto-restart Threshold.

RAK7249/58
12
RAK LoRaWAN Industrial Gateway Configuration Guide
Automatic Data Recovery
This is an important feature that came with the r176 Firmware update. It allows for LoRa
Frames to be store on the SD card (provided there is one in the slot), if the LoRa Network
Server is unavailable. Upon restoring the connection those buffed messages will be
forwarded so no data will be lost. This is done in blocks of 8 (FIFO), until all are cleared from
the buffer.
LoRa Gateway MQTT Bridge:
By choosing this option, you make the Gateway act as a bridge to the MQTT Broker, which
is hosted somewhere separate. You need to configure the Gateway to point to the correct
address of the MQTT broker
Built-in LoRa Server:
In case you require an integrated solution where the LoRa Network Server is hosted on the
gateway itself you choose this option. The configuration of the LoRa MQTT Bridge itself is
done in a separate section of the configuration UI, which is discussed in Paragraph 3.3.2
Beacon Setup
In the case of Class B LoRa devices, you need to have a beacon in order to synchronize
downlink message windows. Thus, you have to configure its parameters: Frequency
Channel, SF, Bandwidth, Tx Power, etc. Make sure you adhere to the LoRa Alliance
recommendations.
Packet Filter
By enabling this functionality, you can filter incoming traffic and only forward packets from
the desired nodes in order to optimize bandwidth usage over backhaul. You can filter by
OUI or Network ID by whitelisting.
The Enable Auto Filter slider allows nodes to be automatically dropped in accordance with a
set of parameters. One can set threshold values for Discard Period, Join Period, Join
Interval, and Join Count (1 and 2 for Join Interval and Join Period respectively).
GPS Information
In case, you want to enter the GPS parameters for the Gateway manually.
Frequency Plan
This is a part of the page, common for all gateway from the RAK72xx series, however
depending on the number of Concentrator modules installed there are variations. The
difference when there is a second Concentrator is that first it has to also be configured, and
second only the fields for the central frequencies for Radio 0 and Radio 1 need be set.
You can directly import a whole frequency plan via the Import Frequency Plan Template
drop down menu. Alternately you can set the frequencies yourself.
There are two mode for setting the frequencies:

RAK7249/58
13
RAK LoRaWAN Industrial Gateway Configuration Guide
Standard Mode:
You can start by importing a region via the drop down menu (EU868 is the default one). You
will get the defaults channels for the chosen frequency band and the option to add additional
ones. Simply enter the frequency in the text box (in MHz) and click the “Add” button. You
can add as many channels as you need as long as they fall in the Regional band.
Additionally there is a field for adding the Standard LoRa Channel and FSK channel (you
need also choose the SF, Bandwidth and data rate of each of the aforementioned).
Advanced Mode:
Because of the presence of double SX1257s, you need to configure the two radios
separately. You have eight Multi Spreading Factor Channels, The LoRa Standard Channel
and the FSK Channel. The sliders can enable or disable those, so you can choose to have
any number of them active. Additionally you can choose which radio to use for a given,
channel as long as you do not assign more than five channels per radio. In order to set the
desired channel to a given frequency you need to input an offset value in the If field. Thus,
the channel frequency will be the central frequency (Radio 0 Freq or Radio 1 Freq
parameter) summed with the offset value (in Hz).
Additionally for the LoRa Standard and FSK channels, you are also required to select the
Bandwidth and Data Rate.
Figure 10 | Frequency plan (standard mode)

RAK7249/58
14
RAK LoRaWAN Industrial Gateway Configuration Guide
As mentioned before you can choose to import those settings for the Indian, Russian and
EU Regions (in accordance with the LoRa Alliance specifications).
For details on the procedure refer to the Packet Forwarder Customs Spectrum Settings
Guide.
Figure 11 | Frequency plan (advanced mode)
LoRa Gateway MQTT Bridge
The Gateway is capable of working with an external LoRa Server, where the MQTT Broker
is functioning separately. For this purpose, there are several tabs with their corresponding
parameters to be filled (in addition for a slider for turning the Bridge on and off).
Figure 12 | LoRa Gateway MQTT Bridge

RAK7249/58
15
RAK LoRaWAN Industrial Gateway Configuration Guide
General Setup
The tab starts with the button to enable/disable this functionality, followed by:
MQTT Broker Address:
The IP Address where the MQTT Broker is hosted.
MQTT Broker Port:
The corresponding port.
Client ID:
The user can input a custom Client ID (Will be reflected in the MQTT Broker data).
Clean Session:
If this slider is in the on position, every new connection to the MQTT Broker will open a new
session. All meta-data from previous one will be removed.
Will Retain:
This slider determines if the published messages from a client will be retained.
Qos:
You can pick one of several options here: Almost Once, Atleast Once, Exactly Once
Enable Authentication:
The switch turns on Encryption of the transmitted data. You need to configure the
Certificates used to encrypt the data in order for secure authentication to be performed.
TLS Version:
The version of the TLS protocol to be used. Options are TLSv1, TLSv1.1, TLSv1.2
Username/Password:
Credentials the MQTT Bridge is to use for connecting to the LoRa Server instance
CA Certificate, TLS Certificate, TLS Key:
Those are to be generated via the appropriate algorithm and distributed between the MQTT
Broker and the LoRa Server.
Please refer to the MQTT Bridge with TLS Encryption Configuration Manual for details on
how to edit the settings in order for the Gateway to work as an MQTT Bridge with TLS
Encryption.
MQTT Topic Template Setup

RAK7249/58
16
RAK LoRaWAN Industrial Gateway Configuration Guide
This tab has the MQTT Topic template information necessary to publish or subscribe to the
Broker. The Uplink, Downlink, Downlink Acknowledgement, and Gateway statistics
templates are here.
3.4 LoRa Network Server
The Gateway comes with an integrated LoRa Networks server. This makes the Gateway a
standalone solution for the whole LoRaWAN chain in one device. This is immensely helpful
for testing purposes, and provided for flexibility in deployment options.
Naturally, one can opt to disable this feature and use a LoRa Network Server hosted
separately.
3.4.1 General
In order to use the LoRa Server you need to enable its protocol from the following menu:
LoRa Gateway Menu -> LoRa Packet Forwarder -> Protocol -> Built-in LoRa Server
Now you can choose to enable/disable it via the slider in the General Configuration tab.
Below is a short explanation of the main parameters:
Frequency Plan
A drop down menu list including the following:
EU-863-870, IN868-867, US902-928, AS923, CN470-510, AU915, KR920
Enable ADR
If you choose to use Adaptive Data Rate, you need to enable it via the slider and further
configure the Minimum and Maximum allowed value.
Figure 13 | LoRa Network Server General Configuration

RAK7249/58
17
RAK LoRaWAN Industrial Gateway Configuration Guide
Minimum and maximum allowed data-rate
Note the DR_0, to DR_15 values represent a bits/s value and max payload size. Those are
dependent on your region of operation and the bandwidth and SF used. However as they
are predefined by the LoRa Alliance the menu does not list the full parameter values. Please
refer to the official documentation for details.
Network ID
The ID of the network to be advertised to end devices in case you want to have roaming to
other networks
Downlink Tx Power
This is the maximum power in dBm the Gateway is allowed to use when transmitting frames
to the nodes. It is region specific (for example EU – 14dBm)
Device-status request interval
The time in seconds between node status request messages sent by the Gateway. Default
value of 0 (disabled status requests).
Gateway
3.4.2
In this section you can add and External Gateways to work with your LoRa Network Server.
This way packets forwarded by the listed Gateways will be forwarded as though they were
within the range of this device. Refer to Figure 11 for an overview of the section window:
Below is a short explanation of the main parameters:
Figure 14 | Adding Gateways to the LoRa Network Server

RAK7249/58
18
RAK LoRaWAN Industrial Gateway Configuration Guide
Gateway
Here you can add a Gateway. You simply need to input the EUI into the text box and press
the Add button. Additionally you can add a Name, Description and the coordinates of the
Gateway.
Gateway Backend Configuration
By filling this section, you are pointing the LoRa Network Server to the MQTT Broker
MQTT Broker Address:
The IP Address where the MQTT Broker is hosted.
MQTT Broker Port:
The corresponding port.
Client ID:
The user can input a custom Client ID (Will be reflected in the MQTT Broker data).
Clean Session:
If this slider is in the on position, every new connection to the MQTT Broker will open a new
session. All meta-data from previous one will be removed.
Will Retain:
This slider determines if the published messages from a client will be retained.
Enable User Authentication:
If this is switched on, a Username, Password, and a Certificate (Disabled by default) will be
required for user authentication.
SSL/TLS Mode:
Choose the certificate type here:
CA Signed server certificate, Self-signed server certificate, Self-signed server & client
certificate. All certificated have support for TLSv1, TLSv1.1, and TLSv1.2.
MQTT Topic
Here you can get information on the topic templates: Uplink MQTT topic, Downlink MQTT
Topic, Downlink Acknowledge MQTT Topic, Gateway Statistic MQTT Topic.

RAK7249/58
19
RAK LoRaWAN Industrial Gateway Configuration Guide
Applications
3.4.3
Figure 15 | Adding an Application
The first time you access the menu it will have no applications listed. Create one by Entering
a name in the field and pressing the “Add” button. You will be redirected to the Application
Configuration Screen (Figure 16). Enter the Name, Application EUI, Application Key.
Optionally you can use the slider to choose whether to turn Auto Add LoRa Device (devices
with valid Application EUI and Key will be automatically added, no need to do it manually by
entering the Device EUI) on or off.
After completing the initial Application setup you will see the image in Figure 17. The two
tabs present are explained below:
Figure 16 | Application Configuration
Figure 17 | Application Configuration

RAK7249/58
20
RAK LoRaWAN Industrial Gateway Configuration Guide
Devices
If you want to manually add a device to your application, you can do this one by one by
entering their EUIs in the field pressing the “Add” button. Another option is to use the Batch
Add function.
Batch add devices
You need to fill in the following parameters: Start EUI, Step, Count, and Application Key.
The step is a decimal value that represents by how much the value of the EUI will be
increased with each consecutive device. This will be done starting from the least significant
bit.
The count is the maximum number of devices to be added. Note that if your step is anything
different than 1 you will essentially add less devices than the Step value. Basically you will
end up with a number of devices that is the Integer Division of the Count by the Step. For
example if your Step is 3 and your Count is 10 you will end up with 3 Devices.
The Application Key is an AES-128 value, which is common for all devices under a given
application.
Note: When Batch Adding devices they are all configured in Class A, OTAA mode, with
Frame counter validation enabled.
Additionally you can Export/Import the device list in CSV format.
Application Configuration
Here resides the data you already entered when creating the Application. You can adjust it
as needed.
Adding and configuring a device
Below is in depth explanation of the data available per device. You can enter this section by
either inputting a valid EUI and pressing the Add button, or pressing the Edit button for an
existing device:
Figure 18 | Device Configuration

RAK7249/58
21
RAK LoRaWAN Industrial Gateway Configuration Guide
Figure 19 | Device Configuration parameters
Configuration
Here you can edit device parameters as follows:
Name – does not need to match the EUI, batch loading results in a match by default.
Class – both Class A and Class C devices are supported.
Join Mode – both OTAA and ABP are supported.
Application Key – note those can be different per device, however devices will still be
grouped by application name.
Enable Frame-Counter Validation – with this feature turned on, frames that have a counter
number smaller or equal than current counter value.
Disable Application-EUI Validation – if this slider is on, the Application EUI will not be
checked for validity, the device will join based only on the Application Key and an
Application EUI will be generated.
Activation
Once you have properly configure the parameters of the device mentioned above you
should see the data in the following picture (Activation tab):
Figure 20 | Device Activation

RAK7249/58
22
RAK LoRaWAN Industrial Gateway Configuration Guide
Device Address - The field is generated automatically and displays the address assigned to
the node. This is how you distinguish devices in the LoRa Packet Logger.
Application session key – The key assigned to the device upon OTAA Activation, or the one
input manually if ABP is used..
Network session key – Same as for the Application Session Key.
Uplink frame-counter – The number of messages that have been received by the Gateway
since the device activation.
Downlink frame-counter – The number of messages the Gateway has sent to the node.
Clear frame-counter – you can clear the frame counter and reset it to 0 with this button.
Downlink
This is where you can simulate a Downlink frame, a feature especially useful for testing. You
have the following parameter choices:
Confirmed – this slider determines if the packet will request an Acknowledgement to be send
for confirmation.
FPort – the number of the Frame Port that will be used for the frame.
HEX Bytes – the actual data to be send in HEX format.
Figure 20 | Device Downlink frame

RAK7249/58
23
RAK LoRaWAN Industrial Gateway Configuration Guide
Live Device Data
You can see the packets for the selected devices in real time in this section.
Figure 21 | Live Device Data
3.4.4 Global Integration
This feature allows for integration of the Built-in LoRa Application Server with an External
MQTT broker.
Figure 22 | LoRa Server Global Integration

RAK7249/58
24
RAK LoRaWAN Industrial Gateway Configuration Guide
General Setup
The configuration is very similar to the LoRa Gateway MQTT Bridge as can be seen below:
MQTT Broker Address:
The IP Address where the MQTT Broker is hosted.
MQTT Broker Port:
The corresponding port.
Client ID:
The user can input a custom Client ID (Will be reflected in the MQTT Broker data).
Clean Session:
If this slider is in the on position, every new connection to the MQTT Broker will open a new
session. All meta-data from previous one will be removed.
Will Retain:
This slider determines if the published messages from a client will be retained.
Qos:
You can pick one of several options here: Almost Once, Atleast Once, Exactly Once
Enable Authentication:
The switch turns on Encryption of the transmitted data. You need to configure the
Certificates used to encrypt the data in order for secure authentication to be performed.
TLS Version:
The version of the TLS protocol to be used. Options are TLSv1, TLSv1.1, TLSv1.2
Username/Password:
Credentials the MQTT Bridge is to use for connecting to the LoRa Server instance
CA Certificate, TLS Certificate, TLS Key:
Those are to be generated via the appropriate algorithm and distributed between the MQTT
Broker and the LoRa Server.
Please refer to the MQTT Bridge with TLS Encryption Configuration Manual for details on
how to edit the settings in order for the Gateway to work as an MQTT Bridge with TLS
Encryption.
MQTT Topic Template Setup

RAK7249/58
25
RAK LoRaWAN Industrial Gateway Configuration Guide
Here you can get information on the topic templates: Join Topic, Uplink Topic, Downlink
Topic, Ack Topic, Downlink Topic (status). Unlike the MQTT Bridge those are all application
topics.
Figure 23 | Live Device Data
3.5 Services
As of now the OpenVPN Service is the only one implemented. This allows a Virtual Private
Network access to be set-up. You can configure a number of different client/server
configurations with their corresponding IP Addresses and Port.
Figure 23 | OpenVPN Page

RAK7249/58
26
RAK LoRaWAN Industrial Gateway Configuration Guide
System
3.6
This is the place where you configure general device parameters.
3.5.1 System
General Settings
The system time is displayed here. Additionally you can edit the Host Name and select the
Time zone.
Another way to get the correct time is to use Timing Synchronization. You can Enable NTP
client mode, enable NTP server and provide server candidate URLs.
Note that the Time Synchronization tab is displayed in all System submenus.
Logging
In case you want to keep a log of system events you can configure how this is done here:
You can set the Buffer size, provide the IP Address and port of an External log server, and
set the Log Level.
Language
By default, this is in Auto (English), however you can choose from several options including
German, Spanish, Russian, etc.
Figure 24 | System configuration options

RAK7249/58
27
RAK LoRaWAN Industrial Gateway Configuration Guide
3.5.2 Administration
This is where you change the administration password of the device.
Figure 25 | Username and Password
Backup / Flash Firmware
3.5.3
Generate archive – downloads an archive of the current configuration
Perform reset – resets the Gateway to the default settings
Restore – you can upload a previously generated archive to restore the configuration
settings at the time of its making
Flash new firmware – update the firmware by flashing a bin file. Use the button to select the
location of the new firmware file and the blue button to initiate the flashing process. There is
a tick box to toggle the option of keeping the current settings of the gateway.
Note it is selected by default as unchecking it will results in having a gateway with stock
settings after the firmware update.
Figure 26 | OBackup / Flash Firmware and Recovery

RAK7249/58
28
RAK LoRaWAN Industrial Gateway Configuration Guide
3.5.4 Reboot
Reboots the gateway. All unsaved changes will be discarded. This is not a reset in any way
and only power cycles the device. All configuration settings will be left intact.
Figure 27 | Gateway Reboot
File Browser
3.5.1
You can explore the file tree and download the system log files via this page:
Figure 28 | File Browser

RAK7249/58
29
RAK LoRaWAN Industrial Gateway Configuration Guide
SD card Backup and packet recovery
3.7
Finally there is the functionality to buff packets on the SD card (provided one is inserted) in
case of LoRa Network Server outage. The stored packets will be forwarded 8 at a time
(FIFO), as soon as the connection is restored.
The red colored frames are the ones being pushed to the buffer as there is an outage. The
green colored ones are being redirected as the connection ahs been restored. Thus no
packets were lost, even though the backhaul connection was unavailable for a time.
Figure 29 | Buffering and Pushing of packets in an outage

RAK7249/58
30
RAK LoRaWAN Industrial Gateway Configuration Guide
4 Contact Information
Please contact us if you need technical support or want to know more information.
Support center: https://forum.rakwireless.com/
Email us: info@rakwireless.com

RAK7249/58
31
RAK LoRaWAN Industrial Gateway Configuration Guide
5 Revision History
Revision
Description
Date
1.0
Initial Release
2019-04-02
1.1
Add the LoRa Gateway MQTT Bridge Configuration
2019-04-03
1.2
Add Customize the Channel and MQTT Bridge Chapter
2019-04-23
1.3
Add LoRa Network Server Chapter. Remove Frequency
channel settings and MQTT Bridge Chapter (will be in
separate documents)
2019-05-31
1.4
Addition of new features set
2019-06-16
1.5
Features update for new Firmware r176
2019-07-26
Prepared by
Checked by
Approved by
Penn, Vladislav
Penn
About RAKwireless:
RAKwireless is the pioneer in providing innovative and diverse cellular and LoRa
connectivity solutions for IoT edge devices. It's easy and modular design can be used in
different IoT applications and accelerate time-to-market. For more information, please
visit RAKwireless website at www.rakwireless.com.
6 Document Summary
 Loading...