

Page 1

®
Model 801GC, 801GF & 801GX
Portable Video Signal Generators
Owner's and
Programmer's
Manual
Page 2

Thank you for considering our product.
At Quantum Data, we are committed to providing you with innovative
products and superior customer service. If something doesn't seem right or
you see an opportunity that we haven't addressed, please let us know.
Helping our customer's solve their problems is what we do best.
®
2111 Big Timber Road
Elgin, IL 60123-1100 USA
Phone: (847) 888-0450
Fax: (847) 888-2802
BBS: (847) 888-0115
[≤19.2KB, 8-N-1 protocol]
Please note that on January 20, 1996 our
phone, fax and BBS area codes changed
from 708 to 847.
Internet Connections
World Wide Web Site:
http://www.quantumdata.com
Sales & Service E-mail:
sales@quantumdata.com
Technical Support E-mail:
support@quantumdata.com
Copyright ©1996 Quantum Data Corp.
All rights reserved. The information contained in this document is provided for
use by our customers and may not be incorporated into other products or publications without the expressed written consent of Quantum Data.
Quantum Data reserves the right to make changes to its products to improve
performance, reliability, producibility, and (or) marketability.
Information furnished by Quantum Data is believed to be accurate and reliable.
However, no responsibility is assumed by Quantum Data for its use.
Page 3
To quickly find
information on the
topics shown on the
right, just match the
black bars with the
black markers on
the edges of the
pages in the
manual.
Table of Contents
1. Introduction
2. Basic Operation
3. Built-In Formats
4. Built-In Images
5. Making Connections
For more
information on the
contents of each
chapter, please
refer to the table of
contents starting on
the next page.
To locate
information on a
specific subject,
please refer to the
index at the end of
this manual.
Model 801GC, 801GF & 801GX
OwnerÕs & Programmers Manual
Part# 68-00157 (rev. A 21-Feb-96)
6. Programming
7. Troubleshooting
8. Error Messages
9. Maintenance
9. Service
Appendices
Index
Table of Contents
i
Page 4

Trademark Acknowledgments:
Quantum Data is a registered trademark of Quantum Data Corporation.
IBM is a registered trademark of International Business Machines Corporation.
Macintosh and Apple are registered trademarks of Apple Computer, Inc.
Microsoft and MS-DOS are registered trademarks of Microsoft Corporation.
MultiSync is a registered trademark of NEC Home Electronics, Inc.
Radio Shack is a registered trademark of Tandy Corporation.
Other products or company names mentioned are registered trademarks or trade-
marks of their respective companies.
ii Table of Contents
Models 801GC, 801GF & 801GX ¥ Rev. A
Page 5

Chapter 1: Introduction 1-1
Features ..................................................... 1-2
Product Overview ..................................... 1-3
Formats ................................................. 1-3
Images ................................................... 1-3
Controls ................................................. 1-3
Connectors ............................................ 1-4
Chapter 2: Basic Operation 2-1
Introduction ............................................... 2-2
Operating Modes ...................................... 2-2
Front panel operation ............................ 2-2
Normal Format and Images Selection Mode
2-2
Test Sequence Mode ............................ 2-3
Switching operating modes ................... 2-3
Programming Mode ............................... 2-3
Displays and Indicators (Normal Mode) . 2-4
Knobs ......................................................... 2-5
Format Knob in Normal Mode ............... 2-5
Format Knob in Other Modes ................ 2-5
Image Knob in Normal Mode ................. 2-5
Image Looping in Normal Mode ............ 2-6
Image Knob in Other Modes ................. 2-6
Table of Contents
iii
Page 6

Switches .................................................... 2-7
AC Select .............................................. 2-7
Power Switch ......................................... 2-7
Buttons ...................................................... 2-8
Image Button ......................................... 2-8
Video Gate Buttons ............................... 2-9
Analog Monochrome Operation ............ 2-9
Sync Gate Buttons .............................. 2-10
Outputs Button .................................... 2-10
Chapter 3: Built-In Formats 3-1
Introduction ............................................... 3-2
Explanation of Terms Used in Charts .... 3-3
Built-in Formats ........................................ 3-4
Chapter 4: Built-In Images 5-1
Introduction ............................................... 5-2
Descriptions of the Images ..................... 5-4
Acer1 ..................................................... 5-4
Acer2 ..................................................... 5-4
Acer3, Acer4, Acer5 and Acer6 ............ 5-4
Acer7 and Acer 8 ................................... 5-4
Acer9 ..................................................... 5-4
iv Table of Contents
Models 801GC, 801GF & 801GX¥Rev. A
Page 7

BLU_EM, GRN_EM, RED_EM, WHT_EM,
MEMESony, MESony_B, MESony_G, and
MESony_R ............................................ 5-5
BLU_EM+, GRN_EM+, RED_EM+,
WHT_EM+, MEMEPlus, MEPlus_B,
MEPlus_G, and MEPlus_R ................... 5-6
BLU_PIC, GRAY_PIC, GRN_PIC, RED_PIC,
WHT_PIC, Flat, Flat Gray, Flat_B, Flat_G,
and Flat_R ............................................. 5-7
Box_50mm and Box_64mm .................. 5-9
BriteBox ............................................... 5-10
Burst.............................................................
5-12
Check511 ............................................ 5-13
CheckBy3 ............................................ 5-14
Check_11 ............................................ 5-15
CirclesL ............................................... 5-16
CirclesS ............................................... 5-17
ColorBar .............................................. 5-18
Cubes .................................................. 5-19
Custom ................................................ 5-20
Dot_10, Dot_12, Dot_24 ...................... 5-21
EMITest1 ............................................. 5-23
EMITest2 ............................................. 5-23
EMITest3 ............................................. 5-23
EMITest4 ............................................. 5-23
Focus_@6, Focus_@7, Focus_@8 .... 5-24
Focus_Cx ............................................ 5-25
Focus_H .............................................. 5-26
Table of Contents
v
Page 8

Focus_Oo ............................................ 5-27
Format ................................................. 5-28
GrayBar ............................................... 5-29
Grill_11, Grill_22, Grill_33, Grill_44 ..... 5-30
Hatch_10i, Hatch_10o, Hatch_12i,
Hatch_12o, Hatch_24i, Hatch_24o,
Hatch_24s, Hatch_G, Hatch_M, GRN_HTCH,
and MAGENTA .................................... 5-31
Hatch4x3, Hatch5x4 and Hatch8x8 ..... 5-33
Hatch64W ............................................ 5-34
Hitachi1 ............................................... 5-35
KanjiKan .............................................. 5-36
Linearty(Linearity) ................................ 5-37
LinFocus .............................................. 5-39
Outline0 and Outline1 .......................... 5-41
P1 ........................................................ 5-46
P2 ........................................................ 5-46
P3 ........................................................ 5-46
P4 ........................................................ 5-46
P5 ........................................................ 5-46
P6 ........................................................ 5-46
P7 ........................................................ 5-46
P8 ........................................................ 5-46
Persist ................................................. 5-47
PulseBar .............................................. 5-49
QuartBox ............................................. 5-50
Ramp ................................................... 5-51
Raster .................................................. 5-52
vi Table of Contents
Models 801GC, 801GF & 801GX¥Rev. A
Page 9

Regulate .............................................. 5-53
Samsung1 ........................................... 5-54
Samsung2 ........................................... 5-54
SlideG .................................................. 5-54
SlideRGB ............................................. 5-54
SMPTE133 .......................................... 5-55
SMPTEbar ........................................... 5-61
Stairs20 ............................................... 5-66
Strokes0, Strokes1 .............................. 5-67
Text_9, Text_16 .................................. 5-68
Text_9 ................................................. 5-68
TVBar100 & TVBar_75 ........................ 5-70
TVHatch .............................................. 5-73
Chapter 5: Making Connections 5-1
Line Voltage Selector ............................... 5-2
Selecting a line voltage. ........................ 5-2
Fuse Requirements .................................. 5-3
AC Power Connection .............................. 5-3
Display Connection .................................. 5-4
D-Sub Output Connectors ..................... 5-4
BNC Output Connectors ........................ 5-6
S-VIDEO Connector (801GX Only) ....... 5-6
Display Codes ........................................... 5-6
What is a Display Code? ....................... 5-6
Table of Contents
vii
Page 10

Checking a Display Code ...................... 5-7
SUN Display Codes ............................... 5-8
IBM VGA Display Codes ....................... 5-8
Apple Macintosh Display Codes ............ 5-8
External Programming Connections ..... 5-9
Serial Port Connection ............................. 5-9
PC / Terminal Wiring ........................... 5-11
Apple Macintosh Wiring ....................... 5-12
IEEE-488 (GPIB) Port Connection ......... 5-13
Chapter 6: Programming 6-1
Programming Capabilities Overview ...... 6-2
Editing and adding signal formats ......... 6-2
Editing the format knob directory ........... 6-2
Creating custom test images ................. 6-3
Editing the image knob directory ........... 6-3
Creating a test sequence ...................... 6-3
Setting system parameters .................... 6-4
ProgrammerÕs utility disk ....................... 6-5
Operating via remote control .................. 6-6
Using the Built-In Editors ........................ 6-7
Format Editor ............................................ 6-9
Knob Functions ..................................... 6-9
Format Knob Directory Editor ............... 6-19
viii Table of Contents
Models 801GC, 801GF & 801GX¥Rev. A
Page 11

Image Knob Directory Editor ................. 6-21
Custom Image Editor ............................. 6-24
What is a Sequence? ............................. 6-35
Sequence Knob Directory Editor .......... 6-36
Sequence Editor ..................................... 6-38
Running a Sequence .............................. 6-41
Cancelling the Sequence Mode ............ 6-42
Creating your own format file ............... 6-43
Entering the format parameters ........... 6-43
ANALOG_3.CMD Listing ..................... 6-44
Analog Video and Sync Parameters ... 6-45
Digital Video Parameters ..................... 6-48
Digital Sync Parameters ...................... 6-49
Timing Parameters .............................. 6-50
Calculated Rates ................................. 6-55
Active Video Physical Size .................. 6-56
Display Codes ..................................... 6-56
Outputs Control ................................... 6-57
Downloading formats using a DOS- compat-
ible computer ....................................... 6-60
Controlling via the Serial Port ............... 6-61
Controlling via the IEEE-488 Port ......... 6-62
Input Buffer .......................................... 6-62
Table of Contents
ix
Page 12

Message Syntax .................................. 6-63
Commands .......................................... 6-63
Queries ............................................... 6-64
Output Queue ...................................... 6-64
Buffer Deadlock ................................... 6-65
The Status Byte .................................. 6-65
Requesting Service ............................. 6-65
Remote/Local Operation ..................... 6-66
IEEE-488 Status Reporting: ................................................. 6-67
Bus Commands ................................... 6-69
Common Commands .......................... 6-69
Command Language .............................. 6-75
Command and Query Finder ................. 6-75
Format Parameter Settings ................... 6-76
Format Editor Control ............................ 6-77
Format Memory Management ............... 6-78
Custom Image Primitives ...................... 6-79
Image Editor Control .............................. 6-82
Image Memory Management ................. 6-82
Sequence Editor Control ....................... 6-82
Sequence Memory Management ........... 6-83
Sequence Parameter Settings ............... 6-83
x Table of Contents
Models 801GC, 801GF & 801GX¥Rev. A
Page 13

Directory Editor Control ........................ 6-83
Directory Memory Management ............ 6-84
System Parameter Settings ................... 6-84
Miscellaneous System Parameters ...... 6-85
Direct Processor Control (Reserved) ... 6-85
Alphabetical Listing of Commands ..................... 6-86
801G Memory (Information) Flow Diagram
6-177
Chapter 7: Troubleshooting 7-1
Power-on ................................................... 7-2
Normal power-on ................................... 7-2
Power-on message remains .................. 7-2
Error message at power-on ................... 7-3
Unit will not power-on ............................ 7-3
Computer Interfacing ............................... 7-3
If All Else Fails .......................................... 7-4
Chapter 8:Error Messages 8-1
System Errors ........................................... 8-2
Power-on Self Test Messages .............. 8-2
Power Fail Message .............................. 8-4
Table of Contents
xi
Page 14

Format Errors ............................................ 8-4
Invalid Data Error Messages ................. 8-4
Corrupt Data Error Messages ............... 8-5
System Error Message Summary ........... 8-6
Format Error Messages ........................... 8-7
Chapter 9: Service 9-1
New Product Warranty ............................. 9-2
User Registration Card ............................ 9-2
Product Updates ....................................... 9-3
Service Agreements ................................. 9-3
In the U.S.A. .......................................... 9-3
In Europe ............................................... 9-4
Getting Your 801G* Repaired .................. 9-4
Authorized Service Centers .................... 9-4
Returning the 801G* .............................. 9-4
xii Table of Contents
Models 801GC, 801GF & 801GX¥Rev. A
Page 15

Appendix A:Specifications 11-1
Model 801GC, 801GF and 801GX Specifica-
tions .................................................... 11-2
Additional Model 801GC and 801GX Specifi-
cations ................................................ 11-4
Additional Model 801GF Specifications 11-5
Index
Table of Contents
xiii
Page 16

Notes:
xiv Table of Contents
Models 801GC, 801GF & 801GX¥Rev. A
Page 17

Chapter 1: Introduction
Features
Product Overview
1-1
Page 18
Features
✓ low cost
✓ portable - fits in a briefcase
✓ ultra-simple controls
✓ ultra-fast format-loading & image-drawing
✓ color NTSC and PAL compatible composite and
S-video outputs on the 801GX
✓ self calibrating analog video outputs
✓ industry-standard output connectors
✓ display and edit formats on the unit under test
✓
over 100 industry-standard signal formats built-in
✓ room for up to 300 user-defined formats
✓ programmable pixel rates up to 150 MHz on the
801GC and 801GX; up to 250 MHz on the 801GF
✓ over 50 test images built-in
✓ custom test images can be created and saved
✓ user defined format-image test sequencing
1-2 Chapter 1: Introduction
Model 801GC, 801GF & 801GX ¥ Rev. A
Page 19

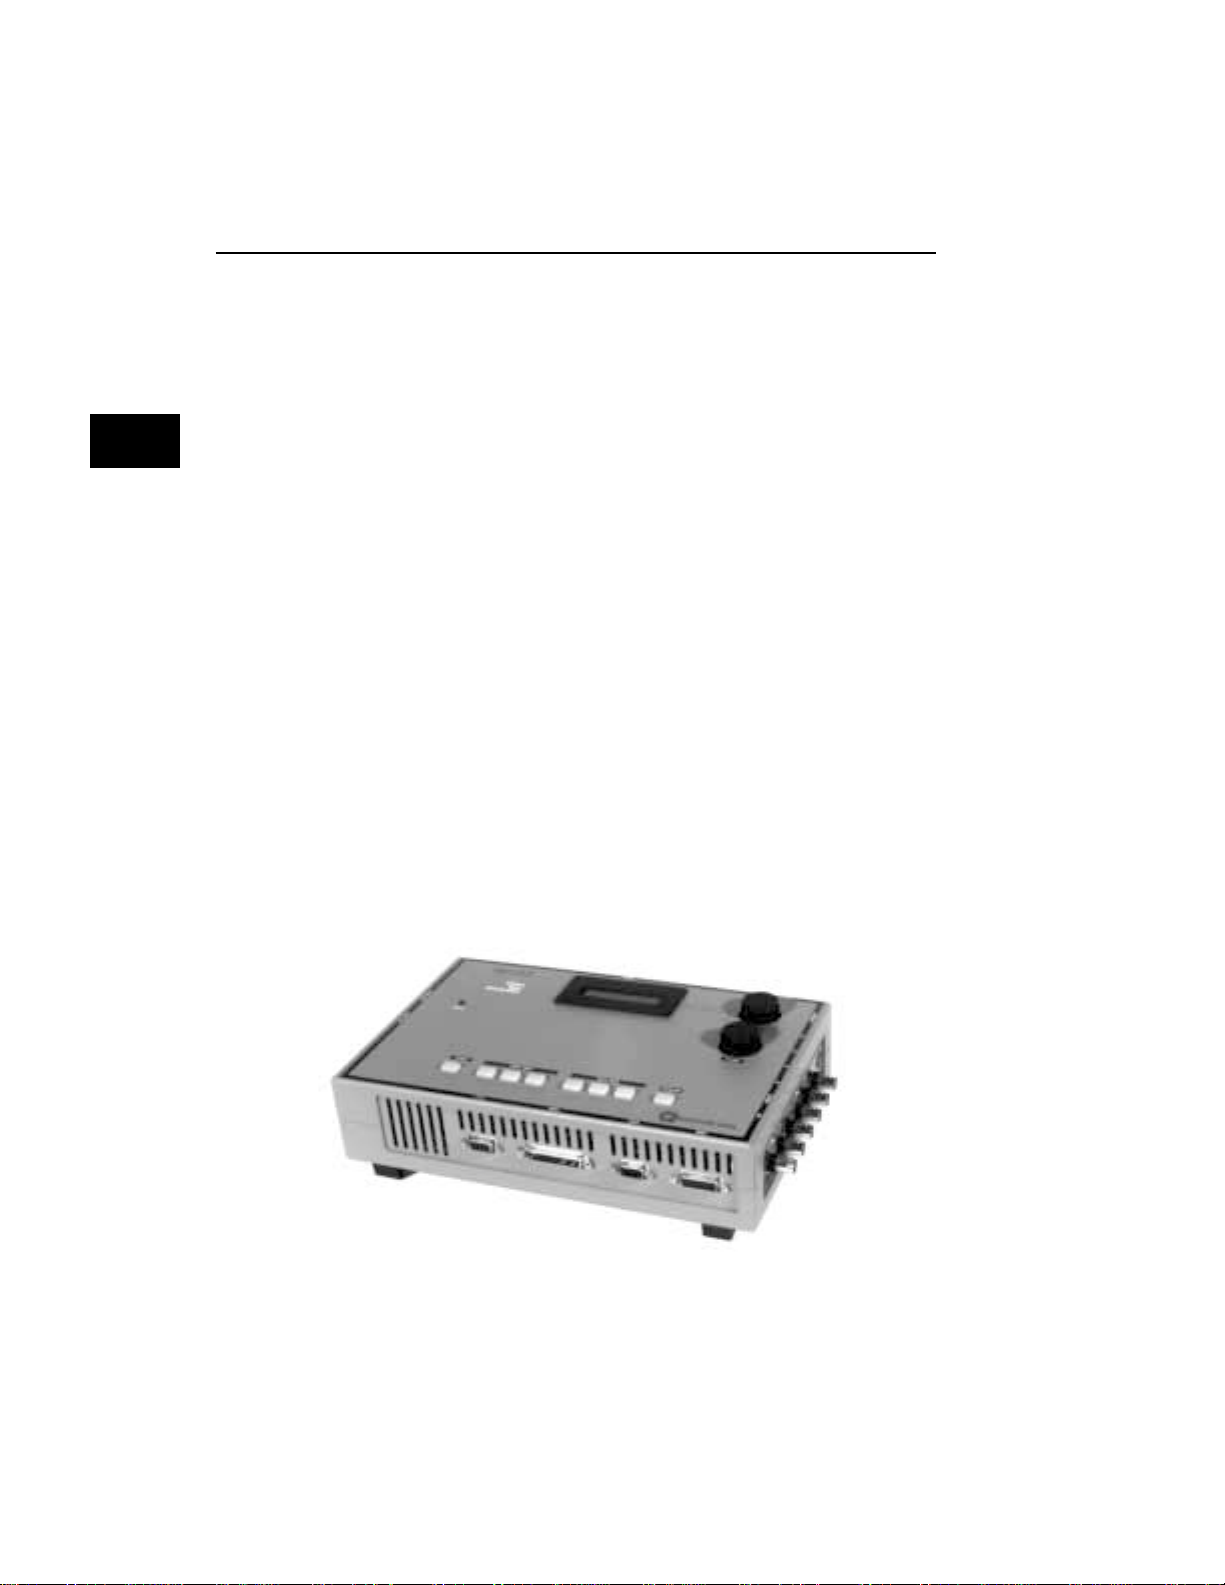
Product Overview
The 801G series are low-cost portable video signal
generators designed for basic testing and alignment
of various types of raster-scanned displays. This
manual covers the 801GC, 801GF and 801GX models. Information that mentions the “801G*” applies
to all three models.
Formats
A format is a set of
specifications that
describe the video
signal required by a
particular type of
display.
Images
Controls
The generator is shipped with over 100 signal formats in place for driving a variety of industry-standard displays. Formats for other displays can be
added using the built-in graphics user interface editor
or a personal computer or terminal via the built-in
RS-232 and IEEE-448 interfaces.
Formats are stored in a non-volatile memory. This
memory has room for up to 300 formats. Permanent
copies of industry-standard formats are stored (along
with the generator's operating code) in EPROM and
can be copied into format memory and modified as
required.
The 801G* features over 50 test images that allow a
wide variety of display criteria to be checked. The
generator has an image loop feature that can be used
for monitor burn-in or at trade shows to display a
series of images over and over. User defined custom test images can also be created and saved in
non-volatile memory.
The number of controls on the 801G* has been minimized to insure simple operation. Two knobs and 8
lighted push-buttons provide complete control of the
generator. One knob selects the video signal format.
A second selects the test image. Three push-buttons
gate the individual video components on and off.
Another three push-buttons select any of three available synchronizing signals. A seventh button allows
all of the outputs of the generator to be turned on
or off with a single key stoke. Finally, an image
stepping button is provided that calls up alternate
versions of some images.
Product Overview
1-3
Page 20

Connectors
The output connectors on the 801G* match those
found on popular computers and video systems.
These connectors eliminate the need for expensive
and bulky conversion cables.
1-4 Chapter 1: Introduction
Model 801GC, 801GF & 801GX¥Rev. A
Page 21

Chapter 2: Basic Operation
Operating Modes
Displays & Indicators
Knobs
Switches
Buttons
2-1
Page 22

Introduction
Operating Modes
This chapter gives you a basic overview of the
Quantum Data model 801G*’s front panel operating
modes and how the displays and controls function
in the normal operating mode. Other chapters in this
manual cover topics that you may need to know in
order to operate the unit. Please refer to the table of
contents or index to locate additional specific information on how to use the 801G*.
Front panel operation
The current firmware supports three main modes of
front panel operation:
Normal Format
and Images
Selection Mode
2-2 Chapter 2: Basic Operation
• Normal signal format and test image selection.
All knobs and pushbuttons function as labeled.
The upper knob is used to select formats from
a list of formats stored in non-volatile memory.
The lower knob selects test images (patterns)
from a list of built-in and user created images.
This is the factory default setting for how the
generator will operate on normal power-up.
This mode is suitable for use by engineering
and service groups that need to be able to
quickly select any combination of format and
test image that they may need.
It is also possible to set the 801G* to continuously cycle through the test image list using a
given format in this mode. This can be used
for burn-in testing or for running single mode
displays at trade shows.
Model 801GC, 801GF & 801GX ¥ Rev. A
Page 23

Test Sequence
Mode
• Running a user defined test sequence. Each step
in a test sequence combines one format and
one test image. The operator can then go forward and backwards through the steps using
a single knob. The 801G* can be programmed
so that it automatically enters a test sequence
mode on power-up. This mode of operation is
suitable for a test position in a manufacturing
environment where the same series of tests and
adjustments need to be repeated on many identical displays. There is less likelihood that an
operator on the line will select the wrong format or skip an important alignment procedure.
It is also possible to set the 801G* to continuously cycle through the steps in a test sequence.
Information on creating and running test sequences is contained in the “Programming”
chapter.
Programming
Mode
• Programming mode. Formats, the format list,
custom images, the image list and test sequences
can be created and edited using the built-in
Graphics User Interface (GUI). In order to use
the GUI, a display that is compatible with any
stored format and has at least 640 active pixels and 480 active lines needs to be connected
to the 801G*. The contents of the format, custom test image or test sequence are shown on
the display. The 801G*’s knobs and buttons are
used to select and modify the displayed parameters. The current button functions are
labeled at the bottom of the GUI screen. No
other hardware, other than the display, needs
to be connected to the 801GX.
Information on using the GUI editors is in the
“Programming” chapter.
Switching operating modes
The “Programming” chapter contains information on
switching between the operating modes.
Introduction and Operating Modes
2-3
Page 24
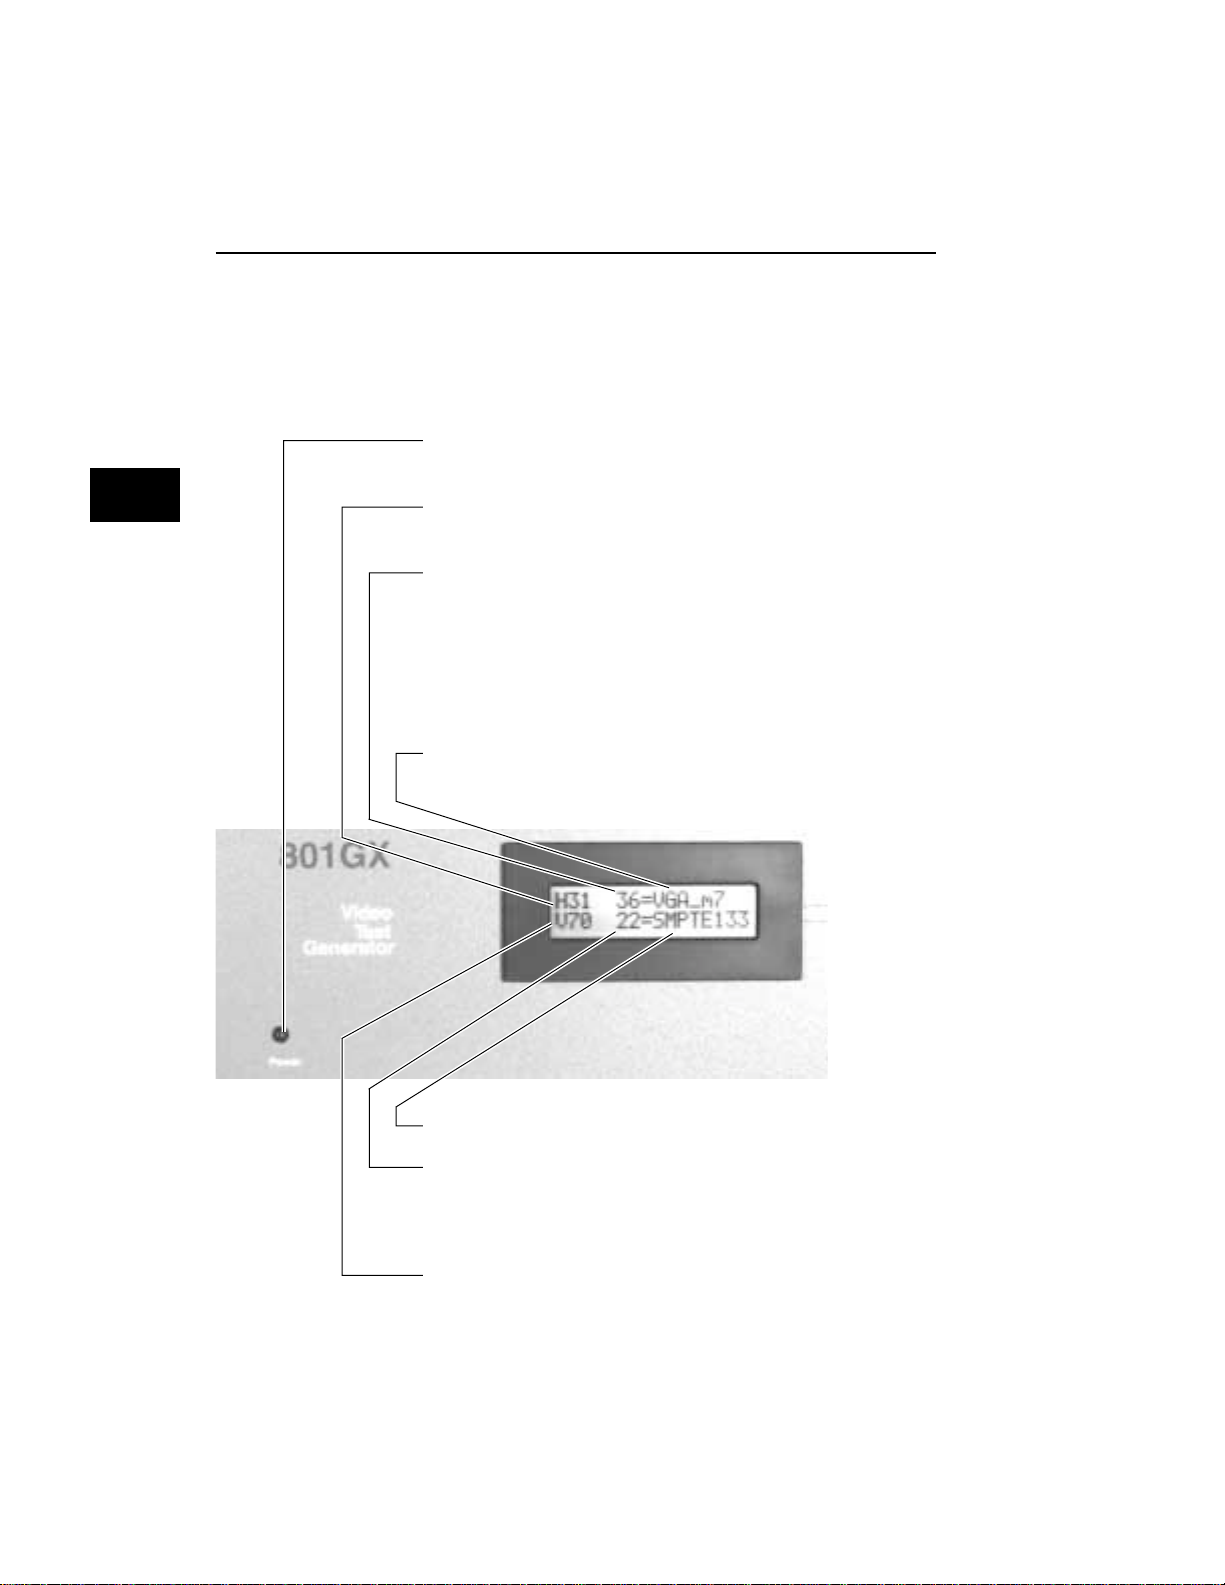
Displays and Indicators (Normal Mode)
The figure below shows a typical LCD display in
the normal operating mode. Please see the “Troubleshooting” chapter of this manual if the LCD is showing different types of information.
This light is on whenever the 801G*; is plugged into
a live AC outlet and the power switch is ON.
The horizontal scanning frequency rounded to the
nearest kHz.
The format’s position on the Format knob list.
❖ A "=" sign appearing between the memory loca-
tion and name indicate the current state and saved
state exactly match. Pressing some keys may
modify the current state so that it no longer
matches the saved version.
The name of the current signal format.
A ( ’ ) mark at end indicates a justified format.
The name of the current test image.
The image’s position on the Image knob list.
❖ An "m" appearing to the left of the image loca-
tion indicates monochrome analog video.
The vertical scanning frequency (field rate) rounded
to the nearest hertz.
2-4 Chapter 2: Basic Operation
Model 801GC, 801GF & 801GX¥Rev. A
Page 25
Knobs
Format Knob in
Normal Mode
Format Knob in
Other Modes
Image Knob in
Normal Mode
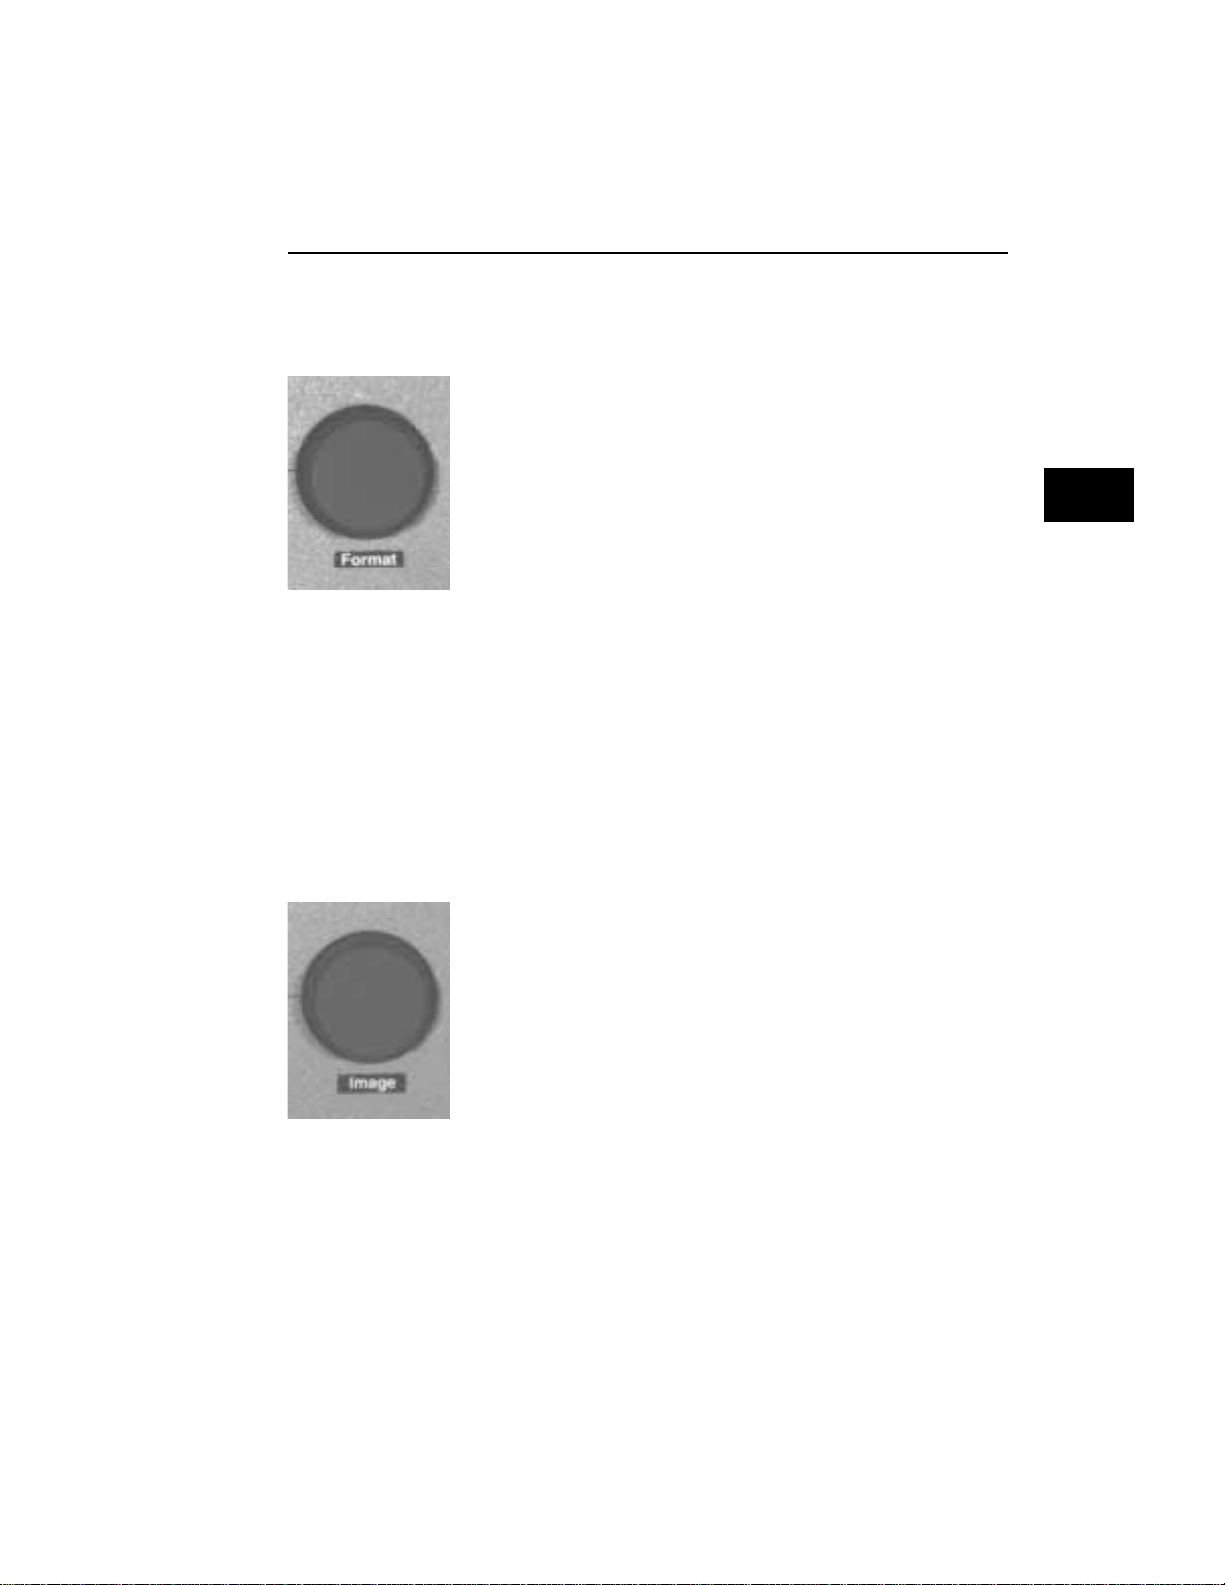
The format knob is normally used to select a signal
format. A format is a set of parameters that specify
the video and sync signal requirements of a particular display. Format parameters include timing,
sync type, video type, display size, etc. By turning
the knob, you can scroll through a list of formats
stored in non-volatile memory. The list includes many
factory default formats. You can edit the list as well
as add formats that you create. A new format is
loaded with each click of the knob. Loading a format redraws the current test image and updates the
LCD. If you select a format containing erroneous
information, the outputs of the generator are automatically turned off and an error message is displayed. The knob performs other functions when
the editors are being used.
The format knob performs other functions when the
801G* is operated in the either the test sequence or
GUI programming modes. Please see the “Programming” chapter for detailed information on operating the 801G* in the other modes.
The image knob is normally used to select a test
image. The exact behavior of the knob depends upon
the status of the “Image” push-button. Turning the
knob when the button is not lit scrolls through the
main list of test images. The knob performs other
functions when the editors are being used.
❖ Not all images are supported by all signal for-
mats. Some images in the main image list may
be skipped while certain formats are present. For
example, the ColorBar image will be skipped
whenever a monochrome format is present. If
the currently selected image cannot be drawn
given a newly selected format, the Outline image is automatically drawn after the new format
has finished loading.
Displays, Indicators & Knobs
2-5
Page 26

Some of the image names in the main list may refer
to a sub-set of two or more different images. The
images in the sub-sets are selected by first selecting
the name of the desired sub-set from the main image list. If the sub-set consists of just two images,
pressing the “Image” button will toggle between the
two images. The button is lit when the second image is showing.
If the sub-list consists of more than two images, the
“Image” button is first lighted by pressing it one
time. The image knob can then be used to select
images from within the sub-set. The image name on
the LCD will not change. Pressing the “Image” button a second time will will return the “Image” knob
to normal operation.
❖ If there is only one test image associated with a
name in the image list, the “Image” button can
not be turned on for that image.
All of the built-in test images (and their uses) are
covered in detail in the “Images” chapter.
Image Looping in
Normal Mode
Image Knob in
Other Modes
2-6 Chapter 2: Basic Operation
• A continuous cycling mode can be selected that
draws images one-after-another in an infinite
loop. This mode is activated by rotating the
image knob clockwise beyond the last image
in the image list about one turn. When activated, the message “Loop Enabled” is displayed
on the unit under test. After a second or two,
the first image in the cycle appears. Turning
the image knob counter-clockwise will stop
image looping.
The image knob performs other functions when the
801G* is operated in the either the test sequence or
programming modes. Please see the “Programming”
chapter for detailed information on operating the
801G* in the other modes.
Model 801GC, 801GF & 801GX¥Rev. A
Page 27
Switches
The 801G* has two switches located on its left side.
Both switches are related to AC power.
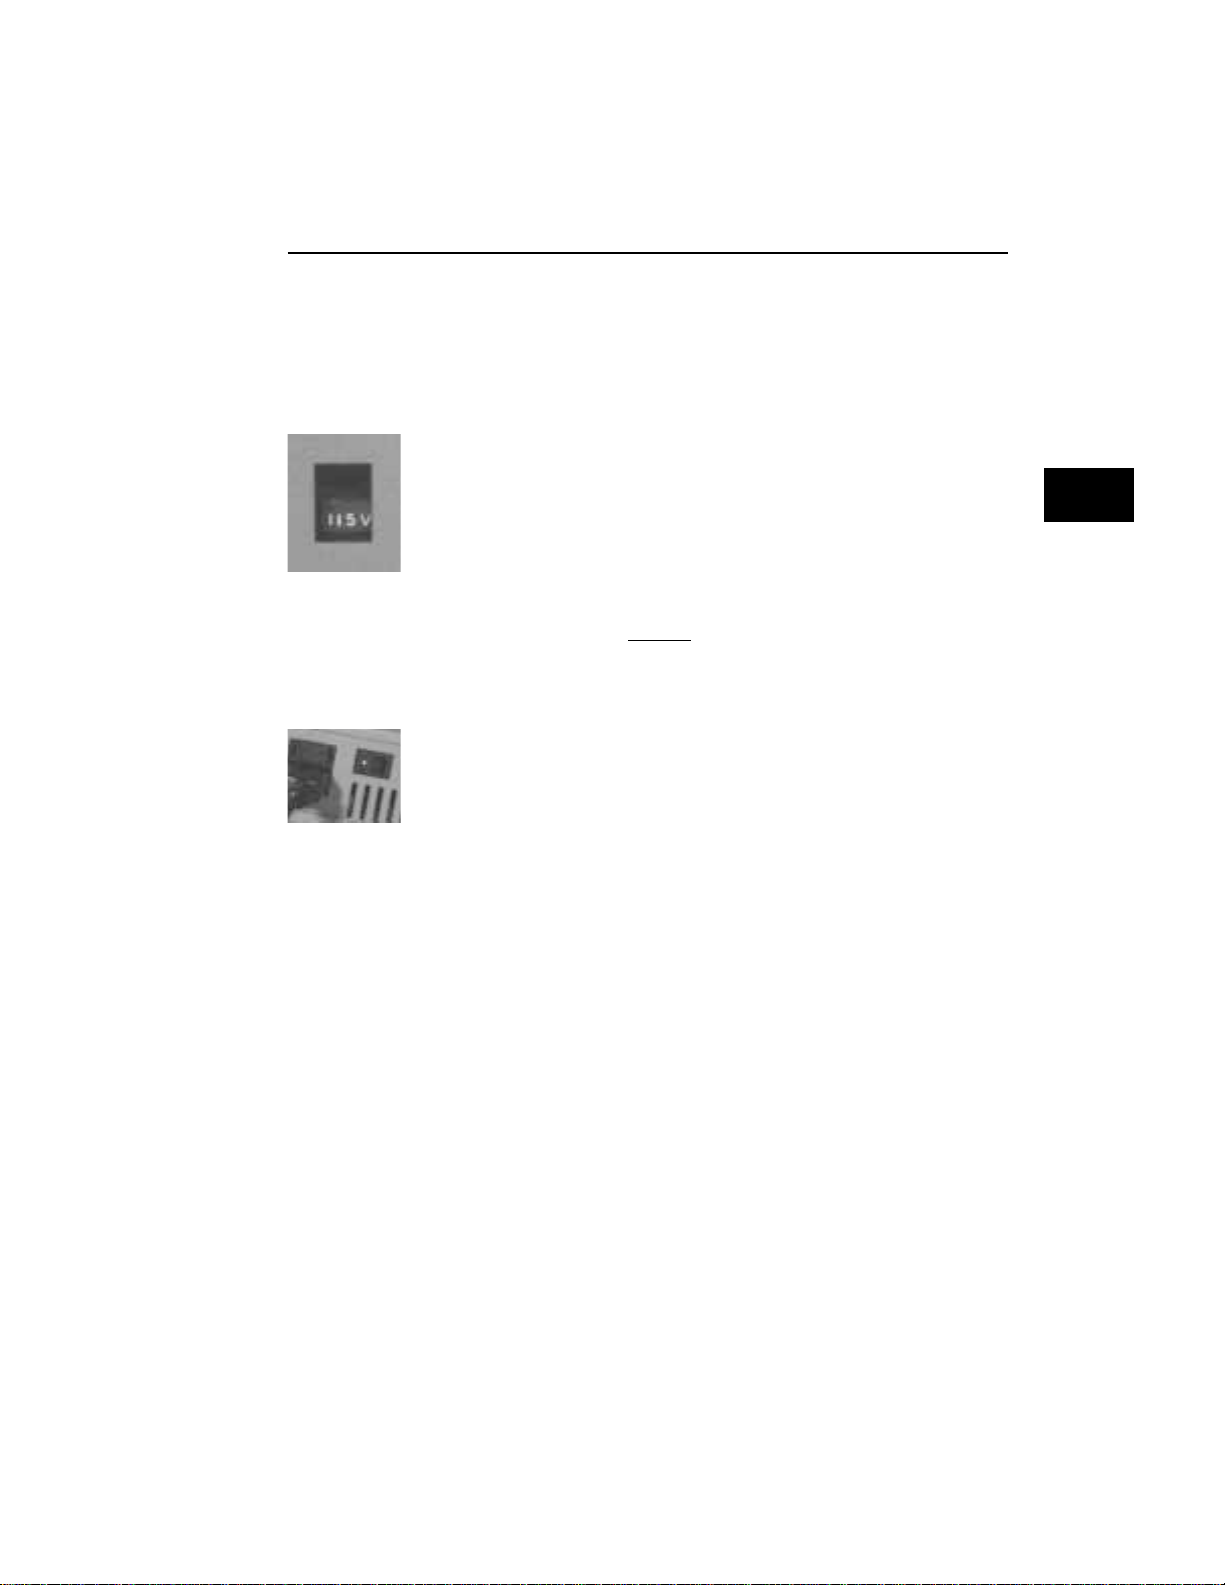
AC Select
This recessed slide switch sets the safe AC line voltage
operating range of the generator. The “Making Connections” chapter of this manual describes the correct procedure for setting this switch
❖ Do not change the voltage selector switch set-
ting while the 801G* is connected to the AC power
line. Make sure that the switch is in the correct
position before plugging in the 801G*.
Power Switch
This rocker switch turns the power on and off. Pressing the side of the switch with the color dot or the
number “1” turns the power on.
❖ CAUTION:Holding down any of the buttons on
the front panel while turning on power may
produce unexpected and extremely undesirable
results. Please see the “Programming” chapter
for information on using special power-up button combinations.
Switches
2-7
Page 28
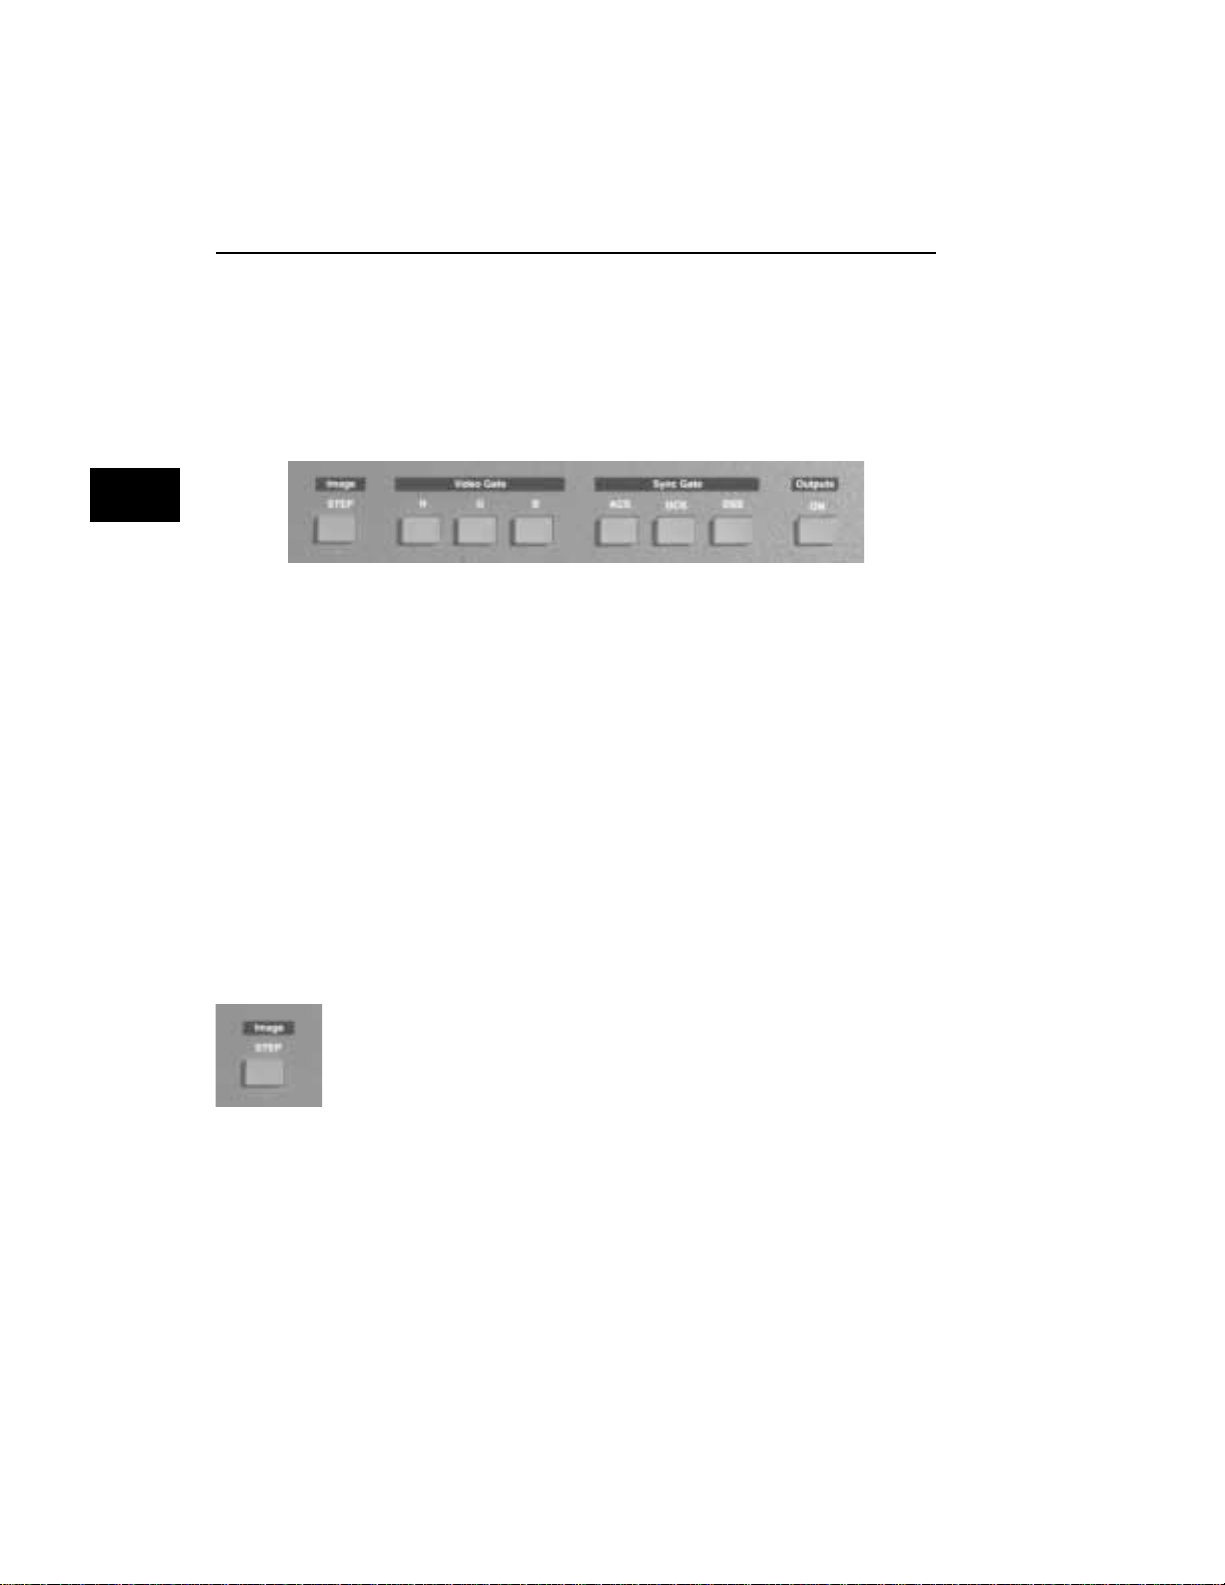
Buttons
The 801G* has a total of eight push-button switches,
arranged into four function groups: Image, Video
Gate, Sync Gate, and Outputs. All of the buttons
have built-in indicators. When illuminated, a button’s
function is considered on (or enabled).
This section of the manual describes the functions
of the buttons when the 801G* is in the normal mode
of operation The buttons are used for other functions when the 801G* is operated in and a test sequence or programming mode. Please see the
“Programming” chapter for detailed information on
operating the 801G* in the other modes.
❖ CAUTION:Holding down any of the buttons on
the front panel while turning on power may
produce unexpected and extremely undesirable
results. Please see the “Programming” chapter
for information on using special power-up button combinations.
Image Button
The Image push-button determines the behavior of
the “Image” knob in the normal operating mode.
Please see an earlier section on the “Image” knob
for information on how the button interacts with
the knob.
❖ If there is only one test image associated with a
name in the image list, the “Image” button can
not be turned on for that image.
2-8 Chapter 2: Basic Operation
Model 801GC, 801GF & 801GX¥Rev. A
Page 29
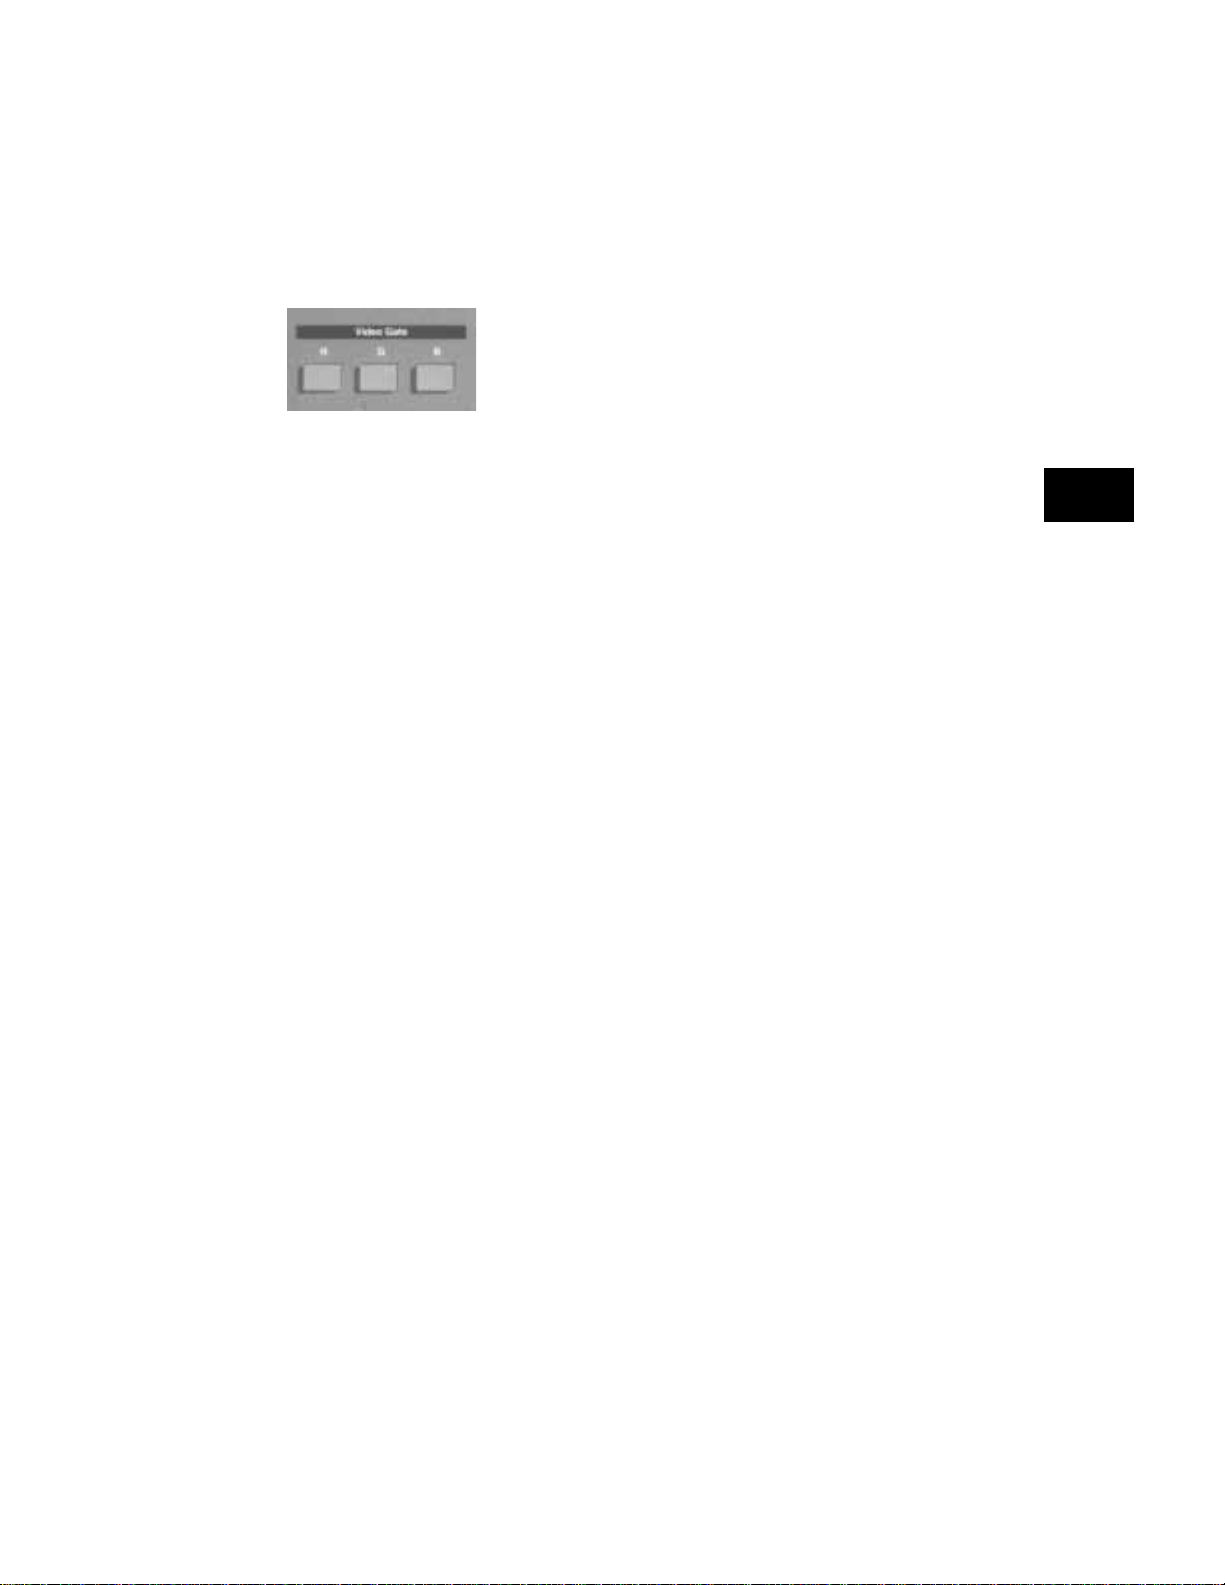
Video Gate Buttons
The Video Gate buttons turn individual color outputs on and off. They also control the adsdition of
primary color information to the NTSC / PAL video
outputs on the 801GX.
• The R push-button turns all of the red video
outputs on and off.
• The G push-button normally turns all of the
green video outputs on and off. When a 2-bit
digital monochrome (MDA) signal is being
generated, the G push-button turns the I (intensity) signal of the video pair on and off.
• The B push-button normally turns all of the
blue video outputs on and off. When a 1 or 2bit digital monochrome signal is being generated, the B push-button turns the V (video)
signal on and off.
❖ The master output gating button overrides the
settings of these buttons when turned off.
Analog
Monochrome
Operation
Many of the built-in analog video signal formats are
stored with the RGB video signal type selected. If
you are testing a monochrome monitor with the same
timing, you can toggle between color and monochrome modes by pressing both R and B push-buttons simultaneously.
❖ An “m” appearing to the left of the image loca-
tion on the LCD window indicates that monochrome analog video has been selected.
2-9
Page 30
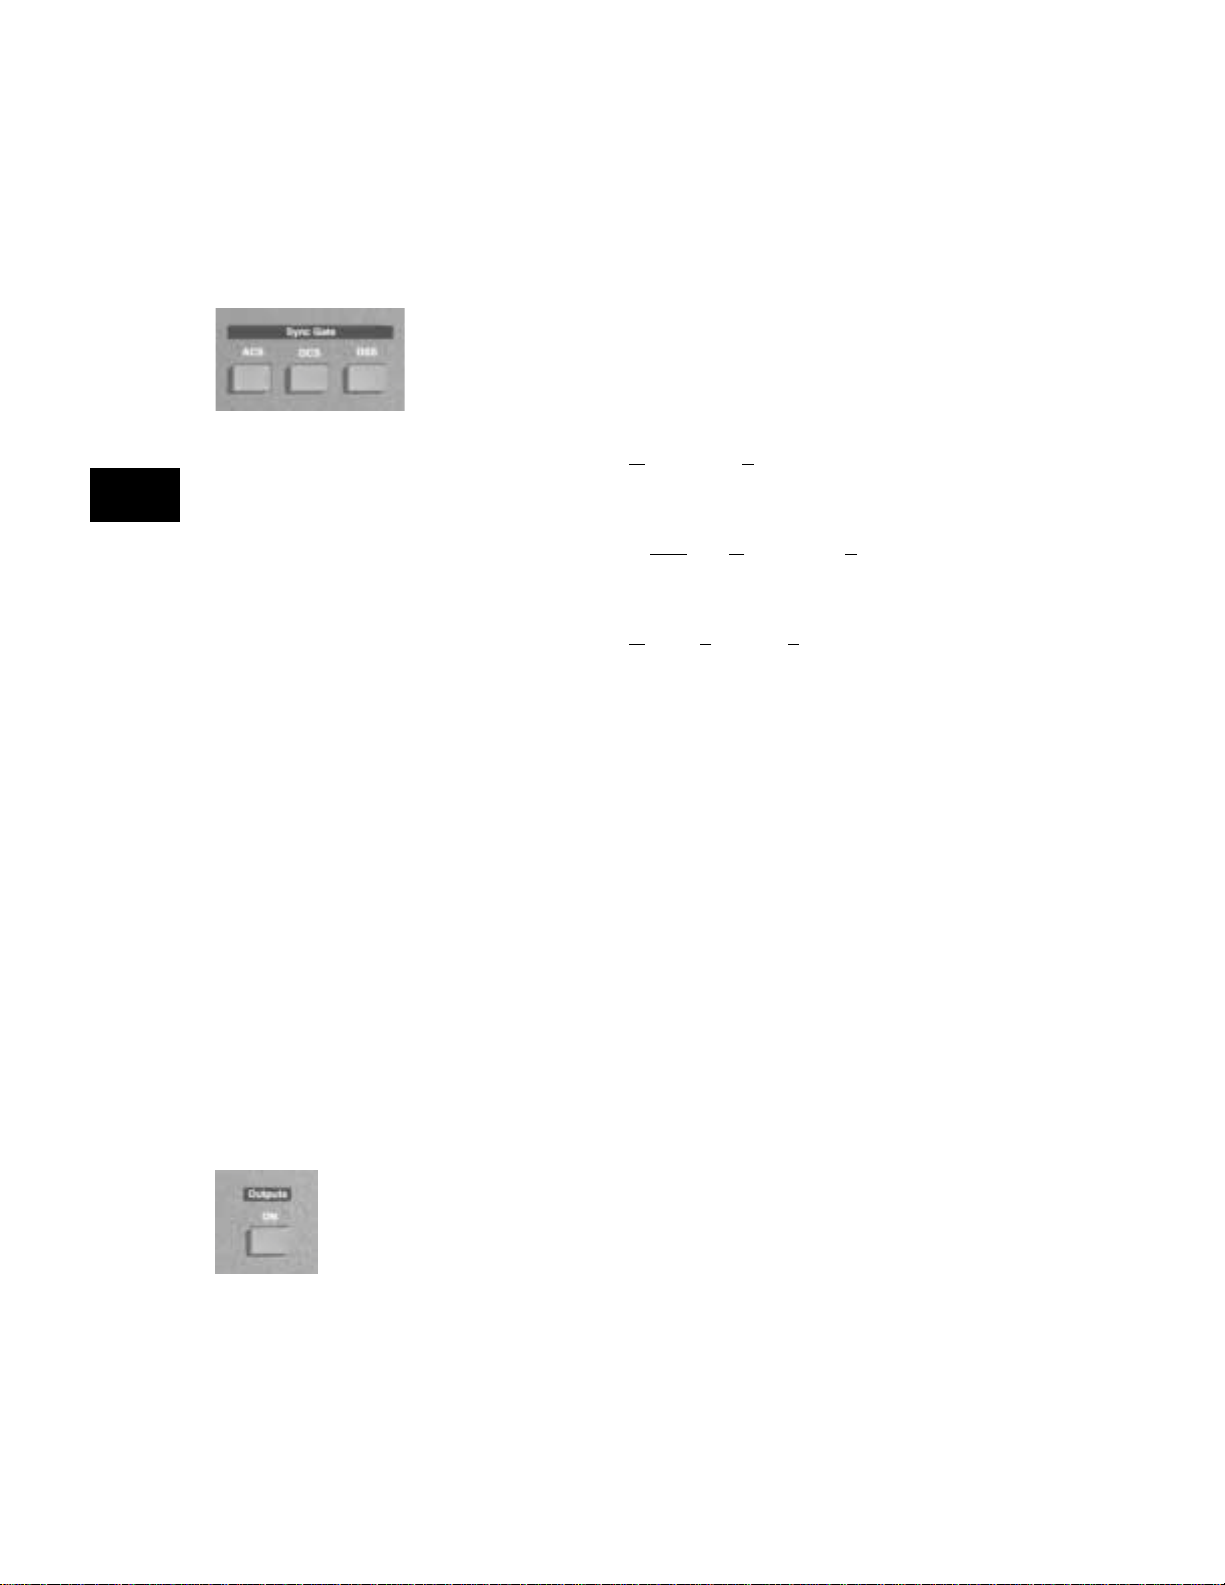
Sync Gate Buttons
The buttons in this group select the type of sync
signal that is used to synchronize the display. Depending on a particular format’s settings, more than
one type of sync can be selected by pressing two
buttons at a time.
• The ACS (Analog Composite Sync) push-button causes analog sync to be output on one or
more of the analog video outputs.
• The DCS (separate Digital Composite Sync)
push-button causes a separate digital composite sync signal (CS) to be output.
• The DSS (separate Digital Separate Sync) pushbutton causes separate digital horizontal and
vertical sync signals to be output.
❖ A default sync type is automatically selected
whenever a new format is selected. Not all sync
types are available with all formats. For example,
digital video formats will not allow analog composite sync to be selected. If a button will not
light up when pressed, then the corresponding
sync type is unavailable.
Re-depressing a sync gate button causes the selected
sync to be toggled either on or off. When toggled
off, no sync will be sent to the display and the display will be allowed to free-run.
❖ The individual settings are overridden (gated off)
whenever the master outputs button is turned
off.
Outputs Button
This is the master output signal control. When the
master output control is turned off, all of the signal
outputs of the generator are disabled.
2-10 Chapter 2: Basic Operation
Model 801GC, 801GF & 801GX¥Rev. A
Page 31

Chapter 3: Built-In Formats
Introduction
Format charts
3-1
Page 32

Introduction
The charts on the following pages list the generator’s
built-in formats library. These are stored in read only
memory (ROM) along with the generator’s operating code. They can be used as starting points for
creating your own formats and new ones can be added
to the nonvolatile RAM. A maximum of 300 formats
can be stored in RAM.
The same format library is used for all models in
the 801G series. Some formats are for displays and
graphics systems that may not be compatible with a
specific generator model. If a format has too high of
a pixel rate, a modified version of the format is placed
in RAM with reduced horizontal timing parameters
that bring the pixel clock rate below the limit of the
generator. The horizontal and vertical rates however are correct. This lets you light-up a display and
verify most of its operation. These modified formats
are created by the memory re-intialization routine.
In other cases the library format may have a video
type or sync type selection that may not be compatible with a specific generator model. Attempting to
load an incompatible format will give you an error
message.
The charts give only a general description of each
format. More detailed information can be obtained
in one of the following ways.
■ You can use the Format test image to display a
detailed list of parameters of any format in
firmware or RAM.
■ You can use the built-in Graphics User Inter-
face to view and edit the contents of any format. Also you can check, modify, and copy
formats with a terminal or computer connected
to a generator’s communications port.
3-2 Chapter 3: Built-In Formats
Model 801GC, 801GF & 801GX ¥ Rev. A
Page 33

The information in the charts is believed to be accurate and complete at the time that this manual was
wrritten. Last minute firmware changes and new
firmware releases may affect the format information stored in EPROM.
Explanation of T erms Used in Charts
File Name Name of the format file as saved in EPROM
Video Type C3 = 3-bit digital color
C4 = 4-bit digital color (CGA)
C6 = 6-bit digital color (EGA)
M2 = 2-bit digital monochrome
RGB = separate red, green and blue analog color
Mono = analog monochrome. EYC = analog color television
(w/subcarrier) / S-video (separate lumi and chroma).
Horiz x Vert Number of active pixels in the horizontal direction and
Active Pixels the number of active scan lines in the vertical direction
NOTE: The number of active pixels shown is for the
original format file as it’s stored in ROM. The firmware
may reduce this number if the original value would cause
the calculated pixel clock rate to exceed the pixel clock
limit for the generator.
Line Rate Horizontal scanning frequency in KHz rounded to 3 places
past the decimal
Frame Rate Picture refresh rate in Hz rounded to 3 places past the
decimal
A bullet (•) after the vertical rate indicates the number is
the frame rate for a 2:1 interlaced format.
3-3
Page 34

Built-in Formats
IBM Digital
AT&T
IBM Analog
File Name
MDA_M7 M2 720 x 350 18.432 49.816
HGC_text M2 720 x 350 18.141 49.030
HGCgraph M2 720 x 348 18.519 50.051
CGA_M14 C4 640 x 200 15.700 59.924
EGA_m2 C6 640 x 350 21.851 59.702
IBM_3179 C3 640 x 400 25.560 60.000
IBM_3164 C3 640 x 400 27.648 64.749
File Name
AT&T_SVC C6 640 x 400 25.862 59.866
AT&T_IVC C6 640 x 400 25.862 59.866
AT&T_EVC C6 640 x 350 25.862 59.866
File Name
PGA_400 RGB 640 x 400 30.296 59.638
PGA_480 RGB 640 x 480 30.296 59.638
VGA_m1 RGB 720 x 350 31.469 70.087
VGA_m2 RGB 720 x 400 31.469 70.087
VGA_m3 RGB 640 x 480 31.469 59.941
VGA_m4 RGB 1024 x 768 35.522 43.478¥
XGA_m4a RGB 1053 x 754 35.414 43.453¥
XGA_m4b RGB 1056 x 768 35.602 43.470¥
XGA_m5 RGB 1024 x 768 56.287 70.008
XGA_m6 RGB 1360 x 1024 56.469 51.476¥
XGA6475 RGB 640 x 480 39.375 75.000
XGA1076 RGB 1024 x 768 61.080 75.782
Video
Type
Video
Type
Video
Type
Horiz x Vert
Active Pixels
Horiz x Vert
Active Pixels
Horiz x Vert
Active Pixels
Line
Rate
Line
Rate
Line
Rate
Frame
Rate
Frame
Rate
Frame
Rate
File Name
IBM Workstation
IBM6Km1 RGB 1024 x 1024 63.360 60.000
IBM6Km2 RGB 1280 x 1024 63.363 60.002
IBM6Km3 RGB 1280 x 1024 70.755 67.003
IBM6Km4 RGB 1280 x 1024 70.755 67.003
3-4 Chapter 3: Built-In Formats
Video
Type
Horiz x Vert
Active Pixels
Line
Rate
Frame
Rate
Model 801GC, 801GF & 801GX¥Rev. A
Page 35

Built-in Formats Ð cont.
VESA
(Video
Electronics
Standards
Association)
File Name
VG900601 RGB 800 x 600 35.156 56.250
VG900602 RGB 800 x 600 37.879 60.317
VS900603 RGB 800 x 600 48.077 72.188
VS901101 RGB 640 x 480 37.861 72.809
VG901101 RGB 1024 x 768 48.363 60.004
VG910801 RGB 1024 x 768 56.476 70.069
DMT6475 RGB 640 x 480 37.500 75.000
DMT648A RGB 640 x 350 37.861 85.080
DMT648B RGB 640 x 400 37.861 85.080
DMT6485 RGB 640 x 480 43.269 85.008
DMT7285 RGB 720 x 400 37.927 85.083
DMT8075 RGB 800 x 600 46.875 75.000
DMT8085 RGB 800 x 600 53.674 85.061
DMT1075 RGB 1024 x 768 60.023 75.029
DMT1085 RGB 1024 x 768 68.677 84.997
DMT1170 RGB 1152 x 864 63.851 70.012
DMT1175 RGB 1152 x 864 67.500 75.000
DMT1185 RGB 1152 x 864 77.094 84.999
DMT1243 RGB 1280 x 1024 46.433 43.436¥
DMT126A RGB 1280 x 960 60.000 60.000
DMT1260 RGB 1280 x 1024 63.981 60.020
DMT127A RGB 1280 x 960 75.000 75.000
DMT1275 RGB 1280 x 1024 79.976 75.025
DMT128A RGB 1280 x 960 85.938 85.002
DMT1285 RGB 1280 x 1024 91.146 85.024
DMT1648 RGB 1600 x 1200 62.500 48.040¥
DMT1660 RGB 1600 x 1200 75.000 60.000
DMT1665 RGB 1600 x 1200 81.250 65.000
DMT1670 RGB 1600 x 1200 87.500 70.000
DMT1675 RGB 1600 x 1200 93.750 75.000
DMT1680 RGB 1600 x 1200 100.000 80.000
DMT1685 RGB 1600 x 1200 106.259 85.000
Video
Type
Horiz x Vert
Active Pixels
Line
Rate
Frame
Rate
3-5
Page 36

Built-in Formats Ð cont.
Macintosh
Japanese NEC
Sun
Microsystems
Workstation
File Name
MAC_TVus RGB 640 x 480 15.734 29.970¥
MAC_TVos RGB 512 x 384 15.734 29.970¥
MAC_12m Mono 512 x 384 24.480 60.147
MAC_12c RGB 512 x 384 24.480 60.147
MAC_12ce RGB 560 x 384 24.480 60.147
MAC_13LC RGB 640 x 480 34.975 66.619
MAC_13m Mono 640 x 480 35.000 66.667
MAC_13c RGB 640 x 480 35.000 66.667
MAC_15 Mono 640 x 870 68.850 75.000
MAC_16 RGB 832 x 624 49.107 75.087
MAC_1960 RGB 1024 x 768 48.193 59.278
MAC_19 RGB 1024 x 768 60.241 74.927
MAC_21 RGB 1152 x 870 68.681 75.062
File Name
NECPC400 RGB 640 x 400 24.823 56.416
NECPC750 RGB 1120 x 750 32.857 40.021¥
File Name
SUN1061 RGB 1024 x 1024 65.267 61.399
SUN1077 RGB 1024 x 768 62.040 77.069
SUN1166 RGB 1152 x 900 61.796 65.950
SUN116B RGB 1152 x 900 61.846 66.004
SUN1176 RGB 1152 x 900 71.713 76.047
SUN117B RGB 1152 x 900 71.809 76.149
SUN1267 RGB 1280 x 1024 71.722 66.718
SUN126B RGB 1280 x 1024 71.678 66.677
SUN1276 RGB 1280 x 1024 81.130 76.107
SUN1667 RGB 1600 x 1280 89.286 66.931
Video
Type
Video
Type
Video
Type
Horiz x Vert
Active Pixels
Horiz x Vert
Active Pixels
Horiz x Vert
Active Pixels
Line
Rate
Line
Rate
Line
Rate
Frame
Rate
Frame
Rate
Frame
Rate
3-6 Chapter 3: Built-In Formats
Model 801GC, 801GF & 801GX¥Rev. A
Page 37

Built-in Formats Ð cont.
Hewlett Packard
Japanese Sony
Monitor
Intercolor
Workstation
Barco
File Name
HP1060 RGB 1024 x 768 47.700 60.000
HP1070 RGB 1024 x 768 56.476 70.069
HP1075A RGB 1024 x 768 62.937 74.925
HP1075B RGB 1024 x 768 60.241 75.020
HP1260 RGB 1280 x 1024 63.338 59.979
HP1272 RGB 1280 x 1024 78.125 72.005
HP1275 RGB 1280 x 1024 79.976 75.025
File Name
SON1072 RGB 1024 x 768 57.870 71.799
SON1274 RGB 1280 x 1024 78.855 74.112
SON1276 RGB 1280 x 1024 81.206 76.179
File Name
INT1160 RGB 1184 x 884 55.200 60.000
INT1176 RGB 1184 x 884 71.712 76.047
INT1660 RGB 1664 x 1248 77.940 60.00
INT1676 RGB 1664 x 1248 100.73 76.020
File Name
BAR2060 RGB 2048 x 2048 126.86 60.008
BAR2080 RGB 2048 x 1536 126.86 79.187
BAR2560 RGB 2560 x 2048 126.91 60.034
Video
Type
Video
Type
Video
Type
Video
Type
Horiz x Vert
Active Pixels
Horiz x Vert
Active Pixels
Horiz x Vert
Active Pixels
Horiz x Vert
Active Pixels
Line
Rate
Line
Rate
Line
Rate
Line
Rate
Frame
Rate
Frame
Rate
Frame
Rate
Frame
Rate
PAL Component
Video
RS 170 Video
File Name
PAL_Y RGB 920 x 574 15.625 25.000¥
PAL_Yus RGB 768 x 575 15.625 25.000¥
PAL_Yos RGB 640 x 480 15.625 25.000¥
File Name
RS170Y RGB 752 x 484 15.734 29.970¥
RS170Yus RGB 640 x 480 15.734 29.970¥
RS170Yos RGB 512 x 384 15.734 29.970
Video
Type
Video
Type
Horiz x Vert
Active Pixels
Horiz x Vert
Active Pixels
Line
Rate
Line
Rate
Frame
Rate
Frame
Rate
3-7
Page 38

Built-in Formats Ð cont.
PAL Encoded
Video
NTSC Encoded
Video
HDTV Component
Video
Generator
Diagnostics
File Name
PAL_4xSC EYC 910 x 574 15.625 25.000¥
PALTV601 EYC 720 x 574 15.625 25.000¥
PAL_TVus EYC 768 x 574 15.625 25.000¥
PAL_TVos EYC 640 x 480 15.625 25.000¥
PAL_N EYC 910 x 574 15.625 25.000¥
File Name
NTSC_443 EYC 752 x 484 15.734 29.970¥
NTSC4xSC EYC 752 x 484 15.734 29.970¥
NTSC_601 EYC 720 x 484 15.734 29.970¥
NTSCTVus EYC 640 x 480 15.734 29.970¥
NTSCTVos EYC 512 x 384 15.734 29.970¥
File Name
HDTV_1J RGB‡ 1920 x 1035 33.750 30.000¥
HDTV_2J RGB‡ 1920 x 1035 33.750 30.000¥
HDTV_4J RGB‡ 1920 x 1035 33.750 30.000¥
HDTV_1E RGB‡ 1920 x 1152 31.250 25.000¥
HDTV_2E RGB‡ 1920 x 1152 31.250 25.000¥
HDTV_4E RGB‡ 1872 x 1152 31.250 25.000¥
File Name
TEST150 RGB 2048 x 1024 50.403 46.887
TEST250 RGB 2048 x 2048 79.719 35.861¥
Video
Type
Video
Type
Video
Type
Video
Type
Horiz x Vert
Active Pixels
Horiz x Vert
Active Pixels
Horiz x Vert
Active Pixels
Horiz x Vert
Active Pixels
Line
Rate
Line
Rate
Line
Rate
Line
Rate
Frame
Rate
Frame
Rate
Frame
Rate
Frame
Rate
3-8 Chapter 3: Built-In Formats
Model 801GC, 801GF & 801GX¥Rev. A
Page 39

Chapter 4: Built-In Images
Description of the test images
and how to use them
4-1
Page 40

Introduction
This chapter covers all of the built-in test images
(patterns) in a standard model 801G* generator. It
is also possible to add custom, user defined test
images to thegenerator. Information on modifying
and adding custom test images can be found in the
“Programming” chapter.
Information on how to select the various images can
be found in the “Basic Operation” chapter of this
manual. The “Troubleshooting” chapter has
information on resetting the 801GX to its factory
default conditions.
The remainder of this chapter describes each of the
images in detail. The purpose of each image is
included in the description. The images are presented
in the same order as they are in the table. Most of
the images are presented in the format shown on
the next page.
4-2 Chapter 4: Built-In Images
Model 801GC, 801GF & 801GX ¥ Rev. X1
Page 41

ImageName
Description This tells how the image is drawn on the display. A
black and white drawing of the image is included
as part of the description.
Drawing of the Image
Test Name of the test to be done
The name of the test describes the type of test to
be done.
Purpose Why this type of test should be done
Method A general guide on how to perform the test
4-3
Page 42

Descriptions of the Images
Acer1
Description Special test image specified by some display
manufacturers. Consists of two sets of color bars
and five blocks of “#” characters on a white crosshatch
witha black background.
Acer2
Description Special test image specified by some display
manufacturers. Consists of colorbars, lines of “#”
characters and a green border.
Acer3, Acer4, Acer5 and Acer6
Description Special test images specified by some display
manufacturers. Consists of a large and small white
circles centered on either a yellow (Acer3), magenta
(Acer4), cyan (Acer5) or white (Acer6) crosshatch
on a black background.
Acer7 and Acer 8
Description Special test image specified by some display
manufacturers. Consists of five blocks of either white
“#” (Acer7) or “H” (Acer8) characters on a black
background.
Acer9
Description Special test image specified by some display
manufacturers. Consists of mostly a white field with
two rows of color bars at the bottom.
4-4 Chapter 4: Built-In Images
Model 801GC, 801GF & 801GX¥Rev. X1
Page 43

BLU_EM, GRN_EM, RED_EM, WHT_EM,
MEMESony, MESony_B, MESony_G, and
MESony_R
Description In the primary version, the screen is filled with
blue (BLU and B), green (GRN and G), red (R), or
white (WHT and MEMESony) EM characters on a
black background. A bit map of a single character
is shown here.
Only the white character has a secondary version.
It’s drawn with black characters on a white
background.
Test Focus
Purpose This pattern is specified by one or more display
manufacturers for checking and adjusting focus
on their products one color at a time.
4-5
Page 44

BLU_EM+, GRN_EM+, RED_EM+, WHT_EM+,
MEMEPlus, MEPlus_B, MEPlus_G, and
MEPlus_R
Description In the primary version, the screen is filled with
blue (BLU and B), green (GRN and G), red (R), or
white (WHT and MEMEPlus) EM character block
on a black background. A bit map of a single
character block is shown here.
Only the white character has a secondary version.
It’s drawn with black characters on a white
background.
Test Focus
Purpose This pattern is specified by one or more display
manufacturers for checking and adjusting focus
on their products one color at a time.
4-6 Chapter 4: Built-In Images
Model 801GC, 801GF & 801GX¥Rev. X1
Page 45

BLU_PIC, GRAY_PIC, GRN_PIC, RED_PIC,
WHT_PIC, Flat, Flat Gray, Flat_B, Flat_G, and
Flat_R
Description A solid blue (BLU), gray, green (GRN), red, or
white (WHT) box fills the active video area.
Only the white fill has a secondary version. It can
be changed to a black fill.
Test Purity adjustment
Purpose To produce correct colors in a displayed image,
the electron beams from each of the three (3) guns
in the CRT should strike only their matching
phosphors. A white image shows patches of various
colors on a monitor with bad purity. The purity
adjustment(s) should be performed before doing
any brightness or color tests. In some cases, purity
adjustments involve loosening and repositioning
the yoke, in which case purity should be adjusted
prior to doing any geometry tests.
4-7
Page 46

BLU_PIC, GRAY_PIC, GRN_PIC, RED_PIC,
WHT_PIC, Flat, Flat Gray, Flat_B, Flat_G, and
Flat_R — contd.
Method The methods used for adjusting purity on a color
monitor depend on the type of monitor and CRT
you’re using (for example; Delta, In-Line or Single
Gun). In most cases, the first step is to degauss
the CRT.
Note – For a Delta Gun CRT, turn on only the Red output. A
solid uniform field of red should be displayed. If the color is
not uniform, adjust the yoke and the Purity Tabs assembly.
If purity cannot be corrected to acceptable limits,
the monitor may not have been properly degaussed
or there may be a defect in the CRT or purity
assembly.
Test Shadow mask warping
Purpose The purity characteristics of your CRT can change
over time if you leave it on with a lot of video
being displayed. This may be due to the CRT’s
electron beams striking its shadow mask with
enough energy to cause the mask to heat. This
internal heating may be enough to cause the
shadow mask to warp and give bad purity.
Method Set the purity image to white and allow the monitor
to run for a few minutes. Any mask warping shows
up as a change in purity. You can use a color
meter to measure the change. The BriteBox pattern
also may be useful for measuring shadow mask
warping.
4-8 Chapter 4: Built-In Images
Model 801GC, 801GF & 801GX¥Rev. X1
Page 47

Box_50mm and Box_64mm
Description The primary version has a solid white box in the
center of the active video. Depending on the image
selected, the box is either 50 millimeters (1.97
inches) or 64 millimeters (2.52 inches) square. If
there’s room, information on the current format
appears below and to the left of the box. This shows
the number of active pixels and lines as well as
the horizontal and vertical scan rates. An I after
the number of active lines indicates the format is
interlaced. The secondary version draws a black
box and black text on a white background.
Note – The box will be the correct size only if the correct
physical active video size is set in the format.
640 x 480
H= 31.469 KHz
V= 59.940 Hz
Test Brightness control adjustment
Purpose The wrong brightness setting may cause other tests
such as Contrast, Focus and Beam Size to be invalid.
An accurate brightness setting helps give repeatable
measurements throughout other tests.
Method Center your light meter probe within the center
square and adjust the monitor’s brightness control
to obtain the required light meter reading.
4-9
Page 48

BriteBox
Description The primary version has a single white box in the
center of active video. The box size is controlled
by the MSIZ system parameter. The secondary
version (shown below) adds four boxes in the
corners of active video.
Test Brightness control adjustment
Purpose The wrong brightness setting may cause other tests
such as Contrast, Focus and Beam Size to be invalid.
An accurate brightness setting helps give repeatable
measurements throughout other tests.
Method Center your light meter probe within the center
square and adjust the monitor’s brightness control
to obtain the required light meter reading.
4-10 Chapter 4: Built-In Images
Model 801GC, 801GF & 801GX¥Rev. X1
Page 49

BriteBox — contd.
Test Brightness uniformity
Purpose The light output of most picture tubes varies
slightly when measured across the CRT face. This
test can be used to verify that the light output
variation is within your spec limits.
Method Select the inverted version and perform the
Brightness Control Adjustment test on the center
box. Then center the light meter probe in each of
the corner squares and note the reading you get
for each square. The deviation between each of
the corner readings and the center reading should
be within your spec limits.
4-11
Page 50

Burst (TV formats only)
Description: The left side start with reference white (+100 IRE)
and black (+7.5 IRE) levels. This is followed by six
bursts of sine waves. Each burst is at a different
frequency forming vertical lines of various widths.
The frequencies, going from left to right, are 0.5, 1,
2, 3, 3.58 and 4.43 MHz.
Test: Frequency Response
Method: When viewed on a TV screen, the peak intensities
of the all of the bursts should match the white
reference level. The darkest portions between the
peaks should match the black reference level.
The image can also be used with a TV waveform
analyzer to check the frequency response of a video
system. One scan line of the image, as it would appear
on a waveform analyzer, is shown at the top of the
next page. High frequency roll-off (loss) would show
up as a decrease in the peak-to-peak swings on the
right side of the waveform. Low frequency roll-off
would show up as a decrease in the peak-to-peak
swings on the left side of the waveform.
Some waveform analyzers can be set to detect and
display the amplitude of the peaks. A typical
amplitude waveform for a good system is shown at
the bottom of the next page.
4-12 Chapter 4: Built-In Images
Model 801GC, 801GF & 801GX¥Rev. X1
Page 51

Check511
Description Five small boxes are placed in the corners and at
the center of active video. The boxes are on a black
background. Each box consists of alternating black
and white pixels that form a very fine
checkerboard. The secondary version inverts the
image, creating a white background. The colors
of the individual pixels in the boxes also are
inverted.
Test Verify monitor resolution
Purpose The resolution of your monitor should meet or
exceed the design specs.
Method First adjust the brightness, contrast, and focus to
their correct settings. You should be able to see
individual and distinct pixels in each of the boxes.
Failure to see distinct pixels may indicate you have
a defective video amplifier, focus correction circuit
or picture tube.
Note – If multicolored areas appear on a mask-type color
picture tube, you may have a problem with convergence or
you may be exceeding the resolution of the picture tube.
4-13
Page 52

CheckBy3
Description The active video area is equally divided into a
three by three checkerboard of black and white
boxes. The primary version has four white boxes
as shown in the figure on the left. The secondary
version has five white boxes as shown in the figure
on the right.
Test Contrast ratio
Purpose The pattern is based on a proposed ANSI method
of measuring the contrast ratio of video projection
systems.
Method Using a suitable light meter probe, measure and
record the light-level reading (in foot lamberts)
in the center of each of the black and white boxes.
The contrast ratio is expressed as the average of
all of the white readings divided by the average
of all of the black readings.
4-14 Chapter 4: Built-In Images
Model 801GC, 801GF & 801GX¥Rev. X1
Page 53

Check_11
Description The active video area is filled with alternating black
and white pixels that form a very fine
checkerboard. The secondary version inverts the
colors in the image. The inverted image looks
almost the same as the non-inverted version.
Test Verify monitor resolution
Purpose The resolution of your monitor should meet or
exceed the design specs.
Method Adjust the brightness, contrast, and focus to their
correct settings first. You should be able to see
individual and distinct pixels in each of the boxes.
Failure to see distinct pixels may indicate you have
a defective video amplifier, focus correction circuit
or picture tube.
Note – If multicolored areas appear on a mask-type color
picture tube, you may have a problem with convergence or
you may be exceeding the resolution of the picture tube.
4-15
Page 54

CirclesL
Description This image may be called for by some display
manufacturers’ test procedures. The image consists
of five large white circles on a black background.
The circles are positioned in the center and in the
corners of the active video area.
The secondary version inverts the image to black
circles on a white background.
Purpose This pattern is specified by one or more monitor
manufacturers for checking and adjusting video
scan size, linearity and over scanning.
4-16 Chapter 4: Built-In Images
Model 801GC, 801GF & 801GX¥Rev. X1
Page 55

CirclesS
Description This image may be called for by some display
manufacturers’ test procedures. The image consists
of eight small white circles on a black background.
The circles are positioned in the corners of the
active video area and centered on each edge of
the active video area.
The secondary version inverts the image to black
circles on a white background.
Purpose This pattern is specified by one or more monitor
manufacturers for checking and adjusting video
scan size, linearity and over scanning.
4-17
Page 56

ColorBar
Description The primary version has 16 full-height vertical color
bars. The order of the bars is shown below. The
secondary version splits the field into a top and
bottom half. The bars in the bottom half of the
screen are in reverse order.
When digital video is being output, 33% Gray
changes to 50% Gray and 67% Gray becomes either
Black or some gray level depending on how the
display interprets the video information.
Black
50% Blue
50% Red
50% Cyan
50% Green
67% Gray
33% Gray
50% Yellow
50% Magenta
Blue
Cyan
Green
Red
Yellow
Magenta
White
Test Verify that all video channels is functional
Purpose To verify that none of the video channels are bad
or hooked up incorrectly
Method Compare the sequence of color bars with the table.
Missing bars may indicate a dead or unconnected
channel. The transition between the bars should
be sharp and distinct. Each bar also should be
uniform in color and intensity across its entire
width. Non-uniformity may indicate problems with
the response of the video amplifiers. If all the bars
are present but in the wrong order, one or more
inputs may be swapped.
4-18 Chapter 4: Built-In Images
Model 801GC, 801GF & 801GX¥Rev. X1
Page 57

Cubes
Description This is an animated image consisting of one small
multicolored cube orbiting around a larger
multicolored cube. Each cube also is spinning on
its own axis. The default text string says Quantum
Data. The text can be modified and saved using
commands sent over the communications ports.
The primary version has a black background and
a thick green border. The secondary version uses
just a white background.
Quantum Data
Purpose Can be used for show demonstrations with your
own text.
4-19
Page 58

Custom
Description This image has a white border around the active
video, a centered smaller yellow box, and green
diagonals.
Purpose This image is an example of some of the available
drawing primitives. It’s not intended to be an image
suitable for testing or adjusting a display. Rather,
it can be used as a starting point for developing
a custom image of your own.
4-20 Chapter 4: Built-In Images
Model 801GC, 801GF & 801GX¥Rev. X1
Page 59

Dot_10, Dot_12, Dot_24
Description The active video area is filled with multiple rows
of white single pixel dots. The dots define the
corners of what would appear to be square boxes
if all the connecting pixels were lit. The number
of rows of boxes and the number of boxes per
row depends on which version of the image is
selected and the screen aspect ratio of the currently
loaded format. The number in the image’s name
refers to the number of boxes that will be formed
along the minor axis for most aspect ratios. The
firmware calculates the ratio and then finds the
closest match from the following table.
Aspect Ratio Dot_10 Dot_12 Dot_24
W : H Decimal
16 : 9 1.777É 10 16 10 16 18 32
5 : 3 1.666 É 10 16 10 16 18 30
4 : 3 1.333 É 10 14 12 16 24 32
1 : 1 1.000 10 10 12 12 24 24
3 : 4 0.750 14 10 16 12 32 24
Number
of Rows
Boxes
per Row
Number
of Rows
Boxes
per Row
Number
of Rows
Boxes
per Row
4-21
Page 60

Dot_10, Dot_12, Dot_24 — contd.
Purpose In order to accurately produce an image on a color
monitor, the three electron beams in the CRT must
meet (converge) at the exact same location at the
same time. Small dots displayed on a misconverged
monitor appear as a group of multicolored dots.
Method The convergence adjustments of most color
monitors fall into two main categories.
The first set of adjustments, usually called Static
Convergence, aligns the three beams in the center
of the display. The idea is to turn on all three
guns and adjust the various magnets on the
convergence assembly to produce all white dots
in the center of the display. The convergence
assembly is located on the neck of the CRT.
Different monitors and CRT types may each require
their own magnet-adjustment sequence.
After the center of the display is properly
converged, the outer areas are adjusted by using
the monitor’s Dynamic Convergence controls. The
number of controls, the area of the screen they
affect, and their adjustment procedure depends
on the monitor you’re testing.
Test Focus adjustment(s)
Purpose An out-of-focus monitor displays fuzzy pixels
which, in turn, result in poorly formed and hardto-read characters.
Method On monitors with a single (static) focus adjustment,
adjust the control for the best average focus over
the entire screen. The focus at certain locations
should be within specified limits.
Some monitors have a static and one or more
dynamic focus controls. The sequence for adjusting
them and the areas of the screen they affect depend
on the monitor you’re testing.
4-22 Chapter 4: Built-In Images
Model 801GC, 801GF & 801GX¥Rev. X1
Page 61

EMITest1
Description Special test image used for Electro-Magnetic
Interference (EMI) testing of displays. The entire
active video area is filled with a small “H” character.
The primary version of the image draws white
characters on a black background. The secondary
version draws black characters on a white
background.
EMITest2
Description Same as EMITest1 but with the bottom row of
characters contstantly being drawn left to right and
then cleared.
EMITest3
Description Same as EMITest1 but with a smaller version of the
“H” character.
EMITest4
Description Same as EMITest2 but with a smaller version of the
“H” character.
4-23
Page 62

Focus_@6, Focus_@7, Focus_@8
Description In the primary versions, the screen is filled with
white “@” characters on a black background. Bit
maps of a single character for the three different
images are shown here.
The secondary versions are drawn with black
characters on a white background.
Test Focus adjustment(s)
Purpose An out-of-focus monitor displays fuzzy graphic
images and poorly formed, hard-to-read text
characters.
Method On monitors with a single (static) focus adjustment,
adjust the control for the best average focus over
the entire screen. The focus at certain locations of
the screen should be within specified limits.
Some monitors have a static and one or more
dynamic focus controls. The sequence for adjusting
them and the areas of the screen that they affect
depend on the monitor you’re testing.
4-24 Chapter 4: Built-In Images
Model 801GC, 801GF & 801GX¥Rev. X1
Page 63

Focus_Cx
Description In the primary version, the screen is filled with
white Cx characters on a black background. A bit
map of a single character is shown here.
The secondary version is drawn with black
characters on a white background.
Test Focus adjustment(s)
Purpose An out-of-focus monitor displays fuzzy graphic
images and poorly formed, hard-to-read text
characters.
Meth od On monitors with a single (static) focus adjustment,
adjust the control for the best average focus over
the entire screen. The focus at certain locations of
the screen should be within specified limits.
Some monitors have a static and one or more
dynamic focus controls. The sequence for adjusting
them and the areas of the screen that they affect
depend on the monitor you’re testing.
4-25
Page 64

Focus_H
Description In the primary version, the screen is filled with
white H characters on a black background. A bit
map of a single character is shown here.
The secondary version is drawn with black
characters on a white background.
Test Focus adjustment(s)
Purpose An out-of-focus monitor displays fuzzy graphic
images and poorly formed, hard-to-read text
characters.
Method On monitors with a single (static) focus adjustment,
adjust the control for the best average focus over
the entire screen. The focus at certain locations of
the screen should be within specified limits.
Some monitors have a static and one or more
dynamic focus controls. The sequence for adjusting
them and the areas of the screen that they affect
depend on the monitor you’re testing.
4-26 Chapter 4: Built-In Images
Model 801GC, 801GF & 801GX¥Rev. X1
Page 65

Focus_Oo
Description In the primary version, the screen is filled with
white Oo characters on a black background. A bit
map of a single character is shown here.
The secondary version is drawn with black
characters on a white background.
Test Focus adjustment(s)
Purpose An out-of-focus monitor displays fuzzy graphic
images and poorly formed, hard-to-read text
characters.
Meth od On monitors with a single (static) focus adjustment,
adjust the control for the best average focus over
the entire screen. The focus at certain locations of
the screen should be within specified limits.
Some monitors have a static and one or more
dynamic focus controls. The sequence for adjusting
them and the areas of the screen that they affect
depend on the monitor you’re testing.
4-27
Page 66

Format
Description A listing of the data contained in any format. This
pattern works best at display resolutions of at least
640 pixel by 480 lines. It’s quite similar to the
format editor’s GUI screen.
Name: MDA_m7 Pixel Rate:
Location: 13 16.257 MHz 61.512 ns
Entry Units: Time
Rate: 18.432 KHz* 49.816 Hz
Active: 720 pixels 44.289 µs* 350 lines 18.989 ms*
Blank: 162 pixels 9.965 µs 20 lines 1.085 ms
Period: 882 pixels 54.253 µs* 370 lines 20.074 ms*
Physical size: 11.811 inches 300.000 mm 8.858 inches 225.000 mm
Pulse delay: 9 pixels 0.554 µs 0 lines 0.000 ms
Pulse width: 144 pixels 8.858 µs 16 lines 0.868 ms
EQ Before: 0 lines
EQ After: 0 lines
Scan: Progressive (non-interlace)
ACS kind: none On: -GDCS kind: American 0Red
DSS kind: American separate DS Polarity: H+ V- C+
Sync select: DSS DS Gate: Hon Von Con
Video kind: 2-bit mono Pedestal: OFF 7.5 IRE
Video bias: 0.000 volts blank minus ground
Video swing: 0.714 volts white minus blank
Sync swing: 0.286 volts blank minus sync
Gamma: OFF 2.200
Display code expected: E Code read F
Test View a format’s parameter settings
Purpose To verify programmed values or choose a format
Method The main image lists the settings of the format
that’s driving the display. The secondary image
can be used to list the contents of any stored
format.
Horizontal Vertical
4-28 Chapter 4: Built-In Images
Model 801GC, 801GF & 801GX¥Rev. X1
Page 67

GrayBar
Description The primary version has 16 full-height vertical
graybars. The intensity of the bars is shown below.
The secondary version splits the field into a top
and bottom half. The bars in the bottom half of
the screen are in reverse order.
7% Gray
13% Gray
20% Gray
27% Gray
33% Gray
40% Gray
47% Gray
53% Gray
60% Gray
67% Gray
73% Gray
80% Gray
87% Gray
93% Gray
Black (0% Gray)
White (100% Gray)
Test Video color tracking (color monitors)
Purpose To check to see that a color monitor accurately
reproduces colors at all intensities
Method Perform the Brightness Control Adjustment and
Brightness Uniformity tests first.
Changes in brightness from bar to bar should be
uniform. All of the bars should appear as an
untinted gray at all levels.
Test Video Gain Linearity (monochrome monitors)
Purpose To check the video linearity; i.e., grayscale
modulation
Method Perform the Brightness Control Adjustment and
Brightness Uniformity tests first.
Changes in brightness from bar to bar should be
visible and uniform.
4-29
Page 68

Grill_11, Grill_22, Grill_33, Grill_44
Description The entire active video area is filled with
alternating black and white stripes. The stripes
are drawn at different resolutions. Each of the
stripes is four (4) pixels wide in the Grill_44 image
and three (3) pixels wide in the Grill_33 image.
Each of the stripes is two (2) pixels wide in the
Grill_22 image and one (1) pixel wide in the Grill_11
image.
The primary versions draw vertical stripes while
the secondary versions draw horizontal stripes.
Test Verify monitor resolution
Purpose The resolution of your monitor should meet or
exceed the design specs.
Method First adjust the brightness, contrast, and focus to
their correct settings. You should be able to see
individual and distinct stripes in all areas of the
display at all four resolutions. Failure to see distinct
lines at the highest resolution (Grill_11) may
indicate you have a defective video amplifier or
picture tube.
Note – If multicolored lines appear on a mask-type color picture
tube, you may have a problem with convergence or you may
be exceeding the resolution of the picture tube.
4-30 Chapter 4: Built-In Images
Model 801GC, 801GF & 801GX¥Rev. X1
Page 69

Hatch_10i, Hatch_10o, Hatch_12i, Hatch_12o,
Hatch_24i, Hatch_24o, Hatch_24s, Hatch_G,
Hatch_M, GRN_HTCH, and MAGENTA
Description The primary versions consist of a white, green (G
and GRN), or magenta (M) crosshatch drawn on a
black background. The lines form square boxes.
A single pixel dot is located in the center of each
crosshatch box. The number of boxes formed
depends on the version of the image selected and
the screen aspect ratio of the currently loaded
format. The number in the image’s name refers to
the number of boxes that are formed along the
minor axis for most aspect ratios. The firmware
calculates the ratio and then finds the closest match
from the table on the next page. Versions ending
in i draw from the inside (center) out. Any partial
boxes are placed around the perimeter of the image.
Versions ending in o draw from the outside in.
Any partial boxes are placed along the centerlines
of the image. Versions ending in s are the “i” version
plus a 1 pixel thick border.
The secondary versions invert the images to black
lines and dots on a white background. Hatch_G,
Hatch_M, GRN_HTCH and Magenta do not have
secondary versions.
4-31
Page 70

Aspect Ratio Hatch_10 Hatch_12 Hatch_24
W : H Decimal
16 : 9 1.777É 10 16 10 16 18 32
5 : 3 1.666 É 10 16 10 16 18 30
4 : 3 1.333 É 10 14 12 16 24 32
1 : 1 1.000 10 10 12 12 24 24
3 : 4 0.750 14 10 16 12 32 24
Boxes
Vertically
Boxes
Horizontally
Boxes
Vertically
Boxes
Horizontally
Boxes
Vertically
Boxes
Horizontally
Test Convergence adjustment (color monitors only)
Purpose In order to accurately produce an image on a color
monitor, the three electron beams in the CRT must
meet (converge) at the exact same location at the
same time. Lines displayed on a misconverged
monitor appear as several multicolored lines and
the transitions between different colored areas
contain fringes of other colors.
Method The convergence adjustments of most color
monitors fall into two main categories.
The first set of adjustments, usually called Static
Convergence, aligns the three beams in the center
of the display. The idea is to turn on all three
guns and adjust the various magnets on the
convergence assembly to produce all white dots
in the center of the display. The convergence
assembly is located on the neck of the CRT.
Different monitors and CRT types may each require
their own magnet adjustment sequence.
After the center of the display is properly converged,
the outer areas are adjusted by using the monitor’s
Dynamic Convergence controls. The number of controls,
the area of the screen they affect, and their adjustment
procedure depends on the monitor you’re testing.
4-32 Chapter 4: Built-In Images
Model 801GC, 801GF & 801GX¥Rev. X1
Page 71

Hatch4x3, Hatch5x4 and Hatch8x8
Description These are different versions of a crosshatch pattern
that may be called for by some display manufacturers’
test procedures. The primary version consists of white
crosshatch on a black background.
The secondary version inverts the image to black
lines on a white background.
Purpose This is a general purpose test image that can be
used to check and adjust video scan linearity and
geometry and color convergence.
4-33
Page 72

Hatch64W
Description This is still another version of a crosshatch pattern
that may be called for by some manufacturers’
test procedures. The primary version consists of
an 8 by 8 white crosshatch on a black background.
A white rectangular patch is added in the center.
The secondary version inverts the image to black
lines and box on a white background.
Purpose This is a general purpose test image that can be
used to check and adjust video scan linearity and
geometry and color convergence. The large white
rectangle also allows for checking a display’s high
voltage regulation. This is done by observing the
vertical lines at the left and right edges of the
image. They should be fairly straight and not pull
in the area of the white rectangle.
4-34 Chapter 4: Built-In Images
Model 801GC, 801GF & 801GX¥Rev. X1
Page 73

Hitachi1
Description This is a special test image specified by some display
manufacturers. The image consists of a 2x2 cluster
of Microsoft Windows® program manager screen
simulations using Japanese characters.
4-35
Page 74

KanjiKan
Description In the primary version, the screen is filled with
white Japanese Kan characters on a black
background.
The secondary version is drawn with black
characters on a white background.
Test Focus adjustment(s)
4-36 Chapter 4: Built-In Images
Model 801GC, 801GF & 801GX¥Rev. X1
Page 75

Linearty (Linearity)
Description The image is made up of three parts. The first
part consists of six (6) white circles. A large circle
is drawn in the center of the screen. Its diameter
equals the lesser of the video height or width of
the display. A smaller circle is drawn at half the
diameter and concentric with the larger circle. A
circle also is drawn in each of the corners of the
screen. The diameter of the corner circles equals
one-fifth of the display width. The second part of
the image consists of a white crosshatch image.
The number of boxes in the crosshatch depends
on the physical size of the display. The last part
of the image consists of white tic marks on the
horizontal and vertical center lines of the image.
The marks are one pixel thick and at every other
pixel location. Every fifth mark is slightly longer.
The color of the pattern can be changed with the
individual video output controls.
4-37
Page 76

Linearty (Linearity) — contd.
Detail showing
center of
linearity test
image. All
lines are one
pixel thick.
Test Linearity adjustment
Purpose In order to present an undistorted display, the
horizontal and vertical sweeps of the electron beam
across the face of the CRT should be at uniform
speeds. Any non-uniformity in the sweep causes
portions of an image to stretch while other portions
are compressed. Non-linearity in a monitor shows
up in several ways. It may be present across the
entire screen, in a large portion of the screen, or
localized in a very small area.
Method The circles in the image can be used to do a ball
park adjustment of a monitor’s linearity controls.
Adjust the controls to form perfectly round circles.
The crosshatch image can be used to measure
linearity and to make finer control adjustments.
All the full boxes in the crosshatch should be
identical in size. Measure them with a ruler or a
gauge made for the monitor you’re testing. Any
deviation should be within your spec limits. Use
the tic marks and a ruler or gauge to measure
linearity over a small portion of the display.
Compare the number of tic marks per unit of
measure with an adjacent or overlapping area.
4-38 Chapter 4: Built-In Images
Model 801GC, 801GF & 801GX¥Rev. X1
Page 77

LinFocus
Description The image consists of several parts. It starts with
a large circle in the center of the screen. Its
diameter equals the lesser of the video height or
width of the display. The second part is a 10 by
10 box crosshatch pattern. The crosshatch is drawn
in from the outside edges, with any extra pixels
in the boxes placed along the vertical and
horizontal axis. The vertical centerline is two pixels
thick if the format has an even number of active
pixels per line. The horizontal centerline is two
pixels thick if the format has an even number of
active lines per frame. A smaller box is added at
the center of the image. The box is one-half the
height and two-fifths the width of one of the
crosshatch boxes. Current format data is shown
in the lower left quadrant of the image. It shows
the number of active pixels (H) and lines (V) as
well as the vertical and horizontal scan rates.
640 x 480
H= 31.469 KHz
V= 59.940 Hz
4-39
Page 78

LinFocus — contd.
/8 /7 /6 /5 /4 /3 /2 1X2X 3X4X 5X6X7X 8X
533101
The image also includes blocks of
focus-checking characters at
various locations. The blocks are
positioned inside the crosshatch
boxes and are up to 3 by 3
characters in size. The size of the
blocks is limited by the number of
characters that can fit in one box. The bit map of
a single focus character is shown here.
The primary version consists of a white pattern
on a black background. The secondary version has
a black pattern on a white background.
Test Linearity adjustment
Please see the discussion of the Linearity test image
for information on measuring linearity.
Test Focus adjustment(s)
Purpose An out-of-focus monitor displays fuzzy graphic
images and poorly formed, hard-to-read characters
when text is displayed on the screen.
Method On monitors with a single (static) focus adjustment,
adjust the control for the best average focus over
the entire screen. The focus at certain locations of
the screen should be within specified limits.
Some monitors have a static and one or more
dynamic focus controls. The sequence for adjusting
them and the areas of the screen they affect depend
on the monitor you’re testing.
4-40 Chapter 4: Built-In Images
Model 801GC, 801GF & 801GX¥Rev. X1
Page 79

Outline0 and Outline1
Description The Outline0 image consists of a rectangular white
border on a black background. The border is one
(1) pixel wide and defines the active video area.
Two (2) diagonal lines join the opposite corners.
A full size cross is centered in the image. The
horizontal line of the cross is one (1) pixel thick
for formats with an odd number of active lines
and two (2) pixels thick for formats with an even
number of active lines. The vertical line of the
cross is one (1) pixel thick for formats with an
odd number of active pixels per line and two (2)
pixels thick for formats with an even number of
active pixels.
In the Outline1 version, the two diagonal lines
are removed and short marker lines are added to
the border lines near to where the cross lines meet
the border lines. The markers appear at both sides
of the cross lines. The distance between the marker
lines and the cross lines is the greater of either
two (2) pixels or one (1) millimeter.
4-41
Page 80

Outline0 and Outline1 — contd.
Test Yoke tilt correction
Purpose The horizontal axis of a displayed image should line
up with the horizontal axis of your monitor. Any
tilt is likely due to the yoke being rotated on the
neck of the CRT. A rotated yoke makes any displayed
image appear rotated.
Method Place your monitor on a flat surface so the face of
the CRT is perpendicular to the surface. Use a
ruler or gauge to measure the height of each end
of the image’s horizontal center line from the
surface. The difference between the two readings
should be within spec for the monitor. If it’s out
of spec, the yoke needs to be adjusted. Loosen
the hardware that clamps the yoke to the neck of
the CRT and rotate the yoke until the line is
horizontal. Tighten the yoke-clamp hardware.
Test Yoke winding orthogonality check
Purpose The horizontal and vertical deflection coils on the
yoke should have their axes cross at exactly 90
degrees. Improper orientation of the windings
causes displayed rectangles to look more like nonorthogonal parallelograms. This type of defect is
almost impossible to correct with adjustments. It’s
usually easier to replace the defective yoke.
Method First perform the previously discussed yoke tilt test.
The vertical center line of the image should be
perpendicular to the work surface. If the deviation
is beyond spec, the monitor should be rejected and
sent back for repair before the operator wastes time
trying to magnet a defective yoke.
4-42 Chapter 4: Built-In Images
Model 801GC, 801GF & 801GX¥Rev. X1
Page 81

Test Display size correction
Purpose A too-large active video size adjustment on a monitor
may cause information to be lost around the edges
of the screen. A too-small active video size adjustment
may make some displayed information hard to read.
The correct size is needed to obtain the correct aspect
ratio. You need the correct aspect ratio to get round
circles and square squares.
Method First you need to know the correct physical size of
the active video area for the display. This information
usually is given in a display’s spec sheet or service
manual. The size should match the sizes in the format
you’re using. The size setting of the current format
can be checked using the Format test image.
Place a ruler or gauge along the horizontal line of
the image and adjust the monitor's horizontal size
control until the distance between the endpoints
matches the specified value.
Move the ruler or gauge to the vertical line and
adjust your monitor's vertical size control until
the distance between the endpoints matches the
specified value.
Test Parallelogram distortion check
Purpose Parallelogram distortion is very difficult to correct
with magnets because the correction often causes
barrel distortion. Therefore, you should decide
early whether your monitor meets this spec. The
problem usually can be traced to the improper
winding of the yoke coils. If the problem isn’t too
severe, it may be corrected by adding or adjusting
magnets on the yoke. However, if the distortion
is excessive, it may be an indication of a defective
yoke which cannot be corrected with magnets.
4-43
Page 82

Outline0 and Outline1 — contd.
Method Measure the lengths of the two (2) diagonal lines.
Any difference is an indication of parallelogram
distortion. The difference in readings should be
within the specifications of the monitor.
If the difference in the readings is too far beyond
spec, the monitor should be rejected and sent back
for repair before the operator wastes time trying
to magnet a defective yoke.
Test Trapezoid distortion correction
Purpose This image gives you a way to measure trapezoid
distortion in your monitor. If the distortion isn’t
too severe, you may be able to correct it by adding
or adjusting magnets on the yoke.
Method Perform the Yoke Winding Orthogonality Check and
Parallelogram Distortion Check tests first to prevent
an operator from wasting time on a monitor with
a defective yoke.
Measure the width of the image at the top and
bottom of the display. Any difference in readings
should be within the spec limits. Measure the
height of the image at both sides of the display.
Again, any difference in readings should be within
spec limits. If either of the differences is out of
spec, the trapezoid distortion of the monitor is
out of spec.
Add or adjust magnets on the yoke to correct the
problem. The Pin & Barrel Correction test should
be repeated to make sure that it’s still in spec.
4-44 Chapter 4: Built-In Images
Model 801GC, 801GF & 801GX¥Rev. X1
Page 83

Test Pin and barrel distortion correction
Purpose If perfectly linear sweep signals are sent to a perfectly
wound deflection yoke that’s mounted on a perfect
CRT, you would not necessarily get a perfectly formed
raster. Instead you would likely get a raster that
had its corners stretched away from the center and
resembled a pincushion. This distortion occurs
because the geometry of the deflected electron beam
does not match the geometry of the tube faceplate.
Also, imperfections in the yoke or CRT may affect
this problem. In some cases one or more corners
may be pulled towards the center of the raster causing
it to look like a barrel. Uncorrected raster distortion
carries over as distortion of the displayed image.
Method A slot gauge may be used to determine if the amount
of pincushion or barrel distortion is within limits.
A basic slot gauge may consist of a piece of opaque
film with at least two (2) transparent slots in it.
One slot is used for top and bottom distortion
and the other is used for the sides. By positioning
the correct slot over each portion of the border
line, the entire line should be visible. If this cannot
be done at all four sides, the monitor needs
correcting.
There are two main ways of correcting pincushion
distortion. The first involves placing or adjusting
magnets on the yoke. This is a trial-and-error
method. However, skilled operators develop a feel
for how strong a magnet to use and how to place
it in order to get the desired correction. If any
correction is performed, the Trapezoid Distortion
Correction test should be repeated.
The other correction method involves adding
correction signals to the deflection signal driving
the yoke. This method is usually found in color
monitors, where adding magnets to the yoke would
cause problems with convergence and purity. The
type and number of adjustments depends on the
monitor being tested.
4-45
Page 84

P1
Description 6 by 6 white crosshatch without a border on a black
backgound.
P2
Description 4 by 4 white crosshatch with a border on a black
backgound.
P3
Description 4 by 4 white crosshatch with a border and a small
centered white patch on a black backgound.
P4
Description 8 by 8 white crosshatch with a border on a black
backgound.
P5
Description 8 by 8 white crosshatch with a border and a small
centered white patch on a black backgound.
P6
Description 16 by 12 white crosshatch with a border on a black
backgound.
P7
Description 16 by 12 white crosshatch with a border and a small
centered white patch on a black backgound.
P8
Description All black active video area
4-46 Chapter 4: Built-In Images
Model 801GC, 801GF & 801GX¥Rev. X1
Page 85

Persist
Description In the primary version, 15 small white boxes move
back and forth between diagonal guide lines. The
lines form 15 side-by-side tracks. The size of each
box is scaled to the light meter box size set by the
MSIZ system parameter. The box in the center track
moves one scan line vertically and one pixel
horizontally for each vertical frame of refresh. The
seven boxes in the tracks to the right of the center
track move 2, 3, 4, 5, 6, 7 and 8 pixels and lines
per frame. These boxes are marked 2X through
8X at the bottom of the tracks. The seven boxes to
the left of the center track move one scan line
vertically and one pixel horizontally for every 2,
3, 4, 5, 6, 7 and 8 vertical frames of refresh. These
boxes are marked /2 through /8 at the bottom of
the tracks.
In cases where the next move would cause the
box to move beyond the end of its track, it
immediately reverses and moves the correct
distance in the opposite direction for the next
frame.
A continuously running counter appears in the
upper left-hand corner of the image. The number
shown is the number of vertical frame refreshes
that have occurred since the generator was first
powered up.
The secondary version draws a black image on a
white background.
4-47
Page 86

533101
/8 /7 /6 /5 /4 /3 /2 1X 2X 3X 4X 5X 6X 7X 8X
Test Phosphor persistence
Purpose The phosphors on the face of most CRTs continue
to glow for a short period of time after the electron
beam has stopped energizing them. This
phenomenon is called persistence. A certain amount
of persistence is desirable in most applications. It
prevents a flickering of a displayed image that
most users would find objectionable. On the other
hand, a CRT with an overly long persistence time
causes moving objects to leave a blurred trail.
Method A flickering in the slower moving boxes indicates
that the combination of refresh rate and phosphor
persistence is not suitable for long-term viewing.
A fading tail left behind by the faster moving boxes
indicates that the display may not be suitable for
viewing animated images.
4-48 Chapter 4: Built-In Images
Model 801GC, 801GF & 801GX¥Rev. X1
Page 87

PulseBar (TV formats only)
Description: The image looks like two vertical lines followed by
a wide vertical bar on a display’s screen. The first
line is a sine-squared modulated pulse that fades
from black to red and back to black. The pulse is
20T for PAL and 12.5 T for NTSC formats. The second
narrower line is a 2T white sine-squared pulse. T =
100 nSec for PAL and 125 nSec for NTSC formats.
The wide bar is white with sine-squared edges.
Test: Video System Testing
This multi-purpose pattern can be used with other
instruments to check television K factors. The
modulated pulse can be used to check chrominance-
to-luminance delay and gain. The narrow white line
can be used to measure short term linear distortion
(K2T). One scan line of the image, as it would appear
on a waveform analyzer, is shown here:
4-49
Page 88

QuartBox
Description The primary version has a single white box in the
center of active video. The size of the box is onehalf the width and height of the active video area
(a quarter of the entire active video area). The
secondary version draws a black box on a white
background.
Test Brightness control adjustment
Purpose The wrong brightness setting on your monitor may
cause other tests such as Contrast, Focus and Beam
Size to be invalid. An accurate brightness setting
helps give repeatable measurements throughout
other tests. This version of the brightness box
should be used if the display’s specifications call
for the brightness to be set with one-fourth of the
screen lit.
Method Place your light meter probe within the center box
and adjust the monitor’s brightness control to
obtain the required light meter reading.
4-50 Chapter 4: Built-In Images
Model 801GC, 801GF & 801GX¥Rev. X1
Page 89

Ramp (TV formats only)
Description: The active video area goes from full black (+7.5 IRE)
at the left edge of the screen to full white (+100
IRE) at the right edge.
Test: Video Gain Linearity
Method: When viewed on a TV screen, the full range of grays
should be visible. There should be no color shifts
visible.
4-51
Page 90

Raster
Description A totally black display (nothing being displayed)
Test Raster centering
Purpose Many monitor applications require that the
displayed image or text fit completely within a
bezel that surrounds the CRT. This usually requires
that you first center the blank raster on the face
of the CRT and then center the image within the
raster. Use this image for centering the raster on
the CRT.
Method Turn up your monitor’s brightness control until
the raster is just visible. Adjust the raster’s position
and size using the size and raster centering
controls. The raster centering adjustment for many
monochrome monitors consists of moving magnetic
rings on the deflection yoke.
4-52 Chapter 4: Built-In Images
Model 801GC, 801GF & 801GX¥Rev. X1
Page 91

Regulate
Description The image cycles between two (2) patterns. In the
primary version, the first pattern is a white outline
that defines the edges of displayed video. The other
pattern has the same outline plus a solid white
rectangle in the center. The size of the solid
rectangle equals 95% of the height and width of
displayed video. The speed of the cycle cannot be
changed.
The secondary version has a thick white frame
with a black center for the first pattern and a solid
white active video area for the other pattern.
Test High voltage regulation
Method The size of the border should not change for each
half of the image. The change in border size
between the two images should be within the spec
limits of the monitor.
4-53
Page 92

Samsung1
Description Special test image specified by some display
manufacturers. The image consists of three small
simulations of Microsoft WIndows® screens on a blue
background. A border and centered cross are formed
with repeating groups of the characters “e” and “m”.
The repeating characters are also used to form a
rectangular patch in the upper left hand corner and
a circular area in the center of the image.
Samsung2
Description Same as Samsung1 but with a black background.
SlideG
Description Special test image specified by some display
manufacturers. The image consists of a green
crosshatch with moving lines on a black background.
The vertical lines move to the right and the vertical
lines move down.
SlideRGB
Description Special test image specified by some display
manufacturers. The image consists of a crosshatch
with moving lines that also change color on a black
background. The vertical lines move to the right and
the vertical lines move down. The colors of the lines
change after every move. The colors continuosly cycle
between red, green and blue.
4-54 Chapter 4: Built-In Images
Model 801GC, 801GF & 801GX¥Rev. X1
Page 93

SMPTE133
Description This image is based on a recommended practice
(RP-133) test pattern designed by the Society of
Motion Picture and Television Engineers (SMPTE).
The original application was used in testing and
evaluating medical imaging monochrome displays.
The image now is used in many different display
applications. The image is self scaling as to the
number of active pixels and active lines used. Some
of the image’s elements have minor differences
from the original SMPTE specification. These
differences are noted in descriptions of the
individual elements.
1) The image is drawn on a reference
background having a 50% intensity level. The
background covers the entire active video
area.
2) Crosshatch – There are 10 boxes vertically.
The number of horizontal boxes is based on
the physical aspect ratio determined by the
HSIZ and VSIZ parameters in the currently
loaded format. The boxes are perfectly square
with any fractional spaces placed around the
outside edges of the image. The vertical lines
are two (2) pixels thick while the horizontal
lines are two (2) scan lines thick. Small crosses
indicate the intersection of the horizontal and
vertical lines when they are covered by other
parts of the image. All parts of the crosshatch
are normally drawn using a 70% intensity
level. A 75% level is used in the secondary
version.
3) Resolution Patch – The patch is made up of
six (6) smaller boxes that are each about 6.25%
of the height of the display. The boxes are
made of alternating intensity (0 and 100%)
stripes. The stripes run vertically and
horizontally. The stripes may be one (1), two
(2) or three (3) pixels wide each. Details of
the patch are shown in the lower half of the
4-55
Page 94

following illustration. The patches are located
in each corner of the main image and in the
center. They’re oriented with the highest
resolution and contrast boxes closest to the
outside corners. The 48%-53%, 48%-51% and
50%-51% level patches are omitted in the
secondary version.
4) Gray-Scale Boxes – Twelve (12) boxes at
eleven (11) intensity levels are clustered
around the center of the main image. They
start at 0% and increase in 10% steps to 100%
with two (2) boxes at a 50% level. All of the
gray-scale boxes are omitted in the secondary
version.
5) Gamma Check Dither Box – A small box is
drawn inside the right-hand 50% gray-scale
box. The box is half the width and height of
the larger box. The box consists of a checkerboard of alternate one-on and one-off pixels.
The alternate pixels have levels of 0 and 100%.
This smaller box is not part of the original
SMPTE specification and is omitted in the
secondary version.
6) Contrast Boxes – Two (2) boxes are drawn
adjacent to the gray-scale boxes. They’re at
0 and 100% levels. There are smaller boxes
drawn inside each box at 5 and 95% levels.
The contrast boxes are omitted in the
secondary version.
7) Black & White Windows – Two (2) horizontal
bars are located above and below the grayscale boxes. Their height equals 8% of the
display height. There are half-size bars
centered in the larger bars. In the primary
version, the dark portion of the windows is
at a 5% level and the bright portion is at a
95% level. Zero and 100% levels are used in
the secondary version.
4-56 Chapter 4: Built-In Images
Model 801GC, 801GF & 801GX¥Rev. X1
Page 95

SMPTE — contd.
8) Border – A border line is drawn around the
image. It’s set in from the edges of displayed
video a distance equal to 1% of the displayed
height and has a thickness equal to 0.5% of
the displayed height. The intensity level is
the same as that of the crosshatch lines.
9) Circle – A large circle is centered in the image.
It touches the top and bottom of the active
video area when the aspect ratio is wider
than it is high (landscape-type display). The
circle touches the left and right sides of active
video when the aspect ratio is taller than it
is wide (portrait-type display). The intensity
level is the same as that of the crosshatch
lines. The circle is not part of the original
SMPTE specification.
10) Resolution Data - The number of active pixels
per line and the number of active lines is
shown as text below the lower black-andwhite window. The pixel depth also is shown.
The intensity level of the text is the same as
that of the crosshatch lines. The displaying
of the data is not part of the original SMPTE
specification.
The secondary version adds a row of six (6)
Color Bars above and below the black-andwhite windows. The order of the colors, from
left to right, is red, green, blue, cyan (g+b),
magenta (r+b) and yellow (r+g). The top row
is drawn at 100% intensity levels and the
bottom row is drawn at 50% intensity levels.
Color bars are not part of the original SMPTE
specification.
4-57
Page 96

Primary version of
(SMPTE) RP-133
Quantum Data
30 40 50 50 60 70
20
10
0
H: 720
V: 350
D: 4
80
90
100
2 @ 51%
2 @ 50 %
Horizontal
2 @ 51%
2 @ 50 %
Vertical
2 @ 51%
2 @ 48 %
Horizontal
2 @ 51%
2 @ 48 %
Vertical
2 @ 53%
2 @ 48 %
Vertical
2 @ 53%
2 @ 48 %
Horizontal
Center detail of
RP-133
Gamma Check
Dither Box
30 40 50 50 60 70
20
10
0
0% and 5%
Contrast Boxes
95% and 100%
Contrast Boxes
80
90
100
1 @ 100%
1 @ 0 %
Vertical
1 @ 100%
1 @ 0 %
Horizontal
2 @ 100%
2 @ 0 %
Vertical
2 @ 100%
2 @ 0 %
Horizontal
3 @ 100%
3 @ 0 %
Horizontal
3 @ 100%
3 @ 0 %
Vertical
4-58 Chapter 4: Built-In Images
Model 801GC, 801GF & 801GX¥Rev. X1
Page 97

SMPTE — contd.
Test Deflection linearity
Method If the overall height and width of the display’s
active video area match the sizes in the format,
the large circle should be perfectly round. Each
box in the crosshatch pattern should be the same
size and shape. For more information on testing
linearity, please see the discussion on the Linearty
test image.
Test High contrast resolution
Meth od All the 0 and 100% level stripes in all the resolution
patches should be separate and distinct.
Test Low contrast resolution and noise
Method All the mid-level 2 on - 2 off stripes in all the
resolution patches should be visible and distinct.
This is a sensitive test for noise in the display’s
video amplifiers.
Test Quick gamma check
Method The average brightness level of the small gamma
dither box should match the brightness of the larger
surrounding box. This is a visual check to see if
the display’s gamma correction is producing the
correct mid-level response.
Test Video gain linearity and gamma
Method The individual gray-scale boxes all should be at
their indicated levels. A small aperture photometer
is usually required to get accurate and repeatable
readings.
Test Contrast and brightness check
Method On a display with properly adjusted brightness
and contrast controls, both the 5% and 95% contrast
boxes should be clearly visible inside their larger
surrounding 0% and 100% boxes.
4-59
Page 98

SMPTE — contd.
Test Video amplifier stability
Method The two black-and-white windows should show
sharp transitions between the smaller box and the
surrounding window. Streaking may be an
indication of undershoot or overshoot while ghost
images may indicate a ringing problem.
Test Excessive overscan and off-center alignment
Method The entire border should be clearly visible on the
face of the tube and not be hidden by the edge of
the glass or by any bezel.
Test Interlace flicker
Method The horizontal 1 On - 1 Off stripes in the resolution
boxes should not have objectionable flicker when
shown with an interlaced format. Excessive flicker
indicates that the combination of the display’s CRT
persistence and frame scan rate is below the
persistence time of the human eye.
4-60 Chapter 4: Built-In Images
Model 801GC, 801GF & 801GX¥Rev. X1
Page 99

SMPTEbar
Description: This image is based on an engineering guideline
(EG 1-1990) test signal specified by the Society of
Motion Picture and Television Engineers (SMPTE).
The SMPTE pattern, in turn, is derived from an EIA
standard test pattern (RS-189-A). The image, is set
up to be generated by an 801GX as an encoded TV
output. It is designed for adjusting the color settings
of a television monitor by eye. It can also be used
with a TV waveform analyzer and vectorscope for
testing video signal processors and color decoders.
The image is available on all models as a component
RGB signal. Some of the image’s elements have some
differences from the original SMPTE specification.
These differences are given in descriptions of the
individual elements.
1) The upper 67% of the image consists of a series
of color bars. These bars match the order of
the bars in the SMPTE and EIA patterns. They
are similar to the 801GX’s TVBar_75 image
without the last black bar.
2) The left hand side of the lower 25% of the image
contains isolated -I and Q color difference
signals that match the original EIA and SMPTE
patterns. The -I signal appears as a bluish gray
bar and the Q signal appears as a purple bar
on a TV monitor. The bars are separated by a
white (+100 IRE) bar.
3) The right hand side of the lower 25% of the
image contains a narrow 12.5 IRE gray bar.
Due to a hardware limitation on the 801GX,
this portion of the pattern does not match the
original EIA and SMPTE patterns. The original
patterns had +3.5 (blacker than black) and +11.5
IRE bars separated by a +7.5 IRE (black) bar.
4) The remaining central 8% of the image contains
a row of chroma set bars. These bars are part
of the SMPTE pattern but are not in the EIA
pattern. The order of the alternating color and
black bars matches those in the SMPTE pattern.
4-61
Page 100

Gray
Blue Mag Cyan Gray
-I
(Blue
Gray)
Yellow
White
Cyan
+Q
(Purple)
Green
Red
Magenta
Blue
5% Gray Bar
as it would appear on a TV monitor
SMPTEbar Image
A single scan line from the upper portion of the SMPTEbar
Image as it would appear on a TV waveform analyzer
4-62 Chapter 4: Built-In Images
connected to the 801GXÕs TV output
Model 801GC, 801GF & 801GX¥Rev. X1
 Loading...