

Page 1

DXi Advanced Reporting
6-67004-01 Rev A
DXi Advanced Reporting
DXi-Series
User’s Guide User’s Guide User’s Guide User’s Guide
Page 2

Quantum DXi Advanced Reporting User’s Guide, 6-67004-01 Rev A, June 2010, Product of USA.
Quantum Corporation provides this publication “as is” without warranty of any kind, either express or
implied, including but not limited to the implied warranties of merchantability or fitness for a particular
purpose. Quantum Corporation may revise this publication from time to time without notice.
COPYRIGHT STATEMENT
© 2010 Quantum Corporation. All rights reserved.
Your right to copy this manual is limited by copyright law. Making copies or adaptations without prior
written authorization of Quantum Corporation is prohibited by law and constitutes a punishable
violation of the law.
TRADEMARK STATEMENT
Quantum, the Quantum logo, DLT, DLTtape, the DLTtape logo, Scalar, and StorNext are registered
trademarks of Quantum Corporation, registered in the U.S. and other countries.
Backup. Recovery. Archive. It’s What We Do., the DLT logo, DLTSage, DXi, DXi-Series, Dynamic
Powerdown, FastSense, FlexLink, GoVault, MediaShield, Optyon, Pocket-sized. Well-armored, SDLT,
SiteCare, SmartVerify, StorageCare, Super DLTtape, SuperLoader, and Vision are trademarks of Quantum.
LTO and Ultrium are trademarks of HP, IBM, and Quantum in the U.S. and other countries. All other
trademarks are the property of their respective companies.
Specifications are subject to change without notice.
ii Quantum DXi Advanced Reporting User’s Guide
Page 3

Contents
Preface xiii
Chapter 1 DXi Advanced Reporting Introduction 1
About DXi Advanced Reporting. . . . . . . . . . . . . . . . . . . . . . . . . . . . . . . 1
Extension to DXi Remote Management . . . . . . . . . . . . . . . . . . 2
On Demand Reports . . . . . . . . . . . . . . . . . . . . . . . . . . . . . . . . . 2
Historical Data . . . . . . . . . . . . . . . . . . . . . . . . . . . . . . . . . . . . . 4
Logging Database . . . . . . . . . . . . . . . . . . . . . . . . . . . . . . . . . . . . . . . . . 4
Round Robin Database . . . . . . . . . . . . . . . . . . . . . . . . . . . . . . . 4
Database Resolution . . . . . . . . . . . . . . . . . . . . . . . . . . . . . . . . . 4
Performance Impact . . . . . . . . . . . . . . . . . . . . . . . . . . . . . . . . . . . . . . . 5
Chapter 2 DXi Advanced Reporting Installation 7
Verifying Version Compatibility . . . . . . . . . . . . . . . . . . . . . . . . . . . . . . . 7
Setting the Date and Time. . . . . . . . . . . . . . . . . . . . . . . . . . . . . . . . . . . 8
Obtaining DXi Advanced Reporting. . . . . . . . . . . . . . . . . . . . . . . . . . . . 9
Checking if DXi Advanced Reporting is Pre-Installed . . . . . . . . . 9
Downloading DXi Advanced Reporting. . . . . . . . . . . . . . . . . . . 9
Installing DXi Advanced Reporting . . . . . . . . . . . . . . . . . . . . . . . . . . . 10
Quantum DXi Advanced Reporting User’s Guide iii
Page 4

Contents
Adding the DXi Advanced Reporting License . . . . . . . . . . . . . 11
Uploading the DXi Advanced Reporting Software . . . . . . . . . 13
Activating the DXi Advanced Reporting Software (DXi3500 and
DXi5500). . . . . . . . . . . . . . . . . . . . . . . . . . . . . . . . . . . . . . . . . 17
Chapter 3 DXi Advanced Reporting Navigation 19
Accessing DXi Advanced Reporting . . . . . . . . . . . . . . . . . . . . . . . . . . . 19
Supported Browsers . . . . . . . . . . . . . . . . . . . . . . . . . . . . . . . . 20
Logging On to DXi Advanced Reporting . . . . . . . . . . . . . . . . . 21
Logging Off of DXi Advanced Reporting. . . . . . . . . . . . . . . . . 22
Using the Report Window . . . . . . . . . . . . . . . . . . . . . . . . . . . . . . . . . . 23
Menu . . . . . . . . . . . . . . . . . . . . . . . . . . . . . . . . . . . . . . . . . . . 24
Toolbar . . . . . . . . . . . . . . . . . . . . . . . . . . . . . . . . . . . . . . . . . . 25
View Controls . . . . . . . . . . . . . . . . . . . . . . . . . . . . . . . . . . . . . 26
Graphs . . . . . . . . . . . . . . . . . . . . . . . . . . . . . . . . . . . . . . . . . . 26
Working With Time Ranges . . . . . . . . . . . . . . . . . . . . . . . . . . . . . . . . . 27
Changing the Time Range. . . . . . . . . . . . . . . . . . . . . . . . . . . . 28
Working With Graphs . . . . . . . . . . . . . . . . . . . . . . . . . . . . . . . . . . . . . 32
Selecting the Base. . . . . . . . . . . . . . . . . . . . . . . . . . . . . . . . . . 33
First, Last, and Delta . . . . . . . . . . . . . . . . . . . . . . . . . . . . . . . . 34
Gaps in Graphs . . . . . . . . . . . . . . . . . . . . . . . . . . . . . . . . . . . . 34
Stacked and Layered Graphs. . . . . . . . . . . . . . . . . . . . . . . . . . 34
The Zero Line . . . . . . . . . . . . . . . . . . . . . . . . . . . . . . . . . . . . . 36
Interpreting Performance Data . . . . . . . . . . . . . . . . . . . . . . . . . . . . . . 37
Chapter 4 Advanced Reports 41
Reports and Graphs. . . . . . . . . . . . . . . . . . . . . . . . . . . . . . . . . . . . . . . 41
Report Descriptions . . . . . . . . . . . . . . . . . . . . . . . . . . . . . . . . . . . . . . . 43
Overview. . . . . . . . . . . . . . . . . . . . . . . . . . . . . . . . . . . . . . . . . 44
Capacity . . . . . . . . . . . . . . . . . . . . . . . . . . . . . . . . . . . . . . . . . 48
Capacity detail . . . . . . . . . . . . . . . . . . . . . . . . . . . . . . . . . . . . 51
Capacity delta - bytes/h. . . . . . . . . . . . . . . . . . . . . . . . . . . . . . 53
Capacity delta - bytes/s . . . . . . . . . . . . . . . . . . . . . . . . . . . . . . 56
Data Reduction . . . . . . . . . . . . . . . . . . . . . . . . . . . . . . . . . . . . 56
CPU load . . . . . . . . . . . . . . . . . . . . . . . . . . . . . . . . . . . . . . . . . 58
Ethernet I/O . . . . . . . . . . . . . . . . . . . . . . . . . . . . . . . . . . . . . . 60
Fibre Channel I/O . . . . . . . . . . . . . . . . . . . . . . . . . . . . . . . . . . 61
iv Quantum DXi Advanced Reporting User’s Guide
Page 5

Contents
Replication . . . . . . . . . . . . . . . . . . . . . . . . . . . . . . . . . . . . . . . 62
Space Reclamation . . . . . . . . . . . . . . . . . . . . . . . . . . . . . . . . . 64
System Load . . . . . . . . . . . . . . . . . . . . . . . . . . . . . . . . . . . . . . 65
Data Ingest Per Week . . . . . . . . . . . . . . . . . . . . . . . . . . . . . . . 68
Glossary 71
Quantum DXi Advanced Reporting User’s Guide v
Page 6

Contents
vi Quantum DXi Advanced Reporting User’s Guide
Page 7

Figures
Figure 1 DXi Advanced Reporting Overview Report . . . . . . . . . . . . . 3
Figure 2 License Key Management Page. . . . . . . . . . . . . . . . . . . . . 12
Figure 3 License Keys Page . . . . . . . . . . . . . . . . . . . . . . . . . . . . . . . 13
Figure 4 Software Page . . . . . . . . . . . . . . . . . . . . . . . . . . . . . . . . . 14
Figure 5 Login Window . . . . . . . . . . . . . . . . . . . . . . . . . . . . . . . . . 21
Figure 6 The Report Window . . . . . . . . . . . . . . . . . . . . . . . . . . . . . 23
Figure 7 Selecting a Report . . . . . . . . . . . . . . . . . . . . . . . . . . . . . . 25
Figure 8 Arranging Graphs . . . . . . . . . . . . . . . . . . . . . . . . . . . . . . . 27
Figure 9 Using the Timeline . . . . . . . . . . . . . . . . . . . . . . . . . . . . . . 29
Figure 10 Selecting a Preset Time Range . . . . . . . . . . . . . . . . . . . . . 29
Figure 11 Using the Navigation Buttons. . . . . . . . . . . . . . . . . . . . . . 30
Figure 12 Click and Drag to Zoom . . . . . . . . . . . . . . . . . . . . . . . . . . 31
Figure 13 Using the Preset Zoom Buttons . . . . . . . . . . . . . . . . . . . . 31
Figure 14 The Graph Legend . . . . . . . . . . . . . . . . . . . . . . . . . . . . . . 33
Figure 15 Selecting a Base . . . . . . . . . . . . . . . . . . . . . . . . . . . . . . . . 34
Figure 16 Layered Graph . . . . . . . . . . . . . . . . . . . . . . . . . . . . . . . . . 35
Figure 17 Stacked Graph . . . . . . . . . . . . . . . . . . . . . . . . . . . . . . . . . 36
Figure 18 Graph With a Zero Line. . . . . . . . . . . . . . . . . . . . . . . . . . . 36
Quantum DXi Advanced Reporting User’s Guide vii
Page 8

Figures
Figure 19 Amplitude Changes With Resolution . . . . . . . . . . . . . . . . 39
Figure 20 Data Volume Overview Graph . . . . . . . . . . . . . . . . . . . . . 45
Figure 21 Reduction Ratio Graph . . . . . . . . . . . . . . . . . . . . . . . . . . . 46
Figure 22 Fibre Channel Activity Graph . . . . . . . . . . . . . . . . . . . . . . 47
Figure 23 Ethernet Activity Graph . . . . . . . . . . . . . . . . . . . . . . . . . . 48
Figure 24 After Reduction vs. Used Disk Space Graph . . . . . . . . . . . 49
Figure 25 Before Reduction vs. After Reduction Graph. . . . . . . . . . . 50
Figure 26 After Reduction vs. Unique Data found Graph . . . . . . . . . 50
Figure 27 Before Reduction Graph . . . . . . . . . . . . . . . . . . . . . . . . . . 51
Figure 28 After Reduction Graph . . . . . . . . . . . . . . . . . . . . . . . . . . . 52
Figure 29 Unique Data found Graph . . . . . . . . . . . . . . . . . . . . . . . . 52
Figure 30 Used Disk Space Graph. . . . . . . . . . . . . . . . . . . . . . . . . . . 53
Figure 31 Combined - delta in Bytes/h Graph. . . . . . . . . . . . . . . . . . 54
Figure 32 Before Reduction - delta in Bytes/h Graph . . . . . . . . . . . . 54
Figure 33 After Reduction - delta in Bytes/h Graph . . . . . . . . . . . . . 55
Figure 34 Unique Data found - delta in Bytes/h Graph . . . . . . . . . . . 55
Figure 35 Used Disk Space - delta in Bytes/h Graph . . . . . . . . . . . . . 56
Figure 36 Deduplication Ratio Graph . . . . . . . . . . . . . . . . . . . . . . . . 57
Figure 37 Compression Ratio Graph. . . . . . . . . . . . . . . . . . . . . . . . . 58
Figure 38 CPU Load Average Graph . . . . . . . . . . . . . . . . . . . . . . . . . 58
Figure 39 CPU stats in % Graph . . . . . . . . . . . . . . . . . . . . . . . . . . . . 59
Figure 40 ethn Activity Graph. . . . . . . . . . . . . . . . . . . . . . . . . . . . . . 61
Figure 41 Fibre Channel Port n Activity Graph . . . . . . . . . . . . . . . . . 62
Figure 42 Namespace Replication % Complete Graph . . . . . . . . . . . 63
Figure 43 Continuous Replication % Complete Graph . . . . . . . . . . . 64
Figure 44 Space Reclamation Graph. . . . . . . . . . . . . . . . . . . . . . . . . 65
Figure 45 CPU Load Average Graph . . . . . . . . . . . . . . . . . . . . . . . . . 66
Figure 46 Disk I/O usage in % Graph . . . . . . . . . . . . . . . . . . . . . . . . 67
Figure 47 Data Ingest Volume per week Graph . . . . . . . . . . . . . . . . 69
viii Quantum DXi Advanced Reporting User’s Guide
Page 9

Figures
Figure 48 Data Ingest Volume per day Graph. . . . . . . . . . . . . . . . . . 69
Quantum DXi Advanced Reporting User’s Guide ix
Page 10

Figures
x Quantum DXi Advanced Reporting User’s Guide
Page 11

Ta b l e s
Table 1 Logging Database Resolution . . . . . . . . . . . . . . . . . . . . . . . 5
Table 2 Navigation Button Functions . . . . . . . . . . . . . . . . . . . . . . 30
Table 3 DXi Advanced Reporting Reports and Graphs. . . . . . . . . . 42
Table 4 Categories of Processes in the CPU stats in % Graph . . . . 59
Quantum DXi Advanced Reporting User’s Guide xi
Page 12

Tables
xii Quantum DXi Advanced Reporting User’s Guide
Page 13

Preface
Quantum® DXi™ Advanced Reporting provides performance data
logging and visual reporting and graphing features for Quantum DXi™Series systems.
This guide introduces DXi Advanced Reporting and discusses the
following topics:
• Installation
• Navigation
•Reports
Audience This guide is written for DXi operators and system administrators.
Document Organization This guide contains the following chapters:
• Chapter 1, DXi Advanced Reporting Introduction provides an
overview of the features of DXi Advanced Reporting.
• Chapter 2, DXi Advanced Reporting Installation provides step-bystep instructions for installing and running DXi Advanced Reporting
on a DXi system.
Quantum DXi Advanced Reporting User’s Guide xiii
Page 14

Preface
• Chapter 3, DXi Advanced Reporting Navigation describes how to
access and work with the Web-based user interface of DXi
Advanced Reporting.
• Chapter 4, Advanced Reports describes how to view and interpret
the available performance reports.
• Glossary provides definitions of technical terms used in this
document.
Notational Conventions This manual uses the following conventions:
Convention Example
User input is shown in bold font. ./DARTinstall
Computer output and command
./DARTinstall
line examples are shown in
monospace font.
User input variables are enclosed in
http://<ip_address>/reports
angle brackets.
For UNIX and Linux commands, the
command prompt is implied.
./DARTinstall
is the same as
# ./DARTinstall
File and directory names, menu
/data/upload
commands, button names, and
window names are shown in bold
font.
Menu names separated by arrows
Utilities > Software
indicate a sequence of menus to be
navigated.
The following formats indicate important information:
Note: Note emphasizes important information related to the main
topic.
Caution: Caution indicates potential hazards to equipment or data.
xiv Quantum DXi Advanced Reporting User’s Guide
Page 15

Preface
WARNING: Warning indicates potential hazards to personal safety.
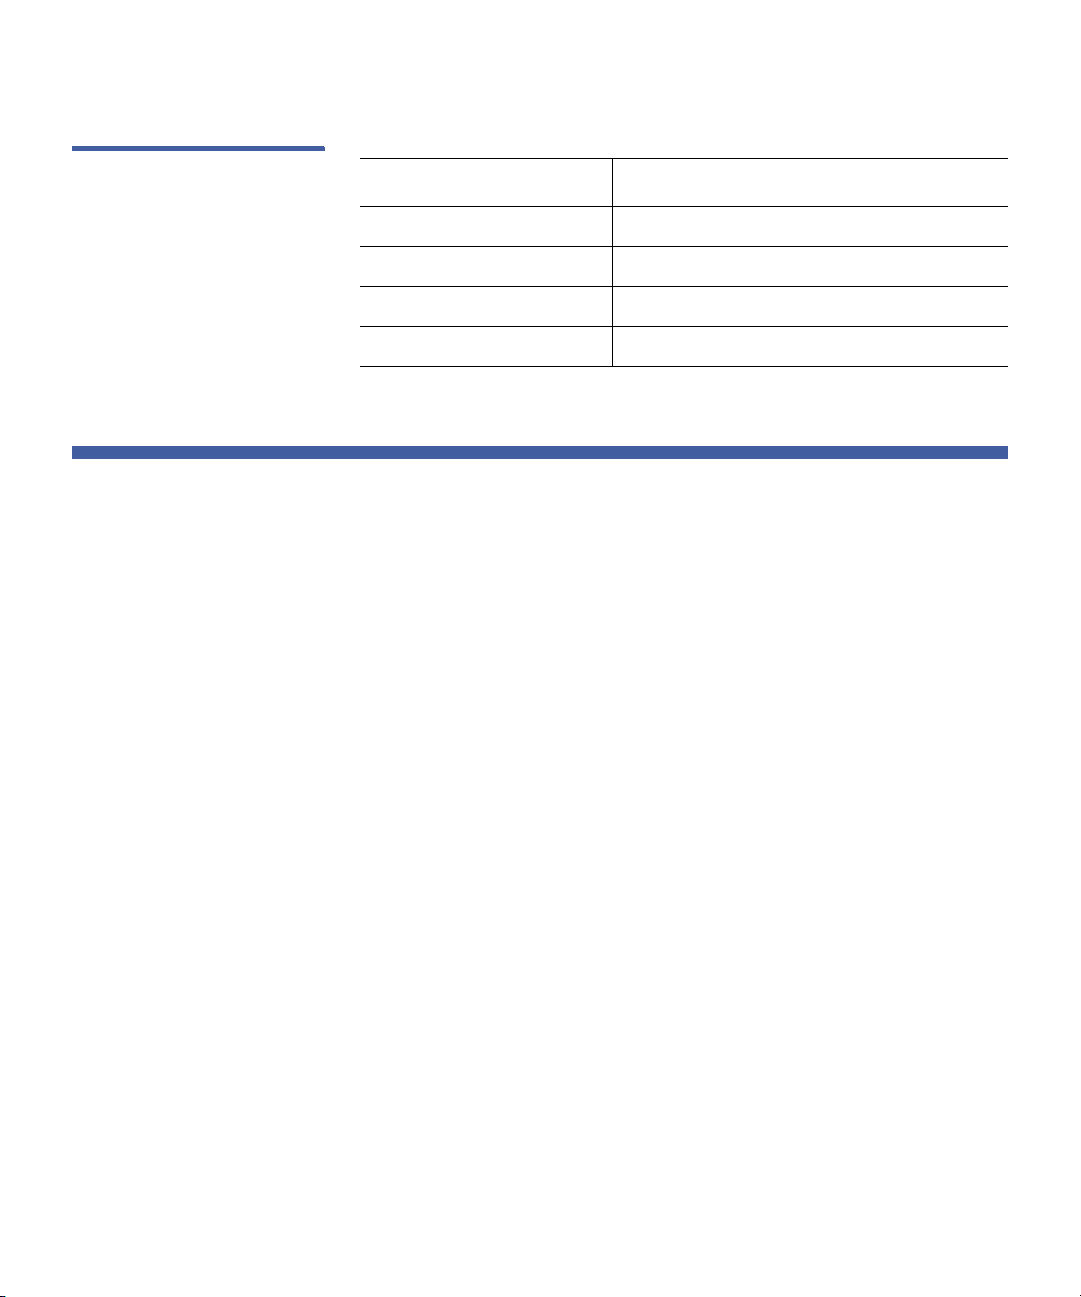
Related Documents The following Quantum documents are also available for DXi Advanced
Reporting and DXi systems:
Document No. Document Title Document Description
6-67003 Quantum DXi
Advanced Reporting
Release Notes
6-66591 Quantum DXi2500-D
User’s Guide
81-81701 Quantum DXi3500
and DXi5500 User’s
Guide
6-66904 Quantum DXi4500
User’s Guide
6-66639 Quantum DXi6500
User’s Guide
6-66586 Quantum DXi7500
User’s Guide
For the most up to date information on DXi Advanced Reporting, see:
Describes late-breaking
information about DXi
Advanced Reporting.
Describes DXi2500-D
operation and
administration.
Describes DXi3500 and
DXi5500 operation and
administration.
Describes DXi4500
operation and
administration.
Describes DXi6500
operation and
administration.
Describes DXi7500
operation and
administration.
http://www.quantum.com/ServiceandSupport/Index.aspx
Contacts Quantum company contacts are listed below.
Quantum DXi Advanced Reporting User’s Guide xv
Page 16
Preface
Quantum Corporate Headquarters
To order documentation on DXi Advanced Reporting or other products
contact:
Getting More
Information or Help
Quantum Corporation (Corporate Headquarters)
1650 Technology Drive, Suite 700
San Jose, CA 95110-1382
Technical Publications
To comment on existing documentation send e-mail to:
doc-comments@quantum.com
Quantum Home Page
Visit the Quantum home page at:
http://www.quantum.com
StorageCare™, Quantum’s comprehensive service approach, leverages
advanced data access and diagnostics technologies with crossenvironment, multi-vendor expertise to resolve backup issues faster and
at lower cost.
Accelerate service issue resolution with these exclusive Quantum
StorageCare services:
• Service and Support Website - Register products, license software,
browse Quantum Learning courses, check backup software and
operating system support, and locate manuals, FAQs, software
downloads, product updates and more in one convenient location.
Benefit today at:
http://www.quantum.com/ServiceandSupport/Index.aspx
• eSupport - Submit online service requests, update contact
information, add attachments, and receive status updates via
e-mail. Online Service accounts are free from Quantum. That
account can also be used to access Quantum’s Knowledge Base, a
comprehensive repository of product support information. Sign up
today at:
http://www.quantum.com/osr
xvi Quantum DXi Advanced Reporting User’s Guide
Page 17

Preface
• StorageCare Guardian - Securely links Quantum hardware and the
diagnostic data from the surrounding storage ecosystem to
Quantum's Global Services Team for faster, more precise root cause
diagnosis. StorageCare Guardian is simple to set up through the
internet and provides secure, two-way communications with
Quantum’s Secure Service Center. More StorageCare Guardian
information can be found at:
http://www.quantum.com/ServiceandSupport/Services/
GuardianInformation/Index.aspx
For further assistance, or if training is desired, contact Quantum
Customer Support Center:
United States 800-284-5101 (toll free)
949-725-2100
EMEA 00800-4-782-6886 (toll free)
+49 6131 3241 1164
APAC +800 7826 8887 (toll free)
+603 7953 3010
For worldwide support:
http://www.quantum.com/ServiceandSupport/Index.aspx
Worldwide End-User
Product Warranty
Quantum DXi Advanced Reporting User’s Guide xvii
For more information on the Quantum Worldwide End-User Standard
Limited Product Warranty:
http://www.quantum.com/pdf/QuantumWarranty.pdf
Page 18

Preface
xviii Quantum DXi Advanced Reporting User’s Guide
Page 19
Chapter 1
DXi Advanced Reporting
Introduction
This chapter introduces Quantum DXi Advanced Reporting and contains
the following sections:
• About DXi Advanced Reporting
• Logging Database
• Performance Impact
About DXi Advanced Reporting
Quantum DXi Advanced Reporting works with all DXi-Series disk backup
systems.
DXi Advanced Reporting combines comprehensive performance data
logging with powerful visual reporting and analysis tools to help you
identify potential problems and optimize system operation.
See the following sections for more information about DXi Advanced
Reporting:
• Extension to DXi Remote Management
• On Demand Reports
• Historical Data
Quantum DXi Advanced Reporting User’s Guide 1
Page 20

Chapter 1: DXi Advanced Reporting Introduction
About DXi Advanced Reporting
Extension to DXi
Remote Management
DXi Advanced Reporting is an extension to the DXi remote management
interface.
With DXi Advanced Reporting, you can view an array of performance
statistics for a DXi system and see how those statistics change over time.
This lets you identify trends or determine when a problem began.
By showing you how various operations affect performance, DXi
Advanced Reporting also helps you optimize the network ecosystem
and business procedures for backup, recovery, and replication.
On Demand Reports DXi Advanced Reporting runs on a DXi system and continually works in
the background to log performance data.
To view logged data, use DXi Advanced Reporting's graphical reports.
Reports are available on demand through a Web-based interface. You
can check up-to-the-minute system status or view data for any time
period since data logging began.
DXi Advanced Reporting reports let you view and work with a wealth of
performance and system statistics, such as:
• Capacity utilization
• Ethernet and Fibre Channel activity
• Data and system disk activity
•CPU load
• Data deduplication, replication, and space reclamation activities
Each report includes one or more graphs. Use the report tools to zoom
in on a graph to see just the time period you want to see, or zoom out
to see data for a longer time period.
No matter what time period you select, all of the graphs in the report
stay in sync. In addition, DXi Advanced Reporting maintains the current
time period when you select a new report. This lets you compare
performance data between graphs in the same report or between
different reports. For example, you can see how CPU load is affected
during deduplication or space reclamation activities.
Figure 1 shows an example of the Overview report.
2 Quantum DXi Advanced Reporting User’s Guide
Page 21
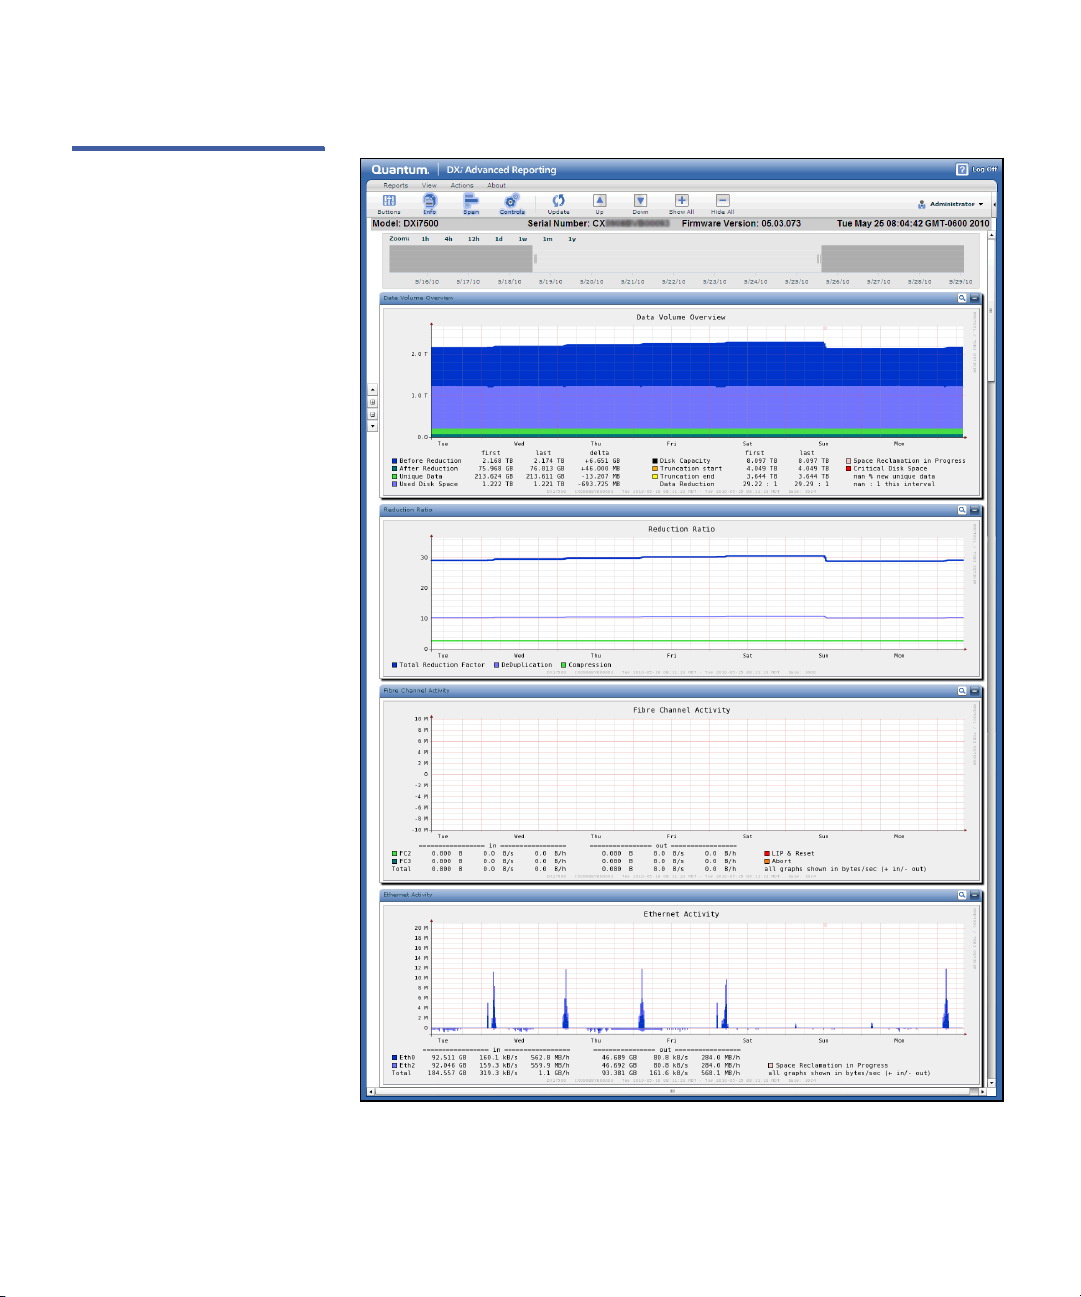
Figure 1 DXi Advanced
Reporting Overview Report
Chapter 1: DXi Advanced Reporting Introduction
About DXi Advanced Reporting
Quantum DXi Advanced Reporting User’s Guide 3
Page 22

Chapter 1: DXi Advanced Reporting Introduction
Logging Database
Historical Data DXi Advanced Reporting maintains approximately six years of logged
data, so you can view historical reports for any time period since
logging began—up to six years in the past.
DXi Advanced Reporting's historical record lets you compare current
performance to past performance. It also lets you see the effect of any
recent changes to system and network configuration or business
processes.
Logging Database
DXi Advanced Reporting records performance data in the logging
database. The database resides on the DXi system where DXi Advanced
Reporting is running.
See the following sections for more information about the logging
database:
• Round Robin Database
• Database Resolution
Round Robin Database The DXi Advanced Reporting logging database is a round robin style
database with a small, fixed size.
The database never grows larger than the fixed size. As new logging
data is added to the database, older data is overwritten as necessary,
thereby maintaining the fixed size. As a result, the logging database has
a negligible impact on storage capacity on the DXi system.
Database Resolution The logging database records performance data at two second intervals.
DXi Advanced Reporting aggregates this data over time to maintain
different resolutions for different time periods. The database resolution
is finer (more granular) for recent events and becomes coarser (less
granular) as you go back in time.
Ta bl e 1 lists the database resolutions that are maintained in the logging
database for each time period.
4 Quantum DXi Advanced Reporting User’s Guide
Page 23
Chapter 1: DXi Advanced Reporting Introduction
Performance Impact
Table 1 Logging Database
Resolution
Database Resolution Maintained For
2 seconds Data up to 7 days old
60 seconds Data from 7 days up to 400 days old
600 seconds Data from 400 days up to 3 years old
3,600 seconds Data from 3 years up to 6 years old
Performance Impact
DXi Advanced Reporting logging has a negligible impact on the
operation and performance of a DXi system.
• Most data is captured once every two seconds with a typical loop
time of only 2ms per capture.
• Total disk capacity used is limited to 2GB for the logging database.
• Disk contention is rare, and if it occurs DXi Advanced Reporting
logging has lower priority compared to system needs.
Quantum DXi Advanced Reporting User’s Guide 5
Page 24

Chapter 1: DXi Advanced Reporting Introduction
Performance Impact
6 Quantum DXi Advanced Reporting User’s Guide
Page 25
Chapter 2
DXi Advanced Reporting
Installation
This chapter describes how to install DXi Advanced Reporting on a
Quantum DXi system and contains the following sections:
• Verifying Version Compatibility
• Setting the Date and Time
• Obtaining DXi Advanced Reporting
• Installing DXi Advanced Reporting
Verifying Version Compatibility
Before you install DXi Advanced Reporting, make sure the system
software running on the DXi is a compatible version. Look at the Home
page of the DXi remote management pages to see what version of the
DXi software is installed on the system. The software version number
appears under System Details on the Home page.
The following DXi software versions are compatible with DXi Advanced
Reporting:
• DXi2500-D - Software version 1.1.1.4_25 or higher
• DXi4500, DXi6500, and DXi7500 - Software version 1.2.1 or higher
Quantum DXi Advanced Reporting User’s Guide 7
Page 26
Chapter 2: DXi Advanced Reporting Installation
Setting the Date and Time
• DXi3500 and DXi5500 - Software version 1.7.3.1 or higher
If the DXi system is running an older software version, you must update
it to a compatible version before installing DXi Advanced Reporting.
Note: For help accessing the DXi remote management pages, or for
information about updating the DXi system software, see the
User’s Guide for your DXi system.
Setting the Date and Time
Because data in the DXi Advanced Reporting database is time sensitive,
it is important that the date and time are correctly set on the DXi system
prior to installing DXi Advanced Reporting.
If the date and time are not correct on the DXi system, it will be difficult
to correlate DXi Advanced Reporting data with replication activity or to
associate problems with events in the customer ecosystem. For example,
the Replication report might show a problem starting at 6:00p.m., but
because the time on the DXi system was not correct, it will not be clear
that the problem is actually associated with congestion on the network
that began at 5:00p.m.
To make sure the time and date are always correct, configure the DXi
system to use an NTP (Network Time Protocol) server. For help with this
task, see the User’s Guide for your DXi system.
Caution: Not all Windows time servers offer NTP services. If a time
server does support the NTP protocol, you cannot use it as
a time source for DXi system. However, in this case, a third
party NTP application for Windows should work correctly.
8 Quantum DXi Advanced Reporting User’s Guide
Page 27

Chapter 2: DXi Advanced Reporting Installation
Obtaining DXi Advanced Reporting
DXi Advanced Reporting is pre-installed on all new DXi systems and is
available for download on existing systems. See the following sections
for more information:
• Checking if DXi Advanced Reporting is Pre-Installed
• Downloading DXi Advanced Reporting
Obtaining DXi Advanced Reporting
Checking if DXi
Advanced Reporting is
Pre-Installed
Downloading DXi
Advanced Reporting
If you purchased a DXi2500-D, DXi4500, DXi6500, or DXi7500 system
after June 2010, DXi Advanced Reporting may already be installed and
licensed on your system.
To see if DXi Advanced Reporting is already installed on your DXi, follow
the procedure for accessing DXi Advanced Reporting (see
Advanced Reporting on page 19). If you are able to access the login
screen, then DXi Advanced Reporting is pre-installed, and you do not
need to install or license it.
Note: For DXi3500 and DXi5500 systems, you must install DXi
Advanced Reporting.
To obtain DXi Advanced Reporting, download the DXi Advanced
Reporting software from the Quantum Service and Support site:
http://www.quantum.com/ServiceandSupport/Index.aspx
Under Select Your Product, navigate to the support page for your DXi
system and click the Diagnostics tab. Then download the DXi Advanced
Reporting software for your system.
• DXi2500-D, DXi4500, DXi6500, and DXi7500 - Download the
64-bit DXi Advanced Reporting software.
Accessing DXi
• DXi3500 and DXi5500 - Download the 32-bit DXi Advanced
Reporting software.
Quantum DXi Advanced Reporting User’s Guide 9
Page 28

Chapter 2: DXi Advanced Reporting Installation
Installing DXi Advanced Reporting
Note: Alternately, you can obtain the DXi Advanced Reporting
software and documentation on a CD. To request a CD, contact
your Quantum sales representative.
Running DXi Advanced Reporting on a DXi system requires a DXi
Advanced Reporting license. To obtain a license for DXi Advanced
Reporting, contact your Quantum sales representative. After you
request the license, you will receive a License Certificate containing an
authorization code.
Installing DXi Advanced Reporting
To install DXi Advanced Reporting on a DXi system, first add the DXi
Advanced Reporting license, then upload the DXi Advanced Reporting
software to the DXi.
For detailed steps, see the following sections:
• Adding the DXi Advanced Reporting License
• Uploading the DXi Advanced Reporting Software
Note: Uploading the DXi Advanced Reporting software does not
change the system software on the DXi. You do not need to
restart the system after installing DXi Advanced Reporting, and
installing DXi Advanced Reporting does not affect system
operation.
Note: Upgrading the system software on a DXi may cause DXi
Advanced Reporting to stop logging performance data.
Quantum recommends that you always obtain and install the
latest version of DXi Advanced Reporting after upgrading the
system software on a DXi.
10 Quantum DXi Advanced Reporting User’s Guide
Page 29

Chapter 2: DXi Advanced Reporting Installation
Installing DXi Advanced Reporting
Adding the DXi
Advanced Reporting
License
Locate the License Certificate you obtained from Quantum (see
Obtaining DXi Advanced Reporting on page 9). Then perform the
following steps:
Note: If you are installing DXi Advanced Reporting on a DXi2500-D
running software version 1.1.1.4_25, you do not need to add a
license. Instead, skip this procedure and continue with
Uploading the DXi Advanced Reporting Software on page 13. If
the DXi2500-D is running software version 1.4.1 or later, you
must add a license.
1 Open a Web browser on a computer with Internet access.
2 Enter one of the following addresses in the browser address box.
• For DXi3500 or DXi5500:
http://www.quantum.com/products/disk-basedbackup/
dxupgrades/index.aspx
• For DXi6500 or DXi7500:
http://www.quantum.com/licensekeys/upgrades/index.aspx
• For DXi2500-D or DXi4500, see the DXi Advanced Reporting
Release Notes (6-67003) for the latest information about
obtaining a license key.
The License Key Management page or the DXi-Series Upgrade
page displays (see
Quantum DXi Advanced Reporting User’s Guide 11
Figure 2).
Page 30

Chapter 2: DXi Advanced Reporting Installation
Installing DXi Advanced Reporting
Figure 2 License Key
Management Page
3 Enter the DXi system serial number in the Serial Number box and
click Submit.
Note: The serial number appears under System Details on the
Home page in the remote management pages.
The Licensed Feature page displays.
4 Enter the authorization code (printed on the License Certificate) and
click Get License Key.
The Licensed Feature page returns a license key. Print out or write
down the license key, or save it to a text file.
5 Access the DXi remote management pages.
For information about accessing the remote management pages,
see the User’s Guide for your DXi system.
6 From the Utilities menu, click the License Keys tab.
The License Keys page displays (see Figure 3).
12 Quantum DXi Advanced Reporting User’s Guide
Page 31

Figure 3 License Keys Page
Chapter 2: DXi Advanced Reporting Installation
Installing DXi Advanced Reporting
7 Enter the license key in the New Key field.
8 Click Add.
The DXi Advanced Reporting license key is added to the system.
Uploading the DXi
Advanced Reporting
Software
Locate the DXi Advanced Reporting software file you downloaded from
the Quantum Web site (or that you obtained on CD). Then perform the
following steps:
1 On a workstation that has network access to the DXi, launch a
supported Web browser on the workstation, and then log on to the
DXi remote management pages as an administrator.
For help logging on, see the User’s Guide for your DXi system.
2 If there are any outstanding Admin Alerts, you must delete them
before continuing.
For help deleting Admin Alerts, see the User’s Guide for your DXi
system.
3 From the Utilities menu, click the Software tab (or Firmware tab
on some systems).
The Software page displays (or Firmware page on some systems)
(see
Figure 4).
Quantum DXi Advanced Reporting User’s Guide 13
Page 32

Chapter 2: DXi Advanced Reporting Installation
Installing DXi Advanced Reporting
Figure 4 Software Page
4 Click the Browse button and locate the DXi Advanced Reporting
software file that you downloaded from the Quantum Web site.
Select the software file, and then click Open.
Or, insert the DXi Advanced Reporting Software CD in the CD-ROM
drive. The software file is located in the /ar directory.
Note: The software file ends with the .fw extension.
5 Click Upload.
A Warning message displays.
6 Click Start to begin the upload process.
An Information message displays stating the software image was
uploaded successfully.
Note: If an Error message displays, the software upload did not
complete successfully. See
Software Upload Errors on
page 16 for a description of errors and the correct action to
take.
7 Click OK.
Take the appropriate action depending on the DXi model:
14 Quantum DXi Advanced Reporting User’s Guide
Page 33

Chapter 2: DXi Advanced Reporting Installation
Installing DXi Advanced Reporting
• DXi3500 and DXi5500 - Do not complete the rest of this
procedure. Instead, continue with
Activating the DXi Advanced
Reporting Software (DXi3500 and DXi5500) on page 17.
Caution: In rare cases, an Activate/Remove New System
Software Image message might display on a
DXi3500 or DXi5500 system. If this occurs, do not
click Activate. Instead, click Remove to remove the
incomplete software file, then upload the DXi
Advanced reporting software again.
If you click Activate, the DXi system is not harmed
and its system software is not changed in any way.
However, the system will reboot and interrupt all
operations.
• DXi2500-D, DXi4500, DXi6500, and DXi7500 - An Activate/
Remove New System Software Image message displays at the
bottom of the Software page (scroll down to see the message).
Perform the following steps:
a Click Activate to activate the DXi Advanced Reporting
software.
A Confirmation message displays.
b Click Yes.
On some DXi systems, a Warning message displays.
The warning states the activating the software will cause
backup jobs to fail. However, this is only true if you are
updating the DXi system software. Installing DXi Advanced
Reporting will not affect system operation.
c If necessary, click Yes .
On some DXi systems, an Information message displays.
The message states that the system will restart and you
must log in again. However, this is only true if you are
updating the DXi system software. Installing DXi Advanced
Reporting will not affect system operation.
Installation is now complete. To access DXi Advanced
Reporting, see
Accessing DXi Advanced Reporting on
page 19.
Quantum DXi Advanced Reporting User’s Guide 15
Page 34

Chapter 2: DXi Advanced Reporting Installation
Installing DXi Advanced Reporting
Software Upload Errors
If the DXi system was not able to successfully upload the DXi Advanced
Reporting software, an Error message displays one of the following
errors:
• Error: Uploaded software image is corrupt or contains invalid
data.
This error occurs when the DXi system is unable to extract the DXi
Advanced Reporting software from the .fw file.
To correct this error:
a Click OK to close the Error message.
b Upload the DXi Advanced Reporting software again (see
Uploading the DXi Advanced Reporting Software on page 13).
If this error occurs again, the .fw file might be corrupted.
Download a new copy of the DXi Advanced Reporting software
(see
uploading the DXi Advanced Reporting software again.
• Error: This version can only be installed using the CD. Insert the
CD into the DX and reboot. Choose Upgrade from the Boot
Menu.
Obtaining DXi Advanced Reporting on page 9). Then try
This error occurs if the version of the DXi Advanced Reporting
software you uploaded does not support the software version
installed on the DXi system.
To correct this error:
a Click OK to close the Error message.
b Download the newest version of the DXi Advanced Reporting
software (see
Obtaining DXi Advanced Reporting on page 9).
If you already have the newest version of the DXi Advanced
Reporting software, then DXi Advanced Reporting is not
supported on the software version installed on the DXi system
(see
Verifying Version Compatibility on page 7).
c Upload the DXi Advanced Reporting software again (see
Uploading the DXi Advanced Reporting Software on page 13).
16 Quantum DXi Advanced Reporting User’s Guide
Page 35

Chapter 2: DXi Advanced Reporting Installation
Installing DXi Advanced Reporting
Activating the DXi
Advanced Reporting
Software (DXi3500 and
DXi5500)
For DXi3500 and DXi5500 systems only, the DXi Advanced Reporting
software must be manually activated after it is uploaded. This procedure
can be performed remotely by a Quantum Service Representative.
To request activation of the DXi Advanced Reporting software on a
DXi3500 or DXi5500, contact Quantum Customer Support (see
More Information or Help on page xvi).
Getting
Quantum DXi Advanced Reporting User’s Guide 17
Page 36

Chapter 2: DXi Advanced Reporting Installation
Installing DXi Advanced Reporting
18 Quantum DXi Advanced Reporting User’s Guide
Page 37
Chapter 3
DXi Advanced Reporting
Navigation
This chapter describes how to navigate in DXi Advanced Reporting and
contains the following sections:
• Accessing DXi Advanced Reporting
• Using the Report Window
• Working With Time Ranges
• Working With Graphs
• Interpreting Performance Data
Accessing DXi Advanced Reporting
Access DXi Advanced Reporting using a Web browser on a workstation
that is on the same network as the DXi system for which you want to
view reports.
See the following sections for more information about accessing DXi
Advanced Reporting:
• Supported Browsers
• Logging On to DXi Advanced Reporting
• Logging Off of DXi Advanced Reporting
Quantum DXi Advanced Reporting User’s Guide 19
Page 38

Chapter 3: DXi Advanced Reporting Navigation
Accessing DXi Advanced Reporting
Supported Browsers DXi Advanced Reporting is designed to run in any modern Web browser
that supports the Adobe Flash Player plug-in version 10.x and higher.
Web browser software is not included with DXi Advanced Reporting.
You must obtain and install it separately.
You must also install the correct version of the Adobe Flash Player plugin for your operating system and browser. DXi Advanced Reporting
requires Adobe Flash Player version 10.x or higher. To download and
install Flash Player, go to:
Note: You can also install the Adobe Flash Player plug-in using the
DXi Advanced Reporting Software CD (see
Using the Software CD on page 20).
Caution: DXi Advanced Reporting does not support the 64-bit
version of the Flash Player plug-in on Linux. Instead, use
the 32-bit Flash Player plug-in and a 32-bit browser.
http://www.adobe.com
Installing Flash
Installing Flash Using the Software CD
If your site does not allow Internet access, use the DXi Advanced
Reporting Software CD to install the Adobe Flash Player plug-in.
To install Flash Player:
1 Insert the DXi Advanced Reporting Software CD in the CD-ROM
drive of your computer.
2 On the CD, open the plugins directory, and then open the directory
for your operating system.
3 (Windows only) Open the activex directory (Internet Explorer) or
open the plugin directory (other browsers).
4 Double-click the Flash Player installer, and then follow the onscreen
instructions.
20 Quantum DXi Advanced Reporting User’s Guide
Page 39
Chapter 3: DXi Advanced Reporting Navigation
Accessing DXi Advanced Reporting
Logging On to DXi
Advanced Reporting
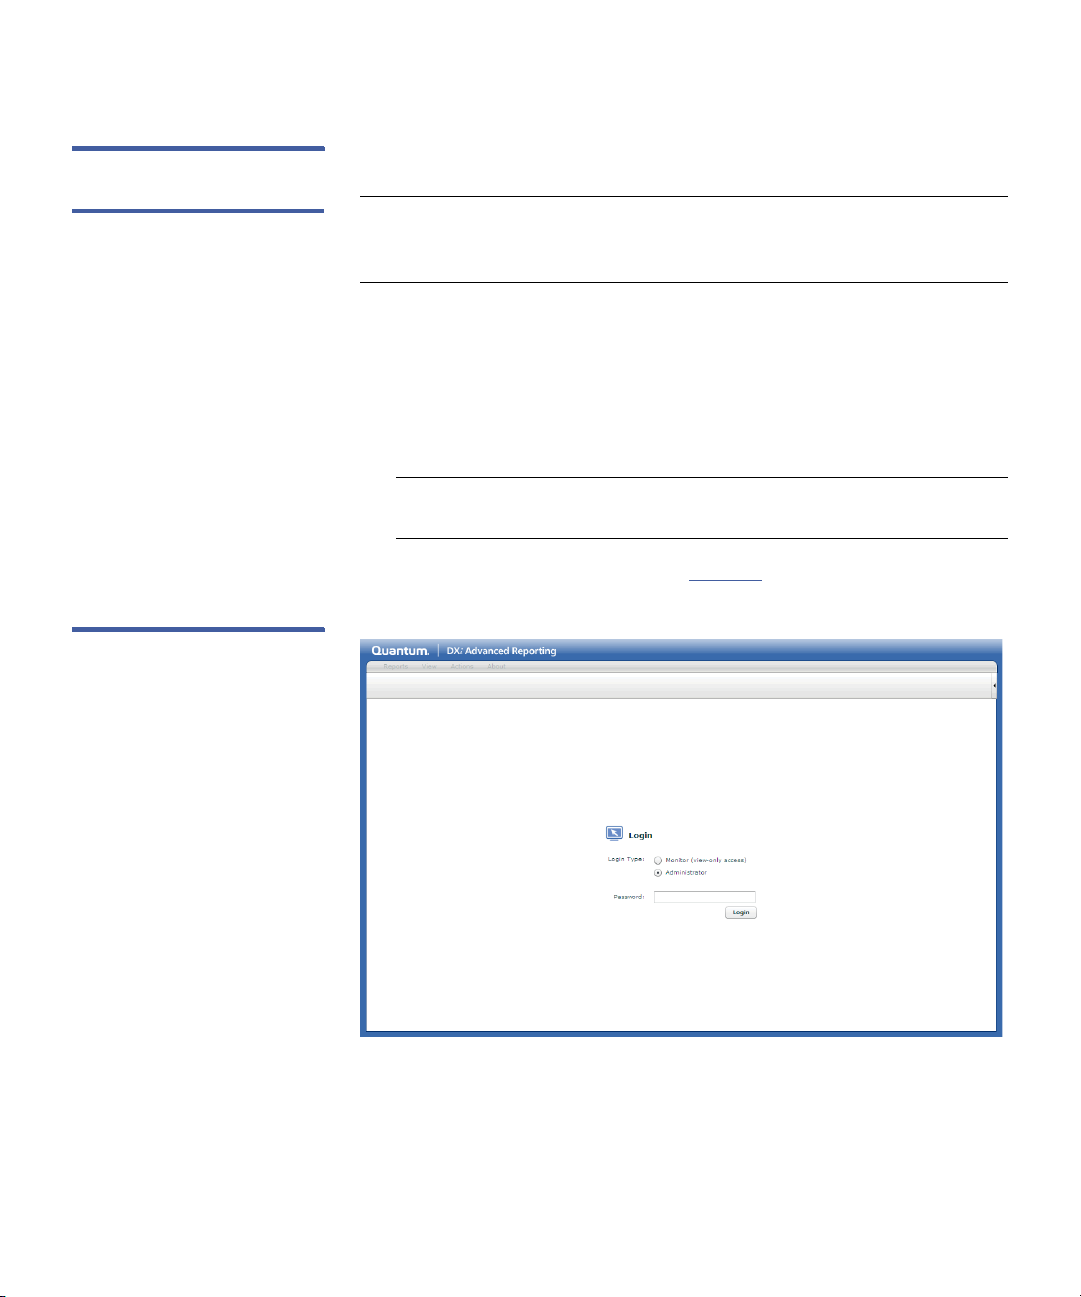
Figure 5 Login Window
To log on to DXi Advanced Reporting:
Note: This procedure assumes that DXi Advanced Reporting has been
installed and configured on the DXi system by a DXi
administrator.
1 Launch a supported Web browser on a workstation that has
network access to the DXi system for which you want to view
reports.
2 In the browser address box, type http://<IP_address>/reports
where <IP_address> is the IP address of the DXi, and then press
<Enter>.
Note: For information about setting the IP address of the DXi, see
the User's Guide for your DXi system.
The Login window displays (see Figure 5).
If the Login window does not display, verify that the IP address is
correct. Also verify that you are using a supported Web browser and
that the correct version of Adobe Flash Player is installed. Then try
again. If you are still unable to access the Login window, contact
your DXi administrator.
Quantum DXi Advanced Reporting User’s Guide 21
Page 40

Chapter 3: DXi Advanced Reporting Navigation
Accessing DXi Advanced Reporting
3 Select a login option:
• Monitor - Log on to the DXi as a monitor. A monitor can view
information on the DXi but cannot make changes.
• Administrator - Log on to the DXi as an administrator. An
administrator can view and chance information on the DXi.
Note: The functionality of DXi Advanced Reporting are the same
Note: If you previously logged on to the DXi as a monitor or
4 Enter the monitor or administrator Password for the DXi, and then
click Login.
for monitors and administrators. However, when you log
on to DXi Advanced Reporting, you are also logging on to
the DXi system. This means it is important to log on to DXi
Advanced Reporting with the appropriate user account.
administrator, and the login session has not timed out, you
do not need to log on to DXi Advanced Reporting.
Note: The default password is password. For information about
changing the monitor or administrator password, see the
User's Guide for your DXi system.
After a successful login, the report window displays (see Figure 6).
If you are unable to log on, verify that the password is correct, then
try again. If you are still unable to log on, contact your DXi
administrator.
Logging Off of DXi
Advanced Reporting
When you are done working in DXi Advanced Reporting, click the user
menu in the upper right of the report window, and then click Log Off to
end your DXi Advanced Reporting session.
22 Quantum DXi Advanced Reporting User’s Guide
Page 41

Using the Report Window
Menu
To ol b ar
System Information
Timeline
Button Bar
View Controls
Report Graphs
Log Off
Help
User Menu
The report window displays the performance graphs for the currently
selected report (see
Reporting, the Overview report displays. By default, the report shows
data for the most recent seven days.
The report window includes the following features:
• Menu
• Toolbar
• View Controls
• Graphs
Figure 6 The Report Window
Chapter 3: DXi Advanced Reporting Navigation
Using the Report Window
Figure 6). When you first access DXi Advanced
Quantum DXi Advanced Reporting User’s Guide 23
Page 42

Chapter 3: DXi Advanced Reporting Navigation
Using the Report Window
Menu The menu displays at the top of the report window and includes the
following options:
• Reports - Use the Reports menu to select a report to display (see
Figure 7).
DXi Advanced Reporting maintains the currently selected time range
when you choose a new report. For example, if you are currently
viewing the most recent day of logging for the Overview report, DXi
Advanced Reporting displays data for that same time range when
you select a new report. This makes it easy to compare different
performance statistics for the same time range.
Note: For more information about time ranges, see Working With
Time Ranges on page 27. For a description of the available
reports, see Advanced Reports on page 41.
• View - Use the View menu to show or hide the button bar
(Buttons), system information (Info), the timeline (Span), the
toolbar (To ol ba r), or the view controls (View Controls).
By default, all of these items are visible except for the button bar.
• Actions - Use the Actions menu to perform graph actions.
• Update - Updates the graphs in the currently displayed report
with the latest logging information.
• Scroll Up - Scrolls the graph order up by one graph.
• Scroll Down - Scrolls the graph order down by one graph.
• Show All Legends - Shows the title and legend on all graphs in
the report.
• Hide All Legends - Hides the title and legend on all graphs in
the report.
• About - Use the About menu to display version and license
information for DXi Advanced Reporting.
24 Quantum DXi Advanced Reporting User’s Guide
Page 43

Figure 7 Selecting a Report
Reports menu
Chapter 3: DXi Advanced Reporting Navigation
Using the Report Window
Toolbar The toolbar displays below the menu and includes the following
options:
• Buttons - Shows hides the button bar. (By default, the button bar is
hidden.)
• Info - Shows or hides the system information. (By default, the
system information is visible.)
The system information includes the DXi model, serial number,
software version, and the current date, time, and time zone.
• Span - Shows or hides the timeline. (By default, the timeline is
visible.)
• Controls - Shows or hides the view controls. (By default, the view
controls are visible.)
• Update - Updates the graphs in the currently displayed report with
the latest logging information.
• Up - Scrolls the graph order up by one graph.
• Down - Scrolls the graph order down by one graph.
• Show All - Shows the title and legend on all graphs in the report.
• Hide All - Hides the title and legend on all graphs in the report.
Quantum DXi Advanced Reporting User’s Guide 25
Page 44

Chapter 3: DXi Advanced Reporting Navigation
Using the Report Window
• User Menu - Displays the user that is currently logged on to DXi
Advanced Reporting. To log off, click the user menu, and then click
Log Off.
Note: To hide the toolbar, click the arrow on the right edge of the
toolbar. Click the arrow again to show the toolbar.
View Controls The view controls display on the left edge of the report window and
include the following options:
• Scroll Up - Scrolls the graph order up by one graph.
• Show All Legends - Shows the title and legend on all graphs in the
report.
• Hide All Legends - Hides the title and legend on all graphs in the
report.
• Scroll Down - Scrolls the graph order down by one graph.
Graphs Each report is made up of one or more graphs that show performance
data for the selected time range (see
appearance of a report by arranging the graphs in a different order.
• To change the order of the graphs, drag a graph by its title bar and
move it before or after another graph.
• To minimize a graph, click the minimize button (-) on the upper
right of the graph title bar. Click the minimized title bar to restore
the graph to full size.
• To hide the graph title and legend, click the magnifying glass on the
upper right of the graph title bar. Click the magnifying glass again
to show the graph title and legend.
Note: If you log off of DXi Advanced Reporting, the graphs are
restored to their default appearance the next time you log on.
26 Quantum DXi Advanced Reporting User’s Guide
Figure 7). Customize the
Page 45

Figure 8 Arranging Graphs
Minimize graph
Hide graph title and legend
Drag title bar to arrange
Working With Time Ranges
Chapter 3: DXi Advanced Reporting Navigation
Working With Time Ranges
A time range is like a window through which you view performance
data. Each report displays performance data for the time range you
choose. All graphs in a report display data for the same time range.
By default, DXi Advanced Reporting displays data for the most recent
seven days of logging. To view logged data for a different time range,
use the tools at the top of the report window. You can move the time
range backward and forward in time, and you can make the time range
longer or shorter.
When you change the time range, DXi Advanced Reporting
automatically adjusts the resolution of performance data. For example,
the resolution is finer (more granular) for shorter time ranges and is
Quantum DXi Advanced Reporting User’s Guide 27
coarser (less granular) for longer time ranges.
Note: No matter how long the time range is, DXi Advanced Reporting
scales all graphs in the report so that the time range uses the
entire width of each graph.
Page 46

Chapter 3: DXi Advanced Reporting Navigation
Working With Time Ranges
Changing the Time
Range
To view performance data for a different time range, use one of the
following methods:
• Using the Timeline
• Selecting a Preset Time Range
• Moving Forward and Backward
• Zooming With the Dynamic Zoom Feature
• Zooming With the Preset Zoom Buttons
• Specifying Start and End Times
• Resetting the Time Range
Note: The button bar displays the starting date and time and the
ending date and time of the current time range, as well as the
total length of the time range. It also displays the time zone of
the DXi. If the button bar is not visible, select View > Buttons.
Using the Timeline
To move the time range forward or backward in time, use the timeline
at the top of the report window (see
current time range used for the report.
Figure 9). The timeline displays the
Note: If the timeline is not visible, select View > Span.
• To move the time range backward or forward in time, drag the
timeline to the left or right. Then double-click the timeline to apply
the new time range to the report.
• To make the time range longer or shorter, drag the left and right
selection handles. Then double-click the timeline to apply the new
time range to the report.
28 Quantum DXi Advanced Reporting User’s Guide
Page 47

Figure 9 Using the Timeline
Drag handles to resize timeline
Drag timeline to move, or
double-click to apply new time range
Click a preset time range to apply it
Chapter 3: DXi Advanced Reporting Navigation
Working With Time Ranges
Selecting a Preset Time Range
To quickly display performance data for a different time range, use the
time range presets on the timeline (see
display data for 1 hour (1h), 4 hours (4h), 12 hours (12h), 1 day (1d), 1
week (1w), 1 month (1m), or 1 year (1y). After you click a preset,
double-click the timeline to apply the new time range to the report.
Note: If the timeline is not visible, select View > Span.
When you apply a preset, DXi Advanced Reporting resizes the time
range while maintaining the center of the time range. For example, if
you are currently viewing a one week time range that goes from Sunday
to Saturday, applying the 1d preset displays performance data for
Wednesday.
Figure 10). Click a preset to
Figure 10 Selecting a Preset
Time Range
Quantum DXi Advanced Reporting User’s Guide 29
Note: You can also use the button bar to apply time range presets. If
the button bar is not visible, select View > Buttons.
Moving Forward and Backward
Move the time range forward or backward in time using the navigation
buttons on the left or right of the button bar (see
Advanced Reporting shifts the time range while maintaining the length
of the time range.
Figure 11). DXi
Page 48

Chapter 3: DXi Advanced Reporting Navigation
Navigation buttons
Working With Time Ranges
Note: If the button bar is not visible, select View > Buttons.
Ta bl e 2 describes the functions of the navigation buttons.
Figure 11 Using the
Navigation Buttons
Table 2 Navigation Button
Functions
Button Description
<<< or
>>>
Moves the time range back or forward an amount
equal to the current time range.
<< or >> Moves the time range back or forward an amount
equal to one half of the current time range.
< or > Moves the time range back or forward an amount
equal to one quarter of the current time range.
Zooming With the Dynamic Zoom Feature
Use the dynamic zoom feature to select the part of a graph you want to
zoom in on and see in more detail (see
To zoom in on part of a graph:
1 Click and drag over the part of the graph you want to zoom in on.
DXi Advanced Reporting highlights the selected part of the graph.
2 (Optional) Drag the left and right selection handles to adjust the
size of the selection, or drag the selection area to move it.
3 Double-click the selection area.
Figure 12).
DXi Advanced Reporting zooms in on the time range so that the
selected area takes up the entire width of the graph.
To cancel the action and start over, click Clear on the upper left of
the graph.
30 Quantum DXi Advanced Reporting User’s Guide
Page 49

Figure 12 Click and Drag to
Click to clear the selection
Double-click to apply the selection
Click a preset zoom to apply it
Click to reset the time range to the
most recent seven days of logging
Zoom
Chapter 3: DXi Advanced Reporting Navigation
Working With Time Ranges
Zooming With the Preset Zoom Buttons
Use the preset zoom buttons on the button bar to zoom in or zoom out
on a report by a fixed factor (see
to specify a zoom factor of x0.25, x0.5, x2.0, or x4.0. When you zoom
in, DXi Advanced Reporting displays a shorter time range. When you
zoom out, DXi Advanced Reporting displays a longer time range. DXi
Advanced Reporting maintains the current center of the time range
when you zoom.
Figure 13). Click a preset zoom button
Note: If the button bar is not visible, select View > Buttons.
Figure 13 Using the Preset
Zoom Buttons
Specifying Start and End Times
The Start and End boxes on the button bar display the starting date and
time and the ending date and time for the current time range.
To change the time range using exact values, specify a new date and
Quantum DXi Advanced Reporting User’s Guide 31
time in the Start and End boxes, and then click reload. DXi Advanced
Page 50

Chapter 3: DXi Advanced Reporting Navigation
Working With Graphs
Reporting adjusts the time range to reflect the start and end times you
entered.
Note: Specify the starting or ending time in hours, minutes, and
seconds using a twenty four hour clock.
Note: If the button bar is not visible, select View > Buttons.
Resetting the Time Range
To reset the time range back to its original position, click reset range on
the button bar (see
range to display the most recent seven day of logging.
Note: If the button bar is not visible, select View > Buttons.
Figure 13). DXi Advanced Reporting adjusts the time
Working With Graphs
In DXi Advanced Reporting, each report is made up of one or more
graphs. Each graph shows a particular type of performance data for the
current time range. For example, the Overview report includes the
following graphs: Data Volume Overview, Reduction Ratio, Fibre
Channel Activity, and Ethernet Activity.
The horizontal axis of each graph represents time and displays the
current time range. The vertical axis varies depending on the graph. It is
often a capacity or data amount, but can also be a calculated value such
as a ratio, average, or percentage.
Below each graph is a color-coded legend. Use the legend to help read
and interpret the graph. For example, according to the legend for the
Data Volume Overview graph, bright green represents unique data
stored on the DXi system (see
32 Quantum DXi Advanced Reporting User’s Guide
Figure 14).
Page 51

Figure 14 The Graph Legend
Graph legend
Chapter 3: DXi Advanced Reporting Navigation
Working With Graphs
See the following sections for more information about graphs:
• Selecting the Base
• First, Last, and Delta
• Gaps in Graphs
• Stacked and Layered Graphs
• The Zero Line
Selecting the Base Different DXi models report data usage in different ways.
• DXi2500-D, DXi4500, DXi6500, and DXi7500 - Data is reported
using a base of 1000 bytes per kilobyte, or in TB. (Similar to disk and
tape drives.)
• DXi3500 and 5500 - Data is reported at 1024 bytes per kilobyte, or
in TiB. (Similar to most backup applications.)
This difference results in a disparity of over 10% in reported data sizes at
the terabyte level. For example, 27.3TiB reported at base 1024 becomes
30.0TB when reported at base 1000. Backup applications typically
report summaries in units of 1024. Tape drives, tape cartridges, and disk
drives report capacities in units of 1000.
DXi Advanced Reporting automatically selects the appropriate base for
each DXi model so that numeric results most closely match what is
displayed in the DXi remote management pages. To display data using a
different base, select it in the Base list on the button bar (see
DXi Advanced Reporting adjusts all report data to reflect the selected
base.
Quantum DXi Advanced Reporting User’s Guide 33
Figure 15).
Page 52

Chapter 3: DXi Advanced Reporting Navigation
Base list
Working With Graphs
Figure 15 Selecting a Base
First, Last, and Delta The graph legend for some graphs includes first, last, and delta values
for variables in the graph.
• first - The value of the variable at the start of the time range.
• last - The value of the variable at the end of the time range.
• delta - The net change in the value of the variable over the time
range (last minus first).
DXi Advanced Reporting provides these values so you do not have to try
to estimate them visually from the graph.
Gaps in Graphs A white gap in a graph indicates an absence of logging data for a period
of time. This can occur for the following reasons:
• A system reboot occurred.
• No DXi Advanced Reporting logging took place because the system
was busy.
• DXi Advanced Reporting logging was turned off.
Upgrading the software on a DXi3500/5500 system turns off DXi
Advanced Reporting logging. To resume logging, reinstall DXi Advanced
Reporting. Reinstalling DXi Advanced Reporting does not remove or
replace the existing logging database, and all previously logged data is
preserved.
Note: For information about installing DXi Advanced Reporting, see
DXi Advanced Reporting Installation on page 7.
Stacked and Layered
Graphs
34 Quantum DXi Advanced Reporting User’s Guide
DXi Advanced Reporting often displays data for multiple variables on
the same graph. This lets you see the interaction between different
variables.
Page 53

Chapter 3: DXi Advanced Reporting Navigation
Working With Graphs
DXi Advanced Reporting uses two different methods for placing
multiple variables on the same graph:
• Layered Graphs
• Stacked Graphs
Layered Graphs
DXi Advanced Reporting uses layered graphs to compare related
variables. A layered graph superimposes data for two or more variables
on top of one another. DXi Advanced Reporting assigns a different color
to each variable, so you can see how the values for each variable differ
over time.
For example, in the Data Volume Overview graph (see Figure 16), DXi
Advanced Reporting displays a separate value line for the variables
Before Reduction, After Reduction, and Unique Data.
Note: DXi Advanced Reporting always displays the smaller variable in
front of the larger variable. Because of this, shifts in the color
pattern in a graph can occur if the variable that was smaller
becomes larger at some point in time.
Figure 16 Layered Graph
Stacked Graphs
DXi Advanced Reporting uses stacked graphs to display aggregate
performance. A stacked graph adds together values for two or more
variables to arrive at a total value. DXi Advanced Reporting assigns a
different color to each variable, so you can see the contribution that
each variable makes to the total.
Quantum DXi Advanced Reporting User’s Guide 35
Page 54

Chapter 3: DXi Advanced Reporting Navigation
Data writes appear above the zero line
Data reads appear below the zero line
Working With Graphs
For example, in the Fibre Channel Activity graph (see Figure 17), values
for each Fibre Channel port are added together to reach a total value for
each point in the time range.
Figure 17 Stacked Graph
The Zero Line DXi Advanced Reporting uses graphs with a zero line to show when the
DXi system is being written to or being read from.
• Positive values (above the line) represent data being written to the
system.
• Negative values (below the line) represent data being read from the
system.
By using a zero line, DXi Advanced Reporting can show data reads and
writes on the same graph, for example, on the Ethernet Activity graph
(see
Figure 18).
Figure 18 Graph With a Zero
Line
36 Quantum DXi Advanced Reporting User’s Guide
Page 55

Interpreting Performance Data
The power of DXi Advanced Reporting is that it lets you compare
different types of performance data for the same time range. This lets
you see patterns and trends and helps you identify relationships
between events.
Keep in mind the following general concepts as you work with graphs in
DXi Advanced Reporting:
• Correlating Information Across Graphs
• Looking For Interactions Between Events
• Understanding the Effects of Time Resolution
Correlating Information Across Graphs
When you view a report, try to correlate information in one graph with
information in the other graphs.
Chapter 3: DXi Advanced Reporting Navigation
Interpreting Performance Data
Remember that all graphs in a report display the same time range and
always remain in sync. That means an event that happens in the center
of one graph can be correlated with an event that happens in the center
of another graph in the same (or in a different) report.
In other words, if you can draw a straight vertical line between events in
two graphs, then the events happened at the same time.
Looking For Interactions Between Events
As you work in DXi Advanced Reporting, look for interactions between
events in different graphs.
While correlation is not the same as causation, if you consistently see
that events in one graph happen at the same time as events in another
graph, there is a strong possibility that the two types of events are
related.
Understanding the Effects of Time Resolution
DXi Advanced Reporting displays graphs with 960 data points (pixels)
along the horizontal axis. However, the logging database usually
Quantum DXi Advanced Reporting User’s Guide 37
Page 56

Chapter 3: DXi Advanced Reporting Navigation
Interpreting Performance Data
contains more than 960 data points for the currently selected time
range (depending on the length of the time range).
DXi Advanced Reporting uses aggregation to convert the resolution of
the database to the resolution of the graph. This means that, in many
cases, each pixel in the graph is an aggregate of multiple data points in
the database. Depending on how many data points are aggregated to
create each pixel in the graph, the resulting value can change.
For example, consider a transfer on the Ethernet Activity graph that
lasts for 6 seconds. First it is displayed in a 32 minute time range, and
then in a 128 minute time range (see
• In the first example, the graph shows the transfer within a time
range of 32 minutes or 1,920 seconds. In this case, each pixel in the
graph represents 2 seconds of time. As a result, the transfer takes
up 3 pixels in the graph and displays a peak amplitude of 2.1MB/
second.
• In the second example, the graph shows the transfer within a time
range of 128 minutes, or 7,680 seconds. In this case, each pixel in
the graph represents 8 seconds of time. Even though the transfer is
only 6 seconds long, it cannot take up less than 1 pixel in the graph.
As a result, the transfer amount is averaged over 8 seconds,
resulting in a lower peak amplitude of 0.9MB/second.
Figure 19).
38 Quantum DXi Advanced Reporting User’s Guide
Page 57

Figure 19 Amplitude Changes
32 Minute time range: Peak amplitude is 2.1MB/second
128 Minute rime range: Peak amplitude is 0.9MB/second
With Resolution
Chapter 3: DXi Advanced Reporting Navigation
Interpreting Performance Data
The only difference between the two examples is the time resolution.
The underlying data did not change. The difference in amplitude is due
to the different number of data points DXi Advanced Reporting
aggregates when calculating the value for each pixel in the graph. Be
aware of this effect as you work with graphs and time ranges in DXi
Advanced Reporting.
Note: DXi Advanced Reporting always uses the finest resolution of
Quantum DXi Advanced Reporting User’s Guide 39
data available in the database. Finer-grained data is available
for more recent time ranges as opposed to time ranges further
in the past. This affects the number of data points DXi
Advanced Reporting aggregates when displaying a graph, and
in turn can affect amplitude.
Page 58

Chapter 3: DXi Advanced Reporting Navigation
Interpreting Performance Data
40 Quantum DXi Advanced Reporting User’s Guide
Page 59

This chapter provides information to help you interpret the reports
available in DXi Advanced Reporting and contains the following
sections:
• Reports and Graphs
• Report Descriptions
Reports and Graphs
Chapter 4
Advanced Reports
Each report available in DXi Advanced Reporting is made up of one or
more graphs. Some graphs appear in more than one report.
the graphs included in each report. For information about interpreting
each report, see
Note: For information about viewing reports, see Using the Report
Window on page 23.
Note: In Ta bl e 3, reports are designated as (L) for layered graphs or
(S) for stacked graphs. This distinction does not apply to graphs
that report only a single variable.
Quantum DXi Advanced Reporting User’s Guide 41
Report Descriptions on page 43.
Ta bl e 3 lists
Page 60

Chapter 4: Advanced Reports
Reports and Graphs
Table 3 DXi Advanced
Reporting Reports and Graphs
Report Graphs
Overview Data Volume Overview (L)
Reduction Ratio (L)
Fibre Channel Activity (S)
Ethernet Activity (S)
Capacity Data Volume Overview (L)
After Reduction vs. Used Disk Space (L)
Before Reduction vs. After Reduction (L)
After Reduction vs. Unique Data found (L)
Reduction Ratio (L)
Capacity detail Data Volume Overview (L)
Before Reduction
After Reduction
Unique Data found
Used Disk Space
Capacity delta -
bytes/h
Data Volume Overview (L)
Combined - delta in Bytes/h (L)
Before Reduction - delta in Bytes/h
After Reduction - delta in Bytes/h
Unique Data found - delta in Bytes/h
Used Disk Space - delta in Bytes/h
Capacity delta -
bytes/s
Data Volume Overview (L)
Combined - delta in Bytes/s (L)
Before Reduction - delta in Bytes/s
After Reduction - delta in Bytes/s
Unique Data found - delta in Byte/s
Used Disk Space - delta in Byte/s
Data Reduction Data Volume Overview (L)
Reduction Ratio (L)
Deduplication Ratio
Compression Ratio
42 Quantum DXi Advanced Reporting User’s Guide
Page 61

Chapter 4: Advanced Reports
Report Descriptions
Report Graphs
CPU load CPU Load Average
CPU stats in % (S)
Ethernet I/O Ethernet Activity (S)
ethn Activity
Fibre Channel I/O Fibre Channel Activity (S)
Fibre Channel Port n Activity
Replication Namespace Replication % Complete (L)
Continuous Replication % Complete (L)
Space Reclamation Space Reclamation
System Load CPU Load Average (logarithmic scale)
CPU stats in % (S)
Disk I/O usage in % (S)
Fibre Channel Activity (S)
Ethernet Activity (S)
Data Ingest per week Data Volume Overview (L)
Data Ingest Volume per week (S)
Reduction Ratio (L)
Data Ingest Volume per day (S)
Report Descriptions
This section describes the graphs included in the following reports
available in DXi Advanced Reporting:
• Overview
• Capacity
• Capacity detail
• Capacity delta - bytes/h
Quantum DXi Advanced Reporting User’s Guide 43
Page 62

Chapter 4: Advanced Reports
Report Descriptions
• Capacity delta - bytes/s
• Data Reduction
• CPU load
• Ethernet I/O
• Fibre Channel I/O
• Replication
• Space Reclamation
• System Load
• Data Ingest Per Week
Overview The Overview report displays key statistics for a DXi system, including
the amount of data processed by the system, the reduction ratio, and
the levels of I/O activity. The report contains the following graphs:
• Data Volume Overview
• Reduction Ratio
• Fibre Channel Activity
• Ethernet Activity
Data Volume Overview
The Data Volume Overview graph (see Figure 20) displays information
about the amount of data processed by the system.
Note: The Data Volume Overview graph appears in many reports.
Note: The Data Volume Overview graph is a layered graph. In a
layered graph, multiple variables are superimposed on top of
one another (see Stacked and Layered Graphs on page 34).
44 Quantum DXi Advanced Reporting User’s Guide
Page 63

Figure 20 Data Volume
Overview Graph
Chapter 4: Advanced Reports
Report Descriptions
Use the Data Volume Overview graph to evaluate the overall health of
the system.
• Used Disk Space (light blue) increases as data is ingested by the
system. This happens because data is truncated only when the
truncation threshold is reached.
Note: On DXi3500/5500 systems, Used Disk Space increases less
markedly as data is ingested. This happens because data is
truncated immediately as it is deduplicated.
• As data is deduplicated, Before Reduction (dark blue), After
Reduction (dark green), and Unique Data (light green) increase. If
deduplication is deferred on the system, some time passes before
these values begin to increase.
•If Before Reduction is decreasing, it means space reclamation is in
progress.
• Lines on the graph indicate physical disk capacity of the system
(black) and the level of disk usage at which used disk space is
considered to be critical (red).
• (DXi systems) Lines on the graph indicate the level of disk usage
at which truncation of data starts (orange), and the level of disk
usage at which truncation ends (yellow).
• (DXi 3500/5500 systems) A line on the graph indicates the
licensed disk capacity (yellow).
• A pink bar at the top of the graph indicates that space reclamation
is in progress. Space reclamation activity is resource intensive and
can affect the rate at which the system deduplicates data or
performs namespace replication.
Quantum DXi Advanced Reporting User’s Guide 45
Page 64

Chapter 4: Advanced Reports
Report Descriptions
Figure 21 Reduction Ratio
Graph
Reduction Ratio
The Reduction Ratio graph (see Figure 21) displays the data reduction
factor for the system. The higher the reduction ratio, the less space that
is used to store the same amount of ingested data.
Use the Reduction Ratio graph to evaluate the effectiveness of data
reduction in the system.
• The light blue line shows the reduction factor for deduplication
(Before Reduction divided by Unique Data).
• The green line shows the reduction factor for compression (Unique
Data divided by After Reduction).
• The dark blue line shows the total reduction factor (Before
Reduction divided by After Reduction).
This value corresponds to the Total Reduction Ratio value displayed
on the Home page in the DXi remote management pages.
Note: The reduction ratio is in flux during space reclamation or
during incoming replication because these activities affect the
Before Reduction amounts.
Fibre Channel Activity
The Fibre Channel Activity graph (see Figure 22) displays the amount
of data passing through all of the Fibre Channel ports in the system.
46 Quantum DXi Advanced Reporting User’s Guide
Page 65

Figure 22 Fibre Channel
Activity Graph
Chapter 4: Advanced Reports
Report Descriptions
Use the Fibre Channel Activity graph to monitor writes to and reads
from the system using the Fibre Channel ports.
• The graph shows each port in a different color.
• Fibre Channel write activity (above the zero line) occurs during
backups.
• A regular backup schedule results in repeating patterns.
• A high amplitude left edge indicates that a large number of
client backups start at the same time.
• Fibre Channel read activity (below the zero line) occurs during VTL
restore operations.
• Symmetrical read and write activity (that is, mirrored patterns above
and below the zero line) indicate Tivoli Storage Manager (TSM) tape
reclamation.
• A red line at the top of the graph indicates a Fibre Channel loop
initialization primitives (LIP) or reset occurred. An orange line at the
top of the graph indicates a Fibre Channel abort occurred.
Ethernet Activity
The Ethernet Activity graph (see Figure 23) displays the amount of data
passing through all of the Ethernet ports in the system.
Quantum DXi Advanced Reporting User’s Guide 47
Page 66

Chapter 4: Advanced Reports
Report Descriptions
Figure 23 Ethernet Activity
Graph
Use the Ethernet Activity graph to monitor writes to and reads from
the system using the Ethernet ports.
• The graph shows each port in a different color.
In the example above, the symmetry between the two shades of
blue indicates the two Ethernet ports are bonded and traffic is
balanced across both ports.
• Write activity (above the zero line) indicates target replication to the
system, NAS backup or restore operations, or management activity.
• Read activity (below the zero line) indicates source replication from
the system, NAS backup or restore operations, or management
activity.
• A pink bar at the top of the graph indicates that space reclamation
is in progress. Space reclamation activity is resource intensive and
can affect the rate at which the system deduplicates data or
performs namespace replication.
Capacity The Capacity report displays information about utilized storage space,
including the amount of data processed by the system and data
reduction statistics. The report contains the following graphs:
• Data Volume Overview
• After Reduction vs. Used Disk Space
• Before Reduction vs. After Reduction
• After Reduction vs. Unique Data found
• Reduction Ratio
48 Quantum DXi Advanced Reporting User’s Guide
Page 67

Figure 24 After Reduction vs.
Used Disk Space Graph
Chapter 4: Advanced Reports
Report Descriptions
Data Volume Overview
See Data Volume Overview on page 44.
After Reduction vs. Used Disk Space
The After Reduction vs. Used Disk Space graph (see Figure 24)
compares the data stored after reduction (including deduplication and
compression) and the used disk space on the system.
Use the After Reduction vs. Used Disk Space graph to monitor the
amount of disk space that can be freed during space reclamation.
• After Reduction (dark green) increases as more unique,
compressed data is stored on the system.
• Used Disk Space (light blue) increases until it reaches the
truncation threshold (orange line), then goes down until truncation
ends (yellow line).
Note: DXi3500/5500 systems continuously truncate data, not just
when the truncation threshold is reached. Only
deduplicated data is truncated.
•If Used Disk Space exceeds the truncation start line (orange line)
while After Reduction remains below the line, then there is data in
the buffer that has not been deduplicated. Once the queued data is
deduplicated, Used Disk Space will decrease as data is truncated.
Before Reduction vs. After Reduction
The Before Reduction vs. After Reduction graph (see Figure 25)
compares the amount of data ingested by the system to the amount of
unique and compressed data.
Quantum DXi Advanced Reporting User’s Guide 49
Page 68

Chapter 4: Advanced Reports
Report Descriptions
Figure 25 Before Reduction vs.
After Reduction Graph
Use the Before Reduction vs. After Reduction graph to evaluate the
effectiveness of data reduction in the system.
• Before Reduction (dark blue) increases as the system ingests data.
• Unique Data (bright green) shows the amount of data that remains
after ingested data is deduplicated and pointers are substituted for
redundant data. Unique Data increases more slowly than Before
Reduction because, as time goes on, less of the data ingested by
the system is unique.
• After Reduction (dark green) shows the amount of data that
remains after ingested data is both deduplicated and compressed.
After Reduction vs. Unique Data found
The After Reduction vs. Unique Data found graph (see Figure 26)
compares the amount of unique data before and after compression.
Figure 26 After Reduction vs.
Unique Data found Graph
Use the After Reduction vs. Unique Data found graph to evaluate the
effectiveness of data compression.
• Unique Data (bright green) shows the amount of data that remains
after ingested data is deduplicated and pointers are substituted for
redundant data.
• After Reduction (dark green) shows the amount of data that
remains after ingested data is both deduplicated and compressed.
50 Quantum DXi Advanced Reporting User’s Guide
Page 69

Chapter 4: Advanced Reports
Report Descriptions
Reduction Ratio
See Reduction Ratio on page 46.
Capacity detail The Capacity detail report displays information about utilized storage
space, including the amount of data before and after data reduction.
The report contains the following graphs:
• Data Volume Overview
• Before Reduction
• After Reduction
• Unique Data found
• Used Disk Space
Data Volume Overview
See Data Volume Overview on page 44.
Before Reduction
The Before Reduction graph (see Figure 27) displays the total amount
of data ingested by the system. Use the Before Reduction graph to see
how much data the system is processing.
Figure 27 Before Reduction
Graph
After Reduction
The After Reduction graph (see Figure 28) displays the amount of data
that remains after ingested data is both deduplicated and compressed.
Quantum DXi Advanced Reporting User’s Guide 51
Page 70

Chapter 4: Advanced Reports
Report Descriptions
Figure 28 After Reduction
Graph
Use the After Reduction graph to see the amount of deduplicated,
compressed data stored on the system.
Unique Data found
The Unique Data found graph (see Figure 29) displays the amount of
data that remains after ingested data is deduplicated but before it is
compressed and pointers are substituted for redundant data. Use the
Unique Data found graph to see the amount of deduplicated data
stored on the system.
Figure 29 Unique Data found
Graph
Used Disk Space
The Used Disk Space graph (see Figure 30) displays the amount of disk
capacity that is used to store data, including deduplicated data and
data that has not been deduplicated.
52 Quantum DXi Advanced Reporting User’s Guide
Page 71

Figure 30 Used Disk Space
Graph
Chapter 4: Advanced Reports
Report Descriptions
Use the Used Disk Space graph to see the amount of used and free disk
capacity on the system.
• Used Disk Space (light blue) increases until it reaches the
truncation threshold (orange line), then goes down until truncation
ends (yellow line).
Note: DXi3500/5500 systems continuously truncate data, not just
when the truncation threshold is reached. Only
deduplicated data.
•If Used Disk Space exceeds the critical disk space threshold (red
line, not shown in
Figure 30), the DXi enters critical disk space
management mode.
Note: Note: Some lines (for example, critical disk space) may not be
visible on the graph if they lie above the top of the y-axis.
Capacity delta - bytes/h The Capacity delta - bytes/h report displays information about changes
in the amount of data stored on the system. Amounts are reported in
bytes per hour. The report contains the following graphs:
• Data Volume Overview
• Combined - delta in Bytes/h
• Before Reduction - delta in Bytes/h
• After Reduction - delta in Bytes/h
• Unique Data found - delta in Bytes/h
• Used Disk Space - delta in Bytes/h
Quantum DXi Advanced Reporting User’s Guide 53
Page 72

Chapter 4: Advanced Reports
Report Descriptions
Figure 31 Combined - delta in
Bytes/h Graph
Data Volume Overview
See Data Volume Overview on page 44.
Combined - delta in Bytes/h
The Combined - delta in Bytes/h graph (see Figure 31) displays
changes to the values for Before Reduction, Unique Data, and After
Reduction in bytes per hour.
Use the Combined - delta in Bytes/h graph to see increases and
decreases in the total amount of data stored on the system.
• Values above the zero line indicate an increase in data stored.
• Values below the zero line indicate a decrease in data stored.
Before Reduction - delta in Bytes/h
The Before Reduction - delta in Bytes/h graph (see Figure 32) displays
changes to the value for Before Reduction in bytes per hour.
Figure 32 Before Reduction delta in Bytes/h Graph
Use the Before Reduction - delta in Bytes/h graph to see increases and
decreases in the amount of ingested (not deduplicated, not
compressed) data stored on the system.
54 Quantum DXi Advanced Reporting User’s Guide
Page 73

Figure 33 After Reduction delta in Bytes/h Graph
Chapter 4: Advanced Reports
Report Descriptions
• Values above the zero line indicate an increase in data stored.
• Values below the zero line indicate a decrease in data stored.
After Reduction - delta in Bytes/h
The After Reduction - delta in Bytes/h graph (see Figure 33) displays
changes to the value for After Reduction in bytes per hour.
Use the After Reduction - delta in Bytes/h graph to see increases and
decreases in the amount of deduplicated, compressed data stored on
the system.
• Values above the zero line indicate an increase in data stored.
• Values below the zero line indicate a decrease in data stored.
Unique Data found - delta in Bytes/h
The Unique Data found - delta in Bytes/h graph (see Figure 34)
displays changes to the value for Unique Data in bytes per hour.
Figure 34 Unique Data found delta in Bytes/h Graph
Use the Unique Data found - delta in Bytes/h graph to see increases
and decreases in the amount of deduplicated data stored on the system.
• Values above the zero line indicate an increase in data stored.
Quantum DXi Advanced Reporting User’s Guide 55
Page 74

Chapter 4: Advanced Reports
Report Descriptions
Figure 35 Used Disk Space delta in Bytes/h Graph
• Values below the zero line indicate a decrease in data stored.
Used Disk Space - delta in Bytes/h
The Used Disk Space - delta in Bytes/h graph (see Figure 35) displays
changes to the value for Used Disk Space in bytes per hour.
Use the Used Disk Space - delta in Bytes/h graph to see increases and
decreases in the amount disk capacity that is used to store data,
including deduplicated data and data that has not been deduplicated.
• Values above the zero line indicate an increase in data stored.
• Values below the zero line indicate a decrease in data stored.
Capacity delta - bytes/s The Capacity delta - bytes/s report displays information about changes
in the amount of data stored on the system.
This report includes the same graphs as the Capacity delta - bytes/h
report. However, values are reported in bytes per second rather than in
bytes per hour. For more information, see
Capacity delta - bytes/h on
page 53.
Data Reduction The Data Reduction report displays detailed data reduction statistics.
The report contains the following graphs:
• Data Volume Overview
• Reduction Ratio
• Deduplication Ratio
• Compression Ratio
56 Quantum DXi Advanced Reporting User’s Guide
Page 75

Figure 36 Deduplication Ratio
Graph
Chapter 4: Advanced Reports
Report Descriptions
Data Volume Overview
See Data Volume Overview on page 44.
Reduction Ratio
See Reduction Ratio on page 46.
Deduplication Ratio
The Deduplication Ratio graph (see Figure 36) displays the
deduplication factor for the system. The higher the deduplication ratio,
the less space that is used to store the same amount of raw data. Use
the Deduplication Ratio graph to evaluate the effectiveness of
deduplication in the system.
Note: The deduplication ratio is in flux during space reclamation or
during incoming replication because these activities affect the
Before Reduction amounts.
Compression Ratio
The Compression Ratio graph (see Figure 37) displays the compression
factor for the system. The higher the compression ratio, the less space
that is used to store the same amount of deduplicated data. Use the
Compression Ratio graph to evaluate the contribution of compression
to overall data reduction and space savings.
Note: The compression ratio is in flux during space reclamation or
during incoming replication because these activities affect the
Before Reduction amounts.
Quantum DXi Advanced Reporting User’s Guide 57
Page 76

Chapter 4: Advanced Reports
Report Descriptions
Figure 37 Compression Ratio
Graph
CPU load The CPU Load report displays information about the usage of CPU
resources in the system. The report contains the following graphs:
• CPU Load Average
• CPU stats in %
CPU Load Average
The CPU Load Average graph (see Figure 38) displays the one minute
load average for the system.
Figure 38 CPU Load Average
Graph
Use the CPU Load Average graph to determine if the system has
adequate CPU resources.
• The load average represents the average number of processes, in a
one minute time period, that were running on a CPU or that were
waiting to run on a CPU.
• A load average higher than the number of CPU cores in the system
indicates that the system is CPU limited.
For example, a typical DXi system has four CPUs. In this case, a load
average of greater than four means that some processes had to wait
for an available CPU before running. In contrast, a load average of
less than four means no processes had to wait for a CPU.
58 Quantum DXi Advanced Reporting User’s Guide
Page 77

Figure 39 CPU stats in %
Graph
Chapter 4: Advanced Reports
Report Descriptions
Note: A CPU load higher than 8 on a DXi3500/5500 system or higher
than 15 on other DXi systems indicates the system is busy. In
this case, performance may be affected.
CPU stats in %
The CPU stats in % graph (see Figure 39) displays the relative CPU
usage for seven categories of processes (see Tab le 4).
Table 4 Categories of
Processes in the CPU stats in %
Graph
Process
Category
iowait
(red)
irq
(gold)
Description
The CPU is waiting for an I/O device to respond
(for example, the system is waiting on a disk).
The CPU is handling an interrupt request related
to I/O (for example, network, Fibre Channel, disk,
keyboard, or serial port activity).
softirq
(brown)
The CPU is handling a high level I/O task (for
example, timer interrupts or packets in the
TCP/IP stack).
system
(green)
The CPU is handling a kernel process (for
example, filesystem operations related to the
StorNext or blocklet filesystems).
nice
(black)
Quantum DXi Advanced Reporting User’s Guide 59
The CPU is handling processes that have lower
priority (for example, background processes).
Page 78

Chapter 4: Advanced Reports
Report Descriptions
Process
Category Description
user
(blue)
The CPU is handling processes that are not
owned by the kernel (for example, deduplication
as well as some space management and
replication activities)
idle
(not shown)
The CPU is not handling one of the other process
categories.
Use the CPU stats in % graph to see how CPU resources are allocated
among different categories of processes.
• The amount of CPU activity consumed by each category of process is
expressed as a percentage. The percentages (including the value for
idle, which is not shown in the graph) total to 100%.
• If a system has a high CPU load average (see CPU Load Average on
page 58), then consider the following guidelines:
• A high percentage of system (green) and user (blue) activity
indicates the system is CPU limited. Add more CPUs to improve
system performance.
• A high percentage of iowait (red) activity indicates the system is
I/O limited. Add more disks or arrays to improve system
performance.
Ethernet I/O The Ethernet I/O report displays detailed information about the amount
of data passing through the Ethernet ports in the system. The report
contains the following graphs:
• Ethernet Activity
• ethn Activity
Ethernet Activity
See Ethernet Activity on page 47.
60 Quantum DXi Advanced Reporting User’s Guide
Page 79
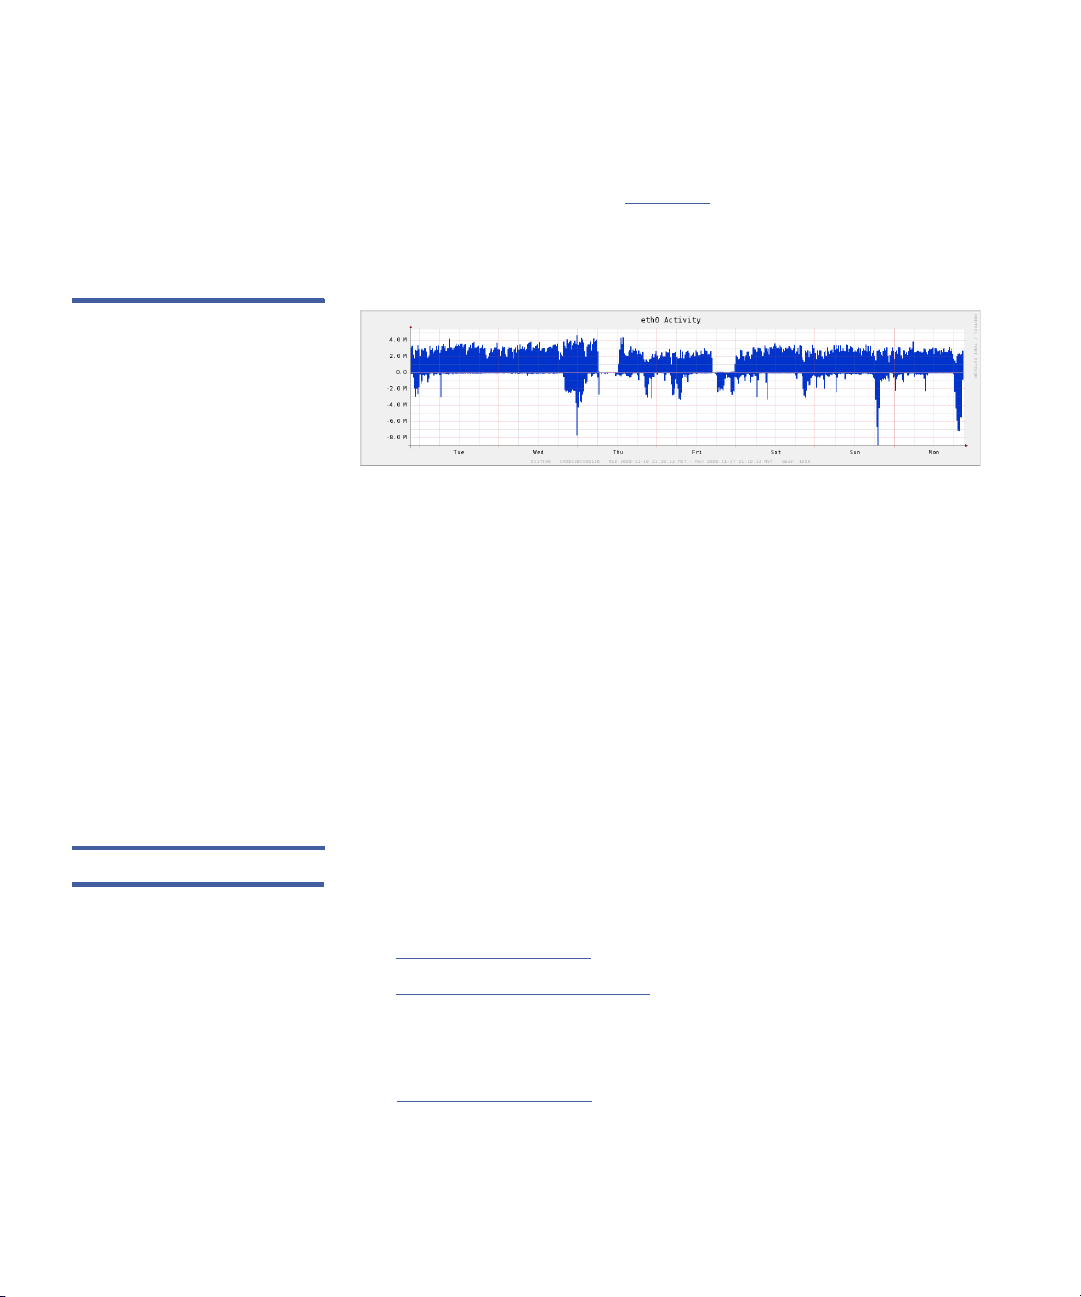
Figure 40 ethn Activity Graph
Chapter 4: Advanced Reports
Report Descriptions
ethn Activity
The ethn Activity graph (see Figure 40) displays the amount of data
passing through Ethernet port n. A graph appears for each Ethernet
port in the system, for example, eth0, eth1, and so on.
Use the ethn Activity graph to monitor writes to and reads from the
system using Ethernet port n.
• Write activity (above the zero line) indicates target replication to the
system, NAS backup or restore operations, or management activity.
• Read activity (below the zero line) indicates source replication from
the system, NAS backup or restore operations, or management
activity.
• A pink bar at the top of the graph indicates that space reclamation
is in progress. Space reclamation activity is resource intensive and
can affect the rate at which the system deduplicates data or
performs namespace replication.
Fibre Channel I/O The Fibre Channel I/O report displays detailed information about the
amount of data passing through the Fibre Channel ports in the system.
The report contains the following graphs:
• Fibre Channel Activity
• Fibre Channel Port n Activity
Fibre Channel Activity
See Fibre Channel Activity on page 46.
Quantum DXi Advanced Reporting User’s Guide 61
Page 80

Chapter 4: Advanced Reports
Report Descriptions
Figure 41 Fibre Channel Port n
Activity Graph
Fibre Channel Port n Activity
The Fibre Channel Port n Activity graph (see Figure 41) displays the
amount of data passing through Fibre Channel port n. A graph appears
for each Fibre Channel port in the system, for example, port 4, port 5,
and so on.
Use the Fibre Channel Port n Activity graph to monitor writes to and
reads from the system using Fibre Channel port n.
• Fibre Channel write activity (above the zero line) occurs during
backups.
• A regular backup schedule results in repeating patterns.
• A high amplitude left edge indicates that a large number of
client backups start at the same time.
• Fibre Channel read activity (below the zero line) occurs during VTL
restore operations.
Replication The Replication report displays information about the completion of
namespace and continuous replication activities. The report contains the
following graphs:
• Namespace Replication % Complete
• Continuous Replication % Complete
Namespace Replication % Complete
The Namespace Replication % Complete graph (see Figure 42)
displays completion statistics for namespace replication activities.
62 Quantum DXi Advanced Reporting User’s Guide
Page 81

Figure 42 Namespace
Replication % Complete Graph
Chapter 4: Advanced Reports
Report Descriptions
Use the Namespace Replication % Complete graph to monitor how
long namespace replication jobs take to complete.
•The value for Namespace % Complete (teal) rises until it reaches
100% when the namespace replication job is complete.
• A gray background on the graph indicates that a work queue exists
for continuous replication. (Continuous replication is suspended
whenever namespace replication is active.)
• A pink bar at the top of the graph indicates that space reclamation
is in progress. Space reclamation activity is resource intensive and
can affect the rate at which the system deduplicates data or
performs namespace replication.
• A blue bar at the bottom of the graph indicates that namespace
replication was paused by the user.
• A red bar at the bottom of the graph indicates that a program
pause occurred during namespace replication. A program pause can
occur in the following situations:
• The source or target is not reachable due to network issues.
• The DXi system is in critical space management mode and is
blocking outgoing replication traffic.
• A green bar at the bottom of the graph indicates that encryption is
enabled for replication activities.
Continuous Replication % Complete
The Continuous Replication % Complete graph (see Figure 43)
displays completion statistics for continuous replication activities.
Quantum DXi Advanced Reporting User’s Guide 63
Page 82

Chapter 4: Advanced Reports
Report Descriptions
Figure 43 Continuous
Replication % Complete Graph
Use the Continuous Replication % Complete graph to monitor how
long continuous replication jobs take to complete.
•The value for Continuous % Complete (teal) indicates the portion
of the continuous replication queue that has been completed.
Because continuous replication is an ongoing activity, the value may
rise or fall as more data is successfully replicated or is added to the
queue.
• A pink bar at the top of the graph indicates that space reclamation
is in progress. Space reclamation activity is resource intensive and
can affect the rate at which the system deduplicates data or
performs namespace replication.
Space Reclamation The Space Reclamation report displays information about the
completion of space reclamation activities. The report contains the
following graph:
• Space Reclamation
Space Reclamation
The Space Reclamation graph (see Figure 44) displays completion
statistics for space reclamation activities (also known as garbage
collection).
64 Quantum DXi Advanced Reporting User’s Guide
Page 83

Figure 44 Space Reclamation
Graph
Chapter 4: Advanced Reports
Report Descriptions
Use the Space Reclamation graph to monitor how long space
reclamation activities take to complete.
• A pink background on the graph indicates that space reclamation is
in progress. Space reclamation activity is resource intensive and can
affect the rate at which the system deduplicates data or performs
namespace replication.
•The value for gcProgress (blue) rises until it reaches 100% when
space reclamation is complete.
•The value for gcStage x 10 represents the current stage of the space
reclamation activity. Garbage collection occurs in multiple (typically
four) stages. To make it easier to read the graph, the stage number
is multiplied by 10.
For example, stage 2 of garbage collection appears as 20 on the
graph.
System Load The System Load report displays information about the usage of CPU,
disk, and I/O resources in the system. The report contains the following
graphs:
• CPU Load Average (logarithmic scale)
• CPU stats in %
• Disk I/O usage in %
• Fibre Channel Activity
• Ethernet Activity
Quantum DXi Advanced Reporting User’s Guide 65
Page 84

Chapter 4: Advanced Reports
Report Descriptions
Figure 45 CPU Load Average
Graph
CPU Load Average (logarithmic scale)
The CPU Load Average (logarithmic scale) graph (see Figure 45)
displays the one minute load average for the system using a logarithmic
scale.
Use the CPU Load Average graph to determine if the system has
adequate CPU resources.
• The load average represents the average number of processes, in a
one minute time period, that were running on a CPU or that were
waiting to run on a CPU.
• A load average higher than the number of CPU cores in the system
indicates that the system is CPU limited.
For example, a typical DXi system has four CPUs. In this case, a load
average of greater than four means that some processes had to wait
for an available CPU before running. In contrast, a load average of
less than four means no processes had to wait for a CPU.
Note: A CPU load higher than 8 on a DXi3500/5500 system or higher
than 15 on other DXi systems indicates the system is busy. In
this case, performance may be affected.
CPU stats in %
See CPU stats in % on page 59.
Disk I/O usage in %
The Disk I/O usage in % graph displays information about the average
load on the disk arrays in the system.
66 Quantum DXi Advanced Reporting User’s Guide
Page 85

Figure 46 Disk I/O usage in %
Graph
Chapter 4: Advanced Reports
Report Descriptions
Use the Disk I/O usage in % graph to determine if disk I/O activity is
correctly balanced and optimized across disk arrays.
• For DXi systems:
• Because the system can contain a large number of arrays, disk
usage values for all arrays are combined into a single value
called array(s) (blue).
• Disk usage for the system partitions are represented by the
values for sda and sdb.
• For DXi3500/5500 systems:
• The graph shows each array in a different color.
• The system partition is part of the first storage array. As a result,
disk I/O on the system partition can affect usage values for
Array 1 (green). Similarly, disk I/O on the first array can affect
usage values for System Partition (black).
• The usage percentage represents the portion of the total I/O
capacity that is being used by the array or arrays.
• If, during data ingest, some arrays show high utilization rates (90%
or more) while others arrays show lower utilization rates, it means
that disk I/O is not balanced in the system.
In this case, to improve system performance, configure the system
to match disk I/O across arrays. If necessary, add more disks to
balance disk I/O activity.
Note: To determine when data ingest is occurring, use the Fibre
Channel Activity graph in the Overview report (see
Fibre
Channel Activity on page 46).
Quantum DXi Advanced Reporting User’s Guide 67
Page 86

Chapter 4: Advanced Reports
Report Descriptions
Fibre Channel Activity
See Fibre Channel Activity on page 46.
Ethernet Activity
See Ethernet Activity on page 47.
Data Ingest Per Week The Data Ingest per week report displays information about the
volume of data ingested by the system, including weekly volume, daily
volume, and the data reduction ratio. The report contains the following
graphs:
• Data Volume Overview
• Data Ingest Volume per week
• Reduction Ratio
• Data Ingest Volume per day
Data Volume Overview
See Data Volume Overview on page 44.
Data Ingest Volume per week
The Data Ingest Volume per week graph (see Figure 47) displays the
amount of data ingested by the system each week. The amount of data
ingested by each Ethernet and Fibre Channel port is displayed in a
different color. Use the Data Ingest Volume per week graph to view
how much data the system is ingesting on a weekly basis.
Note: Weeks are measured beginning at midnight on Thursdays
(UTC). Because of the time offset between Coordinated
Universal Time (UTC) and the local time of the DXi, data ingest
may be reported for the week preceding or the week following
the week when it actually occurred. This does not affect the
purpose of the graph, which is to identify long term trends in
data ingest volume.
68 Quantum DXi Advanced Reporting User’s Guide
Page 87

Figure 47 Data Ingest Volume
per week Graph
Chapter 4: Advanced Reports
Report Descriptions
Reduction Ratio
See Reduction Ratio on page 46.
Data Ingest Volume per day
The Data Ingest Volume per day (see Figure 48) graph displays the
amount of data ingested by the system each day. The amount of data
ingested by each Ethernet and Fibre Channel port is displayed in a
different color. Use the Data Ingest Volume per day graph to view how
much data the system is ingesting on a daily basis.
Note: Days are measured beginning at midnight (UTC). Because of
the time offset between Coordinated Universal Time (UTC) and
the local time of the DXi, data ingest may be reported for the
day preceding or the day following the day when it actually
occurred. This does not affect the purpose of the graph, which
is to identify long term trends in data ingest volume.
Figure 48 Data Ingest Volume
per day Graph
Quantum DXi Advanced Reporting User’s Guide 69
Page 88

Chapter 4: Advanced Reports
Report Descriptions
70 Quantum DXi Advanced Reporting User’s Guide
Page 89

Glossary
A Adaptive Deduplication The mode of deduplication which allows
data deduplication to run concurrent with the backup being
ingested. The deduplication process will adapt to the speed of
the ingest.
B Bit The basic unit of data in a binary numbering system (binary
digit), represented by a 0 or a 1. Eight bits equals one byte.
Block During deduplication, data is divided into variable length blocks
(also called blocklets). Redundant blocks are removed and
replaced with pointers to the original copy of the block.
Blockpool See Deduplication Pool.
Byte The basic unit of computer memory which is large enough to
hold one character.
C Compress A process of removing fine-grained redundancy from data
prior to storing or transmitting it. The granularity may vary, but
generally compression deals with redundancy in grains of a few
bytes.
Continuous Replication Data replication is the process of creating
and managing duplicate versions of your data. Once a data set
Quantum DXi Advanced Reporting User’s Guide 71
Page 90

Glossary
has been deduplicated, it may be replicated (nonredundant
data is transmitted from a source system to a target).
Deduplication tags representing files with a high probability of
being replicated (for example, NAS share marked for replication)
are queued for replication after deduplication is complete
without regard to the replication schedule. This continuous
transmission of data is an optimization allowing replication to
be used with low bandwidth networks.
D Deduplicate A process of removing coarse-grained redundancy from
data prior to storing or transmitting it. The granularity may vary,
but generally deduplication deals with redundancy in grains of
several kilobytes.
Deduplication Pool The term used to refer to the collection of unique
data stored in a DXi deduplication appliance. The size of the
deduplication pool is reported as the After Reduction statistic
on the DXi GUI and is a measure of the disk space occupied by
all data backed up to the DXi after the data has been
deduplicated and compressed.
Deferred Deduplication The mode of deduplication which begins
only after the deferred deduplication window. Typically,
deferred deduplication begins after the backup ingest is
complete.
Deferred Deduplication Window A defined window during which no
deduplication will take place. This allows maximum system
resources to be devoted to data ingest thus allowing a faster
backup. The deferred deduplication window applies only to the
share/partition for which it is defined. It is possible to define a
second share/partition and perform backups that overlap the
same time period. The data written to the share without a
defined deferred deduplication window will be subjected to
adaptive deduplication.
F File or Cartridge Replication File or cartridge replication (FCR)
extends continuous and namespace replication from operating
at a share/partition level and zooms in to the file-directory/
virtual cartridge level. FCR can be used to synchronize the
72 Quantum DXi Advanced Reporting User’s Guide
Page 91

Glossary
content of a share or partition that is concurrently accessible at
both source and target DXi.
I Ingest The process of writing data from an external system or
application to disk in a DXi system.
L LUN Logical Unit Number. A logical storage unit that corresponds to
a storage volume. A storage array can be partitioned into
multiple LUNs.
N Namespace The term that applies to metadata required to reconstruct
deduplicated data back into its native application format. It is
used in phrase combinations such as “namespace replication”
or “synchronize the namespace.”
Namespace Replication When a replication set is scheduled for
transmission, the system scans the files comprising the
replication set and a namespace file is created. A namespace
file contains the complete set of deduplication tags for the
replication set. Data that is active (a NAS file that is open) or
data that is not yet deduplicated is not included in the
namespace file. The namespace file is then deduplicated and
transmitted to the target system after the data transmission of
the replication set is complete. Once both the replication set
and namespace file have been transmitted to the target
system, the replication can be recovered.
NTP Network Time Protocol. A protocol used to synchronize time
between devices over a network.
P Partition A DXi storage destination for data transferred by FC or iSCSI
where the structure is considered to be a virtual tape library
(VTL) and the content is written to virtual tape cartridges.
Quantum DXi Advanced Reporting User’s Guide 73
Page 92

Glossary
R Recover The DXi procedure to make replicated and namespace data
accessible on the DXi to which it had been replicated. If a share
was replicated, then a share is recovered. If a partition is
replicated, then a partition is recovered. It is not possible to
convert a share to a partition (or vice-versa) during the recovery
procedure.
S Share A DXi storage destination for data transferred by NAS where the
content is treated as files and directories.
Source The term often applied to the DXi that is sending a copy of
deduplicated data to a second DXi.
Space Reclamation A multi phase process used to recover disk space
on a DXi system. During space reclamation, the system searches
for redundant blocks that were not captured during
deduplication. The system also deletes blocks associated with
expired virtual tape cartridges (VTCs) and files that have been
deleted from NAS shares.
T Tag A united of ingested data. During deduplication, a tag is divided
into variable length blocks (also called blocklets).
Ta r ge t The label often applied to the DXi that is receiving a copy of
deduplicated data.
Truncation A process used to recover disk space on a DXi system.
When deduplicated data is truncated, only the metadata is
available on the filesystem. This reduces the amount of capacity
required in the filesystem. Once truncated, the file must be
reconstituted using its tag before you are able to access the file.
V Virtual Tape Cartridge (VTC) An emulation of a real, physical tape
cartridge, including a type, any nonvolatile memory associated
with the case housing, and that recording medium. Also
referred to as a virtual tape volume or a virtual volume.
74 Quantum DXi Advanced Reporting User’s Guide
 Loading...