

Page 1

L
Simplify
SANbox 5000 Series QuickTools
Switch Management User Guide
Firmware Version 6.8
59235-02 A Page i
Page 2

SANbox 5000 Series QuickTools
Switch Management User Guide
Information furnished in this manual is believed to be accurate and reliable. However, QLogic Corporation assumes no
responsibility for its use, nor for any infringements of patents or other rights of third parties which may result from its
use. QLogic Corporation reserves the right to change product specifications at any time without notice. Applications
described in this document for any of these products are for illustrative purposes only. QLogic Corporation makes no
representation nor warranty that such applications are suitable for the specified use without further testing or
modification. QLogic Corporation assumes no responsibility for any errors that may appear in this document.
This product is covered by one or more of the following patents: 6697359; other patents pending.
QLogic, SANbox, SANblade, QuickTools, and Management Suite are trademarks or registered trademarks of
QLogic Corporation.
Java and Solaris are registered trademarks of Sun Microsystems, Inc.
Gnome is a trademark of the GNOME Foundation Corporation.
Linux is a registered trademark of Linus Torvalds.
Mac OS X and Safari are registered trademarks of Apple Computer, Inc.
Microsoft, Windows NT, Windows 2000, Windows 2003, and Internet Explorer are trademarks of Microsoft
Corporation.
Netscape Navigator and Mozilla are registered trademarks of Netscape Communications Corporation.
Red Hat is a registered trademark of Red Hat Software Inc.
SUSE is a trademark of Novell, Inc.
All other brand and product names are trademarks or registered trademarks of their respective owners.
L
Release, Revision A, September 2007
Revision History
© 2000–2007 QLogic Corporation. All Rights Reserved Worldwide.
QLogic Corporation, 26650 Aliso Viejo Parkway, Aliso Viejo, CA 92656, (800) 662-4471 or (949) 389-6000
Page ii 59235-02 A
First Published: 2006
Page 3

Table of Contents
Section 1 Introduction
1.1 Intended Audience .................................................................................... .........1-1
1.2 Related Materials ...............................................................................................1-2
1.3 JDOM License....................................................................................................1-2
1.4 Technical Support...............................................................................................1-3
1.4.1 Availability..................................................................................................1-3
1.4.2 Training......................................................................................................1-3
1.4.3 Contact Information...................................................................................1-4
Section 2 Using QuickTools
2.1 Workstation Requirements.................................................................................2-1
2.2 Opening QuickTools ...........................................................................................2-2
2.3 QuickTools User Interface ..................................................................................2-3
2.3.1 Maintenance Panel Health Check.............................................................2-4
2.3.2 Fabric Tree................................................................................................2-5
2.3.3 Graphic Window........................................................................................2-5
2.3.4 Data Windows and Tabs............................................................................2-5
2.3.5 Menu Bar...................................................................................................2-6
2.3.5.1 Popup Menus ...................................................................................2-8
2.3.5.2 Shortcut Keys ...................................................................................2-8
2.3.6 Selecting Switches ....................................................................................2-8
2.3.7 Selecting Ports ..........................................................................................2-8
2.4 Setting QuickTools Preferences .......................................................................2-10
2.5 Using Online Help ............................................................................................2-11
2.6 Viewing Software Version and Copyright Information...................................... 2-11
2.7 Exiting QuickTools............................................................................................2-11
Section 3 Managing Fabrics
3.1 Fabric Services...................................................................................................3-1
3.1.1 Enabling SNMP Configuration...................................................................3-2
3.1.2 Enabling In-band Management.................................................................3-2
3.2 Rediscovering a Fabric.......................................................................................3-2
3.3 Adding a New Switch to a Fabric .......................................................................3-2
3.4 Replacing a Failed Switch..................................................................................3-3
3.5 Event Browser....................................................................................................3-4
3.5.1 Filtering the Event Browser .......................................................................3-6
59235-02 A Page iii
Page 4

SANbox 5000 Series QuickTools
Switch Management User Guide
3.5.2 Sorting the Event Browser.........................................................................3-7
3.5.3 Saving the Event Browser to a File ...........................................................3-7
3.6 Device Information and Nicknames....................................................................3-8
3.6.1 Devices Data Window ...............................................................................3-8
3.6.2 Displaying Detailed Device Information...................................................3-10
3.6.3 Managing Device Port Nicknames ..........................................................3-10
3.6.3.1 Creating a Nickname......................................................................3-11
3.6.3.2 Editing a Nickname......................................................................... 3-11
3.6.3.3 Deleting a Nickname ......................................................................3-12
3.6.3.4 Exporting Nicknames to a File........................................................3-12
3.6.3.5 Importing a Nicknames File............................................................3-13
3.7 Zoning ..............................................................................................................3-13
3.7.1 Active Zone Set Data Window.................................................................3-14
3.7.2 Configured Zonesets Data Window.........................................................3-15
3.7.3 Zoning Concepts .....................................................................................3-16
3.7.3.1 Zones..............................................................................................3-16
3.7.3.2 Aliases............................................................................................3-17
3.7.3.3 Zone Sets.......................................................................................3-17
3.7.3.4 Zoning Database............................................................................3-18
3.7.3.5 Viewing Zoning Limits and Properties............................................3-18
3.7.4 Managing the Zoning Database ..............................................................3-19
3.7.4.1 Editing the Zoning Database..........................................................3-20
3.7.4.2 Resolving Zoning............................................................................3-23
3.7.4.3 Configuring the Zoning Database...................................................3-24
3.7.4.4 Saving the Zoning Database to a File.............................................3-25
3.7.4.5 Restoring the Zoning Database from a File....................................3-25
3.7.4.6 Restoring the Default Zoning Database..........................................3-26
3.7.4.7 Removing All Zoning Definitions.....................................................3-26
3.7.5 Managing Zone Sets ...............................................................................3-26
3.7.5.1 Creating a Zone Set .......................................................................3-27
3.7.5.2 Activating and Deactivating a Zone Set..........................................3-27
3.7.5.3 Renaming a Zone Set.....................................................................3-28
3.7.5.4 Removing a Zone Set.....................................................................3-28
L
Page iv 59235-02 A
Page 5

SANbox 5000 Series QuickTools
L
3.7.6 Managing Zones......................................................................................3-29
3.7.6.1 Creating a Zone in a Zone Set .......................................................3-29
3.7.6.2 Copying a Zone to a Zone Set........................................................3-30
3.7.6.3 Adding Zone Members...................................................................3-30
3.7.6.4 Renaming a Zone...........................................................................3-31
3.7.6.5 Removing a Zone Member.............................................................3-31
3.7.6.6 Removing a Zone from a Zone Set ................................................3-32
3.7.6.7 Removing a Zone from All Zone Sets.............................................3-32
3.7.7 Managing Aliases....................................................................................3-32
3.7.7.1 Creating an Alias............................................................................3-33
3.7.7.2 Adding a Member to an Alias .........................................................3-33
3.7.7.3 Removing an Alias from All Zones .................................................3-34
3.7.8 Merging Fabrics and Zoning....................................................................3-34
3.7.8.1 Zone Merge Failure........................................................................3-34
3.7.8.2 Zone Merge Failure Recovery........................................................3-35
Switch Management User Guide
Section 4 Managing Switches
4.1 Switch Data Window ..........................................................................................4-1
4.2 Managing User Accounts...................................................................................4-8
4.2.1 Creating User Accounts.............................................................................4-9
4.2.2 Removing a User Account.......................................................................4-10
4.2.3 Changing a User Account Password....................................................... 4-11
4.2.4 Modifying a User Account........................................................................4-12
4.3 Paging a Switch................................................................................................4-13
4.4 Setting the Date/Time and Enabling NTP Client..............................................4-13
4.5 Resetting a Switch............................................................................................4-14
4.6 Configuring a Switch ........................................................................................4-15
4.6.1 Using the Configuration Wizard...............................................................4-15
4.6.2 Switch Properties.....................................................................................4-16
4.6.2.1 Domain ID and Domain ID Lock.....................................................4-17
4.6.2.2 Syslog.............................................................................................4-17
4.6.2.3 Symbolic Name ..............................................................................4-18
4.6.2.4 Switch Administrative States...........................................................4-18
4.6.2.5 Broadcast Support..........................................................................4-18
4.6.2.6 In-band Management .....................................................................4-19
4.6.2.7 Fabric Device Management Interface.............................................4-19
4.6.3 Advanced Switch Properties....................................................................4-20
4.6.3.1 Timeout Values...............................................................................4-20
4.6.4 Managing System Services.....................................................................4-21
59235-02 A Page v
Page 6

SANbox 5000 Series QuickTools
Switch Management User Guide
4.6.5 Network Properties..................................................................................4-23
4.6.5.1 IP Configuration..............................................................................4-24
4.6.6 SNMP Properties.....................................................................................4-25
4.6.6.1 SNMP Configuration.......................................................................4-26
4.6.6.2 SNMP Trap Configuration...............................................................4-27
4.7 Archiving a Switch............................................................................................4-28
4.8 Restoring a Switch ...........................................................................................4-29
4.9 Restoring the Factory Default Configuration....................................................4-31
4.10 Downloading a Support File.............................................................................4-33
4.11 Installing Firmware...........................................................................................4-33
4.12 Using Call Home ..............................................................................................4-34
4.12.1 Using the Call Home Profile Manager.....................................................4-37
4.12.2 Using the Call Home Profile Editor..........................................................4-38
4.12.3 Applying All Profiles on a Switch to Other Switches................................4-39
4.12.4 Using the Call Home Message Queue....................................................4-40
4.12.5 Testing Call Home Profiles ......................................................................4-40
4.12.6 Change Over...........................................................................................4-41
L
Section 5 Managing Ports
5.1 Port Information Data Window ...........................................................................5-1
5.2 Port Statistics Data Window ...............................................................................5-5
5.3 Viewing and Configuring Ports.........................................................................5-10
5.3.1 Port Symbolic Name................................................................................5-12
5.3.2 Port States...............................................................................................5-12
5.3.2.1 Port Operational States...................................................................5-12
5.3.2.2 Port Administrative States...............................................................5-13
5.3.3 Port Types ...............................................................................................5-14
5.3.4 Port Speeds.............................................................................................5-14
5.3.5 Port Transceiver Media Status ................................................................5-16
5.3.6 I/O Stream Guard....................................................................................5-17
5.3.7 Device Scan ............................................................................................5-17
5.3.8 Auto Performance Tuning and AL Fairness ............................................5-18
5.4 Resetting a Port................................................................................................5-18
5.5 Testing Ports.....................................................................................................5-19
Glossary
Index
Page vi 59235-02 A
Page 7

SANbox 5000 Series QuickTools
L
Switch Management User Guide
Figures
Figure Page
2-1 Add a New Fabric Dialog ...............................................................................................2-2
2-2 Password Change Required Dialog...............................................................................2-3
2-3 QuickTools Interface.......................................................................................................2-3
2-4 Maintenance Panel Health Check..................................................................................2-4
2-5 Preferences Dialog – QuickTools.................................................................................2-10
3-1 Events Browser..............................................................................................................3-5
3-2 Filter Events Dialog........................................................................................................3-7
3-3 Devices Data Window....................................................................................................3-8
3-4 Detailed Devices Display Dialog..................................................................................3-10
3-5 Active Zone Set Data Window.....................................................................................3-14
3-6 Configured Zonesets Data Window .............................................................................3-15
3-7 Edit Zoning Dialog........................................................................................................3-20
3-8 Zoning Config Dialog....................................................................................................3-24
4-1 Switch Data Window......................................................................................................4-2
4-2 Switch Data Window Buttons.........................................................................................4-2
4-3 User Account Administration Dialog – Add Account......................................................4-9
4-4 User Account Administration Dialog – Remove Account.............................................4-10
4-5 User Account Administration Dialog – Change Password...........................................4-11
4-6 User Account Administration Dialog – Modify Account................................................4-12
4-7 Switch Properties Dialog..............................................................................................4-16
4-8 Advanced Switch Properties Dialog.............................................................................4-20
4-9 System Services Dialog...............................................................................................4-21
4-10 Network Properties Dialog ...........................................................................................4-23
4-11 SNMP Properties Dialog..............................................................................................4-25
4-12 Restore Dialogs – Full and Selective...........................................................................4-29
4-13 Call Home Setup Dialog...............................................................................................4-34
4-14 Call Home Profile Manager Dialog ...............................................................................4-37
4-15 Call Home Profile Editor Dialog....................................................................................4-38
4-16 Call Home Profile Multiple Switch Apply Dialog...........................................................4-39
4-17 Call Home Message Queue Dialog..............................................................................4-40
4-18 Call Home Profile Manager Dialog ...............................................................................4-40
5-1 Port Information Data Window.......................................................................................5-1
5-2 Port Information Data Window Buttons..........................................................................5-2
5-3 Port Statistics Data Window...........................................................................................5-5
5-4 Port Properties Dialog..................................................................................................5-10
5-5 Advanced Port Properties Dialog.................................................................................5-18
5-6 Port Diagnostics Dialog................................................................................................5-19
59235-02 A Page vii
Page 8

SANbox 5000 Series QuickTools
Switch Management User Guide
L
Tables
Table Page
2-1 Workstation Requirements.............................................................................................2-1
2-2 Menu Bar Options.........................................................................................................2-6
3-1 Severity Levels...............................................................................................................3-5
3-2 Devices Data Window Entries........................................................................................3-9
3-3 Edit Zoning Dialog Tool Bar Buttons and Icons............................................................3-21
4-1 Switch Data Window Entries..........................................................................................4-3
4-2 Factory User Accounts...................................................................................................4-8
4-3 Switch Resets ..............................................................................................................4-14
4-4 Switch Administrative States........................................................................................4-18
4-5 IP Configuration Parameters........................................................................................4-24
4-6 SNMP Configuration Parameters.................................................................................4-26
4-7 SNMP Trap Configuration Parameters.........................................................................4-27
4-8 Factory Default Configuration Settings ........................................................................4-31
4-9 Call Home Setup Entries..............................................................................................4-35
5-1 Port Information Data Window Entries...........................................................................5-2
5-2 Port Statistics Data Window Entries...............................................................................5-7
5-3 Port Properties Dialog Entries......................................................................................5-11
5-4 Port Operational States................................................................................................5-12
5-5 Port Administrative States............................................................................................5-13
5-6 Port Types....................................................................................................................5-14
5-7 Port Speeds..................................................................................................................5-15
5-8 Port Transceiver Media View .......................................................................................5-16
Page viii 59235-02 A
Page 9

Section 1
Introduction
This manual describes the QuickTools™ web applet (version 6.08) for SANbox
5000 Series switches (firmware version 6.8). The QuickTools web applet is the
primary focus of this manual which is organized as follows:
Section 1 describes the intended audience for this manual, related
materials, and technical support.
Section 2 describes how to use QuickTools, its menus, and its displays.
Section 3 describes fabric management tasks.
Section 4 describes switch management tasks.
Section 5 describes port and device management tasks.
A glossary of terms and an index are also provided.
Note: If you haven't purchased QLogic Enterprise Fabric Suite 2007, try it for
30 days free of charge. Enterprise Fabric Suite 2007 is a suite of tools
for fabric management, performance monitoring, fabric monitoring,
distance configuration, switch configuration with configuration and
zoning wizards, and much more. A full featured 30-day trial is included
with the purchase of each SANbox 5000 Series switch. Enterprise
Fabric Suite 2007 can be installed from the CD-ROM found in the
accessories box of SANbox 5000 Series switches. Insert the CD into
the workstation of your choice and follow the prompts. Take advantage
of QLogic's powerful suite of fabric management tools for 30 days,
then contact your switch distributor or authorized reseller to purchase
Enterprise Fabric Suite 2007.
1.1
Intended Audience
This manual introduces the switch management products and explains their
installation and use. It is intended for users responsible for installing and using
59235-02 A 1-1
switch management tools.
Page 10

1 – Introduction
Related Materials
1.2
Related Materials
Refer to the following manuals for information about switch hardware and
installation.
SANbox 5600 Series Fibre Channel Switch Installation Guide, publication
number 59096-05.
SANbox 5000 Series Fibre Channel Switch Command Line Interface Guide,
publication number 59183-02.
1.3
JDOM License
This product includes software developed by the JDOM Project
(http://www.jdom.org/). Copyright (C) 2000-2002 Brett McLaughlin & Jason
Hunter. All rights reserved.
Redistribution and use in source and binary forms, with or without modification,
are permitted provided that the following conditions are met:
L
1. Redistributions of source code must retain the above copyright notice, this
list of conditions, and the following disclaimer.
2. Redistributions in binary form must reproduce the above copyright notice,
this list of conditions, and the disclaimer that follows these conditions in the
documentation and/or other materials provided with the distribution.
3. The name "JDOM" must not be used to endorse or promote products
derived from this software without prior written permission. For written
permission, please contact license@jdom.org.
4. Products derived from this software may not be called "JDOM", nor may
"JDOM" appear in their name, without prior written permission from the
JDOM Project Management (pm@jdom.org).
In addition, we request (but do not require) that you include in the end-user
documentation provided with the redistribution and/or in the software itself an
acknowledgement equivalent to the following: "This product includes software
developed by the JDOM Project (http://www.jdom.org/)."
Alternatively, the acknowledgment may be graphical using the logos available at
http://www.jdom.org/images/logos.
1-2 59235-02 A
Page 11

L
1 – Introduction
Technical Support
THIS SOFTWARE IS PROVIDED ``AS IS'' AND ANY EXPRESSED OR IMPLIED
WARRANTIES, INCLUDING, BUT NOT LIMITED TO, THE IMPLIED
WARRANTIES OF MERCHANTABILITY AND FITNESS FOR A PARTICULAR
PURPOSE ARE DISCLAIMED. IN NO EVENT SHALL THE JDOM AUTHORS
OR THE PROJECT CONTRIBUTORS BE LIABLE FOR ANY DIRECT,
INDIRECT, INCIDENTAL, SPECIAL, EXEMPLARY, OR CONSEQUENTIAL
DAMAGES (INCLUDING, BUT NOT LIMITED TO, PROCUREMENT OF
SUBSTITUTE GOODS OR SERVICES; LOSS OF USE, DATA, OR PROFITS;
OR BUSINESS INTERRUPTION) HOWEVER CAUSED AND ON ANY THEORY
OF LIABILITY, WHETHER IN CONTRACT, STRICT LIABILITY, OR TORT
(INCLUDING NEGLIGENCE OR OTHERWISE) ARISING IN ANY WAY OUT OF
THE USE OF THIS SOFTWARE, EVEN IF ADVISED OF THE POSSIBILITY OF
SUCH DAMAGE.
This software consists of voluntary contributions made by many individuals on
behalf of the JDOM Project and was originally created by Brett McLaughlin
<brett@jdom.org> and Jason Hunter <jhunter@jdom.org>. For more information
on the JDOM Project, please see <http://www.jdom.org/>.
1.4
Technical Support
Customers should contact their authorized maintenance provider for technical
support of their QLogic switch products. QLogic-direct customers may contact
QLogic Technical Support; others will be redirected to their authorized
maintenance provider.
Visit the QLogic support Web site listed in Contact Information for the latest
firmware and software updates.
1.4.1
Availability
QLogic Technical Support is available from 7:00 AM to 7:00 PM Central Standard
Time, Monday through Friday, excluding QLogic-observed holidays.
1.4.2
Training
QLogic offers certification training for the technical professional for all QLogic
products. From the training link at www.qlogic.com, you may choose
Electronic-Based Training or schedule an intensive "hands-on" Certification
course.
Technical Certification courses include installation, maintenance and
troubleshooting QLogic SAN products. Upon demonstrating knowledge using live
equipment, QLogic awards a certificate identifying the student as a Certified
Professional. The training professionals at QLogic may be reached by Email at
tech.training@qlogic.com.
59235-02 A 1-3
Page 12

1 – Introduction
Technical Support
1.4.3
Contact Information
Support Headquarters QLogic Corporation
QLogic Web Site www.qlogic.com
Technical Support Web Site support.qlogic.com
Technical Support Email support@qlogic.com
Technical Training tech.training@qlogic.com
North American Region
Email support@qlogic.com
L
12984 Valley View Road
Eden Prairie, MN 55344-3657
USA
Phone +1-952-932-4040
Fax +1 952-974-4910
Europe, Middle East, and Africa Region
Email emeasupport@qlogic.com
Phone Numbers by Language +353 1 6924960 - English
+353 1 6924961 - Français
+353 1 6924962 - Deutsch
+353 1 6924963 - Español
+353 1 6924964 - Português
+353 1 6924965 - Italiano
Asia Pacific Region
Email apacsupport@qlogic.com
Phone Numbers by Language +63-2-885-6712 - English
+63-2-885-6713 - (Mandarin)
+63-2-885-6714 - (Japanese)
+63-2-885-6715 - (Korean)
Latin and South America Region
Email calasupport@qlogic.com
Phone Numbers by Language +52 55 5278 7016 - English
1-4 59235-02 A
+52 55 5278 7017 - Español
+52 55 5278 7015 - Português
Page 13

Using QuickTools
This section describes how to use the QuickTools web applet and its menus. The
following topics are covered:
Workstation Requirements
Opening QuickTools
QuickTools User Interface
Maintenance Panel Health Check
Setting QuickTools Preferences
Using Online Help
Viewing Software Version and Copyright Information
Exiting QuickTools
2.1
Workst ation Requirements
The requirements for fabric management workstations running the QuickTools
web applet are listed in Table 2-1.
Section 2
Table 2-1. Workstation Requirements
Operating System
Memory 256 MB or more (512MB or more recommended)
Disk Space 150 MB per installation
Processor 1 GHz or faster
Hardware
Windows® 2003 and XP SP1/SP2
Solaris™ 9, 10, and 10 x86
Red Hat® Enterprise Linux® 3, 4
SUSE™ Linux Enterprise Server 9 and 10
Macintosh® OS X 10.4
CD-ROM drive,
RJ-45 Ethernet port, RS-232 serial port (optional)
59235-02 A 2-1
Page 14
2 – Using QuickTools
Opening QuickTools
L
Table 2-1. Workstation Requirements
Internet Browser
2.2
Opening QuickTools
After the switch is operational, open the QuickTools web applet by entering the
switch IP address in an Internet browser. If your workstation does not have the
Java 2 Run Time Environment program, you will be prompted to download it. The
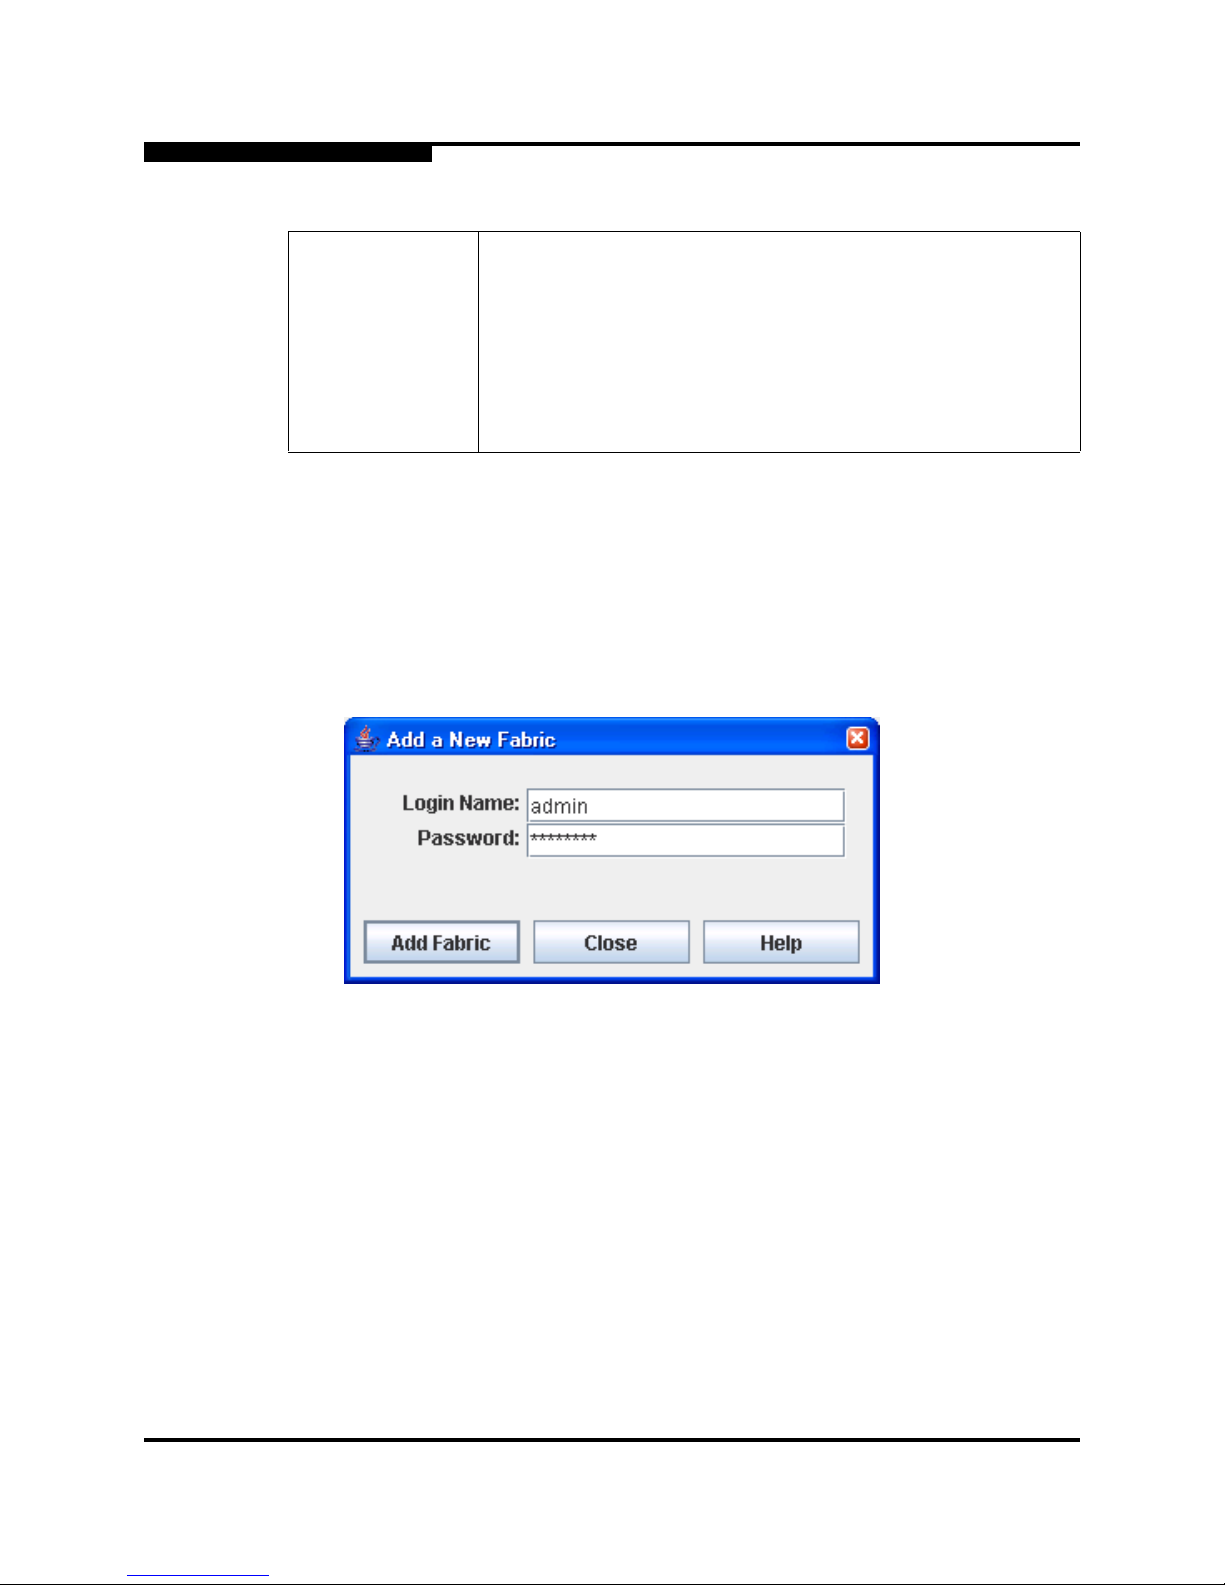
Add a New Fabric dialog shown in Figure 2-1 prompts you for your username and
password. Click the Add Fabric button to open the fabric.
Microsoft® Internet Explorer® 5.0 and later
Netscape® Navigator® 6.0 and later
Mozilla™ 1.5 and later
Firefox® 1.0 and later
Safari® 1.0 and later
Java 2 Standard Edition Runtime Environ ment 1.4.2 to support
the web applet
Figure 2-1. Add a New Fabric Dialog
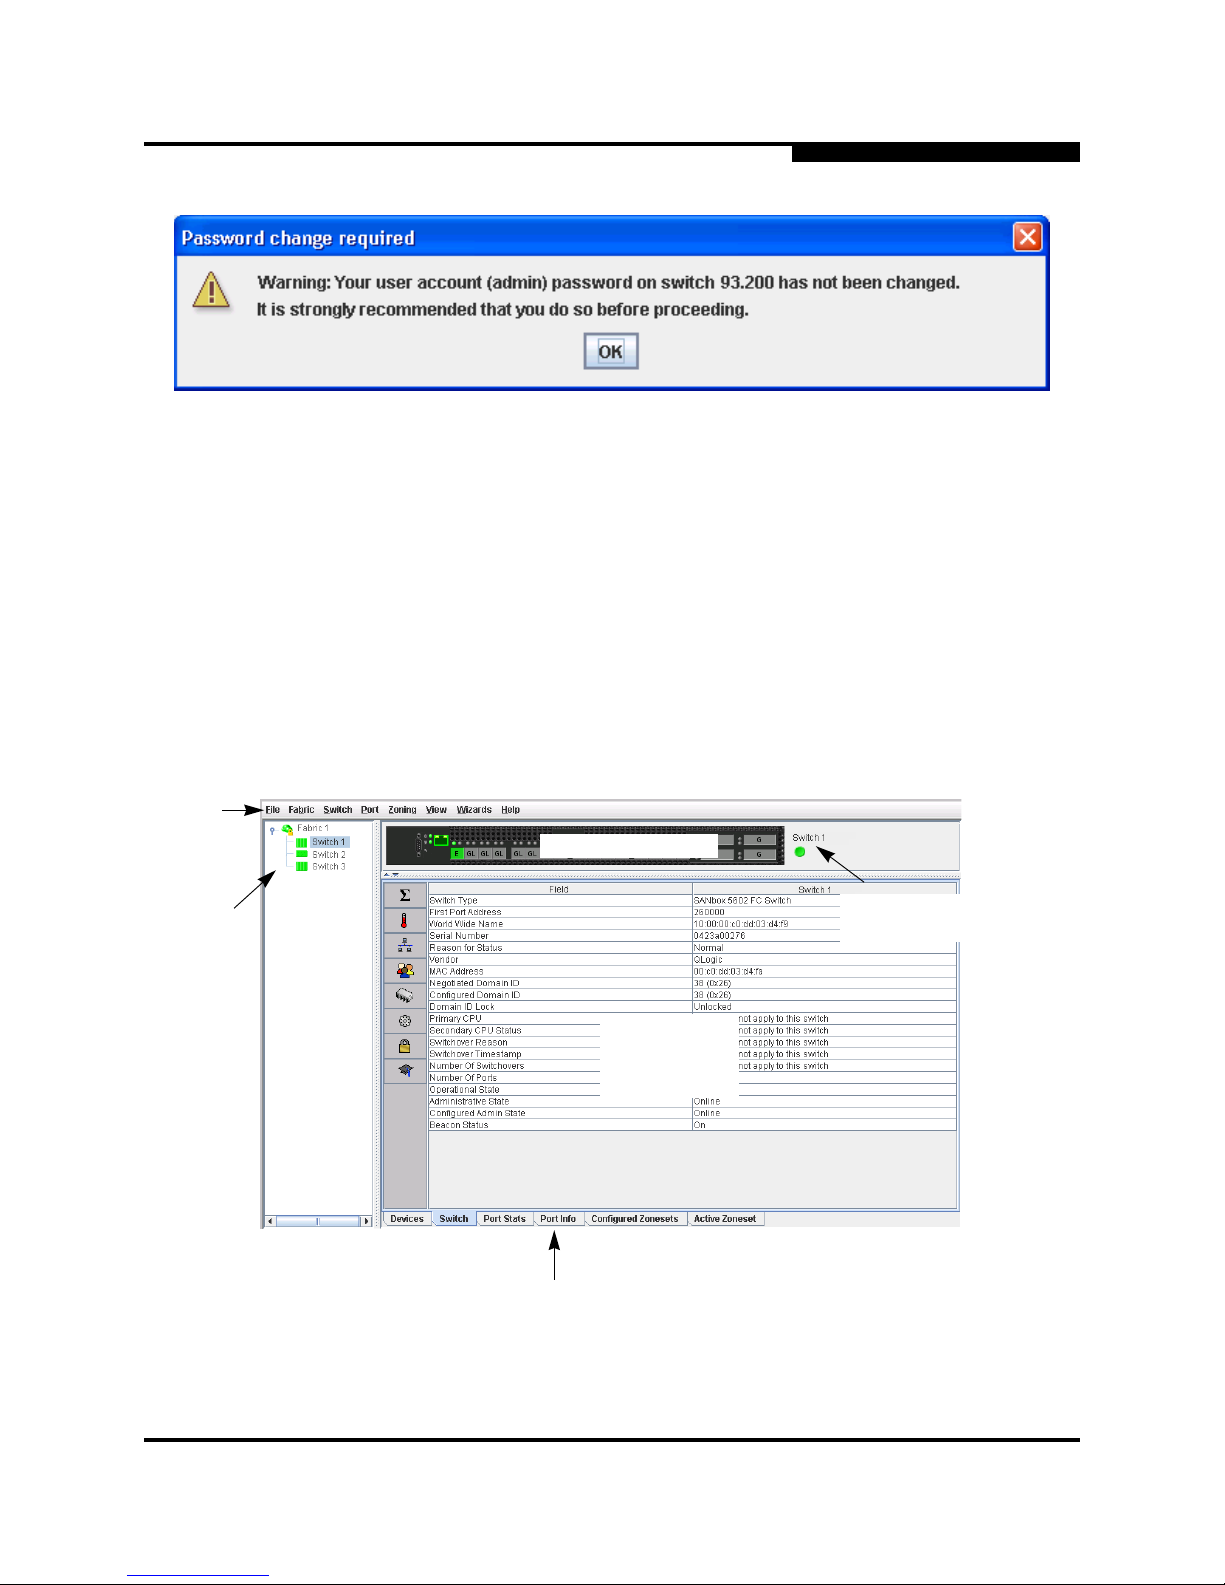
The opening window is displayed, as shown in Figure 2-3. For security reasons,
you will be prompted to change your user account password that was initially set
up by the administrator, as shown in Figure 2-2. You will be prompted to change
the password each time you attempt to open the fabric until you change the
default password. Click the OK button, and change the user account password.
Refer to ”Managing User Accounts” on page 4-8 for more information.
2-2 59235-02 A
Page 15
L
M
Figure 2-2. Password Change Required Dialog
2.3
QuickTools User Interface
The QuickTools web applet uses the faceplate and backplate displays to manage
the switches in a fabric. The interface, as shown in Figure 2-3, consists of a menu
bar, fabric tree, graphic window, data windows (some with buttons), and data
window tabs. The switch faceplate is displayed in the graphic window and shows
the front of a single switch and its ports. While there is no topology display, the
fabric name is displayed for reference in the fabric tree above the switch names.
Click a switch name or icon to display a different switch faceplate in the graphic
window. Information displayed in the data windows corresponds to the data
window tab selected.
2 – Using QuickTools
QuickTools User Interface
enu
Bar
Fabric
Tree
Graphic Window
Fabric/Switch Name
and Status
Data Window
Data Window Tabs
Figure 2-3. QuickTools Interface
59235-02 A 2-3
Page 16

2 – Using QuickTools
QuickTools User Interface
2.3.1
Maintenance Panel Health Check
The Maintenance Panel Health Check feature provides notification to the user of
error conditions that have been detected and will require attention.
NOTE: The up/down arrows on the divider bar (between the MP Health Check
entries and data windows) enable you to move the divider bar up or
down. With the faceplate image and data windows displayed, click the
up arrow (on left) to move the divider up to the top of the window, thus
completely hiding the faceplate image. Click the down arrow (on right)
to move the divider back to the middle; click the down arrow again to
completely hide the data window. You can also click-and-drag the
divider bar to manually move it up or down.
L
MP
Health
Check
Move
Divider
Arrows
Figure 2-4. Maintenance Panel Health Check
2-4 59235-02 A
Page 17

L
2.3.2
Fabric Tree
2 – Using QuickTools
QuickTools User Interface
The QuickTools web applet allows you to manage the switches in one fabric. The
fabric tree, shown in Figure 2-3, provides access to each switch faceplate display
in the fabric. Click a switch name or icon to display that switch faceplate in the
graphic window. The window width of the fabric tree can be adjusted by clicking
and dragging the moveable window border.
The fabric tree entry has a small icon next to it that uses color to indicate
operational status.
A green icon indicates normal operation.
A yellow icon indicates that a switch is operational, but may require attention
to maintain maximum performance.
A red icon indicates a potential failure or non-operational state as when the
switch is offline.
A blue icon indicates that a switch is unknown, unreachable, or
unmanageable.
If the status of the fabric is not normal, the fabric icon in th e fabric tree will indicate
the reason for the abnormal status. The same message is provided when you rest
the mouse on the fabric icon in the fabric tree.
2.3.3
Graphic Window
The graphic window shows the switch faceplate (shown in Figure 2-3) or
backplate display. The window height can be adjusted by clicking and dragging
the window border that it shares with the data window.
The faceplate display shows the front of a switch. To view the faceplate display,
open the View menu, and select View Faceplate. The backplate display shows
the back of the switch. To view the backplate display, open the View menu, and
select View Backplate.
2.3.4
Data Windows and Tabs
The data window, shown in Figure 2-3, presents a table of data and statistics
associated with the selected tab for the switch displayed in the graphic window.
Use the scroll bar to browse through the data. The window length can be adjuste d
by clicking and dragging the border that it shares with the graphic window. Adjust
the column width by moving the pointer over the column heading border shared by
two columns until a right/left arrow graphic is displayed. Click and drag the arrow
to the desired width. The data windows and tabs are described below.
59235-02 A 2-5
Page 18

2 – Using QuickTools
QuickTools User Interface
Devices — displays information about devices (hosts and storage targets)
connected to the switch. Refer to ”Devices Data Window” on page 3-8 for
more information.
L
2.3.5
Menu Bar
Switch
selected switches. Refer to ”Switch Data Window” on page 4-1 for more
information.
Port Statistics
”Port Statistics Data Window” on page 5-5 for more information.
Port Information
Statistics Data Window” on page 5-5 for more information.
Configured Zonesets
in the zoning database.
Active Zoneset
and their member ports. Refer to ”Active Zone Set Data Window” on
page 3-14 for more information about this data window. Refer to ”Zoning” on
page 3-13 for information about zone sets and zones.
The QuickTools web applet menu bar options are listed in Table 2-2.
— displays current network and switch configuration data for the
— displays performance data for the selected ports. Refer to
— displays information for the selected ports. Re fer to ”Port
— displays all zone set s, zones, and zone membership
— displays the active zone set for the fabric including zones
Table 2-2. Menu Bar Options
Menu Options
File Preferences
Fabric Nicknames
Rediscover Fabric
Show Event Browser
2-6 59235-02 A
Page 19

L
2 – Using QuickTools
QuickTools User Interface
Table 2-2. Menu Bar Options (Continued)
Menu Options
Switch Archive
Restore
User Accounts
Set Date/Time
Switch Properties
Advanced Switch Properties (available on entry switch only)
Services
Call Home (Setup, Profile Manager, Message Queue, Test Profile,
Change Over)
Network Properties
SNMP Properties
Toggle Beacons
Load Firmware
Reset Switch
Restore Factory Defaults
Features
Download Support File
Port Port Properties
Advanced Port Properties
Reset Port
Port Diagnostics
Zoning Edit Zoning
Resolve Zoning (Capture Active Zoning, Restore Configured
Zoning, Capture Merged Zoning, View Merged/Configured
Differences)
Edit Zoning Config
Activate Zone Set
Deactivate Zone Set
Restore Default Zoning
View Refresh
View Port Types
View Port States
View Port Speeds
View Port Media
View Faceplate (5202/5602 only)
View Backplate (5202/5602 only)
Wizards Configuration Wizard
Help Help Topics
About
59235-02 A 2-7
Page 20

2 – Using QuickTools
QuickTools User Interface
2.3.5.1
Popup Menus
Popup menus are displayed when you right-click the switch faceplate or backplate
images in the graphic window. Popup menu options give you quick access to the
common tasks and dialogs, such as:
Refreshing a switch
Selecting all ports
Properties dialogs (Port, Switch, Network, and SNMP)
Services dialog
Port diagnostics dialogs
2.3.5.2
Shortcut Keys
Shortcut key combinations provide an alternative method of accessing menu
options in the web applet. For example, to open the Preferences dialog, press
Alt+F, then press R. The shortcut key combinations are not case-sensitive.
Shortcut keys are not supported on the Mac platform.
L
2.3.6
Selecting Switches
Switches are selectable in the fabric tree. Click a switch icon or name to display its
faceplate display in the graphic window . Refer to Section 4 Managing Switches for
detailed switch information.
2.3.7
Selecting Ports
Ports are selectable and serve as access points for other displays and menus.
You select ports to display information about them in the data window or to modify
them. Context-sensitive popup menus are displayed when you right-click the
faceplate image or on a port icon. Refer to Section 5 Managing Ports for detailed
port information.
Selected ports in the faceplate display are outlined in white. You can select ports
the following ways.
To select a port, click the port.
To select all ports, right-click on the faceplate image and select Select All
Ports from the popup menu.
To select a range of consecutive ports, click a port, press the Shift key and
click another port. The web applet selects both end ports and all ports in
between the end ports.
2-8 59235-02 A
Page 21

L
2 – Using QuickTools
QuickTools User Interface
Note: When using the Shift key to select a range of ports, the first port you
click in the range is the "anchor" selection. Subsequent ranges are
based on this anchor selection. For example, after clicking port 4 and
port 9 respectively, port 4 becomes the anchor selection. The next
range includes all ports between port 4 and the next port you select.
To select several non-consecutive ports, press the Control key while
clicking each port.
To un-select ports in a group of selected ports, press the Control key while
clicking each port.
To cancel a selection, press the Control key and select it again.
59235-02 A 2-9
Page 22

2 – Using QuickTools
Setting QuickTools Preferences
2.4
Setting QuickTools Preferences
Using the preferences settings, you can:
Change the location of the working directory in which to save files.
Change the location of the browser used to view the online help. The
Browser Location field is not supported/displayed for Mac OS X.
Select a Display Dialog When Making Non-secure Connections option. If
enabled, the Non-secure Connections Check dialog is displayed when you
attempt to open a non-secure fabric. You then have the option of opening a
non-secure fabric. If disabled, you cannot open a fabric with a non-secure
connection).
Enable (default) or disable the Event Browser. Refer to ”Event Browser” on
page 3-4. If the Event Browser is enabled using the Preferences dialog as
shown in Figure 2-5, the next time QuickTools is started, all events will be
displayed. If the Event Browser is disabled when QuickTools is started and
later enabled, only those events from the time the Event Browser was
enabled and forward will be displayed.
Choose the default port view when opening the faceplate display. You can
set the faceplate to reflect the current port type (default), port speed, port
operational state, or port transceiver media. Regardless of the default port
view you choose, you can change the port view in the faceplate display by
opening the View menu and selecting a different port view option. Refer to
the corresponding subsection for more information:
”Port Types” on page 5-14
”Port Operational States” on page 5-12
L
”Port Speeds” on page 5-14
”Port Transceiver Media Status” on page 5-16
Figure 2-5. Preferences Dialog – QuickTools
2-10 59235-02 A
Page 23

L
To set preferences for your QuickTools sessions, do the following:
1. Open the File menu, and select Preferences to open the Preferences
dialog.
2. Enter, or browse, for paths to the working directory and browser.
3. In the Application-wide Options area, choose the preferences you want.
4. Click the OK button to save the changes.
2.5
Using Online Help
The browser-based online help system can be accessed from the QuickTools web
applet several ways. Online help is also context-sensitive, that is, the online help
opens to the topic that describes the dialog you have open.
To open the first topic in the help system, choose one of the following:
Open the Help menu and select Help Topics
With no dialog displayed, press the F1 function key
2 – Using QuickTools
Using Online Help
To open the help system to the topic that describes the dialog you have open,
choose one of the following:
Click the Help button in the dialog
Press the F1 function key
2.6
Viewing Software Version and Copyright Information
To view QuickTools software version and copyright information, open the Help
menu and select About.
2.7
Exiting QuickTools
To exit a QuickTools web applet session, close the browser.
59235-02 A 2-11
Page 24

2 – Using QuickTools
Exiting QuickTools
Notes
L
2-12 59235-02 A
Page 25

This section describes the following tasks that manage fabrics:
Fabric Services
Rediscovering a Fabric
Adding a New Switch to a Fabric
Replacing a Failed Switch
Event Browser
Device Information and Nicknames
Zoning
3.1
Fabric Services
Fabric services security includes SNMP and In-band management. Simple
Network Management Protocol (SNMP) is the protocol governing network
management and monitoring of network devices. SNMP security consists of a
read community string and a write community string, that are basically the
passwords that control read and write access to the switch. The read community
string ("public") and write community string ("private") are set at the factory to
these well-known defaults and should be changed if SNMP is enabled using the
System Services or SNMP Properties dialogs. If SNMP is enabled (default) and
the read and write community strings have not been changed from their defaults,
you risk unwanted access to the switch. Refer to ”Enabling SNMP Configuration”
on page 3-2 for more information. SNMP is enabled by default.
Section 3
Managing Fabrics
In-band management is the ability to manage switches across inter-switch links
using QuickTools, SNMP, management server, or the application programming
interface. The switch comes from the factory with in-band management enabled. If
you disable in-band management on a particular switch, you can no longer
communicate with that switch by means other than a direct Ethernet or serial
connection. Refer to ”Enabling In-band Management” on page 3-2 for more
59235-02 A 3-1
information.
Page 26

3 – Managing Fabrics
Rediscovering a Fabric
3.1.1
Enabling SNMP Configuration
To enable SNMP configuration, do the following:
1. Open the Switch menu and select SNMP Properties to open the SNMP
Properties dialog.
2. In the SNMP Configuration area, select the SNMP Enabled option.
3. Click the OK button to save the change to the database.
3.1.2
Enabling In-band Management
To enable In-band Management, do the following:
1. Open the Switch menu and select Switch Properties to open the Switch
Properties dialog.
2. Click the In-band Management Enable option.
3. Click the OK button to save the change to the database.
L
3.2
Rediscovering a Fabric
After making changes to or deleting switches from a fabric view, it may be helpful
to again view the actual fabric configuration. The rediscover fabric option clears
out the current fabric information being displayed, and rediscovers all switch
information. To rediscover a fabric, open the Fabric menu, and select Rediscover
Fabric. The rediscover function is more comprehensive than the refresh function.
3.3
Adding a New Switch to a Fabric
If there are no special conditions to be configured for the new switch, simply plug
in the switch and the switch becomes functional with the default fabric
configuration. The default fabric configuration settings are:
Fabric zoning is sent to the switch from the fabric.
All 1/2/4-Gbps ports will be GL_Ports; all 10-Gbps ports will be G_Ports.
The default IP address 10.0.0.1 is assigned to the switch without a gateway
or boot protocol configured (RARP, BOOTP, and DHCP).
If you are adding a new switch to a fabric and do not want to accept the default
fabric configuration, do the following:
1. If the switch is not new from the factory, reset the switch to the factory
configuration before adding the switch to the fabric by selecting Restore
Factory Defaults in the Switch menu.
2. If you want to manage the switch through the Ethernet port, you must first
configure the IP address using the Network Properties dialog or the
Configuration Wizard.
3-2 59235-02 A
Page 27

L
3. Configure any special switch settings. To open the Zoning Config dialog,
open the Zoning menu, and select Edit Zoning Config.
4. Plug in the inter-switch links (ISL), but do not connect the devices.
5. Configure the port types for the new switch using the Port Properties dialog.
The 1/2/4-Gbps ports can be G_Port, GL_Port, F_Port, FL_Port, or Donor.
The 10-Gbps ports can be a G_Port or F_Port.
6. Connect the devices to the switch.
7. Make any necessary zoning changes using the Edit Zoning dialog. To open
the Edit Zoning dialog, open the Zoning menu, and select Edit Zoning.
3.4
Replacing a Failed Switch
The archive/restore works for all switches. However, the Restore menu item is not
available for the in-band switches. You can only restore a switch out-of-band (the
fabric management switch). There are certain parameters that are not archived,
and these are not restored by QuickTools. Refer to ”Archiving a Switch” on
page 4-28 and ”Restoring a Switch” on page 4-29 for information about archive
and restore. Use the following procedure to replace a failed switch for which an
archive is available.
3 – Managing Fabrics
Replacing a Failed Switch
1. At the failed switch:
a. Turn off the power and disconnect the AC cords.
b. Note port locations and remove the interconnection cables and SFPs.
c. Remove the failed switch.
2. At the replacement switch:
a. Mount the switch in the location where the failed switch was removed.
b. Install the SFPs using the same ports as were used on the failed
switch.
CAUTION!
c. Attach the AC cords and power up the switch.
3. Open the Switch menu and select Delete.
4. Restore the configuration from the failed switch to the replacement switch:
a. Open a new fabric through the replacement switch.
b. Open the faceplate display for the replacement switch. Open the
Switch menu and select Restore.
c. In the Restore dialog, enter the archive file from the failed switch or
browse for the file.
d. Click the Restore button.
Do not reconnect inter-switch links, target devices, and
initiator devices at this time. Doing so could invalidate
the fabric zoning configuration.
59235-02 A 3-3
Page 28

3 – Managing Fabrics
Event Browser
5. Reset the replacement switch to activate the configuration formerly
6. Reconnect the inter-switch links, target devices, and initiator devices to the
3.5
Event Browser
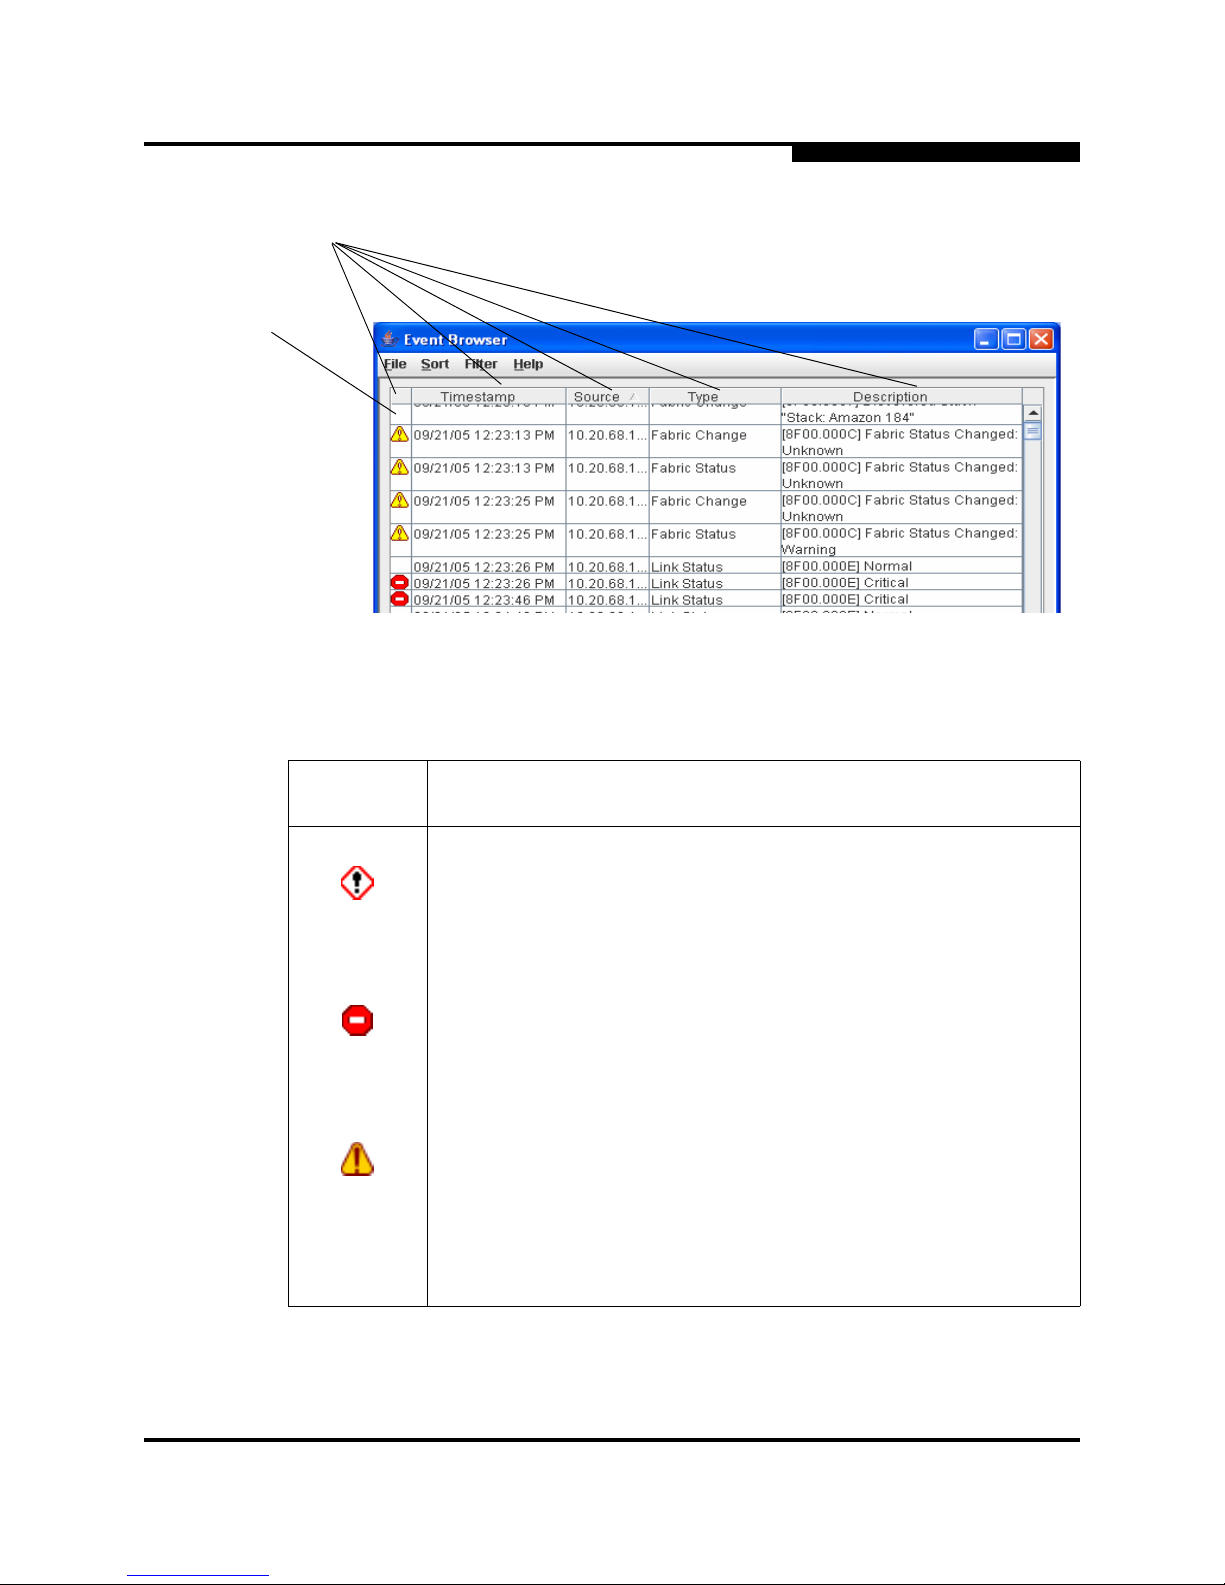
The Event Browser displays a list of events gen erated by the switches in the fabric
and the QuickTools web applet. Events that are generated by the QuickTools web
applet are not saved on the switch, but can be saved to a file during the
QuickTools session.
Entries in the Event Browser, shown in Figure 3-1, are formatted by severity, time
stamp, source, type, and description. The maximum number of entries allowed in
the Event Browser is 10,000. The maximum number of entries allowed on a switch
is 1200. Once the maximum is reached, the event list wraps and the oldest events
are discarded and replaced with the new events. Event entries from the switch,
use the switch time stamp, while event entries generated by the web applet have
a workstation time stamp. You can filter, so rt, and export the co ntents of the Event
Browser to a file. The Event Browser begins recording when enabled and
QuickTools is running.
L
possessed by the failed switch including the domain ID and the zoning
database. Open the Switch menu and select Reset Switch.
replacement switch using the same ports as were used on the failed switch.
If the Event Browser is enabled using the Preferences dialog, the next time
QuickTools is started all events from the switch log will be displayed. If the Event
Browser is disabled when QuickTools is started and later enabled, only those
events from the time the Event Browser was enabled and forward will be
displayed.
To display the Event Browser, open the Fabric menu and select Show Event
Browser, or click the Events button on the tool bar. If the Show Event Browser
selection or the Events button is grayed-out, you must first enable the Events
Browser preference. Refer to ”Setting QuickTools Preferences” on page 2-10.
3-4 59235-02 A
Page 29
L
Column Sorting
Buttons
Severity
Column
3 – Managing Fabrics
Event Browser
Figure 3-1. Events Browser
Severity is indicated in the severity column using icons as described in Table 3-1.
Table 3-1. Severity Levels
Severity
Icon
No icon
Alarm
— an alarm is a "serviceable event". This means that attention by
the user or field service is required. Alarms are posted asynchronously
to the screen and cannot be turned off. If the alarm denotes that a system error has occurred the customer and/or field representative will
generally be directed to provide a "show support" capture of the switch .
Critical event — an event that indicates a potential failure. Critical log
messages are events that warrant notice by the user. By default, these
log messages will be posted to the screen. Critical log messages do not
have alarm status as they require no immediate attention from a user or
service representative.
Warning event
may require attention to maintain maximum perfor mance. Warning messages will not be posted to the screen unless the log is configured to do
so. Warning messages are not disruptive and, therefore, do not meet
the criteria of Critical. The user need not be informed asynchronously
Informative
tion.
— an event that indicates errors or other conditions that
— an unclassified event that provides supporting informa-
Description
59235-02 A 3-5
Page 30

3 – Managing Fabrics
Event Browser
Note: Events (Alarms, Critical, Warning, and Informative) generated by
the web applet are not saved on the switch. They are permanently
discarded when you close a QuickTools session, but you can save
these events to a file on the workstation before you close
QuickTools and read it later with a text editor or browser.
Events generated by the switch are stored on the switch, and will
be retrieved when the web applet is restarted. Some alarms are
configurable.
3.5.1
Filtering the Event Browser
Filtering the Event Browser enables you to display only those events that are of
interest based on the event severity, timestamp, source, type, and description. To
filter the Event Browser, open the Filter menu and select Filter Entries. This
opens the Filter Events dialog shown in Figure 3-2. The Event Browser displays
those events that meet all of the criteria in the Filter Events dialog. If the filtering
criteria is cleared or changed, then all the events that were previously hidden that
satisfy the new criteria will be shown.
L
You can filter the event browser in the following ways:
Severity —
events, critical events, warning events, or informative events.
Date/Time —
bounding timestamps (MM/dd/yy hh:mm:ss aa) to display only those events
that fall within those times. ("aa" indicates AM or PM.) The current year (yy)
can be entered as either 2 or 4 digits. For example, 12/12/03 will be
interpreted December 12, 2003.
Text —
string (case sensitive) for event source, type, and description. The Event
Browser displays only those events that satisfy all of the search
specifications for the Source, Type, and Description text.
select one or more of the corresponding options to display alarm
select one or both of the From: and To: options. Enter the
select one or more of the corresponding options and enter a text
3-6 59235-02 A
Page 31

L
3 – Managing Fabrics
Event Browser
Figure 3-2. Filter Events Dialog
3.5.2
Sorting the Event Browser
Sorting the Event Browser enables you to display the events in alphanumeric
order based on the event severity , timest amp, source, type, or description. Initially,
the Event Browser is sorted in ascending order by timestamp. To sort the Event
Browser, click the Severity, Timestamp, Source, Type, or Description column
buttons. You can also open the Sort menu and select By Severity, By
Timestamp, By Source, By Type, or By Description. Successive sort
operations of the same type alternate between ascending and descending order.
3.5.3
Saving the Event Browser to a File
You can save the displayed Event Browser entries to a file. Filtering affects the
save operation, because only displayed events are saved. To save the Event
Browser to a file, do the following:
1. Filter and sort the Event Browser to obtain the desired display.
2. Open the File menu and select Save As.
3. Select a folder and enter a file name in which to save the e vent log an d click
the Save button. The file can be saved in XML, CSV, or text format. XML
files can be opened with an internet browser or text editor. CSV files can be
opened with most spreadsheet applications.
59235-02 A 3-7
Page 32

3 – Managing Fabrics
Device Information and Nicknames
3.6
Device Information and Nicknames
Devices are hosts and storage targets connected to the switch. A nickname is a
user-definable, meaningful name that can be used in place of the World Wide
Name. This sub-section describes how to view and manage device information
and nicknames.
Devices Data Window
Displaying Detailed Device Information
Managing Device Port Nicknames
3.6.1
Devices Data Window
The Devices data window displays, shown in Figure 3-3, information about
devices connected to the switch. To display the Devices data window, click the
Devices tab below the data window.
L
3-8 59235-02 A
Figure 3-3. Devices Data Window
Page 33

L
3 – Managing Fabrics
Device Information and Nicknames
Table 3-2 describes the entries in the Devices data window.
Table 3-2. Devices Data Window Entries
Entry Description
Port WWN Port world wide name
Nickname Device port nickname. To create a new nickname or edit an
existing nickname, double-click the cell and enter a nickname
in the Edit Nickname dialog. Refer to ”Managing Device Port
Nicknames” on page 3-10 for more information.
Details Click the (i) to display additional information about the device.
Refer to ”Displaying Detailed Device Information” on
page 3-10.
FC Address Fibre Channel address
Switch Switch name
Port Switch port number
Ta rget /Initiator Device type: Target, Initiator, or Both
Vendor Host Bus Adapter/Device V endor
Active Zones The active zone to which the device belongs
Row # Row number reference for each listing in the Devices data win-
dow table
59235-02 A 3-9
Page 34

3 – Managing Fabrics
Device Information and Nicknames
3.6.2
Displaying Detailed Device Information
In addition to the information that is available in the Devices data window, you can
click the (i) in the Details column to open the Detailed Devices Display dialog,
shown in Figure 3-4, to display more information.
L
Figure 3-4. Detailed Devices Display Dialog
3.6.3
Managing Device Port Nicknames
You can assign a nickname to a device port World Wide Name. A nickname is a
user-definable, meaningful name that can be used in place of the World Wide
Name. Assigning a nickname makes it easier to recognize device ports when
zoning your fabric or when viewing the Devices data window.
Nicknames are stored on each 6.X switch, and are not compatible with 5.x switch
nickname files. In addition to creating, editing, and deleting nicknames, you can
also export the nicknames to a file, which can then be imported into the
Nicknames.xml file on other workstations. The maximum number of nicknames
allowed is 5000.
3-10 59235-02 A
Page 35

L
Nicknames are saved to an XML file stored on the switch. If different nickname
files exist on other switches in the fabric, you will be prompted to resolve
differences before the Nicknames dialog will be displayed. A series of dialogs is
presented to resolve differences between the nicknames stored on that switch
with nicknames stored on other switches. The most recent nickname takes
precedence during nickname resolution. Changes made in the Nickname dialog
are propagated to all switches in the fabric after you click the Apply button.
3.6.3.1
Creating a Nickname
To create a device port nickname, do the following:
1. Open the Fabric menu and select Nicknames to open the Nicknames
dialog. The device entries are listed in table format.
2. Choose one of the following methods to enter a nickname. A nickname must
start with a letter and can have up to 64 characters. Valid characters include
alphanumeric characters [aA-zZ][0-9] and special symbols [$ _ - ^ ].
Double-click a cell in the Nicknames column, and enter a new
nickname in the text field. Click the Save button to save the changes
and exit the Nicknames dialog.
3 – Managing Fabrics
Device Information and Nicknames
Click on a device in the table. Open the Edit menu and select Create
3.6.3.2
Editing a Nickname
A nickname must start with a letter and can have up to 64 characters. Valid
characters include alphanumeric characters [aA-zZ][0-9] and special symbols [$ _
- ^ ].
Open the Fabric menu and select Nicknames to open the Nicknames dialog. The
device entries are listed in table format. Choose one of the following methods to
edit a nickname:
Double-click a cell in the Nicknames column, and edit the nickname in the
text field. In the Nicknames dialog, click the Apply button to save the
changes.
Click on a device entry in the table. Open the Edit menu and select Edit
Nickname to open the Edit Nicknames dialog. Edit the nickname in the text
field. Click the OK button to save the changes. In the Nicknames dialog,
click the Apply button to save the changes.
Nickname to open the Add Nickname dialog. In the Add Nickname
dialog, enter a nickname and WWN and click the OK button.
59235-02 A 3-11
Page 36

3 – Managing Fabrics
Device Information and Nicknames
3.6.3.3
Deleting a Nickname
To delete a device port nickname, do the following:
1. Open the Fabric menu and select Nicknames to open the Nicknames
dialog.
2. Choose one of the following:
Click a device in the table. Open the Edit menu and select Delete
Nickname.
Double-click a cell in the Nicknames column, and delete the nickname
text.
3. Click the Apply button to save the changes.
3.6.3.4
Exporting Nicknames to a File
You can save nicknames to a file. This is useful for distributing nicknames to other
management workstations. To save nicknames to an XML file, do the following:
L
1. Open the Fabric menu and select Nicknames to open the Nicknames
dialog.
2. Open the File menu in the Nicknames dialog, and select Export.
3. Enter a name for the XML nickname file in the Save dialog and click Save.
3-12 59235-02 A
Page 37

L
3.6.3.5
Importing a Nicknames File
Importing a nicknames file copies its contents into and replaces the contents of
the Nicknames.xml file which is used by QuickTools. To import a nickname file, do
the following:
1. Open the Fabric menu and select Nicknames to open the Nicknames
dialog.
2. Open the File menu in the Nicknames dialog, and select Import.
3. Select an XML nickname file in the Open dialog and click Open. When
prompted to overwrite existing nicknames, click Yes.
3.7
Zoning
Zoning a fabric enables you to divide the ports and devices of the fabric into zones
for more efficient and secure communication among functionally grouped nodes.
This section addresses the following topics:
Active Zone Set Data Window
Configured Zonesets Data Window
Zoning Concepts
3 – Managing Fabrics
Zoning
Managing the Zoning Database
Managing Zone Sets
Managing Zones
Managing Aliases
Merging Fabrics and Zoning
59235-02 A 3-13
Page 38

3 – Managing Fabrics
Zoning
3.7.1
Active Zone Set Data Window
The Active Zoneset data window, shown in Figure 3-5, displays the zone
membership for the active zone set that resides on the fabric management switch.
The active zone set is the same on all switches in the fabric. To open the Active
Zoneset data window, click the Active Zoneset tab below the data window.
The Active Zoneset data window uses display conventions for expanding and
contracting entries that are similar to the fabric tree. An entry handle located to the
left of an entry in the tree indicates that the entry can be expanded. Click this
handle or double-click the following entries:
A zone set entry expands to show its member zones.
A zone entry expands to show its member ports/devices.
Ports/devices that are zoned by WWN or FC address, but no longer part of
the fabric, are grayed-out.
L
Active Zoneset
Data Window
Figure 3-5. Active Zone Set Data Window
3-14 59235-02 A
Page 39

L
3.7.2
Configured Zonesets Data Window
The Configured Zonesets data window, shown in Figure 3-6, displays all zone
sets, zones, aliases, and zone membership in the zoning database. To open the
Configured Zonesets data window, click the Configured Zonesets tab below the
data window.
The Configured Zonesets data window uses display conventions for expanding
and contracting entries that are similar to the fabric tree. An entry handle located
to the left of an entry in the tree indicates that the entry can be expanded. Click
this handle or double-click the following entries to expand or collapse them:
A zone set entry expands to show its member zones.
A zone entry expands to show its members by device port World Wide
Name, or device port Fibre Channel address.
The alias entry expands to show its entries.
3 – Managing Fabrics
Zoning
Figure 3-6. Configured Zonesets Data Window
59235-02 A 3-15
Configured
Zonesets Data
Window
Page 40

3 – Managing Fabrics
Zoning
3.7.3
Zoning Concepts
The following zoning concepts provide some context for the zoning tasks
described in this section:
Zones
Aliases
Zone Sets
Zoning Database
Configuring the Zoning Database
3.7.3.1
Zones
Zoning divides the fabric for purposes of controlling discovery and inbound traffic.
A zone is a named group of ports or devices. Members of the same zone can
communicate with each other and transmit outside the zone, but cannot receive
inbound traffic from outside the zone. A port/device can be a member of up to
eight zones whose combined membership does not exceed 64.
L
Zoning is hardware enforced on a switch port if the sum of the logged-in devices
plus the devices zoned with devices on that port is 64 or less. If a port exceeds
this sum, that port behaves as a soft zone member. The port continues to behave
as a soft zone member until the sum of logged-in and zoned devices falls back to
64, and the port is reset.
A zone can be a component of more than one zone set. Several zone sets can be
defined for a fabric, but only one zone set can be active at one time. The active
zone set determines the current fabric zoning.
Membership in a zone can be defined by switch domain ID and port number,
device Fibre Channel address (FCID), or device World Wide Name (WWN).
WWN entries define zone membership by the World Wide Name of the
attached device. With this membership method, you can move WWN
member devices to different switch ports in dif fe rent zones without having to
edit the member entry as you would with a domain ID/port number member.
Furthermore, unlike FCID members, WWN zone members are not affected
by changes in the fabric that could change the Fibre Channel address of an
attached device.
FCID entries define zone membership by the Fibre Channel address of the
attached device. With this membership method you can replace a device on
the same port without having to edit the member entry as you would with a
WWN member.
Domain ID/Port number entries define zone membership by switch domain
ID and port number. All devices attached to the specified port become
members of the zone. The specified port must be an F_Port or an FL_Port.
3-16 59235-02 A
Page 41

L
3.7.3.2
Aliases
3.7.3.3
Zone Sets
3 – Managing Fabrics
Zoning
To make it easier to add a group of ports or devices to one or more zones, you can
create an alias. An alias is a named set of ports or devices that are grouped
together for convenience. Unlike zones, aliases impose no communication
restrictions between its members. You can add an alias to one or more zones.
However, you cannot add a zone to an alias, nor can an alias be a member of
another alias.
A zone set is a named group of zones. A zone can be a member of more than one
zone set. Each switch in the fabric maintains its own zoning database containing
one or more zone sets. This zoning database resides in non-volatile or permanent
memory and is therefore retained after a reset. Refer to ”Configured Zonesets
Data Window” on page 3-15 for information about displaying the zoning database.
Note: Zones that are currently not in a zone set are considered to be part of
the “orphan zone set”. The orphan zone set is not an actual zone set,
but rather a way of displaying the zones that are not currently in a zone
set.
To apply zoning to a fabric, choose a zone set and activate it. When you activate a
zone set, the switch distributes that zone set and its zones, excluding aliases, to
every switch in the fabric. This zone set is known as the active zone set. Refer to
”Active Zone Set Data Window” on p age 3-14 for information about displaying the
active zone set.
59235-02 A 3-17
Page 42

3 – Managing Fabrics
Zoning
3.7.3.4
Zoning Database
Each switch has its own zoning database. The zoning database is made up of all
aliases, zones, and zone sets that have been created on the switch or received
from other switches. The switch maintains two copies of the inactive zoning
database: one copy is maintained in temporary memory for editing purposes; the
second copy is maintained in permanent memory. Zoning database edits are
made on an individual switch basis and are not propagated to other switches in
the fabric when saved.
The Merge Auto Save parameter determines whether changes to the active zone
set that a switch receives from another switch in the fabric will be saved to
permanent memory on that switch. Refer to ”Configuring the Zoning Database” on
page 3-24 for information about zoning configuration.
3.7.3.5
Viewing Zoning Limits and Properties
The zoning limits for switches with 6.8 firmware are:
MaxZoneSets is 256. The maximum number of zone sets that can be
configured on the switch.
MaxZones is 2000. The maximum number of zones that can be configured
on the switch, including orphan zones.
MaxAliases is 2500. The maximum number of aliases that can be configured
on the switch.
MaxTotalMembers is 10,000. The maximum number of zone and alias
members (10000) that can be stored in the switch’s zoning database. Each
instance of a zone member or alias member counts toward this maximum.
L
MaxZonesInZoneSets is 2000. The maximum number of zone linkages to
zonesets that can be configured on the switch. Every time a zone is added
to a zoneset this constitutes a linkage.
MaxMembersPerZone is 2000. The maximum number of zone members
that can be added to any zone on the switch. Aliases are considered zone
members when added to a zone.
MaxMembersPerAlias is 2000. The maximum number of zone members that
can be added to any alias on the switch.
To view zoning properties and limits on a switch, do the following:
1. On the faceplate display, open the Zoning menu and select Edit Zoning or
click the Zoning button to open the Edit Zoning dialog.
2. Choose one of the following:
The zoning properties/limits are displayed under the zoning toolbar, as
shown in Figure 3-7.
3-18 59235-02 A
Page 43

L
In the zone sets tree (left windowpane), right-click the Zone Set s at the
very top, and select Properties.
In the zone set tree (left windowpane), select the Zone Sets entry at
the very top, open the Edit menu, and select Properties.
3. View the zoning properties information in the Properties dialog.
4. Click the OK button to close the Properties dialog.
3.7.4
Managing the Zoning Database
Managing the zoning database consists of the following:
Editing the Zoning Database
Resolving Zoning
Configuring the Zoning Database
Saving the Zoning Database to a File
Restoring the Zoning Database from a File
Restoring the Default Zoning Database
3 – Managing Fabrics
Zoning
Removing All Zoning Definitions
59235-02 A 3-19
Page 44

3 – Managing Fabrics
Zoning
3.7.4.1
Editing the Zoning Database
Use the Edit Zoning dialog, shown in Figure 3-7, to edit the zoning database for a
particular switch. To open the Edit Zoning dialog, open the Zoning menu and
select Edit Zoning. Changes can only be made to inactive zone sets, which are
stored in flash (non-volatile) memory and retained after resetting a switch.
L
Port/Device
Tree
Zone Sets
Tree
Figure 3-7. Edit Zoning Dialog
To apply zoning to a fabric, choose a zone set and activate it. When you activate a
zone set, the switch distributes that zone set and its zones, excluding aliases, to
every switch in the fabric. This zone set is known as the active zone set.
You cannot edit an active zone set on a switch. You must configure an inactive
zone set to your needs and then activate that updated zone set to apply the
changes to the fabric. When you activate a zone set, the switch distributes that
zone set to the temporary zoning database on every switch in the fabric. However ,
in addition to the merged active zone set, each switch maintains its own original
zone set in its zoning database. Only one zone set can be active at one time.
3-20 59235-02 A
Page 45

L
3 – Managing Fabrics
Zoning
Note: If the Merge Auto Save parameter is enabled on the Zoning
Configuration dialog, then every time the active zone set changes, the
switch will copy it into an inactive zone set stored on the switch. You
can edit this copy of the active zone set stored on the switch, and
activate the updated copy to conveniently apply the changes to the
active zone set. The edited copy then becomes the active zone set.
The Edit Zoning dialog has a Zone Sets tree on the left and a Port/Device (or
members) tree on the right. Both trees use display conventions similar to the
fabric tree for expanding and contracting zone sets, zones, and ports. An
expanded port shows the port Fibre Channel address; an expanded address
shows the port World Wide Name. You can select zone sets, zones, and ports in
the following ways:
Click a zone, zone set, or port icon.
Right-click to select a zone set or zone, and open the corresponding popup
menu.
Press the Shift key while clicking several consecutive icons.
Press the Control key while clicking several non-consecutive icons.
Using tool bar buttons, popup menus, or a drag-and-drop method, you can create
and manage zone sets and zones in the zoning datab ase. Table 3-3 describes the
zoning tool bar operations.
Use the Edit Zoning dialog to define zoning changes, and click the Apply button
to open the Error Check dialog. Click the Error Check button to have QuickTools
check for zoning conflicts, such as empty zones, aliases, or zone set s, and zones
with non-domain ID/port number membership. Click the Save Zoning button to
implement the changes. Click the Close button to close the Error Check dialog.
On the Edit Zoning dialog, click the Close button to close the Edit Zoning dialog.
Table 3-3. Edit Zoning Dialog Tool Bar Buttons and Icons
Button/Icon Description
Create Zone Set button
Create Zone button
— creates a new zone set
— creates a new zone
59235-02 A 3-21
Create Alias button
— creates another name for a set of objects
Page 46

3 – Managing Fabrics
Zoning
L
Table 3-3. Edit Zoning Dialog Tool Bar Buttons and Icons (Continued)
Button/Icon Description
Add Member button — adds selected port/device to a zone
Remove Member button
set, or delete the selected port/device from a zone
Copy button
Paste button — pastes clipboard items to selected zoning item
where applicable.
Switch port icon
Switch port icon
NL_Port (loop) device icon
— copies selected zoning items to clipboard.
— not logged in
— logged in
— deletes the selected zone from a zone
— logged in to fabric
3-22 59235-02 A
NL_Port (loop) device icon
N_Port device icon
N_Port device icon
— logged in to fabric
— not logged in to fabric
— not logged in to fabric
Page 47

L
3.7.4.2
Resolving Zoning
The Resolving Zoning options enable you to manage the active, configured, and
merged zone sets in the zoning database. To access the Resolving Zoning
options, open the faceplate display, open the Zoning menu, and select Resolve
Zoning
3.7.4.2.1
Capture Active Zoning
The Capture Active Zoning option copies the active zone set to the configured
zone set.
3.7.4.2.2
Restore Configured Zoning
The Restore Configured Zoning option reverts back to the previously saved
configured zone set.
3 – Managing Fabrics
Zoning
3.7.4.2.3
Capture Merged Zoning
The Capture Merged Zoning option saves the merged zone set into the configured
zone set.
3.7.4.2.4
View Merged/Configured Differences
The View Merged/Configured Differences option opens a dialog to display the
Merged and Configured zone sets in split panes. The items in the Merged but not
the Configured are shown in red (to highlight that they will go away on the next
reset). The items in the Configured but not the Merged show up as green (to
highlight the fact that they will be there after the next reset. The bottom pane is an
English description of the differences in summary.
59235-02 A 3-23
Page 48

3 – Managing Fabrics
Zoning
3.7.4.3
Configuring the Zoning Database
Use the Zoning Config dialog, shown in Figure 3-8, to change the Auto Save,
Default Zone, and Discard Inactive configuration parameters. Open the Zoning
menu and select Edit Zoning Config to open the Zoning Config dialog. After
making changes, click the OK button to put the new values into effect.
L
3.7.4.3.1
Merge Auto Save
The Merge Auto Save parameter determines whether changes to the active zone
set that a switch receives from other switches in the fabric will be saved to the
zoning database on that switch. Changes a re saved whe n an updated zone set is
activated. Zoning changes are always saved to temporary memory. However, if
Merge Auto Save is enabled, the switch firmware saves changes to the active
zone set in temporary memory and to the zoning database. If Merge Auto Save is
disabled, changes to the active zone set are stored only in temporary memory
which is cleared when the switch is reset.
Note: Disabling the Merge Auto Save parameter can be useful to prevent the
Figure 3-8. Zoning Config Dialog
propagation of zoning information when experimenting with different
zoning schemes. However, leaving the Merge Auto Save parameter
disabled can disrupt device configurations should a switch have to be
reset. For this reason, the Merge Auto Save parameter should be
enabled in a production environment.
3-24 59235-02 A
Page 49

L
3.7.4.3.2
Default Zone
The Default Zone parameter enables (Allow) or disables (Deny) communication
among ports/devices that are not defined in the active zone set or when there is
no active zone set. This parameter must have the same value throughout the
fabric. If interop mode is not Standard mode, the Default Zone parameter is
automatically distributed throughout the fabric.
3.7.4.3.3
Discard Inactive
The Discard Inactive parameter automatically removes inactive zones and zone
sets when a zoneset is activated or deactivated from a remote switch.
3.7.4.4
Saving the Zoning Database to a File
You can save the zoning database to an XML file. You can later reload this zoning
database on the same switch or another switch. To save a zoning database to a
file, do the following:
3 – Managing Fabrics
Zoning
1. Open the Zoning menu, and select Edit Zoning.
2. In the Edit Zoning dialog, open the File menu and select Save As.
3. In the Save dialog, enter a file name for the database file.
4. Click the Save button to save the zoning file.
3.7.4.5
Restoring the Zoning Database from a File
CAUTION! Restoring the zoning database from a file will replace the current
zoning database on the switch.
Do the following to restore the zoning database from a file to a switch:
1. Open the Zoning menu and select Edit Zoning to open the Edit Zoning
window.
2. Open the File menu and select Open File. A popup window will prompt you
to select an XML zoning database file.
3. Select a file and click Open.
59235-02 A 3-25
Page 50

3 – Managing Fabrics
Zoning
3.7.4.6
Restoring the Default Zoning Database
Restoring the default zoning clears the switch of all zoning definitions.
L
CAUTION!
To restore the default zoning for a switch:
1. Open the Zoning menu and select Restore Default Zoning.
2. Click the OK button to confirm that you want to restore default zoning and
save changes to the zoning database.
3.7.4.7
This command will deactivate the active zone set.
Removing All Zoning Definitions
To clear all zone and zone set definitions from the zoning database, choose one of
the following:
Open the Edit menu and select Clear Zoning. In the Removes All dialog,
click the Yes button to confirm that you want to delete all zones and zone
sets.
Right-click the Zone Sets heading at the top of the Zone Sets tree, and
select Clear Zoning from the popup menu. Click the Yes button to confirm
that you want to delete all zone sets and zones.
3.7.5
Managing Zone Sets
Zoning a fabric involves creating a zone set, creating zones as zon e set members,
then adding devices as zone members. The zoning database supports multiple
zone sets to serve the different security and access needs of your storage area
network, but only one zone set can be active at one time. Managing zone sets
consists of the following tasks:
Creating a Zone Set
Activating and Deactivating a Zone Set
Copying a Zone to a Zone Set
Removing a Zone Set
Note: Changes that you make to the zoning database are limited to the
managed switch and do not propagate to the rest of the fabric. To
distribute changes to configured zone sets fabric wide, you must edit
the zoning databases on the individual switches.
3-26 59235-02 A
Page 51

L
3.7.5.1
Creating a Zone Set
To create a zone set, do the following:
1. Open the Zoning menu, and select Edit Zoning to open the Edit Zoning
dialog.
2. Open the Edit menu, and select Create Zone Set to open the Create Zone
Set dialog.
3. Enter a name for the zone set, and click the OK button. The new zone set
name is displayed in the Zone Sets dialog. A zone set name must begin with
a letter and be no longer than 64 characters. Valid characters are 0-9, A-Z,
a-z, _, -, ^, and $.
4. To create new zones in a zone set, choose one of the following:
Right-click a zone set and select Create A Zone from the popup menu.
3 – Managing Fabrics
Zoning
In the Create a Zone dialog, enter a name for the new zone, and click
the OK button. The new zone name is displayed in the Zone Sets
dialog.
Copy an existing zone by dragging a zone into the new zone set. Refer
to ”Copying a Zone to a Zone Set” on page 3-30 .
5. Click the Apply button to save changes to the zoning database.
3.7.5.2
Activating and Deactivating a Zone Set
You must activate a zone set to apply its zoning definitions to the fabric. Only on e
zone set can be active at one time. When you activate a zone set, the switch
distributes that zone set to the temporary zoning database on every switch in the
fabric.
The purpose of the deactivate function is to suspend all fabric zoning which
results in free communication fabric wide or no communication. It is not necessary
to deactivate the active zone set before activating a new one.
To activate a zone set, open the Zoning menu and select Activate Zone Set
to open the Activate Zone Set dialog. Select a zone set from th e Select Zone
Set drop-down list, and click the Activate button.
To deactivate the active zone set, open the Zoning menu, select Deactivate
Zone Set. Acknowledge the warning about traffic disruption, and click the
Yes button to confirm that you want to deactivate the active zone set.
59235-02 A 3-27
Page 52

3 – Managing Fabrics
Zoning
3.7.5.3
Renaming a Zone Set
To rename a zone set, do the following:
1. In the Zone Sets tree of the Edit Zoning dialog, click the zone set to be
renamed.
2. Open the Edit menu and select Rename.
3. In the Rename Zone Set dialog, enter a new name for the zone set.
4. Click the OK button.
3.7.5.4
Removing a Zone Set
Removing a zone set from the database affects the me mber zones in the following
ways.
Member zones that are members of other zone sets are not affected.
Zones that are currently not in a zone set are considered to be part of the
“orphan zone set”. The orphan zone set is not an actual zone set, but rather
a way of displaying the zones that are not currently in a zone set.
L
To remove a zone set, do the following:
1. Open the Zoning menu and select Edit Zoning to open the Edit Zoning
dialog.
2. In the Zone Sets tree, select the zone set to be removed.
3. Open the Edit menu, and select Remove to remove the zone set.
4. Click the Apply button to save changes to the zoning database.
Alternatively, you may use shortcut menus to remove a zone set from the
database.
3-28 59235-02 A
Page 53

L
3.7.6
Managing Zones
Managing zones involves the following:
Creating a Zone in a Zone Set
Adding Zone Members
Renaming a Zone
Removing a Zone Member
Removing a Zone from a Zone Set
Removing a Zone from All Zone Sets
Note: Changes that you make to the zoning database are limited to the
3 – Managing Fabrics
Zoning
managed switch and do not propagate to the rest of the fabric. To
distribute changes to configured zone sets fabric wide, you must edit
the zoning databases on the individual switches.
3.7.6.1
Creating a Zone in a Zone Set
To create a zone in a zone set, do the following:
1. Open the Zoning menu, and select Edit Zoning to open the Edit Zoning
dialog.
2. Select a zone set.
3. Open the Edit menu and select Create a Zone.
4. In the Create a Zone dialog, enter a name for the new zone, and click the
OK button. The new zone name is displayed in the Zone Sets dialog. A zone
name must begin with a letter and be no longer than 64 characters. Valid
characters are 0-9, A-Z, a-z, _, ^, $, and -.
Note: If you enter the name of a zone that already exists in the
database, the QuickTools web applet will ask if you would like to
add that zone and its membership to the zone set.
5. To add switch ports or attached devices to the zone, choose one of the
following:
In the zone set tree, select the zone set. In the graphic window, select
the port to add to the zone. Open the Edit menu and select Add
Members.
Select a port by port number, Fibre Channel address, or World Wide
Name in the Port/Device tree, and drag it into the zone.
59235-02 A 3-29
Page 54

3 – Managing Fabrics
Zoning
Select a port by port number, Fibre Channel address, or World Wide
Name in the Port/Device tree. Right-click the zone and select Add
Zone Members from the popup menu.
6. Click the Apply button to save changes to the zoning database.
3.7.6.2
Copying a Zone to a Zone Set
To copy an existing zone and its membership from one zone set to another , do the
following:
1. In the faceplate display, open the Zoning menu and select Edit Zoning to
open the Edit Zoning dialog.
2. In the zone set tree, select the zone to copy, and drag it to the chosen zone
set.
3. Click the OK button to display the Error Check dialog.
4. Click the Error Check button to have the application check for zoning
conflicts, such as empty zones, aliases, or zone sets.
L
5. Click the Save Zoning button to implement the changes.
6. Click the Close button to close the Error Check dialog.
3.7.6.3
Adding Zone Members
You can zone a port/device by switch domain ID and port number, device port
Fibre Channel address, or the device port WWN. Adding a port/device to a zone
affects every zone set in which that zone is a member. To add ports/devices to a
zone, do the following:
1. Open the Zoning menu, and select Edit Zoning to open the Edit Zoning
dialog.
2. Choose one of the following methods to add the port/device:
Select a port/device in the Port/Device tree, and drag it into the zone.
To select multiple ports/devices, press the Control key while selecting.
Select a port/device in the Port/Device tree. To select multiple
ports/devices, press the Control key while selecting. Select a zone set
in the left pane. Open the Edit menu and select Add Members.
Select a port/device in the Port/Device tree. To select multiple
ports/devices, press the Control key while selecting. Select a zone set
in the left pane. Click the Insert button.
If the port/device you want to add is not in the Port/Device tree, you can add
it by doing the following:
a. Right-click the selected zone.
b. Open the Edit menu and select Create Members.
3-30 59235-02 A
Page 55

L
3 – Managing Fabrics
Zoning
c. Select the WWN, Domain/Port, or First Port Address option.
d. Enter the hexadecimal value for the port/device according to the option
selected: 16 digits for a WWN member, 4 digits for a Domain/ Port
member (DDPP), or a 6-digit Fibre Channel Address for a First Port
Address member (DDPP AA) wher e D=domain ID, P=port number, and
A=ALPA.
3. Click the OK button to display the Error Check dialog.
4. Click the Error Check button to have the application check for zoning
conflicts, such as empty zones, aliases, or zone sets.
5. Click the Save Zoning button to implement the changes.
6. Click the Close button to close the Error Check dialog.
7. On the Edit Zoning dialog, click the Close button to close the Edit Zoning
dialog.
Note: Domain ID conflicts can result in automatic reassignment of switch
domain IDs. These reassignments are not reflected in zones that use
domain ID/port number pair to define their membership. Be sure to
reconfigure zones that are affected by a domain ID change.
3.7.6.4
Renaming a Zone
To rename a zone, do the following:
1. In the Zone Sets tree of the Edit Zoning dialog, click the zone to be
renamed.
2. Open the Edit menu and select Rename.
3. In the Rename Zone dialog, enter a new name for the zone.
4. Click the OK button.
3.7.6.5
Removing a Zone Member
Removing a zone member will affect every zone and zone set in which that zone
is a member. To remove a member from a zone:
1. In the Edit Zoning dialog, select the zone member to be removed.
2. Open the Edit menu and select Remove.
3. Click the Yes button in the Remove dialog to save the change.
4. Click the Apply button in the Edit Zoning dialog to save the change.
5. Click the Close button to close the Edit Zoning dialog.
59235-02 A 3-31
Page 56

3 – Managing Fabrics
Zoning
3.7.6.6
Removing a Zone from a Zone Set
To remove a zone from a zone set, do the following:
1. In the Edit Zoning dialog, select the zone to be removed. The selected zone
will be removed from that zone set only.
2. Open the Edit menu and select Remove.
3. Click the Yes button in the Remove dialog to save the change.
4. Click the Apply button in the Edit Zoning dialog to save the change.
5. Click the Close button to close the Edit Zoning dialog.
3.7.6.7
Removing a Zone from All Zone Sets
To remove a zone from all zone sets, do the following:
1. In the Edit Zoning dialog, select the zone to be removed.
2. Open the Edit menu and select Delete Zone.
3. Click the Yes button in the Remove dialog to save the change.
L
4. Click the Apply button in the Edit Zoning dialog to save the change.
5. Click the Close button to close the Edit Zoning dialog.
3.7.7
Managing Aliases
An alias is a collection of objects that can be zoned together. An alias is not a
zone, and cannot have a zone or another alias as a member.
Note: Changes that you make to the zoning database are limited to the
managed switch and do not propagate to the rest of the fabric. To
distribute changes to configured zone sets fabric wide, you must edit
the zoning databases on the individual switches.
You will not see aliases in the active zone set.
3-32 59235-02 A
Page 57

L
3.7.7.1
Creating an Alias
To create an alias, do the following:
1. Open the Zoning menu, and select Edit Zoning to open the Edit Zoning
dialog.
2. Open the Edit menu, and select Create Alias to open the Create Alias
dialog.
3. Enter a name for the alias, and click the OK button. The alias name is
displayed in the Zone Sets dialog. An alias name must begin with a letter
and be no longer than 64 characters. V alid characters are 0-9, A-Z, a-z, _, $,
^, and -.
4. Click the Apply button to save the alias name to the zoning database.
3.7.7.2
Adding a Member to an Alias
You can add a port/device to an alias by domain ID and port number, device port
Fibre Channel address, or the device port WWN. To add ports/devices to an alias,
do the following:
1. Open the Zoning menu, and select Edit Zoning to open the Edit Zoning
dialog.
2. Choose one of the following methods to add the port/device:
3 – Managing Fabrics
Zoning
Select a port/device in the Port/Device tree, and drag it into the alias.
To select multiple ports/devices, press the Control key while selecting.
Select a port/device in the Port/Device tree. Click an alias to select
multiple ports/devices, press the Control key while selecting. Select
an alias. Open the Edit menu and select Add Members.
Select a port/device in the Port/Device tree. To select multiple
ports/devices, press the Control key while selecting. Select an alias.
Click the Insert button.
If the port/device you want to add is not in the Port/Device tree, you can add
it by doing the following:
a. Right-click the selected alias.
b. Open the Edit menu and select Create Members.
c. Select the WWN, Domain/Port, or First Port Address option.
d. Enter the hexadecimal value for the port/device according to the option
selected: 16 digits for a WWN member, 4 digits for a Domain/ Port
member (DDPP), or a 6-digit Fibre Channel Address for a First Port
Address member (DDPP AA) wher e D=domain ID, P=port number, and
A=ALPA.
3. Click the OK button to add the member and save the change.
59235-02 A 3-33
Page 58

3 – Managing Fabrics
Zoning
3.7.7.3
Removing an Alias from All Zones
To remove an alias from all zones, do the following:
1. In the Zone Sets tree in the Edit Zoning dialog, select the alias to be
removed.
2. Open the Edit menu, and select Delete Alias.
3. Click the Yes button in the Remove dialog to save the change.
4. Click the Apply button in the Edit Zoning dialog to save the change.
5. Click the Close button to close the Edit Zoning dialog.
3.7.8
Merging Fabrics and Zoning
If you join two fabrics with an inter-switch link, the active zone sets from the two
fabrics attempt to merge automatically. The fabrics may consist of a single switch
or many switches already connected together. The switches in the two fabrics
attempt to create a new active zone set containing the union of each fabric's
active zone set. The propagation of zoning informat ion only affects th e active zone
set, not the configured zone sets, unless Merge Auto Save is turned on.
L
3.7.8.1
Zone Merge Failure
If a zone merge is unsuccessful, the inter-switch links between the fabrics will
isolate due to a zone merge failure, which will generate an alarm. The reason for
the E_Port isolation can also be determined by viewing the port information. Refer
to Table 5-1 for more information.
A zone merge will fail if the two active zone sets have member zones with
identical names that differ in membership or type. For e xample, consid er Fabric A
and Fabric B each with a zone named “ZN1” in its active zone set. Fabric A "ZN1"
contains a member specified by Domain ID 1 and Port 1; Fabric B “ZN1” cont a ins
a member specified by Domain ID 1 and Port 2. In this case, the merge will fail
because the two zones have the same name, but different membership.
A zone merge may also fail if the merged zones/members exceeds the max
zoning limits. Refer to ”Viewing Zoning Limits and Properties” on page 3-18 for
more information on zoning limits.
3-34 59235-02 A
Page 59

L
3.7.8.2
Zone Merge Failure Recovery
When a zone merge failure occurs, the conflict that caused the failure must be
resolved. You can correct a failure due to a zone conflict by deactivating one of
the active zone sets or by editing the conflicting zones so that their membership is
the same. You can deactivate the active zone set on one fabric if the active zone
set on the other fabric accurately defines your zoning needs. If not, you must edit
the zone memberships, and reactivate the zone sets. After correcting the zone
membership, reset the isolated ports to allow the fabrics to join.
Note: If you deactivate the active zone set in one fabric and the Merge Auto
Save parameter is enabled, the active zone set from the secon d fabric
will propagate to the first fabric and replace all zones with matching
names in the configured zone sets.
Refer to ”Managing Zones” on page 3-29 for information about adding and
removing zone members. Refer to ”Resetting a Port” on page 5-18 for information
about resetting a port.
3 – Managing Fabrics
Zoning
59235-02 A 3-35
Page 60

3 – Managing Fabrics
Zoning
Notes
L
3-36 59235-02 A
Page 61

This section describes the following tasks that manage switches in the fabric.
Managing User Accounts
Paging a Switch
Setting the Date/Time and Enabling NTP Client
Resetting a Switch
Configuring a Switch
Archiving a Switch
Restoring a Switch
Restoring the Factory Default Configuration
Downloading a Support File
Installing Firmware
Using Call Home
4.1
Switch Data Window
Section 4
Managing Switches
The Switch data window, shown in Figure 4-1, displays the current network and
switch information for the selected switch. To open the Switch data window, click
the Switch tab below the data window.
59235-02 A 4-1
Page 62

4 – Managing Switches
Switch Data Window
L
Figure 4-1. Switch Data Window
Information in the Switch data window is grouped and accessed b y the Summary,
Status, Network, User Login, Firmware, Services, Zones/Security, and Advanced
buttons. Click a button to display the grouped information in the data window on
the right. Figure 4-2 describes the Switch data window buttons.
Figure 4-2. Switch Data Window Buttons
The Switch data window entries are listed in Table 4-1.
4-2 59235-02 A
Page 63

L
4 – Managing Switches
Switch Data Window
Table 4-1. Switch Data Window Entries
Entry Description
Summary Group
Switch Type Switch model
First Port Address Switch Fibre Channel address
World Wide Name Switch world wide name
Serial Number Number assigned to each chassis.
Reason for Status The reason for the operational state.
Vendor Switch manufacturer
MAC Address Media Access Control address
Negotiated Domain ID The domain ID currently being used by the fabric
Configured Domain ID The domain ID defined by network administrator
Domain ID Lock Domain ID lock status. Prevents (True) or permits (False)
dynamic domain ID reassignment.
Number of Ports Number of ports activated on the switch
Operational State Switch operational state: Online, Offline, Diagnostic,
Down
Administrative State Current switch administrative state
Configured Admin State Switch administrative state that is stored in the switch
configuration
Beacon Status Beacon status. Switch LEDs are blinking (On) or not (off).
Status Group
Operational State Switch operational state: Online, Offline, Diagnostic,
Down
Administrative State Current switch administrative state
Configured Admin State Switch administrative state that is stored in the switch
configuration
Beacon Status Beacon status. Switch LEDs are blinking (On) or not (off).
Reason for Status The reason for the operational state.
Temperature Internal switch temperature °C
Fan 1 Status Fan 1 status
59235-02 A 4-3
Page 64

4 – Managing Switches
Switch Data Window
Fan 2 Status Fan 2 status
Fan 3 Status Fan 3 Status
Power Supply 1 Status Power supply 1 status
Power Supply 2 Status Power supply 2 status
L
Table 4-1. Switch Data Window Entries (Continued)
Entry Description
Temperature Failure Port
Shutdown
Warning Temperature Non-configurable temperature threshold (65° Celsius)
Failure Temperature Non-configurable temperature threshold (70° Celsius)
Diag Status The current diagnostic state of switch.
Diag Fault Code The code value for the la st recor ded diagno stic test result
Test Status The current diagnostic test status of switch.
Test Fault Code The code value for the last recorded diagnostic test status
Network Group
IP Address Internet Protocol address
Subnet Mask Mask that determines the IP address subnet
Gateway Gateway address
Non-configurable (always enabled for this switch). All
ports are downed when the switch temperature exceeds
the Failure Temperature.
above which a warning condition alarm is generated.
above which a failure condition alarm is generated.
recorded on the switch.
recorded on the switch.
SNMP Enabled SNMP enabled or disabled.
Broadcast Support Broadcast support status. Broadcast support is enabled
NTP Client Enabled Enabled or disabled. Allows for switches to synchronize
NTP Server Address The IP address of the centralized NTP server. Ethernet
Use Front Port Use this option to activate the two CPU Ethernet connec-
4-4 59235-02 A
(default) or disabled.
their time to a centralized server.
connection to NTP server is required.
tions on the backplate, or activate the two Maintenance
Panel Ethernet connections on the faceplate (SB9000
Series switches only).
Page 65

L
4 – Managing Switches
Switch Data Window
Table 4-1. Switch Data Window Entries (Continued)
Entry Description
User Login Group
User Name Account name
Login Level Authority level
Super User Super user privileges enabled/disabled
UserAuthentication
Enabled
Firmware Group
Firmware Version Active firmware version
Inactive Firmware Version This field does not apply to this switch
Pending Firmware Version Firmware version that will be activated at the next reset
PROM/Flasher Version PROM firmware version
Services Group
NTP Client Enabled Enabled or disabled. Allows for switches to synchronize
NTP Server Address The IP address of the centralized NTP server. Ethernet
FDMI Enable Fabric Device Management Interface status. If enabled,
Enforcement of account names and authority (always
True)
their time to a centralized server.
connection to NTP server is required.
device information can be obtained, managed, a nd saved
through the fabric using Name Service Management
Server functions. QuickTools will report all FDMI informa-
tion reported by the entry switch, if FDMI is enabled on the
entry switch.
FDMI HBA Entry Limit Maximum number of HBAs that can be registered with a
Embedded GUI Enabled QuickTools web applet status. Enables or disables the
Inactivity Timeout Number of minutes the switch waits before terminating an
GUI Mgmt Enabled Web applet status. If disabled, the switch cannot be man-
Telnet Enabled Telnet client status
59235-02 A 4-5
switch.
web applet on the switch.
idle command line interface session. Zero (0) disables the
time out threshold.
aged using the web applet.
Page 66

4 – Managing Switches
Switch Data Window
SSH Enabled Secure Shell status. If enabled, an encrypted data path is
SSL Enabled Secure Sockets Layer status. If enabled, encryption for
CIM Enabled Common Information Model status. The CIM agent is
FTP Enabled FTP status
L
Table 4-1. Switch Data Window Entries (Continued)
Entry Description
provided for command line interface sessions.
switch management web applet and CIM sessions is pro-
vided.
based on the SNIA Storage Man agement Initiative Speci-
fication (SMI-S), which is the standard for SAN manage-
ment in a heterogeneous environment.
Management Server
Enabled
SNMP Enabled SNMP enabled or disabled.
Call Home Enabled Call Home status. If enabled and configured, switches can
Zones/Security Group
Merge Auto Save If enabled, any zoning updates from the fabric will be
Zoning Default Visibility Zoning visibility status. Permits (All) or prevents (None)
Default Zone Disables communication between ports and devices not
Discard Inactive Automatically removes the previously active zone set
Management server status.
send alerts and events to pagers, Email and QLogic Tech-
nical support. Users can configure the type of events and
where the alerts are sent.
saved in permanent (non-volatile) memory as we ll as te m-
porary memory. If disabled, any zoning updates from the
fabric will be saved only in temporary memory and will be
lost after a switch reset.
communication with other switches in the absence of an
active zone set.
defined in the active zone set, or when there is no active
zone set.
when a zone set is activated on a switch.
Implicit Hard Zoning Introduces hardware enforcement of zoning regardless of
Security Auto Save N/A - does not apply to this switch
4-6 59235-02 A
type. All zones and all supported zone member types will
have hardware enforcement.
Page 67

L
4 – Managing Switches
Switch Data Window
Table 4-1. Switch Data Window Entries (Continued)
Entry Description
Security Fabric Binding
Enable
Advanced Group
R_A_TOV Resource allocation timeout value
E_D_TOV Error detect timeout value
Number of Donor Groups Total num ber of dono r por t gr oups. A donor group is a set
Inactivity Timeout Number of minutes the switch waits before terminating an
In-band Enabled In-band management status. Permits (True) or prevents
Principal Switch If there is a domain ID conflict in the fabric, the switch with
N/A - does not apply to this switch
of ports on a switch that can donate buffer cre dits to each
other.
idle command line interface session. Zero (0) disables the
time out threshold.
(False) a switch from being managed over an ISL.
the highest principal priority, or the principal switch, will
reassign any domain ID conflicts and establish the fabric.
59235-02 A 4-7
Page 68

4 – Managing Switches
Managing User Accounts
4.2
Managing User Accounts
Only the Admin account can manage user accounts with the User Account
Administration dialogs. However, any user can modify their own password. To
open the User Account Administration dialogs, open the Switch menu and select
User Accounts. A user account consists of the following:
Account name or login
Password
Authority level
Expiration date
Switches come from the factory with the following user accounts:
Account Name Password Admin Authority Expiration
L
Table 4-2. Factory User Accounts
admin password true never expires
images images false never expires
The Admin account is the only user that can manage all user accounts with the
User Account Administration dialogs. The Admin account can create, remove, or
modify user accounts, and change account passwords. The Admin account can
also view and modify the switch and its configuration with QuickTools. The Admin
account can not be removed.
Users with Admin authority can view and modify the switch and its configuration
using QuickTools. Users without Admin authority are limited to viewing switch
status and configuration.
The Images account is used to exchange files with the switch using FTP. The
Images account can not be removed.
Note: If the same user account exists on a switch and its RADIUS server,
that user can login with either password, but the authority and account
expiration will always come from the switch database.
4-8 59235-02 A
Page 69

L
4.2.1
Creating User Accounts
To create a user account on a switch, open the Switch menu and select User
Accounts to open the User Account Administration dialog shown in Figure 4-3. A
switch can have a maximum of 15 user accounts.
4 – Managing Switches
Managing User Accounts
Figure 4-3. User Account Administration Dialog – Add Account
1. To open the User Account Administration dialogs, open the Switch menu
and select User Accounts.
2. Click the Add Account tab to open the Add Account tab page.
3. Enter an account name in the New Account Login field. Account names are
limited to 15 characters. The first character must be alphanumeric.
4. If the account is to have the ability to modify switch configurations, select the
Admin Authority Enabled option.
5. Enter a password in the New Password field and enter it again in the Verify
Password field. A password must have a minimum of 8 characters and no
more than 20.
6. If this account is to be permanent with no expiration date, select the
Permanent Account option. Otherwise, click the Account Will Expire
button and enter the number days in which the account will expire.
7. Click the Add Account button to add the newly defined account.
59235-02 A 4-9
Page 70

4 – Managing Switches
Managing User Accounts
4.2.2
Removing a User Account
To remove a user account on a switch, open the Switch menu and select User
Accounts. Click the Remove Account tab in the User Account Administration
dialog to present the display shown in Figure 4-4. Select the account (login) name
from the list of accounts at the top of the dialog and click the Remove Account
button.
L
Figure 4-4. User Account Administration Dialog – Remove Account
4-10 59235-02 A
Page 71

L
4.2.3
Changing a User Account Password
To change the password for an account on a switch, open the Switch menu and
select User Accounts. Click the Change Password tab in the User Account
Administration dialog to present the display shown in Figure 4-5. Select the
account (login) name from the list of accounts at the top of the dialog, then enter
the old password, the new password, and verify the new password in the
corresponding fields. Click the Change Password button. Any user can change
their password for their account, but only the Admin account name can change
the password for another user’s account. If the administrator does not know the
user’s original password, the administrator must remove the account and add the
account.
4 – Managing Switches
Managing User Accounts
Figure 4-5. User Account Administration Dialog – Change Password
59235-02 A 4-11
Page 72

4 – Managing Switches
Managing User Accounts
4.2.4
Modifying a User Account
To modify a user account on a switch, open the Switch menu and select User
Accounts. Click the Modify Account tab in the User Account Administration
dialog to present the display shown in Figure 4-6. Select the account (login) name
from the list of accounts at the top of the dialog. Select the Admin Authority
Enabled option to grant admin authority to the account name. Select an Account
Expiration Date option. If the account is not to be permanent, enter the number of
days until the account expires. Click the Modify Account button to save the
changes. Click the Close button to close the User Account Administration dialog.
L
Figure 4-6. User Account Administration Dialog – Modify Account
4-12 59235-02 A
Page 73

L
4.3
Paging a Switch
You can use the beacon feature to page a switch. The beacon feature causes all
Logged-In LEDs to flash, making it easier to recognize. To page a switch, open
the Switch menu in the faceplate display and select Toggle Beacon. To cancel
the beacon, reselect Toggle Beacon.
4.4
Setting the Date/Time and Enabling NTP Client
The Date/Time dialog enables you to manually set the date, time, and time zone
on a switch, or to enable the NTP Client to synchronize the date and time on the
switch with an NTP server. Enabling the NTP client ensures the consistency of
date and time stamps in alarms and log entries. An Ethernet connection to an NTP
server is required. To set the date and time on a switch, do the following:
1. Open the Switch menu, and select Set Date/Time.
2. Choose one of the following:
Enter the year, month, day, time, and time zone in the Switch
Date/Time dialog, then click OK. The new date and time take effect
immediately.
4 – Managing Switches
Paging a Switch
Select the NTP Client Enabled option to enable the switch to
synchronize its time with an NTP server. Enter the IP address of the
NTP server. Ethernet connection to NTP server is required. Click the
OK button to save the settings.
59235-02 A 4-13
Page 74

4 – Managing Switches
Resetting a Switch
4.5
Resetting a Switch
Resetting a switch reboots the switch using configuration parameters in memory.
Depending on the reset type, a switch reset may or may not include a Power On
Self Test or it may or may not disrupt traffic. Table 4-3 describes the types of
switch resets.
During a hotreset operation, fabric services will be unavailable for a short period
(30-75 seconds depending on switch model). Verify all administrative changes to
the fabric (if any) are complete before performing an Nondisruptive Code Load
and Activation (NDCLA). When upgrading firmware across a fabric using
non-disruptive activation, upgrade one switch at a time and allow 75 seconds
between switches.
L
CAUTION!
Common administrative operations that change the fabric include:
Zoning modifications
Adding, moving or removing devices attached to the switch fabric. This
includes powering up or powering down attached devices.
Adding, moving or removing ISLs or other connections.
After an NDCLA operation is complete, management connections must be
re-initiated:
QuickTools sessions will re-connect automatically
Telnet sessions must be restarted manually.
Applicable Code Versions:
Future switch code releases will be upgraded non-disruptively unless
specifically indicated in its associated release notes
An NDCLA operation to previous switch code releases is not supported.
Type Description
Changes to the fabric may disrupt the NDCLA process.
Table 4-3. Switch Resets
Hot Reset Resets a switch without a Power On Self Test. This reset activates
Reset Resets a switch without a Power On Self Test. This reset activates
4-14 59235-02 A
the pending firmware, but does not disrupt switch traffic. If errors
are detected on a port during a hot reset, the port is reset automatically.
the pending firmware and it is disruptive to switch traffic.
Page 75

L
4 – Managing Switches
Configuring a Switch
Table 4-3. Switch Resets
Type Description
Hard Reset Resets a switch with a Power On Self Test. This reset activates the
pending firmware and it is disruptive to switch traf fic.
NOTE: If performing a Reset or a Hard Reset, the supports files, the firmware
image files that have not been unpacked, and the config uration backup
files that were created on the switch will be deleted.
To reset a switch using QuickTools, do the following:
1. Select the switch to be reset in the fabric tree.
2. Open the Switch menu and select the Reset Switch:
Select Hot Reset to perform a hot reset.
Select Reset to perform a standard reset.
Select Hard Reset to perform a hard reset.
4.6
Configuring a Switch
Switch configuration is divided into three areas: chassis configuration, network
configuration, and SNMP configuration. Chassis configuration specifies
switch-wide Fibre Channel settings. Network configuration specifies IP settings,
remote logging, and the NTP client. SNMP configuration specifies SNMP settings
and traps.
Y ou can configure a switch explicitly or you can use the Configurat ion Wizard. The
Configuration Wizard is a series of dialogs that guide you through the chassis,
network, and SNMP configuration steps on new or replacement switches.
4.6.1
Using the Configuration Wizard
The Configuration Wizard is a series of dialogs you can use to configure the IP
address and other basic parameters on new or replacement switches. Open the
Wizards menu and select Configuration Wizard. Use the Configuration Wizard
to configure a new switch in a fabric.
59235-02 A 4-15
Page 76

4 – Managing Switches
Configuring a Switch
4.6.2
Switch Properties
To open the Switch Properties dialog, choose one of the following:
Open the faceplate display for the switch you be configuring. Open the
Switch menu and select Switch Properties.
Right-click a switch graphic in the faceplate display, and select Switch
Properties from the popup menu.
Use the Switch Properties dialog to change the following switch configuration
parameters:
Domain ID and Domain ID Lock
Syslog
Symbolic Name
Switch Administrative States
Broadcast Support
L
In-band Management
Fabric Device Management Interface
Figure 4-7. Switch Properties Dialog
4-16 59235-02 A
Page 77

L
4.6.2.1
Domain ID and Domain ID Lock
The domain ID is a unique Fibre Channel identifier for the switch. The Fibre
Channel address consists of the domain ID, port ID, and the Arbitrated Loop
Physical Address (ALP A). T he maximum number of switches within a fabric is 239
with each switch having a unique domain ID.
Switches come from the factory with the domain IDs unlocked. This means that if
there is a domain ID conflict in the fabric, the switch with the highest principal
priority, or the principal switch, will reassign any domain ID conflicts and est ablish
the fabric. If you lock the domain ID on a switch and a domain ID conflict occurs,
one of the switches will isolate as a separate fabric and the Logged-In LEDs on
both switches will flash to show the affected ports. Refer to the SANbox 5000
Series Fibre Channel Switch Command Line Interface Guide for information about
the Switch keyword and the Domain ID Lock and Principal Priority parameters.
If you connect a new switch to an existing fabric with its domain ID unlocked, and
a domain conflict occurs, the new switch will isolate as a separate fabric.
However, you can remedy this by resetting the new switch or taking it offline then
back online. The principal switch will reassign the domain ID and the switch will
join the fabric.
4 – Managing Switches
Configuring a Switch
4.6.2.2
Syslog
Note: Domain ID reassignment is not reflected in zoning that is defined by
domain ID and port number pair. You must reconfigure zones that are
affected by domain ID reassignment.
The Syslog (Remote Logging) feature enables saving of the log information to a
remote host that supports the syslog protocol. When enabled, the log entries are
sent to the syslog host at the IP address that you specify in the Logging Host IP
Address field. Log entries are saved in the internal switch log whether this feature
is enabled or not.
To save log information to a remote host, you must edit the syslog.conf file
(located on the remote host) and then restart the syslog daemon. Consult your
operating system documentation for information on how to configure Remote
Logging. The syslog.conf file on the remote host must contain an entry that
specifies the name of the log file in which to save error messages. Add the
following line to the syslog.conf file. A <tab> separates the selector field
(local0.info) and action field which contains the log file path name
(/var/adm/messages/messages.name).
local0.info <tab> /var/adm/messages.name
59235-02 A 4-17
Page 78

4 – Managing Switches
Configuring a Switch
4.6.2.3
Symbolic Name
The symbolic name is a user-defined name of up to 32 characters that identifies
the switch. The symbolic name is used in the displays and data windows to help
identify switches. The illegal characters are the pound sign (#), semi-colon (;), and
comma (,).
4.6.2.4
Switch Administrative States
The switch administrative state determines the operational state of the switch. The
switch administrative state exists in two forms: the configu red administrative st ate
and the current administrative state.
Configured administrative state — the state that is saved in the switch
configuration and is preserved across switch resets. QuickTools always
makes changes to the configured administrative state. The configured
administrative state is displayed in the Switch Properties dialog.
Current administrative state — the state that is applied to the switch for
temporary purposes and is not retained across switch resets. The current
administrative state is set using the Set Switch command.
L
Table 4-4 describes the administrative state values.
Parameter Description
Online The switch is available.
Offline The switch is unavailable.
Diagnostics The switch is in diagnostics mode, is unavailable, and tests can
4.6.2.5
Broadcast Support
Broadcast is supported on the switch and allows for TCP/IP support. Broadcast is
implemented using the proposed standard specified in Multi-Switch Broa dcast fo r
FC-SW-3, T11 Presentation Number T11/02-031v0. Fabric Shortest Path First
(FSPF) is used to set up a fabric spanning tree used in transmission of broadcast
frames. Broadcast frames are retransmitted on all ISLs indicated in the spanning
tree and all online N_Ports and NL_Ports. Broadcast zoning is supported with
zones. The default setting is enabled.
Table 4-4. Switch Administrative States
then be run on all ports of the switch.
4-18 59235-02 A
Page 79

L
4.6.2.6
In-band Management
In-band management is the ability to manage switches across inter-switch links
using QuickTools, SNMP, management server, or the application programming
interface. The switch comes from the factory with in-band management enabled. If
you disable in-band management on a particular switch, you can no longer
communicate with that switch by means other than a direct Ethernet or serial
connection.
4.6.2.7
Fabric Device Management Interface
Fabric Device Management Interface (FDMI) provides a means to gather and
display device information from the fabric, and allows FDMI capable devices to
register certain information with the fabric, if FDMI is enabled. QuickTools will
report any and all FDMI information reported by the entry switch, if FDMI is
enabled on the entry switch. To view FDMI data, FDMI must be enabled on the
entry switch and on all other switches in the fabric which are to report FDMI data.
4 – Managing Switches
Configuring a Switch
FDMI is comprised of the fabric-to-device interface and the application-to-fabric
interface. The fabric-to-device interface enables a device’s management
information to be registered. The application-to-fabric interface provides the
framework by which an application obtains device information from the fabric. Use
the FDMI HBA Entry Limit field on the Switch Properties dialog to configure the
maximum number of HBAs that can be registered with a switch. If the number of
HBAs exceeds the maximum number, the FDMI information for those HBAs can
not be registered.
Use the FDMI Enabled option on the Switch Properties dialog to enable or disable
FDMI. If FDMI is enabled on an HBA, the HBA forwards information about itself to
the switch when the HBA logs into the switch. If FDMI is enabled on a switch, the
switch stores the HBA information in its FDMI database. Disabling FDMI on a
switch clears the FDMI database. If you disable FDMI on a switch, then re-enable
it, you must reset the ports to cause the HBAs to log in again, and thus forward
HBA information to the switch.
To view detailed FDMI information for a device, click the Devices tab, and click
the Information (i) button in the Details column of the Devices data window. The
Detailed Devices Display dialog displays the specific information for that device.
Refer to ”Devices Data Window” on page 3-8 for more information.
59235-02 A 4-19
Page 80

4 – Managing Switches
Configuring a Switch
4.6.3
Advanced Switch Properties
The Advanced Switch Properties dialog, shown in Figure 4-8, enables you to set
the timeout values. The Advanced Switch Properties dialog is available for only
the entry switch. The switch will automatically be taken of fline temporarily and will
be restored to its original state after the changes are completed. To open the
Advanced Switch Properties dialog, open the Switch menu and select Advanced
Switch Properties. After making changes, click the OK button to put the new
values into effect.
L
4.6.3.1
Timeout Values
The switch timeout values determine the timeout values for all ports on the switch.
The timeout values must be the same for all switches in the fabric.
R_A_TOV (Resource Allocation Timeout) — the maximum time a frame
E_D_TOV (Error Detect Timeout) — the maximum round trip time that an
NOTE: Mismatched timeout values will disrupt the fabric. These should not be
Figure 4-8. Advanced Switch Properties Dialog
could be delayed and still be delivered. The default is 10000 milliseconds.
operation between two N_Ports could require. The default is 2000
milliseconds.
changed unless absolutely necessary . Th e switch is temporarily placed
offline to change these values.
4-20 59235-02 A
Page 81

L
4.6.4
Managing System Services
The System Services dialog provides a central location for you to enable or
disable any of the external user services such as Simple Network Management
Protocol (SNMP), embedded web applet, command line interface, Network Time
Protocol (NTP), Common Information Model (CIM), and Call Home. To display the
System Services dialog, open the Switch menu and select Services.
4 – Managing Switches
Configuring a Switch
Figure 4-9. System Services Dialog
Use caution when disabling the Embedded GUI, GUI Mgmt, and Telnet, as it is
possible to disable all access to the switch except through a serial connection.
Embedded GUI (Graphical User Interface) — allows users to point a
browser at the switch and use the QuickTools web applet.
GUI Mgmt — allows out-of-band management of the switch from the switch
management application (GUI). If disabled, the switch can not be specified
as the entry switch for a fabric in the GUI, but can still be managed through
59235-02 A 4-21
an in-band connection.
Page 82

4 – Managing Switches
Configuring a Switch
Telnet (Command line interface) — allows users to manage the switch
SNMP (Simple Network Management Protocol) — allows management of
NTP (Network Time Protocol) — allows the switch to obtain it s time and date
CIM (Common Information Model) — allows management of the switch
FTP (File Transfer Protocol) — allows file transfers to the switch via FTP.
Management Server — allows management of the switch through third-party
L
through a Telnet command line interface session. Disabling T elnet access to
the switch is not recommended.
the switch through third-party applications that use SNMP.
settings from an NTP server. Configuring all of your switches and your
workstations to utilize NTP will keep their date/time settings in sync and will
prevent difficulties with SSL certificates and event logs.
through third-party applications that use CIM.
FTP is required for out-of-band firmware uploads which will complete faster
than in-band Firmware uploads.
applications that use GS-3 Management Server.
Call Home — allows users to configure their switches to send alerts and
events to pagers, Email and QLogic Technical support. Users can configure
the type of events and where the alerts are sent.
4-22 59235-02 A
Page 83

L
4.6.5
Network Properties
Use the Network Properties dialog shown in Figure 4-10 to change IP
configuration parameters. After making changes, click the OK button to put the
new values into effect. To open the Network Properties dialog, choose one of the
following:
Open the faceplate display for the switch you be configuring. Open the
Switch menu and select Network Properties.
Right-click a switch graphic in the faceplate display, and select Network
Properties from the popup menu.
4 – Managing Switches
Configuring a Switch
Figure 4-10. Network Properties Dialog
59235-02 A 4-23
Page 84

4 – Managing Switches
Configuring a Switch
4.6.5.1
IP Configuration
The IP configuration identifies the switch on the Ethernet network and determines
which network discovery method to use. Table 4-5 describes the IP configuration
parameters.
Parameter Description
L
Table 4-5. IP Configuration Parameters
Network
Discovery
IP Address Internet Protocol (IP) address for the Ethernet port. The defa ult value
Subnet mask Subnet mask address for the Ethernet port. The default value is
Choose one of the following methods by which to assign the IP
address:
Static — uses the IP configuration parameters entered in the
Switch Properties dialog.
BootP — acquires the IP configuration from a BootP server. If no
IP address is obtained, the switch reverts to the previously configured IP address.
RARP (Reverse Address Resolution Protocol) — acquires the IP
address from a RARP server. A RARP request is broadcast with
up to three retries, each at 5 second intervals. If no IP address is
obtained, the switch reverts to the previously configured IP
address.
DHCP (Dynamic Host Configuration Protocol) — acquires the IP
configuration from a DHCP server. If no satisfactory lease is
obtained, the DHCP client attempts to use the previously configured lease. If the previous lease cannot be used, no IP address
will be assigned to this switch in order to avoid an IP address
conflict.
is 10.0.0.1.
255.0.0.0.
Gateway IP gateway address. The default value is 10.0.0.254.
4-24 59235-02 A
Page 85

L
4.6.6
SNMP Properties
Use the SNMP Properties dialog shown in Figure 4-11 to change SNMP
configuration parameters. After making changes, click the OK button to put the
new values into effect. To open the SNMP Properties dialog, choose one of the
following:
Open the faceplate display for the switch you be configuring. Open the
Switch menu and select SNMP Properties.
Right-click a switch graphic in the faceplate display, and select SNMP
Properties from the popup menu.
Note: Since the Read Community, Trap Community, and Write Community
4 – Managing Switches
Configuring a Switch
settings are like passwords and are write-only fields, the current
settings are displayed as asterisks.
Figure 4-11. SNMP Properties Dialog
59235-02 A 4-25
Page 86

4 – Managing Switches
Configuring a Switch
4.6.6.1
SNMP Configuration
The SNMP configuration defines how authentication traps are managed.Table 4-6
describes the SNMP configuration parameters. The illegal characters for the
user-defined fields are the pound sign (#), semi-colon (;), and comma (,).
Parameter Description
SNMP Enabled Enables or disables SNMP communication with other switches in the
Contact Specifies the name (up to 64 characters) of the person who is to be
L
Table 4-6. SNMP Configuration Parameters
fabric. If disabled, the user cannot use an SNMP application at a
workstation to talk to the switch that has this setting disabled.
contacted to respond to trap events. The default is “undefined”.
Read Community
Trap Community Trap community password (up to 32 characters) that authorizes an
SNMP Proxy If enabled, you can use SNMP to monitor and configure any switch in
Location S pecifies the na me (up to 64 characters) for the switch location. The
Authentication
Trap
Write Community
Read community password (up to 32 characters) that authorizes an
SNMP agent to read information from the switch. This is a write-only
field. The value on the switch and the SNMP management server
must be the same. The default is “public”.
SNMP agent to receive traps. This is a write-only field. The value on
the switch and the SNMP management server must be the same.
The default is “public”.
the fabric.
default is “undefined”.
Enables or disables the reporting of SNMP authentication failures. If
enabled, a notification trap is sent when incorrect community string
values are used. The default value is "False".
Write community password (up to 32 characters) that authorizes an
SNMP client to write information to the switch. This is a write-only
field. The value on the switch and the SNMP management server
must be the same. The default is “private”.
4-26 59235-02 A
Page 87

L
4.6.6.2
SNMP Trap Configuration
The SNMP trap configuration defines how traps are set. Choose from the tabs
Trap1 – Trap 5 to configure each trap. Table 4-7 describes the SNMP
configuration parameters.
Table 4-7. SNMP Trap Configuration Parameters
Parameter Description
Trap Version Specifies the SNMP version (1 or 2) with which to format traps.
Trap 1 Enabled Enables or disables the trap. If disabled, traps are not sent to trap
monitoring stations and the trap settings are not configurable.
1
Trap Address
Trap Port
1
Specifies the IP address to which SNMP traps are sent. A maxim um
of 5 trap addresses are supported. The default address for trap 1 is
10.0.0.254. The default address for traps 2–5 is 0.0.0.0.
The port number on which the trap is sent. The default is 162.
4 – Managing Switches
Configuring a Switch
Trap Severity Specifies a severity level to assign to the trap. Open the drop-down
list and choose a level. The Trap 1 Enabled option on the SNMP
Properties dialog must be enabled to access this drop-down list.
Trap severity levels include Unknown, Emergency, Alert, Critical,
Error, Warning, Notify, Info, Debug, and Mark
1
Trap address (other than 0.0.0.0) and trap port combinations must be unique. For example, if trap 1 and trap
2 have the same address, then they must have different port values. Similarly, if trap 1 and 2 have the same
port value, they must have different addresses.
59235-02 A 4-27
Page 88

4 – Managing Switches
Archiving a Switch
4.7
Archiving a Switch
You can create an .XML archive file containing the configuration parameters.
Basically any data received by QuickTools is archived. This archive file can be
used to restore the configuration on the same switch or on a replacement switch.
You can also use the archive file as a template for configuring new switches to
add to a fabric. Passwords are not archived. Security Group secrets are not
included in the archive and must be re-configured using the CLI after a restore.
Archived parameters include the following:
Switch properties and statistics
IP configuration
SNMP configuration
Port properties and statistics
Name server
Date/Time and NTP settings
Alarm configuration
L
Zoning configuration
Nicknames configuration
Call Home parameters
User account information (but not restored)
To archive a switch, do the following:
1. Open the Switch menu and select Archive.
2. In the Save dialog, enter a file name.
3. Click the Save button.
4-28 59235-02 A
Page 89

L
4.8
Restoring a Switch
Restoring a switch loads the archived switch configuration parameters to the
switch. The administrative state of the switch must be set to “offline” using the
Switch Properties dialog before an archive can be used in the restore process.
The switch archive must be compatible with the switch to be restored; that is, you
can not restore a SANbox 5000 Series switch with an archive from a SANbox
9000 Series switch. Refer to ”Archiving a Switch” on page 4-28 for more
information.
CAUTION! The switch being restored should be physically disconnected from
To restore a switch, do the following:
4 – Managing Switches
Restoring a Switch
the fabric. Restoring a switch in a fabric can severely disrupt the
fabric. After the restore process is complete, the switch can be
reconnected to the fabric.
1. Log in to the fabric through the switch you want to restore. You cannot
restore a switch over an ISL.
2. Open the Switch menu and select Restore to display the Restore dialog
shown in Figure 4-12. The Restore dialog offers a Full Restore and a
Selective Restore tab.
Figure 4-12. Restore Dialogs – Full and Selective
59235-02 A 4-29
Page 90

4 – Managing Switches
Restoring a Switch
3. Enter the archive file name or browse for the file. This archive file must be
4. To restore all configuration settings, click the Full Restore tab, then click the
5. If you select the Configured Zoning or Full Restore option and the file
L
one that was produced by the QuickTools Archive function. Configuration
backup files created with the Config Backup command are not compatible
with the QuickTools Restore function. The Config Backup command does
not archive the primary or secondary secrets for any security groups.
Restore button. To restore selected configuration settings, click the
Selective Restore tab and select one or more of the following options, then
click the Restore button:
Network Properties — restores all settings presented in the Network
properties dialog except the IP address. Refer to ”Network Properties”
on page 4-23.
IP Address — restores switch IP address in addition to the other
network properties.
Port Properties — restores all settings presented in the Port properties
dialog. Refer to ”Port Symbolic Name” on page 5-12.
Switch Properties — restores all settings presented in the Switch
properties dialog except the domain ID. Refer to ”Switch Properties” on
page 4-16.
Domain ID — restores switch domain ID in addition to the other switch
properties.
Configured Zoning — restores all configured zone sets, zones, and
aliases in the switch’s zoning database excluding the active zone set.
Nicknames — restores the last saved nickname configuration.
Call Home — restores all Call Home configuration and profiles
settings.
contains zone sets, a dialog prompts you to activate one of those zone set s.
Click the Yes button, and select a zone set from the drop-down list in the
Select Zone Set to be Activated dialog.
6. Click the OK button and view the results in the top pane of the Restore
4-30 59235-02 A
dialog.
Page 91

L
4.9
Restoring the Factory Default Configuration
Restoring the Factory Default Configuration
You can restore the switch and port configuration settings to the factory default
values. To restore the factory configuration on a switch, open the Switch menu
and select Restore Factory Defaults. Table 4-8 lists the factory default switch
configuration settings.
Restoring the switch to the factory default configuration does not restore the
account name and password settings. The most current port license will remain in
effect. To restore user accounts, you must select the Reset User Accounts to
Default option in the maintenance menu. Refer to “Recovering a Switch” in the
Installation Guide for your switch for information about maintenance mode and the
maintenance menu.
Table 4-8. Factory Default Configuration Settings
Setting Value
Symbolic Name SANbox
4 – Managing Switches
Administrative State Online
Domain ID 1
Domain ID Lock False
In-band Management True
Broadcast Support Enable
Resource Allocation Timeout (R_A_TOV) 10000 milliseconds
I/O Stream Guard Disabled
Device Scan Enabled True
Error Detect Timeout (E_D_TOV) 2000 milliseconds
SNMP Enabled True
SNMP Proxy True
IP Address 10.0.0.1
FDMI Enabled True
FDMI HBA Entry Level 1000
Subnet Mask Address 255.0.0.0
Gateway Address 10.0.0.254
Network Discovery Static
59235-02 A 4-31
Page 92

4 – Managing Switches
Restoring the Factory Default Configuration
Table 4-8. Factory Default Configuration Settings (Continued)
Setting Value
Remote Logging False
Remote Logging Host Ip Address 10.0.0.254
NTP Client Enabled False
NTP Server IP Address 10.0.0.254
Contact Undefined
Location Undefined
Trap Enabled False
Trap Port 162
Trap Address Trap 1: 10.0.0.254; Traps 2-5: 0.0.0.0
Trap Community Public
L
Read Community Public
Write Community Private
Port State Online
Port Speed Auto-detect
Port Type 1/2/4-Gbps ports = GL
10-Gbps ports = G
Call Home Setup <undefined>
Call Home Profile <undefined>
Default Zone Deny
Merge Auto Save True
Discard Inactive false
4-32 59235-02 A
Page 93

L
4.10
Downloading a Support File
The Download Support File menu option assembles all log files and switch
memory data into a core dump file (dump_support.tgz). This file can be sent to
technical support personnel for troubleshooting switch problems. The menu option
is not accessible (displayed) for switches that don't support the download support
file function.
To create a support file, do the following:
1. Open the Switch menu, and select Download Support File.
2. In the Download Support File dialog, click the Browse button to define a
location for the support file or type the path in the text field.
3. Click the Start button to begin the process of creating and downloading the
support file to your workstation. Observe the status in the Status area.
4. After the support file is saved to your workstation, click the Close button to
close the Download Support File dialog.
4 – Managing Switches
Downloading a Support File
4.11
Installing Firmware
Installing firmware involves loading, unpacking, and activating the firmware image
on the switch. QuickTools does this in one operation. To provide consistent
performance throughout the fabric, ensure that all switches are running the same
version of firmware.
During a hotreset operation, fabric services will be unavailable for a short period
(30-75 seconds depending on switch model). To ensure that an NDCLA operation
is successful, verify that all administrative changes to the fabric (if any) are
complete. When you need to do NDCLA/hotreset to multiple switches, only
perform the NDCLA/hotreset on one switch at a time, and allow a 75 second wait
before performing the NDCLA/hotreset operation on the next switch.
CAUTION!
Common administrative operations that change the fabric include:
Zoning modifications
Adding, moving or removing devices attached to the switch fabric. This
includes powering up or powering down attached devices.
Adding, moving or removing ISLs or other connections.
Changes to the fabric may disrupt the NDCLA process.
After an NDCLA operation is complete, management connections must be
re-initiated:
QuickTools sessions will re-connect automatically
Telnet sessions must be restarted manually.
59235-02 A 4-33
Page 94

4 – Managing Switches
Using Call Home
The applicable code versions are:
Future switch code releases will be upgraded non-disruptively unless
specifically indicated in its associated release notes
An NDCLA operation to previous switch code releases is not supported.
To install firmware, do the following:
1. Open the Switch menu and select Load Firmware.
2. In the Firmware Upload dialog, click the Browse button to browse and select
the firmware file to be uploaded.
3. Click the Start button to begin the firmware load process. You will be shown
a message warning you that the switch will be reset in order to activate the
firmware.
4. QuickTools prompts you to activate the new firmware using a hot
(non-disruptive) reset, if possible. Click the OK button to reset the switch
and activate the new firmware.
4.12
Using Call Home
L
The Call Home feature allows you to configure switches to send alerts and events
to pagers, Email and QLogic Technical support. You can configure the type of
events and where the alerts are sent. Use the Call Home Setup dialog shown in
Figure 4-13 to configure call home parameters. To display the Call Home Setup
dialog, open the Switch menu, select Call Home, and select Setup.
Figure 4-13. Call Home Setup Dialog
4-34 59235-02 A
Page 95

L
4 – Managing Switches
Using Call Home
Table 4-9 lists the entries in the Call Home Setup dialog.
Table 4-9. Call Home Setup Entries
Entry Description
Primary SMTP: (active) The "(active)" indicates the Primary SMTP (Simple Mail
Transfer Protocol) is the SMTP server that CallHome is
going to try to use when transmitting Email messages.
CallHome operates as an SMTP client, or more correctly,
and SMTP sending agent.
After any system configuration, the Primary SMTP server
will always become the active SMTP, provided it is
enabled and has a non-default address defined (0.0.0.0 is
the default).
Primary SMTP Server
Address:
Primary SMTP Server Port: This is the service port number that the primary SMTP
Secondary SMTP: The Secondary SMTP is the second SMTP server. If the
Secondary SMTP Server
Address:
Secondary SMTP Server
Port:
Contact Email Address: The Email address of the point-of-contact for the switch.
Phone Number: The phone number of the point-of-contact for the switch.
This is the IP address of the primary (first) SMTP server.
server is listening on to accept connections from SMTP
sending agents.
primary SMTP is not enabled/defined, or if there was a
failure in communicating with the primary SMTP server,
the Secondary SMTP server will become the (active)
SMTP server - the one used by Call Home for the next
attempt to transmit Email.
The IP address of the secondary (second) SMTP server.
The service port number that the secondary SMTP server
is listening on to accept connection from SMTP sending
agents.
This Email address will be included in the text of Email
messages using the 'FullText' format under the section for
"Contact Information."
This value will be included in the text of Email messages
using the 'FullText' format under the section for "Contact
Information."
Street Address: The address of the point-of-contact for the switch. This
59235-02 A 4-35
value will be included in the text of Email messages using
the 'FullText' format under the section for "Contact Information."
Page 96

4 – Managing Switches
Using Call Home
From Email Address: The Email address that will be provided to the SMTP
L
Table 4-9. Call Home Setup Entries (Continued)
Entry Description
server to indicate the sender of the Email being transmitted. In Emails sent by CallHome, this address will appear
in the message heading as the "From: " address. This
value is required to send Emails. If there are any problems encountered in routing the Email to any of the
intended recipients, the notice of the problem will be sent
to this address. It is an important address for receiving
Email notices concerning problems.
This address is also the default address used when
replies are sent to an Email by a recipient. If the
"Reply-To: " Email address is supplied it will override the
sending of replies to the "From: " Email address by recipients. However, any notifications of Email problems sent
by any SMTP server used to route the message to the
final recipient will always send those notifications to the
"From: " address.
ReplyTo Email Address: The Email address used by mail reading programs to
determine the address that an Email should be addressed
to for a reply to a received message. This value will override the use of the "From: " address as the recipient for a
reply message.
Throttle Duplicates: This boolean setting indicates if duplicate messages
should be suppressed and accumulated. If "True", then
after an Email has been transmitted, CallHome will not
transmit Email for switch events that would result in duplicate Emails during a specified time window (default is 15
seconds). The time window can be only be configured
using the command line interface. During this time window, these duplicate switch events will be accumulated to
keep track of how many have occurred. After the time window has expired, an Email message for the event will be
transmitted that also includes the count of how many
duplicate events were accumulated and the time of the
last received event. If additional switch events are
received that would result in duplicate Email messages
being sent.
4-36 59235-02 A
Page 97

L
4.12.1
Using the Call Home Profile Manager
Use the Call Home Profile Manager dialog shown in Figure 4-14 to manage all
profiles on a switch. You can add new profiles, remove profiles, edit profiles, and
make copies of existing profiles. To display the Call Home Profile Manager dialog,
open the Switch menu, select Call Home, and select Profile Manager. The
Profiles list shows all profiles on the switch. The Email List shows all Email
addresses associated with the selected profile in the Profiles list. The the Apply
Changes to Multiple Switches in Fabric option enables you to propagate all
profiles on the switch to one or more switches in the fabric. Refer to ”Applying All
Profiles on a Switch to Other Switches” on page 4-39 for more information.
4 – Managing Switches
Using Call Home
Figure 4-14. Call Home Profile Manager Dialog
59235-02 A 4-37
Page 98

4 – Managing Switches
Using Call Home
4.12.2
Using the Call Home Profile Editor
Use the Call Home Profile Editor dialog shown in Figure 4-15 when creating a new
profile or editing/copying an existing profile. The Call Home Profile Editor dialog is
displayed after clicking the Add, Edit, or Copy buttons on the Call Home Profile
Manager dialog. Alternatively, you can open the Edit menu, and select Add New
Profile, Edit Profile, or Copy Profile. The name in the title bar changes to reflect
adding a new profile, making a copy of an existing profile, or editing an existing
profile. Enter a name for the profile, select an event level threshold, a format type
for the message text being sent (short/full), enter the size of the message being
sent, enter the subject of the Email, and enter the Email address(es) of the
recipients. Click the Add button to add the Email address(es) to the list. Click the
OK button to save the changes.
You can use the Call Home Profile Editor dialog to make a copy of and rename an
existing profile. In the Call Home Profile Manag er dialog, select a profile in the list
of existing profiles shown in Figure 4-14. To open the Call Home Profile Editor
dialog shown in Figure 4-15, click the Copy button or open the Edit menu and
select Copy Profile. The dialog is pre-populated with all of the information from the
selected profile, except the name. Enter a unique name for the profile copy and
click the OK button to save the new profile.
L
Figure 4-15. Call Home Profile Editor Dialog
4-38 59235-02 A
Page 99

L
4.12.3
Applying All Profiles on a Switch to Other Switches
You can apply all profiles on a switch to one or more switches in a fabric. The Call
Home Profile Multiple Switch Apply dialog shown in Figure 4-16 is displayed after
selecting the Apply Changes to Multiple Switches in Fabric option on the Call
Home Profile Manager dialog shown in Figure 4-14. The Available Switches list
shows all switches in the fabric. Switch names that are greyed-out do not have
current Call Home firmware, and can not receive any profiles. The Selected
Switches list shows the switch names that you selected to receive all profiles from
the switch. In the Available Switches list, select the switches in the fabric to
receive all profiles, and click the double-arrow button to move them to the
Selected Switches list. Click the OK button to start the process. The Results area
indicates success or failure of applying all the profiles on a switch to the switches
you selected.
4 – Managing Switches
Using Call Home
Figure 4-16. Call Home Profile Multiple Switch Apply Dialog
59235-02 A 4-39
Page 100

4 – Managing Switches
Using Call Home
4.12.4
Using the Call Home Message Queue
Use the Call Home Message Queue dialog shown in Figure 4-17 to access the
logged call home statistics. Click the Update Stats button to refresh with the most
recent switch Call Home information. Click the Clear Queue button to clear the
current statistics.
L
Figure 4-17. Call Home Message Queue Dialog
4.12.5
Testing Call Home Profiles
Use the Call Home Test Profile dialog shown in Figure 4-18 to test the Call Home
parameters currently configured. Select one or more profiles in the window, and
click the Test button. To display the Call Home Test Profile dialog, open the
Switch menu, select Call Home, and select Test Profile.
Figure 4-18. Call Home Profile Manager Dialog
4-40 59235-02 A
 Loading...