

Page 1
1
Piccolo2
FIBER-OPTIC OXYGEN METER
USER MANUAL
Page 2

2
Document Version 2.04
Refers to Pyro Oxygen Logger Software version >3.2
The Piccolo2 is manufactured by
Pyro Science GmbH
Hubertusstr. 35
52064 Aachen
Germany
Phone +49 (0)241 5183 2210
Fax +49 (0)241 5183 2299
Email info@pyro-science.com
Internet www.pyro-science.com
Registered: Aachen HRB 17329, Germany
Page 3

3
TABLE OF CONTENT
1 OVERVIEW .............................................................................. 5
2 SAFETY GUIDELINES .............................................................. 6
3 INTRODUCTION TO THE PICCOLO2 ......................................... 8
4 SOFTWARE INSTALLATION .................................................... 9
5 OXYGEN SENSOR TYPES....................................................... 10
5.1 ROBUST PROBE ....................................................................... 10
5.2 DIPPING PROBE ....................................................................... 11
5.3 SENSOR SPOTS ........................................................................ 11
5.4 FLOW-THROUGH CELLS ............................................................ 13
5.5 RESPIRATION VIALS .................................................................. 14
5.6 NANOPROBES ......................................................................... 16
5.7 CONNECTING THE SENSORS AND OPTICAL FIBERS ......................... 18
5.8 CLEANING AND MAINTENANCE OF THE SENSORS........................... 20
6 THE SOFTWARE "PYRO OXYGEN LOGGER" ........................... 22
6.1 MAIN WINDOW ........................................................................ 22
6.2 SETTINGS................................................................................ 30
6.2.1 Basic Settings .................................................................... 31
6.2.2 Advanced Settings ............................................................. 32
6.2.3 Conditions in the Sample ................................................... 33
6.2.4 Options ............................................................................. 34
6.3 RAW DATA WINDOW ................................................................ 36
7 CALIBRATION OF OXYGEN SENSORS .................................... 38
7.1 CALIBRATION .......................................................................... 38
7.1.1 Calibration Mode: Factory .................................................. 39
7.1.2 Calibration Mode: 1-Point .................................................. 40
7.1.3 Calibration Mode: 2-Point .................................................. 42
7.1.4 Calibration Mode: Custom .................................................. 44
7.2 ADVANCED ADJUSTMENTS ......................................................... 45
8 CALIBRATION STANDARDS ................................................... 47
8.1 THE AIR CALIBRATION STANDARD .............................................. 47
Page 4

4
8.1.1 Ambient Air ....................................................................... 49
8.1.2 Water-Vapor Saturated Air ................................................ 49
8.1.3 Air Saturated Water ........................................................... 50
8.2 THE 0% STANDARD .................................................................. 51
8.2.1 Water Mixed with a Strong Reductant ................................ 51
8.2.2 Water Flushed with Nitrogen Gas ....................................... 51
8.2.3 Nitrogen Gas ..................................................................... 52
9 CALIBRATION OF CONTACTLESS SENSORS .......................... 53
9.1 CALIBRATION PROCEDURE ......................................................... 53
9.2 MANUAL BACKGROUND COMPENSATION .................................... 54
10 APPENDIX ............................................................................. 56
10.1 SPECIFICATIONS OF THE PICCOLO2 .............................................. 56
10.2 TROUBLESHOOTING ................................................................. 57
10.3 MEASURING PRINCIPLE ............................................................. 58
10.4 OPERATING SEVERAL PICCOLO2 IN PARALLEL ................................ 60
10.5 DEFINITION OF OXYGEN UNITS ................................................... 61
10.6 TABLE OF OXYGEN SOLUBILITY .................................................. 63
10.7 EXPLANATION OF THE SENSOR CODE .......................................... 65
Page 5
5
1 Overview
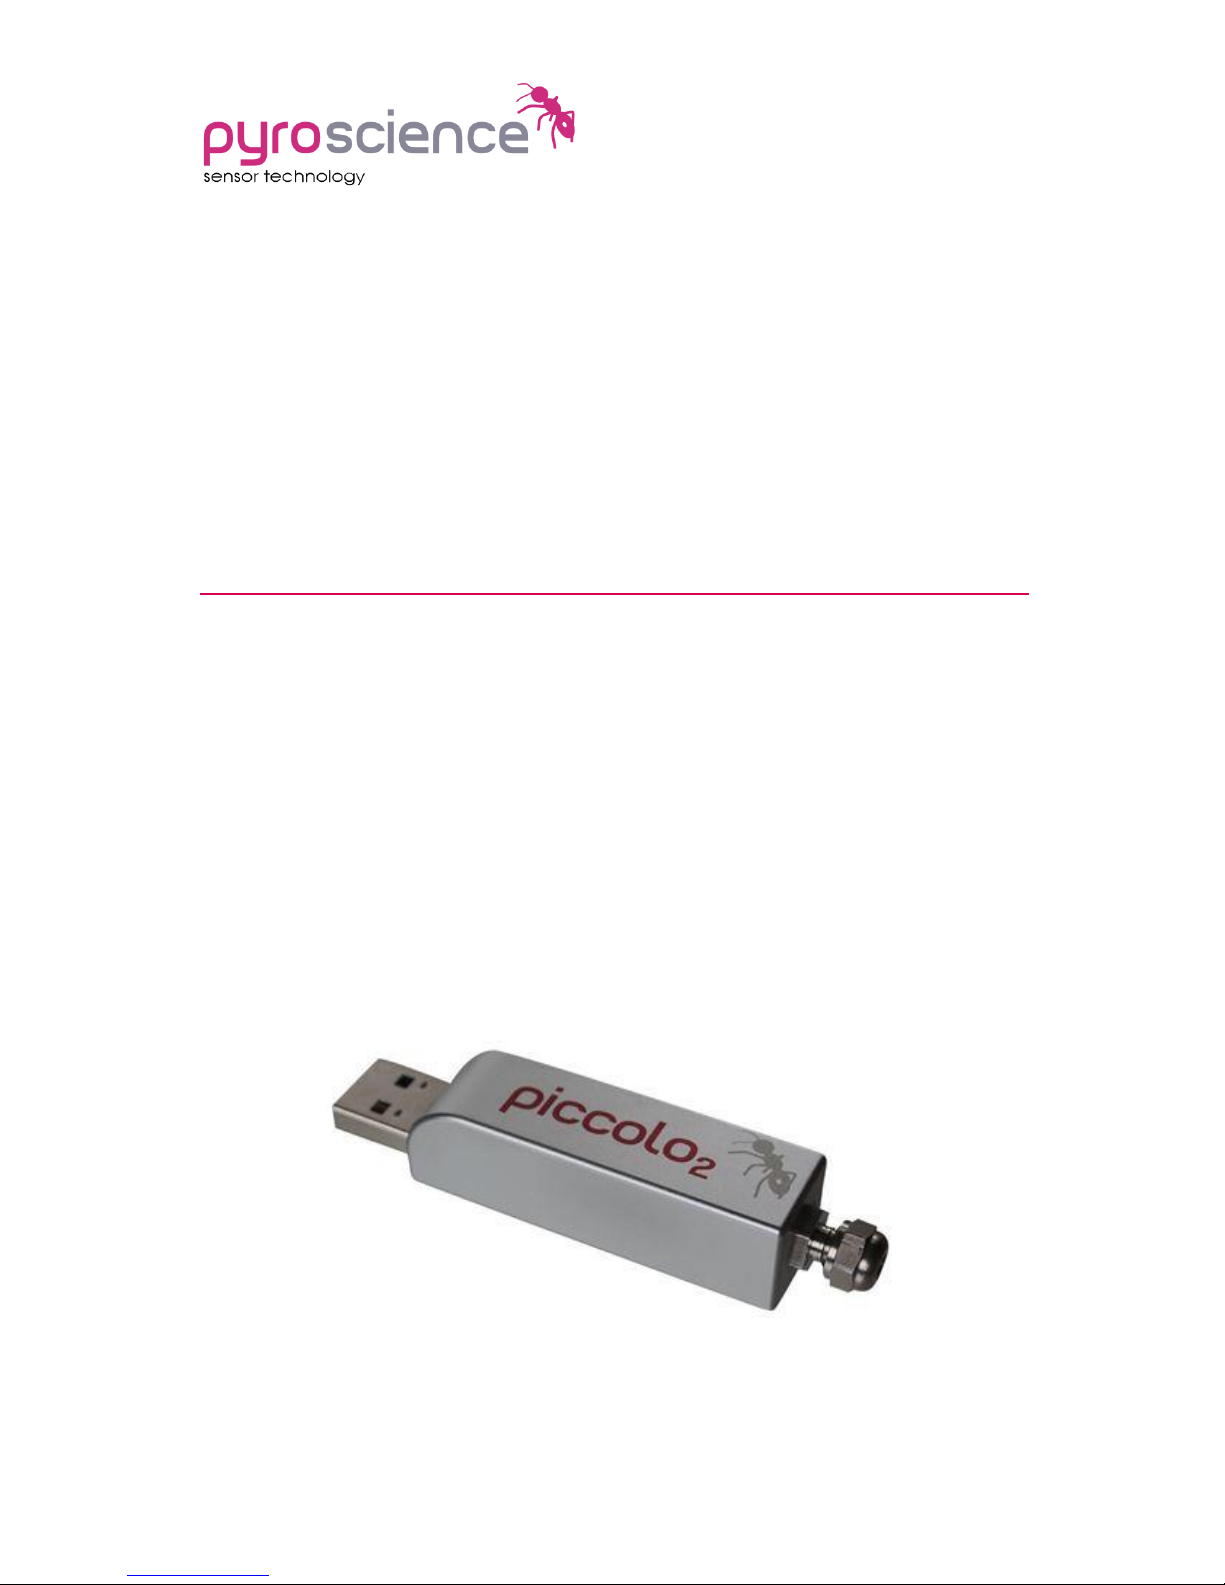
The ultra-compact Piccolo2 is a fiber-optic oxygen meter
integrated in a small USB stick housing. Despite its small size, it
features the proven REDFLASH technology from Pyro Science (see
Appendix 10.3 for more details). The Piccolo2 can be used in
combination with a variety of optical oxygen sensors, like robust
probes, dipping probes or contactless sensors (sensor spots,
respiration vials, flow-through cells, nanoprobes). The optimized
optics of the Piccolo2 enable contactless oxygen measurements up
to a window thickness of 20 mm. The sensors can be used in water
samples (dissolved oxygen, DO), as well as in the gas phase
(gaseous oxygen, O2). Simply plug the Piccolo2 into a USB port of
your Windows PC or Windows tablet, connect the oxygen sensor of
your choice and start measuring with the comfortable logging
software "Pyro Oxygen Logger".
More information concerning our products can be found at
www.pyro-science.com
or contact us under info@pyro-science.com
Your Pyro Science Team
Page 6

6
2 Safety Guidelines
The Piccolo2 is a laboratory instrument to be used at constant
experimental temperatures with optical oxygen sensors (optodes)
from Pyro Science. In order to guarantee an optimal performance
of the Piccolo2, please follow these operation instructions and
safety guidelines.
Please note that opening the housing will void the warranty. There
are no serviceable parts inside the device.
The Piccolo2 and the sensors should be used in the laboratory by
qualified personnel only, following the operation instructions and
safety guidelines of this manual. They should be kept and stored
out of reach of children in a secure place under dry and clean
conditions at room temperature, avoiding moisture, dust,
corrosive conditions and heating of the instrument.
The Piccolo2 and the sensors are not intended for medical, military
or other safety-relevant areas. They must not be used for
applications in humans; not for in vivo examination on humans, not
for human-diagnostic or therapeutic purposes. The sensors must
not be brought in direct contact with foods intended for
consumption by humans.
Please follow the appropriate laws and guidelines for safety like
EEC directives for protective labor legislation, national protective
labor legislation, safety regulations for accident prevention and
safety data-sheets from manufacturers of chemicals used during
the measurements.
When used in the field, extreme environmental conditions (like
high humidity, dust, and exposure to (salt) water or intense solar
radiation) can cause damage to the Piccolo2.
Page 7

7
Before using the Piccolo2 and the sensors, carefully read the
instructions and user manuals.
In case of problems or damage, disconnect the instrument and
mark it to prevent any further use! Consult Pyro Science for
advice! There are no serviceable parts inside the device. Please
note that opening the housing will void the warranty!
The Piccolo2 is not watertight, is sensitive to corrosive
conditions and to changes in temperature causing
condensation. Avoid temperatures above 50°C (122°F) or below
0°C (32°F). Avoid any elevated humidity causing condensing
conditions.
Handle the sensors with care, especially after removal of the
protective cap! Prevent mechanical stress to the fragile sensing
tip! Avoid strong bending of the fiber cable!
Calibration and application of the sensors are on the user’s
authority, as well as data acquisition, treatment and
publication!
The sensors and the oxygen meter Piccolo2 are not intended for
medical, diagnostic, therapeutic, or military purposes or any
other safety-critical applications. The sensors must not be used
for applications in humans and must not be brought in direct
contact with foods intended for consumption by humans.
The sensors should be used in the laboratory by qualified
personnel only, following the user instructions and the safety
guidelines of the manual, as well as the appropriate laws and
guidelines for safety in the laboratory!
Keep the sensors and the oxygen meter Piccolo2 out of reach of
children!
Page 8
8
3 Introduction to the Piccolo2
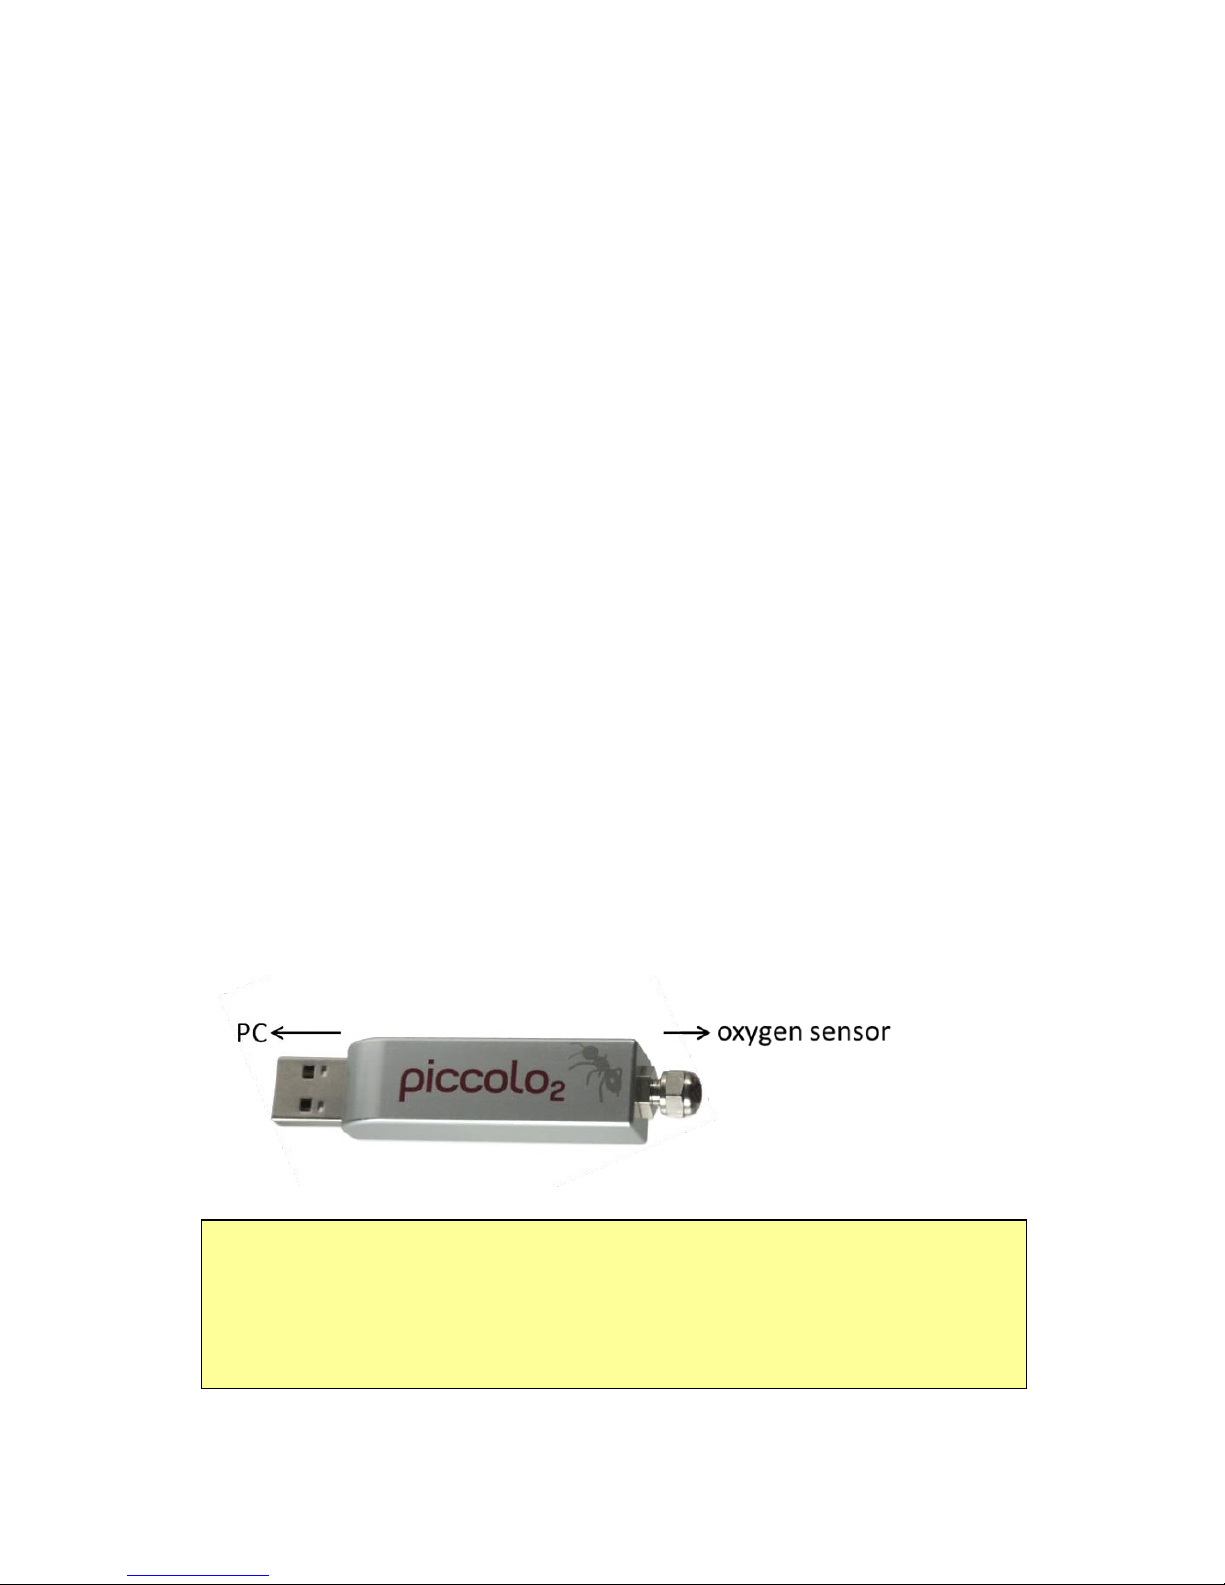
The Piccolo2 is a miniature USB-driven fiber-optic oxygen meter
for usage in the laboratory. It is compatible to a variety of oxygen
sensors from Pyro Science, like robust probes, dipping probes and
contactless sensors, including sensor spots, respiration vials, flowthrough cells and nanoprobes.
These sensors are available in versions for the full range (050% O2, max. range 0-100% O2), and selected sensor types are
additionally available for the trace range (0-10% O2). The Piccolo2
utilizes a measuring principle based on red light excitation and
lifetime detection in the near infrared using the proven REDFLASH
indicators (REDFLASH technology, see Appendix 10.3 for more
details).
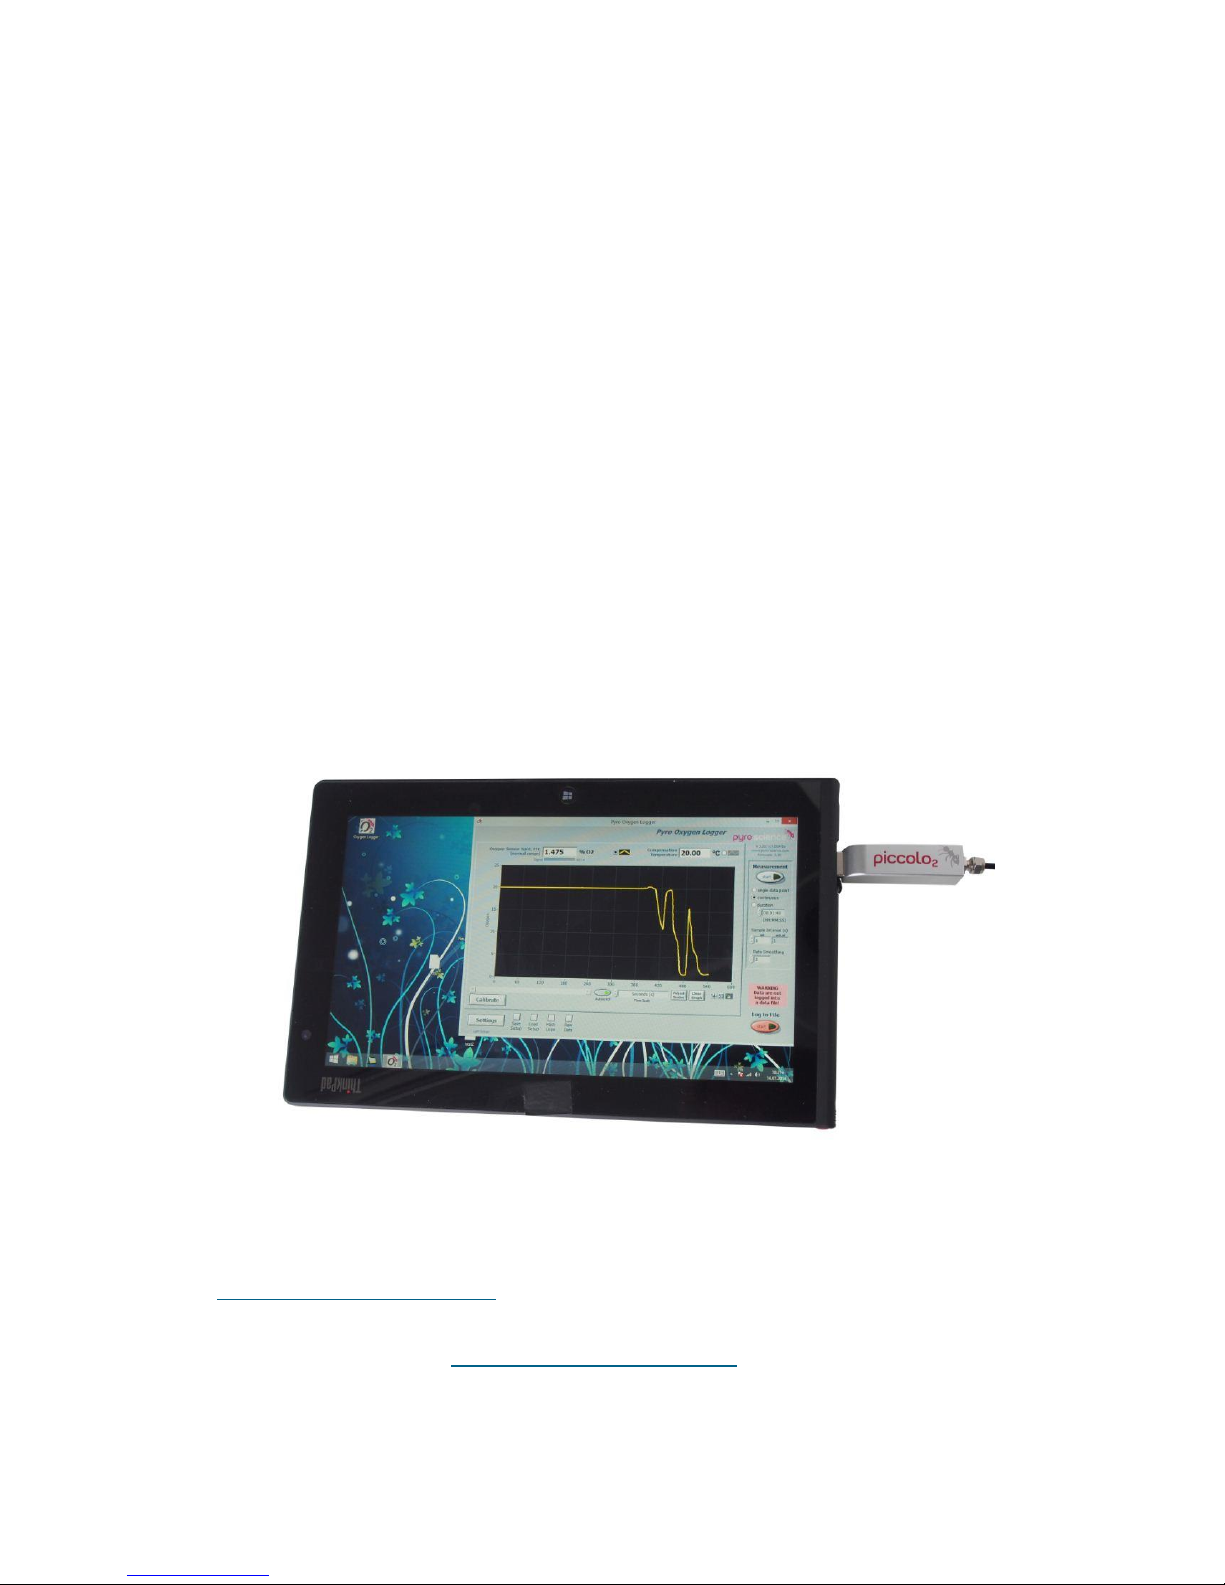
The Piccolo2 can be connected directly to a Windows PC with the
USB plug, providing energy supply and data exchange with the PC.
If a greater distance between the PC and the Piccolo2 is needed,
the delivered USB extension cable can be used.
Comfortable calibration and logging functions are provided by the
logging software Pyro Oxygen Logger, available as free download.
IMPORTANT: The Piccolo2 is intended for oxygen measurements
at constant and defined temperatures! Do not submerse the
housing of the Piccolo2 into liquid samples! This destroys the
device. Protect the Piccolo2 against water spray!
Page 9

9
4 Software Installation
IMPORTANT: Do not connect the Piccolo2 to your PC before the
Pyro Oxygen Logger software has been installed. The software will
install the appropriate USB-drivers automatically.
System requirements:
PC or tablet with Windows XP / Vista / 7 / 8 / 10 (but not
Windows RT) and min. 200 MB free disk space
Installation steps:
• download the installer package for the newest version of the Pyro
Oxygen Logger software from the Pyro Science homepage:
www.pyro-science.com/downloads.html
• unzip, then start the installer and follow the instructions
• connect the Piccolo2 to a free USB port of the computer
After successful installation, a new program group "Pyro Oxygen
Logger" is added to the start menu, and a shortcut named "Oxygen
Logger" can be found on the desktop.
Page 10
10
5 Oxygen Sensor Types
For the Piccolo2 meter, Pyro Science offers a range of optical
oxygen probes and contactless oxygen sensors, comprising sensor
spots, flow-through cells, respiration vials and nanoprobes. For an
overview of all available oxygen sensor types, please visit the Pyro
Science website.
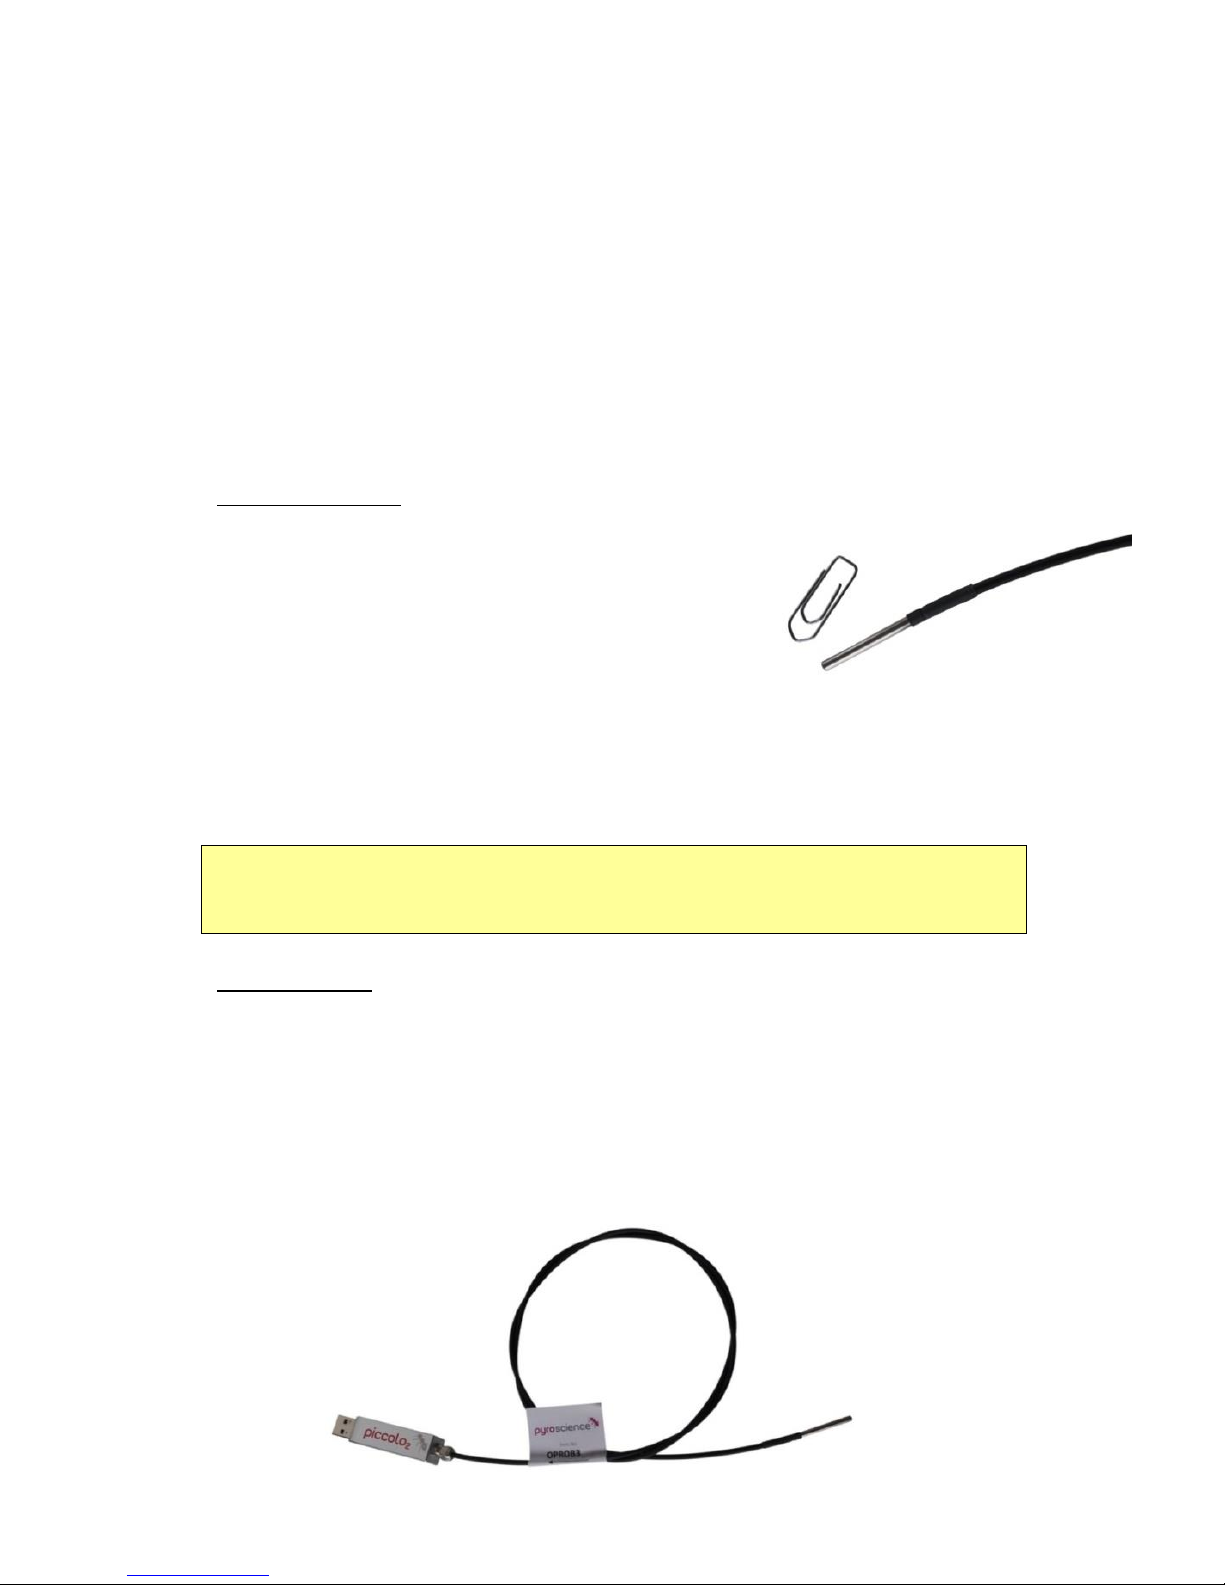
5.1 Robust Probe
Characteristics: robust probe for Piccolo2 (item no. OPROB3) with
stainless steel tubing 3 mm in diameter and
30 mm in length
oxygen sensor with optical isolation located
in the 3 mm disc at the tip of the tubing
(sensor end, see chapter 5.7)
fiber cable 3 mm in diameter and 1 m in
length
Note: The fiber cable needs to be handled with care, as strong
bending can lead to breakage and damage of the robust probe.
Applications:
standard laboratory applications in gases and liquids
for aqueous liquids: permanent stirring is recommended, as
diffusion limitation of oxygen towards the 3 mm tip has a
measurable effect on the response time in liquid samples (this
diffusion limitation is negligible in gas samples)
Page 11
11
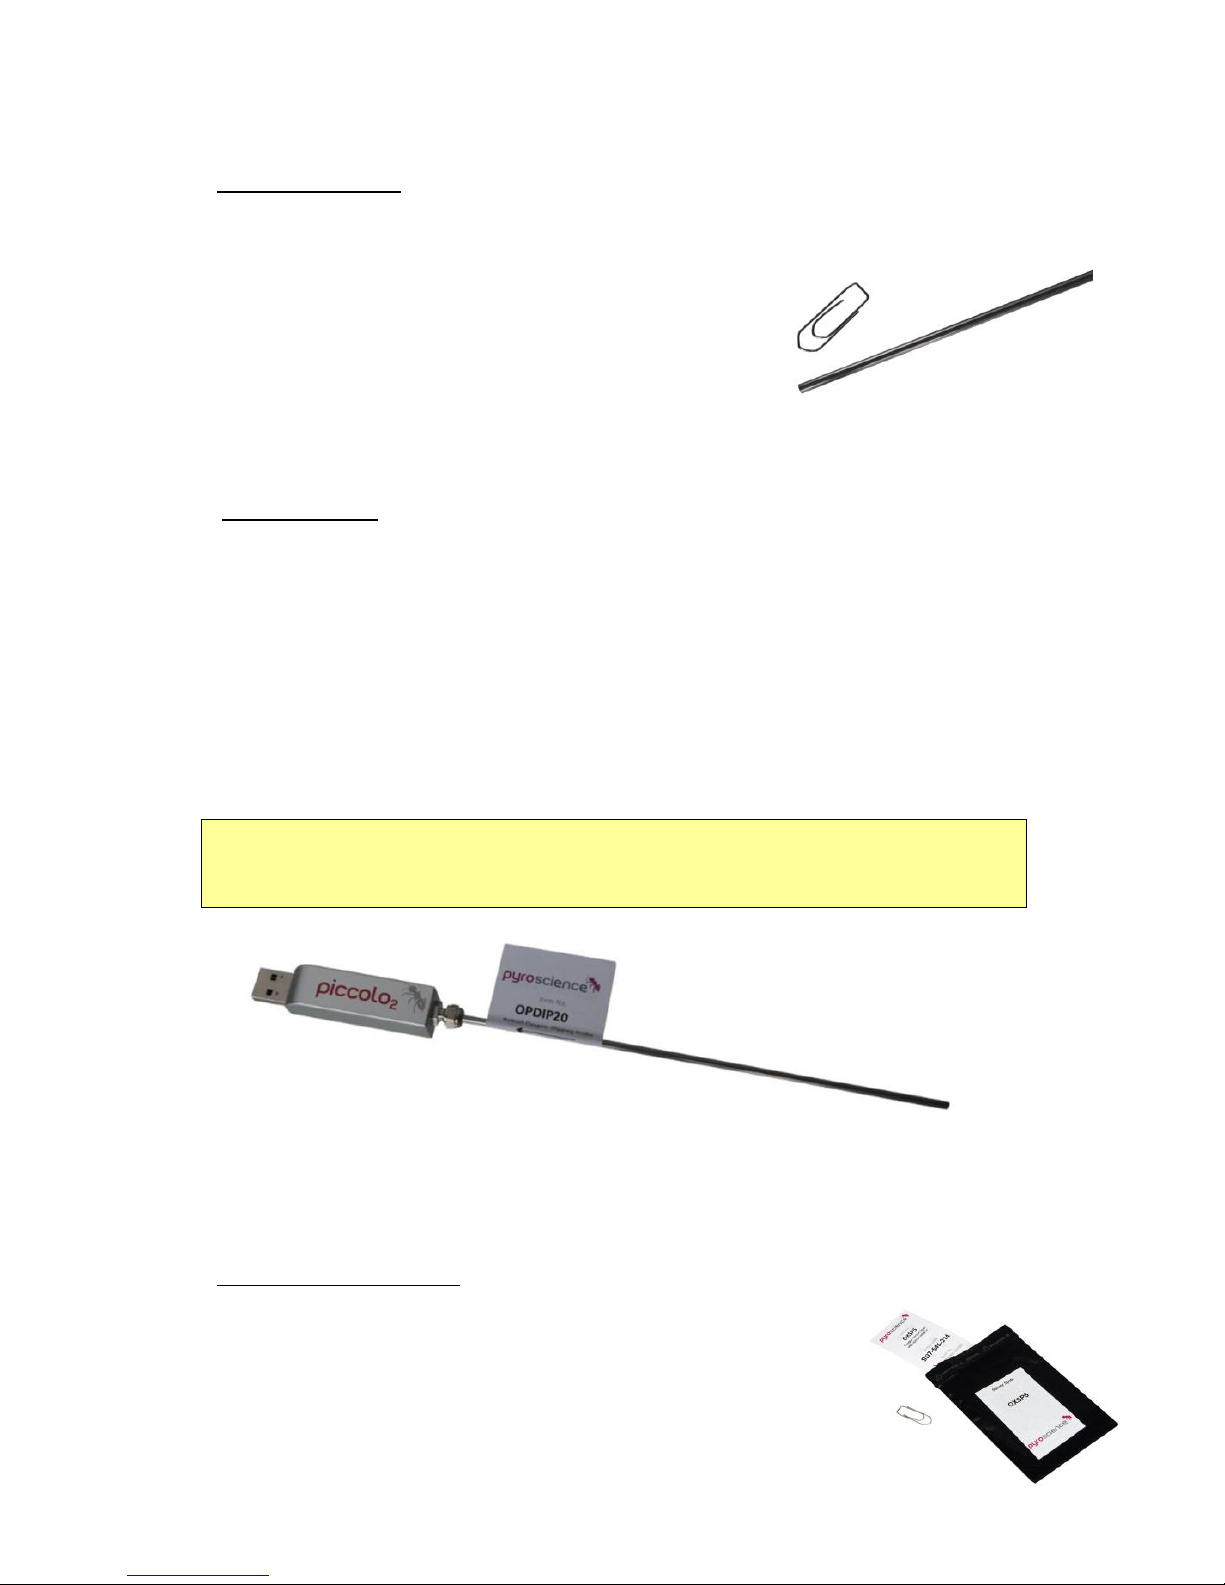
5.2 Dipping Probe
Characteristics: dipping probe for Piccolo2 (item no. OPDIP20)
with
stainless steel tubing 3 mm in diameter and
200 mm in length
oxygen sensor with optical isolation located
in the 3 mm disc at the tip of the tubing
(sensor end, see chapter 5.7)
Applications:
standard laboratory applications in gases and liquids
full probe length can be dipped into the sample
in aqueous liquids: permanent stirring is recommended, as
diffusion limitation of oxygen towards the 3 mm tip has a
measurable effect on the response time in liquid samples (this
diffusion limitation is negligible in gas samples)
Important: No part of the Piccolo2 device itself must be
submersed into liquid samples!
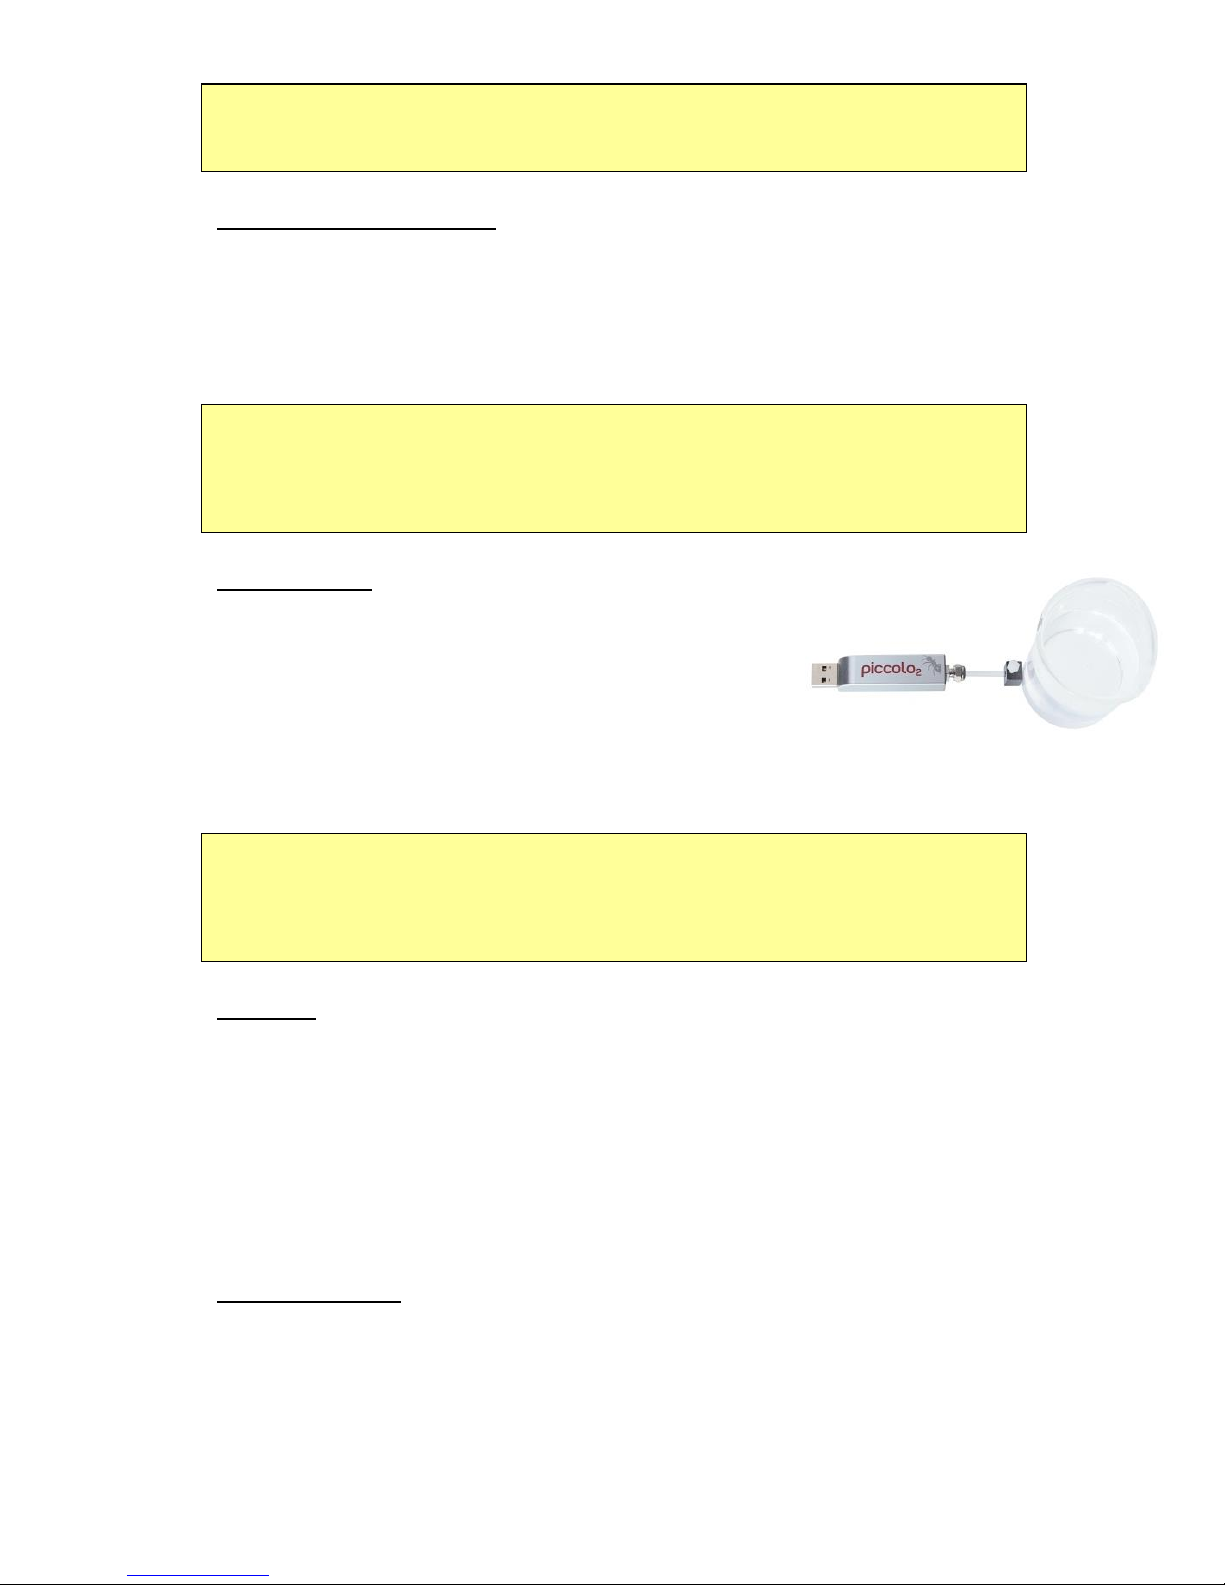
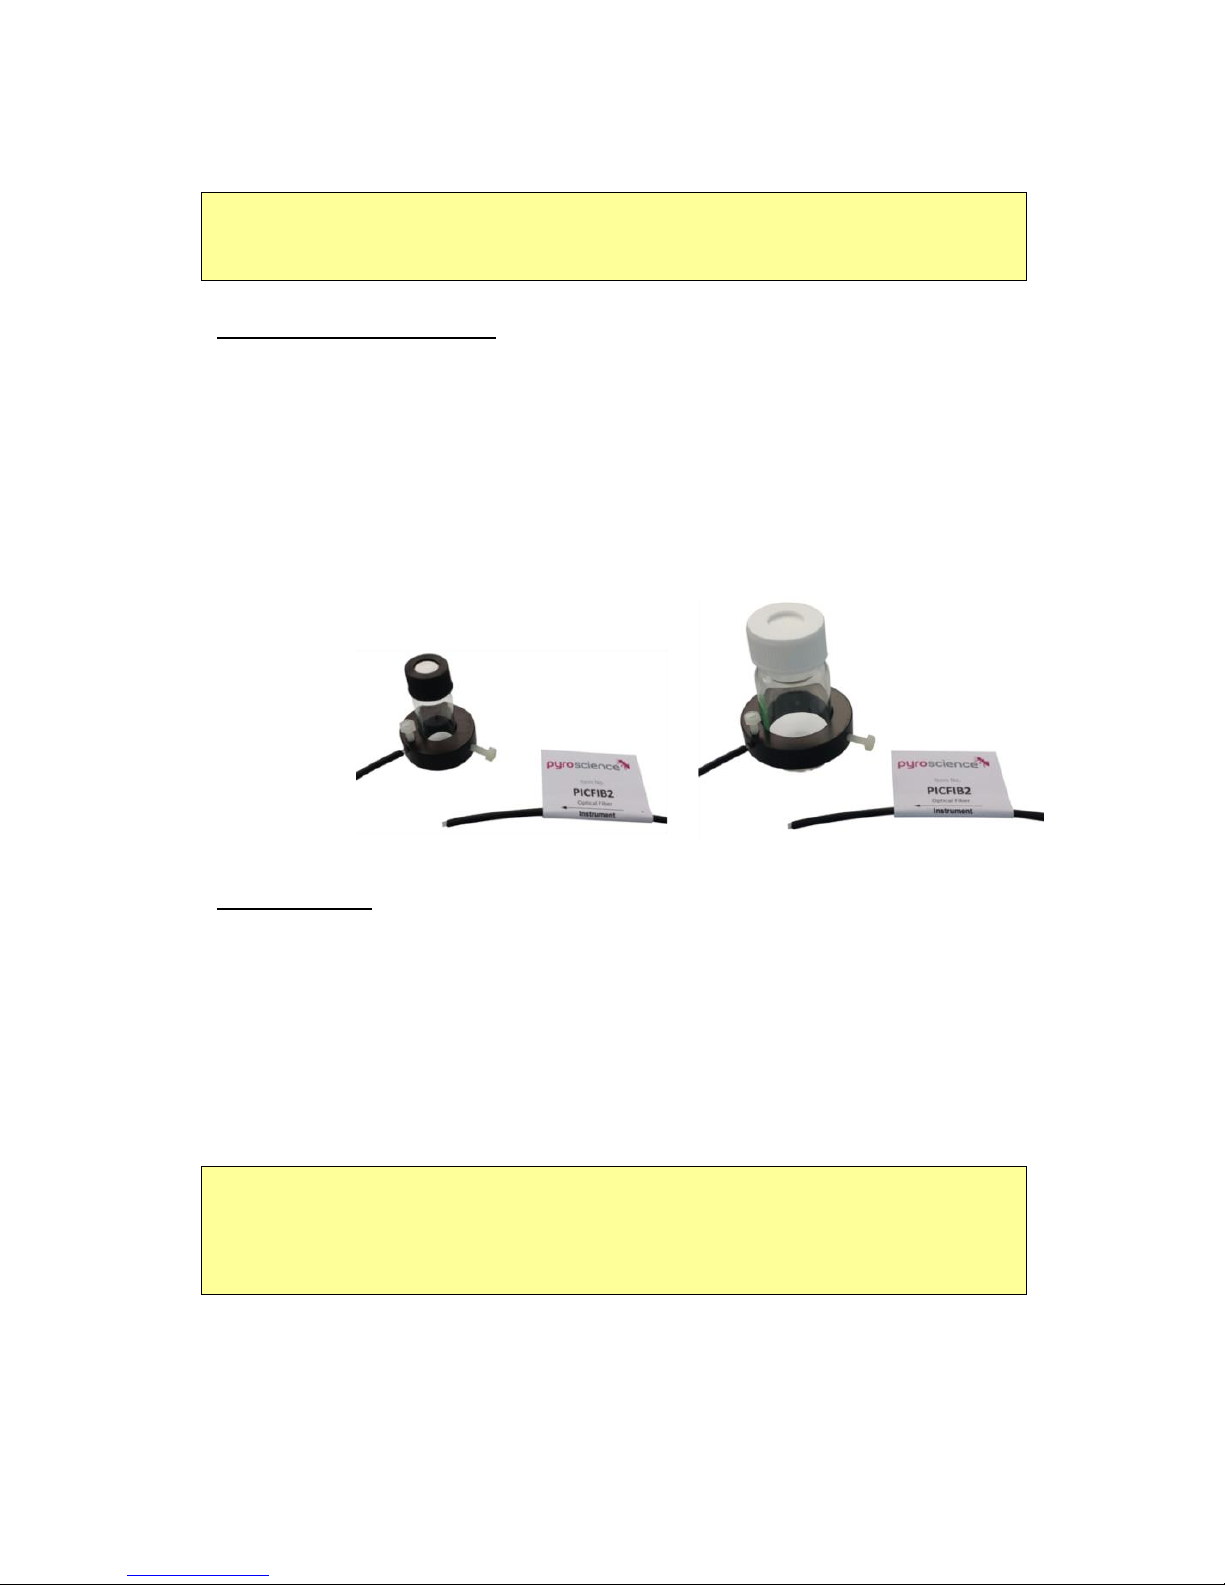
5.3 Sensor Spots
Measuring principle: oxygen sensor spots (item no. OXSP5)
oxygen measurements with contactless read-out
through transparent container walls
Page 12
12
sensor spot with REDFLASH indicator needs to
be glued to the inner container wall
excitation and detection of oxygen indicator
luminescence emission through the
transparent container wall with an optical fiber
fixed at the outer container wall
Characteristics:
PET foil coated with REDFLASH indicator and optical isolation
standard diameter of 5 mm
to be glued with the green back side on transparent, clean and dry
inner container walls (e.g. glass or acrylic glass)
black sensing surface has to be covered completely by the gaseous
or aqueous sample
can be autoclaved few cycles at 121°C for 15 min (requires
calibration afterwards)
Accessories for readout: 0-10 mm thick transparent windows
basic spot adapter SPADBAS: 12 mm in diameter, needs to be
fixed tightly or glued to the outer container wall at the spot
position
optical fiber PICFIB2: black fiber cable, 3 mm in
diameter, 1 m in length, connecting the basic
spot adapter SPADBAS with the Piccolo2 meter
(see also chapter 5.7) or, alternatively,
optical fiber rod PICROD2: stainless steel tubing, 3 mm diameter,
40 mm length, connecting the basic spot adapter SPADBAS with
the Piccolo2 meter (see also chapter 5.7)
transparent silicone glue SPGLUE: based on acetic acid, for gluing
sensor spots and basic spot adapters to the container wall
The PICFIB2 and PICROD2 are also compatible with the flowthrough cells and respiration vials from Pyro Science.
Page 13
13
Note: A change of position of the spot adapter after calibration of
the sensor spot might require a new calibration.
Accessories for readout: 10-20 mm thick transparent windows
optical fiber rod PICROD3: ca. 50 mm in length, needs a
customized fixation on the outer container wall (not compatible
with the spot adapter SPADBAS)
The optical fiber rod PICROD3 is not compatible with the basic
spot adapter SPADBAS. The user has to build a custom fixation at
the wall of the sample container.
Applications:
multi-sampling measurements
measurements of oxygen at greater scales
measurements in closed sample containers,
e.g. in respiration chambers, bioreactors, cell
biological approaches and industrial process water-monitoring
CAUTION: Oxygen measurements in air-tight containers or setups
require special precautions, like constant conditions during
measurements. More details on request.
Options:
trace range version (item no. TROXSP5): for measurements close
to 0% O2 (range: 0-10% O2)
5.4 Flow-Through Cells
Characteristics: flow-through cells (item no. OXFTC, OXFTC2)
flow-through cells with integrated oxygen sensor
available as small version OXFTC and as large version OXFTC2
Page 14
14
equipped with Luer lock connectors on both tubing ends
included Luer lock adapters allow connection of gas-
tight tubings (e.g. stainless steel, ISO-VERSINIC®) with
about 1.0-2.0 mm inner diameter to the OXFTC and
about 3.0-4.0 mm to the OXFTC2
Accessories for readout:
optical fiber PICFIB2: black fiber cable, 3 mm in diameter, 1 m in
length, connecting the flow-through cell with the Piccolo2 meter
(see also chapter 5.7)
Applications:
contactless measurement of oxygen in a
gaseous or liquid sample pumped through
the cell
CAUTION: For liquids, a flow rate of ca. 10-100 mL/min for the
OXFTC and of 20-500 mL/min for the OXFTC2 is recommended!
Lower flow rates are in principle possible; however the user has to
ensure sufficient gas tightness of the connecting tubing.
Options:
trace range version (item no. TROXFTC): for measurements close
to 0% O2 (range: 0-10% O2)
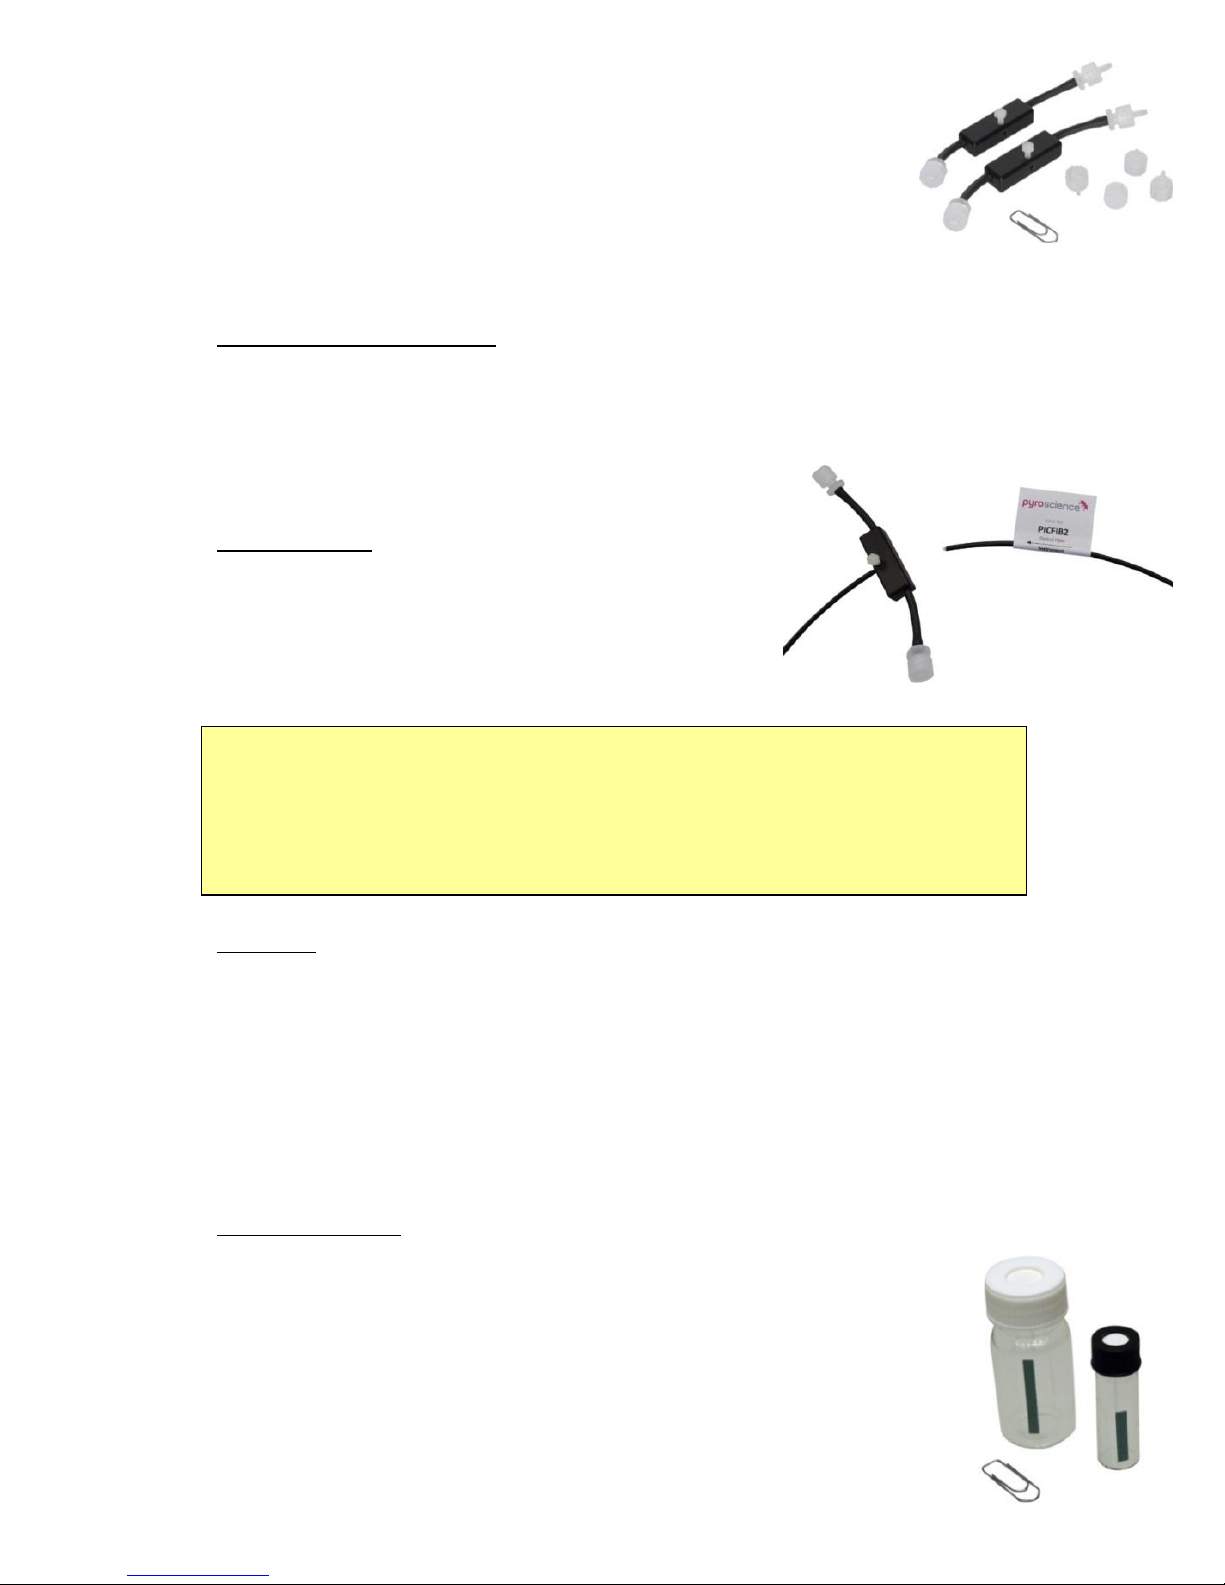
5.5 Respiration Vials
Characteristics: respiration vials (item no. OXVIAL4, OXVIAL20)
ready assembled respiration vials with integrated stripe of the
oxygen sensitive REDFLASH indicator with optical isolation
available with a (uncalibrated) volume of ca. 4 mL (OXVIAL4)
or ca. 20 mL (OXVIAL20)
Page 15
15
elongated shape of the integrated sensor allows
oxygen measurements at different heights within the vial
Note: A change of position of the adapter ring after sensor
calibration might require new calibration.
Accessories for readout:
adapter rings ADVIAL4 / ADVIAL20: for easy fixation of the optical
fiber PICFIB2 to OXVIAL4 / OXVIAL20
optical fiber PICFIB2: black fiber cable, 3 mm in diameter, 1 m in
length, can be fixed in the adapter ring with the clamping screw,
connecting the respiration vial with the Piccolo2 meter (see also
chapter 5.7)
Applications:
for oxygen measurements in e.g. stirred aqueous liquids or
gaseous sample
small-scale respirometry and metabolic rate measurements of e.g.
cell cultures, eggs, larvae, small crustaceans, small fish, water-,
plant-, algal-samples etc.
CAUTION: Oxygen measurements in air-tight vials require special
precautions, like e.g. constant temperature. More details on
request.
Page 16
16
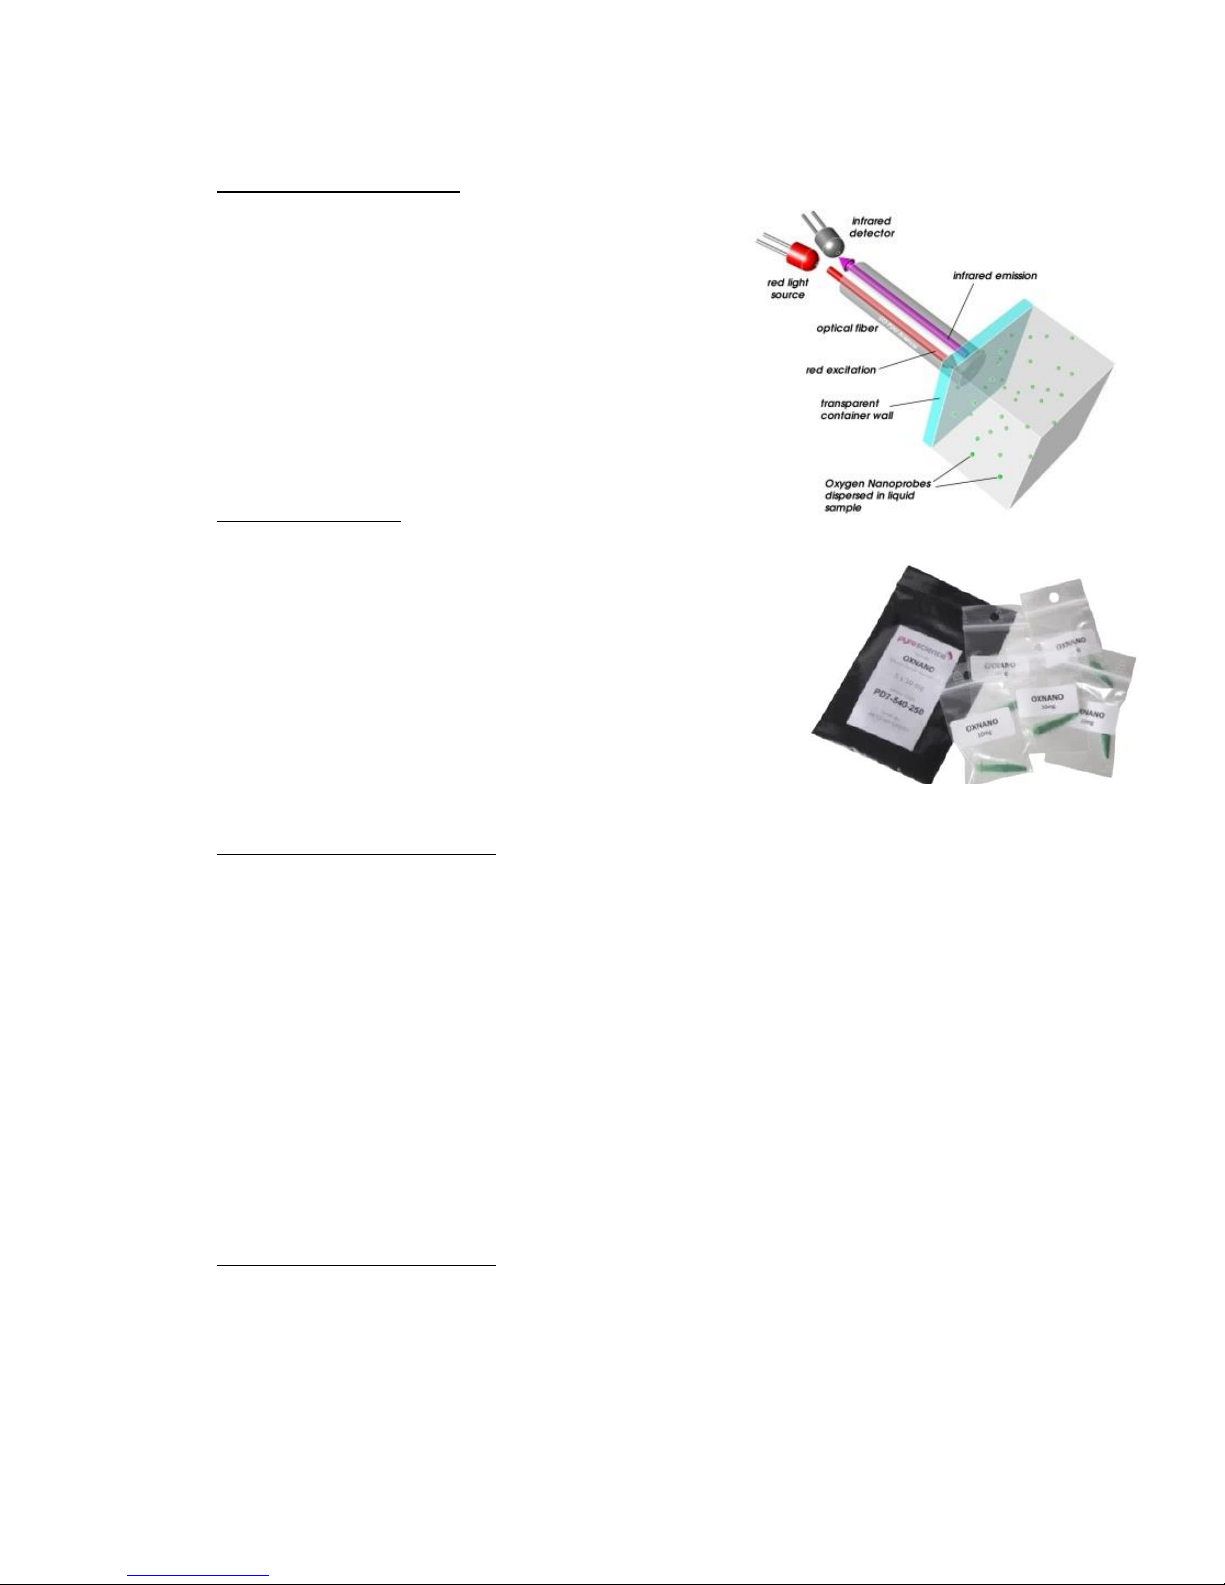
5.6 Nanoprobes
Measuring principle: oxygen nanoprobes (item no. OXNANO)
nanoparticles coated with oxygen-
sensitive REDFLASH indicator
dispersible in aqueous solutions, like e.g.
water, culture media
contactless readout from outside through
transparent windows
Characteristics:
oxygen nanoprobes OXNANO in 5 x 10 mg units
dispersible in aqueous solutions
ultra-fast response times
simple batch calibration
measurements at different positions or in
different vials containing the same dispersion
Accessories for readout: vials, microwell plates
basic spot adapter SPADBAS: 12 mm in diameter, needs to be
fixed tightly or glued to the outer container wall
optical fiber PICFIB2: black fiber cable, 3 mm in diameter, 1 m in
length, connecting the basic spot adapter with the Piccolo2 meter
(see also chapter 5.7) or, alternatively,
optical fiber rod PICROD2: stainless steel tubing, 3 mm in
diameter, 40 mm in length, connecting the basic spot adapter with
the Piccolo2 meter (see also chapter 5.7)
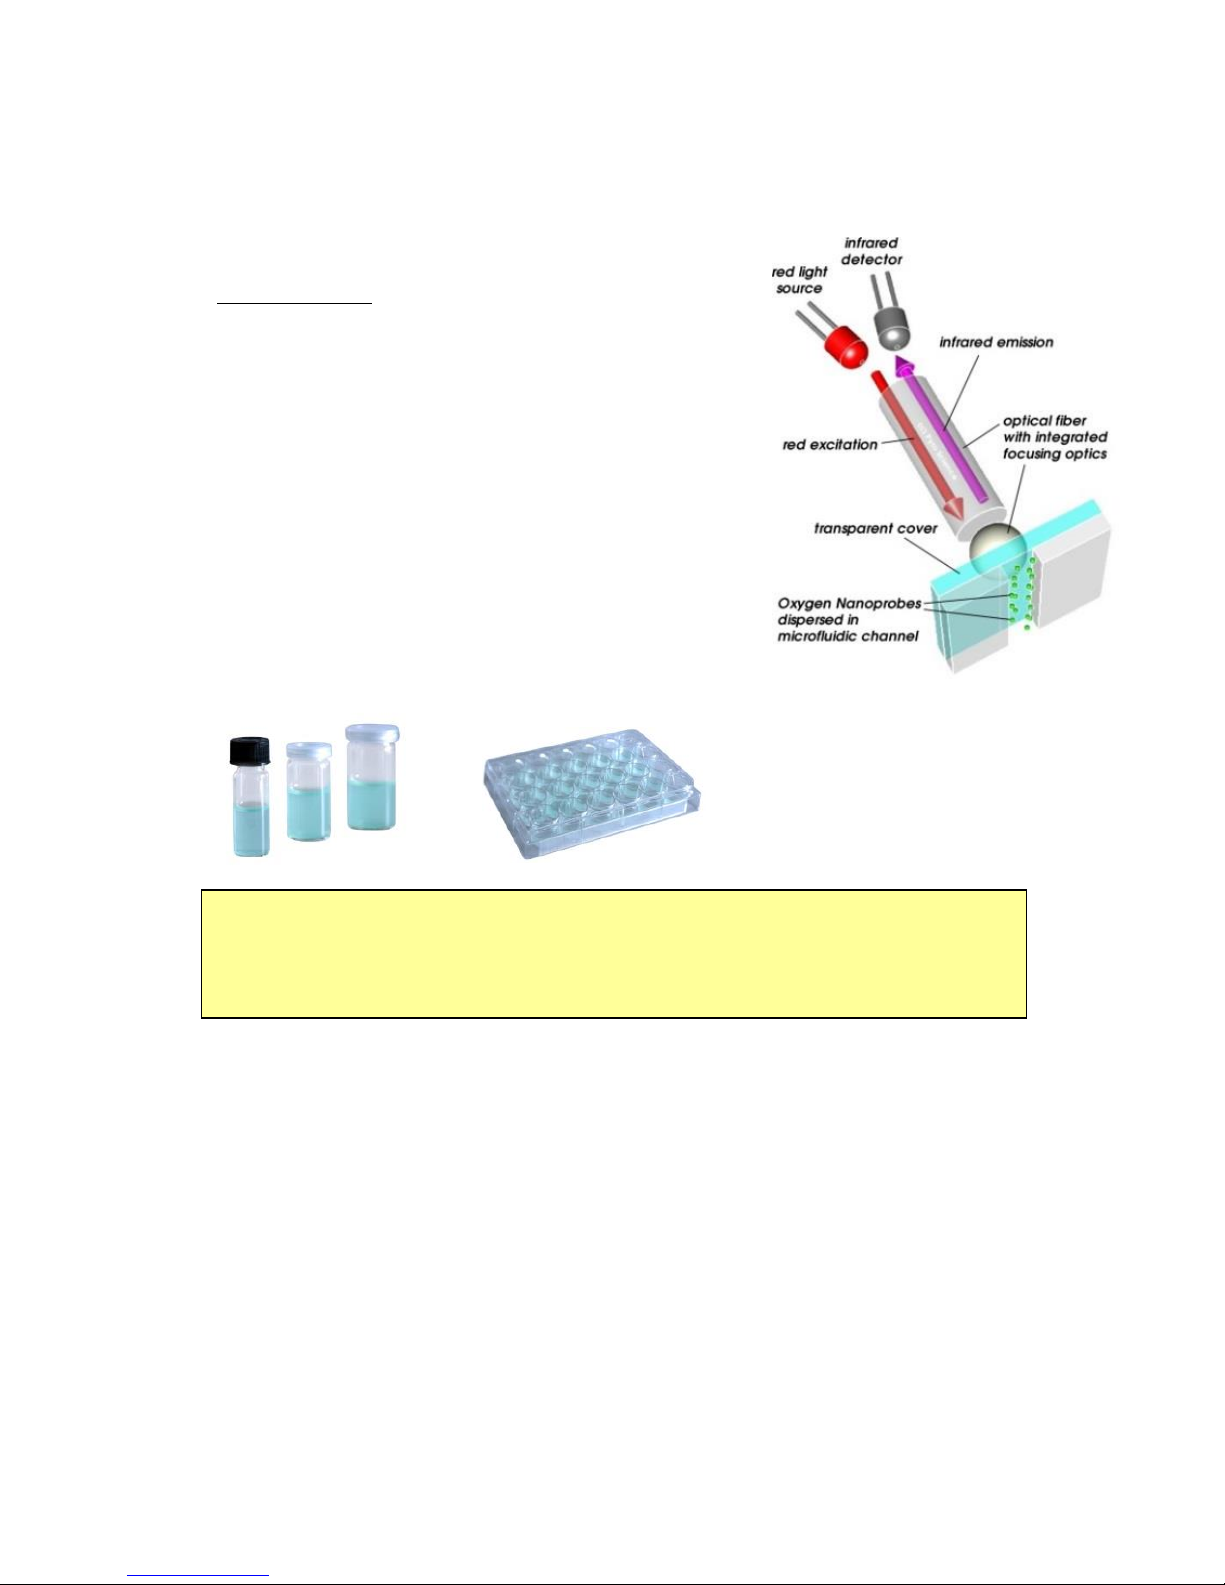
Accessories for readout: microfluidic applications
optical fiber with integrated focusing lens PICFIB2-LNS: black fiber
cable, 1 m in length, stainless steel tip 3 mm in diameter,
connecting the basic spot adapter or custom fixation with the
Piccolo2 meter (see also chapter 5.7) or, alternatively,
Page 17
17
optical fiber rod with integrated focusing lens PICROD2-LNS:
stainless steel tubing, 3 mm in diameter, 40 mm in length,
connecting the basic spot adapter or custom fixation with the
Piccolo2 meter (see also chapter 5.7)
Applications:
real-time monitoring
high through-put screening in e.g. microwell
plates
contactless measurements of fast processes,
like enzymatic reactions
in microfluidic devices (microfluidic chip,
lab-on-a-chip device)
more details on request
CAUTION: Oxygen measurements in closed vials require special
precautions, like constant conditions during measurements. More
details on request.
Page 18
18
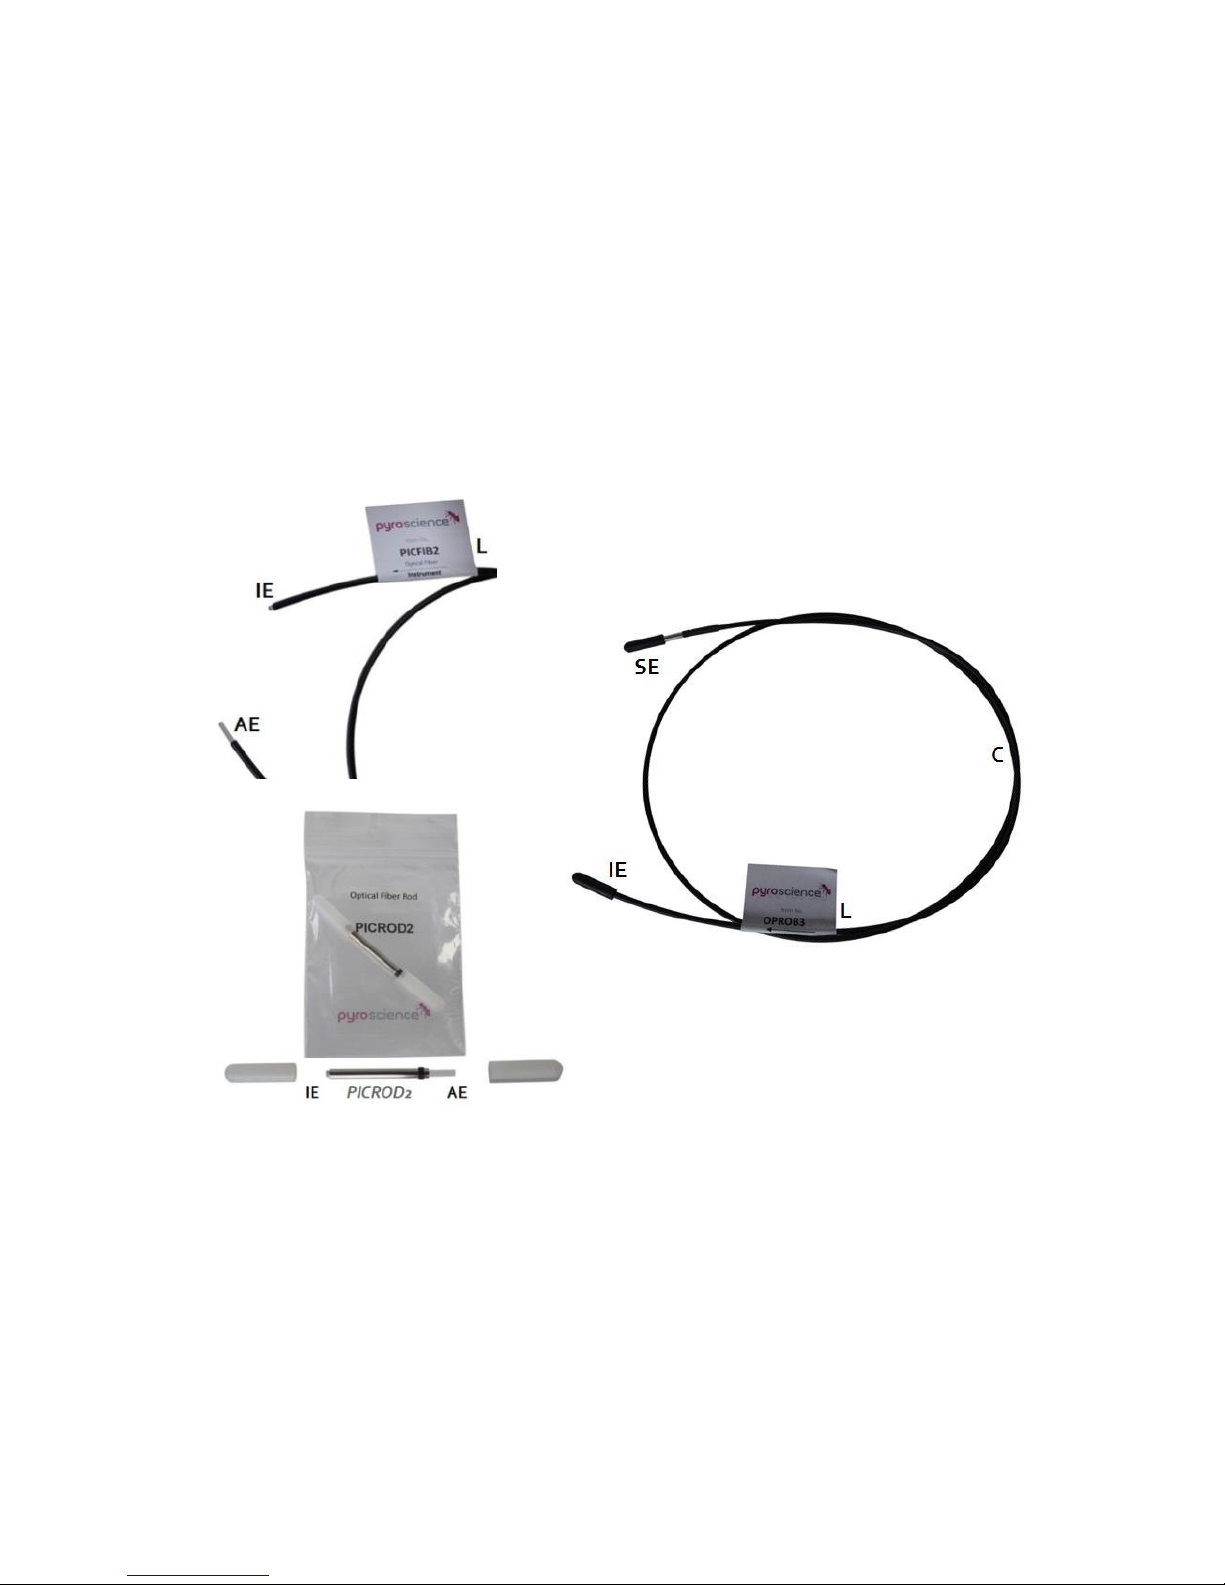
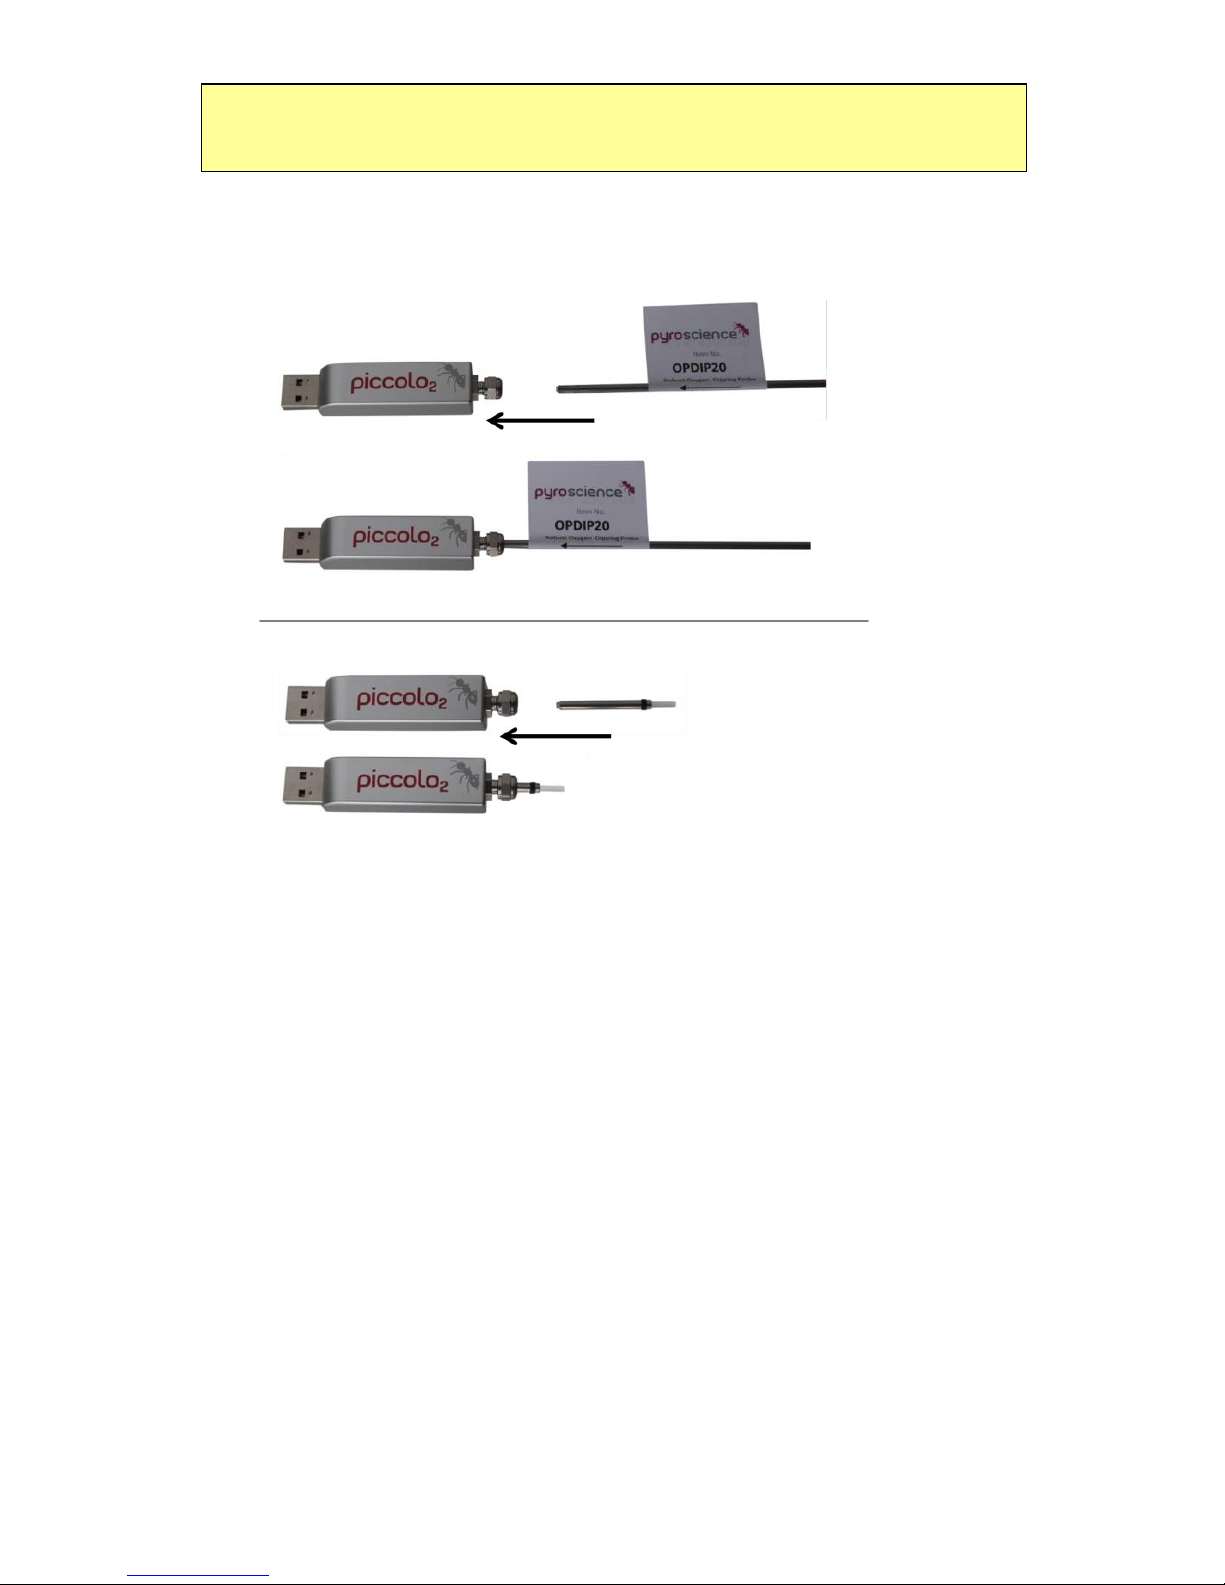
5.7 Connecting the Sensors and Optical Fibers
The robust probe OPROB3, the dipping probe OPDIP20, and the
optical fibers PICFIB2 / PICFIB2-LNS or the optical fiber rods
PICROD2 / PICROD3 / PICROD2-LNS must be connected to the
sensor port of the Piccolo2 with their instrument end. At the
instrument end IE, the core of the optical fiber protrudes ca. 1 mm
from the fiber jacket. For OPROB3, OPDIP20 and PICFIB2 the
instrument end IE is marked with "Instrument" on the attached
label.
First, remove the protective caps from both ends of the optical
probe / fiber / rod. Then slightly unscrew and loosen the nut at the
sensor port of the Piccolo2. The nut must not be removed from the
sensor port. Typically, unscrewing the nut with a single half turn
(180°) is sufficient. Insert now the instrument end IE carefully into
the sensor port of the Piccolo2, the insertion length is about 24
mm (see pictures with insertion of a) a dipping probe and b) an
optical fiber rod).
Page 19
19
Insert the optical probe / fiber / rod carefully as deep as possible
(ca. 24 mm) into the sensor port of the Piccolo2!
Fix the optical probe / fiber / rod by screwing down the nut tightly
onto the sensor port of the Piccolo2.
a)
b)
Then, insert the adapter end (AE) of the optical fibers PICFIB2 /
PICFIB2-LNS or optical fiber rods PICROD2 / PICROD2-LNS into
the basic spot adapter, adapter ring or flow-through cell, and fix it
with the clamping screw.
For OPROB3 and OPDIP20, insert the sensor end (SE) into the gas
or (stirred) aqueous liquid sample.
Page 20

20
5.8 Cleaning and Maintenance of the Sensors
Oxygen sensors for the Piccolo2 can be sterilized with ethylene
oxide (EtO) and can be cleaned with ethanol, peroxide (3% H2O2)
or soap solution. They can be applied in gas phases, in aqueous
solutions, as well as in ethanol, methanol or isopropanol (robust /
dipping probe: only short-term application in diluted ethanol,
methanol or isopropanol). Other organic solvents and gaseous
chlorine (Cl2) interfere with the oxygen sensor reading. No crosssensitivity is found for pH 1-14, CO2, CH4, H2S and any ionic
species.
A signal drift of the sensor can indicate photo-bleaching of the
oxygen-sensitive REDFLASH indicator, depending on the ambient
light intensity, as well as the intensity of the excitation light and
the sample interval. This can necessitate new calibration of the
sensor and eventually also readjustment of the Sensor Settings
(LED intensity; see also chapter 6.2.2). In case of sensor spots, repositioning of the spot fiber on the sensor spot and subsequent
new calibration might be necessary. If the signal intensity is getting
too low (typically after several millions of data points), as indicated
by the horizontal indicator bar in the main window of the Pyro
Oxygen Logger software and by the respective warning (see
chapter 6), the sensor needs to be replaced.
After finalization of the measurements, the sensor tip of the robust
and dipping probe should be rinsed carefully with demineralized
water. Especially after application in seawater, it is recommended
to clean the sensor thoroughly with demineralized water. After
drying, put on carefully the protective caps onto both ends of the
probe.
For sensor spots and respiration vials, wet cotton swabs can be
used for carefully wiping the sensing surface. Rinse the sensing
Page 21

21
surface sufficiently with demineralized water afterwards to remove
small particles and let it dry before storage.
After drying, put the respiration vials into the corresponding black
bag and store them in a secure, dry and dark place at room
temperature!
Store sensors in a dry, dark and secure place at room temperature.
Page 22

22
6 The Software "Pyro Oxygen Logger"
This chapter describes all functions of the Pyro Oxygen Logger
software excluding sensor calibration, which is described in detail
in chapter 7 and 9.
6.1 Main Window
After start of the Pyro Oxygen Logger software the following main
window is shown:
As default, uncalibrated oxygen sensor readings (raw value) are
shown, which give only a qualitative information of the actual
oxygen level.
Note that placing the cursor on many elements in the window will
show a short description ("tool tip"). By clicking on the right mouse
button and selecting "Description and Tip" a more detailed
description might be available additionally.
Page 23

23
The sensor readings are displayed in a numeric display (D) and in a
chart recorder (C) in the chosen oxygen unit (UD). The color and
appearance of each graph can be changed by clicking on the colorcontrol (CC), opening a pop-up menu. With Common Plots, Color,
Line Style, Line Width, Interpolation, and Point Style the chart
appearance can be changed. Clicking on the small rectangular
button (to the left of CC) allows hiding / showing the respective
graph.
The visible time frame of the chart recorder (C) can be changed by
moving the bar along the scroll bar (SCB). Switching off the
Autoscroll button will allow inspection of older data which are not
visible anymore in the time frame, e.g. during long-time
measurements.
The description of the sensor, as defined in the Settings by the
Sensor Code, is shown in the description display (DD). The Signal
Page 24

24
Intensity (SI) of the oxygen sensor is shown as a horizontal
indicator bar just underneath the numeric display (D).
A reasonable oxygen sensor shows signal intensities well above 50
(typically 50-500)1. If the signal intensity drops below 50, the
indicator bar (SI) turns gradually from grey to red, indicating that
the sensor gets degraded soon.
At signal intensities <10, the warning Low signal will
appear in the warning display (WD). At a signal intensity <5, the
display changes to NaN (Not a Number),
indicating that the signal is too low and
the sensor needs to be replaced (or moved to another position on
the sensor spot).
Besides the warning Not calibrated for an uncalibrated oxygen
sensor, the warning display (WD) can show the following warnings:
Low signal The sensor is either not connected or needs to be
replaced by a new one. In case of contactless sensors it might
indicate that the distance between the optical fiber and the sensor
spot is too large. (For advanced users: increase the LED intensity
and / or the amplification in the Advanced Settings).
Signal too high There might be too much ambient light on the
sensor tip or sensor spot. Avoid direct sun light exposure or strong
direct illumination with a lamp. (For advanced users: decrease the
LED intensity and / or the amplification in the Advanced Settings)
Bad reference This indicates internal problems of the Piccolo2.
Please contact Pyro Science for support.
1
Note: Exceptions are trace oxygen sensors. During the air calibration at 21% O2, these sensors naturally
show a very low signal intensity (as low as 10). But the signal intensity will strongly increase when a trace
oxygen sensor is applied within its specified range of 0-10% O2.
Page 25

25
Refer to the Troubleshooting in chapter 10.2.
The actual Compensation Temperature (i.e. the temperature used
for calculating the oxygen values) is shown in the temperature
display (TD) in units of degree Celsius (°C).
If a sensor is not yet calibrated, the
warning Not Calibrated is shown on
the right-hand side of the Calibrate button. As long as the sensors
are not calibrated, the data are shown in units of "raw value"
reflecting the measured oxygen levels only qualitatively. In order
to switch to quantitative oxygen units, the sensor settings need to
be adjusted in the Settings and calibration has to be performed by
clicking on the button Calibrate. The calibration procedure is
explained in detail in chapter 7.
The adjustment of the Settings using the button Settings is
described in detail in chapter 6.2.
The button Save Setup can be used to save the current settings
and calibration data of the Piccolo2. They can be reloaded anytime
by pressing the button Load Setup. This allows e.g. to switch
between different laboratory setups with a single Piccolo2. This
function might be useful also if different computers are used for
calibration and for actual measurements. You might calibrate the
sensors with the first computer, save the configuration with Save
Setup. By transferring this file and also the oxygen meter Piccolo2
to a second computer, you can load this configuration again with
Load Setup, giving you calibrated sensors ready for measurement.
Note, that for this procedure identical software versions of the
Pyro Oxygen Logger must be installed on both computers.
Page 26

26
Save Setup and Load Setup might be useful also if e.g. a Piccolo2
should be used repeatedly with several oxygen sensors. Initially,
each sensor needs to be calibrated only once and the configuration
of each sensor is saved with Save Setup. If later on a measurement
should be performed with a specific sensor, it is only necessary to
load the configuration for this sensor with Load Setup (but it must
be checked if the calibration is still valid).
All current settings and calibration data are automatically saved
when closing the Pyro Oxygen Logger software and are
automatically loaded again at the next startup. The Last Setup
loaded is shown underneath the Settings button.
The button Flash Logo causes a short flashing (ca. 1-2 sec) of the
status LED of the Piccolo2. Several Piccolo2 meters can be
connected to the PC in parallel and multiple measurements can be
performed by opening the Pyro Oxygen Logger software a number
of times corresponding to the number of connected Piccolo2
meters. The different windows operate completely independent of
each other and are assigned to exactly one Piccolo2. This allows
measurements in different setups at the same time. The flashing of
the status LEDs can help to assign a specific logger window to the
corresponding Piccolo2 (more details in chapter 10.4).
Clicking on Raw Data opens a pop-up window Oxygen Sensor
Raw Data which is described in chapter 6.3.
Clicking on the button Bar Graph will
open the Bar Graph Window. Here,
different parameters can be chosen to
be displayed in the bar graph by clicking
next to "Select data type", e.g. the
Signal Intensity (mV) of the connected
oxygen sensor.
Page 27

27
A Measurement is started by clicking on the
measurement start button (MSB). The arrow
in the button turns from dark green to light
green indicating that a measurement is in
progress. Clicking on it again will stop the
measurement.
The mode of Measurement can be chosen as
single data point acquisition, continuous
sampling (default setting) or as continuous
sampling limited to a defined time interval.
The duration of this time interval can be
adjusted in the duration display (DUD) shown
as hour (HH): minutes (MM): seconds (SS).
The Sample Interval (s) for continuous sampling can be defined in
the field designed with set. Setting the sample interval to 0.25 will
give the maximal possible scan rate. The exact maximal rate
depends on the settings. The actual sample interval is shown in the
display actual and is displayed in red if the actual ≠ the set sample
interval.
Acquired data can be smoothed by a Data Smoothing (range
1…10, default: 3, a value of 1 means no data smoothing). For
continuous or duration measurements with a sample interval
<10 s, data smoothing is done by a simple running average (e.g.
with Data Smoothing=5 always the last 5 sampled data points are
averaged). However, for single data point measurements and for
continuous or duration measurements with sample intervals
>10 s, the data smoothing is done by averaging repetitive
measurements (e.g. with Data Smoothing=3 for each data point 3
oxygen measurements are performed as fast as possible
sequentially, and the average of these 3 measurements is
displayed as the new data point).
Page 28

28
IMPORTANT: By default the displayed data are not automatically
saved to a data file.
To activate data logging, click on the red start button (SB) of Log
to File. Select a file name in the appearing file dialog. The saved
data files are simple text-files with the file extension ".txt", which
can be imported easily into common spreadsheet programs.
Thereafter, the indicators Comment and File Path are shown in
the main window additionally. In the field Comment, the measurements can be commented and this comment is then saved
together with the next data point into the data file.
During data logging, the data file can be displayed and opened by
clicking on the button Show File. The data logging is indicated by
the light green arrow in the grey Log to File button and can be
stopped by clicking this button again.
NOTE: During data logging, the buttons Settings and Calibrate
are not active and cannot be used before Log to File is stopped.
Page 29

29
The display of the data in the charts can be changed by different
chart tools arranged underneath the chart recorder.
The button with the magnifying glass offers different zoom
options. After clicking the button with the hand, the user can click
on the chart and move the whole area while keeping the mouse
button pressed.
The button Clear Graph offers the option to clear the graph and to
zero the time scale. Note, that this will not affect the saved data in
the data file.
The unit of the x-axis can be changed with the selector Time Scale.
The time scale can be displayed in Seconds (s), Minutes (min),
Hours (h), Relative Time (HH:MM:SS), Absolute Time (HH:MM:SS),
Absolute Time and Date, and numbered Data Points.
The scales of the y- and x-axis can be adjusted by clicking on
Adjust Scales, opening a pop-up window:
The upper (Maximum) and lower
limits (Minimum) and the Increment
of the Y Scale (Oxygen) and of the X
Scale (Time) can be changed by
clicking on the respective selectors or
by double-clicking directly onto the
field and entering the values
manually (changing these parameters
will automatically deactivate the
autoscaling). Autoscaling for all axes
can be activated with the Autoscale button. The arrow in the
button turns from dark green to light green indicating that
Autoscale is activated. By default only the y-axis Oxygen is in
Autoscale mode.
Page 30

30
6.2 Settings
To open the dialog window Piccolo2 Settings click on the Settings
button in the Main Window:
The Settings can be adjusted only when data logging is not active.
In the Settings the user has to enter the Sensor Code of the
connected oxygen sensor and to define (1) the Sensor Settings, (2)
the Conditions in the Sample under investigation and (3) the
oxygen Units for the measurements.
In the Channel 1 tab, the oxygen sensor can be activated /
deactivated by clicking on the button Activate. Activation is
indicated by a change from dark to light green of the arrow in the
button. A text describing the connected sensor type appears on
the right-hand side of this button after the Sensor Code (see label
on sensor) has been entered. This description will be shown in the
description display (DD) of the main window and in the data file as
well.
Page 31

31
Please take care that the sensor code of the sensor connected to
the Piccolo2 is entered into the field Sensor Code in the Channel 1
tab of the window Piccolo2 Settings. It includes information for
optimal sensor settings and for calibration data needed for the
(rough) factory calibration and for the 1-point calibration. The first
letter of the sensor code defines the sensor type. A detailed
explanation of the sensor code is given in chapter 10.7.
The oxygen units can be selected by the selector Units. The
selectable units include raw value (default), % air saturation, % O2,
mL/L, µmol/L, mg/L (ppm), hPa (mbar), mmHg (Torr), dphi and
µg/L (ppb). For measurements in a Gas Phase only the units raw
value, % O2, hPa (mbar), mmHg (Torr) and dphi can be selected,
whereas for measurements of dissolved oxygen in a Water sample
(DO) all units except % O2 can be selected. For details please refer
to chapter 10.5.
NOTE: The chart in the main window is automatically cleared after
the Settings have been modified. Readjustments in the Settings
might require also new calibration of the sensor.
If changes of the Settings require new sensor
calibration, a warning Not Calibrated appears on the
right-hand side of the Calibrate button in the main window.
6.2.1 Basic Settings
The Sensor Settings can be adjusted in a Basic or
an Advanced mode. The first-time user is advised to
work with the Basic Settings. Please ensure that the
correct sensor code (see label on the connected
sensor) has been entered in the field Sensor Code.
The Measuring Mode can be adjusted gradually
between low drift (1) and low noise (128) of the
sensor signal by moving the arrow with the cursor along the scale,
Page 32

32
thereby changing the oxygen measuring time. For standard
applications, an intermediate mode (8 or 16) is advisable.
The Fiber Length (m) of the connected robust probe (OPROB3) or
of the connected optical fiber (PICFIB2) for contactless sensors
must be entered, which is typically 1 m (refer to chapter 9.2 for
more details). For the dipping probe OPDIP20 and for the optical
fiber rods PICROD2 and PICROD3, please enter a Fiber Length of
0 m (zero m).
NOTE: Ensure that the correct sensor code has been entered. If the
sensor is not yet calibrated, a warning Not Calibrated is displayed
in the main window.
6.2.2 Advanced Settings
If Advanced Sensor Settings are chosen, more complex setting
controls will be shown. Please ensure that the correct sensor code
(see label on sensor) has been entered in the field Sensor Code.
The Advanced Measuring Parameters comprise
the LED Intensity for excitation of the REDFLASH
indicator (in %) and Amplification of the sensor
signal. As a rule of thumb, the LED Intensity
should be 10-30% for robust / dipping probes, but
can be increased up to 100% for contactless
sensors (sensor spots, flow-through cells,
respiration vials). The Amplification should be typically chosen as
80x, 200x or 400x. Note that varying the LED Intensity and the
Amplification has direct influence on the signal intensity and
therefore on the signal-to-noise-ratio.
The Oxygen Measuring Time defines the integration time for
acquisition of a single data point. Shorter measuring times provide
low long-term drift, whereby longer measuring times assure less
noise. The maximal possible value is 128 ms.
Page 33

33
NOTE: If using the Advanced Sensor Settings, it is recommended
to perform a 2-Point calibration of the oxygen sensor. Later
readjustments in the Advanced Settings might require also new
calibration of the sensor.
The Fiber Length (m) of the connected robust
probe (OPROB3) or of the connected optical fiber
(PICFIB2) for contactless sensors must be
entered, which is typically 1 m (refer to chapter
9.2 for more details). For the dipping probe
OPDIP20 and for the optical fiber rods PICROD2
and PICROD3, please enter a Fiber Length of 0 m.
Alternatively, it is possible to select Manual Background
Compensation, which is described in detail in chapter 9.2. Finally,
the background compensation can be completely deactivated by
selecting No Background Compensation.
NOTE: Generally, it is advised to select Fiber Length (m) and to
enter the fiber length there. The alternative options Manual
Background Compensation or No Background Compensation
are only intended for advanced users (see also chapter 9.2).
6.2.3 Conditions in the Sample
The next step is determination of the Conditions in
the Sample, which can be Water for dissolved
oxygen (DO) or a Gas Phase.
The temperature of the environmental sample has
to be measured with a thermometer, kept constant
and entered manually as Fixed Temperature (°C).
This "Compensation Temperature" will be
displayed in the main window (TD).
Page 34

34
IMPORTANT: The measurements must be performed at constant
temperature and constant environmental conditions!
It is important to keep the temperature constant during calibration
and measurements, as
the luminescence of the REDFLASH indicator is temperature
dependent and
the conversion of some oxygen units is dependent on
temperature.
The atmospheric pressure (e.g. read from a separate barometer)
must be entered manually as Fixed Pressure (mbar). Common
conditions refer to 1013 mbar (default).
If the actual atmospheric pressure cannot be determined on site, it
is also possible to enter the Elevation (m) above sea level. For this
click on Elevation and enter the actual elevation in meters. This
procedure will calculate only the average atmospheric pressure for
this elevation; therefore, this option is less precise than measuring
the actual atmospheric pressure.
The Salinity (g/L) of the environmental sample needs to be
measured and entered, e.g. in case of saline water. For
measurements in gas samples this value has no relevance (and is
not active). For measurements in liquid samples, the salinity is only
relevant if a concentration unit was selected (e.g. mg/L or µmol/L).
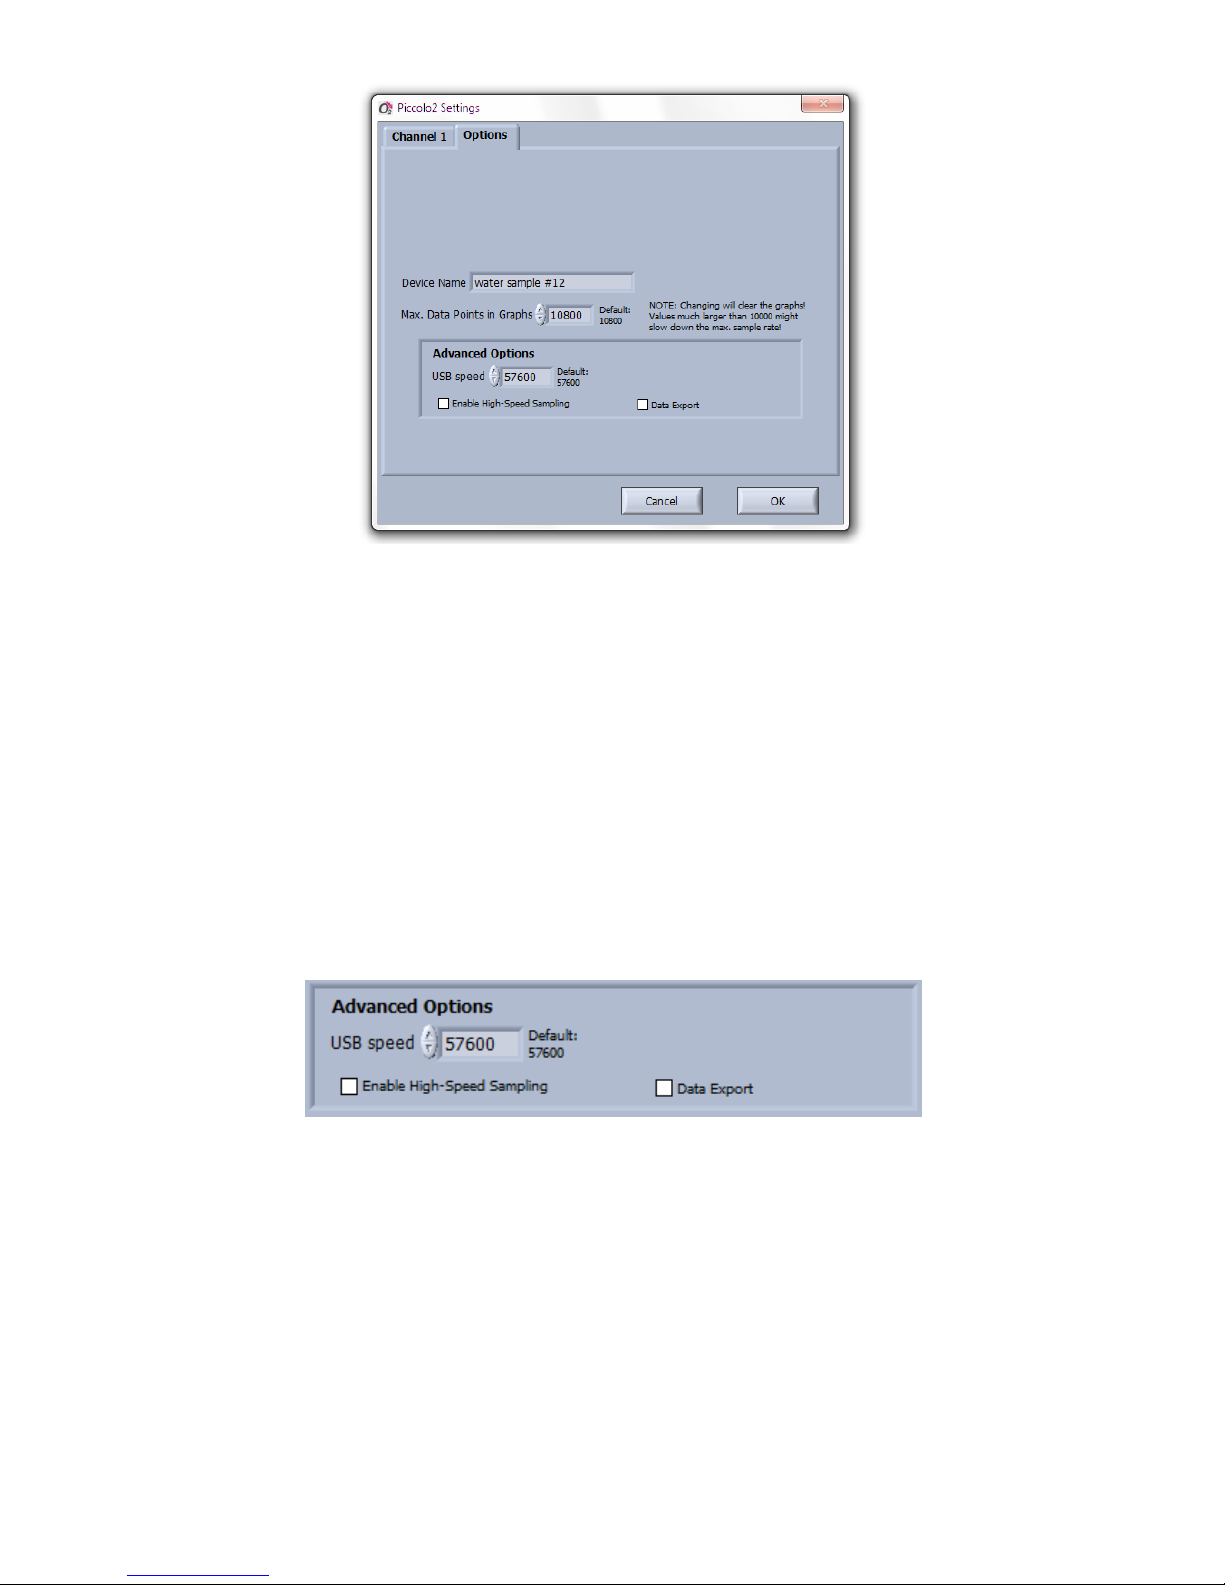
6.2.4 Options
In the panel Options, it is possible to designate a specific name to
the connected Piccolo2 by typing a name in the field Device Name
e.g. "water sample #12". This device name is then displayed in the
top line of the main window. This option is useful especially if
several Piccolo2 devices are operated in parallel in order to
distinguish the opened logger windows.
Page 35
35
The maximum number of data points kept in the graphs can be
changed by the selector Max. Data Points in Graphs (default:
10800). A change of the number of data points will clear the
graphs, and high values (>>10000) might decrease the maximum
sample rate (increase the actual sample interval).
Advanced Options (only for advanced users):
The USB communication speed can be adjusted e.g. for improving
the maximum sampling rate (default: 57600).
Activation of the button Enable High-Speed Sampling will enable
adjustment of a Sample Interval <0.25 s in the main window (and
disable Max. Data Points in Graphs).
The Data Export is relevant only for OEM modules or third-party
software.
Page 36
36
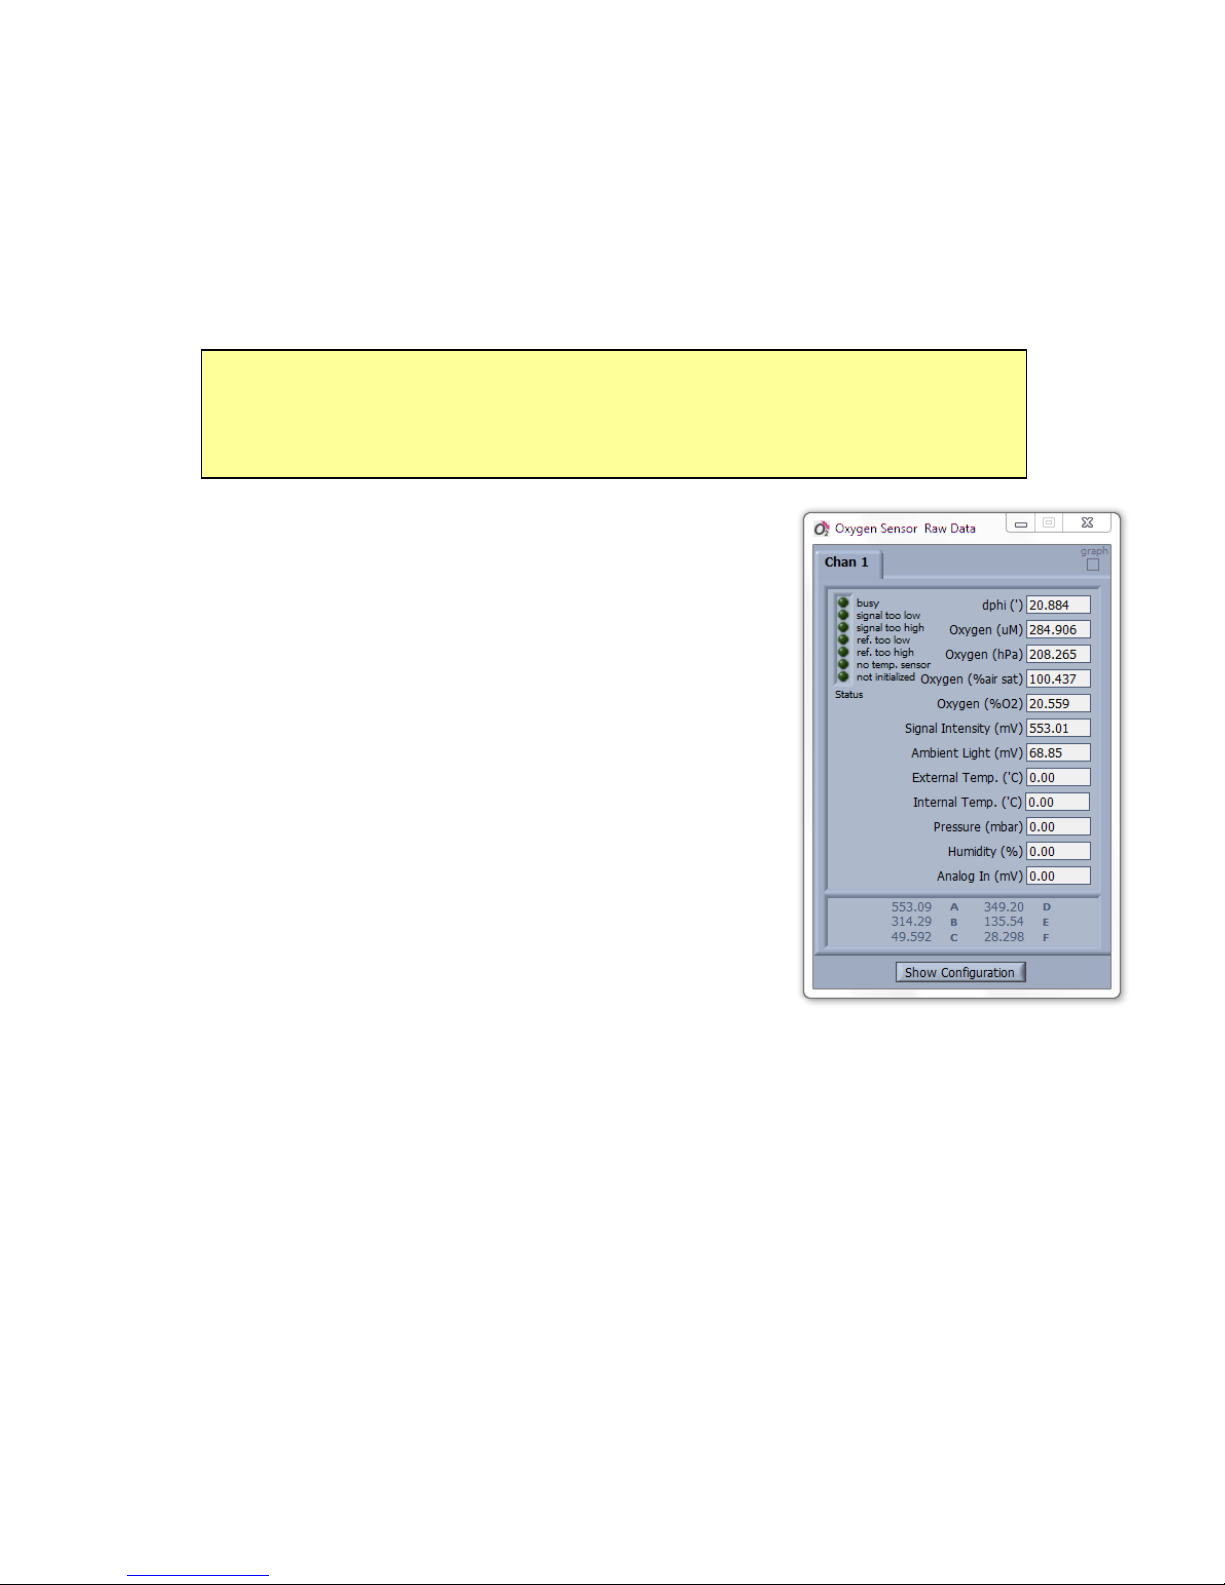
6.3 Raw Data Window
The Raw Data Window is mostly intended for trouble shooting and
advanced users. During standard measurements it is not needed in
general. After clicking on the Raw Data button in the main window
the Oxygen Sensor Raw Data window will open.
NOTE: While the Oxygen Sensor Raw Data window is opened, all
raw values are saved also in the data file in additional columns
behind the standard data columns.
The panel of the oxygen channel (Chan 1)
shows the phase shift as "delta phi" (dphi, in °).
dphi is the actual measured raw value which is
used for internal calculation of oxygen
concentration Oxygen (µM), Oxygen partial
pressure (hPa), Oxygen in % air saturation (%
air sat) and Oxygen (% O2) (see also chapter
10.3).
The Signal Intensity (in mV) gives a measure
of quality of the oxygen measurement and is
also displayed in the horizontal bar indicator in
the main window.
Ambient Light (in mV) gives a measure of the ambient light
entering the sensor from outside. At too high ambient light levels,
the detector of the Piccolo2 might get saturated, indicated by the
warning Signal too high in this window and in the warning display
of the main window.
On the left side, the Status and different warnings related to the
signal and reference intensity (too low, too high) can be indicated.
Page 37

37
On the right side of the channel tab, a graph can be activated,
showing the dphi (°) and Signal Intensity (mV) in the graph (default
setting). Plotting of additional parameters can be activated by
clicking on the small rectangular button next to the color control of
the respective parameter.
Page 38

38
7 Calibration of Oxygen Sensors
This chapter describes the possible calibration modes for oxygen
sensors connected to the Piccolo2 meter using the logger software
Pyro Oxygen Logger.
For sensor calibration, the temperature in the calibration standard,
the atmospheric pressure and the relative humidity of the ambient
air are important parameters ensuring high precision of calibration.
It is on the user´s authority to measure and adjust these
parameters manually.
This chapter covers only the necessary steps during the calibration
procedure. For details regarding preparation of calibration
standards refer to chapter 8.
Please note that during oxygen sensor calibration, the Sample
Interval is automatically set to 0.5 s and the Data Smoothing to 5,
ensuring fast determination of a precise mean value during sensor
calibration. After completion of the calibration, the program
returns to the former settings automatically.
7.1 Calibration
To calibrate a sensor, click on the button Calibrate in the main
window. Note that during data logging this button cannot be used
until Log to File is stopped.
A dialog window Oxygen Sensor Calibration will open in which
the calibration mode can be selected:
Page 39

39
Factory calibration (for a quick, rough calibration): taking the 0%
and the air calibration values from the sensor code; advised only
for rough measurements or testing purposes.
1-Point: taking the 0% value from the sensor code and the air
calibration value from a manual calibration for precise
measurements around 21% O2.
2-Point: taking the 0% and the air calibration value from a manual
calibration for precise measurements over the full range (0-21% O2
or 0-100% dissolved O2 (DO)).
NOTE: It is recommended to determine the air calibration value in
air saturated water if measurements will be performed in water
samples (aqueous liquids).
For advanced users and applications, a Custom Mode can be
selected, allowing the user to combine freely the possible
calibration types for the air and the 0% calibration.
7.1.1 Calibration Mode: Factory
NOTE: Factory Calibration is intended only for rough
measurements and testing purposes. It is only possible if the
correct Sensor Code has been entered in the Settings (see chapter
6.2).
Page 40

40
If the calibration mode Factory Calibration is chosen, ensure that
the correct sensor code has been entered in the Settings (as
displayed in 2. Adjust Calibration Conditions of the Oxygen
Sensor Calibration window). If the sensor code displayed is not
correct, click on Finish, open Settings, enter the correct Sensor
Code and repeat Factory Calibration.
After clicking on Finish factory calibration is completed, and the
program returns to the main window.
7.1.2 Calibration Mode: 1-Point
NOTE: The calibration mode 1-Point is only possible if the correct
Sensor Code has been entered in the Settings (see chapter 6.2).
The calibration mode 1-point is selected by clicking on the button
1-Point. This mode uses a manual calibration in an air calibration
standard for adjusting the air calibration value. The 0% calibration
value is taken from the Sensor Code. The preparation of
appropriate air calibration standards is described in chapter 8.1.
Depending on the air calibration standard used, select Water (DO)
for dissolved oxygen or Gas Phase.
The air calibration standard (see also chapter 8.1) can be:
ambient air of known humidity,
water-vapor saturated air or
air saturated water (100% air saturation).
The oxygen level in the calibration standard (unit: %O2) can be
freely chosen in Oxygen (%O2). If the air calibration standard is
based on ambient air or air saturated water, then this value should
be kept at 20.95% O2 (default), representing the standard oxygen
volume fraction in ambient air. However, other values can be
adjusted if custom calibration gases are used, of e.g. 5% O2, which
might be useful when using trace oxygen sensors.
Page 41

41
The temperature of the calibration standard needs to be
measured, kept constant and entered manually in Fixed
Temperature.
In addition, the actual atmospheric pressure in the calibration
standard can be entered manually in Pressure (mbar). Normal
conditions refer to 1013 mbar (default setting).
If the actual atmospheric pressure cannot be determined on site,
alternatively it is possible to enter the actual Elevation (m) in
meters above sea level. For this click on Elevation and enter the
actual elevation. Please note, that this option takes only the
elevation-dependent pressure change into account, but not the
variations due to actual weather conditions. Therefore,
determining the actual atmospheric pressure with a barometer
gives more precise results.
The relative Humidity (%RH) of the gas phase (e.g. air) needs to
be adjusted. If a calibration standard with water-vapor saturated
air is used (see chapter 8.1.2), it must be adjusted to 100% RH.
Otherwise, the humidity must be determined with a hygrometer
and must be entered.
Now place the oxygen sensor into the air calibration standard.
NOTE: Ensure constant calibration conditions and a constant
temperature in the calibration standard!
Page 42

42
Wait for steady-state until the sensor reading is stable by
observing the graph. Also ensure stable temperature during
calibration.
Note that the button Set Air will be highlighted as soon as the
oxygen reading is within the expected range for the connected
sensor type (the latter does not apply for custom air calibration
with ≠20.95% O2).
If the oxygen readings have reached their steady-state, click on
Set Air, and the current oxygen sensor reading is taken for the
air calibration. If the oxygen reading seems to be out of the
expected range, a warning will be shown offering the option to
repeat calibration (it is not recommended to continue without
checking the calibration standard and the sensor!).
A completed air calibration is indicated by the green indicator
Calibrated at Air.
For Factory 0% Calibration, no further steps are necessary (refer
to chapter 7.1.3). Ensure that the correct sensor code has been
entered in the Settings.
7.1.3 Calibration Mode: 2-Point
The calibration mode 2-point is selected by clicking on the button
2-Point. In this mode both the air calibration value and the 0%
calibration value are determined in specially prepared calibration
standards. Preparation of appropriate 0% and air calibration
standards is explained in chapter 8.
The air calibration standard and the calibration conditions need to
be defined and entered as described for the 1-Point calibration
(see chapter 7.1.2).
Now place the oxygen sensor into the air calibration standard.
Page 43

43
NOTE: Ensure constant calibration conditions and a constant
temperature in the calibration standard!
Wait for steady-state until the sensor reading is stable by
observing the graph. Ensure also stable temperature conditions in
the standard during calibration.
Note that the button Set Air will be highlighted as soon as the
oxygen readings are within the expected range for the connected
sensor type (the latter does not apply for custom air calibration
with ≠20.95% O2).
If the oxygen sensor readings have reached their steady-state, click
on Set Air, and the current oxygen sensor reading is taken for air
calibration. If the oxygen reading seems to be out of the expected
range, a warning will be shown offering the option to repeat
calibration (it is not recommended to continue without checking
the calibration standard and the sensor!).
A completed air calibration is indicated by the green indicator
Calibrated at Air.
Subsequently, insert the oxygen sensor into the 0% calibration
standard. Wait for steady-state until the sensor reading is stable by
observing the graph. Ensure stable temperature conditions during
calibration.
Page 44
44
Note that the button Set 0% will be highlighted as soon as the
oxygen readings are within the expected range for the
connected sensor type.
If the oxygen sensor readings have reached their steady-state,
click on Set 0%, and the current oxygen sensor reading is
taken for 0% calibration. If the oxygen reading is out of the
expected range, a warning will be shown offering the option to
repeat calibration (it is not recommended to continue without
checking the calibration standard and the sensor!).
A completed 0% calibration is indicated by the green indicator
Calibrated at 0%.
Finally, click on Finish for returning to the main window.
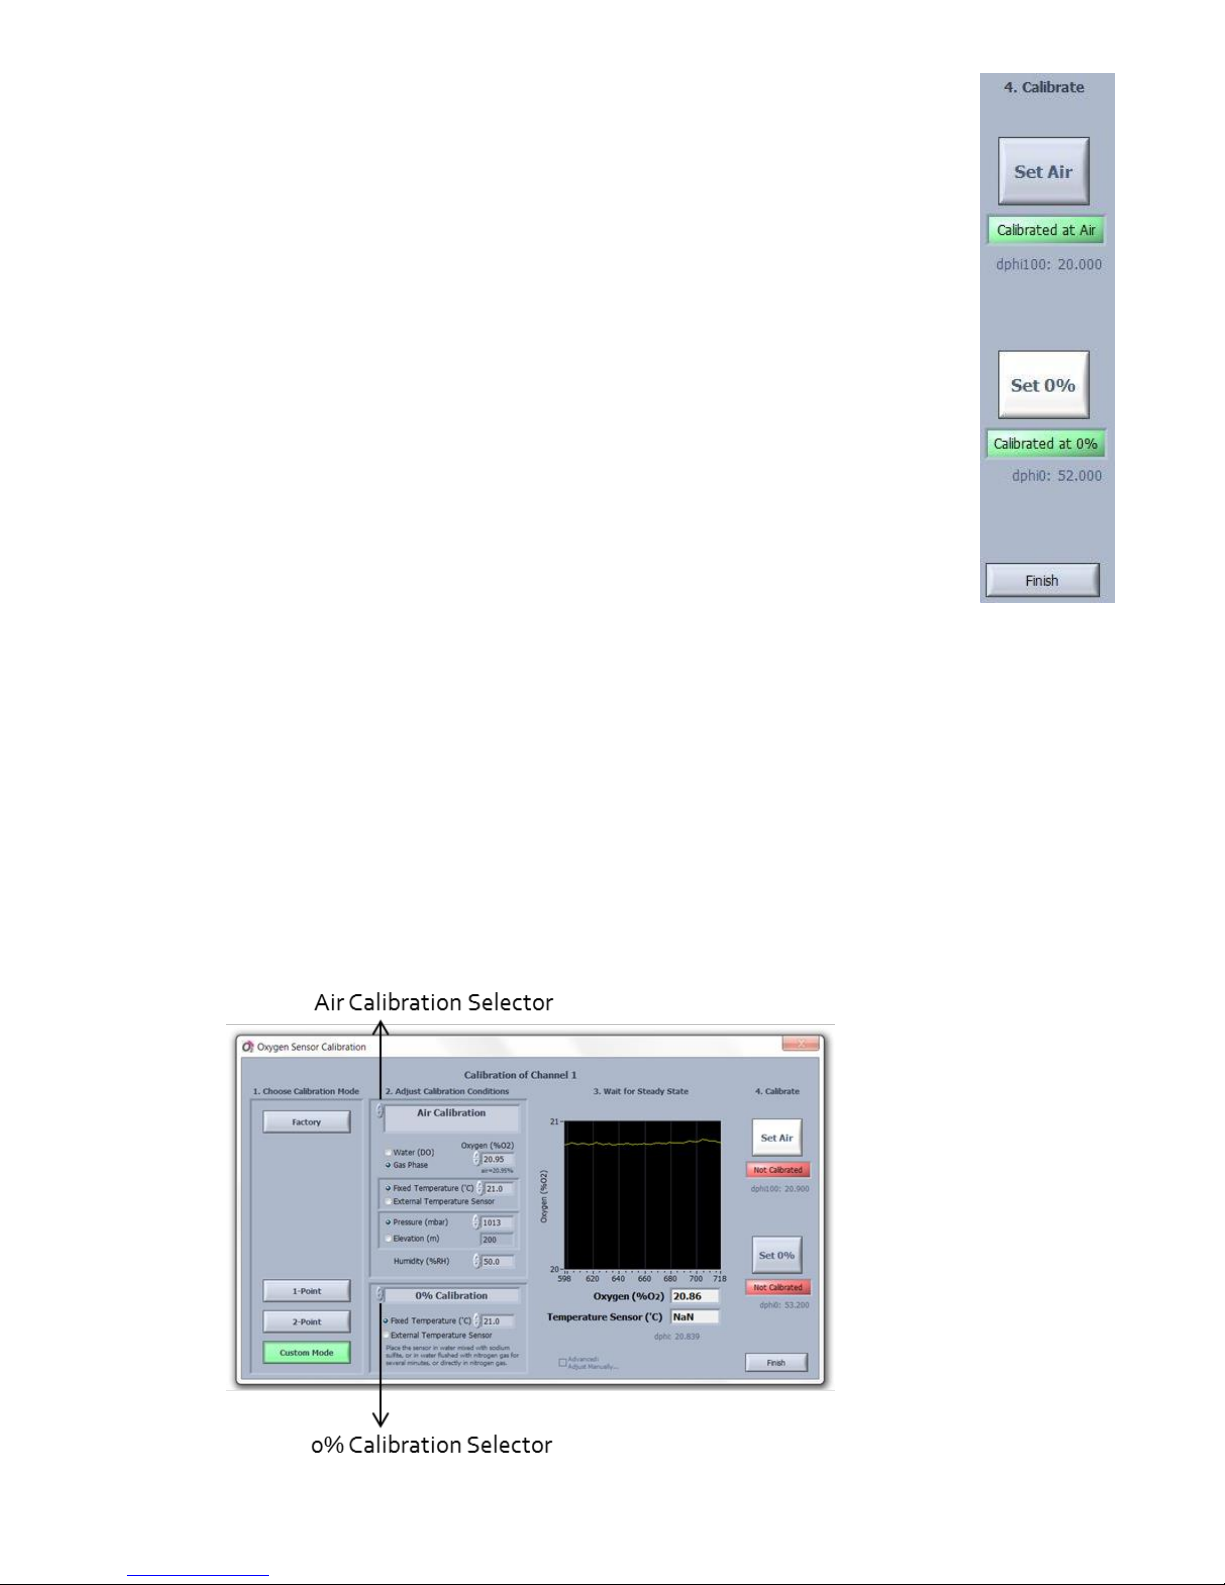
7.1.4 Calibration Mode: Custom
The custom calibration mode is selected by clicking on the button
Custom Mode. This mode allows to freely combine all possible
calibration types for the air calibration and the 0% calibration. The
air calibration type can be selected by clicking on the "Air
Calibration Selector". The 0% calibration type can be selected by
clicking on the "0% Calibration Selector".
Page 45

45
The following air calibration types can be selected:
Factory Air Calibration (refer to chapter 7.1.1)
Air Calibration (refer to chapter 7.1.2)
For the 0% calibration the following types can be selected:
Factory 0% Calibration (refer to chapter 7.1.1)
0% Calibration (refer to chapter 7.1.3)
7.2 Advanced adjustments
This section is for advanced users only!
For very advanced applications, it is possible to manipulate all
internal calibration parameters of the Piccolo2 manually. This
option is accessible by selecting Custom Mode and subsequently
clicking on Advanced: Adjust Manually, which opens a separate
window showing all internal calibration parameters.
Here, the Upper Calibration Point (default: Partial Volume of
Oxygen 20.95% O2) can be defined. The calibration conditions
(Temperature, Air Pressure, Humidity) need to be measured and
entered, as well as the Temperature (°C) at 0% for the 0%
Calibration Point.
Page 46

46
Further, the phase shift "dphi" (dphi, see chapter 10.3) for the 0%
calibration standard (dphi 0% in °) and for the air calibration
standard (dphi 100% in °) can be adjusted manually.
The Background Amplitude (in mV) and the Background dphi
(phase shift in °) can be adjusted (refer to chapter 9.2 for more
details). These two values are relevant only if background
compensation for measurements with contactless sensors has
been activated in the Advanced Settings.
The parameters f, m, F, kt, mt, Tofs, and tt are needed for internal
calculation of the oxygen concentration data. These parameters
are specific constants for the REDFLASH indicators, and are
automatically adjusted for the selected Sensor Type in the
Settings. Unless otherwise communicated by Pyro Science, it is
strongly advised to leave these parameters at their default
values.
Page 47

47
8 Calibration Standards
8.1 The Air Calibration Standard
The Air Calibration standard can be
ambient air
water-vapor saturated air
air saturated water (100% air saturation)
Always use a proper lab stand for mounting the oxygen sensor!
All air calibration standards described in the following rely on the
virtually constant oxygen content in the earth’s atmosphere of
about 20.95% O2 in dry air. Slight deviations might be given in
closed rooms occupied by many people (or e.g. candles,
combustion engines) consuming the oxygen. So if in doubt, ensure
good ventilation of the room with fresh air e.g. by opening a
window for some minutes.
Furthermore, the relative humidity of the air causes deviations
from the ideal value of 20.95% O2. Simply speaking, the water
vapor in humid air replaces a fraction of the oxygen, resulting in a
diminished oxygen level of e.g. 20.7% O2. For temperatures
around and below 20°C, this effect fortunately causes a maximum
deviation of about 0.5% O2 only. However, for higher
temperatures at 30°C or even 40-50°C, the humidity of the air has
a significant influence on the actual oxygen level. For example,
ambient air at body temperature (37°C) with 100% relative
humidity contains only 19.6% O2 compared to dry air with 20.95%
O2.
During calibration of oxygen sensors, there are two possibilities to
take the humidity into account:
Page 48

48
(1) The relative humidity and the temperature of the ambient air must
be determined during calibration and entered into the software.
Then, the Pyro Oxygen Logger software will automatically
calculate the real oxygen level under these conditions.
(2) The calibration standard is prepared in a closed vessel either filled
with water or partly filled with e.g. wet cotton wool or a wet
sponge. This ensures a constant humidity of 100% RH and there is
no need to measure the humidity.
Option (2) is utilized for the calibration standards "Water-Vapor
Saturated Air" (see section 8.1.2) and "Air Saturated Water" (see
section 8.1.3).
Another parameter even more important for the air calibration
standard is the atmospheric pressure. The principle parameter
measured by the oxygen sensors is not the partial volume (i.e. "%
O2"), but the partial oxygen pressure (i.e. "mbar") (see also chapter
10.5). So, an oxygen level of e.g. 20.7% O2 (determined as
described above by a given humidity and temperature) is
converted internally by the Pyro Oxygen Logger software into a
partial pressure of oxygen essentially by multiplying the relative
oxygen level with the atmospheric pressure of e.g. 990 mbar (see
chapter 10.5):
0.207 x 990 mbar = 205 mbar
giving a partial oxygen pressure of e.g. 205 mbar. This is the
essential calibration value used internally by the Pyro Oxygen
Logger software. The atmospheric pressure can be influenced 1) by
weather changes (e.g. varying between ca. 990 mbar and 1030
mbar at sea level) and 2) by the elevation above sea level (e.g. at
1000 m elevation the typical atmospheric pressure is about 900
mbar compared to 1013 mbar at sea level).
Page 49

49
Thus, in summary, there are three important parameters to be
known for the air calibration standard:
Temperature (°C)
Relative Humidity (% RH)
Atmospheric Pressure (mbar)
8.1.1 Ambient Air
If ambient air is used as the air calibration standard, the following
parameters must be independently determined in parallel
- air temperature (thermometer),
- air humidity (hygrometer),
- atmospheric pressure (barometer),
and entered into 2. Adjust Calibration Conditions of the Oxygen
Sensor Calibration window. Ensure that these three parameters
are kept constant during the calibration procedure.
Then, the dry oxygen sensor connected to the Piccolo2 is exposed
to the ambient air. Otherwise, follow the calibration procedures
given in chapter 7.
For precise calibrations in ambient air, it is important that the
measuring tip / surface of the oxygen sensor is completely dry.
Wet sensor tips will cause undefined humidity levels around the
sensor tips. And even worse, the evaporation of water drops would
cool down the sensor tips causing undefined temperatures.
8.1.2 Water-Vapor Saturated Air
Enclose wet cotton wool into a flask (e.g. DURAN flask) with a lid
prepared with one hole for the oxygen sensor connected to the
Piccolo2 and another hole for a temperature sensor. Typically,
about 1/3 to 1/2 of the flask volume is filled with wet cotton wool,
while the other volume fraction is left free for inserting the tip of
Page 50

50
the oxygen sensor and a temperature sensor. Otherwise, follow
the calibration procedures given in chapter 7.
8.1.3 Air Saturated Water
Fill an appropriate amount of water into a flask (e.g. Duran flask)
with a lid prepared with holes for inserting the oxygen sensor and a
temperature sensor. For about 10 minutes, stream air through the
water with an air stone connected to an air pump (available as
commercial equipment for fish aquaria). Alternatively, if no air
pump is available, fill water into the flask leaving >50% air in the
headspace, close it with a lid and shake the flask strongly for about
1 minute. Open the lid shortly for ventilating the headspace with
fresh air. Close it again and shake the flask for 1 more minute.
Insert the oxygen sensor and temperature sensor into the flask.
Ensure that the tips of the sensors are immersed in the water.
Otherwise, follow the calibration procedures given in chapter 7.
Please consider that streaming air through water may cause
cooling of the water. Ensure correct temperature determination!
Page 51

51
8.2 The 0% Standard
The 0% calibration standard can be
water mixed with a strong reductant
water flushed with nitrogen gas (N2)
nitrogen gas (N2)
8.2.1 Water Mixed with a Strong Reductant
Fill an appropriate amount of water into a glass flask (e.g. Duran
flask) with a lid prepared with holes for inserting the oxygen sensor
and a temperature sensor. Add a strong reductant, like sodium
dithionite (Na2S2O4) or sodium sulfite (Na2SO3) at a
concentration of 30 g/L, creating oxygen-free water by chemical
reaction. It is not recommended to use saline water (e.g. seawater)
for this, because the high salinity of the water might prevent a
proper dissolution of the reductant. Stir the solution until the salt is
completely dissolved and let the solution stand for about 15
minutes. Insert the oxygen sensor and temperature sensor into the
flask, and ensure that the sensor tips are completely immersed into
the water. Otherwise, follow the calibration procedures given in
chapter 7.
Do not store the sensors in this solution and rinse them sufficiently
with demineralized water after calibration.
8.2.2 Water Flushed with Nitrogen Gas
Fill water into a glass flask (e.g. Duran flask) with a lid prepared
with holes for inserting the oxygen sensor and a temperature
sensor. Close it and stream nitrogen gas through the water for
about 10 minutes. You might speed up this process by first boiling
the water (and thereby removing all dissolved gases) and then
stream the nitrogen gas through it during cooling. Insert the
oxygen and temperature sensor into the flask, let it equilibrate and
perform calibration as described in chapter 7.
Page 52

52
Please consider that streaming N2 gas through water may cause
cooling of the water. Ensure correct temperature determination of
the 0% calibration standard!
8.2.3 Nitrogen Gas
Flush 100% nitrogen gas through a glass flask (e.g. Duran flask)
with a lid prepared with holes for inserting the oxygen sensor and a
temperature sensor. Ensure that all air has been replaced by the
nitrogen gas before performing calibration. Insert the oxygen and
temperature sensor into the flask, let it equilibrate and perform
calibration as described in chapter 7.
Ensure that no ambient air enters the flask again during the
calibration process. Convectional gas transport is a very fast
process! It is therefore advised to keep flushing the flask with
nitrogen gas during the complete calibration process!
Please consider that nitrogen gas from gas bottles might be
significantly cooled down by the decompression process. Ensure
correct temperature determination of the calibration standard!
Page 53

53
9 Calibration of Contactless Sensors
For preparing a setup with contactless oxygen sensors, please refer
to the chapters 5.3-5.7. More details on oxygen nanoprobes in
microfluidic applications are available on request.
9.1 Calibration Procedure
In general, the calibration procedure for contactless sensors (e.g.
sensor spots, flow-through cells, respiration vials) is the same as
for the robust and dipping probe described in chapters 7 and 8.
However, if a 1-point or a 2-point calibration should be performed,
the calibration standards have to be filled directly into the vessel
containing the sensor spot, into the tubing of the flow-through cell
or into the respiration vial.
If "Ambient Air" is used for the air calibration standard (see chapter
8.1.1), a good air circulation of the ambient air into the dry setup is
important. For precision applications without the possibility to
ensure a dry setup for the calibration procedure, the alternative air
calibration standards "Water-Vapor Saturated Air" (see also
chapter 8.1.2) or "Air Saturated Water" (see also chapter 8.1.3)
should be preferred. In the first case, some part of the inner
volume of the setup can be filled with e.g. wet cotton wool
ensuring 100% RH around the oxygen sensor position. In the latter
case, the inner volume of the setup is simply filled with air
saturated water prepared as described in chapter 8.1.3. Ensure that
the oxygen sensor is completely covered with air saturated water!
Page 54

54
9.2 Manual Background Compensation
The calibration of contactless sensors (e.g. sensor spots, flowthrough cells, respiration vials, nanoprobes) includes a
compensation of potential background fluorescence from the
fiber-optic cable connecting the Piccolo2 with the contactless
oxygen sensor. Based on the Fiber Length (m) entered in the
Settings (see chapters 6.2.1 and 6.2.2), a background signal for
compensation is estimated automatically by the Pyro Oxygen
Logger software. So the user usually does not notice the
background compensation at all. For standard applications this
should be the preferred procedure.
But for precision applications and especially for low signal
intensities (e.g. <50 mV), a manual background compensation can
be performed by the user alternatively. For this, Manual
Background Compensation must be selected in the Advanced
Settings (see chapter 6.2.2). After opening the calibration window
by clicking on Calibrate, a separate Background Compensation
window will open automatically:
Here, the background fluorescence of the connected optical fiber
can be compensated. For this it is important that
Page 55

55
the instrument end of the Optical Fiber is connected to the
Piccolo2 (see 5.7) and
the adapter end of the Optical Fiber is not attached to the
sensor (i.e. disconnect the adapter end from the spot
adapter, adapter ring or from the flow-through cell)
Then, wait for steady-state and press the button Take Actual
Values.
Alternatively, the button Keep Last Values can be used if the
sensor spots are calibrated again with the same optical fiber, which
was background compensated before. Then, the last values for
background compensation are kept.
It is also possible to manually enter values for the Background and
dphi (°) into the field Manual and subsequently, clicking on Take
Manual Values. If you manually enter zero for Background, no
background compensation is performed.
After background compensation is finished, the window closes and
the program proceeds with the main oxygen sensor calibration
window (see chapter 7). It is important that, for the subsequent
calibration process, the Optical Fiber is attached to the sensor spot
position again, e.g. by connecting the adapter end again to the
spot adapter, adapter ring or flow-through cell.
Please ensure that during background compensation the Optical
Fiber is not connected to the contactless sensor.
Please ensure that during the subsequent calibration process the
Optical Fiber is attached again to the contactless sensor.
Keep in mind that the position of the spot adapter or adapter ring
should not be changed after calibration of the sensor spot;
otherwise it has to be calibrated again.
Page 56

56
10 Appendix
10.1 Specifications of the Piccolo2
Dimensions
15.5 x 15.5 x 54 mm
Weight
ca. 20 g
Interface
USB 2.0
Power Supply
5VDC from USB-port, ca. 3-5mA
average current consumption with
max. 40mA peaks (of about 10200ms duration) during an oxygen
measurement
Supported operating systems
Windows 2000, XP, VISTA, 7,8, 10
(but not Windows RT)
Operating temperature
0 to 50ºC
Max. relative humidity
Non-condensing conditions
Oxygen channels
1
Oxygen measuring principle
lifetime detection of REDFLASH
indicator luminescence
Excitation wavelength
620 nm (orange-red)
Detection wavelength
760 nm (NIR)
Max. sample rate
4 samples per second
Max. sample rate with enabled “high
speed sampling” in Settings->Options
ca. 10-20 samples per second
*Please note, that the oxygen sensors have different temperature ranges (typ. 050°C specified, -20°C to 70°C not specified).
Page 57

57
10.2 Troubleshooting
How to respond to the warnings shown in the Pyro Oxygen Logger
software:
Signal Too High
Too much ambient light exposed to the sensor, or amplification is
too high, or LED intensity is too high:
→ darken the surrounding
→ and / or decrease the Amplification in the Advanced settings
→ and / or decrease the LED Intensity in the Advanced settings
Low Signal
Sensor signal is too low:
→ check whether the sensor cable is connected
→ increase the Amplification in the Advanced settings
→ and / or increase the LED Intensity in the Advanced settings
→ replace the sensor, the tip might be broken / bleached
Bad Reference
Internal problem of the electronics
→ contact Pyro Science
Page 58

58
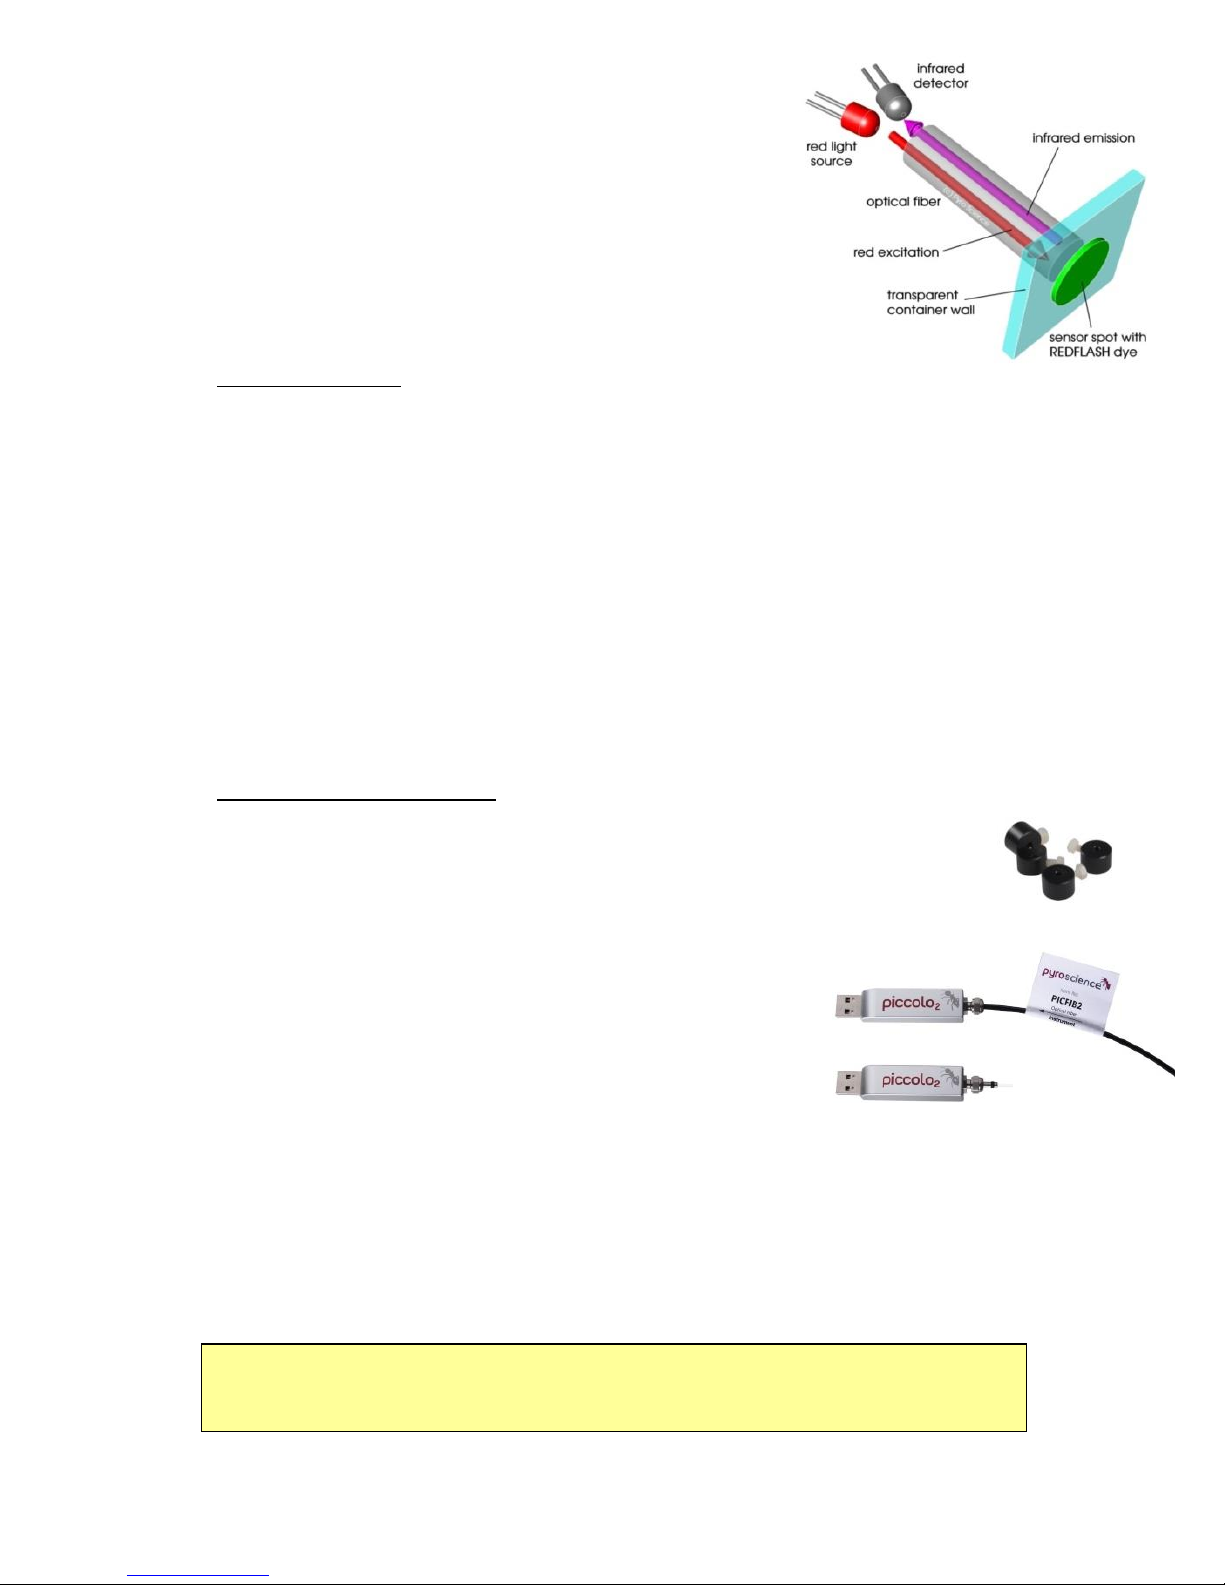
10.3 Measuring Principle
The REDFLASH technology is based on the unique oxygensensitive REDFLASH indicator showing excellent brightness. The
measuring principle is based on the quenching of the REDFLASH
indicator luminescence caused by collision between oxygen
molecules and the REDFLASH indicator immobilized on the sensor
tip or surface. The REDFLASH indicators are excitable with red
light (more precisely: orange-red at a wavelength of 610-630 nm)
and show an oxygen-dependent luminescence in the near infrared
(NIR, 760-790 nm).
The REDFLASH technology impresses by its fast response times,
high precision, high reliability, low power consumption, and low
cross-sensitivity. The red light excitation significantly reduces
Page 59

59
interferences caused by autofluorescence and reduces stress in
biological systems. The REDFLASH indicators show much higher
luminescence brightness than competing products working with
blue light excitation. Therefore, the duration of the red flash for a
single oxygen measurement could be decreased from typically 100
ms to now typically 10 ms, significantly decreasing the light dose
exposed to the measuring setup. Further, due to the excellent
luminescence brightness of the REDFLASH indicator, the actual
sensor matrix can be prepared much thinner now, leading to fast
response times of the Pyro Science oxygen sensors.
The measuring principle is based on a sinusoidally modulated red
excitation light. This results in a phase-shifted sinusoidally
modulated emission in the NIR. The Piccolo2 measures this phase
shift (termed "dphi" in the software). The phase shift is then
converted into oxygen units based on the Stern-Vollmer-Theory.
Page 60

60
10.4 Operating several Piccolo2 in parallel
The fiber-optic oxygen meter Piccolo2 offers one oxygen channel.
In order to realize extendable multichannel systems with higher
channel numbers, several Piccolo2 can be operated at a single PC
as described in the following:
Connect each Piccolo2 to a free
USB port of your PC. If the PC
does not provide a sufficient
number of USB ports, you can
use an external USB-hub.
The Pyro Oxygen Logger
software now has to be started
separately for each connected
Piccolo2. So, if you want to operate e.g. 4 different Piccolo2, you
have to start the Pyro Oxygen Logger software 4 times, which will
open 4 Pyro Oxygen Logger windows on your desktop. The
different windows operate completely independent from each
other, and each of them will be associated to exactly one Piccolo2.
In order to check which window is associated to a specific Piccolo2,
simply press the Flash Logo button in the main window of the Pyro
Oxygen Logger software, which causes a short flashing (1-2 sec.) of
the red status LED at the associated Piccolo2.
When closing the Pyro Oxygen Logger software, all settings and all
current calibration data are saved in a "setup file", which is
automatically loaded at the next startup. This setup file is saved
specifically for each Piccolo2 serial number, i.e. each Piccolo2 in
the setup described above keeps its own settings and calibration
data.
Page 61

61
10.5 Definition of Oxygen Units
phase shift dphi
The phase shift dphi is the fundamental unit measured by the
optoelectronics in the Piccolo2 (see chapter 10.3). Please note, that
dphi is not at all linearly dependent on the oxygen units, and
increasing oxygen levels correspond to decreasing dphi values,
and vice versa! As a rule of thumb, anoxic conditions will give about
dphi=53, whereby ambient air will give about dphi=20.
raw value raw value
Definition: raw value = %O2 (uncalibrated)
The unit raw value is the default unit for uncalibrated sensors and
shows qualitative oxygen sensor readings only.
partial pressure pO2 hPa = mbar
Used in: gas and water phase
For a calibrated sensor, the partial oxygen pressure pO2 in units of
hPa (equivalent to mbar) is the fundamental oxygen unit measured
by the Piccolo2.
partial pressure pO2 Torr
Definition: pO2[Torr] = pO2[hPa] x 759.96 / 1013.25
Used in: gas or water phase
volume percent pV %O2
Definition: pv = pO2[hPa] / p
atm
x 100%
Used in: gas
with p
atm
: actual barometric pressure
Page 62

62
% air saturation A % air sat
Definition: A[% a.s.] = 100% x pO2 / p100O2
Used in: water phase
with p100O2 = 0.2095 ( p
atm
– p
H2O
(T) )
p
H2O
(T) = 6.112mbar x exp ( 17.62 T[°C] / (243.12 + T[°C]))
pO2: actual partial pressure
p
atm
: actual barometric pressure
T: actual temperature
p
H2O
(T): saturated water vapor pressure at temperature T
Dissolved O2 concentration C µmol/L
Definition: C [µmol/L] = A[% a.s.] / 100% x C
100
(T,P,S)
Used in: water phase
with C
100
(T,P,S): interpolation formula for dissolved oxygen
concentration in units of µmol/L at temperature T,
atmospheric pressure P and Salinity S (see chapter 10.6).
Dissolved O2 concentration C mg/L = ppm
Definition: C [mg/L] = C [µmol/L] x 32 / 1000
Used in: water phase
Dissolved O2 concentration C mL/L
Definition: C [mL/L] = C [µmol/L] x 0.02241
Used in: water phase
Page 63

63
10.6 Table of Oxygen Solubility
The following table shows the equilibrium oxygen concentration
C
100
(T, P=1013mbar, S) in units of µmol/L at standard atmospheric
pressure of 1013 mbar as a function of water temperature in units
of °C and salinity in units of PSU ("practical salinity unit" ≈ g/L). In
order to correct these values for the actual atmospheric pressure
p
atm
, the following formula has to be applied:
C
100
(T,P,S) = C
100
(T,P=1013mbar,S) x p
atm
/ 1013mbar
References: Garcia, HE and Gordon, LI (1992)
Oxygen solubility in seawater: Better fitting equations.
Limnol. Oceanogr. 37: 1307-1312
Millero, FJ and Poisson, A (1981)
International one-atmosphere equation of state of seawater.
Deep Sea Res. 28A: 625-629
Page 64

64
Sal
(PSU)
Temp
0
(°C)
5
10 15 20 25 30 35 40
0
456.6
398.9
352.6
314.9
283.9
257.9
235.9
217.0
200.4
2
450.4
393.6
348.1
311.1
280.6
255.0
233.3
214.7
198.3
4
444.2
388.5
343.7
307.3
277.3
252.1
230.8
212.4
196.3
6
438.1
383.3
339.4
303.6
274.0
249.3
228.3
210.2
194.3
8
432.1
378.3
335.1
299.9
270.8
246.5
225.8
207.9
192.3
10
426.1
373.3
330.8
296.2
267.6
243.7
223.3
205.7
190.3
12
420.3
368.4
326.7
292.6
264.5
240.9
220.9
203.6
188.4
14
414.5
363.5
322.5
289.1
261.4
238.2
218.5
201.4
186.5
16
408.8
358.7
318.4
285.5
258.3
235.5
216.1
199.3
184.6
18
403.2
354.0
314.4
282.1
255.3
232.8
213.7
197.2
182.7
20
397.7
349.3
310.4
278.6
252.3
230.2
211.4
195.1
180.8
22
392.2
344.7
306.5
275.2
249.3
227.6
209.1
193.0
179.0
24
386.8
340.2
302.6
271.9
246.4
225.0
206.8
191.0
177.1
26
381.5
335.7
298.7
268.5
243.5
222.5
204.5
189.0
175.3
28
376.2
331.2
294.9
265.3
240.6
219.9
202.3
187.0
173.5
30
371.0
326.9
291.2
262.0
237.8
217.4
200.1
185.0
171.7
32
365.9
322.5
287.5
258.8
235.0
215.0
197.9
183.0
170.0
34
360.9
318.3
283.9
255.7
232.2
212.5
195.7
181.1
168.2
36
355.9
314.1
280.3
252.5
229.5
210.1
193.6
179.2
166.5
38
351.0
309.9
276.7
249.5
226.8
207.7
191.4
177.3
164.8
40
346.2
305.8
273.2
246.4
224.1
205.4
189.3
175.4
163.1
Page 65

65
10.7 Explanation of the Sensor Code
The oxygen sensors are delivered with an attached sensor code
which has to be entered in the Settings (refer to chapter 6.2). The
following figure gives a short explanation about the information
given in the sensor code.
Example Code: XB7-532-205
Sensor Type
LED Intensity
Amplification
Factory Calibration C0
Factory Calibration C100
Sensor Type
X Robust / Dipping Oxygen Probe (full range)
T Oxygen Sensor Spot / FTC (trace range)
S Oxygen Sensor Spot / FTC (full range)
P Oxygen Nanoprobes
LED Intensity
A 10% E 40%
B 15% F 60%
C 20% G 80%
D 30% H 100%
Amplification
4 40x 6 200x
5 80x 7 400x
Page 66

66
C0 (Factory Calibration at 0% O2)
dphi0 = C0 / 10
C100 (Factory Calibration at 100% O2)
dphi100 = C100 / 10
The values of factory calibration are valid for the following
calibration conditions:
Partial Volume of Oxygen (% O2) 20.95
Temperature at both calibration points (°C) 20.0
Air Pressure (mbar) 1013
Humidity (% RH) 0
 Loading...