

Protekdevices 90KS200C, 60KS200C Datasheet
05026
60KS200C
&
. . . engineered solutions for the transient environment™
SHIPBOARD/AC POWER BUS VOLTAGE SUPPRESSORS
APPLICATIONS
✔ A C P ower Protection
✔ Shipboard (Line-Line) Protection
✔ Differential A C P ow er Bus
✔ Aircraft AC Power Bus
FEATURES
✔
Meets the Following Military Specifications:
- DOD-STD-1399 - MIL-STD-704A
✔ 60 & 90 kilowatts P eak Pulse Power per Line (tp=1.2/50µs)
✔ Each Device 100% Tested
✔ 200 V olts Bidirectional
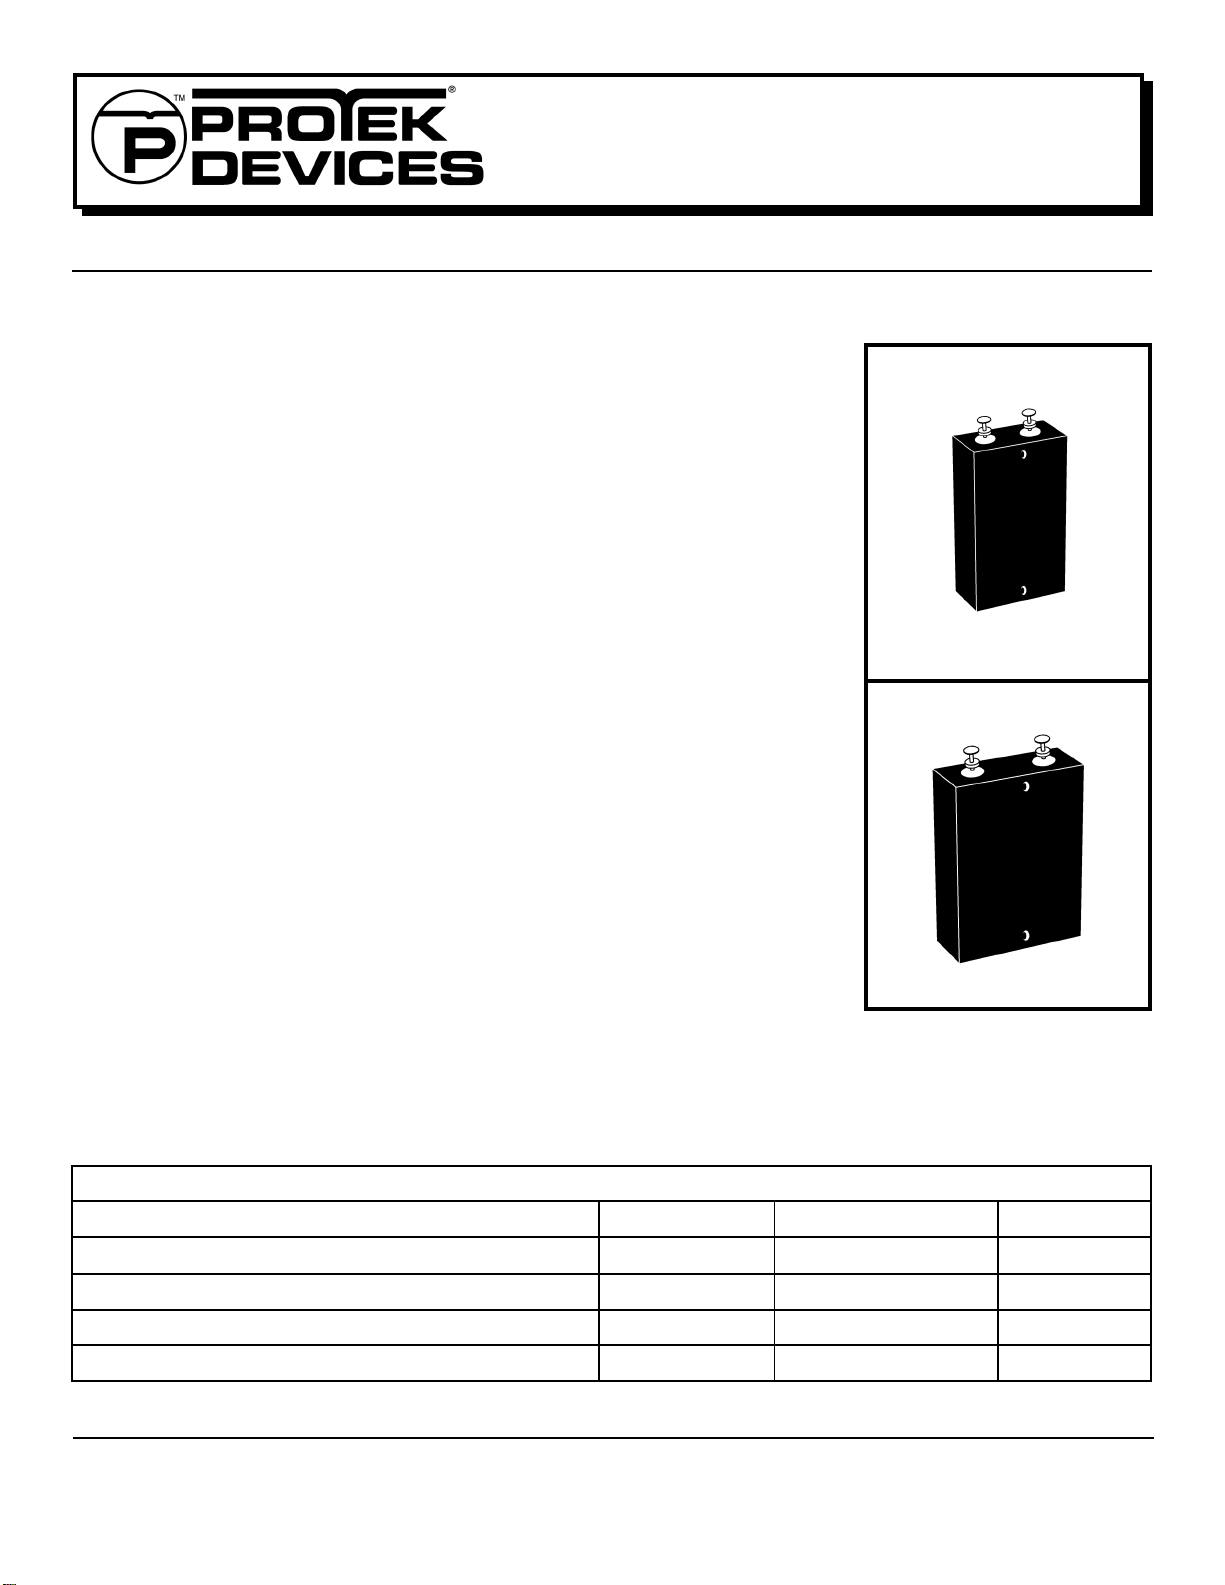
MECHANICAL CHARACTERISTICS
✔ Hermetically Sealed Glass to Metal Sub-Assemblies
✔ Weight 50 grams (Approximate)
✔ Flammability Rating UL 94V-0
✔ De vice Marking: Logo & P art Number
✔ Screening Upon Request - The 60KS & 90KS series can be screened upon
request for military requirements in accordance with MIL-PRF-19500. Standard
screening consists of 100% JANTX equivalent level testing per MIL-PRF-19500.
For Ordering Options Use the Following Suffix:
H1 - Submodule Screening
H2 - Submodule & Module Screening
H3 - Submodule & Module Screening
Module Group B & C Lot Testing
90KS200C
60,000 WATTS
60KS200C
90,000 WATTS
90KS200C
MAXIMUM RATINGS @ 25°C Unless Otherwise Specified
PARAMETER
Peak Pulse P o wer (tp = 1.2/50µs) - See Figure 1
Operating T emperature
Storage T emperature
Steady State Pow er Dissipation @ 25°C Watts10.0T
SYMBOL VALUE
P
T
T
STG
1 www.protekdevices.com05026.R2 4/02
UNITS
PP
J
A
60 & 90 kilowatts
-55°C to 150°C
-55°C to 150°C
°C
°C
60KS200C
90KS200C
DEVICE CHARACTERISTICS
ELECTRICAL CHARACTERISTICS PER LINE @ 25°C Unless Otherwise Specified
&
PART
NUMBER
60KS200C
90KS200C
RATED
STAND-OFF
VOLTAGE
V
WM
VOLTS
180
180
1,000
100
10
- Peak Pulse Power - kilowatts
PP
P
1
0.1 1 10 100 1,000 10,000
MINIMUM
BREAKDOWN
VOLTAGE
MAXIMUM
CLAMPING
VOLTAGE
(See Fig. 2)
@ 1mA
V
(BR)
VOLTS
200
200
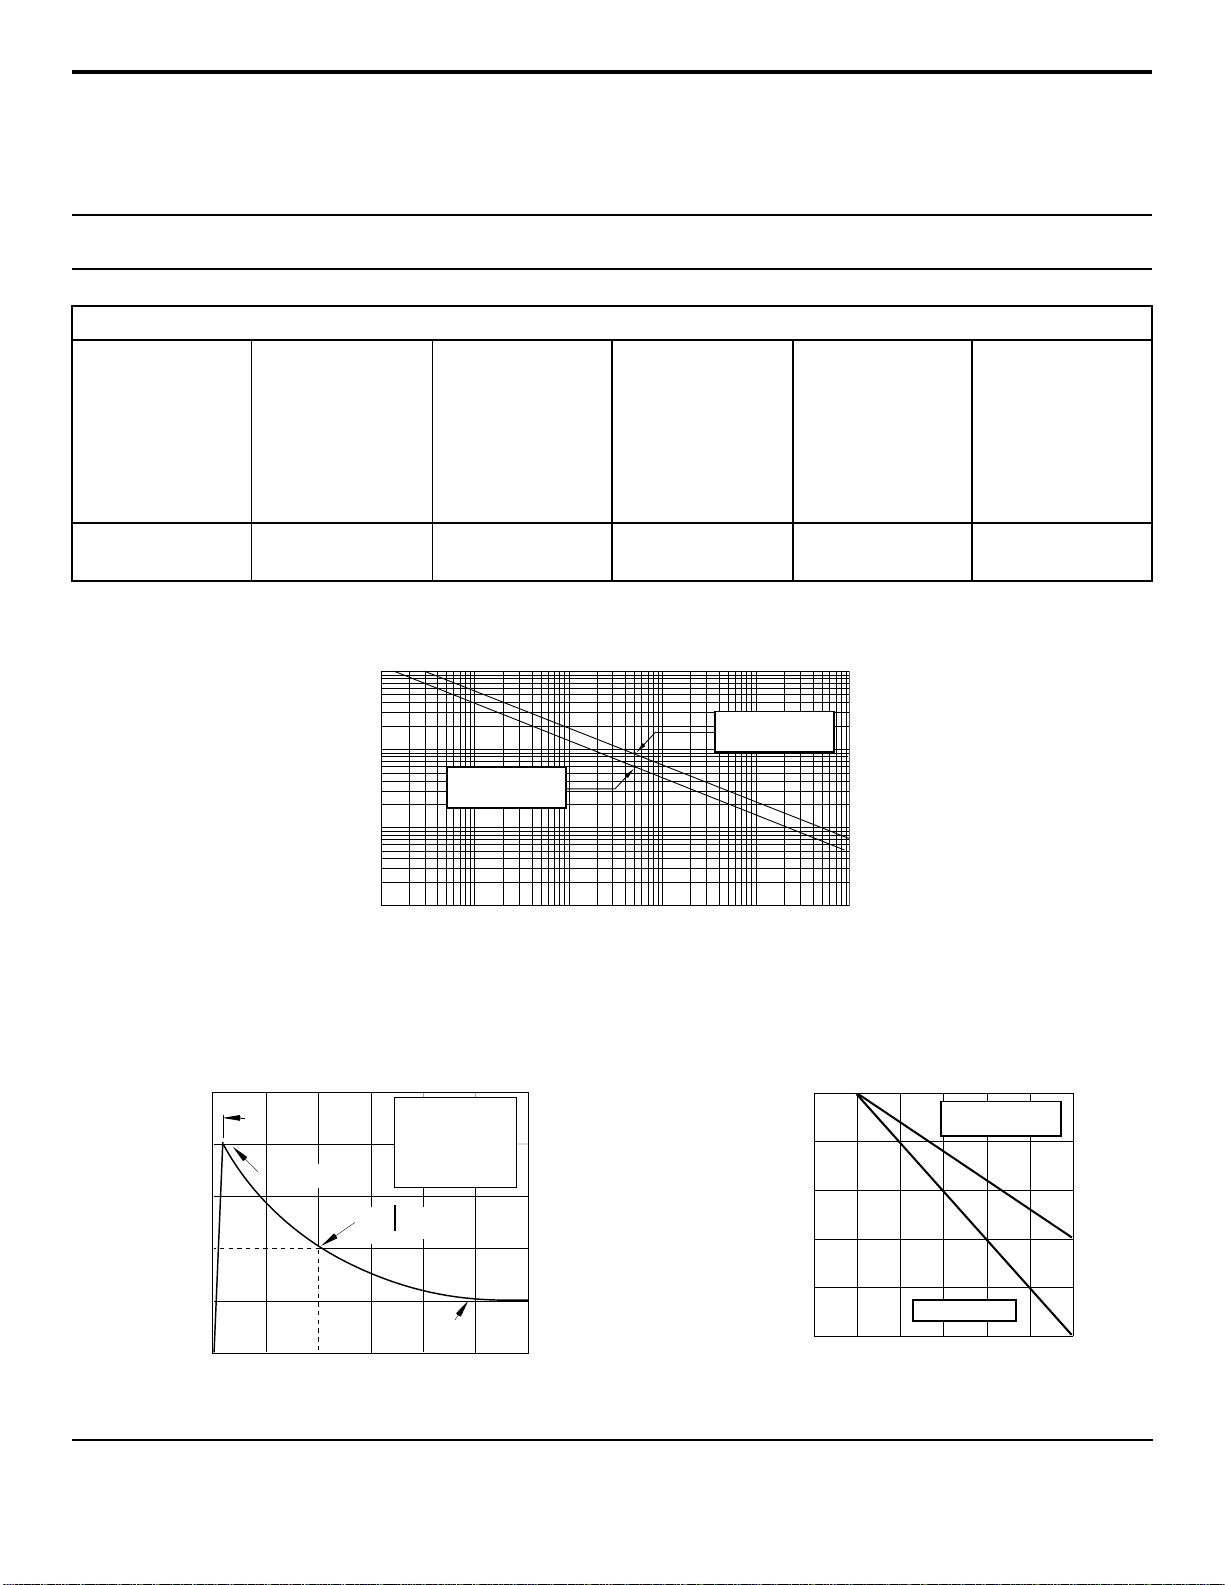
PEAK PULSE POWER VS PULSE TIME
60kW 1.2/50µs
Waveform
FIGURE 1
t
- Pulse Duration - µs
d
@ I
PP
V
C
VOLTS
335
280
90kW 1.2/50µs
Waveform
MAXIMUM
LEAKAGE
CURRENT
@V
WM
I
D
µA
10
0.5
MAXIMUM
PEAK PULSE
CURRENT
(See Fig. 2)
I
PPM
AMPS
180
180
100
PP
50
- Peak Pulse Current - % of I
PP
I
0
05026.R2 4/02
FIGURE 2
PULSE WAVE FORM
PP
td = t
TEST
WA VEFORM
P ARAMETERS
tf = 1.2µs
td = 50µs
IPP/2
-t
e
t
f
Peak V alue I
0 1 2 3
t - Time - µs
POWER DERATING CURVE
FIGURE 3
100
80
60
40
% Of Rated Power
20
0
0 25 50 75 100 125 150
2 www.protekdevices.com
- Lead Temperature - °C
T
L
Peak Pulse Power
1.2/50µs
Average Power
 Loading...