

Page 1

Page 2

INTRODUCTION ................................................................................ 6
FIRMWARE VERSIONS ....................................................................... 6
SAFETY INSTRUCTIONS ..................................................................... 7
CERTIFICATE .................................................................................. 11
1 GENERAL OVERVIEW ............................................................... 12
1.1 Description ....................................................................... 13
1.2 Specifications ................................................................... 13
1.2.1 Basic Specifications .................................................... 13
1.2.2 Key Measurements ..................................................... 15
1.2.3 Key Features .............................................................. 15
1.3 The Layout of A434L ......................................................... 16
1.4 Ordering Information ........................................................ 17
1.4.1 Standard Accessories .................................................. 17
1.4.2 Options ..................................................................... 19
2 PREPARATION FOR USE ........................................................... 21
2.1 General Information .......................................................... 21
2.2 Power Adaptor ................................................................. 21
2.3 Battery ............................................................................. 22
2.3.1 Caution ..................................................................... 23
2.3.2 Installing a Battery...................................................... 24
2.3.3 Charging a Battery ..................................................... 25
2.3.4 Battery Low ............................................................... 25
2.3.5 Battery Power Off ...................................................... 26
2
Page 3

2.4 Front Panel ....................................................................... 27
2.4.1 Key Layout ................................................................ 27
2.4.2 ① Function Hard ........................................................ 28
2.4.3 ② Soft Keys ............................................................... 28
2.4.4 ③ Power Switch Key .................................................. 28
2.4.5 ④ Multi Keys ............................................................. 29
2.4.6 ⑤ ESC, Back, Arrow Keys ............................................ 33
2.4.7 ⑥ Enter Keys ............................................................. 34
2.4.8 ⑦ Knob Keys ............................................................. 35
2.4.9 Display ...................................................................... 35
2.5 Upper Panel ..................................................................... 36
2.5.1 DC Power Connector.................................................. 37
2.5.2 RF OUT/Reflection ...................................................... 37
2.5.3 Ethernet Port ............................................................. 37
2.5.4 USB Port ................................................................... 38
2.6 FAN ................................................................................. 38
2.6.1 FAN Operation .......................................................... 38
2.6.2 FAN alarm ................................................................. 38
3 GETTING STARTED .................................................................. 40
3.1 Power Up ......................................................................... 41
3.1.1 Initialization ............................................................... 41
3.1.2 System Information .................................................... 42
3.2 Layout of the Display Screen .............................................. 43
3.3 Function Hard Keys Structure ............................................. 45
3.3.1 System Screen Menu .................................................. 46
3.3.2 Common Menu ......................................................... 47
3.3.3 VSWR Menu .............................................................. 52
3.3.4 DTF Menu ................................................................. 54
3.3.5 Cable Loss Menu........................................................ 55
3.3.6 Power Meter Menu .................................................... 57
3.4 System Key ....................................................................... 58
3
Page 4

3.5 Multi Keys ........................................................................ 60
3.5.1 Numeric Data Entry .................................................... 61
3.5.2 Specific Function Keys ................................................ 61
4 MEASUREMENT DATA ANALYSIS.............................................. 70
4.1 VSWR .............................................................................. 71
4.1.1 VSWR Display Description ........................................... 71
4.1.2 Setting Frequency ...................................................... 74
4.1.3 Calibration ................................................................ 75
4.1.4 VSWR Measurement .................................................. 77
4.1.4.1 Setting Trace Point .............................................. 79
4.1.4.2 Scale Adjustment ................................................ 79
4.1.4.3 Using Markers .................................................... 79
4.1.4.4 Limit Line ........................................................... 80
4.2 DTF ................................................................................. 81
4.2.1 DTF Display Description .............................................. 81
4.2.2 DTF Setup ................................................................. 83
4.2.3 Calibration ................................................................ 85
4.2.4 DTF Measurement...................................................... 87
4.2.4.1 Scale Adjustment ................................................ 88
4.2.4.2 Using Markers .................................................... 89
4.2.4.3 Windowing ........................................................ 89
4.3 Cable Loss ........................................................................ 91
4.3.1 Cable Loss Display Description ..................................... 91
4.3.2 Setting Frequency ...................................................... 92
4.3.3 Calibration ................................................................ 93
4.3.4 Cable Loss Measurement ............................................ 95
4.3.4.1 Scale Adjustment ................................................ 96
4.3.4.2 Using Markers .................................................... 96
4.4 Power Meter .................................................................... 97
4.4.1 Connecting Sensors.................................................... 97
4.4.2 Setting Power Meter .................................................. 99
4.4.3 Power Measurement ................................................ 100
4
Page 5

4.5 Save & Load ................................................................... 101
4.5.1 Save ....................................................................... 101
4.5.1.1 Save Trace ........................................................ 102
4.5.1.2 Save Screen ...................................................... 103
4.5.1.3 Save State ........................................................ 104
4.5.2 Load ....................................................................... 105
4.5.2.1 Load Trace ....................................................... 105
4.5.2.2 Load Screen ...................................................... 107
4.5.2.3 Load State ........................................................ 107
4.5.2.4 Memory Type ................................................... 107
5 SOFTWARE UPGRADE............................................................ 108
5.1 Upgrade Method ............................................................ 109
6 WARRANTY INFORMATION .................................................... 113
Appendix 1 — Band List ................................................................. 117
Appendix 2 — Cable List ................................................................ 125
5
Page 6

This Operating Manual represents design, specifications, overview of
functions, and detailed operation procedure of A434L RF master, to ensure
effective and safe use of the technical capabilities of the instrument by the
user.
RF Master operation and maintenance should be performed by qualified
engineers with initial experience in operating of microwave circuits and PC.
The following abbreviations are used in this Manual:
PC – Personal Computer
DUT – Device Under Test
IF – Intermediate Frequency
CW – Continuous Wave
SWR – Standing Wave Ratio
The first edition of this Operating Manual applies directly to instruments that
have the firmware version 1.xx.
6
Page 7

Carefully read through the following safety instructions before putting the
Analyzer into operation. Observe all the precautions and warnings provided
in this Manual for all the phases of operation, service, and repair of the
Analyzer.
The Analyzer must be used only by skilled and specialized staff or thoroughly
trained personnel with the required skills and knowledge of safety
precautions.
A434L complies with INSTALLATION CATEGORY II as well as POLLUTION
DEGREE 2 in IEC61010–1.
A434L is MEASUREMENT CATEGORY I (CAT I). Do not use for CAT II, III, or
IV.
A434L is for INDOOR USE only.
A434L is tested in stand-alone condition or in combination with the
accessories supplied by GS INSTRUMENTS CO., LTD. against the
requirement of the standards described in the Declaration of Conformity. If
it is used as a system component, compliance of related regulations and
safety requirements are to be confirmed by the builder of the system.
N
Never operate the Analyzer in the environment containing inflammable
gasses or fumes.
Operators must not remove the cover or part of the housing. The Analyzer
must not be repaired by the operator. Component replacement or internal
adjustment must be performed by qualified maintenance personnel only.
Never operate the Analyzer if the power cable is damaged.
Never connect the test terminals to mains.
7
Page 8

Electrostatic discharge can damage your Analyzer when connected or
disconnected from the DUT. Static charge can build up on your body and
damage the sensitive circuits of internal components of both the Analyzer
and the DUT. To avoid damage from electric discharge, observe the
following:
- Always use a desktop anti-static mat under the DUT.
- Always wear a grounding wrist strap connected to the desktop
anti-static mat via daisy-chained 1 MΩ resistor.
- Connect clamp on the body of the Analyzer to the body of
the DUT before you start operation.
Observe all the general safety precautions related to operation of equipment
powered by mains.
The protection provided by the equipment may be impaired if the
equipment is used in a manner not specified by the manufacturer.The
definitions of safety symbols used on the instrument or in the Manual are
listed below.
Storage
Before first use store your equipment in the factory package at
environment temperature from 0 to +50 ºС and relative humidity up to
95% (at 25ºС).
After you have removed the factory package store the equipment at
environment temperature from +10 to +35 ºС and relative humidity up
to 80% (at 25ºС).
Ensure to keep the storage facilities free from dust, fumes of acids and
alkalies, aggressive gases, and other chemicals, which can cause corrosion.
8
Page 9

Moderate Ventilation
Environment
Ambient temperature 2ºС to 50ºС
Maximum 80% RH between 2ºС and 31ºС,
decreasing to 50% RH at 50ºС
Maximum altitude 2,000m
MAINS supply voltage fluctuations up to 10% of the
nominal voltage
Transient over-voltages according to installation
category II
Pollution degree 2
IPX0
Refers to the Manual if the instrument is
marked with this symbol.
Alternating current.
Direct current.
On (Supply).
Off (Supply).
Maintain moderate ventilation condition to prevent overheating of the
product.
Warning
Never perform cleaning of the instrument if the power cable is connected
to the power outlet.Never clean the internal components of the instrument.
N
Do not position the equipment so that it is difficult to operate the power
cord.
9
Page 10

A chassis terminal; a connection to the
instrument’s chassis, which includes all exposed
metal structure.
CAUTION
This sign denotes a hazard. It calls attention to a
procedure, practice, or condition that, if not
correctly performed or adhered to, could result
in injury or death to personnel.
CAUTION
This sign denotes a hazard. It calls attention to a
procedure, practice, or condition that, if not
correctly performed or adhered to, could result
in damage to or destruction of part or the entire
instrument.
Note
This sign denotes important information. It calls
attention to a procedure, practice, or condition
that is essential for the user to understand.
10
Page 11

CERTIFICATE
11
Page 12

1
GENERAL
OVERVIEW
OPERATING
MANUAL
Page 13

Item
Sub Item
Specification
General
Max Input Power
+25dBm Damage level
Frequency Range
5MHz to 4GHz
Frequency Accuracy
< ±3ppm
Frequency Resolution
10kHz
Impedance
50Ω
Scan Speed
< 1msec /data point
Display
Single & Dual mode
Test port
N Female
1.
1.1 Description
A large number of cell site problems are caused by the antenna system,
cable, or connectors. It is important to have the right instrument available
when either servicing or certifying cell sites for operation.
The Protek A434L RF master is a lightweight portable diagnostic tool for an
accurate detection of operational problems. The Protek A434L has all the
measurement functions necessary to accurately verify the antenna system
from VSWR to power measurements. In addition, the Protek A434L makes
distance-to-fault measurements to accurately pinpoint the fault's location.
The Protek A434L user interface is with a front keypad and a TFT color, 7inch display providing ease of use and control. The application specific
software allows the user to easily compare and analyze measurements and
generate comprehensive reports. The Protek A434L is equipped with a
rechargeable and infield installable lithium-ion battery providing over four
hours of operation.
1.2 Specifications
1.2.1 Basic Specifications
13
Page 14
Test curve storage
Internal : Minimum 512MB
External : Limited by size of USB
(32G)
Screen storage
Setup storage
VSWR
Number of data points
126, 251, 501, 1001, 2001
Return loss Range
0 to -60dB
VSWR Range
1 to 65
Cable Loss
Cable loss range
0 to -30dB, 0.01dB Resolution
Interference
Immunity
On-Frequency
+10dBm
On-Channel
+20dBm
DTF
Return Loss Display
Range
0 to 60dB
Distance Range
0 to 1250m (4125ft)
VSWR Display Range
0 to 65
Miscellaneous
Dimension
260X193X67mm
Weight
<2.45Kg include battery
A434L Voltage and
Current
12Vd.c., 3.5A
Adaptor
AC Input
100 to 250Vd.c., 1.5A
DC
Output
12Vd.c., 5A
Battery
Li-lon (4hr operating time after
full charging), 12Vd.c.,
7600mAh
Environmental
Operating Temperature
0°C ~ +50°C
Storage Temperature
-40°C ~ +80°C (-40°F ~ +176°F)
Humidity
95%R.H. NO Condensation
Degree of protection
IPX0
Power
Meter(Option)
Frequency Range
20MHz to 3.8GHz
Sensor Type
Average
Peak Power Sensor
-40dBm to +10dBm
Accuracy
±7%
Test Port
Precision N Female
14
Table 1.1 Basic Specifications
Page 15

1.2.2 Key Measurements
High resolution VSWR Measurements
Distance to Fault (DTF) Measurements
Cable Loss Measurements
RMS Power Measurements (optional)
1.2.3 Key Features
Rechargeable and infield replaceable lithium-ion battery
Built-in world-wide signal standards and frequency
channels
7 Inch TFT color display viewable in daylight
Dual display to view multiple measurements
simultaneously to reduce test time
Easy front keypad operation
Superior immunity to RF interference
Up to 2001 data points to locate long range problems
Built-in cable menus containing >90 cables’
characteristics
User friendly menu structure
Saves up to Memory (user setups, traces, screens)
Alphanumeric labeling of saved data
Automatic Time/Date stamp of saved data
USB Port (USB 2.0)
Remote firmware upgrade capability
15
Page 16

Fast one-touch selection of menu item or positioning
Smart Battery management can be check Battery
Rechargeable and field replaceable Lithium Ion battery
Backlight keypad for easier use in dark environments
Sun-Light Readable LCD for readability
1.3 The Layout of A434L
marker
capability
with more than 4 hours operation time
16
Figure 1.1 A434L Front Panel
Page 17

Figure 1.2 A434L Rear Panel
Figure 1.3 A434L Upper Panel
1.4 Ordering Information
1.4.1 Standard Accessories
The standard accessories supplied with the A434L RF Master are as
follows:
17
Page 18
Description
Picture
Specification
Soft Carrying Case
AC-DC Adapter
Input: 100 ~ 240Va.c.,
1.5A
Output: 12Vd.c., 5A
Neck Strap
Hand Strap
Li-ion Battery
Output: 8.4Vd.c. MAX,
7800mAh
User’s Manual
Hard Copy
18
Page 19

Description
Picture
Specification
Power Sensor
(Part No: S134)
Frequency Range
: 20MHz to 3.8GHz
Sensor Type : Average
Peak Power Sensor
: -40dBm to +10dBm
Accuracy : ±7%
Test Port : Precision N
Female
Battery Charger
(Part No: C122R5)
Input: 100 ~ 240Va.c.,
1.5A
Output: 12Vd.c., 5A
1.4.2 Options
The options supplied with the A434L RF Master are as follows:
19
Page 20

2
PREPARATION FOR
USE
OPERATING
MANUAL
Page 21

2.
2.1 General Information
Unpack the Analyzer and other accessories. Check the contents of the
package against the list specified in section 1.4.1. Connect your A434L to
the AD-DC Adaptor(12Vd.c., 5A) or Li-ion Battery(8.4Vd.c. MAX, 7800mAh)
power source by means of the Power Cable supplied with the instrument.
Warm-up the Analyzer for 20 minutes after turning the power on.
Assemble the test setup using cables, connectors, fixtures, etc, which allow
DUT connection to the Analyzer.
Perform calibration of the Analyzer. Calibration procedure is described in
section 4.1.3.
2.2 Power Adaptor
The equipment uses following power supply.
Product: Switching Power Supply Adaptor
Model no. FSP060-DBAE1
AC INPUT: 100-240Va.c.~, 1.5A, 50-60Hz
DC OUTPUT: 12.0Vd.c. 5.0A MAX
Manufactured by: Zhonghan Electronics (Shenzhen)
Trade mark: FSP GROUPINCUC
21
Page 22

2.3 Battery
A434L use CE, UL Certificated PBP-7800 Battery.
Figure 2.1 A434L Battery
CAUTION
RISK OF EXPLOSIOM IF BATTERY IS REPLACED BY AN INCORRECT TYPE.
DISPOSE OF USED BATTERIES ACCORDING TO THE MANUFACTURER’S
INSTRUCTIONS.
22
Page 23

① If the “push” button on the battery is pressed, the remained
battery volume will be displayed in the battery icon next to the
“push” button.
② Each level of the battery indicator takes 20% of the battery
portion. If the battery level is three, it means the battery is
charged 40% - 60%.
③ As illustrated below, please insert the battery pack while the
printed label is on the upside.
④ Non rechargeable Li-Ion battery was in analyzer.
⑤ This non rechargeable Li-Ion battery is CR02032.(made by Hitachi
Maxwell Ltd)
2.3.1
Caution
① Avoid placing the battery pack near heating sources of on the
place near windows.
② Do not store the battery pack in the high humidity.
③ If the battery is unused for a long time, separate it from the unit.
④ Keep this battery pack away from children
⑤ If electrolyte from the battery pack is leaking or the battery pack
smells strangely, keep the battery pack away from fire.
⑥ In case that electrolyte from the battery pack is touched by any
part of the human body, wash it immediately and go to hospital
to prevent potential damage.
⑦ Use the authorized charger only.
⑧ Do not abandon the battery pack in the car in the summer.
⑨ Avoid any shock to the battery pack.
⑩ Do not replace non rechargeable Li-Ion battery except for
certified person.
⑪ This battery has about ten-month warranty.
23
Page 24

1
Open the battery cover.
2
Insert the battery (Observe correct battery polarity orientation
when installing).
3
Close the battery cover.
2.3.2
Installing a Battery
Caution: Full charge the battery before first using the analyzer.
Figure 2.2 A434L Right Side View
24
Page 25

1
Insert the battery in the analyzer.
2
Plug in the AC- DC adapter and switch on the external power.
3
The charge indicator icon on the screen, indicating that the
battery is charging and is fully charged.
2.3.3
Charging a Battery
You may charge the battery both in the analyzer and in the external battery
charger.
During charging and discharging, the battery voltage, current, and
temperature are monitored. If any of the monitored conditions exceed their
safety limits, the battery will terminate any further charging or discharging
until the error condition is corrected.
2.3.4
Battery Low
If A434L runs out of battery, the following message will appear on the
display.
25
Page 26

Figure 2.3 Battery 10% or Battery 5% Screen Display
2.3.5
Battery Power Off
If the battery power is lower than 1%, the following message will appear
on the display, and the Power will be Off.
26
Figure 2.4 Battery Power Off Screen Display
Page 27

2.4 Front Panel
The front view of A434L is represented in figure 1.1. The front panel is
equipped with the following parts:
2.4.1
Key Layout
Figure 2.5 A434L Key Layout
27
Page 28

«VSWR» Activates the VSWR
measurement mode.
«DTF» Activates the DTF measurement mode.
«Cable Loss» Activates the Cable Loss
measurement mode.
«Power Meter» Activates the RF Power
measurement mode. An optional power sensor
must be connected to the instrument before
using this function
«System» Opens the system screen menu.
«CAL» Opens the calibration screen menu.
2.4.2 ① Function Hard keys
The six hard keys are located at the left of the display. The function of each
key is indicated on each key. Depending on the selection of Hard Keys, the
functions shown in the screen menu may vary.
2.4.3 ② Soft Keys
The six keys at the right of the display are the Soft Keys.
28
Page 29
Each Soft Key has a function which varies
depending on the operation mode. The
function of each key is displayed at the right
side of the display as a screen menu. As the
LCD is touch-screen, the function can be
selected by touching the screen menu.
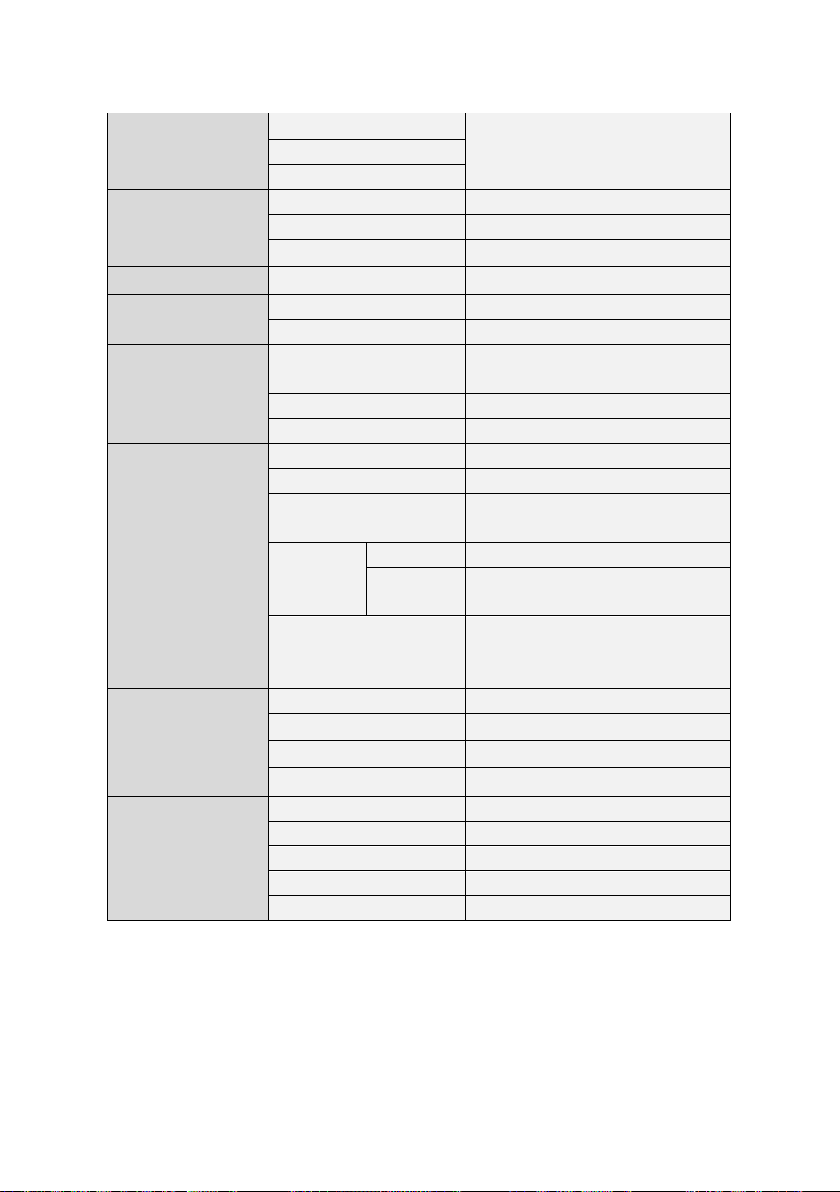
«Power Switch» toggles between On and
Off states of the Analyzer.
Note
Holding the key for more than 3 seconds
on an operating Analyzer will turn off the
power supply
CAUTION
Do not disconnect the power cable from
the mains when the Analyzer is operating.
This can damage the Analyzer software.
2.4.4 ③ Power Switch Key
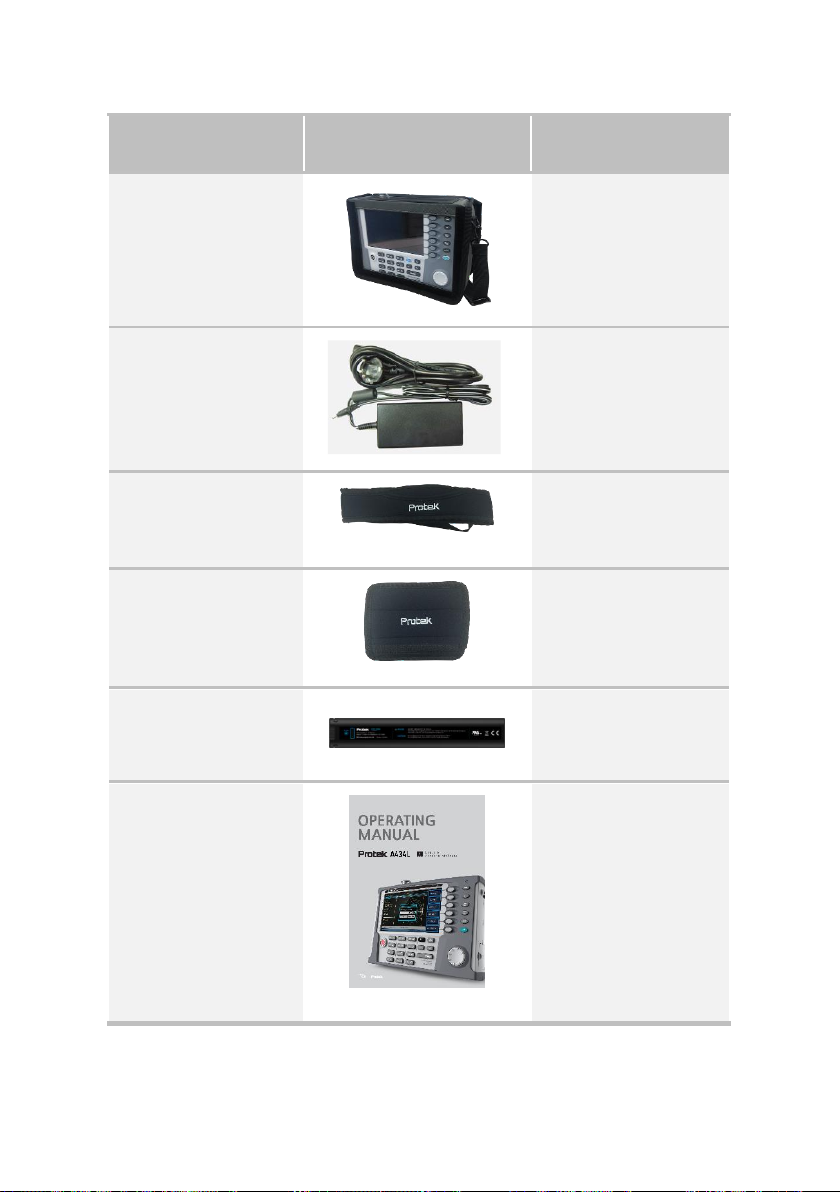
2.4.5 ④ Multi Keys
Enter values printed on the keys when a value input pop-up window is
prompted on the screen. Open a menu linked with the functions in blue or
directly perform the specified function.
29
Page 30
«Numeric & specific
function» key
Multi keys operate as follows when a user
is prompted to input values by pop-up
window.
Numeric keys from 0 to 9 are used
to input user setting numbers.
The plus/minus (+/-) key is used to
assign positive or negative
numbers in the user settings.
The period key (.) is used to input
numbers with decimal points.
Multi keys are used in VSWR, DTF, and
Cable Loss measurement mode. Unless
otherwise specified, multi keys do not
support Power Meter mode.
«0»…«9», «.» keys
...
«0»…«9», numeric keys and decimal
point used for entry of decimal numbers at
the cursor location.
«±» key
«±» key is used to change the sign of a
decimal number.
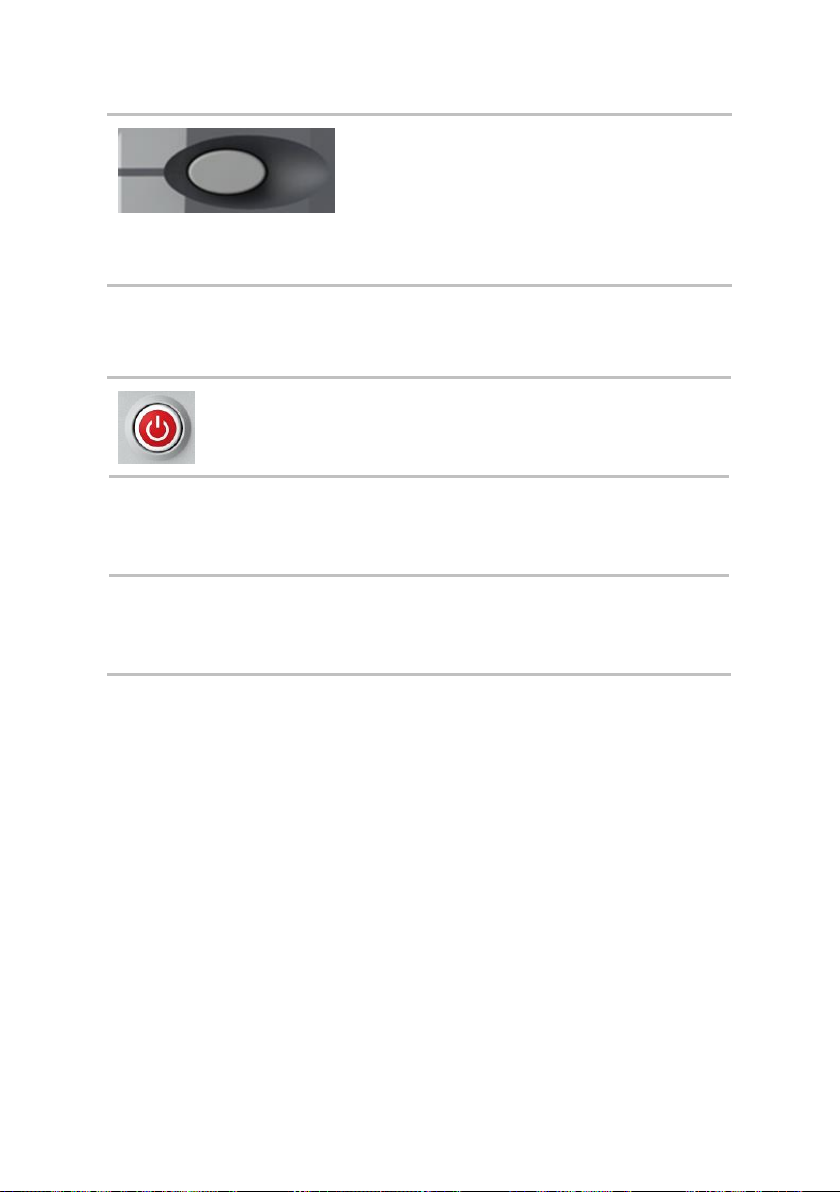
«Auto Scale» key
«Auto Scale» The instrument can
automatically set the scale to the
minimum and maximum values of a
measurement on the Y-axis of the
graph for optimum display of the
traces. Every time AUTO SCALE key is
pressed, the top and bottom scales
are set to the minimum and maximum
values with margin on the Y-axis of
the screen display.
30
Page 31

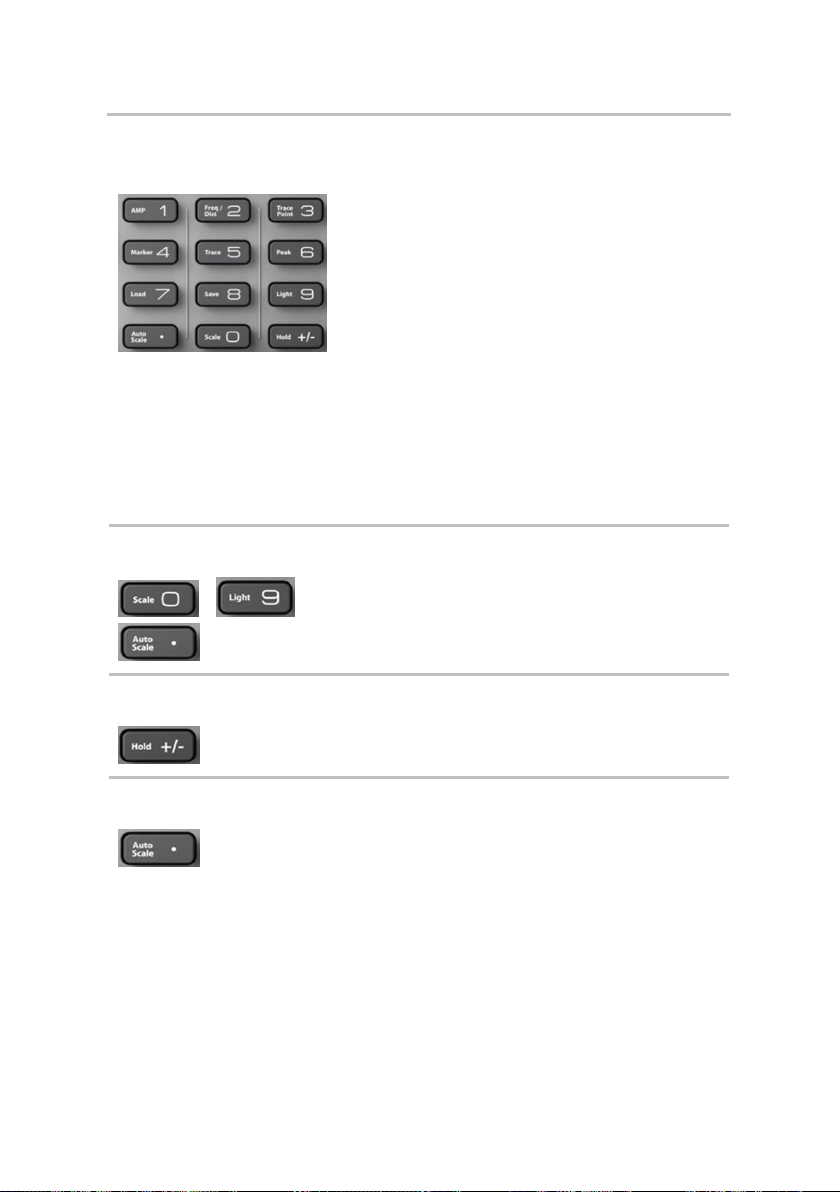
«AMP» key
«AMP» AMP (amplitude) defines a
manual setting for the scale on the Yaxis of the graph. It can be selected in
VSWR, DTF, and Cable Loss
measurement mode.
«Freq/Dist» key
«Freq/Dist» key causes different
screen menu to be displayed
depending on a measurement mode.
In VSWR or Cable Loss measurement
modes it opens a frequency screen
menu and in DTF measurement mode
it opens a distance screen menu.
«Trace Point» key
«Trace Point» Trace point is used to
select the number of data points to
take during a VSWR and Cable Loss
measurement mode. There are four
data points available: 126, 251, 501,
1001 and 2001. The default number
of trace points is 1001.
«Marker» key
«Marker» A marker is used to get
the data on the specific point of a
trace. A total of six markers can be
displayed on the screen and each
marker can be assigned
independently. Placing a marker on
the trace displays the marker’s Y
coordinates next to the marker’s
position. If the marker table is turned
on, both X and Y coordinates of all
activated markers are displayed.
31
Page 32

«Trace» key
«Trace» key enables for selection of
active channel and trace. Active
channel is a channel, which accepts
the channel parameter setting
commands. Active trace is similarly a
trace, which accepts the trace
parameter setting commands. Before
sending commands to change a
channel or a trace settings, activate
the channel or trace,
«Peak» key
«Peak» This key is used to find the
peak value of a trace. Pressing this key
leads to the activation of Marker CH1
and places the marker to the peak
point of the trace.
«Load» key
«Load» key enables for recalling of
the Trace, Screen, and State.
«Save» key
«Save» key enables for saving of the
Trace, Screen, and State.
«Light» key
«Light» This key is used to adjust the
brightness of the LCD display.
Adjustment can be made from 0 to
100% and the default setting is 50%.
32
Page 33

«Scale» key
«Scale» This key is used to select a
unit of Y axis of the graph in VSWR
and DTF measurement modes. Either
VSWR or Return Loss can be selected.
In Cable Loss measurement mode,
Return Loss only can be selected.
«Hold» key
«Hold» This key is used to pause a
sweep in all measurement modes.
«ESC» key
«ESC» key is used for the following:
If there is an active data entry
field, this key cancels all
the data entered in the
field and restores the value
of the field as it was before
any new numbers or
characters were entered.
If there is no active data entry
field, this key brings the
user back to an upper level
of the soft key menu.
2.4.6 ⑤ ESC, Back, Arrow Keys
33
Page 34

«Back» key
«Back»
Delete a character or number.
«Arrow» key
«Arrow» key is used for the
following:
Moves a marker position or
highlighted selection bar
one point at a time.
«ENTER» key
«ENTER» key is used for the
following:
If there is an active data
entry field, this key
completes the entry
process and assigns the
new value to the field.
If there is no active data
entry field, this key
enables the function of
a highlighted soft key.
2.4.7 ⑥ Enter Keys
34
Page 35

«Knob» key
«Knob» The rotary knob is used for
the following:
Move an active marker or a
highlighted selection bar in
the list.
The Analyzer is equipped with 7” color LCD. The display can come
complete with a touch screen (TS option). The touch screen LCD allows
manipulating the Analyzer by touching the LCD screen directly with a
finger.
CAUTION
Do not press the touch screen with a
pen, screwdriver or any other sharp-
pointed object. This can damage the
touch screen.
2.4.8 ⑦ Knob Keys
2.4.9 Display
35
Page 36

The display consists of the control elements and area for measurement result
indication.
The main control element of the display is a vertical soft key menu bar in the right-
hand part of the screen.
The soft key menu bar consists of program soft key panels, which appear one
instead of the other on the screen. Each panel represents one of the submenus of
the soft key menu. All the panels are integrated into multilevel menu system and
allow access to all the functions of the Analyzer.
Note
The top line of the screen represents
the menu bar, which enables you direct
access to the submenus of the soft key
menu. This menu is an auxiliary one and
can be hidden.
2.5 Upper Panel
All Input/Output ports of the Protek A434L are located on the upside of
the instrument as shown in Figure 2.6
36
Figure 2.6 A434L Upper Panel
Page 37

Provides input for the DC power
source via an AC-DC adapter.
In case of emergency, to avoid danger
of electric shock or the like, pull the
power cable out of the power outlet
or the DC power connector of the
instrument.
Output(Accepts) an internal(external)
output(input) with a frequency range from
5MHz to 4GHz.
50ohm N-type RF Connector, maximum
allowable input is +25dBm.
Ethernet port allows the user to connect the
Analyzer to a LAN (Local Area Network).
This connection enables the user to control
the instrument using an external PC. Used
for upgrading the instrument’s firmware.
10BASE-T & 100BASE-TX support
CAT5e UTP Cable uses
2.5.1 DC Power Connector
2.5.2 RF OUT/Reflection
2.5.3 Ethernet Port
37
Page 38

USB ports allow connection of various
external USB compatible devices, such as
flash memory stick and Power Sensor. Used
for either saving measurement data or an
optional external power sensor.
5Vd.c. , 500mA
Type A
2.5.4 USB Port
2.6 FAN
2.6.1 FAN Operation
FAN operates if the internal temperature of the system rises.
The FAN is ON when the temperature is higher than 70.0℃
The FAN is OFF when the temperature is lower than 65.0℃
2.6.2 FAN Alarm
The message of “Fan check required!!!” will be indicated in the bottom left
corner of the displaye if the FAN does not properly operates.
38
Page 39

Figure 2.7 FAN Alarm Screen Display
39
Page 40

3
GETTING STARTED
OPERATING
MANUAL
Page 41

3.
3.1 Power Up
3.1.1
Initialization
The initialization screen (Figure 3.1) appears when the instrument is started
with the indication “System Initialization”. After a successful initialization,
data loading and self-test, the VSWR measurement screen appears.
41
Page 42

Figure 3.1 Boot Logo / Initialization Screen
3.1.2
System Information
Before using the instrument, verify the firmware’s version and status of the
instrument.
Firmware version: For the instrument’s best performance, make
sure the latest version of firmware has been installed. Information
about the latest firmware can be located at www.gsi-protek.com
Verify the system temperature is within the instrument operating
range. Depending on the storage condition, the temperature of the
instrument at power up may be out of normal operating range in
winter or summer season. Measurements over the operating
temperature range may be out of resolution.
42
Page 43

Figure 3.2 System Screen
3.2 Layout of the Display Screen
Figure 3.3 Display Screen
43
Page 44

Indicates the instrument is using an external power supply.
The internal battery is charged when an external power
supply is connected.
Indicates the instrument is using the internal battery and
shows the remaining battery capacity.
Battery Off Icon: This icon appears when a battery is not
installed in the instrument.
Battery Gauge: Indicates the status of the internal battery
Measurement Mode: Indicates a current measurement mode. The
selected mode is displayed in dark blue.
Date and Time: Indicates the system clock information.
Screen Menu set: Indicates the set of screen menu selections.
Screen Menu: Indicates the selectable screen menu. Selection of
the menu can be made by pressing the soft key or touching the
screen menu directly.
Trace Information
Calibration On/Off Status
Calibration Information: Calibrated frequency band and timing
Trace Points
Y Scale Unit
Trace Average (applicable to VSWR and Cable Loss
measurement mode only) before using the instrument, verify
the firmware’s version and status of the instrument.
44
Page 45
Span
Band Name
Cable Name (applicable to DTF measurement mode only)
Max D: Maximum measurement distance limited by user
frequency setting
VT (Relative Propagation Velocity), CL (Cable Loss) – applicable
to DTF measurement mode only
Message window: Displays the result of performed functions or
error messages.
3.3 Function Hard Keys Structure
Function hard keys on the front panel of the instrument are used to select
measurement modes or perform specified functions. Refer to the following
sections for the key structure to be used in each measurement modes.
Figure 3.4 Function Hard Key
45
Page 46

Function Key
Screen Menu
1st Layer
2nd Layer
3rd Layer
4th Layer
SYSTEM
Upgrade
Confirm
No
Beep
OFF ON
Sweep Mode
Conti
Sing
Instrument
Setting >>
Language >>
English
Return
Date/Time >>
Date Format
YMD MDY
DMY
Set Date
Set Time
Return
LAN >>
Apply
IP Addr
10.10.10.73
Net Mask
255.255.255.0
Gateway
10.10.10.1
Return
Alignment
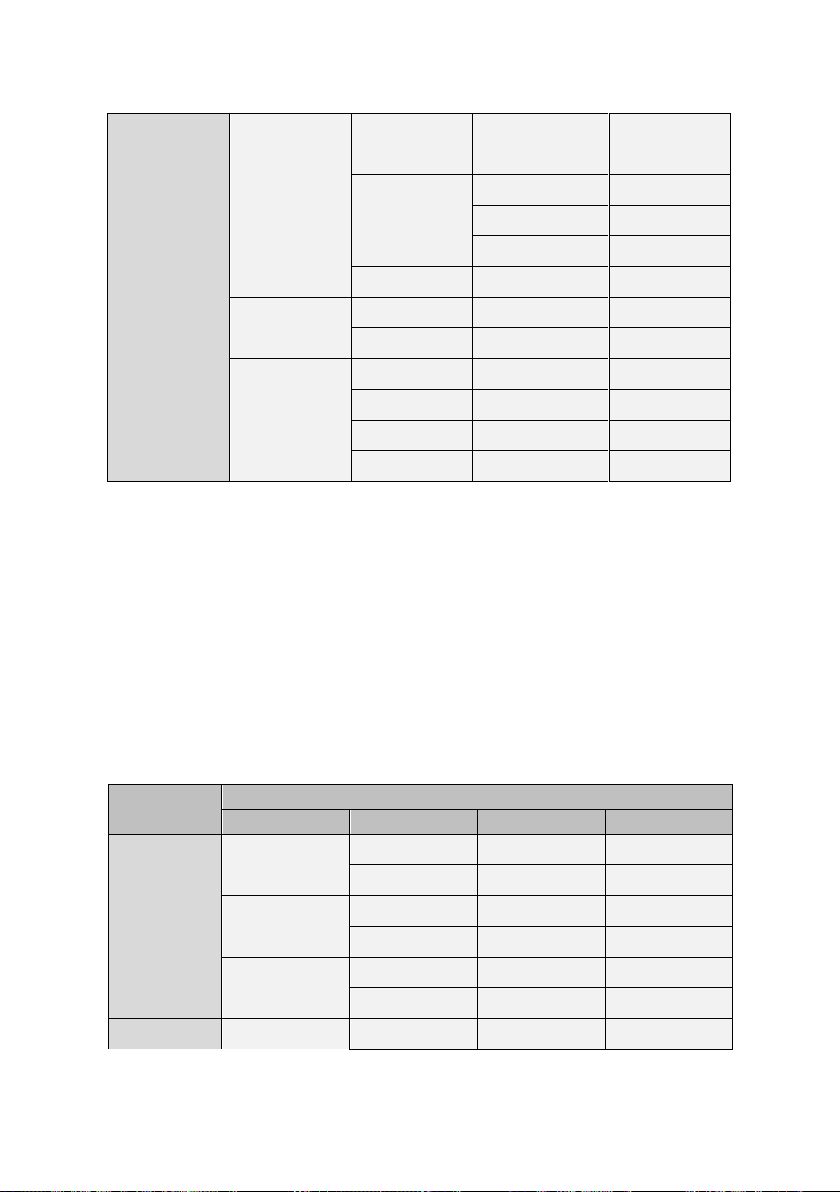
3.3.1
System Screen Menu
System screen menu is used to change the basic settings of the instrument
and consists of sub-menus as shown in Table 3.1.
46
Page 47
Touch Screen
>>
Return
Sleep Time
Enter
Back Space
Cancel
Return
Preset
Yes
No
LED >>
10 Sec
OFF
10 Sec
20 Sec
Return
Function Key
Screen Menu
1st Layer
2nd Layer
3rd Layer
4th Layer
CAL
Open
Start
Back
Short
Start
Back
Load
Start
Back
VSWR
AMP
Max(Top)
Table 3.1 Menu Structure in system mode
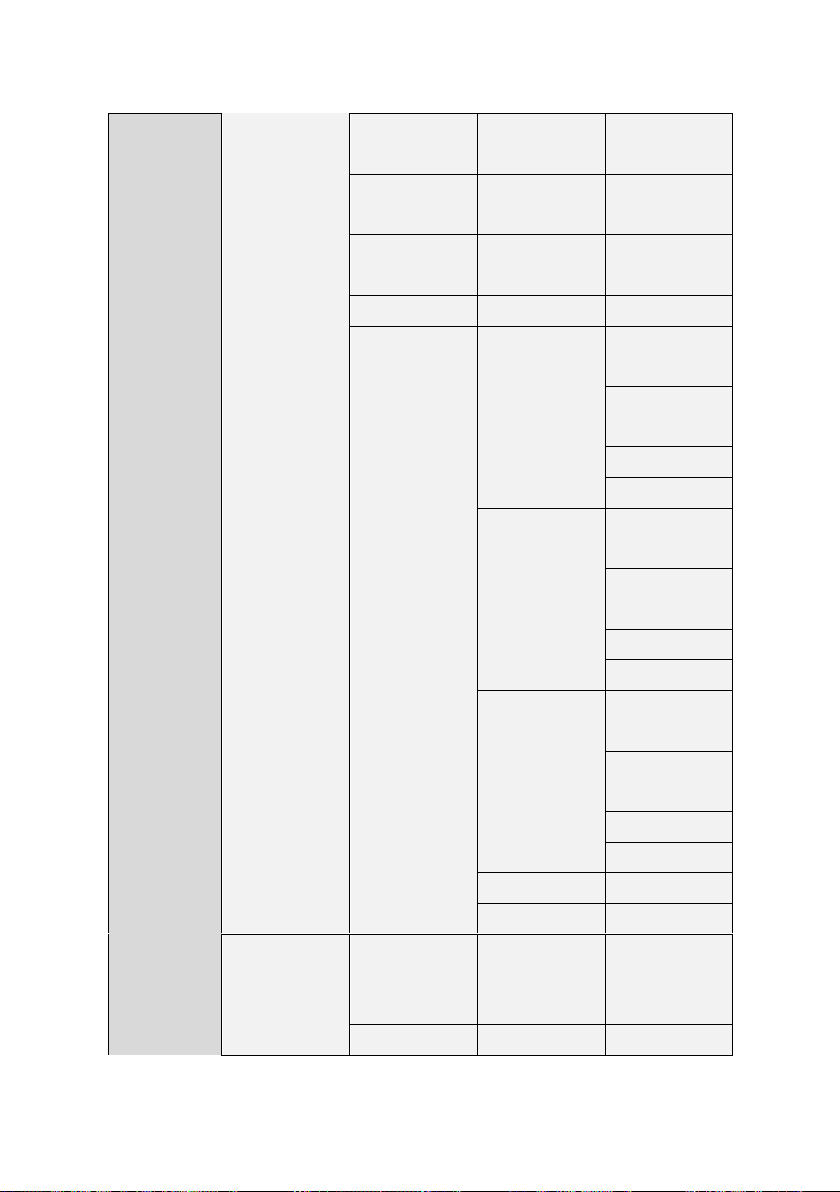
3.3.2
Common Menu
The menu structure is common to all the measurement modes except to the
Power Meter mode, shown in Table 3.2. Refer to section 3.3.6 for screen
menus applicable to the Power Meter mode.
47
Page 48

DTF
Cable Loss
2.00
Min(Bottom)
1.00
Limit
OFF ON
Limit Level
3.00
Dual Mode
Freq/
Dist
Start Freq
5.00 MHz
Stop Freq
4000.00 MHz
Center Freq
2002.50 MHz
Span Freq
3995.00MHz
Band List >>
Standard Band
>>
Select
Add to Custom
Return
Custom Band
>>
Select
Delete
Delete All
Return
Return
Trace Point
126
251
501
1001
2001
Marker
Marker
1 2 3 4 5 6
48
Page 49
Marker View
OFF ON
Marker Type
Normal Delta
Marker
Clear All
Marker Edit
Marker Band >>
Marker Band 1
>>
Band View
OFF ON
Band Slect
Start Stop
Band Edit
Return
Marker Band 2
>>
Band View
OFF ON
Band Slect
Start Stop
Band Edit
Return
Marker Band 3
>>
Band View
OFF ON
Band Slect
Start Stop
Band Edit
Return
Clear All
Return
Trace
Trace
T1 T2 T3
T4
Trace Capture
49
Page 50

Trace View
OFF ON
Clear Write
Trace Clear
Trace
Clear All
Peak
Peak Right
Peak Left
Max Search
Min Search
Load
Load Trace
(*.tra)
Select
File Manager >>
Rename
Delete
Delete All
Copy to USB
Copy All
to USB
Return
Destination >>
Trace 1
Trace 1
Trace 2
Trace 3
Trace 4
Return
Return
Load Screen
(*.jpg)
Select
File Manager >>
Rename
Delete
Delete All
Copy to USB
Copy All
to USB
50
Page 51

Return
Return
Load Setup
(*.sta)
Select
File Manager >>
Rename
Delete
Delete All
Copy to USB
Copy All
to USB
Return
Return
Load From
Internal USB
Save
Save Trace
(*.tra)
Trace 1
Trace 2
Trace 3
Trace 4
Return
Save Screen
(*.png)
Save State
(*.sta)
Save to
Internal
USB
Light
Auto Scale
Scale
Hold
3.2 Menu Structure Common to all measurement mode
51
Page 52

Function
Key
Screen Menu
1st Layer
2nd Layer
3rd Layer
4th Layer
VSWR
Freq/
Dist
Start Freq
(453.0 MHz)
Stop Freq
(464.0 MHz)
Center Freq
(458.5 MHz)
Span
(11.0 MHz)
Band List >>
(C450 P Up)
Startdard Band
Custom Band
Return
AMP
Max (Top)
0.00 dB
Min (Bottom)
40.00 dB
Limit
OFF ON
Limit Level
10.00 dB
Marker
Marker
1 2 3 4 5
6
Marker View
3.3.3
VSWR Menu
The menu structure of the VSWR hard function key and multi keys in VSWR
measurement mode is shown in Table 3.3.
52
Page 53

OFF ON
Marker Type
Normal
Delta
Marker Clear
All
Marker Edit
Marker Band >>
Marker Band 1
>>
Band View
OFF ON
Band Select
Start Stop
Band Edit
Return
Marker Band 2
>>
Band View
OFF ON
Band Select
Start Stop
Band Edit
Return
Marker Band 3
>>
Band View
OFF ON
Band Select
Start Stop
Band Edit
Return
Clear All
Return
3.3 Menu Structure Used for VSWR Measurement mode
53
Page 54

Function Key
Screen Menu
1st Layer
2nd Layer
3rd Layer
4th Layer
DTF
Freq/
Dist
Start Freq
(453.0 MHz)
Stop Freq
(464.0 MHz)
Distance
(25.0 Meter)
Band List >
(C450 P Up)
Startdard Band
Custom Band
Return
Cable List >
(FSJ 250)
Startdard Band
Custom Band
Return
DTF Setting >
Apply
Velocity
Cable Loss
Unit
Meter
Feet
Windowing
>>
(Rectangular)
Rectangular
Blackman
Hamming
Hann
Return
3.3.4
DTF Menu
The menu structure of the DTF hard function key and multi keys in DTF
measurement mode is shown in Table 3.4.
54
Page 55

Return
AMP
Max (Top)
4
Min (Bottom)
1
Limit
OFF ON
Limit Level
1.01
Marker
Marker
1 2 3 4 5
6
Marker View
OFF ON
Marker Type
Normal
Delta
Marker Clear
All
Marker Edit
Function Key
Screen Menu
1st Layer
2nd Layer
3rd Layer
4th Layer
The menu structure of the Cable Loss hard function key and multi keys
in Cable Loss measurement mode are shown in Table 3.5
3.4 Menu Structure Used for DTF Measurement Mode
3.3.5
Cable Loss Menu
55
Page 56

Calbe Loss
Freq/
Dist
Start Freq
(453.0 MHz)
Stop Freq
(464.0 MHz)
Center Freq
(458.5 MHz)
Span
(11.0 MHz)
Band List >
(C450 P Up)
Startdard Band
Custom Band
Return
AMP
Max (Top)
0.00 dB
Min (Bottom)
40.00 dB
Limit
OFF ON
Limit Level
10.00 dB
Marker
Marker
1 2 3 4 5
6
Marker View
OFF ON
Marker Type
Normal
Delta
Marker Clear
All
Marker Edit
Marker Band >>
Band View
56
Page 57

Marker Band 1
>>
OFF ON
Band Select
Start Stop
Band Edit
Return
Marker Band 2
>>
Band View
OFF ON
Band Select
Start Stop
Band Edit
Return
Marker Band 3
>>
Band View
OFF ON
Band Select
Start Stop
Band Edit
Return
Clear All
Return
Function Key
Screen Menu
1st Layer
2nd Layer
3rd Layer
4th Layer
Power Meter
Initialize/Preset
The menu structure of the Power Meter hard function key and multi keys
in Power Meter is shown in Table 3.6.
Table 3.5 Menu Structure Used for Cable Loss Measurement Mode
3.3.6
Power Meter Menu
57
Page 58

Frequency
Display Setup
>>
Unit
dBm Watts
External Offset
0.00 dB
Return
Mode >>
(Average)
AVG
Return
Table 3.6 Menu Structure Used in Power Meter Measurement Mode
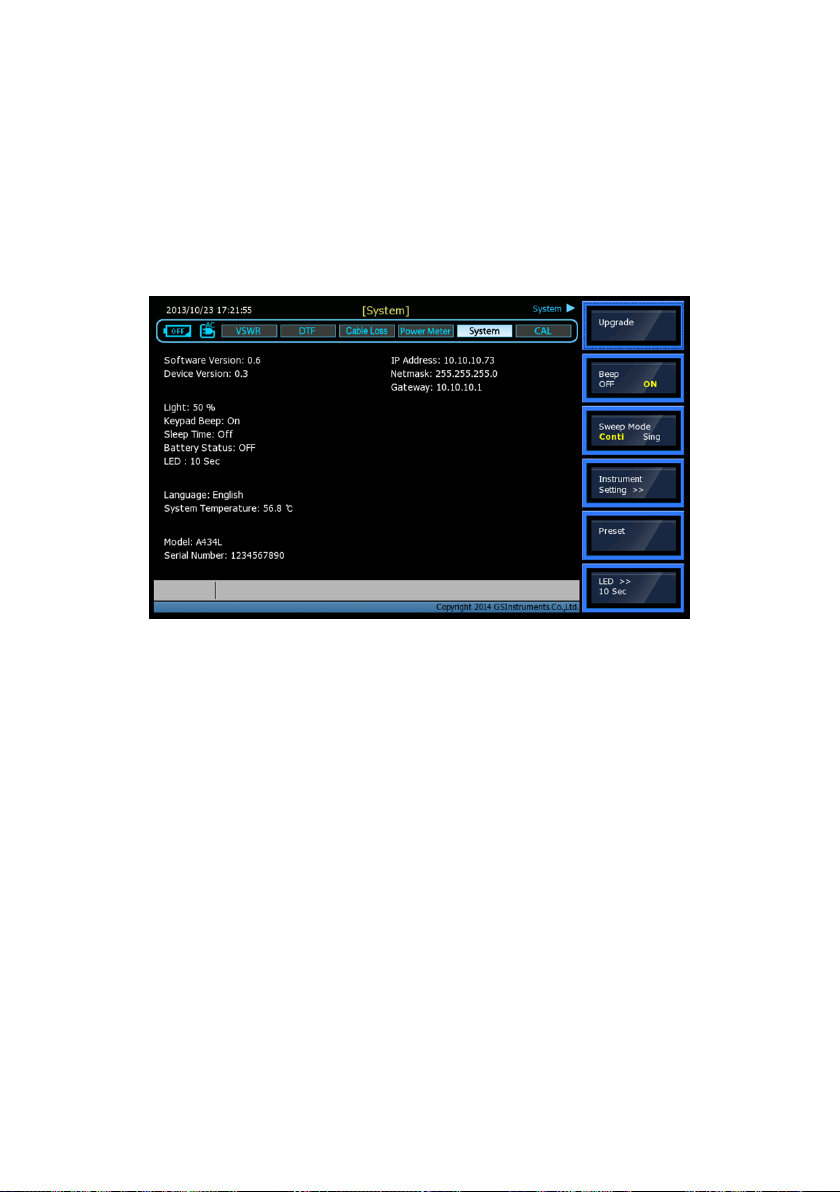
3.4 System Key
The System key enables users to verify the system information or change the
instrument settings.
Selecting the System key opens the following information:
58
Software Version
Device Version
Brightness of the display
Keypad beep On/Off setting
Sleep Mode setting: time to sleep mode
Battery remaining charge capacity
Keypad Backlight On time
Selected language
Page 59
System temperature
Model / Serial Number
IP Address Info
Figure 3.5 System Status Screen
The System key opens the following screen menu:
Upgrade: Upgrades the firmware of the instrument. For detailed
upgrade procedure, refer to the section “5.Software Upgrade”.
Beep: Activates or deactivates the beep sound when keys are
pressed.
Sweep Mode: Sets the sweep mode either single or continuous in
VSWR, DTF, or Cable Loss measurements. If Sweep Mode is set
Single, the message “Hold On” is displayed at the completion of a
current sweep and the sweep stops. Every time the Hold key is
pressed, the sweep is done once.
59
Page 60

Instrument Setting
Language: Changes the language used to display the menu,
messages and information on the screen display. Currently only
available in English.
Time/Date: Sets the time of the system clock.
LAN
Touch Screen
Sleep Time: Sets the time to enter into power saving mode.
Power saving mode is automatically activated when no key
entry occurs during the Sleep Time.
Preset : Set Default Configuration Data
LED: Keypad Backlight On time. If no Keypad input is LED Off after
a set time.
3.5 Multi Keys
Twelve multi keys are located under the LCD display. The Multi keys serve
multiple functions depending on the operation mode. The dual purpose
keys are indicated in black color and the specific functions in blue color. The
key is used to enter a numeric data when a user is prompted to input values.
In all the other cases, the keys are used to perform the specific function.
The function and operating procedure for each multi keys are described in
the following sections
60
Page 61

Figure 3.6 Multi Keys Layout
3.5.1
Numeric Data Entry
Multi keys operate as follows when a user is prompted to input values by
pop-up window.
Numeric keys from 0 to 9 are used to input user setting numbers.
The plus/minus (+/-) key is used to assign positive or negative
numbers in the user settings.
The period key (.) is used to input numbers with decimal points.
3.5.2
Specific Function Keys
Multi keys are used in VSWR, DTF, and Cable Loss measurement mode.
Unless otherwise specified, multi keys do not support Power Meter mode.
1. AMP
AMP (amplitude) defines a manual setting for the scale on the Y-axis of the
graph. It can be selected in VSWR, DTF, and Cable Loss measurement mode.
61
Page 62

Depending on the choice of an amplitude unit, allowable input value is
limited to the following:
In case Y scale is VSWR:
Max(Top): Setting value can be from 1.01 to 65.00 and it
cannot be equal to or smaller than the Min(Bottom) setting
value. Adjustment can be made by steps of 0.01.
Min(Bottom): Setting value can be from 1.0 to 64.99 and it
cannot be equal to or larger than the Max(Top) setting value.
Adjustment can be made by steps of 0.01.
In case Y Scale is Return Loss:
Max(Top): Setting value can be from 0.0 to 59.99dB and it
cannot be equal to or smaller than the Min(Bottom) setting
value. Adjustment can be made by steps of 0.01.
Min(Bottom): Setting value can be from 0.01 to 60.00dB and
it cannot be equal to or larger than the Max(Top) setting
value. Adjustment can be made by steps of 0.01.
Limit line: Turns On and Off the display of the limit line on the
screen.
If a measurement exceeds the limit line, the trace above the
limit line is displayed in red color.
An audible beep sound is generated.
Limit level: Sets the position of a limit line. Depending on the Y-
scale of a graph, the input value is set automatically as none for
VSWR or dB for Return Loss. The value of limit level is displayed on
the limit line.
The instrument takes the negative value of the Return Loss
internally. Users don’t need to add minus (-) sign before typing
in a value. Y-axis of a graph also doesn’t show minus sign.
62
Page 63

2. Freq/Dist
Freq/Dist key causes different screen menu to be displayed depending on a
measurement mode. In VSWR or Cable Loss measurement modes it opens
a frequency screen menu and in DTF measurement mode it opens a distance
screen menu.
VSWR/ Cable Loss Measurement Mode
Center: Sets a center frequency of the measurement to be
made.
Start: Sets a start frequency of the measurement to be made.
Stop: Sets a stop frequency of the measurement to be made.
Span: Sets a user-defined frequency span.
Band: Opens standard or custom frequency band registered
in the instrument.
Standard: Opens the world-wide standard Band List
registered in the instrument.
- Top of List: Moves to the first page of the Band
List.
- Page Up: Moves to the previous page.
- Page Down: Moves to the next page.
- Bottom of List: Moves to the last page of the
Band List.
- Add to Custom: Copies a frequency band
registered in the Standard Band List to the
Custom Band.
Custom: Opens the customized Band List registered in
the instrument.
- Top of List: Moves to the first page of the Band
List.
- Page Up: Moves to the previous page.
- Page Down: Moves to the next page.
- Bottom of List: Moves to the last page of the
Band List.
63
Page 64

- Delete Custom: Deletes a frequency band from
DTF Measurement Mode
Start Frequency: Sets a starting frequency to measure DTF
Stop Frequency: Sets a stop frequency to measure DTF
Distance: Sets a distance to measure. The maximum
measurable distance is 1250m (4125ft).
Cable List: Opens a list of coaxial cables registered in the
instrument. About forty kinds of cables are registered in the
standard cable list. The user can register additional cables to
the instrument by using the application software program
provided with the instrument.
Standard: Opens the Cable List registered in the
instrument.
- Top of List: Moves to the first page of the Cable
- Page Up: Moves to the previous page.
- Page Down: Moves to the next page.
- Bottom of List: Moves to the last page of the
- Add to Custom: Copies a cable registered in the
Custom: Opens a Custom Cable List registered in the
instrument.
- Top of List: Moves to the first page of the Cable
- Page Up: Moves to the previous page.
- Page Down: Moves to the next page.
- Bottom of List: Moves to the last page of the
- Delete Custom: Deletes a cable registered in the
Window: Applies video filtering to the display of the trace. If
the video filter is activated by turning the Window On, traces
the Custom Band.
List.
Cable List.
Standard Cable List to the Custom Cable List.
List.
Cable List.
Custom Cable List.
64
Page 65

are reduced by smoothing out the sharp transitions, thereby
enabling users easy to discriminate noises and peaks.
Setup
Velocity: Opens the Relative Propagation Velocity
parameter for data entry. Enter the propagation
velocity for the type of transmission line being tested.
Cable Loss: Opens the Cable Loss parameter for data
entry. Enter the loss per meter for the type of
transmission line being tested.
Unit: Selects the unit of X-axis scale to display the
measurement results in Meter or Feet.
3. Trace Point
Trace point is used to select the number of data points to take during a
VSWR and Cable Loss measurement mode. There are four data points
available: 126, 251, 501 and 1001. The default number of trace points is
1001.
4. Marker
A marker is used to get the data on the specific point of a trace. A total of
six markers can be displayed on the screen and each marker can be assigned
independently. Placing a marker on the trace displays the marker’s Y
coordinates next to the marker’s position. If the marker table is turned on,
both X and Y coordinates of all activated markers are displayed.
Marker
Select: Selects an Active Marker whose position is moved by
the dial knob or Up and Down arrow keys. The assigned
number of an active marker is displayed in red color on the
Select screen menu and the marker’s number is also displayed
next to the marker on the trace.
Marker View: Hides or displays the selected marker on the
screen. In the same measurement mode markers appear at
65
Page 66

the previous positions when the Marker View is turned off
and on. If a measurement mode has been changed, markers
are not restored to previous positions but move to the left
end of the trace.
All Off: Turns all markers off the screen. Markers are
redisplayed on the previous position if markers are turned
back on. If a measurement mode is changed, current settings
are not restored.
Draw Type: Selects the maximum number of markers to be
used simultaneously. Available options are either 4CH or 6CH.
If 4CH mode is selected, markers number 5 and number 6
cannot be activated. Settings changed in Draw Type are
reflected in Marker CH and Marker table.
Marker Table: Displays a table on the left side of the screen
when Marker Table is activated. All X and Y coordinates of
the activated markers are displayed on the table. Depending
on the selection in Draw Type, the number of markers on the
table is either 4 or 6.
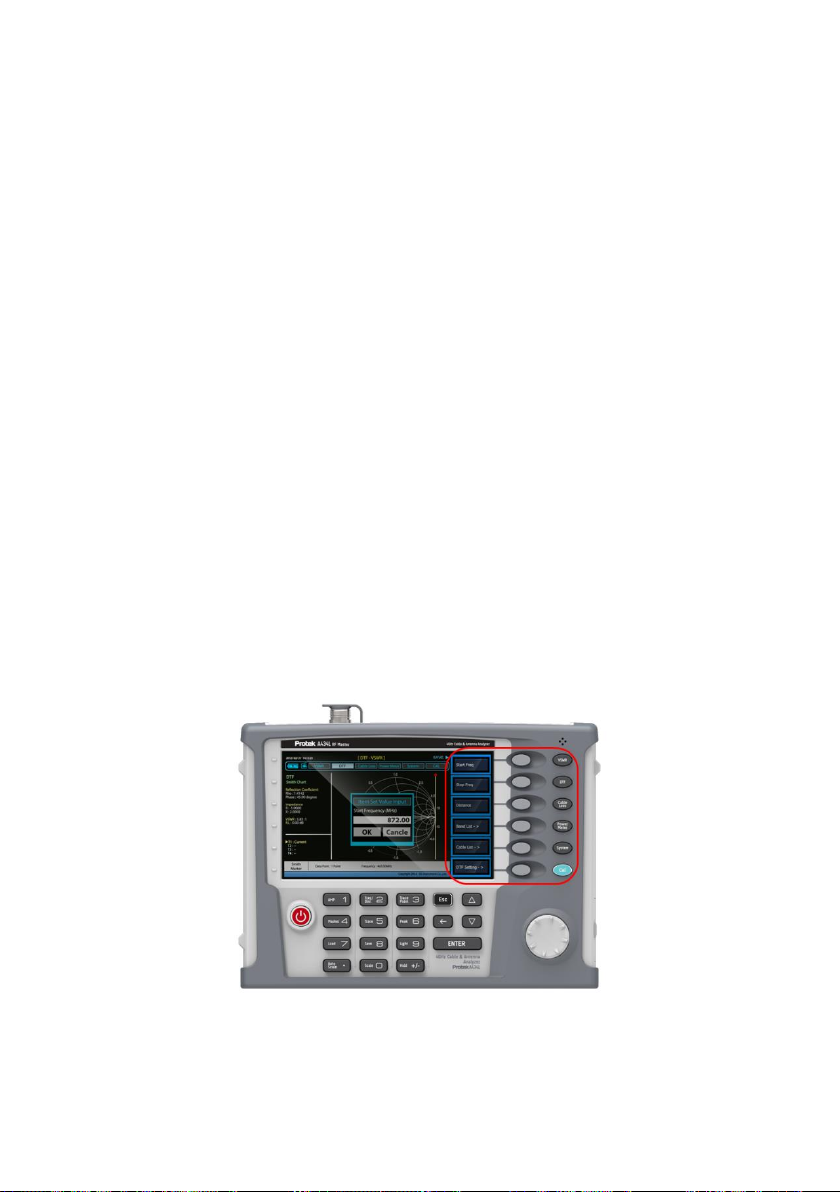
Marker Edit: Sets the marker position manually. A pop-up
window appears for users to set the frequency and the
marker position is moved to the setting frequency
Moving Markers
Knob – Turning the knob clockwise moves a marker to the
right and counter clockwise moves it to the left. The knob is
used to move the marker position fast.
Up/Down Arrow Keys – Pressing the up arrow key (↑)
moves a marker’s position one point to the right and
pressing the down arrow key (↓) moves a marker’s position
one point to the left. Up/Down Arrow keys are used to
move a marker’s position precisely.
As the instrument is equipped with a touch panel operation,
a marker can be placed to the desired position by simply
66
Page 67

touching the screen. Quickly moves an activated marker to the desired
position and makes a fine adjustment using a dial knob or up/down arrow
keys.
5. Trace
Captures a trace for comparison with other traces or saves traces.
Figure 3.7 Trace Screen Display
Select: Selects an active trace. Every time Select screen menu is
pressed, the active trace changes. Channel numbers are assigned
to each captured traces or loaded traces. Refer to Save & Load” for
procedures to load traces.
Capture: Captures a current trace on the screen and assigns a
Trace CH. Refer to “Save & Load” for procedures to save traces.
View: Hides or displays the Trace CH on the screen. Press Select
screen menu key to choose the Trace CH. Traces with View set OFF
are hidden from the screen. The information about the hidden
traces is also cleared from the information window shown on the
upper right of the screen. Setting View On restores hidden traces
and information on the window.
67
Page 68

Info: Hides or displays the trace information window on the upper
right corner of the screen. This is used to view traces overlaid with
the trace information window.
Clear CH: Deletes an active trace channel from the screen. The
cleared channel is not restored. It is used to select and delete a
trace channel one by one when multiple channels are displayed on
the screen. Verify the channels to delete with View ON/OFF
function in advance settings as cleared channels cannot be
restored.
Clear All: Deletes all channels from the instrument and initialize
the trace settings.
6. Peak
This key is used to find the peak value of a trace. Pressing this key leads to
the activation of
Marker CH1 and places the marker to the peak point of the trace.
Peak Right: Moves a marker to the nearest peak on the right.
Peak Left: Moves a marker to the nearest peak on the left.
Max Search: Moves a marker to the highest point of the trace.
Min Search: Moves a marker to the lowest point of the trace.
7. Load
Load key enables for recalling of the Trace, Screen, and State
8. Save
Save key enables for saving of the Trace, Screen, and State.
9. Light
This key is used to adjust the brightness of the LCD display. Adjustment can
be made from 0 to 100% and the default setting is 50%.
68
Page 69

10. Scale
This key is used to select a unit of Y axis of the graph in VSWR and DTF
measurement modes.
Either VSWR or Return Loss can be selected. In Cable Loss measurement
mode, Return Loss only can be selected.
11. Auto Scale
The instrument can automatically set the scale to the minimum and
maximum values of a measurement on the Y-axis of the graph for optimum
display of the traces. Every time AUTO SCALE key is pressed, the top and
bottom scales are set to the minimum and maximum values with margin on
the Y-axis of the screen display.
12. Hold
This key is used to pause a sweep in all measurement modes. The
Hold state is activated by pressing the Hold key, and it is
maintained even if users change the measurement mode. The
sweep resumes when the Hold key is pressed again.
When Sweep Mode is set Single in the System screen menu, a Hold
message is displayed on the screen in red color and the
measurement stops at the completion of a single sweep. Pressing
the Hold key it triggers another single sweep.
69
Page 70

4
MEASUREMENT
DATA ANALYSIS
OPERATING
MANUAL
Page 71

4.
4.1 VSWR
To get maximum power into a load it is required that the load impedance
match the generator impedance. Any impedance difference, or
mismatching would not produce maximum power transfer. A mismatch at
the antenna system produces a reflective 'traveling wave' which goes in the
opposite direction from the incident wave. As the two traveling waves cross
each other in opposite direction, it produces an interference pattern called
a "standing wave". VSWR is the ratio between the power that is sent
forward to the antenna and the amount of the power that is reflected back
toward the transmitter.
Some of the consequences of having a high VSWR condition in cellular
services are: dropped calls, poor reception, and an overall unacceptable
performance in the cell (or section of cell) covered by the base station
antenna. Therefore, the VSWR of the antenna system including the feed line
is one of the most critical factors in the service and maintenance of the RF
transmitter systems.
4.1.1
VSWR Display Description
The screen shown in Figure 4.1 is displayed when VSWR measurement
mode is selected. Various kinds of information related to the VSWR
measurement are shown on the screen.
71
Page 72

Figure 4.1 VSWR Measurement Screen Display
Calibration Info: Displays a calibration state on the measurement frequency
band that a user has selected. When the instrument is first turned on, the
state is “Cal Off”. The symbol “Cal On” is displayed along with the execution
time and frequency band after the calibration is successfully completed.
Trace Point: Sets the number of data points to take during a measurement
mode. Selection is made from one of five choices.
126, 251, 5001, 1001, 2001
Selecting 501 data points provides twice as many measurement points as
251, but it takes approximately twice as long for the trace to sweep and
display.
Selecting the trace points larger than needed for
the measurement will result in a longer sweep
time. This may hinder the user from
observing the fast changing traces.
72
Page 73

It is recommended to select high resolution trace
points only when measuring the wide frequency
band or a precise measurement is required.
The previously executed calibration is effective
even after the trace points change.
Trace Average: Indicates the average value of a single sweep over the user
setting frequency band.
Freq. Span: It is a user-defined frequency band. Changing the frequency
band doesn’t affect the sweep time, but affects the calibration. Recalibration
is required if the frequency setting is changed.
Freq Band Info: The band name is displayed if the band is selected from the
band list stored in the instrument. If the user sets the start, stop, center or
span frequency manually, the band name will show “Custom”
Limit Line: Sets the upper limit value of the trace. The portion of the trace
that exceeds the limit line is displayed in red color. The captured trace by
using the Trace function does not display the exceeded portion of the trace
in different color.
Y scale unit: It is the measurement unit of the Y axis displayed for the trace.
Return Loss (dB)
VSWR
73
Page 74

Action
Note
Setting Center Freq and Span.
1. Press the Freq/Dist key.
Multi key.
2. Select the
Center Freq
screen menu.
The current setting is displayed
on the Window.
3. Enter a center frequency value.
4. Press the Enter key.
5. Select the
Span
screen menu.
6. Enter a span value.
7. Press the Enter key.
Setting Start/ Stop Frequency.
1. Press the Freq/Dist key.
The current setting is cleared
when a new value is entered.
Press the ESC key to delete one
by one the numbers displayed
on the pop-up window.
Pressing the ESC key repeatedly
will cancel the input mode.
The frequency input unit is in
MHz and the minimum input
steps is 0.01MHz
2. Select the
Start
screen menu.
3. Enter a start frequency value.
4. Press the Enter key.
5. Select the
Stop
screen menu.
6. Enter a stop frequency value.
7. Press the Enter key.
Selection from the band list stored in the instrument.
1. Press the Freq/Dist key.
Press the Up(↑) / Down(↓) arrow
keys or rotate the dial knob to
select a band from the list.
Select the
Page Up/Page Down
screen menu for searching
bands not shown in the screen.
2. Select the
Band
screen menu.
3. Select the band from the list and
press the Enter key.
4.1.2
Setting Frequency
Frequencies can be set manually or selected from a band list stored in the
instrument. It is desirable to set the frequency to a value that covers the
normal range of the measurement with enough margin.
74
Table 4.1 Frequency Setting Procedure
Page 75

Changing the frequency settings will automatically turn
calibration off with the symbol “CAL OFF” displayed on the
screen. Always set the frequency before calibrating the
instrument. Changing the trace points during the
measurement doesn’t affect the calibration.
4.1.3
Calibration
The instrument must be calibrated to get a reliable measurement
result. For best results, set the frequency and calibrate the
instrument immediately before taking a measurement.
Calibration accessories (optional)
Calibration Kit which contains one 50ohm load, one Open
standard and one Short standard
Test cable: Use a phase stable cable for reliable and
consistent measurement results
To minimize the measurement error, connect the port
extension cable to the RF In port on the instrument and
then connect the Cal Kit to the end of the extension
cable.
75
Page 76

Figure 4.2 VSWR Calibration Connection
Bending or moving the phase unstable cable while making
a measurement may cause errors in the measurement. The
test cable used for port extension must be phase stable in
the measurement frequencies.
At the successful completion of each calibration step, the
message is displayed with a beep sound.
Figure 4.2 illustrates the connection method when a port extension cable is
used for calibration.
76
Page 77

Action
Note
Performs Calibration after the frequency setting and test cable connections.
1. Press the CAL
key.
Hard function key.
2. Connect an
Open standard.
Connect CAL Kit “Open” connector to the RF out port.
3. Select the
Open/Start
screen menu.
When the
Open/Start
screen menu is selected, a
progress bar is displayed to show the progress.
When a progress bar is disappeared, Open calibration
is finished.
4. Connect a
Short standard.
Connect CAL Kit “Short” connector to the RF out port.
5. Select the
Short/Start
screen menu.
When the
Short/Start
screen menu is selected, a
progress bar is displayed to show the progress.
When a progress bar is disappeared, Short calibration
is finished.
6. Connect the
Load standard.
Connect CAL Kit “Load” connector to the RF out port.
7. Select the
Load/Start
screen
menu.
When the
Load/Start
screen menu is selected, a
progress bar is displayed to show the progress.
When a progress bar is disappeared, Load calibration is
finished.
Calibration state is changed to “Cal On” after the Open-Short-Load calibration.
To compensate errors caused by a port extension cable or adapters, perform
Open-Short-Load calibration including the port extension cable.
Table 4.2 Calibration Procedure
4.1.4
VSWR Measurement
The instrument is ready to take VSWR measurement after completing the
Open-Short-Load calibration using a port extension cable.
77
Page 78

After calibration, do not change the connection of
the port extension cable or the frequency setting. It
can cause produce an error in the measurement.
When the frequency setting is changed, a warning
alarm will sound and the calibration state is
changed to “Cal Off”. After changing the frequency
setting, recalibrate the instrument using the OpenShort-Load standard.
The end of the port extension cable must be connected to the device
(antenna or feed line) for VSWR measurement as shown in Figure 4.3. The
result of the VSWR measurement is displayed on the screen in real time.
Figure 4.3 Connection for VSWR Measurement
78
Page 79

The maximum allowable input level of the
instrument is +25dBm. Do not connect the RF In
port of the instrument directly to the output port of
the system. An over power input degrades the
performance of the instrument and may cause a
malfunction of the instrument.
Do not connect the instrument to the antenna when
there is a risk of lightning. Electric shock may cause
a malfunction or damage the instrument.
4.1.4.1 Setting Trace Point
Adjust a trace point to change the resolution of the VSWR measurement.
Changing the Trace Point doesn’t affect the calibration state.
4.1.4.2 Scale Adjustment
Press Auto Scale key to optimize the Y scale and display the entire trace.
Press AMP key to set the maximum and minimum values on the Y scale
manually.
Press Scale key to select the display unit of the Y scale.
Scale adjustment doesn’t affect the calibration state.
4.1.4.3 Using Markers
Depending on the draw type setting, four or six markers can be used
simultaneously. The Y axis value on a current trace is displayed next to each
marker on the screen, but the frequency information is not provided.
Activate the marker table to see both, the level and frequency information
when moving a marker to the specific frequency using the Marker Edit
function.
79
Page 80

Figure 4.4 Using Markers in VSWR Measurement Mode
4.1.4.4 Limit Line
By setting a limit line, users can easily check if a measurement exceeds the
specified limit. It appears as a horizontal line at the value set. An alarm
sounds when a trace exceeds the limit line and the exceeded portion is
displayed in red color.
80
Page 81

Figure 4.5 Limit Line Application
4.2 DTF
While VSWR is an indicator to express the efficiency of the antenna’s energy
transmission, DTF is a measurement to identify the fault locations in the
antenna line system. Most of the antenna line system consists of the various
types of coaxial cables, connectors and devices such as dividers and surge
arrestors. Since VSWR is a measurement to verify the impedance
discontinuity of the total feed line system, it is necessary to perform DTF
measurement to identify the exact component that is contributing to the
performance of the line system. The DTF measurement makes it easy to
identify the fault location by displaying the relative distance of the signal
reflections or discontinuities from various points of the line system
4.2.1
DTF Display Description
The screen shown in Figure 4.6 is displayed when DTF measurement mode
is selected. The distance from the instrument is shown on the X-axis, while
81
Page 82

the relative magnitude of the discontinuity is shown on the Y-axis. The
information related to the DTF measurement is shown on the screen.
Figure 4.6 DTF Measurement Screen
Limit Line & Limit Level Info: Sets the upper limit value of a trace.
The portion of the trace that exceeds the limit line is displayed in
red color. However, the captured trace by using TRACE function
doesn’t discriminate the color even if the trace exceeds the limit
line.
Calibration Info: Displays a calibration state on the measurement
frequency band that a user has selected. When the instrument is
first turned on, the state is “Cal Off”. The symbol “Cal On” is
displayed along with the execution time and frequency band after
the calibration is successfully completed.
Maximum Distance: Displays the maximum measurable distance
within the user setting frequency band. Setting the frequency
band narrow will increase the measurable distance while setting
the frequency band wide will decrease the distance.
Y Scale Unit: Is the measurement unit of the Y-axis that the trace
is displayed.
Return Loss (dB)
VSWR
Freq. Span: Is the user-defined frequency band. Changing the
82
Page 83

frequency band doesn’t affect the sweep time, but affects the
calibration. Recalibration is required if the frequency setting is
changed.
Freq. Band Info: The band name is displayed if the band is selected
from the band list stored in the instrument. If the user sets the start,
stop, center or span frequency manually, the band name will show
“Custom”.
Cable Info: The name of user selected cable is displayed on the
screen. A cable name is displayed if the cable is selected from a
Cable List stored in the instrument. If the user sets the Velocity and
Cable Loss manually, the band name will show “Custom”. The
following information is also displayed.
Rel. Propa. Vel.: The relative propagation velocity for the
cable type selected by the user selected from the Cable List or
manually set by selecting the Velocity key.
Nominal Atten.: The loss per unit distance for the cable type
that the user selected from the Cable List or set manually by
selecting the Cable Loss key
By using the application program supplied with the
instrument, users can store user’s cable to the instrument. For
details, refer to the Application Program.
4.2.2
DTF Setup
Set the conditions for DTF measurements. The user setting parameters for
DTF measurements are the following:
Frequency Setting: Sets the start and stop frequency to make a
measurement. If a specific frequency band has been set in VSWR
measurement mode, it can be applied to DTF measurement. To
change the maximum measurement distance or increase the
83
Page 84

Action
Note
Frequency Setting.
Press the Freq/Dist key.
Select the
Start Freq
screen menu.
{Enter start frequency value}
Press the Enter key.
Additional calibration is
not necessary if a Freq
Band has been set and a
calibration has been
measurement resolution, is necessary to change the frequency
setting.
Distance Setting: The maximum measurable distance is displayed
on the left side of the screen depending on the frequency setting.
Any value within the maximum measurable distance can be set.
Optimum resolution is achieved when the user setting distance is
the same as the maximum measurable distance.
Cable Setting: Selects a cable type of the feed line. By using this
key, users can select the cable stored in the instrument without
setting the detailed parameters of the cable.
Setup: Used to change the setting of the cable parameters or
change the distance unit. It consists of the following sub menus:
Velocity: Sets the relative propagation delay of a cable. It
affects the calculation of the distance in the DTF
measurement.
Cable Loss: Sets the loss per distance unit of a cable. It affects
the peak level of the discontinuity in the DTF measurement.
After calibration, do not change the connection of the port extension
cable or the frequency setting. It can cause a
frequency setting, recalibrate
A detailed procedure for DTF setup is as follows:
84
measurement error. When the frequency setting is
changed, a warning alarm will sound and the calibration
state is changed to “Cal Off”. After changing the
the instrument using the Open-Short-Load standard.
Page 85

Select the
Stop Freq
screen menu.
{Enter stop frequency value}
Press the Enter key.
performed for the band
in VSWR measurement,
and the same Freq. band
is used in the DTF
measurement.
Distance Setting.
Select the
Distance
screen menu.
{Enter measuring distance}
Press the Enter key.
The ending point can
only be set in distance
setting.
The maximum
measurable distance is
1,250m (4,125ft).
Cable Setting.
Select the
Cable List
screen menu.
[Standard]/[Custom]
{Select a cable by using Knob or
arrow key}
Press the Enter key.
Setup.
Setting Relative Propagation Velocity.
Select the
Velocity
screen menu.
{Enter user setting value}
Press the Enter key.
Setting Cable Loss.
Select the
Cable Loss
screen menu.
{Enter user setting value}
Press the Enter key.
Setting the X axis Unit.
[Meter]/[Feet]
4.2.3
Calibration
The instrument must be calibrated to get the DTF measurement results
compatible with VSWR
Table 4.3 DTF Setup Procedure
85
Page 86

Calibration accessories (optional)
Calibration Kit which contains one 50ohm load, one Open
standard and one Short standard
Test cable: Use a phase stable cable for reliable and consistent
measurement results
To minimize measurement errors, connect the port extension cable
to the RF In port on the instrument and then connect the Cal Kit to
the end of the extension cable.
The Figure 4.7 shows the connection diagram for calibration using a test
cable. To compensate measurement errors due to the test cable or adapters,
perform the Open-Short-Load (O-S-L) calibration including the test cable.
For detailed calibration procedure, refer to Table 4.2 Calibration Procedure
86
Figure 4.7 DTF Calibration Connection Diagram
Page 87

The maximum allowable input level of the
instrument is +25dBm. Do not connect the RF
In port directly to the system output port.
Exposure to the overpowered input may
degrade the performance of the instrument
and may cause damage in the long run.
Do not connect the instrument to the antenna
when there is a risk of lightning. Electric shock
may cause the malfunction or breakdown of
the instrument.
Bending or moving the phase unstable cable while making a
measurement may cause errors in the measurement. The test
cable used for port extension must be phase stable in the
measurement frequencies.
At the successful completion of each calibration step, a message
is displayed with a beep sound.
4.2.4
DTF Measurement
If a port extension cable is used to interconnect the instrument with the line,
measurement error can happen due to the sum of the port extension cable
length and the distance to the fault. By performing the O-S-L calibration at
the end of the port extension cable, the extension cable length will be
compensated and the fault location can be more accurately measurable.
87
Page 88

If O-S-L calibration has been done at the end of
the port extension cable for DTF measurement,
the length of the port extension cable is
compensated automatically and is not included
in the distance to the point of discontinuity.
Figure 4.8 Connection Diagram for DTF Measurement
4.2.4.1 Scale Adjustment
Adjust a trace point to change the resolution of the VSWR measurement.
Changing the Trace Point doesn’t affect the calibration state.
Press the Auto Scale key to optimize the Y scale and display an
entire trace.
Press the AMP key to set the maximum and minimum values on
88
the Y scale manually.
Page 89

Press the Scale key to select a display unit of the Y scale.
4.2.4.2 Using Markers
Depending on the display settings, four or six markers can be used
simultaneously. The distance of a current marker position is displayed next
to each marker on the screen. Activate the marker table to see both the
magnitude and distance information. Use Marker Edit to move a marker to
the specific distance.
Adjust a trace point to change the resolution of the VSWR measurement.
Changing the Trace Point doesn’t affect the calibration state.
Figure 4.9 Using Markers in DTF Measurement Mode
4.2.4.3 Windowing
Windowing is applied when an accurate fault location cannot be verified
due to the side overshoots of the trace. If the video filter is activated by
turning the Window On, side overshoots of the trace are reduced by
89
Page 90

smoothing out the sharp transitions thereby enabling users easy to
discriminate noises and peaks. Figure 4.11 is the result of applying Blackman
window to the trace on Figure 4.10. Noises around peaks are reduced and
distance to the fault location is clearly verified.
90
Figure 4.10 Measurement Display Rectangular Windowing
Figure 4.11 Measurement Display Blackman Windowing
Page 91

4.3 Cable Loss
The cable loss measurement feature checks the signal attenuation level of
the cable system. The frequency band to measure the characteristics of a
cable must be calibrated before performing the cable loss measurement.
4.3.1
Cable Loss Display Description
The screen shown in Figure 4.12 is displayed when the Cable Loss
measurement mode is selected. Various kinds of information related to the
Cable Loss measurement are shown on the screen.
Figure 4.12 Cable Loss Measurement Screen Display
Calibration Info: Displays the calibration state of the measurement
frequency band that a user has selected. When the instrument is
first turned on, the status is “Cal Off”. The symbol “Cal On” is
displayed along with the calibration time and frequency band after
successful completion of calibration.
Trace Point: Sets the data points or resolution to measure the trace.
91
Page 92

Action
Note
Setting Center Freq and Span.
1. Press the Freq/Dist key.
Multi key.
2. Select the
Center Freq
screen menu.
Current setting is displayed as
default on the screen.
3. Enter a center frequency value.
4. Press the Enter key.
5. Select the
Span
screen menu.
6. Enter a span value.
7. Press the Enter key.
Setting Start/ Stop Frequency.
1. Press the Freq/Dist key.
Current setting is cleared when a
new value is entered.
Press the ESC key to delete a
number displayed on the pop-up
2. Select the
Start Freq
screen menu.
3. Enter a start frequency value.
4. Press the Enter key.
Selection is made from one of five choices.
126, 251, 501, 1001, 2001
Trace Average: Indicates the average value of a single sweep over
the user setting frequency band.
Freq. Span: User-defined frequency band. Changing the frequency
band doesn’t affect the sweep time, but affects the calibration.
Recalibration is required if the frequency setting is changed.
Freq. Band Info: The band name is displayed if the band is selected
from the band list registered in the instrument. If the user sets the
start, stop, center or span frequency manually, the band name will
indicate “Custom”
Y scale unit: The unit of the y axis in the Cable Loss measurement
mode is dB.
4.3.2
Setting Frequency
The user must set the frequency band to make a Cable Loss measurement.
Frequency can be set manually or chosen from a band list registered in the
instrument.
92
Page 93

5. Select the
Stop Freq
screen menu.
window one by one.
Pressing the ESC repeatedly will
cancel the input mode.
Input unit is MHz and minimum
input step is 0.01MHz.
6. Enter a stop frequency value.
7. Press the Enter key.
Selection from the band list stored in the instrument.
1. Press the Freq/Dist key.
Select the
Page Up/Page Down
screen menu for searching the
band that doesn’t show up on the
current page.
2. Select the
Band List
screen menu.
3. Select the band from the list and
press the Enter key.
Table 4.4 Frequency Setting Procedure
Changing the frequency settings will automatically turn
calibration off with the symbol “Cal Off” to be displayed on
the screen along with an alarm sound. In this case,
recalibrate the instrument with the Open-Short-Load Calibration kit.
4.3.3
Calibration
The instrument must be calibrated to get reliable Cable Loss measurement
results. For best results, set the frequency and calibrate the instrument
immediately before taking measurements.
Calibration accessories (optional)
Calibration Kit which contains one 50ohm load, one Open
standard and one Short standard
To minimize the measurement error in Cable Loss measurement, don’t
use unnecessary extension cables or adapters while performing
calibration. Figure 4.13 illustrates the recommended calibration
method for Cable Loss measurement.
93
Page 94

Action
Note
Performs Calibration after the frequency setting.
1. Press the CAL key.
Hard function key.
2. Connect an Open
standard.
Connect CAL Kit “Open” connector to the RF out port.
3. Select the
Open/Start
screen
menu.
When the
Open/Start
screen menu is selected, a
progress bar is displayed to show the progress.
When a progress bar is disappeared, Open
calibration is finished.
4. Connect a Short
standard.
Connect CAL Kit “Short” connector to the RF out port.
5. Select the
Short/Start
screen
menu.
When the
Short/Start
screen menu is selected, a
progress bar is displayed to show the progress.
When a progress bar is disappeared, Short
calibration is finished.
Figure 4.13 Port Calibration for One Port Cable Loss Measurement
94
Page 95

6. Connect the Load
standard.
Connect CAL Kit “Load” connector to the RF out port.
7. Select the
Load/Start
screen
menu.
When the
Load/Start
screen menu is selected, a
progress bar is displayed to show the progress.
When a progress bar is disappeared, Load
calibration is finished.
Calibration state is changed to “Cal On” after the Open-Short-Load calibration.
Table 4.5 Calibration Procedure
4.3.4
Cable Loss Measurement
The instrument is ready to perform Cable Loss measurement after
completion of Open-Short-Load calibration.
Figure 4.14 One Port Cable Loss Measurement Connection Diagram
The instrument must be calibrated to get reliable Cable Loss measurement
results. For best results, set the frequency and calibrate the instrument
immediately before taking measurements.
95
Page 96

Action
Note
Make a measurement after completion of O-S-L calibration.
1. Connect the cable to measure its
loss to the RF out port of the
instrument.
2. Connect the Short standard of the
Cal Kit to the end of the cable to be
tested
Cable Loss measurement result is
displayed on the screen.
Table 4.6 Cable Loss Measurement Procedure
4.3.4.1 Scale Adjustment
Press the Auto Scale key to optimize the Y scale and display an
entire trace.
Press the AMP key to set the maximum and minimum values on
the Y scale manually.
Press the Scale key to select a display unit of the Y scale.
4.3.4.2 Using Markers
Depending on the draw type setting, four or six markers can be used
simultaneously. The level of a current trace is displayed next to each marker
on the screen, but the frequency information is not provided. Activate a
marker table to see both level and frequency information when moving a
marker to the specific frequency using the Marker Edit.
96
Page 97

Figure 4.15 Using Markers in Cable Loss Measurement Mode
4.4 Power Meter
The Power Meter is to measure the transmission power of the system. This
function can be used only with optional external power sensors. Two kinds
of power sensors, the average power sensor and peak power sensor, are
available depending on the type of transmission power signals to be
measured.
4.4.1 Connecting Sensors
Selecting the Power Meter function after power up will display Power Meter
measurement screen with the message that “Please, connect external power
sensor and press Initialize menu key” is connected.
97
Page 98

Figure 4.16 Power Measurement Screen
Connect a power sensor to the USB interface port of the instrument using
the provided cable as Figure 4.17. Do not connect a power sensor directly
to the LPA or HPA.
Figure 4.17 Power Sensor Connection Diagram
After connecting a power sensor, select the
the instrument to recognize the sensor. After successful recognition of the
Initialize
screen menu key for
98
Page 99

power sensor, the sensor type is displayed on the screen as in Figure 4.18.
Since no power source is connected to the sensor yet, an alarm message “-
- - -” is displayed on the screen
Figure 4.18 Power Sensor Initial Screen
No sensor type is displayed on the screen if the instrument fails to recognize
a sensor type during the initialization process.
4.4.2 Setting Power Meter
All the keys used to set the power measurement are displayed as
screen menu keys on the screen.
Initialize
calibration data from the sensor.
Frequency
the frequency setting affects the calibration data, be sure to set
the accurate center frequency for reliable measurement results.
: Initializes the power sensor and downloads the
: Sets the frequency of signals to measure. Note: As
99
Page 100

Do not connect the power sensor directly to
the output of the HPA. The power sensor will
be damaged if output power greater than
+10dBm is supplied directly.
Ext. Offset
or an amplifier is used before the power sensor. Note: As the
default setting is Loss, enter the level of Loss in positive value
when an attenuator is used and enter the level of gain in
negative value when an amplified is used.
Unit
units are selected as Watts, depending on the measured power
level, the units are altered as W(Watt), mW(milli Watt), or
uW(micro Watt) automatically.
Preset
: Enters the value of Gain or Loss when an attenuator
: Selects the measurement unit. Note: In the case where the
: Clears all user settings and returns to initial settings.
4.4.3 Power Measurement
After connection and initialization of a power sensor, connect the power
sensor to the output port of the device
Figure 4.19 HPA (High Power Amplifier) Output Power Measurement
100
 Loading...