

Page 1
RANGER
Neo Lite
RANGER
Neo+
TV & SATELLITE ANALYSER
- 0 MI2128 -
Page 2
SAFETY NOTES
Read the user’s manual before using the equipment, mainly "SAFETY RULES"
paragraph.
The symbol on the equipment means "SEE USER’S MANUAL". In this manual
August also appear as a Caution or Warning symbol.
WARNING AND CAUTION statements August appear in this manual to avoid injury
hazard or damage to this product or other property.
MULTIMEDIA CONTENT
You can access instantly to any chapter by clicking on the title of the chapter in the
table of contents.
Click on the arrow at the top right of the page to return to the table of contents.
Throughout this manual are boxes with the symbol . It identifies a direct
access to an explanatory video related to the function where it is. User has to click on
this icon to watch the video.
All videos are in the PROMAX channel on YouTube, which is accessible through the
PROMAX website at: www.promaxelectronics.com
USER'S MANUAL VERSION
Version
Date
Software Version
1.1
March 2017
23.2
Please update your equipment to the latest software version available
This user's manual describes operation for models RANGER
Neo
Lite and
RANGER Neo +. Differences between them are specified by an
asterisk(*).
Screen captures of current manual are from the RANGER
Neo
+.
Page 3

March 2017
SAFETY RULES
* The safety could not be assured if the instructions for use are not closely
followed.
* Use this equipment connected only to systems with their negative of
measurement connected to ground potential.
* The AL-103 external DC charger is a Class I equipment, for safety reasons plug it
to a supply line with the corresponding ground terminal.
* This equipment can be used in Overvoltage Category I installations and
Pollution Degree 2 environments.
External DC charger can be used in Overvoltage Category II, installation and
Pollution Degree 1 environments.
* When using some of the following accessories use only the specified ones to ensure
safety.:
Rechargeable battery
External DC charger
Car lighter charger cable
Power cord
* Observe all specified ratings both of supply and measurement.
* Remember that voltages higher than 70 V DC or 33 V AC rms are dangerous.
* Use this instrument under the specified environmental conditions.
* When using the power adaptor, the negative of measurement is at ground
potential.
* Do not obstruct the ventilation system of the instrument.
* Use for the signal inputs/outputs, specially when working with high levels,
appropriate low radiation cables.
* Follow the cleaning instructions described in the Maintenance paragraph.
Page 4
March 2017
* Symbols related with safety:
Descriptive Examples of Over-Voltage Categories
Cat I Low voltage installations isolated from the mains.
Cat II Portable domestic installations.
Cat III Fixed domestic installations.
Cat IV Industrial installations.
CAUTION: The battery used can present danger of fire or chemical burn if it is
severely mistreat. Do not disassembly, cremate or heat the battery above 100 °C
under no circumstances.
Page 5

March 2017
T A B L E O F C O N T E N T S
1 INTRODUCTION ....................................................................................... 1-1
1.1 Description ................................................................................... 1-1
2 SETTING UP ............................................................................................ 2-3
2.1 Package Content ............................................................................ 2-3
2.2 Power ........................................................................................... 2-3
2.2.1 First charge ............................................................................... 2-4
2.2.2 Charging the battery .................................................................. 2-4
2.2.3 Charge/discharge times .............................................................. 2-5
2.2.4 Energy saving ............................................................................ 2-5
2.2.5 Smart control battery* ............................................................... 2-6
2.2.6 Usage Tips ................................................................................ 2-6
2.3 Equipment Details .......................................................................... 2-7
2.3.1 RANGER
Neo
Lite .................................................................... 2-7
2.3.2 RANGER
Neo
+ ....................................................................... 2-9
2.4 Switching On/Off the equipment .................................................... 2-11
2.5 Reset ......................................................................................... 2-11
2.6 Screen Icons and Dialog boxes ...................................................... 2-12
2.7 Menu Tree .................................................................................. 2-13
2.8 Controls ...................................................................................... 2-17
2.8.1 Touch Screen .......................................................................... 2-17
2.8.2 Joystick .................................................................................. 2-24
2.8.3 Joystick Operation .................................................................... 2-25
2.8.4 Select and edit parameters ....................................................... 2-26
2.8.5 Keyboard shortcuts .................................................................. 2-27
2.8.6 Softkeys ................................................................................. 2-28
2.8.7 Virtual Keyboard ...................................................................... 2-29
3 SETTINGS AND PREFERENCES ................................................................. 3-30
3.1 Setting Menu ............................................................................... 3-30
3.2 Video & Audio settings .................................................................. 3-32
3.3 Preferences Menu ........................................................................ 3-33
4 RF SIGNAL TUNING (Terrestrial and Satellite Band) .................................... 4-39
4.1 Introduction ................................................................................ 4-39
4.2 Operation ................................................................................... 4-39
4.3 General Menu Options .................................................................. 4-40
4.3.1 F1: Tuning – Selecting Channel / Frequency ................................ 4-40
4.3.2 F2: Signal Parameters .............................................................. 4-43
4.3.3 F3: Tools ................................................................................ 4-44
4.4 Advanced Options ........................................................................ 4-46
4.5 Screen Description ....................................................................... 4-49
4.5.1 Measurement Mode Screens ...................................................... 4-49
4.5.2 Spectrum Analyser Mode Screens .............................................. 4-52
4.5.3 TV Mode Screens ..................................................................... 4-57
4.6 Extra Information ........................................................................ 4-63
4.6.1 StealthID Function ................................................................... 4-63
4.6.2 Generic Signal ......................................................................... 4-64
Page 6

March 2017
4.6.3 Locking a signal ....................................................................... 4-64
4.6.4 Satellite Identification ............................................................... 4-65
4.6.5 IRG Descritor .......................................................................... 4-66
4.7 Tools .......................................................................................... 4-67
4.7.1 Constellation ........................................................................... 4-67
4.7.2 LTE Ingress test ....................................................................... 4-70
4.7.3 Echoes .................................................................................... 4-73
4.7.4 MER by carrier* ....................................................................... 4-75
4.7.5 MEROGRAM* ........................................................................... 4-76
4.7.6 Spectrogram* .......................................................................... 4-79
4.7.7 Attenuation Test ...................................................................... 4-81
4.7.8 Signal Monitoring* ................................................................... 4-84
4.7.9 Datalogger .............................................................................. 4-91
4.7.10 Screen and Data capture (Export key) ........................................ 4-98
4.7.11 Explore Channel Plan .............................................................. 4-100
4.7.12 Discover FM stations .............................................................. 4-103
4.7.13 Field Strength ........................................................................ 4-106
4.7.14 Task Planner ......................................................................... 4-111
5 WIFI SIGNAL TUNING ........................................................................... 5-116
5.1 Introduction .............................................................................. 5-116
5.2 Operation ................................................................................. 5-116
5.3 Settings .................................................................................... 5-117
5.4 WiFi Spectrum ........................................................................... 5-117
5.4.1 Introduction .......................................................................... 5-117
5.4.2 Screen Description ................................................................. 5-118
5.4.3 Menu Options ........................................................................ 5-119
5.5 Site survey ............................................................................... 5-120
5.5.1 Introduction .......................................................................... 5-120
5.5.2 Screen Description ................................................................. 5-121
5.5.3 Menu Options ........................................................................ 5-122
6 INSTALLATIONS MANAGEMENT .............................................................. 6-123
6.1 Description ............................................................................... 6-123
6.2 Operation ................................................................................. 6-123
6.3 Installation Management ............................................................ 6-124
6.4 New installation ......................................................................... 6-128
6.5 Tools ........................................................................................ 6-128
6.6 Importing Data from USB ........................................................... 6-129
7 CONNECTING TO EXTERNAL DEVICES ..................................................... 7-131
7.1 USB connector ........................................................................... 7-131
7.1.1 Connecting a USB flash drive ................................................... 7-131
7.1.2 Connecting the RANGER Neo to the WiFi USB adapter ................ 7-133
7.2 Connecting to a computer via Ethernet ......................................... 7-133
7.3 Digital V/A Output via HDMI connector ......................................... 7-133
7.4 Analogue V/A Input via jack connector ......................................... 7-134
7.5 Connecting to antenna via RF Connector ....................................... 7-134
7.5.1 DiSEqC commands ................................................................. 7-134
7.5.2 SCD/EN50494 (SatCR) commands ........................................... 7-135
7.5.3 SCD2/EN50607 (JESS) commands ........................................... 7-136
Page 7

March 2017
8 SPECIFICATIONS .......................................................................... 8-139
8.1 RANGER
Neo
Lite .................................................................... 8-139
8.1.1 General ................................................................................ 8-139
8.1.2 Measurement Mode ................................................................ 8-141
8.1.3 Spectrum Analyser Mode ........................................................ 8-144
8.1.4 WiFi Analyser Mode ................................................................ 8-145
8.1.5 TV Mode ............................................................................... 8-146
8.1.6 Tools .................................................................................... 8-147
8.2 RANGER
Neo
+ ....................................................................... 8-148
8.2.1 General ................................................................................ 8-148
8.2.2 Measurement Mode ................................................................ 8-150
8.2.3 Spectrum Analyser Mode ........................................................ 8-153
8.2.4 TV Mode ............................................................................... 8-155
8.2.5 Tools .................................................................................... 8-156
8.2.6 Options ................................................................................. 8-157
9 MAINTENANCE ....................................................................................158
9.1 Instructions for returning by mail .....................................................158
9.2 Considerations about the Screen ......................................................158
9.3 Cleaning Recommendations ............................................................158
ANNEX 1 OPTICAL OPTION OP-001-PS* ..........................................................160
ANNEX 2 SIGNAL COVERAGE OPTION OP-001-GPS* ........................................169
ANNEX 3 OPTION DAB/DAB+ OP-001-DAB* ....................................................182
ANNEX 4 MULTIMEDIA CONTENT ...................................................................190
Page 8

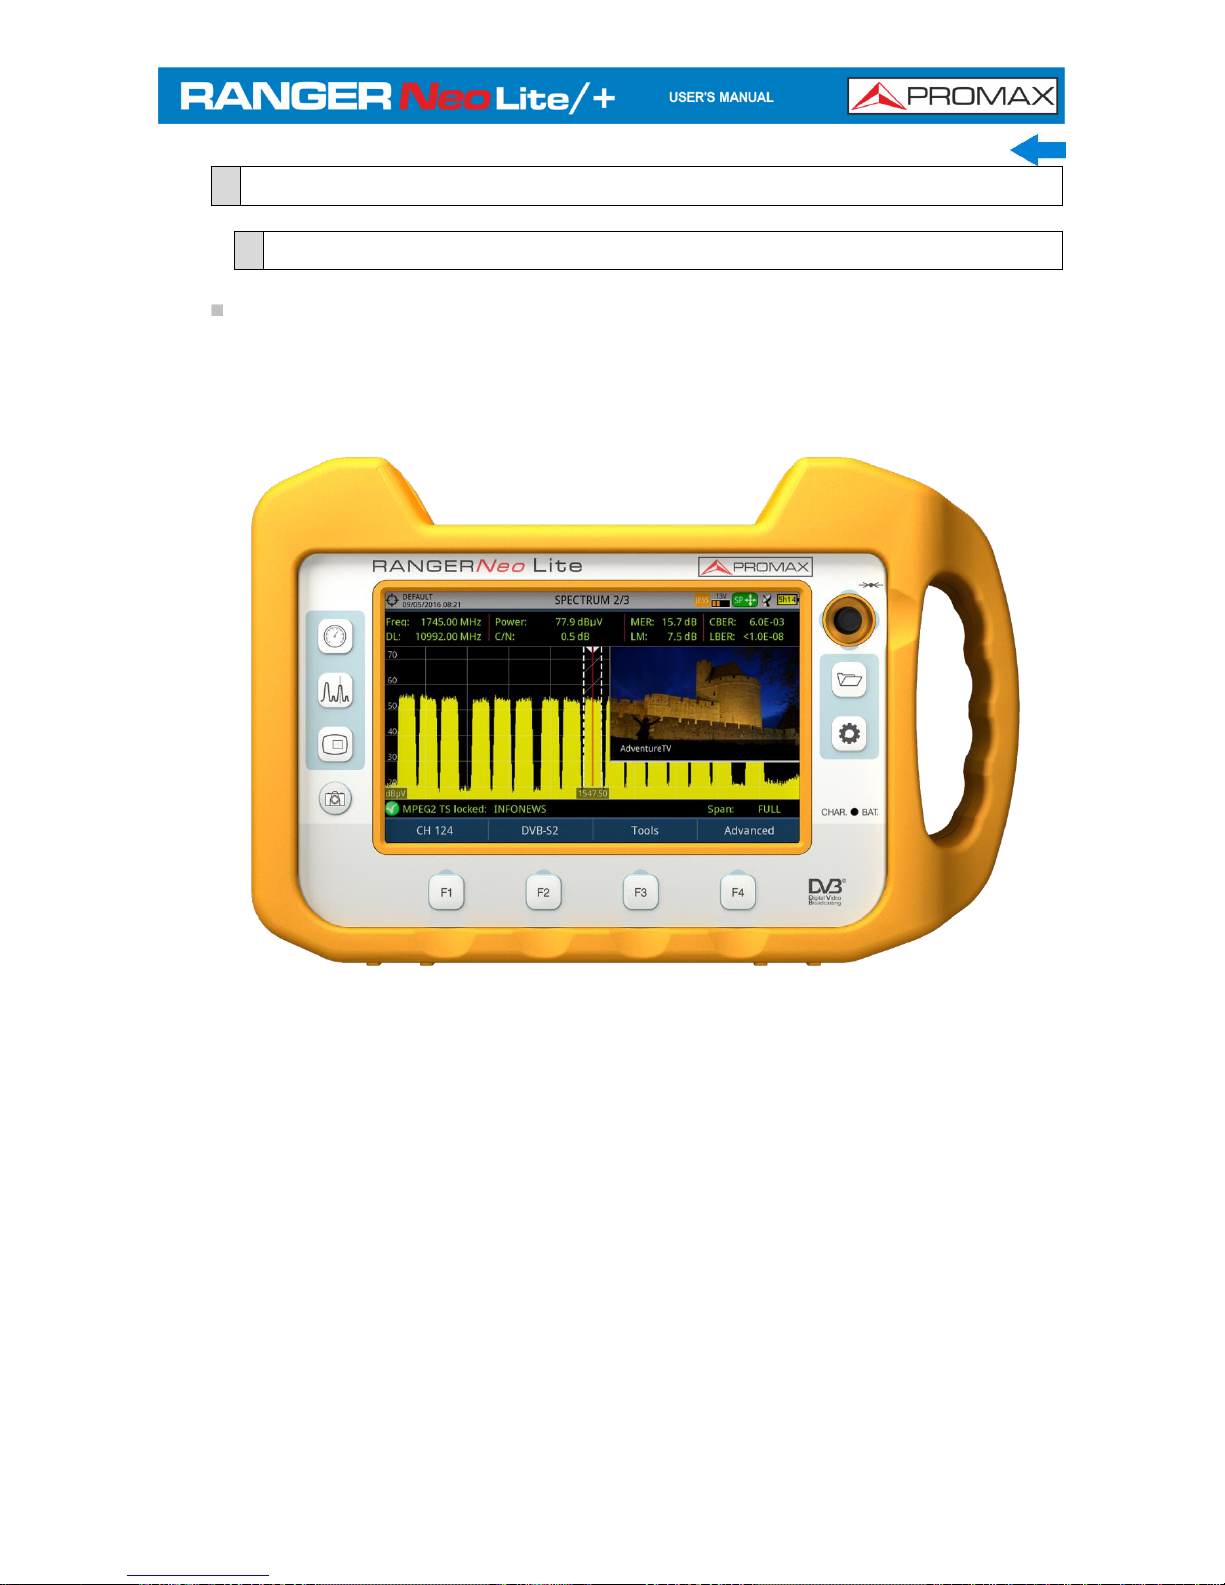
March 2017 1-1
TV & SATELLITE ANALYSER
RANGER
Neo
Lite
RANGER
Neo
+
1
1 INTRODUCTION
1.1
Description
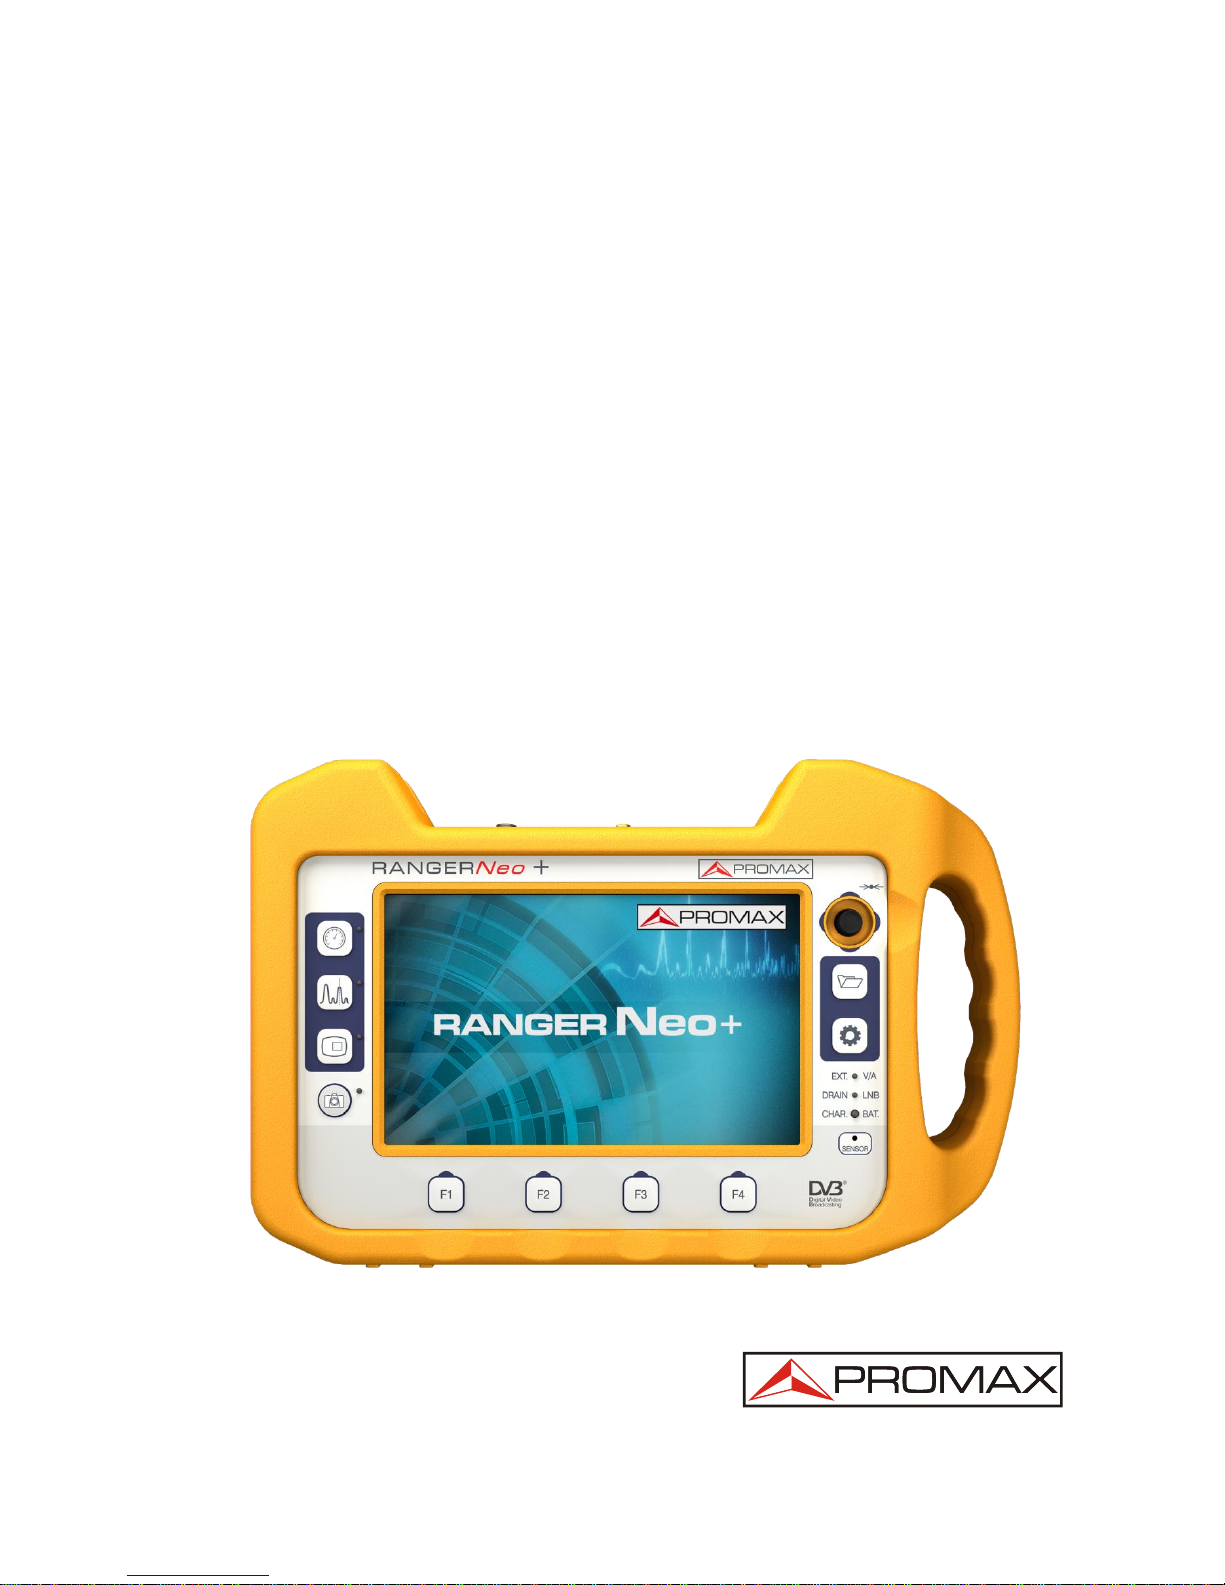
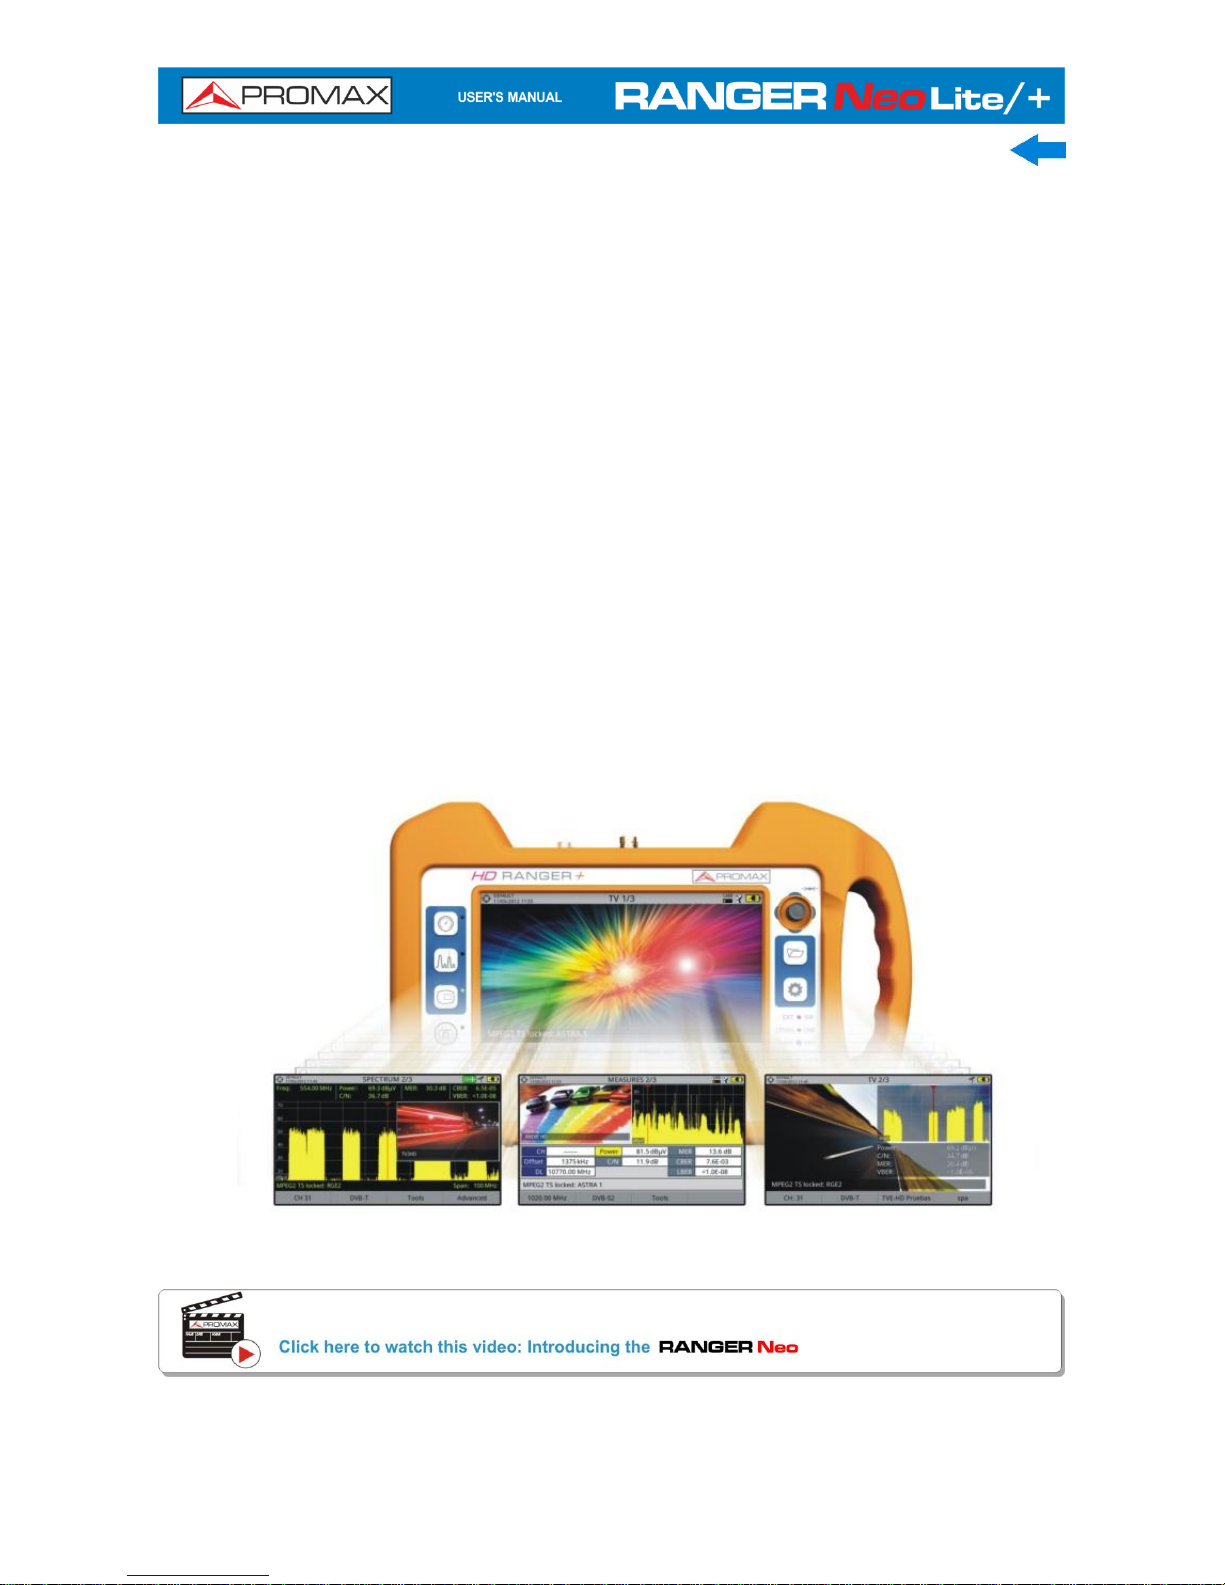
The new RANGER
Neo
is the seventh generation of field meters that PROMAX
launches. As each new generation, it represents an evolution from the previous,
since it integrates the latest technological innovations and develops applications
for the new demands and needs that have emerged in recent years.
The new RANGER
Neo
has been created with the aim to make easy the user
experience. From its ergonomic design and stylized lines to the reduction of keys
and the easy use of its interface, everything has been designed so the user has a
simple tool to use but powerful and useful.
Figure 1.
The RANGER
Neo
is a universal analyser that covers several of the most
popular standards of the DVB family, as well as formats such as MPEG-2 H.265
or MPEG-4 and Dolby audio.
1
Trademark of the DVB - Digital Video Broadcasting Project.
Page 9
1-2 March 2017
Besides the basic functions of TV meter and spectrum analyser for terrestrial and
satellite band, it provides additional tools, such as the detection of 4G signal
interferences (some of its working frequencies are close to the TV bands), the
diagrams constellations or the echoes detection.
The RANGER
Neo
has an application to manage data generated at each
installation. This feature helps the user to manage information generated so he
can access it at any time or download it to a PC for further analysis.
The RANGER
Neo
+ has some tools that differentiate it from the RANGER
Neo
Lite, such as Spectrogram, web remote control, MER by carrier, etc. In
addition, the RANGER
Neo
+ has several expansion modules to adapt to
different environments: the optical module for measurement in fiber optic
installations, the GPS module for mobile measurement or the DAB module for
digital radio measurement.
The RANGER
Neo
has been designed and developed entirely in the European
Union. A multidisciplinary team of highly qualified professionals has dedicated
effort and commitment to the development of a powerful, efficient and reliable
tool. During the manufacturing process, all used materials have been subjected
to a strict quality control.
In an effort to facilitate its work to professionals, our long experience ensures an
after sales quality service, which includes software updates and upgrades for
free.
Figure 2.
Page 10
March 2017 2-3
2 SETTING UP
2.1
Package Content
Check that your package contains the following elements:
RANGER
Neo
Analyser.
External DC charger.
Mains cord for external DC charger.
Car lighter charger.
Dual WiFi Antenna.
USB WiFi adapter.
Aero SMA-H/BNC-M adapter.
"F" Adapters.
• "F" / H - BNC / H Adapter.
• "F" / H - DIN / H Adapter.
• "F" / H - "F" / H Adapter.
Support belt and carrying bag.
4V/RCA Jack Cable.
Monopode.
Transport suitcase*.
Quick Start Guide.
NOTE: Keep the original packaging, since it is specially designed to protect the
equipment. You August need it in the future to send the analyser to be
calibrated.
2.2
Power
The RANGER
Neo
is powered by a 7.2 V built-in rechargeable Li-Ion battery of
high quality and long operation time.
This equipment can operate on battery or connected to the mains using a DC
adapter. An adapter is also supplied to use with the power connector car
(cigarette lighter).
*only available for RANGER
Neo +
Page 11
2-4 March 2017
2.2.1
First charge
The equipment comes with the battery half charged. Depending on the time
elapsed from first charge and environmental conditions August have lost some of
the charge. You should check the battery level. It is advisable a first full charge.
2.2.2
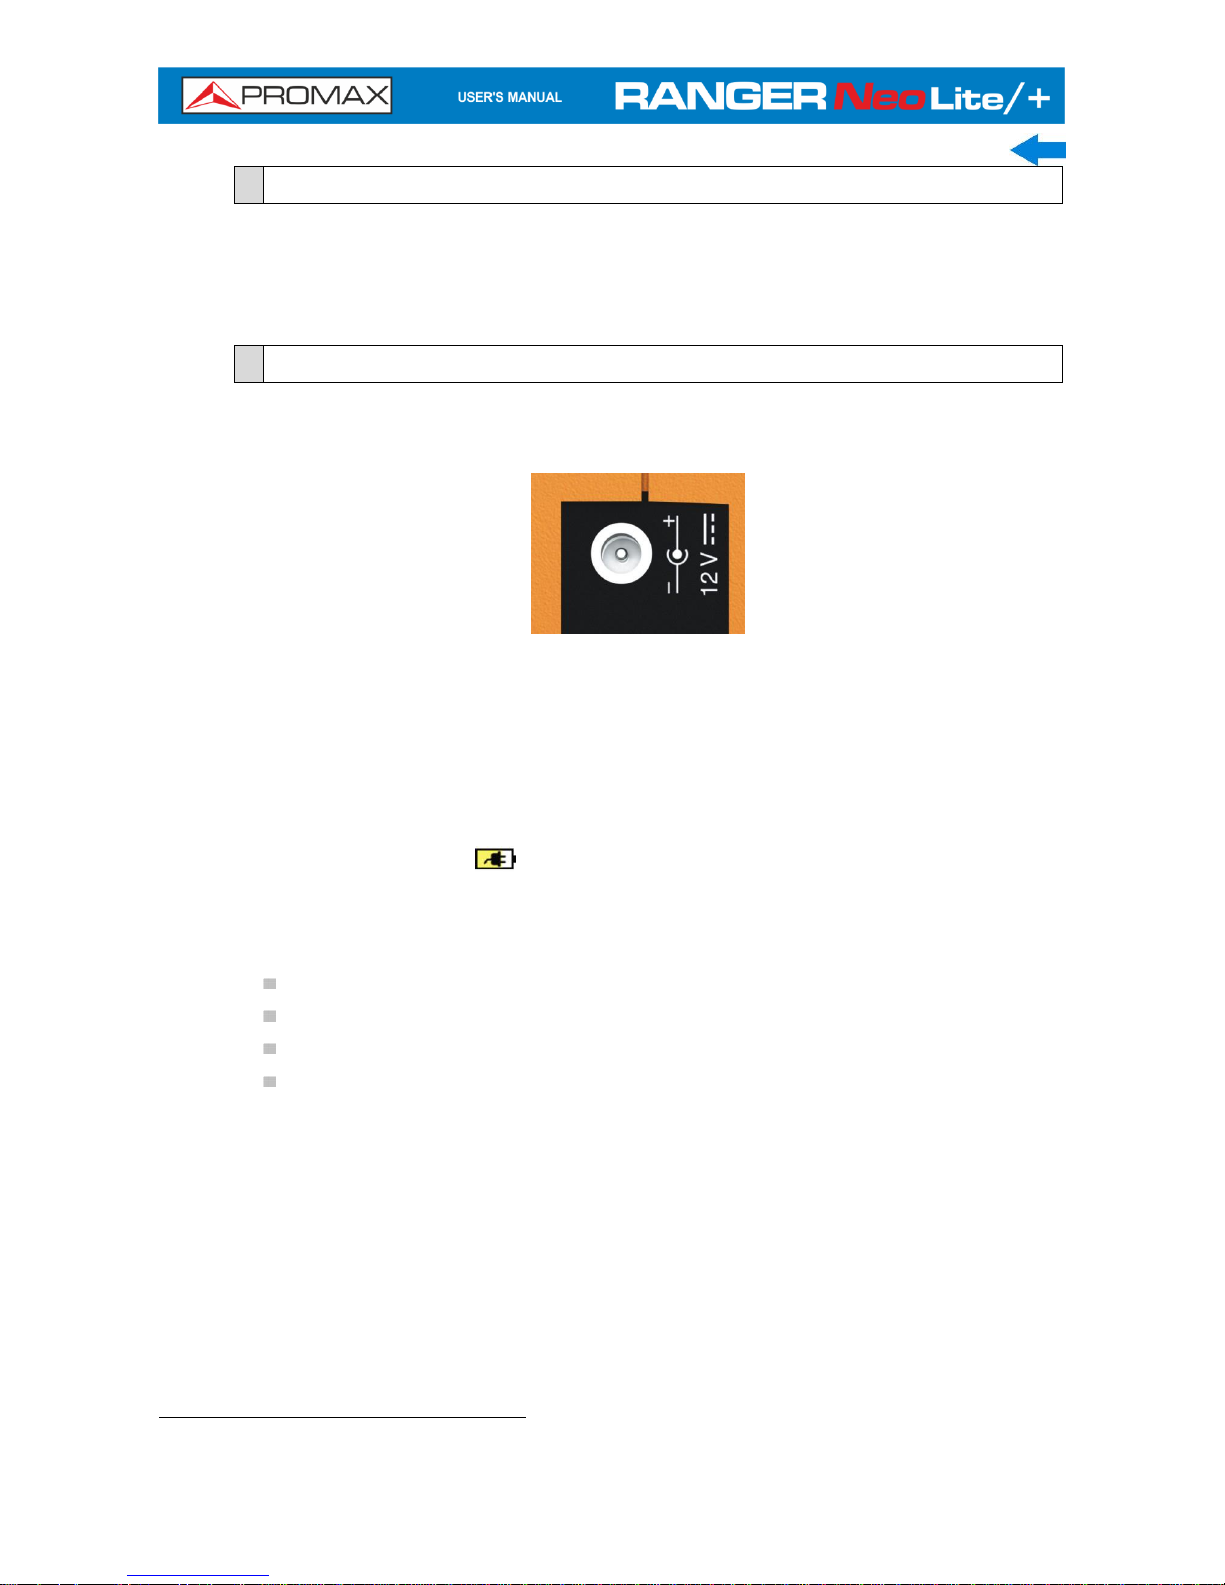
Charging the battery
Connect the DC power adapter to the equipment through the power connector on
the left side panel (see figure 3).
Figure 3.
Then connect the DC power adapter to the mains via the mains cord. Ensure that
your mains voltage is compatible with the adapter voltage.
For a fast charging of the battery is necessary to switch off the equipment.
If the equipment is ON, the battery charging will be slower, depending on the
type of work you are doing. When connecting the equipment to the mains the
mains connected symbol appears inside the battery icon.
The CHARGER led indicator shows the battery status:
Yellow: Battery charging.
Green: Battery full charge.
Blinking: Battery failure or no battery.
Off: Battery is not charging
When switching on the equipment, the battery voltage is checked. If the tension
is too weak to start, the LED EXT* and DRAIN* flashes and the equipment does
not start up. In this case please charge the battery immediately.
*only available for RANGER
Neo +
Page 12
March 2017 2-5
2.2.3
Charge/discharge times
Average charging time with the equipment off (fast charge):
3 hours to achieve an 80% charge.
5 hours to achieve a 100% charge.
With the equipment on (slow charge):
5 hours to achieve an 80% charge.
8 hours to achieve a 100% charge.
► RANGER
Neo
Lite
Average discharge time (with external supply disabled):
With the battery full charge the average battery time is 3 hours.
With the battery at 80% charge the average battery time is 2 h.
► RANGER
Neo
+
Average discharge time (with external supply disabled):
With the battery full charge the average battery time is 5:30 hours.
With the battery at 80% charge the average battery time is 4 h.
2.2.4
Energy saving
These options are available in the Preferences menu, pressing the key for
1s.
Power Off: It allows the user to select the time to power off, which is the
time after which the equipment shuts down automatically unless user press
any key.
TFT Screen: User can select a time after which the TFT screen turns off, but
the equipment is still running normally. The equipment can measure (for
example, making a datalogger or channel exploration) and the battery will
last longer, about 10 % more. The screen turns on by pressing any key. Time
options are: off, 1, 5, 10 or 30 minutes.
Page 13
2-6 March 2017
2.2.5
Smart control battery*
The built-in battery of the equipment is of the "smart" type, which means that
reports its state of charge. This information is displayed inside the battery icon in
the form of the average time available. In this way the user can know at any
time the remaining battery level.
The remaining time charge that appears is calculated according to the work that
has been doing. If you activate the external supply of the equipment, the
average time would be reduced according to the increase in consumption that
occurs.
2.2.6
Usage Tips
The battery is losing storage capacity as you go through its life. Contact your
PROMAX distributor when necessary to replace the battery.
To prolong battery life the user should follow these tips:
In case of providing a long inactivity period of the equipment it is
advisable to make every 3 months a charge / discharge cycle and a
subsequent partial charge (40% aprox.).
It is advisable to keep it in a cool place and away from heat.
You should avoid keeping the battery for a long period of time at full load
or fully discharged.
There is not necessary to wait to fully discharge before a charge because
these batteries have no memory effect.
*only available for RANGER
Neo +
Page 14
March 2017 2-7
2.3
Equipment Details
2.3.1
RANGER
Neo
Lite
Front View
Figure 4.
Page 15
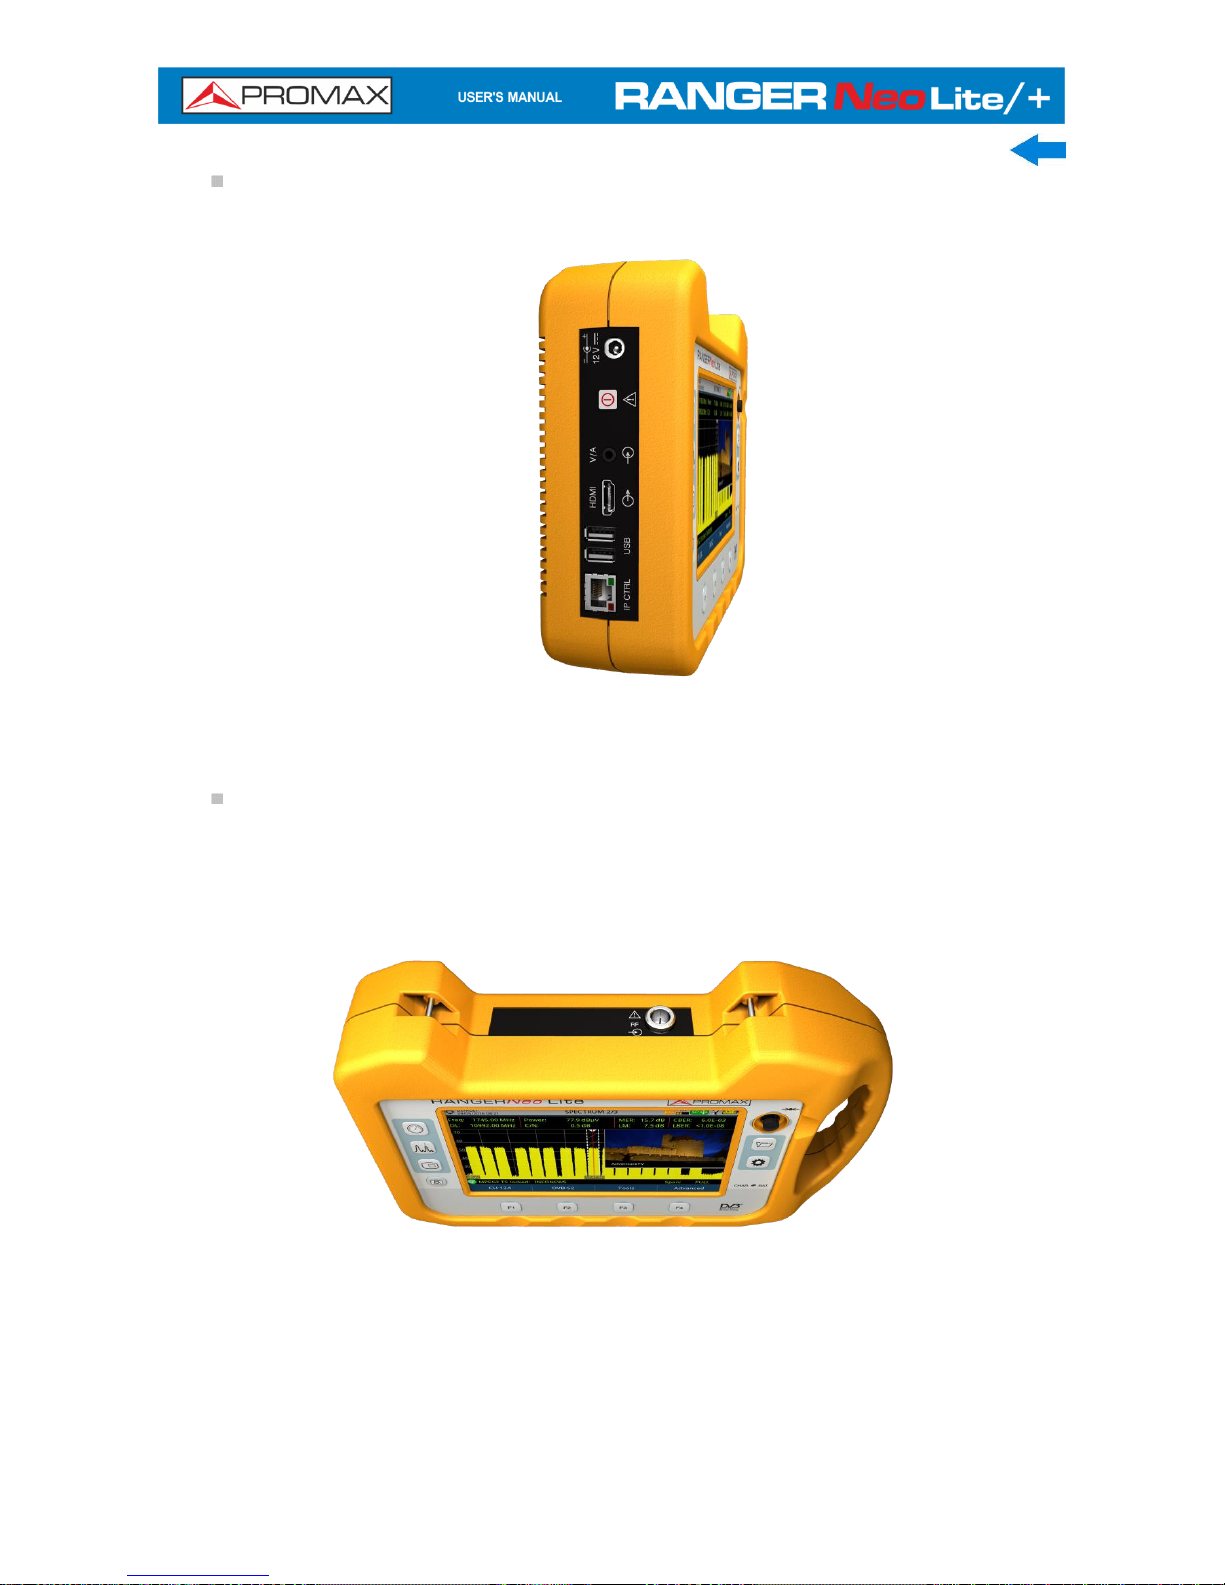
2-8 March 2017
Side view
Figure 5.
Top view
Figure 6.
Page 16
March 2017 2-9
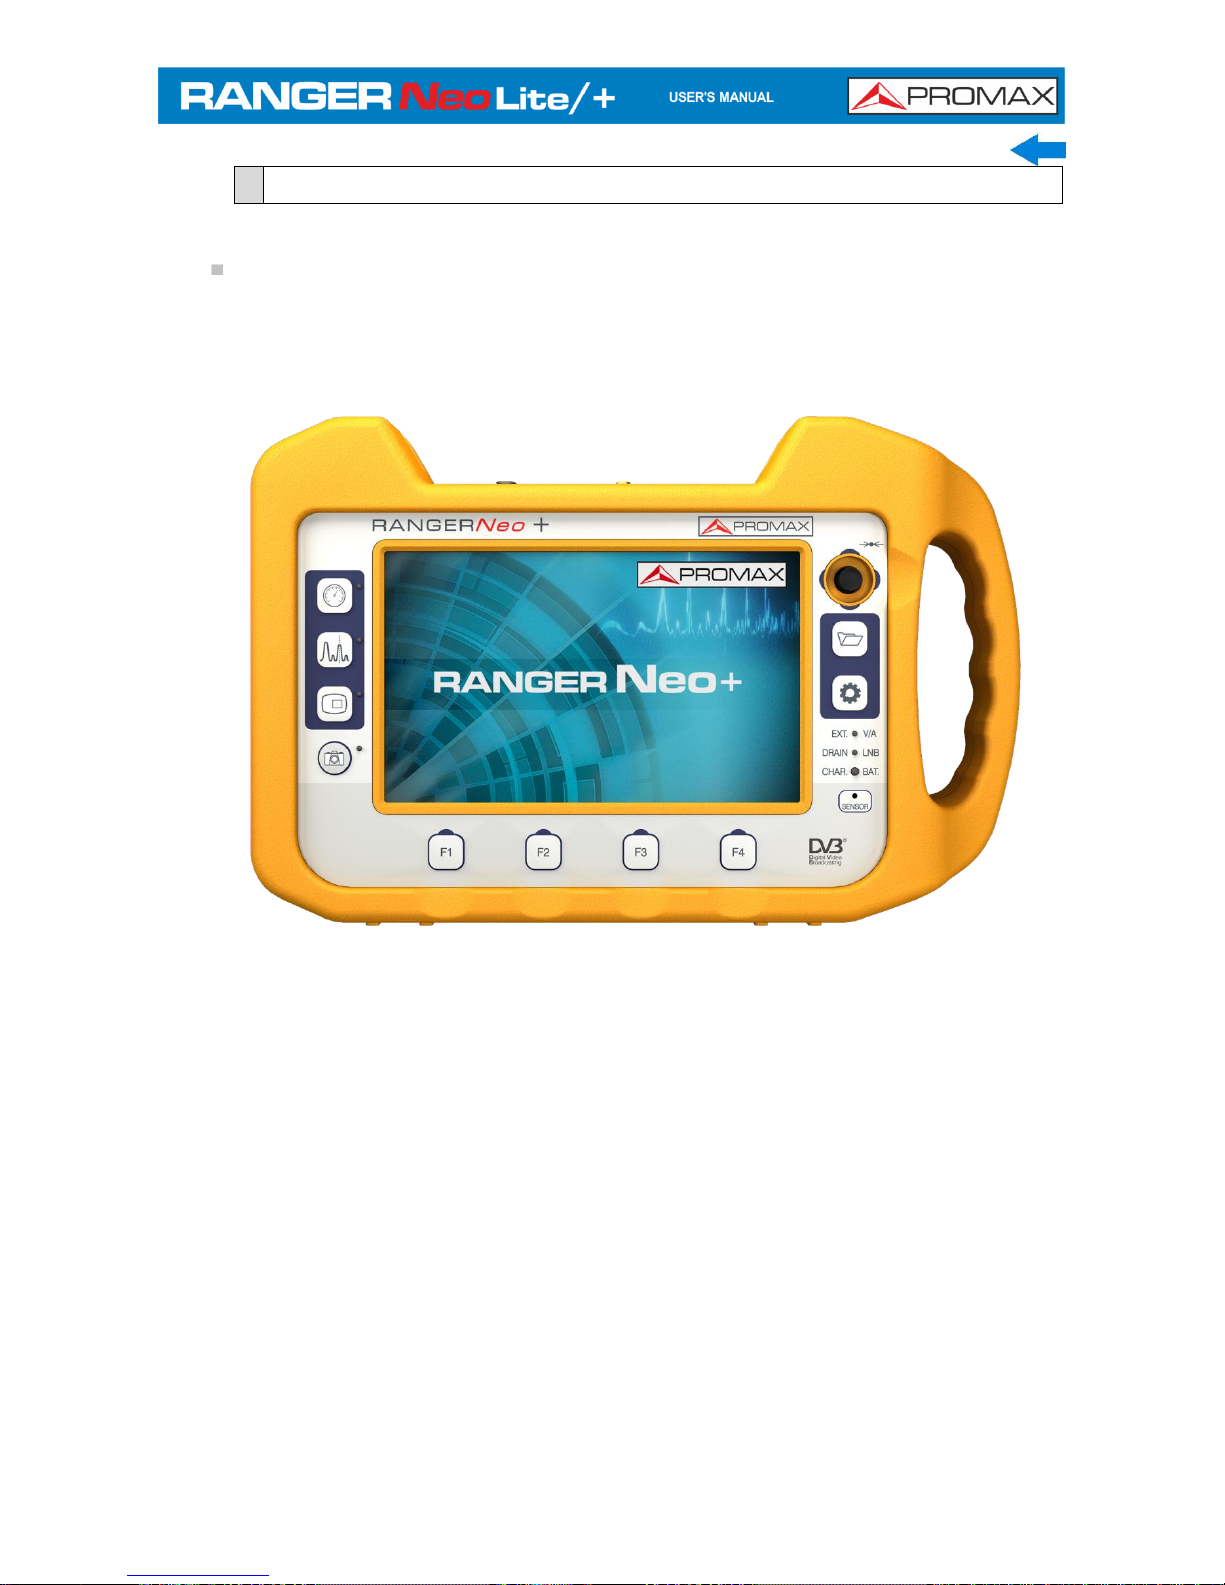
2.3.2
RANGER
Neo
+
Front View
Figure 7.
Page 17

2-10 March 2017
Side view
Figure 8.
Top view
Figure 9*.
* Optical Option. Refer to annex.
Page 18
March 2017 2-11
2.4
Switching On/Off the equipment
► Switching On:
Press for a while (approximately one second) the button located on the side
of the equipment.
When all indicators light up at once release the button.
The boot screen (user can select the boot screen from "Preferences"
menu) appears and also a progress bar that indicates the system load. At
the top left corner it shows the equipment model and the installed
software release detected.
After the system load, the last screen before shutdown appears.
► Switching Off:
Press the button located on the side of the equipment.
Short press (<1 s): A menu on screen allows the user to select
between power off or reboot.
Long press (>2 s): The equipment turns off directly.
When the screen goes off, user should release the button, which returns
to its rest position.
The boot screen picture appears and also a bar showing the system
shutdown progress.
The equipment keeps its last status (mode and screen) which is
recovered when power on.
In the PREFERENCES menu (press 1s), APPEARANCE tab, option "Off" the
user can activate the automatic shutdown option, selecting a waiting time (time
without pressing any key) after which the equipment turns off automatically.
2.5
Reset
How to RESET: Hold down the F4 key for 6 seconds and release.
When to RESET:
When it crashes and does not respond to any key. Hold down
the ON / OFF key for 10 seconds and if the meter does not turn off then
RESET.
Page 19
2-12 March 2017
When it does not switch on. If it does not start after trying turning
on by the normal procedure (by pressing the ON / OFF button with the
meter connected to the mains) then RESET.
When it does not finish the boot process. Hold down the ON /
OFF key for 10 seconds and if the meter does not turn off then RESET.
2.6
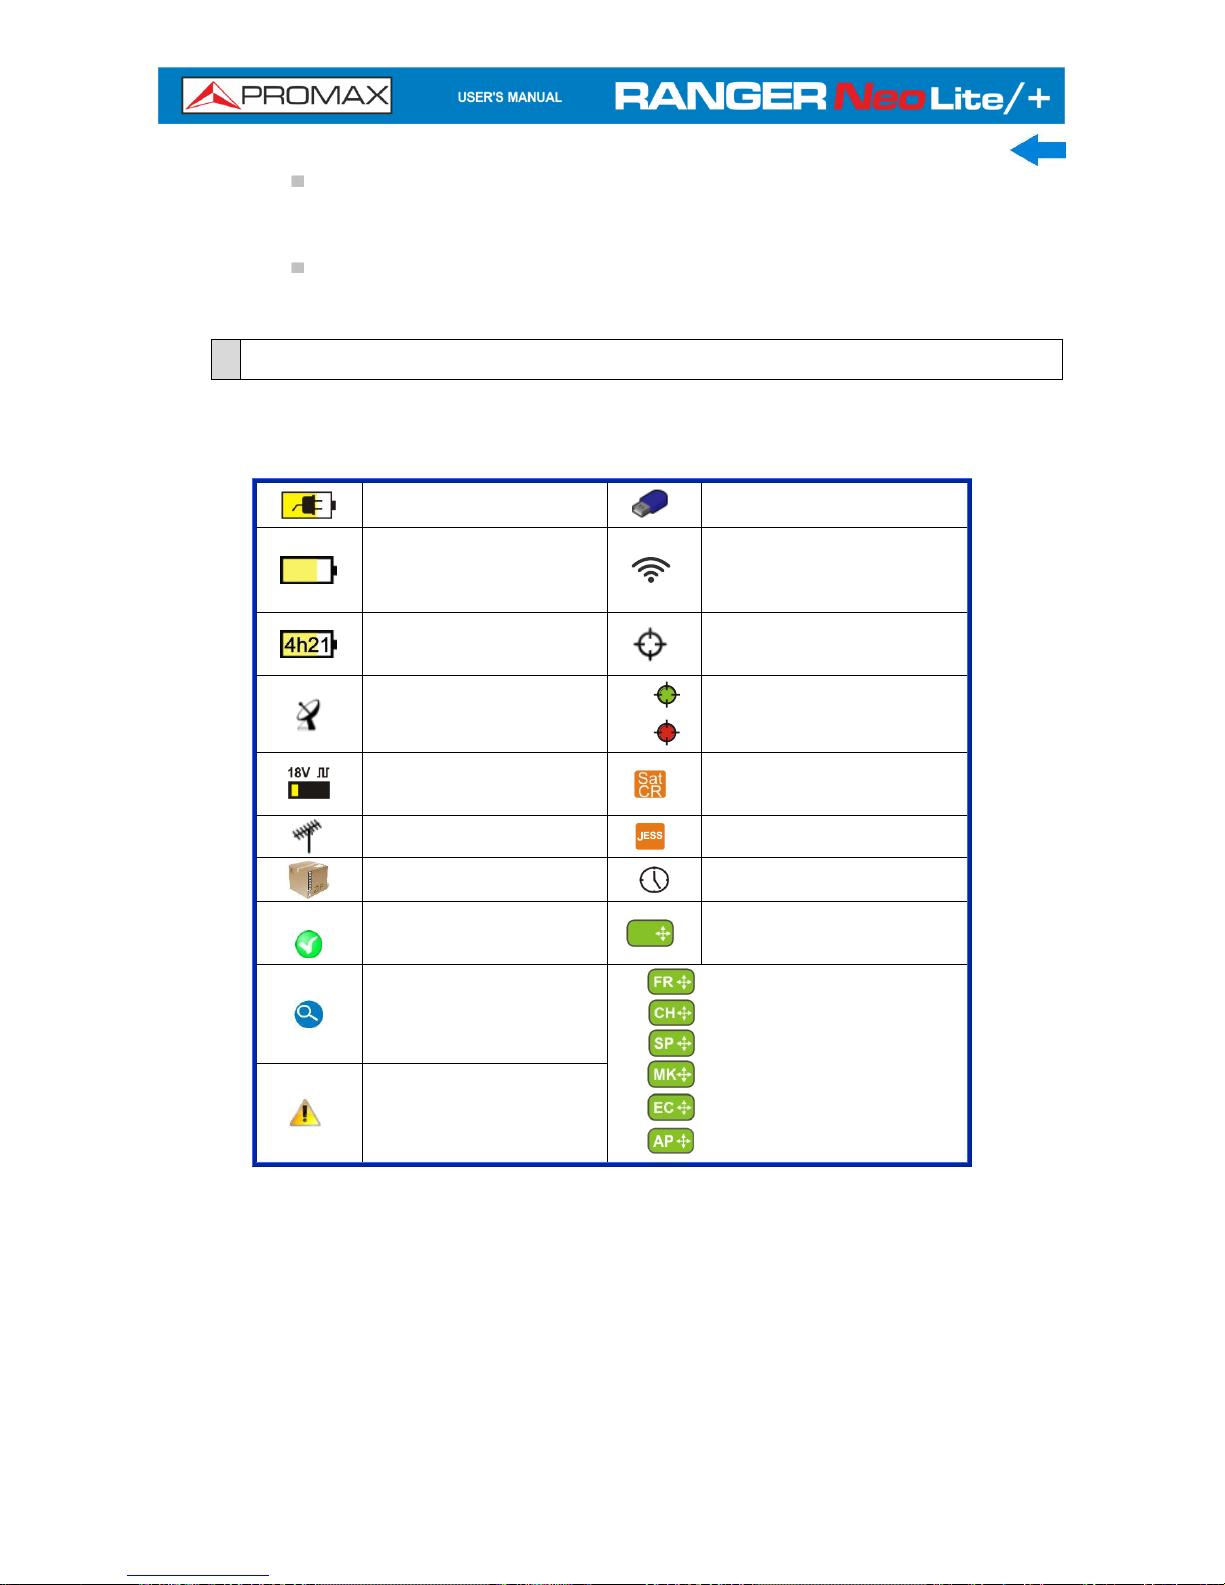
Screen Icons and Dialog boxes
On the screen are some icons that provide useful information to the user about
the current status of the instrument.
Battery charging.
USB flash drive inserted.
Battery not charging.
Yellow level indicates
charge left.
WiFi source Signal
Battery not charging,
time left indicator.
Current installation.
Satellite band.
GPS locked.
GPS unlocked.
Current voltage, 22 kHz
signal and LNB power
level.
SATCR (SCD/EN50494)
commands enabled.
Terrestrial band.
JESS (SCD2/EN50607)
commands enabled.
Compressed
installation.
Task scheduled.
OK.
Multi-function Joystick
enabled. Two-letter code
indicates the exact function:
Searching.
FR Frequency tuning.
CH Channel tuning.
SP Span change.
MK Marker moving.
EC Echo/zoom change.
AP WiFi Acces Point
Warning.
Page 20
March 2017 2-13
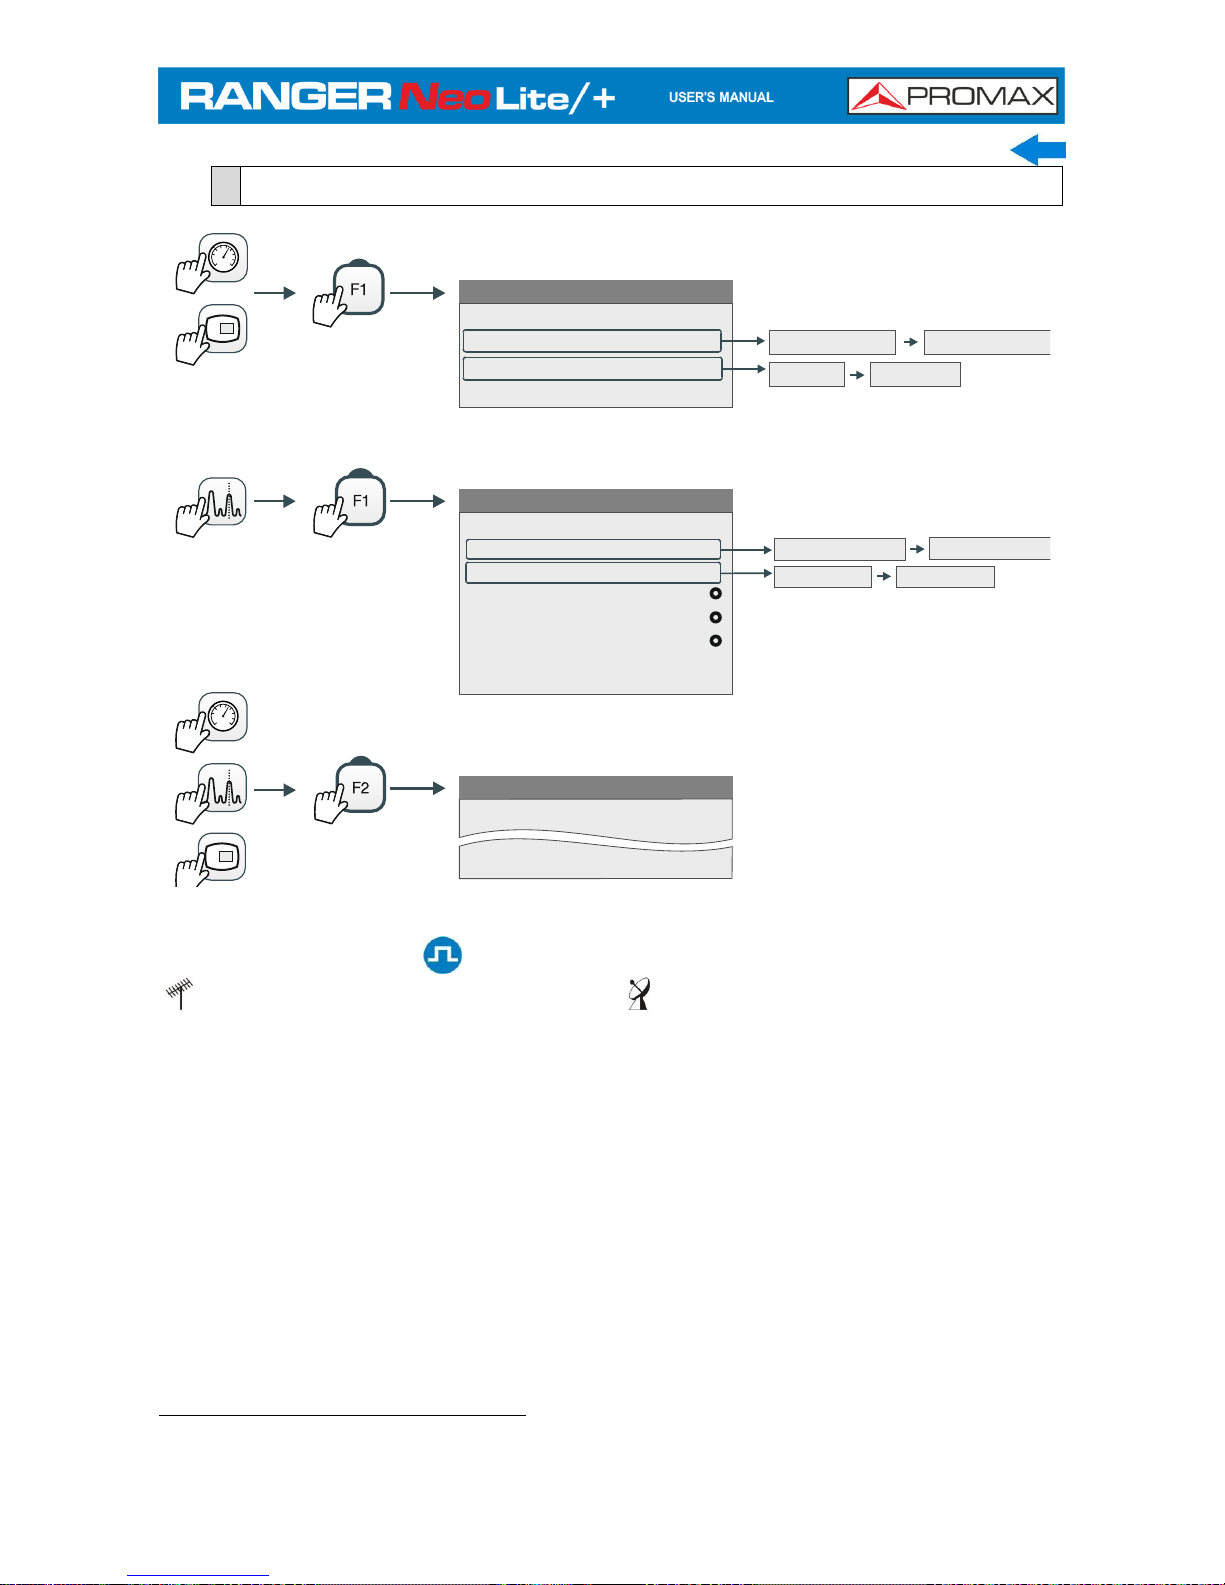
2.7
Menu Tree*
Tuning
Channel:
Channel Plan
Tune by:
View all services...
Channel Plan 1
Channel Plan 2
Channel Frequency
Signal Parameters
Signal Type:
View Advanced Parameters
Frequency:
Channel Plan:
Tune By:
Center Freq:
Ref. Level:
Span:
Center tuned frequency
View all services...
Tuning
Channel
Channel plan 1
Channel Plan 2
Frequency
Figure 10.
Only available for digital channels
Option available for terrestrial band
Option available for satellite band
* Some options on the menu tree are only available for RANGER
Neo
+
Page 21

2-14 March 2017
Figure 11.
Only available for digital channels
Only available for analogue channels
Option available for terrestrial band
Option available for satellite band
Page 22
March 2017 2-15
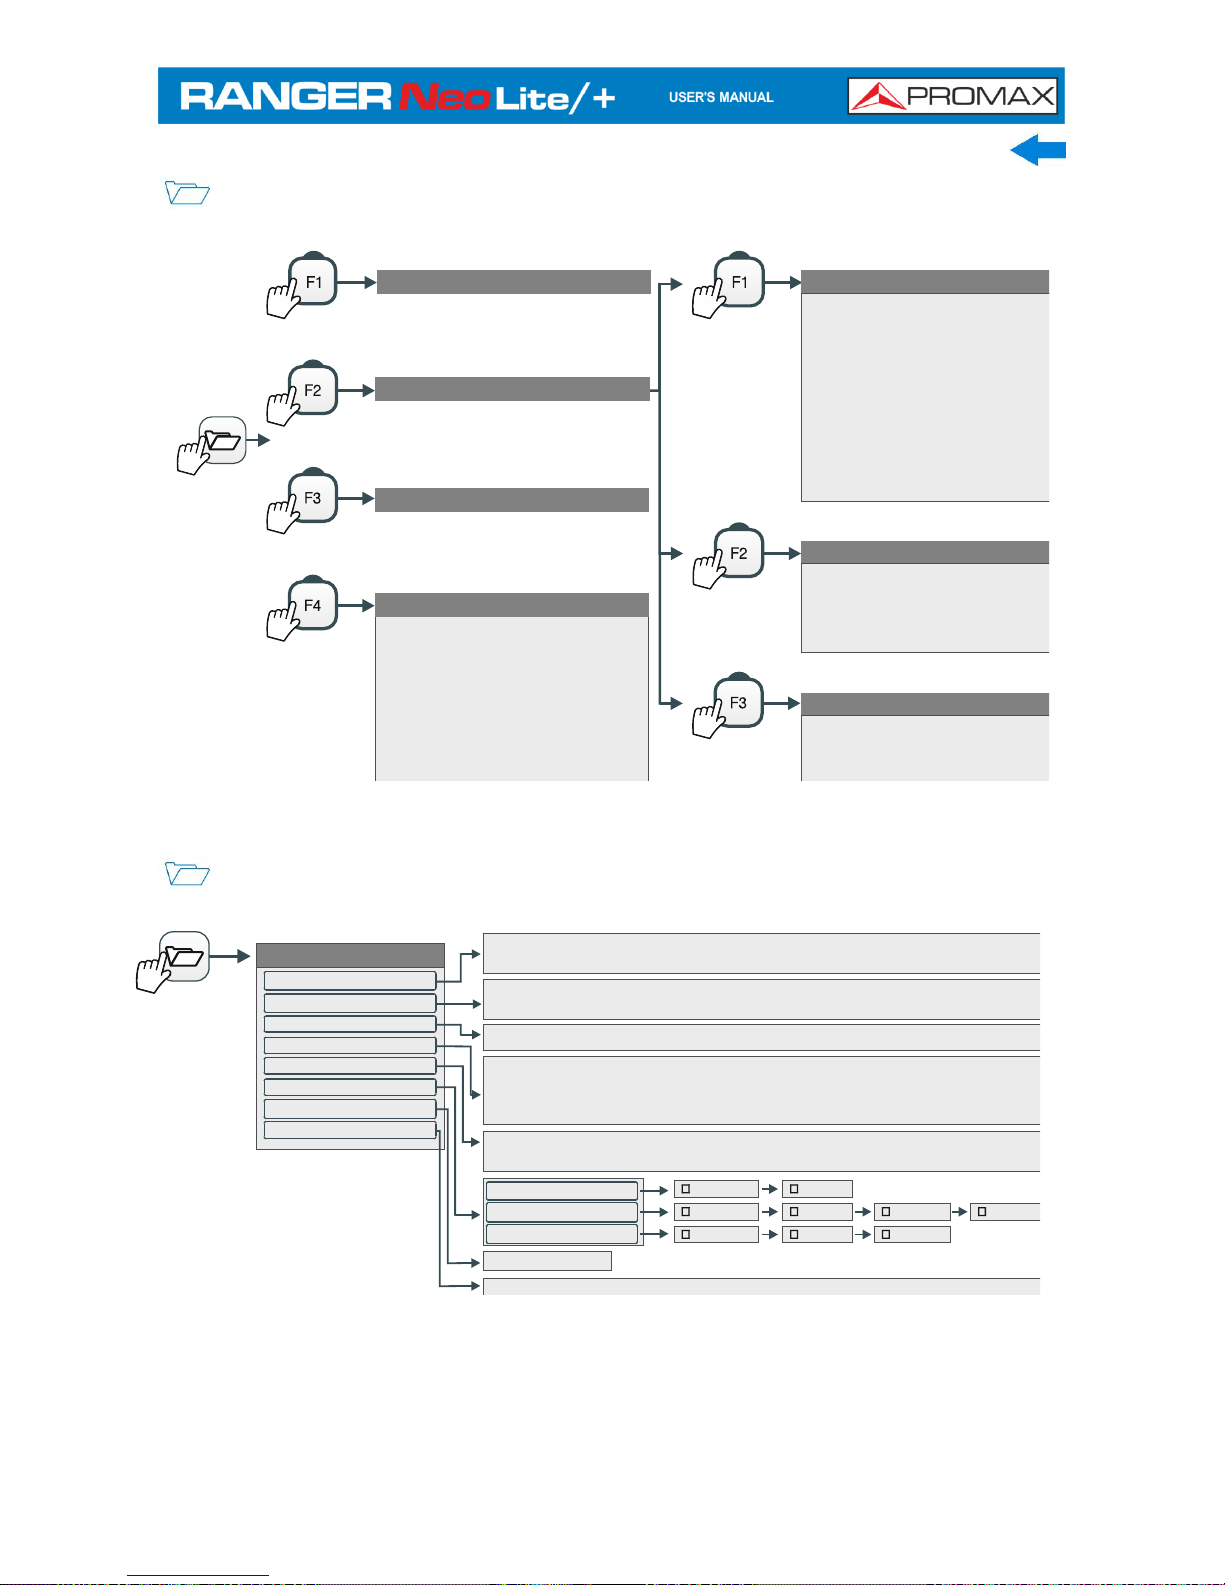
INSTALLATION MANAGEMENT MENU
Load
Manage
Create New
Tools
Mark All
Unmark All
Archive
Delete
Rename
Export to USB
Import from USB
Installed Antennas
Filter by Type
All (0)
Screen shots (0)
Channel Plans (0)
Dataloggers (0)
DiSEqC (0)
Data Captures (0)
Signal Monitoring (0)
Service Databases (0)
Antennas (0)
TS (0)
File
Mark All
Unmark All
Delete
Copy to USB
Installation
Add Channel Plan
Add Antenna Antena
Add DiSEqC Program
Figure 12.
PREFERENCES MENU
Figure 13.
Equipment
Appearance
Time and Date
Measures
Tools
Stealth-ID
Security
Network
Preferences
(1s)
Date: Time: Date Format: Time Zone:
PIN Code 1234
MAC: DHCP: IP Address: Mask: Gateway:
Datalogger PSI:
Database services:
Export button:
LTE Filter F.Min:
LTE Filter F.Max:
Center Freq:
Sat. Band:
Ref. Level:
Ter. Downlink
Terrestrial Units:
Satellite Units:
Optical Units:
Min. TER. Power:
Min. SAT. Power:
Min. TER. Level:
Min. FMI. Level:
np. Impedance:
Analog Terrestrial
Digital Terrestrial
Digital Satellite
Language:
Skin:
Power Off:
Background:
TFT Screen:
Color System:
Vibration:
Boot screen:
Values Format:
Provider
Name
SN
Release
Date
Free System Memory
Free Data Memory
Company
User
ANALOG FM
ANALOGDVB-S DVB-S2 DSS
ANALOGDVB-T DVB-C DVB-T2 DVB-C2
Page 23
2-16 March 2017
SETTINGS MENU
Figure 14.
Option available for terrestrial band
Option available for satellite band
Terrestrial Settings
Signal Source:
Band:
Supply Output:
Supply Voltage:
LNB Drain:
RF
WiFi
Terrestrial
Satellite
Enabled Disabled
External 24 V5 V 12 V
(1s)
Volume
Brightness
Color System:
Video & Audio Settings
PAL 50 Hz PAL 60 Hz PAL-M NTSC SECAM
Wi-Fi Settings
Signal Source:
Band:
RF
WiFi
2.4 GHz
Satellite Settings
Signal Source:
Band:
DiSEqC Mode:
SCD/EN50494:
SCD2/EN50607:
Polarization:
Sat. Band:
LNB Low Osc:
LNB High Osc:
Supply Output:
Supply Voltage:
LNB Drain:
RF
WiFi
Terrestrial Satellite
High Low
Off On
Off On
Off
On
Disabled Enabled
External 5 V 13 V 15 V
18 V
13 V + 22 kHz
18 V + 22 kHz
Off Horizontal/Left Vertical/Right
Page 24

March 2017 2-17
2.8
Controls
The equipment has been designed to be an easy tool to use. For this reason the
number of keys has been reduced and these are grouped by function.
The menu navigation includes hints that appear when the cursor is placed on an
disabled (grayed) option for a while. This hints help the user to understand why
an option is disabled and what to do to enable it.
The equipment can be fully operated using both the touch panel (even using
wearing gloves) and the conventional keyboard.
For measurement and navigation through the menus, the equipment has the
touch panel, a joystick, 4 programmable keys (softkeys) and 6 direct access keys
(shortcut keys).
2.8.1
Touch Screen
The control software is designed in such a way that the meter can be fully
operated using both the touch panel and the conventional keyboard.
These actions can be done through the touch panel:
Menu Selection.
Frequency or channel selection.
Frequency or channel scroll.
Virtual keyboard writing.
Toolbar access.
Mode screens switch.
Installations Management.
One-touch zoom in.
Each touch on the screen is associated with a physical vibration. This vibration
can be enabled or disabled through the option “Vibration” in the “Preferences”
menu.
Page 25

2-18 March 2017
► Menu Selection
User can operate on the menus on screen: drop-down menu, select an option,
accept or exit a message, and so on, just touching on the option.
Figure 15.
Figure 16.
Figure 17.
Page 26
March 2017 2-19
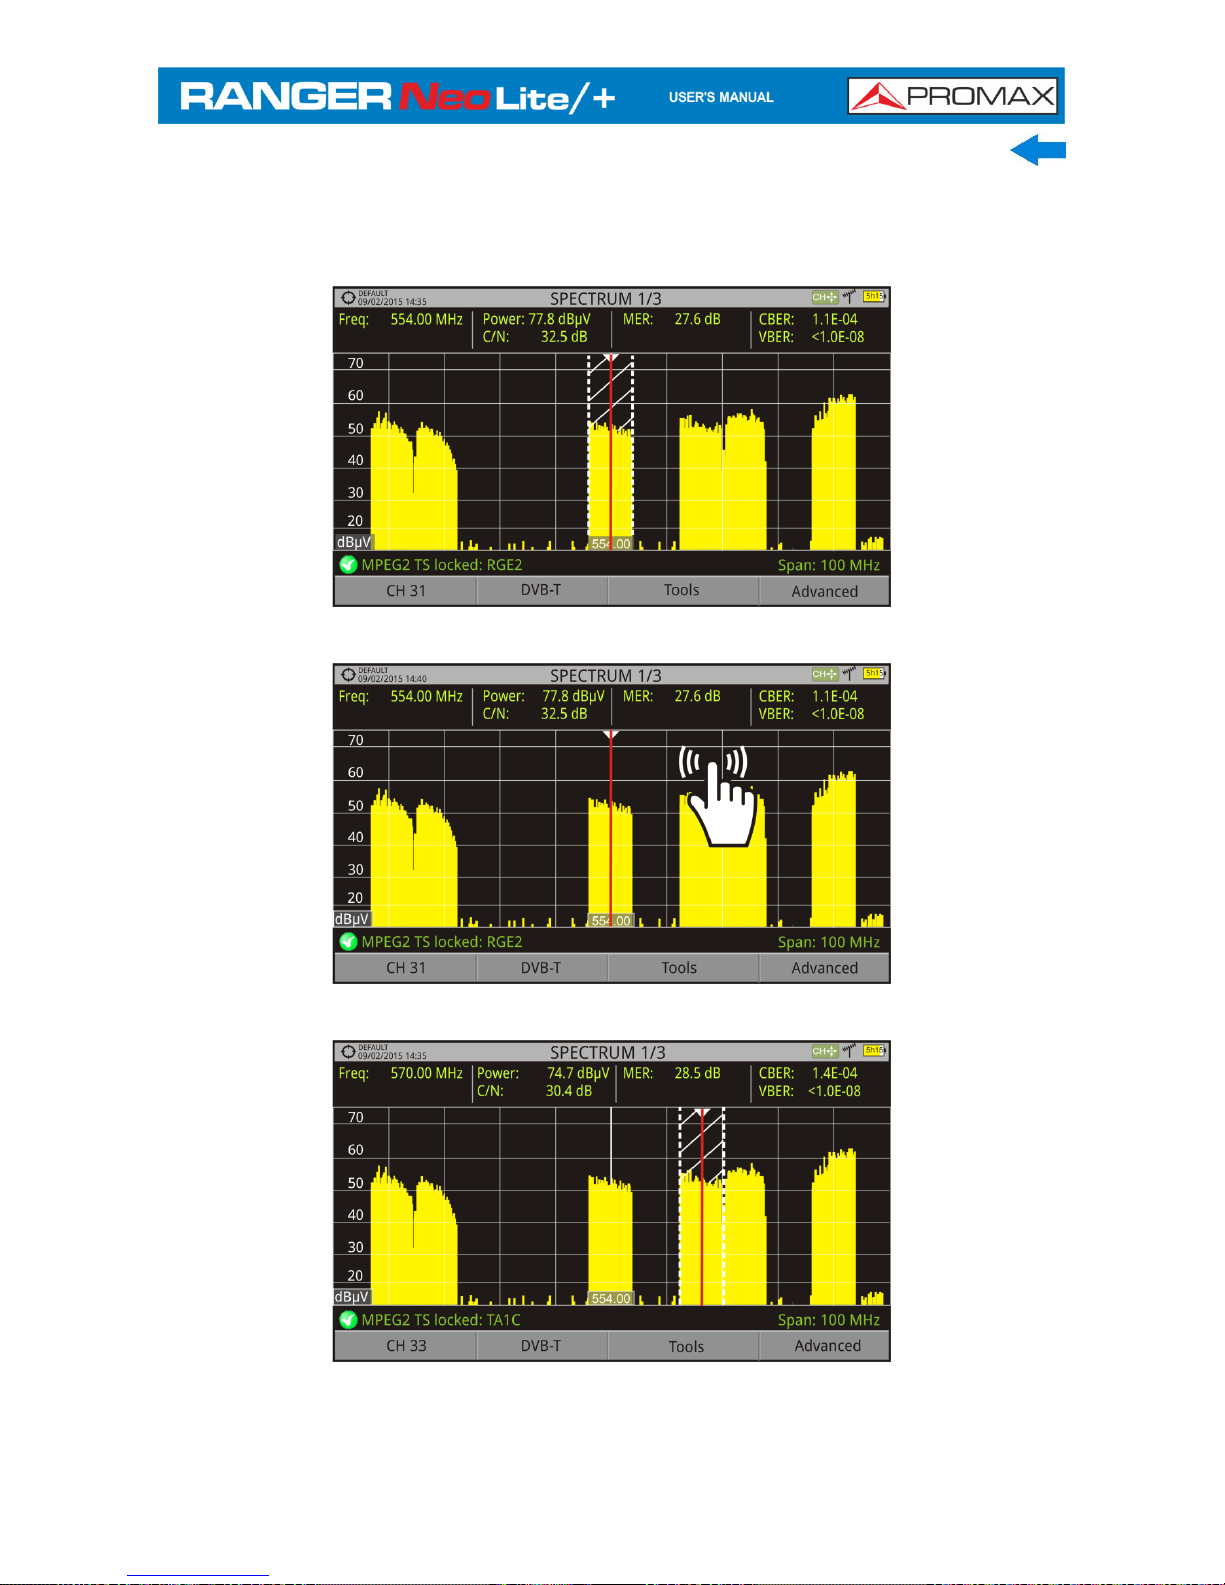
► Frequency or Channel Selection
At the Spectrum Analyser mode, user can select a channel or frequency by
tapping on the frequency or channel.
Figure 18. First screen (channel locked).
Figure 19. Tap on the new frequency.
Figure 20. The cursor moves to the frequency.
Page 27
2-20 March 2017
► Frequency or Channel Scroll
At the Spectrum Analyser mode, user can scroll through frequency or
channels by dragging and dropping his finger on the screen.
Figure 21.
Figure 22.
Page 28
March 2017 2-21
► Virtual keyboard/keypad writing.
User can type directly on the on-screen keyboard or keypad.
Figure 23.
Figure 24.
Page 29
2-22 March 2017
► Toolbar
User can access the more important functions through the toolbar by pressing
on the right top corner of the screen.
Figure 25.
Figure 26.
● Toolbar icons description
Measurement Mode
Settings
Video & Audio Settings
Spectrum Analyser Mode
Terrestrial Band
Preferences
TV Mode
Satellite Band
Screen Capture
Installations Management
Page 30
March 2017 2-23
► Mode screens
User can switch the view of the current mode by pressing on the top center of
the screen.
Figure 27.
► Installations Management
User can access data of the current installation by pressing on the left top
corner.
Figure 28.
Page 31

2-24 March 2017
► One touch zoom-in
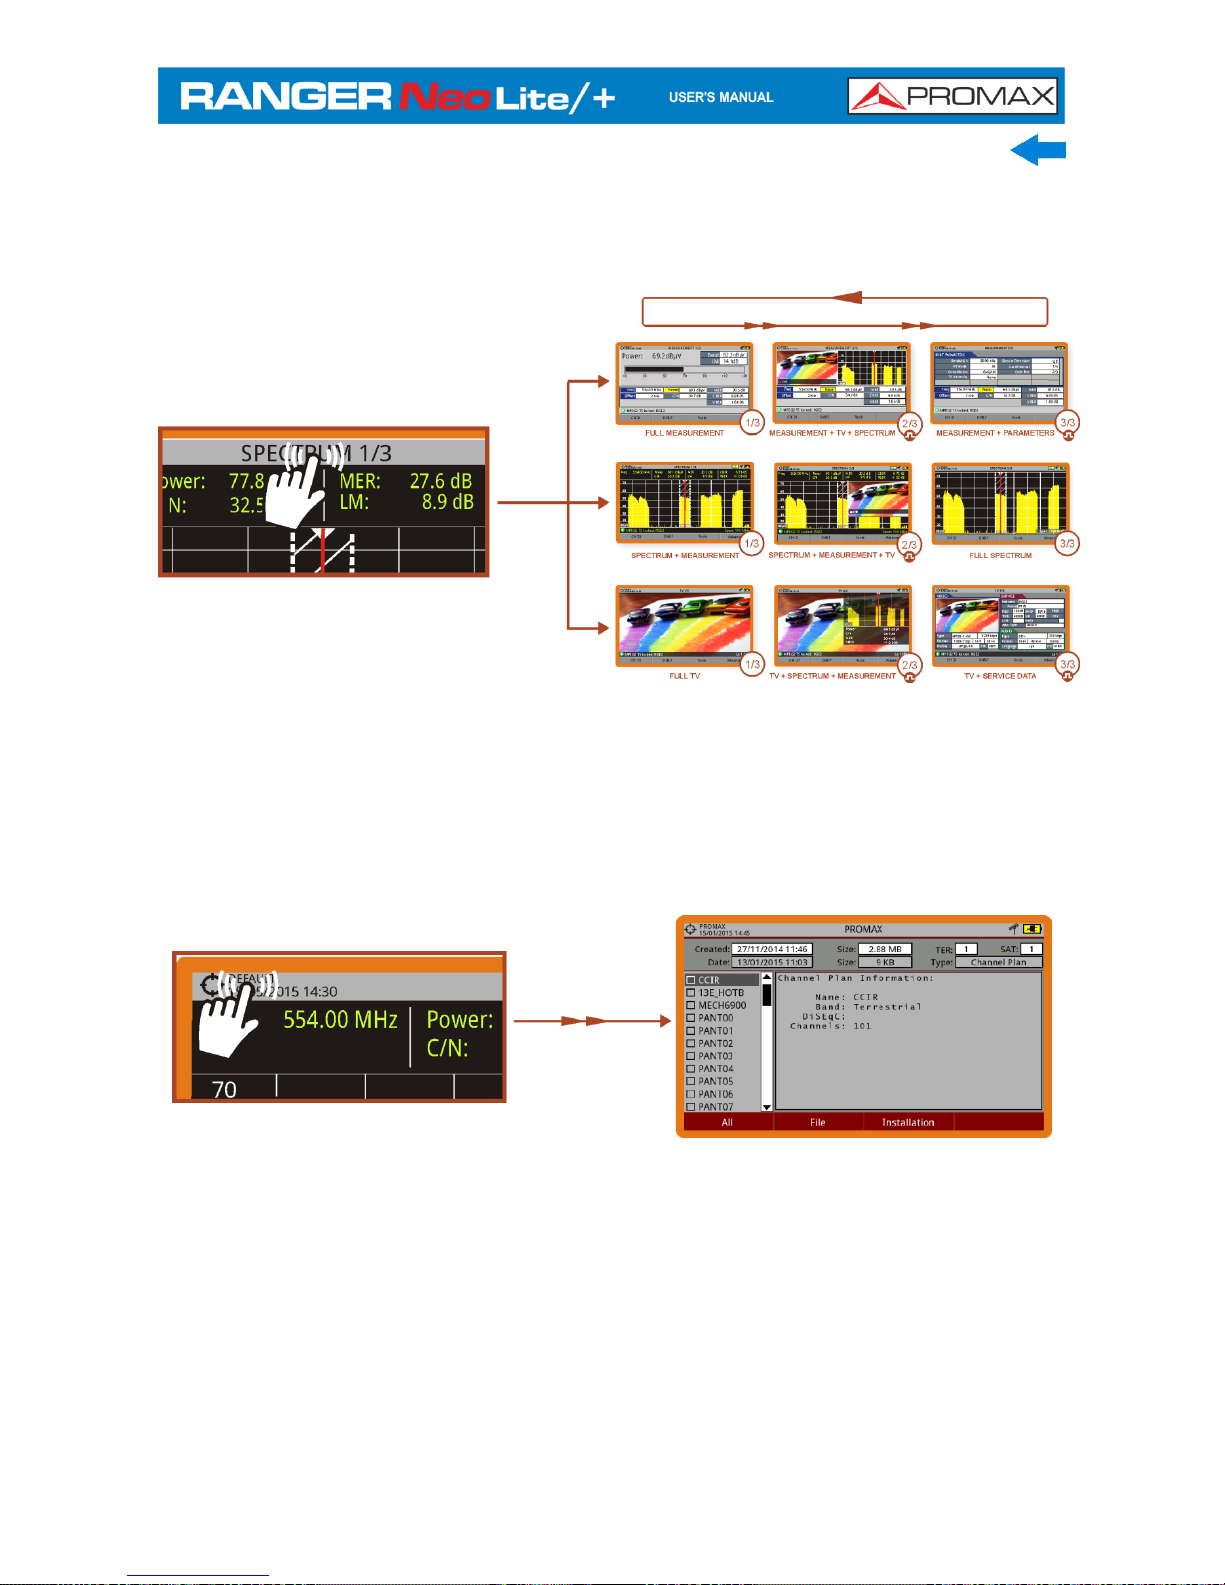
In a view with different windows (measurement, spectrum and / or TV), if the
user clicks on one of the windows, he will directly access the corresponding
enlarged view.
FULL MEASUREMENT
SPECTRUM + MEASUREMENT
MPEG2 TS locked: RGE2
23/1 2/20 16 07 :40
DEFAULT
MEASUREMENTS 2/3
70
60
50
40
30
La 1 H D
CH 31 DVB-T Tools
dBµV
Offset
MER
CBER
VBER 1.8
Po wer
C/N2
80.8
34.7
6.9
30.5
554.00 MHz
kHz
dBm
dB
dB
E-05
E-08
Freq
DL 11747.00 MHz
CH 31
DVB-T To ols
23/12/2016 07:40
DEFAULT
SPECTRUM 1/3
Ad vanc ed
70
MP EG2 TS locked : RG E2 Span : 100 MHz
Freq:
DL:
60
50
40
30
20
CH
1147.00
11747.00
MHz
MHz
Power:
C/N:
<-19.2
<36.2
dBmdBMER: 30.3 dB CBER:
VBER:
6.7
<1.0
E-05
E-08
554 .00
dBµV
LM: 8.9 dB
CH 31 DV B-S To ols
MP EG2 TS locked : RG E2
23/12/2016 07:40
DEFAU LT
MEASUREMENT 1/ 3
Offset
MER
CBER
VBER 1.8
Power
C/N2
80.8
34.7
6.9
30.5554.00
Power:
10 30 50 70 90 110 130
MHz
kHz
dBm
dB
dB
E-05
E-08
80.8dBµV
Freq
BandLM65.6 dBµV
14.1dB
DL 11747.00 M Hz
CH: 31 DVB -T To ols
23/12/2016 07:40
DEFAU LT
TV 2/3
Ad vanc ed
MP EG2 TS locked : RG E2 La 1 HD
Figure 29.
2.8.2
Joystick
Joystick positions are five:
Figure 30.
The joystick is multifunctional, that is, each time you press its function changes.
The user can see the active function according to the icon that is displayed at the
upper right corner of the equipment, as shown in the image.
Page 32

March 2017 2-25
In the SPECTRUM ANALYSER mode, the joystick has the following functions:
► CH or FR:
Channel change (CH) or
frequency (FR) change
(according to the tune
selected: tune by channel or
tune by frequency).
► SP:
Span change.
► MK:
Marker moving (if marker is
enabled).
Figure 31.
Working in WIFI mode, the joystick has the following functions:
► AP: Change of Access Point.
► SP: Change of Span.
Using the ECHOES tool, the joystick is also multifunctional:
► CH or FR: Channel (CH) change or frequency (FR) change (according to the
tune selected: tune by channel or tune by frequency).
► EC: Echo change.
According to the selected function, the joystick will do a specific action.
2.8.3
Joystick Operation
In the SPECTRUM ANALYSER mode, the joystick can make different actions
depending on its active mode.
The active mode of the joystick appears as an icon at the top right of the screen.
Available modes are:
► Frequency tuning.
► Channel tuning.
► SPAN change.
► Marker moving.
Page 33

2-26 March 2017
To change the active mode press the joystick.
Figure 32.
Pressing left or right will take appropriate action according to the active mode.
Pressing up or down will change the reference level regardless the active mode.
The frequency or channel tuning mode will appear depending on the selected
tuning type. Access the Tune by menu to select the type of tuning.
To show the Marker mode, it must be ON. Access the Advanced menu to
activate the Marker.
Pressing the joystick for 1 second, a box appears explaining the joystick modes
available. From here user can also select the active mode.
Figure 33.
2.8.4
Select and edit parameters
To edit or select any parameters of these described above, follow these
instructions:
Place over the option and press the joystick.
The data field gets into the edit mode, indicated by the yellow
background.
Page 34

March 2017 2-27
A menu is displayed at the right with some options or if it is numeric, a
number gets a black ground.
Move the joystick up/down to select one option. To move between
figures press right/left and to change it press up/down.
When finished press joystick or any function key to exit.
2.8.5
Keyboard shortcuts
► Management Keys
There are two Management keys. Each one has two different functions according
to the pressing time:
Short press: It shows the list of installations and
the menus to manage them.
Long press: It shows the preferences menu.
Short press: It shows the menu of terrestrial or
satellite settings (according to the selected band).
Long press: It shows the Video & audio settings.
► Export / Reference key
Depending on how long you press this key, it has two different functions:
Short Press: Pressing this key for less than one second on the Spectrum
Analyser mode, it holds on screen the current waveform as a reference. It is
equivalent to go to the option "Reference - Set" from the "Advanced" menu.
Pressing short again, it deletes the waveform reference. It is equivalent to go
to the option "Reference - Clear" in the "Advanced" menu.
Long press: Pressing this key for one second it makes a capture of what
it is shown on screen at the time.
The capture August be from the screen image, from the measurement data or
from both.
The type of capture, either screen, data, or both can be set in the "Export
button" option which is on the label "Measures" in the "Preferences" menu.
More information in the chapter "Export key".
Page 35

2-28 March 2017
► Function keys
On the left side there are 3 keys to access the most important functions of the
equipment.
Measurement key.
Spectrum Analyser key.
TV Mode Key.
The active function on screen is indicated by the LED* next to the function key.
Pressing a key repeatedly provides access to a different view within the same
function. For analogue signals only the first view of each function is available.
Each view is shown at the top. When reaching the third view it returns to the first
view.
2.8.6
Softkeys
There are four programmable keys, also called softkeys, numbered from to
.
Each key provides access to a menu. This menu varies depending on the function
the user is working on the meter.
The menu is displayed on each softkey at the bottom of the screen.
Figure 34.
*only available for RANGER
Neo +
Page 36

March 2017 2-29
2.8.7
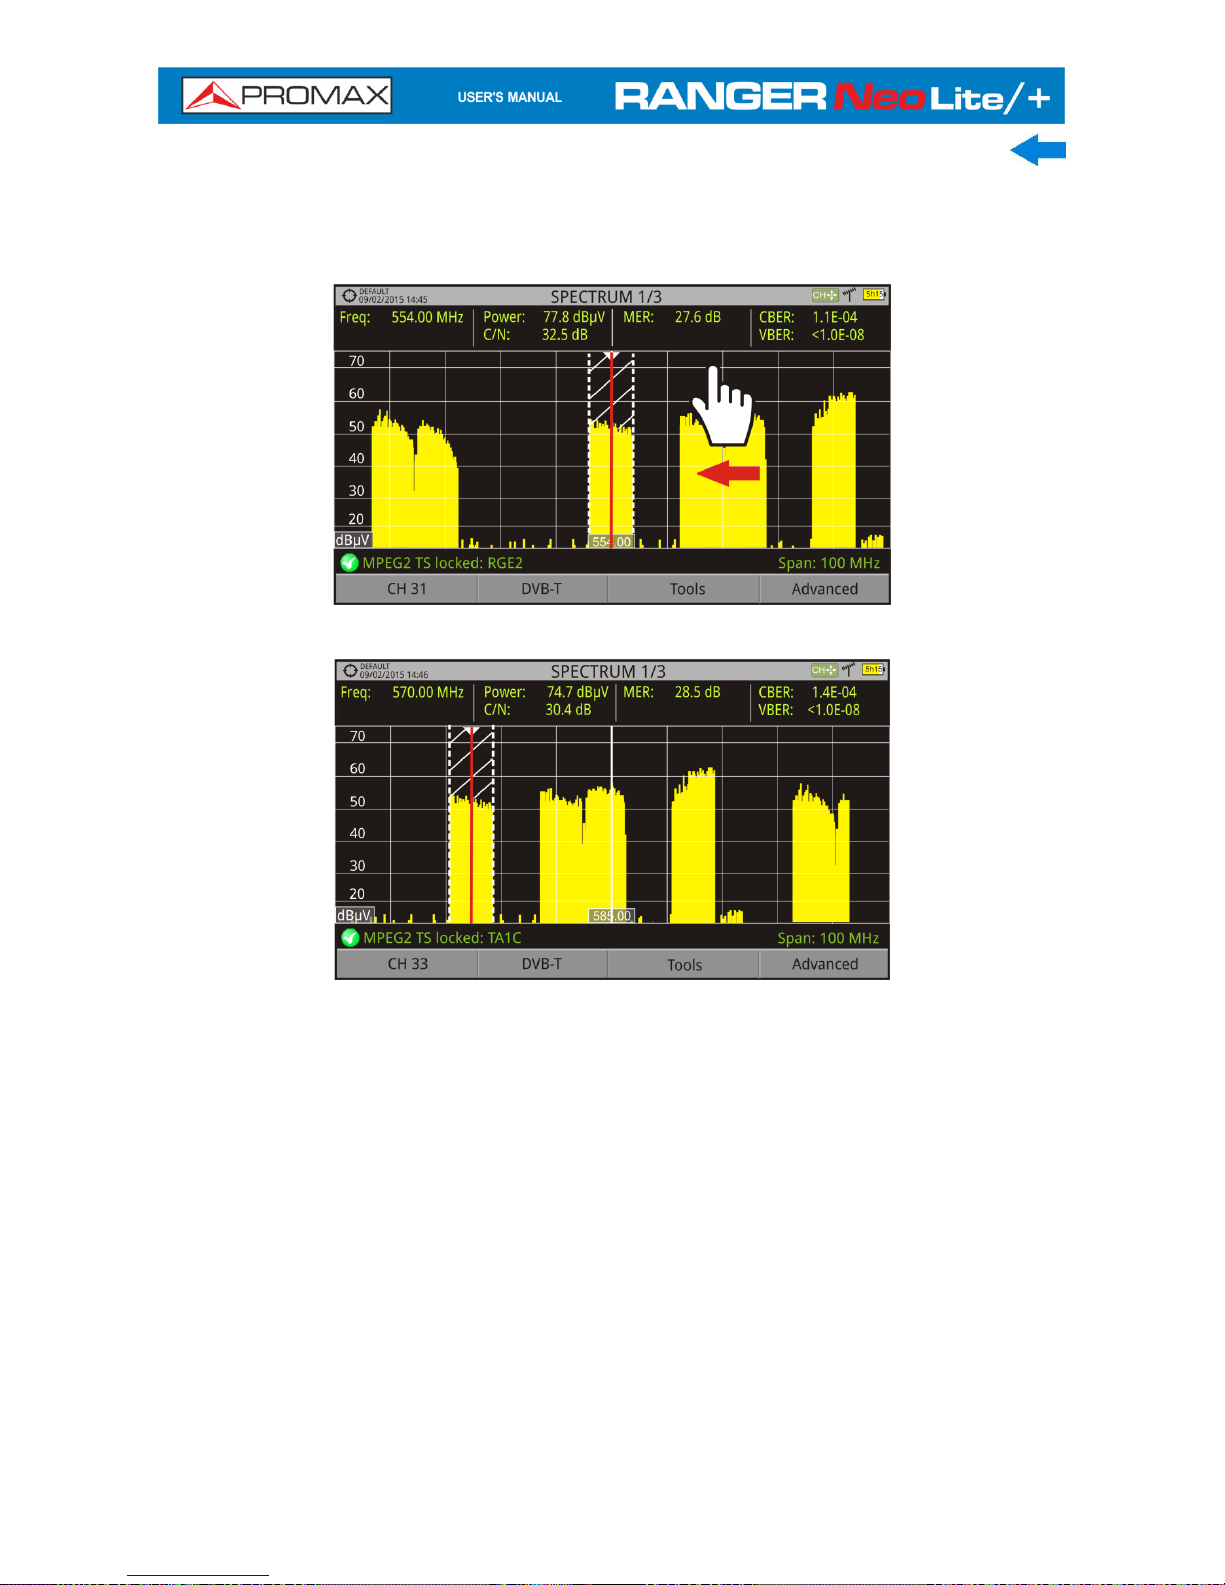
Virtual Keyboard
When a user needs to enter or edit a text (from an image, Channel Plan, etc.), a
screen with a virtual keyboard appears as shown at the figure.
Figure 35.
To edit the file name user should follow these steps:
Place the cursor over the text box where the name appears.
Move the cursor to place it next to the letter that user wants to edit.
Press on the virtual keyboard to edit.
To delete a letter, move the cursor to the right side of the letter and then press
the joystick on the Delete key or press (Del).
To enter an upper case letter press first or press the joystick on the key.
To block upper case press or press the joystick on the key twice
consecutively. To return to lower case press or the key again.
Keys with a point at the top right corner give access to special characters, by
keeping pressed the joystick for one second on the key.
After editing press (Ok) to validate the name and continue the process or
(Cancel) to cancel.
Page 37

3-30 March 2017
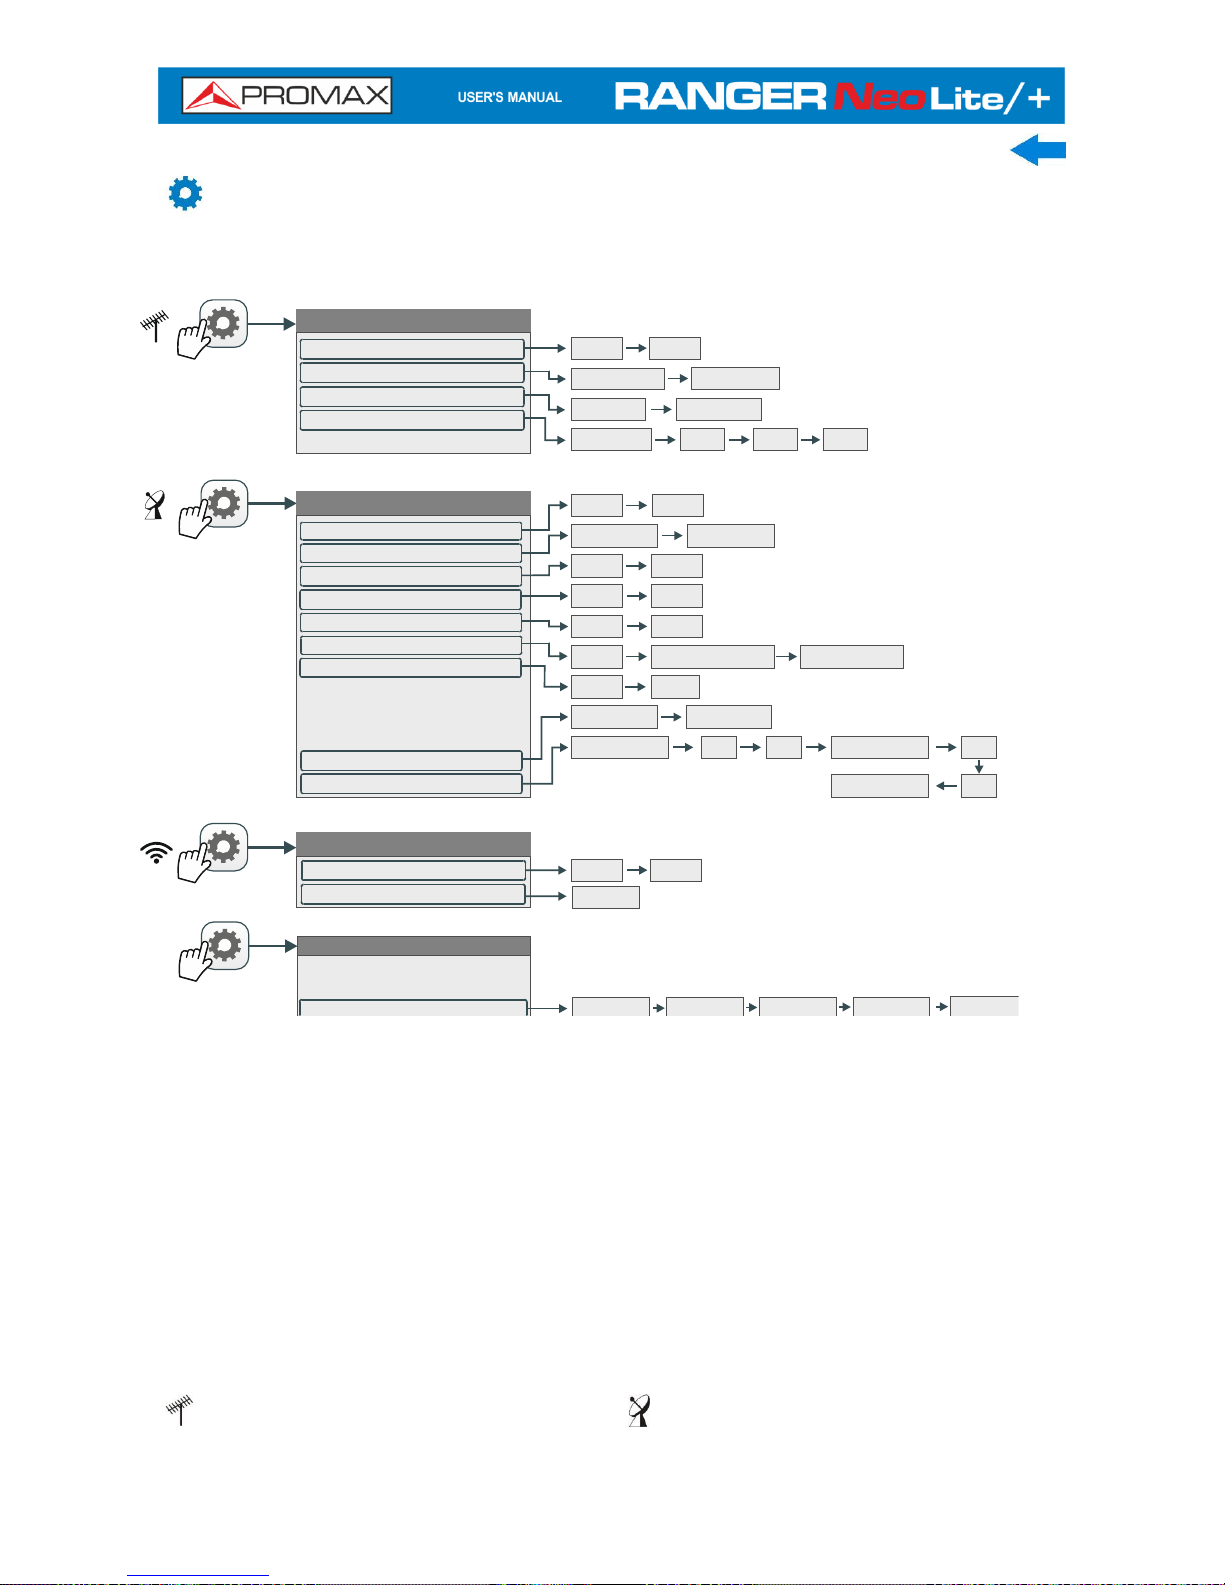
3 SETTINGS AND PREFERENCES
3.1
Settings Menu
Press the Settings key to access the settings menu.
Depending on the selected band, the menu August be different.
Figure 36.
A brief explanation of each option available on the menu:
► Signal Source
It allows the user to select the signal coming into the equipment between RF
(forradio-frequency signals) or WiFi (for wireless signals).
► Band
It allows the user to select between terrestrial or satellite frequency band for
RF or the WiFi operation band.
Terrestrial Settings
Signal Source:
Band:
Supply Output:
Supply Voltage:
LNB Drain:
RF
WiFi
Terrestrial
Satellite
Enabled Disabled
External 24 V5 V 12 V
(1s)
Volume
Brightness
Color System:
Video & Audio Settings
PAL 50 Hz PAL 60 Hz PAL-M NTSC SECAM
Wi-Fi Settings
Signal Source:
Band:
RF
WiFi
2.4 GHz
Satellite Settings
Signal Source:
Band:
DiSEqC Mode:
SCD/EN50494:
SCD2/EN50607:
Polarization:
Sat. Band:
LNB Low Osc:
LNB High Osc:
Supply Output:
Supply Voltage:
LNB Drain:
RF
WiFi
Terrestrial Satellite
High Low
Off On
Off On
Off
On
Disabled Enabled
External 5 V 13 V 15 V
18 V
13 V + 22 kHz
18 V + 22 kHz
Off Horizontal/Left Vertical/Right
Page 38

March 2017 3-31
► External power supply (available for terrestrial and satellite band)
It enables or disables the power supplied to external units such as
preamplifiers for antennas in terrestrial television or LNBs and FI simulators in
the case of satellite TV.
When this option is enabled the equipment applies at the output the voltage
selected by the user in the Supply Voltage option (see below). When this
option is disabled the equipment does not apply the voltage to the output but
it will behave as if it did.
► Supply voltages (available for terrestrial and satellite band)
It selects the voltage to be applied to an external unit.
Available voltage options change depending on the selected band.
Voltage available for terrestrial band is: External, 5 V, 12 V and 24 V.
Voltage available for satellite band is: External, 5 V (for devices working with
5 V such as GPS active antennas), 13 V, 13 V + 22 kHz, 15V, 18 V, 18 V
+ 22 kHz.
In the External supply voltage option the power supplier to the external units
is the power supplier of the antenna preamplifiers (terrestrial television) or the
satellite TV receiver (collective or domestic).
► LNB Drain (available for terrestrial and satellite band)
The LNB drain option shows the voltage and current flowing to the external
unit. If there is any problems (e.g. short circuit), an error message appears on
the screen ('SHORTCIRCUIT'), a warning beep sounds and the equipment will
not supply power. The equipment does not return to its normal operating state
until the problem is solved .During this time the equipment checks every three
seconds if there still the problem, warning with an audible signal.
The DRAIN LNB light indicator* is lit if current is flowing to the external unit.
► DiSEqC Mode (only available for satellite band)
It enables or disables DiSEqC mode. DiSEqC (Digital Satellite Equipment
Control) is a communication protocol between the satellite receiver and
accessories of the satellite system (see chapter "CONNECTING TO EXTERNAL
DEVICES").
*only available for RANGER
Neo +
Page 39

3-32 March 2017
► SCD/EN50494 (only available for satellite band)
It enables or disables the SCD/EN50494 function to control devices of a
satellite TV installation that supports this technology (see chapter
"CONNECTING TO EXTERNAL DEVICES").
► SCD2/EN50607 (only available for satellite band)
It enables or disables SCD2/EN50607 mode to control devices in a satellite TV
installation which must be compatible with this technology (see chapter
"CONNECTING TO EXTERNAL DEVICES").
► Polarization (only available for satellite band)
It allows the user to select the signal polarization between Vertical/Right
(vertical and circular clockwise) and Horizontal/Left (horizontal and circular
anti-clockwise), or disable it (OFF). In tuning mode the Polarization option can
not be changed.
► Sat Band (only available for satellite band)
It allows the user to select the High or Low band frequency for satellite
channel tuning. In channel tuning mode the Band Sat can not be changed.
► LNB Low Osc. (only available for satellite band)
It defines the local oscillator frequency for the LNB low band. When a channel
plan is selected but LNB oscillator values are not properly selected, a warning
is issued.
► LNB High Osc. (only available for satellite band)
It defines the local oscillator frequency for the LNB high band (up to 25 GHz).
When a channel plan is selected but LNB oscillator values are not properly
selected, a warning is issued.
3.2
Video & Audio settings
Press the Settings key for one second to access the Video & Audio settings
menu.
Figure 37.
Page 40

March 2017 3-33
A brief explanation of each option available on the menu:
► Volume
It increases or decreases the volume of the speaker audio output by moving
the joystick to the right (+ volume) or left (- volume).
► Brightness
It increases or decreases the screen brightness by moving the joystick to the
right (+ brightness) or left (- brightness).
► Colour System
The coding system used in analogue transmissions. Available options are: PAL
50 Hz, PAL 60 Hz, PAL-M, NTSC and SECAM.
3.3
Preferences Menu
You access the Preferences menu by pressing the Installations Management
key for one second. The options are grouped in tabs as follows:
► Equipment: Equipment information.
► Appearance: Equipment customization options.
► Date & Time: It allows the user to change date and time zone.
► Measures: It allows the user to choose between several units of measure
among other parameters.
► Tools: It allows to edit some parameters for different tools.
► StealthID: It allows the user to select the set of signal types being used while
auto identifying any modulation type.
► Security: It allows to edit the PIN code.
► Network: Network parameters settings.
Page 41

3-34 March 2017
Figure 38.
To navigate between tabs move the joystick left or right. To navigate between
the options within the tab move the joystick up or down.
Press Exit to exit Preferences.
Press Save to save changes.
A brief explanation of the options available in each tab:
► Equipment information:
Provider: Provider's name.
Name: Equipment's name.
Serial number: Unique identification number for this equipment.
Release: Version of the software installed on the equipment.
Date: Date of the software and hardware installed on the
equipment.
Free memory: Free size of the flash memory installed on the equipment
/ Size of the flash memory installed on the equipment.
Company: Name of the company which owns the equipment
(editable by user; protected by PIN code). This field
appears on the boot screen.
User: Name of the equipment's user (editable by user;
protected by PIN code). This field appears on the boot
screen.
Equipment
Appearance
Time and Date
Measures
Tools
Stealth-ID
Security
Network
Preferences
(1s)
Date: Time: Date Format: Time Zone:
PIN Code 1234
MAC: DHCP: IP Address: Mask: Gateway:
Datalogger PSI:
Database services:
Export button:
LTE Filter F.Min:
LTE Filter F.Max:
Center Freq:
Sat. Band:
Ref. Level:
Ter. Downlink
Terrestrial Units:
Satellite Units:
Optical Units:
Min. TER. Power:
Min. SAT. Power:
Min. TER. Level:
Min. FMI. Level:
np. Impedance:
Analog Terrestrial
Digital Terrestrial
Digital Satellite
Language:
Skin:
Power Off:
Background:
TFT Screen:
Color System:
Vibration:
Boot screen:
Values Format:
Provider
Name
SN
Release
Date
Free System Memory
Free Data Memory
Company
User
ANALOG FM
ANALOGDVB-S DVB-S2 DSS
ANALOGDVB-T DVB-C DVB-T2 DVB-C2
Page 42

March 2017 3-35
► Appearance Options:
Language: Language used on menus, messages and screens.
Available languages are: Spanish, Catalan, English,
German, French, Czech, Italian, Norwegian, Polish,
Russian and Slovak. Once the new language is selected,
the equipment shows a warning message and re-starts in
order to load the new language.
Skin: Colours used on the screen.
Power Off: It allows the user to select the time to power off, which is
the time after which the equipment shuts down
automatically unless user press any key.
Brightness: User can select between two options:
Manual: The display brightness is adjusted manually
using the brightness setting (see section
Video and audio settings).
Automatic: The display brightness is automatically
adjusted according to the light received by
the sensor.
Background: It allows the user to select the background colour on the
display screen. Options available are: white, green, red,
black and blue.
Battery Time: It hides or shows the remaining battery time. Remaining
battery time is displayed on the inside of the battery
level icon.
TFT Screen: User can select a time after which the TFT screen turns
off, but the equipment is still running normally. The
screen turns on by pressing any key. Time options are:
off, 1, 5, 10 or 30 minutes.
Color System: The coding system used in analogue transmissions.
Available options are: PAL 50 Hz, PAL 60 Hz, PAL-M,
NTSC and SECAM.
Boot Screen: User can select the image that appears when the
equipment is booting.
Values Format: It allows the user to select the format to show on fields
PID, NID, ONID, TSID and SID in TV mode screen 3/3.
Available formats are decimal or hexadecimal.
► Time & Date Options:
Date: It allows the user to edit the date. Press the joystick for
edit mode.
Time: It allows the user to edit the time. Press the joystick for
edit mode.
Page 43

3-36 March 2017
Date Format: It allows the user to change the date format, which is the
order in which is shown day (DD), month (MM) and year
(YYYY or YY).
Time Zone: It allows the user to select the time zone where he is.
► Measures Options:
Terrestrial
Units: It allows the user to select the terrestrial measurement
units for the signal level. Available options are: dBm
dBmV and dBµV.
Satellite
Units: It allows the user to select the satellite measurement
units for the signal level. Available options are: dBm,
dBmV and dBµV.
Optical Units: It allows the user to select the optical measurement units
for the signal level. Available options are: dBm.
Satellite Band: It allows the user to select the type of satellite band used
between Ku/Ka band and C band.
Reference
Level: It allows the user to select the type of reference level
adjustment between manual (modified by the user) or
automatic (selected by the equipment).
TER. Downlink: If this option is enabled it allows to work in terrestrial
band with radio link down converters external units (from
1 to 11 GHz) and tune using the link frequency.
Min. TER.
Power: It sets the minimum power for a terrestrial digital signal
to be identified when channel exploring.
Min. SAT.
Power: It sets the minimum power for a satellite digital signal to
be identified when channel exploring.
Min. TER.
Level: It sets the minimum level for a terrestrial analogue signal
to be identified when channel exploring.
Min. FM.
Level: It sets the minimum power for a FM signal to be
identified when channel exploring.
Inp.
Impedance: It allows the user to select the impedance at the RF input
between 50 Ω and 75 Ω.
Page 44

March 2017 3-37
► Tools Options:
Datalogger
PSI: If you select the option "Capture", when datalogger is
working it captures the service list of each channel. This
process slows the datalogger, but provides additional
information that can be downloaded in XML files. To
disable this option select "Don't capture".
Database
services: When it is enabled, it saves all the services been
detected in the current installation. There is a database
for services in terrestrial band and another for services in
satellital band. Services are included automatically when
the signal is locked. If enabled, these services will be
displayed on the "View all services" option in the
Tuning menu. When disabling the option all services
in the database of the installation will be deleted.
Export button: It allows the user to select the data to be exported when
pressing the export key among the following options:
screen only, data only or both. More info in the "Export
key" chapter.
LTE Filter
F.Min: Select the minimum frequency for the external LTE filter.
LTE Filter
F.Max: Select the maximum frequency for the external LTE filter.
Center Freq: User can set the center of frequency to Manual or Auto
mode. In Manual mode the user sets the center of
frequency and the equipment does not change it never,
so the main cursor can be moved out of screen. In Auto
mode the equipment changes the center of frequency to
display always the main cursor on screen.
► StealthID Options:
It allows the user to select the set of signal types being used while auto
identifying any modulation type. More information in the "StealthID function"
chapter.
► Security Options:
It allows the user to change the PIN code that gives access to protected data
fields. The default PIN code is "1234". To change the PIN, first enter the
current PIN code, then enter the new PIN.
In case the user forgets the PIN, after the third attempt, a 12-digit code will
appear on screen. Sending this 12 digit code to the PROMAX customer service,
the user will recover the PIN.
Page 45

3-38 March 2017
► Network Options:
Network parameters that user has to fill out in order to identify the equipment
into a data network. This is necessary to connect to a PC via ethernet.
Network parameters are:
MAC: Physical address of the equipment. It is unique and
cannot be edited.
DHCP: Enable this option to get the proper IP address when the
unit is first connected to a network. That feature
contributes to make things easier to installers when
debugging network access. Enable the DHCP protocol for
proper IP configuration.
IP Address: IP Address of the equipment into the local network.
Mask: Subnet mask of the equipment (by default
255.255.255.0).
Gateway: IP Address of the router into the local network (by
default 10.0.1.1).
Page 46

March 2017 4-39
4 RF SIGNAL TUNING (Terrestrial and Satellite Band)
4.1
Introduction
On the panel left side, the equipment has three functions keys, which give
direct access to three ways to display RF signal.
MEASUREMENT: This mode shows main measures of RF signal and allows
you to identify if any measure is above or below usual values.
SPECTRUM ANALYSER: This mode shows spectrum and allows you to
visually identify any anomalies over the RF signal.
TV: This mode shows RF signal demodulated and allows you to check
broadcasting quality for video and audio.
Pressing a key repeatedly provides access to a different view within the same
mode displaying different windows. Each view combines several RF modes
(demodulated, spectrum, measures) which is very convenient to identify
problems.
The StealthID function is an auto-identification system which identifies type
and characteristic parameters of the signal and then tries to tune and
demodulate it with no need to enter any parameter by hand.
4.2
Operation
Connect the RF input signal to the equipment.
Press the “Settings” key to access Settings menu and in “Source Signal”
select “RF”.
From Settings menu access the “Band” option and select “Terrestrial” to
work on terrestrial band or “Satellite” to work on satellite band.
Select the display mode by pressing the MEASUREMENT, SPECTRUM
ANALYSER or TV mode. Pressing a key repeatedly provides access to
different views.
Enter frequency or channel using the “Tuning” (F1) menu or using the
joystick to go left or right along the frequency / channel band.
Once you are placed on the channel or frequency, the StealthID function
tries to identify and lock the signal and its characteristic parameters and will
show results on screen.
Page 47

4-40 March 2017
4.3
General Menu Options
At the bottom of the screen four menus are accessible via the softkeys or
programmable keys.
It displays the channel where is pointing the cursor
and gives access to the tuning menu.
It displays the selected transmission standard and
gives access to the signal parameters menu.
It displays the Tools menu.
It displays the Advanced menu.
In general, these options are the same for all modes (Measure, Spectrum
Analyser and TV).
The specific options for a mode are placed in the menu "Advanced" pressing the
key. For more details about these options go to section "Specific Options" in
the chapter.
Next each one of these menus is described.
4.3.1
F1: Tuning – Selecting Channel / Frequency
Access by the function key. It contains the options to tune a channel.
The tuning menu consists of the following options:
► Channel/Frequency: It displays the channel/frequency pointed by the
cursor. Tuning type (channel/frequency) is selected by
means of the Tune by option.
► Channel Plan: This option allows the user to select a channel plan
from the ones available for the current installation.
► Tune by: It allows the user to select between tuning by channel
(selecting a channel or channel by channel with the
joystick) and tuning by frequency (selecting a
frequency or step by step with the joystick).
Page 48

March 2017 4-41
In case of tuning by channel, it allows selecting a channel from the active
channel plan:
Place over the Channel option and press the joystick.
A box appears with all channels of the active channel plan and its
frequency.
Move the joystick on the box to select a channel.
When finished press joystick to save the selected value or any function
key to exit without saving.
The cursor will place on the selected channel and it will appear on the
option.
The channel can be changed directly with the joystick in CH mode.
NOTE: When using tune by channel on satellite, the polarity parameters
(horizontal/vertical and left/right) and satellite band (high/low) are
selected automatically by the equipment, according to the channel plan
enabled and cannot be changed by the user. To change these parameters,
the user August switch to frequency tuning. But the user can change the
voltage output while in a channel plan, as long as none has been defined in
that same channel plan. For instance, if a standard channel plan is being
used like the CCIR, there is now need for switching to frequency tuning
mode or make special channel plans for using active antennas.
In case of tuning by frequency, the frequency can be edited:
Place over the Frequency option and press the joystick.
The option is highlighted in yellow to indicate it is in edit mode.
Move the joystick left/right to move between the figures and up/down
to change the figure.
When finished press joystick to save the selected value or any function
key to exit without saving.
The frequency can be changed directly with the joystick in FR mode in
50 kHz steps.
Page 49

4-42 March 2017
► Center Frequency: This option is available only for the Spectrum Analyser
mode. It allows to edit the center frequency. The
center frequency is the frequency at which the screen
is centered. To edit:
► Reference level: This option is available only for the Spectrum Analyser
mode. It allows to edit the reference level. The
reference level is the power range represented on the
vertical axis. To edit:
The Reference Level can be changed directly pushing the joystick up or
down.
► Span: This option is available only for the Spectrum Analyser mode. It
allows to edit the span, which is the frequency range displayed on
screen. To edit:
The span can be changed directly with the joystick in SP mode.
► Center tuned
frequency: This option is only available for the Spectrum Analyser
mode. When selecting this option, the frequency
tuning (where the main cursor is pointing) is placed at
the center of the screen. Even if changing span or
mode (TV or MEASURES), frequency will keep at the
screen center. This option does not work with FULL
span.
► Downlink: This option is available only if the option Ter.
Downlink in Preferences menu has been enabled. It
allows user to work in terrestrial band with radio link
down converters external units (from 1 to 11 GHz)
and tune using the link frequency.
► View all services: This option only appears if the Database services
option is enabled in the Preferences menu.
This option displays a window with a list of services
that have been detected in the current installation.
The list shows service name, provider, SID (stream
identifier) and an icon that shows its type (radio, tv)
and if it is scrambled. When hovering on the service
for one second it displays a hint window with more
information.
If user presses the joystick on a service, it will access
that service.
Page 50

March 2017 4-43
When disabling the Database services option, all
services in the installation will be deleted from the list.
At the bottom of this option are shown the softkeys
with these functions:
Cancel: It exits the option.
Filter List: It shows several options to filter
the list of services: By access (Free Only,
Scrambled Only, All); By type (All, TV,
Radio); Search by name (filtered by the
name); Reset list (it restarts the list as at
first) Service filtering is persistent until
reseting.
Page Up: It jumps one page up.
Page Down: It jumps one page down.
4.3.2
F2: Signal Parameters
Access by the function key. It allows selecting the standard transmission and
displays the parameters for signal transmission.
This menu allows selecting the transmission standard:
► Type of signal: It displays the selected standard. It allows selecting another
standard in the same band (terrestrial or satellite):
Place over the Signal Type option and press the joystick.
It displays a menu at the right with the transmission standards.
Move the joystick up / down to select a standard.
Press joystick to select the standard or any function key to exit
without selecting.
► View Advanced
Parameters: It shows the TPS parameters (Transmission Parameters
Signalling) for the locked signal according to the modulation
standard. This option is available only when these
parameters are detected.
The remaining transmission parameters are detected demodulating the
locked signal.
In case of a DVB-S/S2 signal, the symbol-rate parameter can be set
manually.
Page 51

4-44 March 2017
In case of a DVB-S2 signal, there will be some special settings for this type
of signal. They are:
Physical Layer Scrambling or PLS is used in DVB-S2 as a way to improve
data integrity. A number called the "scrambling sequence index" is used by
the modulator as a master key to generate the uplink signal. This same
number must be known by the receiver so that demodulation is possible.
Most satellite transponders use PLS 0 as a default value but there are some
transponders that use other values.
If it is a multistream signal (MIS), it will appear an option that enables
filtering by the input stream identifier (ISI) and to select the stream to
demodulate.
When a satellite transponder is working with a non-zero PLS code plus MSI
(multiple streams), system will lock that signal in a quite automatic way.
In case of a Generic signal, the menu shows an option to select the signal
bandwidth.
4.3.3
F3: Tools
Access by the key. It shows the Tools menu. If an specific tool is not available
for the signal locked then the option is disabled. Tools are:
► Select Service: It displays the list of services available in the multiplex
tuned, with the service name, icons that identify the
service type, SID (stream identifier) and LCN (logic
channel number).
Icons that appear next to the service name identify the
features of the service. The meaning is given in the
following table:
Digital TV
service
High Definition
TV service
Digital radio
Data
Scrambled
service
Page 52

March 2017 4-45
► Signal monitoring*: This tool allows the user to monitor a signal by
measuring its power, MER and C/N. All this data, can be
downloaded to a PC and exported to a file for later
analysis. In this file are saved all characteristics
measurements for each type of signal.
► Explore channel
plan: It explores the selected channel plan. Tune by channel
must be selected.
► Constellation: It displays the constellation of the locked signal.
► LTE Ingress Test: It enables the detection of signal interferences coming
from mobile phones.
► Attenuation test: This feature allows the user to easily check the response
of the telecommunications installations before antennas
and headers are working.
► Echoes: It detects the echoes that August appear due to the
simultaneous reception of the same signal from several
transmitters.
► MER by carrier*: This function analyses continuously the measure of the
MER value for each one of the carriers forming the
selected channel and they are displayed in a graphic on
screen.
► MEROGRAM*: This function shows a graphical representation of the
MER level for each carrier of the locked signal, which is
superimposed over time.
► Datalogger: It creates a file in which are stored measurements. This
file belongs to the selected current installation.
► Spectrogram*: This function shows a graphical representation of the
spectrum superimposed over time of a channel or
frequency selected by the user.
► Discover FM
Stations: This function scans the FM band and creates a FM
channel plan from scratch. Scanned frequency range is
from 87 to 108 MHz.
► Field strength: This tool allows the equipment to measure as a field
strength meter.
► Task Planner: It allows the user to schedule specific tasks.
For more information about these features, see the "Tools" chapter.
*only available for RANGER
Neo +
Page 53

4-46 March 2017
4.4
Advanced Options
Access by the function key. It allows selecting among several parameters
related to mode selected.
The advanced menu in the Spectrum Analyser mode consists of the following
options:
► Average: The user can select the amount of signal values to be used
to set the average signal value to be displayed on screen.
The larger the average value, the more stable the displayed
signal appears.
► Spectrum
Line: It defines the spectrum display. Outline option displays the
spectrum outline. The Solid option displays the contour of
the spectrum with solid background. The Transparence
option shows the outline in yellow and the background in a
softer yellow.
► Tone Level: This option produces a tone that changes according to the
input level of the signal so the tone is sharper if the level
increases and deeper if the level decreases.
► Marker: It allows enabling/disabling the marker. This marker is
displayed on screen with the shape of an arrowhead,
showing on screen some information about the frequency
and power level where it points. You can move left/right by
the joystick in MK mode (press the joystick until the icon
MK appears).
When the Marker is ON at the top right corner a window
pops up with the following data:
Freq: Frequency where is placed the marker.
Level: Power level at the frequency where is placed the
marker.
F: Difference of frequency between the marker and
the main cursor.
L: Difference of power level between the marker and
the main cursor.
Page 54

March 2017 4-47
► Marker Trace: It allows the user to select the trace to place the marker on:
Normal: It places the marker on the spectrum trace in
real time.
Reference: It places the marker on the spectrum reference
trace. To make a spectrum reference use the
Reference function.
Max. Hold: It places the marker on the max. hold trace. To
make a maximum hold trace use the Max.
Hold function.
Min. Hold: It places the marker on the min. hold trace. To
make a minimum hold trace use the Min. Hold
function.
► Max. Hold: (Off/Permanent/Curtain). It allows the user to display the
current signal with the maximum values measured for each
frequency. The OFF option disables this function. The
Curtain option displays the maximum values in blue for a
moment with the current signal. The Permanent option
maintains maximum signal on the screen. This option is
especially useful for detecting sporadic noises.
► Min. Hold: (Off/Permanent/Curtain). It allows the user to display the
current signal with the minimum values measured for each
frequency. The OFF option disables this function. The
Curtain option displays the minimum values in green for a
moment with the current signal. The Permanent option
maintains minimum signal on the screen. This option is
useful for detecting interferences in TV cable or identify
deterministic interference in analogue and digital channels.
► Persistence: When active, the signal is displayed on a coloured
background. The signal prior to current signal persists for a
while before disappearing so the user can see how the signal
changes easily.
► Detector Type: (PEAK / RMS). It allows the user to select between
maximum PEAK detector or RMS detector. The maximum
peak detector is mainly used for analogue modulated
signals, while the RMS option is the right choice for digital
modulated signals. The max PEAK detector is mostly used
for analogue modulated signals, while the RMS is the proper
choice for digital modulations. The maximum peak detector
causes the noise floor to rise, according to the RMS to peak
ratio. That same effect causes digital signals to apparently
grow in level when maximum peak detector is used.
► Resolution
bandwidth: Resolution filters availables. For terrestrial and satellite:
100, 200 and 1000 kHz. According to the filter being
selected, that maximum and minimum span allowed is
modified.
Page 55

4-48 March 2017
► Vertical Range: It allows to adjust the vertical scale on screen. Available
values are 1, 2, 5 and 10 dB per division.
► Dashed BW: When it is ON the channel bandwidth area is hatched by
lines.
► Reference: (Set / Clear). It memorizes the current trace on screen,
which can be used as a reference for further comparison. It
August be also very helpful for visually measure the gain or
attenuation in a TV distribution network. To delete the
reference, select the "clear" option. The trace can be also
captured by a short press on the export key in the
Spectrum Analyzer mode. Pressing short again on the export
key it clears the reference.
The Advanced menu of the TV mode consists of the following options:
► Analogue Signal
This option is available only if the detected or selected signal is ANALOGUE.
Pressing the F3 key it allows selecting the type of analogue input,
between antenna (via RF connector) and external (via V/A input connector).
To get an external analogue signal use the A/V input (see figure 5).
► Aspect Ratio
This option is available only if the detected or selected signal is ANALOGUE.
It allows the user to select the image aspect ratio (4:3; 16:9). It remembers
this selection even after switch off.
► Advanced
It gives access to these options:
This option is available only if the detected or selected signal is DIGITAL.
Audio: It allows the user to select among the audio tracks available.
TS Data: It shows the IRG data descriptor. If the signal contains this
carrier identifier, this option will be enabled. If the signal
does not contain this identifier, the option will be disabled
(for more information refer to section "IRG descriptor").
Discovered
URLs: If shows the URL related to the interactive service.
Page 56

March 2017 4-49
4.5
Screen Description
4.5.1
Measurement Mode Screens
MEASUREMENT 1/3: FULL MEASUREMENT
Figure 39.
Selected installation, date and time.
Measurement value of the selected parameter.To change parameter move
joysticjk up / down.
Number of view/total views.
Selected band, battery level.
Total power detected over the whole selected band (terrestrial or satellite).
It also shows the link margin measurement. The total power can be used
to know when it is close to saturation. The link margin is the margin of
safety remaining for a good reception.
Graphical measurement of the selected parameter.
Measurement values for the type of locked signal.
Signal status (searching/locked/multiplex name).
Softkeys menus.
► Joystick up/down: It changes selected parameter.
► Joystick left/right: It changes channel/frequency.
Page 57

4-50 March 2017
MEASUREMENT 2/3: MEASUREMENT + TV + SPECTRUM
Figure 40.
Selected installation, date and time.
Image of the locked signal.
Number of view/total views.
Selected band, battery level.
Spectrum of the locked signal.
Measurement values for the type of locked signal.
Signal status (searching/locked/multiplex name).
Softkeys menus.
► Joystick right/left: It changes the selected channel/frequency.
Page 58

March 2017 4-51
MEASUREMENT 3/3: MEASUREMENT + PARAMETERS
Figure 41.
Selected installation, date and time.
Number of view/total views.
Selected band, battery level.
Demodulation parameters of the locked signal.
Measurement values for the type of locked signal.
Signal status (searching/locked/multiplex name).
Softkeys menus.
► Joystick right/left: It changes the selected channel/frequency.
Page 59

4-52 March 2017
4.5.2
Spectrum Analyser Mode Screens
SPECTRUM 1/3: SPECTRUM + MEASUREMENT
Figure 42.
Selected installation, date and time.
Number of view/total views.
Joystick active mode, selected band, battery level.
Measured values of the signal at the frequency/channel where is pointing
the cursor.
Spectrum in the band with the selected span.
Centre frequency and cursor. It also shows the bandwidth of a digital
locked signal.
Signal status (searching/locked/multiplex name/selected span).
Softkeys menus.
► Joystick up/down: It changes the reference level.
► Joystick left/right (depending on the joystick active mode):
SP: SPAN change.
FR or CH: Frequency change or channel change.
MK: Marker change (if marker is ON).
Page 60

March 2017 4-53
SPECTRUM 2/3: SPECTRUM + MEASUREMENT + TV
Figure 43.
Selected installation, date and time.
Number of view/total views.
Joystick active mode, selected band, battery level.
Measured values of the signal at the frequency/channel where is pointing
the cursor.
Image of the tuned signal.
Spectrum in the band with the selected span.
Centre frequency and cursor. It also shows the bandwidth of a digital
locked signal.
Signal status (searching/locked/multiplex name/selected span).
Softkeys menus.
► Joystick up/down: It changes the reference level.
► Joystick left/right (depending on the joystick active mode):
SP: SPAN change.
FR or CH: Frequency change or channel change.
MK: Marker change (if marker is ON).
Only available for digital channels.
Page 61

4-54 March 2017
SPECTRUM 3/3: FULL SPECTRUM
Figure 44.
Selected installation, date and time.
Number of view/total views.
Joystick active mode, selected band, battery level.
Spectrum in the band with the selected span.
Centre frequency and cursor. It also shows the bandwidth of a digital
locked signal.
Softkeys menus.
► Joystick up/down: It changes the reference level.
► Joystick left/right (depending on the joystick active mode):
SP: SPAN change.
FR or CH: Frequency change or channel change.
MK: Marker change (if marker is ON).
Page 62

March 2017 4-55
► Full Spectrum screen description
Figure 45.
Horizontal reference line
It indicates the signal level.
Vertical axis
It indicates the signal level.
Vertical reference line
It indicates the frequency.
SPAN
It is the frequency range displayed on the horizontal axis.
The current span value appears at the bottom right of the screen. To
change use the joystick (left, right) in span mode (SP) or change it by the
"span" option in the Tuning menu ( key).
Using the joystick, span values available are: Full (full band), 500 MHz,
200 MHz, 100 MHz, 50 MHz, 20 MHz and 10 MHz.
Using the "span" option in the Tuning menu it is possible to use any span
value between 10 Hz and FULL.
Tune by frequency works in 50 kHz steps o by frequency selection.
Reference Level
It is the power range represented on the vertical axis.
To change use the joystick (up, down; 5 dB steps).
This equipment has an option to activate the automatic adjustment of the
reference level, so it detects the optimal reference level for each situation.
In automatic mode, it sets the optimum reference level each time it enters
the spectrum mode. This option can be enabled or disabled through the
PREFERENCES menu and Measures tab.
Page 63

4-56 March 2017
Cursor
Red vertical line that indicates position during the channel or frequency
tuning.
When a digital signal is detected, there is a triple cursor that shows the
frequency for the signal locked and two vertical lines that shows the
bandwidth of the digital carrier.
In the case of a GENERIC signal, the bandwidth shown is the one selected
by the user on the "Signal Parameters" menu when pressing the key.
To change frequency/channel use the joystick (left, right) in FR mode
(tuning by frequency) or CH mode (tuning by channel).
Marker
It is a special cursor that can be placed on a given frequency to check the
power in this point.
This option can be enabled using the "Marker" option from the Advanced
menu ( key). To change use the joystick (left, right) in MARKER (MK)
mode.
The window Marker shows the following data:
Freq: Frequency where is placed the marker.
Level: Power level at the frequency where is placed the marker (in case
of working with FSM tool, it shows FSM level).
F: Difference of frequency between the marker and the main
cursor.
L: Difference of power level between the marker and the main
cursor.
Centre frequency
Frequency at which the screen is centered. This frequency can be set
through the Tuning menu. It also changes when moving the cursor out
of the screen.
Page 64

March 2017 4-57
4.5.3
TV Mode Screens
4.5.3.1
TV views
TV 1/3: FULL TV
Figure 46.
Selected installation; date and time.
Number of view/total views.
Selected band, battery level.
Tuned service image.
Signal status (searching/locked/multiplex name) and name of the selected
service.
Softkeys menus.
► Joystick up/down: It changes service.
► Joystick left/right: It changes channel/frequency (depending on the tuning
mode).
Page 65

4-58 March 2017
TV 2/3: TV + SPECTRUM + MEASUREMENT *
Figure 47.
Selected installation; date and time.
Number of view/total views.
Selected band, battery level.
Tuned service image.
Spectrum.
Measured values of the signal in the frequency/channel the cursor is
pointing.
Signal status (searching/locked/multiplex name) and name of the selected
service.
Softkeys menus.
► Joystick up/down: It changes service.
► Joystick left/right: It changes channel/frequency (depending on the tuning
mode).
*Only available for digital channels
Page 66

March 2017 4-59
TV 3/3: SCREEN TV + SERVICE DATA *
Figure 48.
Selected installation; date and time.
Tuned service image.
Tuned service information.
► TYPE: Encoding type and video transmission rate.
► FORMAT: Resolution (horizontal x vertical), aspect ratio and
frequency.
► PROFILE: Profile level.
► PID: Video program identifier.
Number of view/total views.
Selected band; battery level.
Tuned service information.
► NETWORK: Television distribution network (Terrestrial). Orbital
position (Satellite).
► PROVIDER: Program provider name.
► NID: Network identifier where the signal is distributed.
► ONID: Identifier of the original network where the signal
originates.
► TSID: Transport stream identifier.
► SID: Service Identifier.
► App. Type: Type of detected interactive service such as HbbTV,
MHP and MHEG-5. It also shows the URL related to the
interactive service in F4: Advanced - Discovered URLs.
► LCN: Logic Channel Number. It is the first logic number
assigned to the first channel in the receiver.
► +Info: Additional service information.
► NIT v.: Network Information Table version.
* Only available for digital channels
Page 67

4-60 March 2017
► FREE/
SCRAMBLED: Free/scrambled transmission.
► DTV/DS: Standard type of transmission.
Tuned audio information.
► TYPE: Type of audio encoding and transmission speed
► FORMAT: Service audio format. Bit depth; sampling frequency;
sound reproduction.
► LANGUAGE: Broadcasting language.
► PID: ID of the audio program.
Signal status (searching/locked/multiplex name) and name of the selected
service.
Softkeys menu.
► Joystick up/down: It changes service.
► Joystick left/right: It changes channel/frequency (depending on the tuning
mode).
NOTE:
The equipment can identify the HEVC (H.265) signaling and display its
transmission data such as the video type, profile format, aspect ratio, bit
rate and image. In UHD services will display all transmission data except for
the image.
NOTE:
PID, NID, ONID, TSID and SID fields can be shown in decimal or
hexadecimal format. To select this parameter go to "Values Format" in
"Preferences" - "Appearance".
Page 68

March 2017 4-61
4.5.3.2
Radio views
RADIO 1/3: AUDIO RADIO
Figure 49.
RADIO 2/3: AUDIO RADIO + SPECTRUM + MEASUREMENTS
Figure 50.
Page 69

4-62 March 2017
RADIO 3/3: AUDIO RADIO + RDS DATA
Figure 51.
It shows the most representative RDS data. RDS data are:
Details: It has the following fields:
► PS: Programme service.
► PI: Programme Identification.
► PTY: Program type.
► UTC Time: Universal time.
► Local: Local time.
► ECC: Extended country code.
► LIC: Language Identification Code.
► TP: Traffic program.
► TA: Traffic announcement.
► MS: Music switcher.
Radiotext: Extra text information.
Decoder ID (decoder identifier): It identifies different operation modes of
the decoder.
Alternative freqs: It shows alternative frequencies and total number.
Page 70

March 2017 4-63
4.6
Extra Information
4.6.1
StealthID Function
The StealthID function of the RANGER
Neo
is a signal identification function
performed automatically by the equipment without any user intervention.
The equipment tries to identify the channel or frequency of the input signal it
receives, and according to the band selected by the user, it applies identifying
criteria according to the standards of that band. When the equipment recognizes
in the input signal the identification parameters of a standard, it decodes the
signal and shows the data of that signal on the screen.
The identification system tries to lock the first signal using the modulation
defined in the channel plan for that signal. If after five seconds it fails to lock
with that modulation, it starts the wheel for automatic detection. If then it locks
in a modulation other than indicated, it generates an internal temporary channel
plan to accelerate tuning the same channel later on.
Then, the user only has to follow these steps in order to identify a signal:
► Operation
Press the Preferences key for 1 second.
In the StealthID tab, select the signal types to auto-identify (see "Menu
tree" figure 7). By default all them are selected. Press the key to save
the changes made and the key to exit the Preferences screen.
Press the Settings key.
Select the band (terrestrial or satellite).
Select a channel or frequency to identify.
The bottom of the screen shows the message "Searching for signal" and
the standard transmission checking. Wait a few seconds for the equipment
to identify the signal. User can force the auto-identification of a signal by
pressing the key and selecting the type of signal from the menu.
When the equipment identifies the signal a text shows the detected signal
type.
Press (Signal Parameters) to see the signal parameters.
► Signals automatically detected
Digital Terrestrial Television First Generation (DVB-T)
Digital Terrestrial Television Second Generation (DVB-T2: T2-Base and T2-
Lite profiles)
Digital Satellite Television First Generation (DVB-S)
Digital Satellite Television Second Generation (DVB-S2)
Page 71

4-64 March 2017
Digital Satellite Television, exclusive for DirecTV (DSS)
Digital Cable Television First Generation (DVB-C)
Digital Cable Television Second Generation (DVB-C2)
Analogue terrestrial TV
Analogue Cable TV
Analogue Terrestrial FM
4.6.2
Generic Signal
This a special digital signal that the equipment does not demodulate. It can be
used for special signals as DAB/DAB + or COFDM modulation with narrow BW.
In this type of signal the user can select the signal bandwidth by accessing the
"Signal Parameters" menu on the key.
The power measure and C/N ratio is calculated according to the bandwidth
selected by the user. The triple cursor shows on screen the BW selected by the
user.
4.6.3
Locking a signal
Connect the cable with the input signal to the RF input connector.
Press the SPECTRUM key. The spectrum of the signal is displayed.
Adjust the span (recommended value for a terrestrial signal 50 MHz
and for a satellite signal 100 MHz). The current value of the span is at
the right bottom of the screen.
Find the frequency of the signal by moving the joystick left or right to
move sweeping the entire band.
If you know the channel change the tuning by frequency to tuning by
channel. The channel mode allows you to navigate from channel to
channel, using the selected channel plan.
When the channel is locked information appears at the bottom left of
the screen. A triple cursor shows the detected BW for a digital carrier.
The equipment automatically detects transmission parameters of the
signal and makes the corresponding measurements.
Page 72

March 2017 4-65
4.6.4
Satellite Identification
The spectrum analyser makes easier the fieldwork for engineers when working
with SNG mobile units and VSAT communications, since it allows adjusting
transmission-reception systems. It also has several functions to identify satellites
that avoid any possibility of error. When the signal is locked it identifies the
satellite and shows on screen its name.
Often satellite operators request to look for the "Beacon" signal, as a method of
satellite identification. This signal is easily identified by the equipment, because it
has high resolution, high sensitivity and short sweep times.
Below are two BEACON screenshots signals, with a span of 10 MHz and a
bandwidth of 100 kHz resolution, all with a sweep time of 90 ms.
Figure 52.
Figure 53.
More data for installations with satellite signals in annex "How to point a dish
antenna."
Page 73

4-66 March 2017
4.6.5
IRG Descritor
The analyser is compatible with IRG recommendations and it can extract the
Carrier ID information and display it conveniently showing all the details.
This information is useful to identify the interference, thanks to the carrier ID.
This identifier provides enough information to detect the interference source
(customer name, contact data, geo coordinates, etc.) and allows the operators to
communicate directly with the RFI source to resolve the incident.
IRG descriptor function is available only for signals containing the carrier
identifier. To access this feature:
Connect the RF input signal to the equipment.
Tune the channel that produces interferences.
Access to TV mode.
Press the Advanced menu .
Select the TS Data option. If the signal has a carrier identifier, this
option is enabled. If the signal does not contain this identifier, this
option is disabled.
The IRG descriptor window is displayed with the data about the
provider (see figure below).
Figure 54.
Page 74

March 2017 4-67
4.7
Tools
4.7.1
Constellation
4.7.1.1
Description
The constellation diagram is a graphic representation of the digital symbols
received over a period of time. There are different types of constellation
diagrams according to the modulation type.
In the case of an ideal transmission channel without noise or interference, all
symbols are recognized by the demodulator without errors. In this case, they
are represented in the constellation diagram as well defined points hitting in
the same area forming a very concentrated dot.
Noise and interferences cause the demodulator to not always read the symbols
correctly. In this case hits are dispersed and create different forms which can
visually determine the type of problem in the signal.
Each type of modulation is represented differently. A 16-QAM signal is shown
on screen by a diagram of a total of 16 different zones and a 64-QAM signal is
represented by a diagram of 64 different zones and so on.
The constellation diagram shows in different colours the density of hits and
includes features to zoom, move and delete the display on screen.
4.7.1.2
Operation
The constellation is available to all DIGITAL signals, both TERRESTRIAL and
SATELLITE.
To access the CONSTELLATION tool:
Connect the RF input signal to the equipment.
Tune to a digital signal from satellite or terrestrial band.
Press the key (Tools).
Select CONSTELLATION.
The CONSTELLATION of the tuned signal appears.
Page 75

4-68 March 2017
► Screen description
Figure 55.
Selected installation; date and time.
Constellation window.
The colour scale placed at the left side indicates the signal quality in a
qualitative way by a gradation of colours proportional to the density of
symbols concentrated in a given area. The colour scale ranges from black
(no symbols) to red (highest density).
Greater dispersion of the symbols indicates higher noise level or worse
signal quality signal. If there is symbols concentration with respect to the
full grid (see advanced menu for types of grid) this is indicative of good
ratio signal/noise or absence of problems.
Selected band, battery level.
Constellation modulation.
Data Window.
The data shown are: Start Carrier, Stop Carrier, Power, C/N and
frequency/channel.
Spectrum of the tuned signal.
Spectrum is displayed with the span selected at the SPECTRUM mode.
Signal status (searching/locked/multiplex name).
Softkeys menus.
► Joystick Left/Right: Frequency/Channel change (depending on the tuning
mode).
Page 76

March 2017 4-69
4.7.1.3
Menu options
On the bottom of the screen there are four menus accessible via the function
keys.
It displays the channel / frequency where is pointing
the cursor, accesses the tuning menu and allows
selecting the channel plan.
It displays the selected transmission standard menu
and accesses the signal parameters.
It displays the Tools menu.
It displays the Advanced menu.
In the Advanced menu there are some options to set the constellation tool.
They are:
► Grid type:
Full Grid: The grid where the constellation is displayed is a complete
grid.
Cross Grid: The grid where the constellation is displayed is made of
crosses.
► Persistence:
It allows the user to set the level of persistence, which is the lapse of time the
signal stays on the screen before disappearing. Available options according to
the persistence level are: low, medium, high or permanent.
► Zoom:
It allows the user to select a quarter (I, II, III or IV) where apply the zoom in.
To come back to normal view select All.
► Start Carrier/Stop Carrier:
This option allows selecting the range of carriers to be displayed between the
first and last.
► Clear:
This options clears all symbols in the whole constellation window.
Page 77

4-70 March 2017
4.7.2
LTE Ingress test
4.7.2.1
Description
Long Term Evolution is a new standard for mobile networks. This mobile
communication standard uses a frequency band close to the bands used by
television. For this reason it can cause interferences.
The equipment allows you to use an LTE external filter to put on the RF input
connector. This filter can be enabled to check if the quality of the TV signal
reception improves, when much of the LTE band has been attenuated by the
filter. With this tool you can measure the MER of a DTT channel, presumably
affected by an LTE signal, and evaluate the effects of enabling an LTE filter.
To be clarified that these filters cannot completely remove the LTE band
signals. Especially for the TV channels close to 790 MHz, where is the end for
the current UHF. If we are close to a LTE station with low downlink channels, a
filter cannot be a sufficient solution.
Other options to better mitigate the LTE signals can be considered, such as a
change in the location of the TV antenna or a passive shield in the way
between the two antennas (TV and LTE).
For more information, refer to annex "digital dividend".
4.7.2.2
Operation
The LTE Ingress Test is available to all DIGITAL TERRESTRIAL signals.
► Setting:
Press the "Installation manager" key for one second to access
"Preferences" settings.
Go to "Tools" tab and edit the LTE filter settings.
LTE Filter F.Min: In case of use, select the minimum frequency for
the external LTE filter.
LTE Filter F.Max: In case of use, select the maximum frequency
for the external LTE filter.
Once selected, press to save changes and to exit "Preferences".
► Operation:
Connect the external LTE filter between the signal and the RF input.
Tune the channel that is possibly affected by a LTE interference.
Press the key: Tools.
Select the LTE Ingress Test mode.
Screen shows a confirmation message. Press on : "Yes" if filter is
connected or : "No" if filter is not connected.
Page 78

March 2017 4-71
It starts to measure.
To change filter status (ON / OFF), press again the key and will
appear a confirmation message. Connect / disconnect the LTE filter at
the RF input and then press key: Ok to start measuring.
The user can enable / disable the LTE measure by pressing the :
ON/OFF. Remember to connect / disconnect the LTE filter to the RF
input. Each time a LTE measure starts, the time counter will reset.
Check how to connect and disconnect the LTE filter affects the
installation, by comparing the MER measure and the LTE band power.
► Screen description
Figure 56.
Selected installation; date and time.
Elapsed time with filter enabled (ON).
Measurement with LTE filter enabled:
MER: Maximum and minimum MER for the TV channel tuned
(the one probably affected by the LTE interference
signal).
LTE Power: Maximum and minimum power for the complete band,
between minimum and maximum filter frequencies
(internal filter between 776 and 876 MHz).
Page 79

4-72 March 2017
Spectrum band, frequencies between minimum and maximum filter
frequencies (internal filter between 776 and 876 MHz).
Identifier icon of the LTE filter ON (only when using internal LTE filter).
Selected band; battery level.
Time elapsed with filter disabled (OFF).
Measurement with LTE filter disabled:
MER: Maximum and minimum MER for the TV channel tuned
(the one probably affected by the LTE interference
signal).
LTE Power: Maximum and minimum power for the complete band,
frequencies between minimum and maximum filter
frequencies (internal filter between 776 and 876 MHz).
Measurement units/centre frequency/span (span: 10 MHz/division).
Signal status (searching/locked/multiplex name).
Softkeys menus.
4.7.2.3
Menu options
On the bottom of the screen there are four menus accessible via the function
keys.
It displays channel/frequency and access the tuning
menu. It allows selecting the channel plan and the
channel where apply the LTE ingress test.
It displays the selected transmission standard menu
and accesses the signal parameters.
It displays the Tools menu.
It enables (ON) / disables (OFF) the LTE filter.
Page 80

March 2017 4-73
4.7.3
Echoes
4.7.3.1
Description
The Echoes function shows the response in time of a digital terrestrial channel
and therefore it can detect echoes that can occur due to the simultaneous
reception of the same signal from several transmitters with different delays and
amplitudes.
Another cause that August cause echoes is reflection of the signal on large
objects, as buildings or mountains. This August be the explanation that having a
good C/N and a good signal, the BER does not reach the minimum value.
With the Echoes function is possible to know the distance from where the
equipment is to the transmitter or the object that caused the echo. Thus, the
installer can minimise the effect that the echo August cause on the installation,
reorienting the antenna and reducing the effect of received echoes.
This function is only available for DVB-T, DVB-T2 and DVB-C2. Therefore,
previously have to configure the equipment for the reception of such signals.
4.7.3.2
Operation
Echoes function is available for DVB-T, DVB-T2 and DVB-C2 signals.
Connect the RF input signal to the equipment.
Tune a DVB-T, DVB-T2 or DVB-C2 digital signal at the terrestrial
band.
Press the key (Tools).
Select ECHOES.
The ECHOES function of the tuned signal appears on screen.
► Screen description:
Figure 57.
Page 81

4-74 March 2017
Selected installation; date and time.
Selected band, battery level.
Main signal data: Frequency, Power , C/N and Cell ID (it shows the main
signal trasmitter, if available).
ECHOES Diagram.
The display shows a graphical representation of the echoes. The
horizontal axis of the graph corresponds to the delay in receiving the
echo on the main path (the stronger signal).The vertical axis represents
the attenuation of the echo in dB on the main path.
Data box with main data regarding echoes.
In the list of echoes it shows the power, the delay in microseconds and
the distance in kilometres to the echoes.
Signal status (searching/locked/multiplex name).
Softkeys menus.
► Joystick left/right (CHANNEL/FREQUENCY active mode): It changes the
channel/frequency (according to the tuning type selected).
► Joystick up/down (ECHOES mode): It changes Zoom.
Remember to press the joystick to change the ECHOES mode to CHANNEL
mode.
4.7.3.3
Menu options
At the bottom of the screen there are four menus available via the function keys.
It displays the channel/frequency where is pointing
the cursor, it allows the user to select a channel or
frequency, a channel plan and access the tuning
menu.
It displays the selected transmission standard menu
and accesses the signal parameters.
It displays the Tools menu.
It displays the Advanced menu. The ZOOM option
changes the zoom on the echoes windows. Zooms
are 1x, 2x, 4x and 8x.
Page 82

March 2017 4-75
4.7.4
MER by carrier*
4.7.4.1
Description
This function analyses continuously the measure of the MER value for each one of
the carriers forming the selected channel and they are displayed in a graphic on
screen. This tool is especially useful for the analysis of systems in which signals
of different type and origin interfere with each other, as August occur during the
transition from analogue to digital TV.
4.7.4.2
Operation
The MER by carrier tool is available for signals with carriers: DVB-T, DVB-T2
and DVB-C2.
Connect the RF input signal to the equipment.
Select terrestrial band and tune a DVB-T, DVB-T2 or DVB-C2 digital
signal.
Press the Tools key .
Select MER by carrier option.
To exit this tool press any key of mode (TV mode, Spectrum mode or
Measurement mode).
► Screen description:
Figure 58.
Selected installation; date and time.
Joystick active mode; Selected band, battery level.
Measurement values for the signal tuned at the frequency/channel
selected.
*only available for RANGER
Neo +
Page 83

4-76 March 2017
Average measurement value and standard deviation value of MER.
MER by carrier graphic.
Signal status (searching/locked/multiplex name).
Softkeys menus.
Axis X: Carriers
Axis Y: MER
► Joystick left/right: Channel/frequency change (according to the tuning
mode).
4.7.4.3
Menu options
At the bottom of the screen there are three menus available via the function
keys.
It displays the channel/frequency where is pointing
the cursor, it allows selecting channel plan and
channel and access the tuning menu.
It displays the selected transmission standard menu
and accesses the signal parameters.
It displays the Tools menu.
4.7.5
MEROGRAM*
4.7.5.1
Description
This function shows a graphical representation of the MER level for each carrier
of the locked signal, which is superimposed over time. During the MEROGRAM
function, maximum and minimum of some parameters and the time when they
are reached are stored. This tool is especially useful for detecting sporadic
problems over time.
Page 84

March 2017 4-77
4.7.5.2
Operation
The MEROGRAM tool is available for signals with carriers: DVB-T, DVB-T2 and
DVB-C2.
Connect the RF input signal to the equipment.
Select the terrestrial band and tune a DVB-T, DVB-T2 or DVB-C2
channel or frequency.
Press the Tools key .
Select the MEROGRAM function.
It shows the MEROGRAM function of the signal.
To exit this function press any key of mode (TV mode, Spectrum mode
or Measurement mode). All data registered is cleaned after leaving.
► Screen description:
Figure 59.
Selected installation; date and time.
Measurement values for the signal tuned at the frequency/channel
selected.
Maximum level of MER.
MEROGRAM graphic.
Minimum level of MER.
Selected band, battery level.
*only available for RANGER
Neo +
Page 85

4-78 March 2017
Maximum and minimum MER value and MER average over time.
Maximum and minimum value of the measure selected by the user in the
option "User measure".
Elapsed time after starting the MEROGRAM function.
Signal status (searching/locked/multiplex name).
Softkeys menus.
X Axis: Carriers
Y Axis: Power
► Joystick does not have any function in this tool.
4.7.5.3
Menu options
At the bottom of the screen there are four menus available via the function keys.
It displays the channel/frequency where is pointing
the cursor, it allows selecting channel plan and
channel and access the tuning menu.
It displays the selected transmission standard menu
and accesses the signal parameters.
It displays the Tools menu.
It displays the Advanced menu.
In the Advanced menu there are some options for the MEROGRAM function
configuration. They are:
► User measure:
It allows the user to select the measure to view on screen among the several
available for each type of signal.
► Details:
It allows the user to view on screen the date and time when maximum and
minimum measures were reached. To quit this view press the key .
► Clear measures:
It cleans the MEROGRAM function and measures and it restarts the timer.
Page 86

March 2017 4-79
4.7.6
Spectrogram*
4.7.6.1
Description
This function shows a graphical representation of the spectrum superimposed
over time of a channel or frequency selected by the user. During the
Spectrogram, maximum and minimum of several measures and time are
registered. This tool is especially useful to analyse the behaviour of a spectrum
over time, because sporadic and indeterminate anomalies can be detected.
4.7.6.2
Operation
The Spectrogram tool is available for all signals.
Connect the RF input signal to the equipment.
Select a channel or frequency.
Select the SPAN within the spectrogram will be displayed.
Press the Tools key .
Select the Spectrogram option.
It shows the Spectrogram of the signal.
To exit this function press any key of mode (TV mode, Spectrum
mode or Measurement mode). All data registered is cleaned after
leaving.
While using the Spectrogram function, if the signal unlocks, timer and
measurement registered will clean and they will start to register when the signal
is locked again.
► Screen description:
Figure 60.
*only available for RANGER
Neo +
Page 87

4-80 March 2017
Selected installation; date and time.
Measurement values for the signal tuned at the frequency/channel
selected.
Spectrum over time at the selected span.
Softkeys menus.
Selected band, battery level.
Maximum and minimum values of signal power and band power over
time.
Maximum and minimum value of the measure selected by the user in the
option "User measure".
Elapsed time.
Signal status (searching / locked / multiplex name / selected span).
X Axis: Span (MHz)
Y Axis: Power
► Joystick does not have any function in this tool.
4.7.6.3
Menu options
At the bottom of the screen there are four menus available via the function keys.
It displays the channel/frequency where is pointing
the cursor and access the tuning menu.
It displays the selected transmission standard menu
and accesses the signal parameters.
It displays the Tools menu.
It displays the Advanced menu.
In the Advanced menu there are some options for the spectrogram configuration.
They are:
► User measure:
It allows the user to select the measure to view on screen among the several
available for each type of signal.
Page 88

March 2017 4-81
► Details:
It allows the user to view on screen the date and time when maximum and
minimum measures were reached. To quit this view press the key .
► Clear measures:
It cleans the spectrogram and measures and it restarts the timer.
4.7.7
Attenuation Test
4.7.7.1
Description
This feature allows the user to easily check the response of the
telecommunications installations before antennas and headers are working. It
allows the user to evaluate the response along the complete range of frequencies
by measuring the losses (attenuation) in the distribution of TV signals, comparing
reference levels at headend output and at each house antenna plugs.
4.7.7.2
Operation
Attenuation test function is available for all signals.
In Settings select the terrestrial or satellite band.
Press the Tools key .
Select the Attenuation Test option.
The Attenuation Test function for the signal appears on screen.
First, set the parameters before the test, pressing the Advanced
key: Frequencies of pilot signals (pilot 0, pilot 1 and pilot 2),
maximum attenuation and threshold attenuation (see more details in
the next section).
Then it is necessary to Set References. This requires a signal
generator. We recommend to use of one of the PROMAX signal
generators: RP-050, RP-080, RP-110 or RP-250 (depending on the
frequency band).
Connect the generator and the meter where the origin of the signal
distribution is in the installation (antenna, headend, etc.) or connect
the generator directly to the RF input of the meter. If necessary, the
meter can feed the generator using the Supply Output option from
the Settings menu .
Active the signal generator and in the equipment, press the Set
Reference key .
Once are set the references for the pilot signals, let the signal
generator connected to the source point of the distribution system and
take measurements in each user access point with the equipment.
Page 89

4-82 March 2017
In each measurement a message over each pilot signal indicates
whether the measure "Pass" or "Fail" according to the parameters set.
The measurement data from the Attenuation Test can be saved
through the Datalogger tool. To do this, when creating a new
datalogger, in the option Include Attenuation Tests, select
Terrestrial and/or Satellite. Then, the user must perform a datalogger
from the test point where he is performing the attenuation test.
Another quick option it is to select the "Test & Go" function in the
"Datalogger" menu. This option creates automatically one channel plan
(TER ICT or SAT ICT according to the current band) and starts to save
measurements. The data will be saved and can be checked and
transferred to a PC. For more information, see "Datalogger" section
under the "Tools" chapter. Also measurement data or screen image
can be exported by pressing the Export key (see more details in
section "Export key") and after that display the images or download
the data files (in XML format).
NOTE: In both satellite and terrestrial band, the system saves the LNB state every
time the user sets a reference and uses this value always that the
equipment is working in this mode.
► Screen description:
Figure 61.
Installation selected, date and time.
Selected band; battery level.
Status message depending on the attenuation level.
Page 90

March 2017 4-83
Power level of the signal.
Signal Frequency (MHz).
Power level of the reference signal obtained when setting the reference
and used to calculate the attenuation level (dBµV).
Power level of the test signal at the user access point (dBµV).
Attenuation level (dB); Attenuation = Reference – Current.
Softkeys.
X-axis: Pilot signals
Y-axis: Power
► Joystick: The joystick does not have any function in this tool.
4.7.7.3
Menu options
In the bottom of the screen are four menu accessible via the softkeys.
Exit: Exits the tool.
Set Reference: Pressing this option the current
power values are captured and they are assigned as
reference values.
Tools: It access the Tools main menu.
Advanced: It access the Advanced menu.
In the Advanced menu there are five parameters to set the attenuation test.
They are:
► Threshold Attenuation:
It defines the maximum difference that August exist between the pilot signal
of higher level and the pilot signal of lower level. All pilot signals out of this
range will be removed and not used as a pilot signal during the measurement
process.
► Maximum Attenuation:
It sets the attenuation level used by the equipment to show on screen if the
signal passes or fails. When the attenuation level is below this value the
message on screen is "PASS" and when it is above this value is "FAIL".
► Pilot 0:
Page 91

4-84 March 2017
It defines the frequency of the pilot signal 0 (MHz).
► Pilot 1:
It defines the frequency of the pilot signal 1 (MHz).
► Pilot 2:
It defines the frequency of the pilot signal 2 (MHz).
4.7.8
Signal Monitoring*
4.7.8.1
Description
This tool allows the user to monitor a locked signal over time, measuring its
power, MER and C/N. All this data can be downloaded to a PC and exported to a
file for later analysis.
4.7.8.2
Operation
The Signal Monitoring tool is available for all signals.
In Settings menu select the band.
Access the SPECTRUM mode and tune the signal for monitoring.
In case of tuning a DVB-T2 signal, in the Signal Parameters menu
select the Profile (Base or Lite) and in the key select the PLP
identifier. User has to choose one profile and one PLP identifier per each
monitoring.
Press the Tools key .
Select the Signal Monitoring option.
The Signal Monitoring function appears on screen.
Before starting the monitoring, access the Configuration option in the
Advanced menu for settings (more details in next section).
After settings, access the Advanced menu and press on Start to
start the signal monitoring.
In Continuous mode, the equipment takes samples automatically
according to sample time (see next section). In Manual mode each time
the user presses the joystick the equipment takes a sample.
Access the Advanced menu and press on Stop to finish the signal
monitoring. Data obtained is automatically stored.
*only available for RANGER
Neo +
Page 92

March 2017 4-85
After stopped, it appears the Signal Monitoring Viewer that allows the
user to watch the final results (more details in "Signal Monitoring Viewer"
section).
Access the data by pressing the Installation Management key to
check that the monitoring data file has been saved. This file is a "Signal
Monitoring" type. To manage the data, see below the section "Data File
Processing".
► Screen Description:
The following describes the Signal Monitoring screen:
Figure 62.
Selected installation; date and time.
Spectrum.
Power measurement over time (shows span time).
MER and C/N measurement over time (shows span time).
Indicator of signal monitoring started.
LNB, Selected band; battery level.
Signal information window 1:
Frecuency: frequency at which signal is locked; Profile (only for
DVB-T2 signals): Base or Lite; PLP identifier (only for DVB-T2 signals):
identifier of the layer being measured, TS Hierarchy (table hierarchy at
the transport stream) TS Priority (packet priority at the transport
stream).
Signal information window 2:
Power, C/N, MER measurements of the signal over time. It shows on
screen only the span time selected in settings.
Page 93

4-86 March 2017
Signal information window 3:
Elapsed: Time elapsed since the beginning of the monitoring.
Samples: Samples taken since the beginning of the monitoring.
Space left: Space left in the memory to save data.
4.7.8.3
Menu options
At the bottom of the screen there are four menus available via the function keys.
It displays the channel/frequency where is pointing
the cursor and access the tuning menu.
It displays the selected transmission standard menu
and accesses the signal parameters.
It displays the Tools menu.
It displays the Advanced menu.
In the Advanced menu there are some options for the Signal Monitoring. They
are:
► Start: It starts the signal monitoring.
► Stop: It stops the signal monitoring.
► Pause: It stops the signal monitoring for a while until resuming.
► Configuration: It shows the settings window with some parameters. (see the
"Configuration" section for more details).
► GPS Status: It shows a list and a graph with satellites detected to locate the
GPS signal. It is also provided additional data such as longitude, latitude, date
and universal time, visible satellites and GPS status (locked or not) (this
option is available only for equipment with GPS, see annex OP-001-GPS).
► Audio: It allows disable or disable audio. When this option is enabled, the
user can listen to any service in the monitored signal, knowing about signal
reception while driving or doing other tasks.
Page 94

March 2017 4-87
4.7.8.4
Settings
User can adjust some parameters on the Signal Monitoring:
Figure 63.
► File name:
User can give a name to the file where data is saved. All measurement that
can be seen in the MEASUREMENT 1/3 screen (frequency, power/level, C/N,
PLP identifier, MER, CBER, LBER and LM) will be stored on the data file. Be
sure to change the file name when starting a new signal monitoring. If not,
new data file will be saved on the last one.
► Comment:
User can write some comments about the monitoring.
► Mode:
There are two options: Continuous or Manual. In continuous mode a
sample is taken automatically every sample time. In manual mode a sample is
taken every time that user presses the joystick.
► Sample Time:
Time between acquisitions. Only when working in continuous mode. Minimum
time is 1 second.
► Span time:
It is the width, in time, shown on screen for the X axis.
► Save to:
There are two options: Internal or USB. For Internal option it saves the file
with all data in the internal memory of the equipment. For USB option it saves
the file with all data in a USB flashdrive connected to the micro-USB port of
the equipment.
Page 95

4-88 March 2017
4.7.8.5
Data viewer
The data viewer allows the user to watch the monitoring final results. It accesses
directly when signal monitoring ends or also by opening the data file in the
installation management screen.
► Screen description:
Figure 64.
Selected installation; date and time.
Power measurement over time.
MER and C/N measurement over time.
Joystick mode selected: PA mode (panoramic) or MA mode (cursor
movement).
LNB, selected band; battery level.
Signal information window 1:
Measurement of power, C/N, Offset, MER, CBER, VBER and Link Margin
where the cursor is.
Signal information window 2:
Date, time and elapsed time.
Scrollbar: it shows position and size of the data displayed related to total
data.
Time span of displayed data.
Menu Options:
: Exits the data viewer.
: It shows transmission parameters of the monitored signal.
Page 96

March 2017 4-89
► Joystick up/down: It increases / decreases zoom.
► Joystick left/right: In PA mode it moves time span along the total
time. In MA mode it moves the cursor along the samples of the time
span.
► Joystick pressing: It switches between panoramic (PA) and movement
(MA) mode.
4.7.8.6
Data file processing
► Description:
This document is an explanation about the process that is needed to be done in
order to obtain a more comfortable view of the XML data obtained with
RANGER
Neo
family equipment, when performing a Signal Monitoring.
Once you got the monitoring data, copy the XML data file from the equipment to
a USB memory using the Installation Manager. See the equipment’s
documentation in how to get files from an Installation.
► Obtaining an excel file:
For this section, you must have at least Excel 2003 or newer version. Excel 2007
(or later) is highly recommended to avoid macro problems.
First of all we need to locate the XML data file in the folder from which we
want to work. There are no requirements needed to be satisfied. A file
named COVERAGE.XSL must be placed in the same data file folder. That
second file allows proper data formatting when processed by Excel.
Select the XML data file and then right click with the mouse button on the
file name.
Choose the option “Open with” and then select Excel 2007 (or the
available version).
Figure 65.
Page 97

4-90 March 2017
When Excel tries to open the file it will ask you the import method to
open the XML data file by this way:
Figure 66.
You must choose the option in which a stylesheet is asked. It will appear
as an option the “COVERAGE.xsl” file.
Figure 67.
Now Excel is opening the XML data file using the format that the XSL file
is providing. This step could take few seconds depending on the size of
the XML data file.
At this point, you should have an excel file with three different sheets.
Each sheet corresponds to a different view of the same data:
Page 98

March 2017 4-91
The first one will show you the generic signal information and the
different coverage measures for each point acquired.
In the second one, you will find the same data but presented in a
table format, more user friendly for working with graphs based on
each measured parameter.
The third one provides data in a format adapted for geolocation. This
is available only for users with GPS option (refer to annex
OP-001-GPS).
Now save the data as a true excel file. No specific name or path is
required, but you must remember the path.
4.7.9
Datalogger
4.7.9.1
Description
The Datalogger function stores automatically measurements in a file set by the
user (name, channel plan). User can store for each datalogger measurements
taken at different test points of the selected installation. Measurements are made
for all channels in the active channel plan, both analogue and digital. Each
installation has its own datalogger files.
4.7.9.2
Operation
► To create a new datalogger:
First select one installation of the list of installations and load it
pressing the "Load" key . An installation contains the channel plans
and DiSEqC commands selected by the user and it stores dataloggers
and screenshots made while it is selected (more information in chapter
"Installations management").
Check the installation is selected. The name of the installation should
appear on the upper left corner of the screen.
Press the : Tools key.
Press on the "Datalogger" option.
It displays a menu with the "New ...", "Test & Go" option and a list of
all dataloggers at the selected installation.
Select "New ..." to create a new datalogger, select "Test & Go" to
create a quick datalogger (see next) or select the file name of an
existing datalogger if the user want to save data on a specific
datalogger already existing.
Page 99

4-92 March 2017
If "New ..." is selected, a installation wizard shows how to create a
new datalogger. Follow its instructions ( : Next to move to the next
screen, : Previous to move to the previous screen or : Cancel to
cancel).
When creating a new datalogger through the wizard, the user can give
a name to the datalogger.
Figure 68.
Next, the user can select the terrestrial and/or satellite channel plan to
use in the datalogger. The channel plans that are shown depends on
the channel plans available for the current installation.
Figure 69.
Page 100

March 2017 4-93
Figure 70.
In the next window, the user can select an option to capture de
service list when performing the datalogger (this option slows down
the process but provides more information). Another option allows the
user to enable a pause between channel plans (the process stops until
the user wants to carry on). There is also the option to perform a
datalogger on the attenuation test, terrestrial or satellite (see section
"Attenuation Test" under "Tools" for more information).
Figure 71.
At the last step, user can select to open the just created new
datalogger (by default, this option is selected).
Once a new datalogger is created or selected an already existing one,
it shows the datalogger viewer screen and measurements of test
points can start.
If it is a new datalogger, in first place before starting the datalogger,
the system will create a new test point (see next section).
 Loading...