

Page 1
10/04
Technical details are subject to change without prior notice.© Schwer + Kopka GmbH
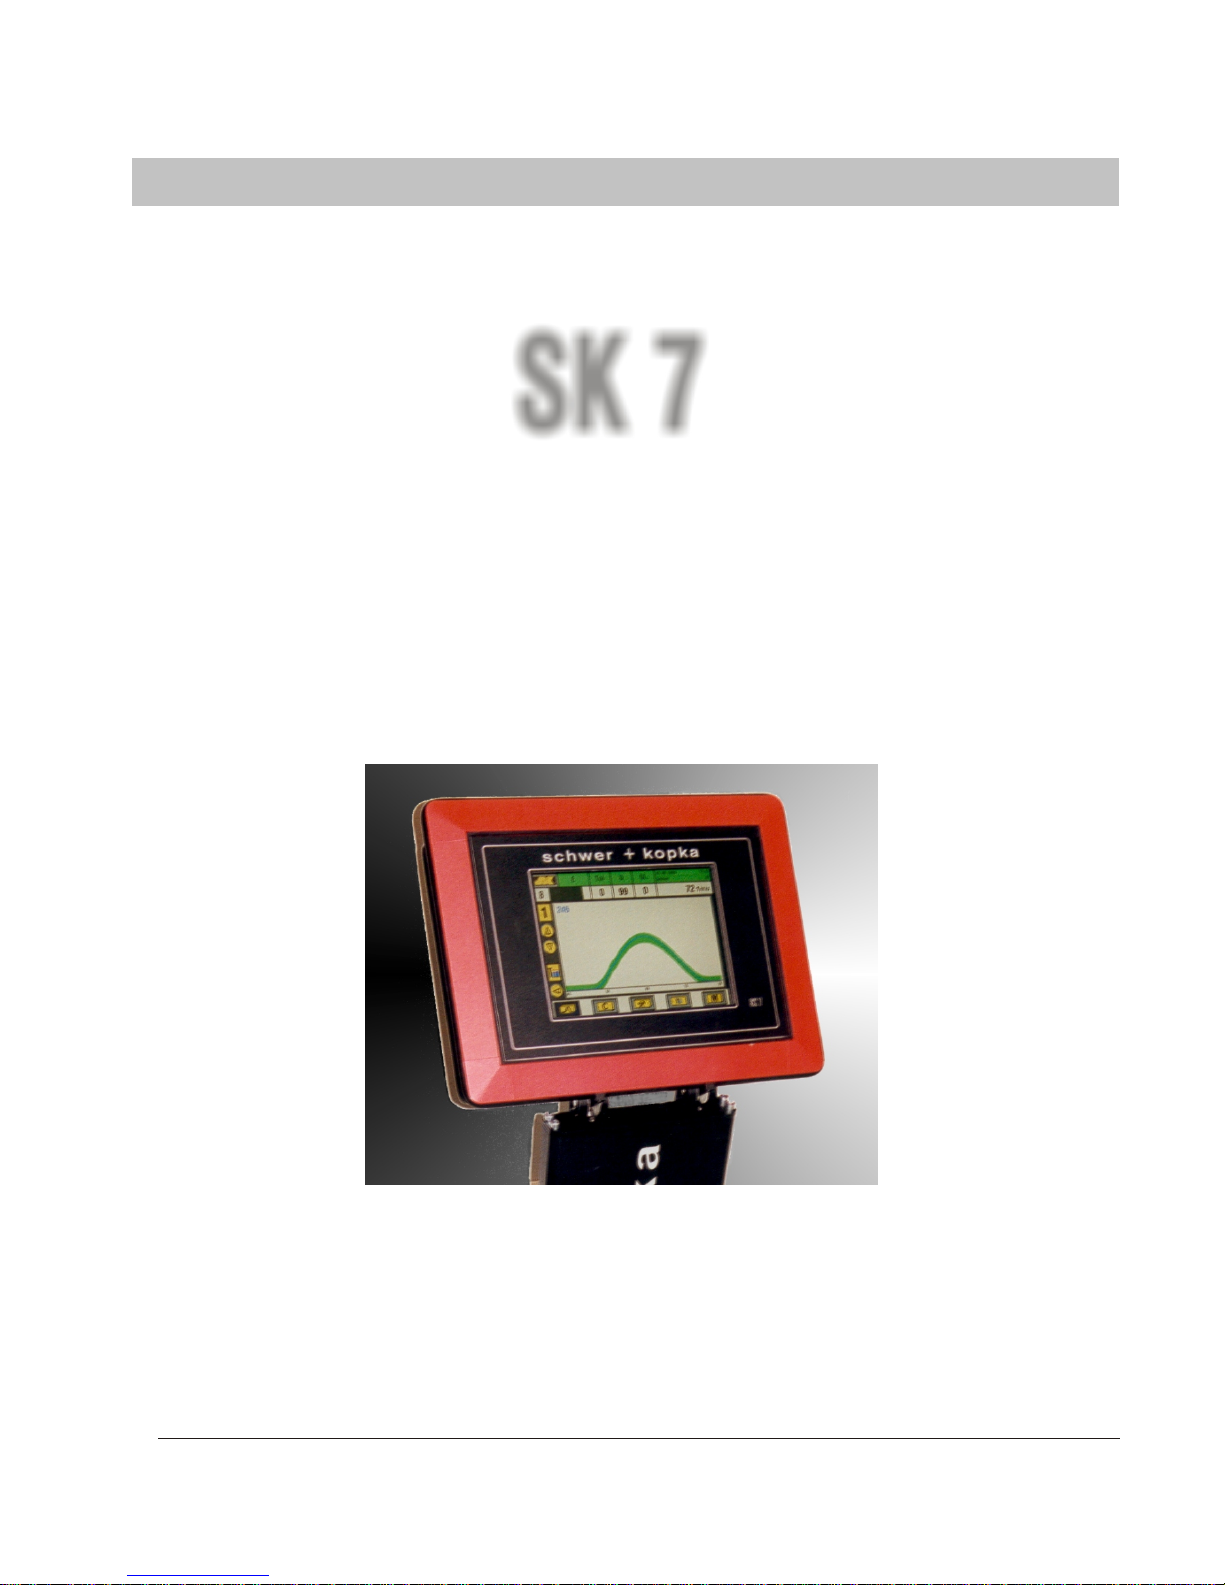
Operating Manual
Process Monitoring System
for Cold Forming Machines
SK 7SK 7
Process Technologies Group, Inc.
30W106 Butterfield Road
Warrenville, IL 60555
Phone: (630) 393-4777 Fax: (630) 393-4680
Web: www.impaxptg.com E-mail: [email protected]
Page 2

Contents
SK 7
SK7-01
Contents
Please note that some of the features described in this manual are optional
and/or may not be available for all models or applications.
Technical details are subject to change without prior notice.
V5.2 E 10/04
System layout................................................2 Part counters... ............................................21
- how to set the counter. ..............................21
Display Panel..................................................3 - order size counter...... ...............................21
- tool life counter..........................................21
Controls and connections (rear panel).............4 - AUTO2-counter.........................................22
- batching counter.......................................22
Start- up/basic functions.................................5
SKToolmaster (header set-up).......................24
Operation modes............................................6
Sorting control/idle stroke adjustment............26
- sorting function .........................................26
Envelope monitoring (force)............................7
- how to set the sorting parameters................27
- envelope display.........................................7
- idle stroke adjustment.................................27
- machine stop with envelope error.................8
- SKSinglemaster.........................................28
- restart after stop.........................................8
- sensitivity ..................................................9
Machine and process data analysis..............29
- tolerance....................................................9
- machine run time diagram.........................29
- error statistics...........................................29
- error memory (failure curves)....................30
Load distribution profile.................................31
Part data memory.........................................32
Machine Interface.............................................
Q-factor monitoring......................................18
SKAutomaster..............................................10
SKFuzzymaster............................................11
SKProfilemaster...........................................12
Trend Monitoring..........................................14
- trend display with stop/go............................15
- trend parameter settings..............................16
- setting of trend limits...................................16
- relative or absolute trend limits.....................16
SKQmaster..................................................20
Page 3
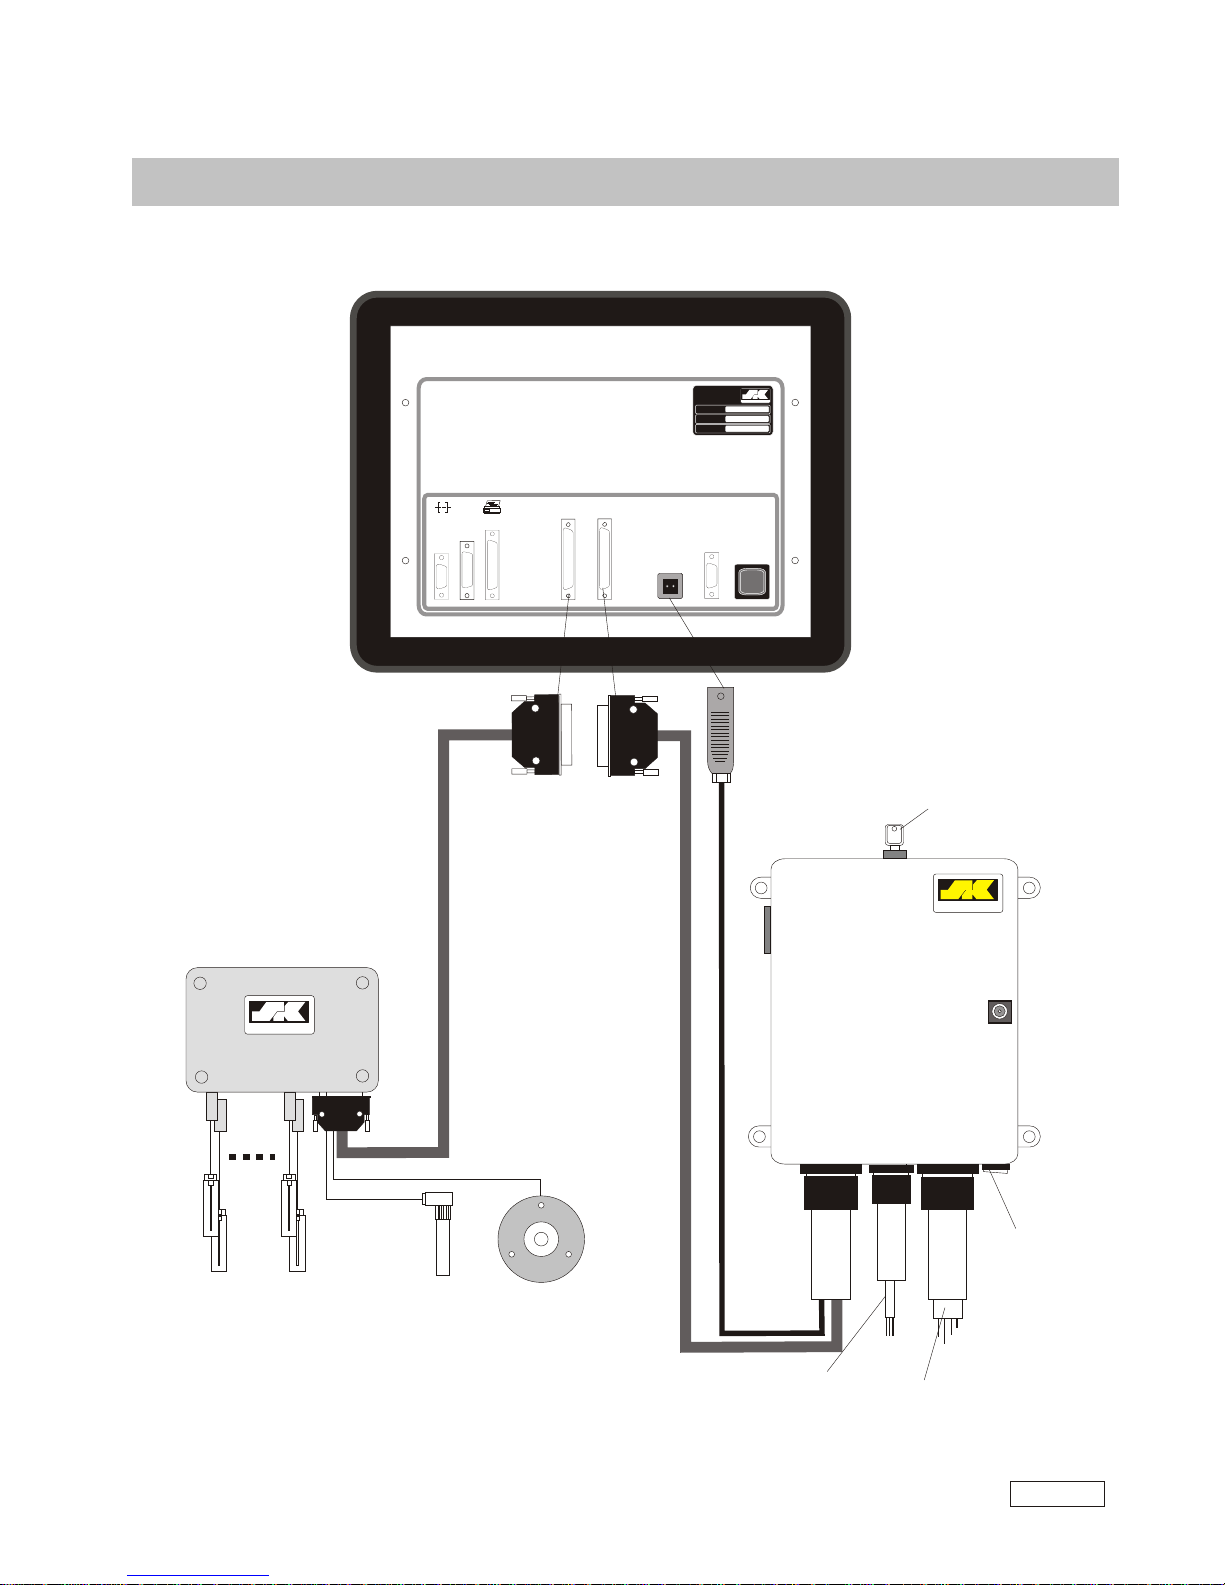
System layout
Piezo electric
sensors
(up to 16 channels)
Timing
signal
(prox)
Rotary
angle
encoder
DB 37
female
DB 37
male
24 VDC
T
S-N
V/A
schw er k op ka
+
CE
s chwer k opka
+
24 VDC / 4 A
SK 4 C
S1
D
O/1
I1
24VDC
Abmasse:
200 B x 250 H x 160 T
Raster Befestigungslöcher:
160 B ; 272 H
Sensor Box
sch we r kop ka
+
Machine
Interface
By-Pass
key switch
sch we r kop ka
+
to machine
control cicuits
85 - 265 VAC
50/60 Hz
On/Off
SK 7
V5.2 E 10/04
SK7-02
Page 4
schwer kopka
+
SK 7SK 7
10,4"
12,1"
SK7-15
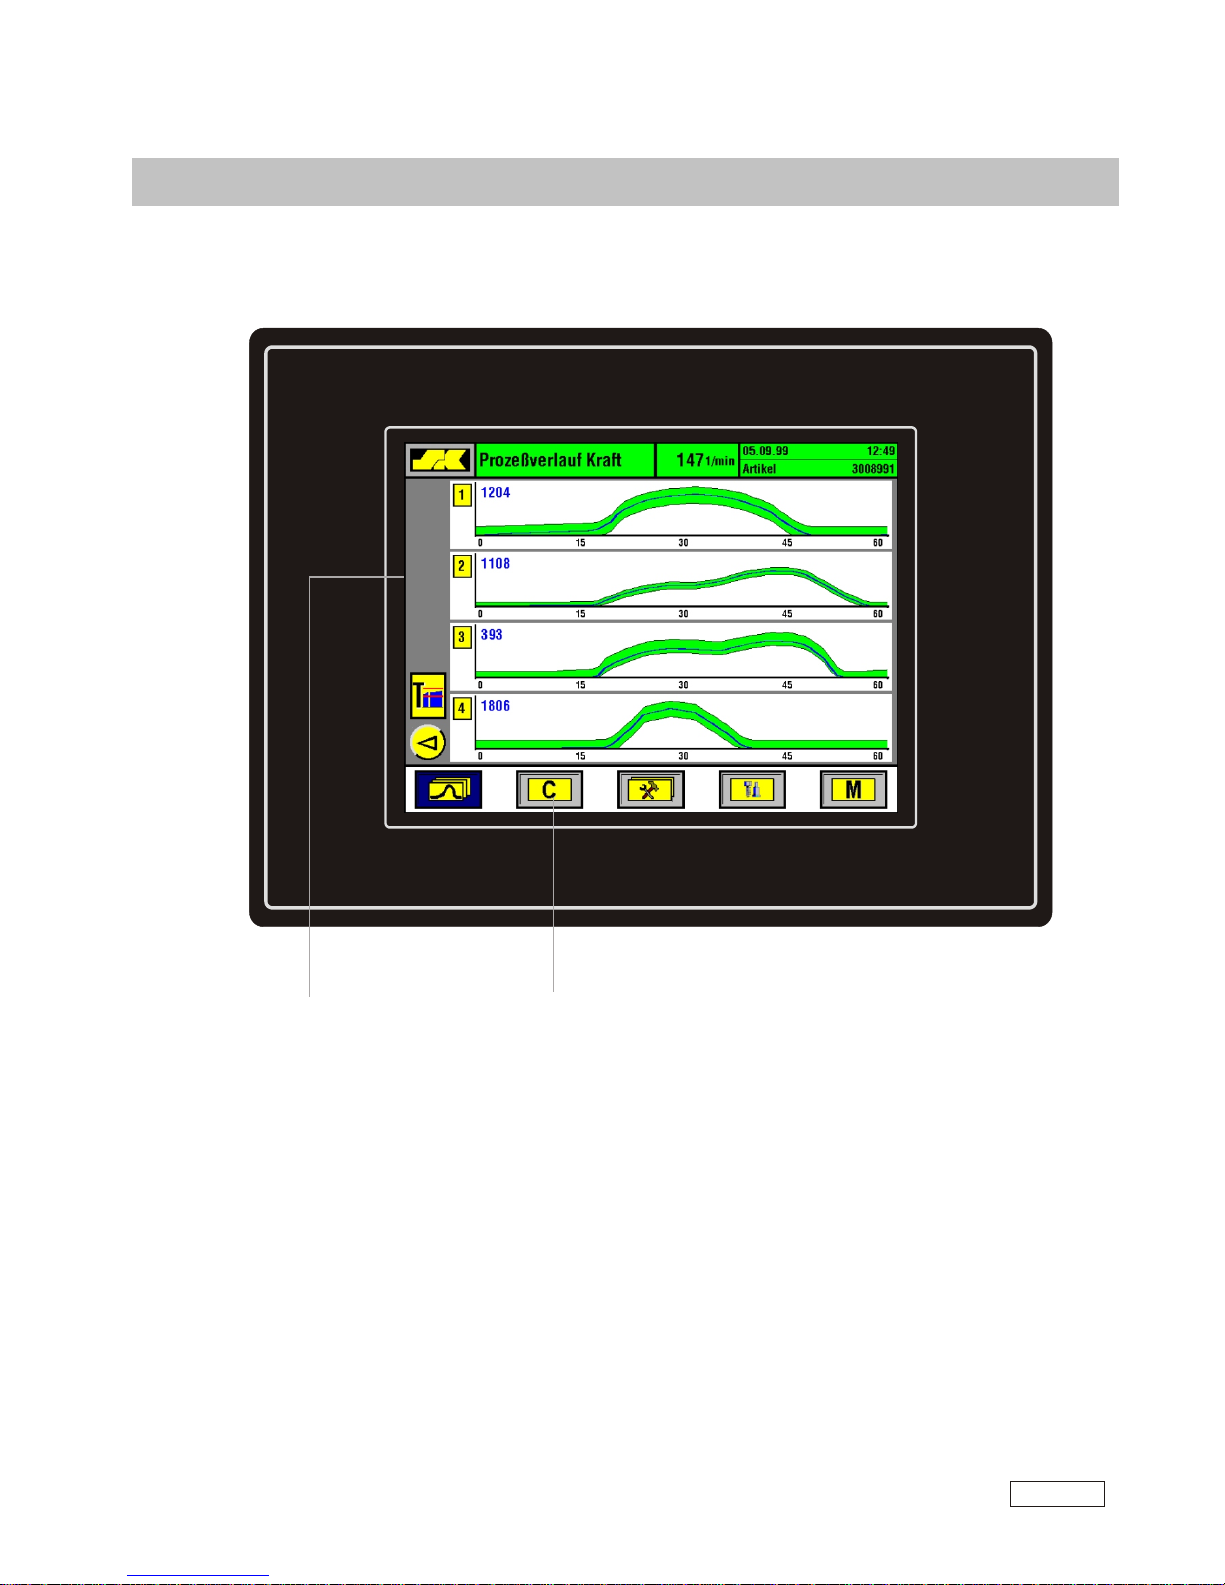
Display Panel
Front Panel
1. 12,1”-LCD-colour-screen (TFT)
with Touch-Screen Surface
2. Function keys / Symbol keys
(touch elements)
1
2
SK 7
V5.2 E 10/04
SK7-03
Page 5
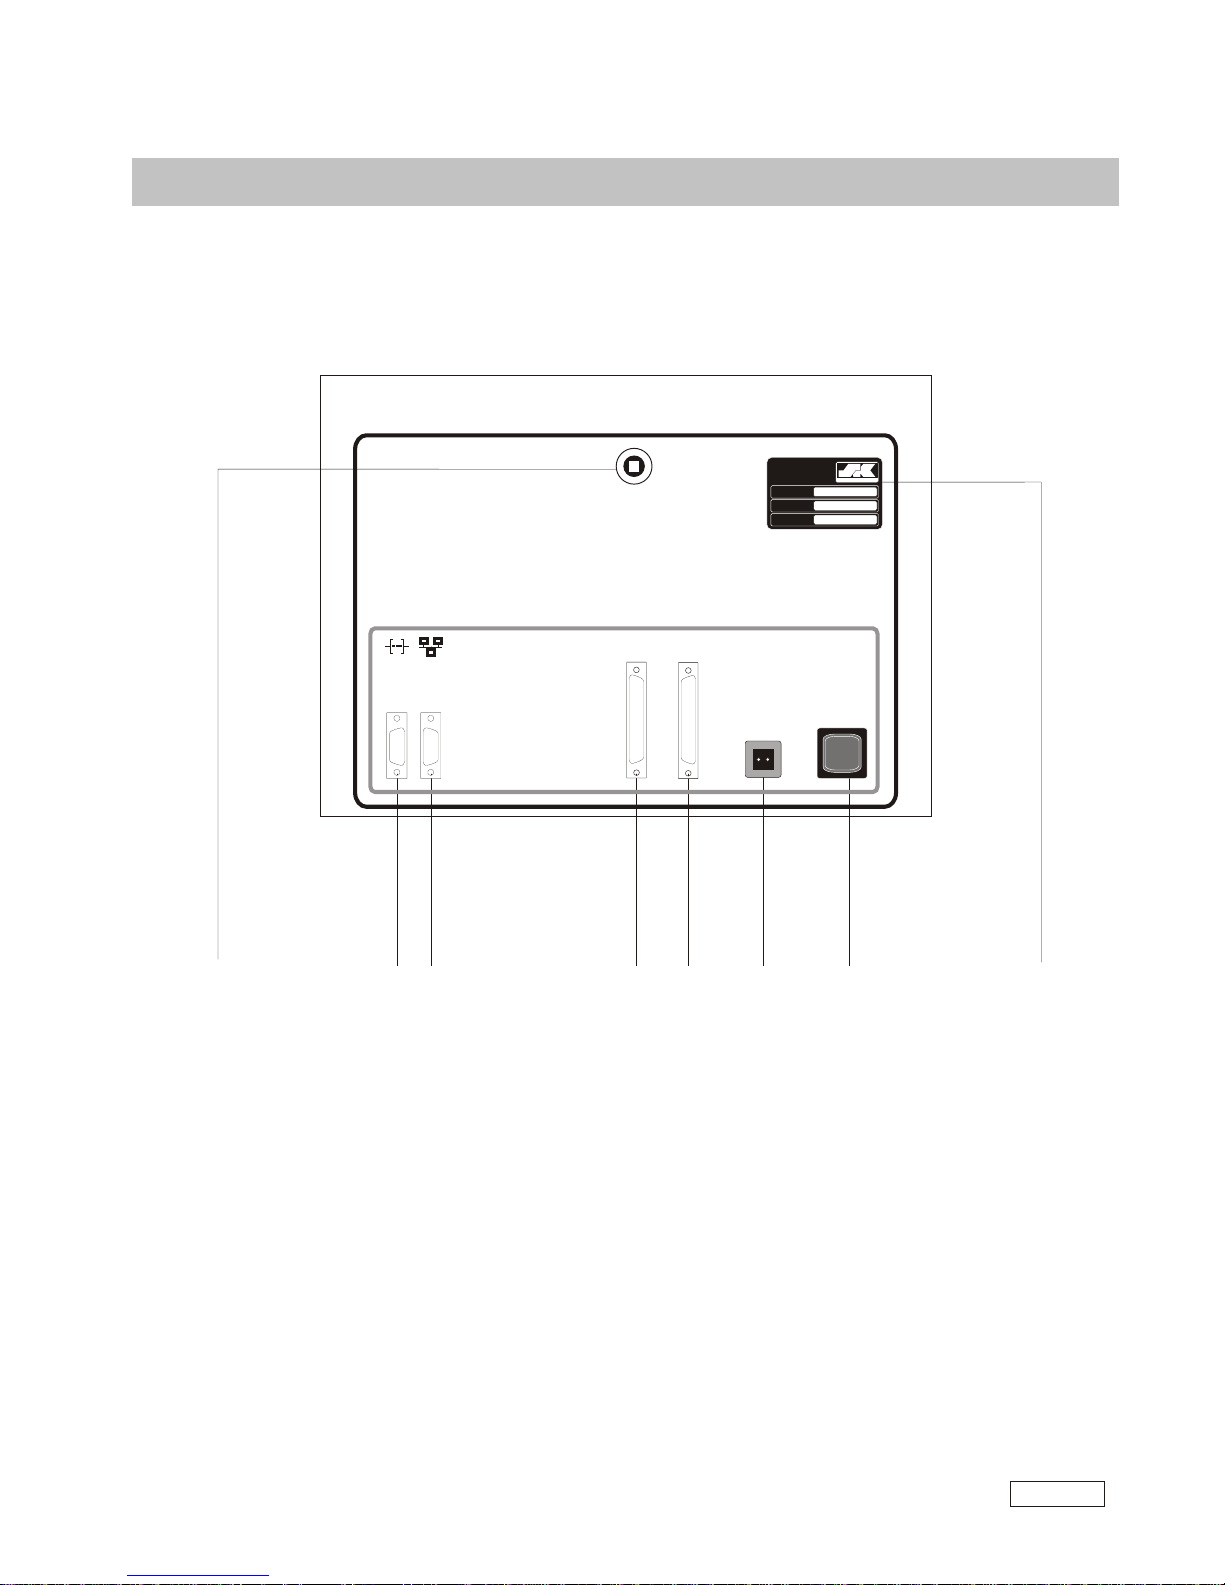
Controls and connections
1. On/Off switch 5. Network socket
2. Power Supply connector 24VDC 6. Serial port (RS 232)
3. Connecting socket for Sensor Cable (S1 7. Serial number plate
4. Connecting socket for Interface Cable (I1) 8. Rear panel lock
T
S-N
V/A
schw er k o pk a
+
s c h w e r ko pk a
+
24 VDC / 4 A
SK 4 C
6
5
4
3
2 1
7
T
S-N
V/A
sch we r ko pk a
+
CE
24 VDC / 4 A
SK 4c
8
S1
O/1
I1
24VDC
SK 7
V5.2 E 10/04
SK7-04
Page 6
Start (switching the system on)
The electronics of the SK unit are switched on via the On/Off push button located on the rear panel
(unit is tyically installed inside the main machine control box, see also page 4).The operating
screens for the process monitoring functions are called up by pressing the respective function key
(often F6) on the main PC control panel. The first screen will show the force curves.
Selecting the different functions
The SK system is designed to work with Touch-Screen controls as well as with regular push-button
operating panels. The decription in this manual concentrates mainly on touch-screen.
The touch-screen version has a row of function symbols at the bottom of the screen. The symbols
can change depending upon the selected functions. Just touch the respective symbol to call-up the
desired function. Where numerical entries are required, a numerical keyboard window will automatically pop-up.
With push button controls, just press the function key (F1 - F10) belonging to the desired symbol in
order to start the respective function. For numerical entries please use the number keys on the front
panel.
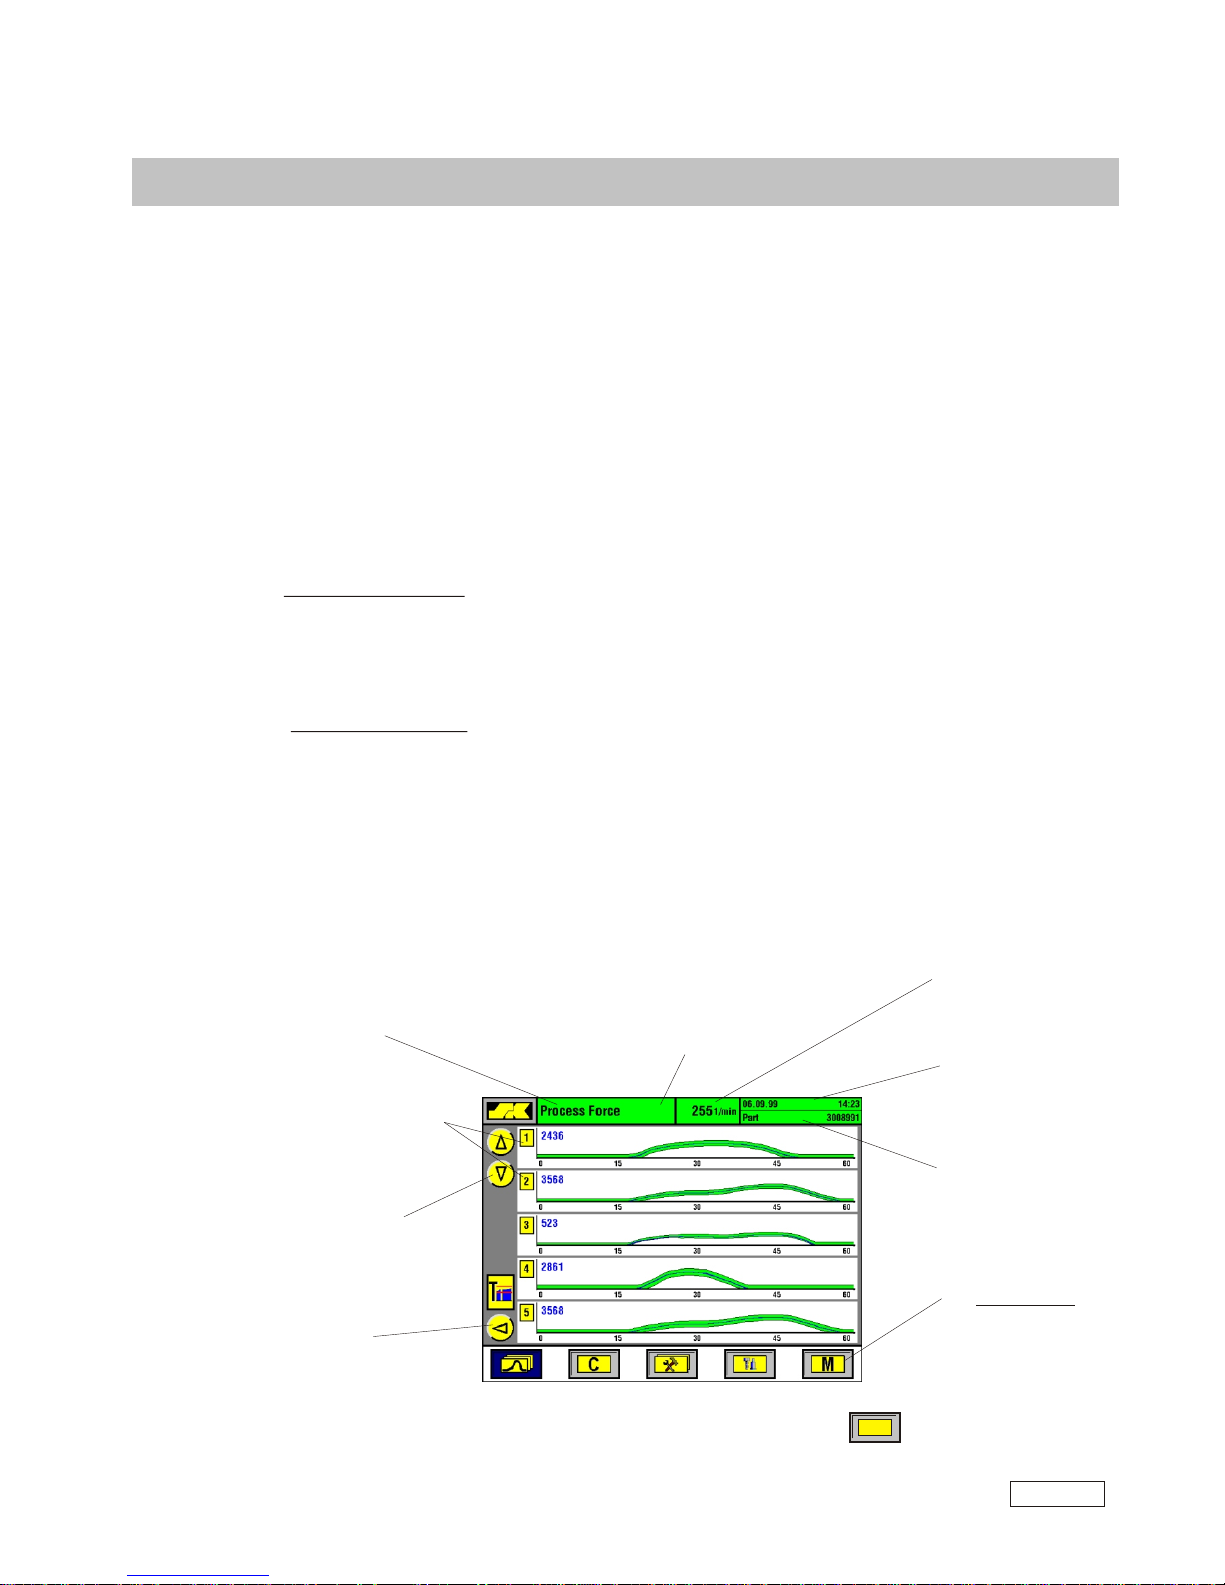
Screen layout
Many features and operational steps are similar on the differents screens. These are briefly explained
below using the example of the multi-curve screen:
Start / basic functions
Upper right corner
always shows current
machine speed in
strokes/minute
Current date and time
Shows current
part number if unit
is equipped with
part data memory
The background color changes with the
selected operation mode:
- yellow: set-up (MAN)
- green: automatic mode (AUTO)
- red: machine is in STOP
The upper left corner describes the
currently selected function screen.
When in STOP, this line gives in red
the reason why the machine was
stopped.
If machine has more
than 5 channels press the
cursor key to advance
to other channels
Change to trending
screens
Pressing the channel
number on the keyboard
(or touching the curve)
will give an enlarged
view of that channel
The symbol boxes
indicate which
functions are
currently available
The symbol key labelled SPS or PLC (mostly F6)
will switch back to the main machine controls.
SPS
SK 7
V5.2 E 10/04
SK7-05
Page 7
Operation Modes
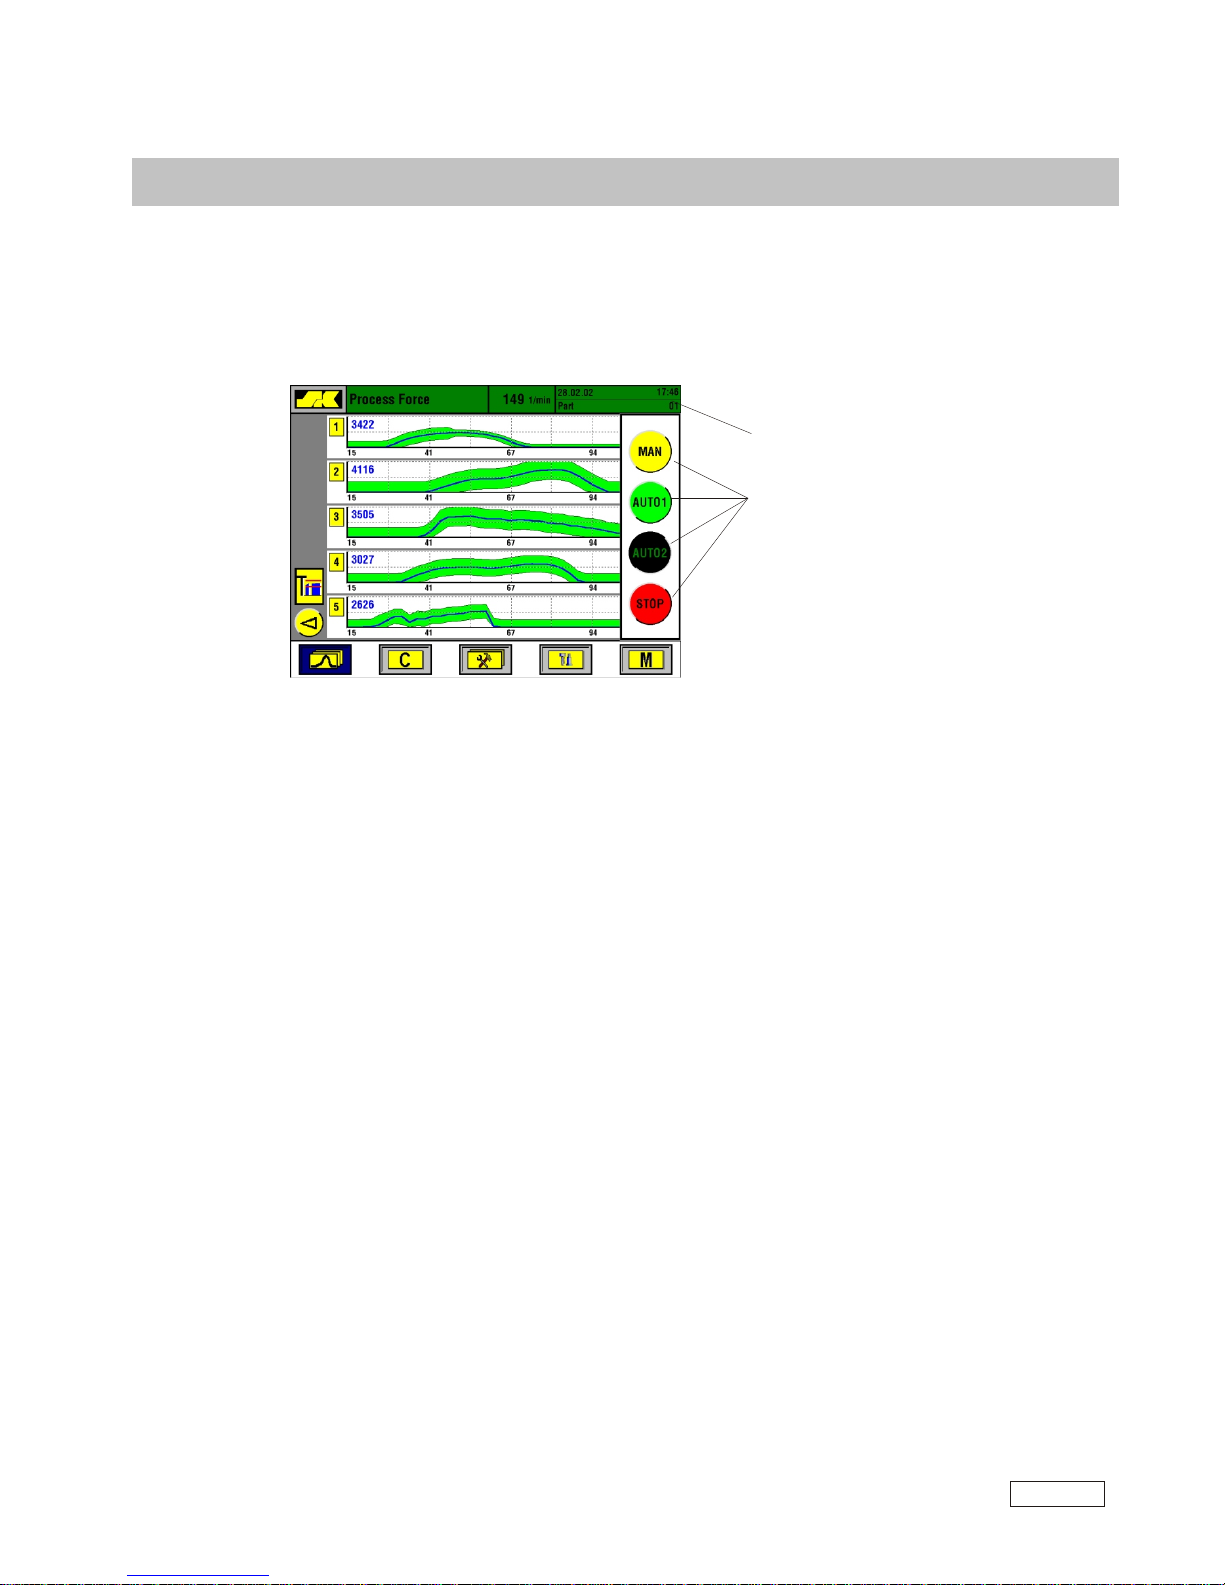
MAN mode (yellow)
The MAN mode is not actively monitoring the process. However, the unit registers and displays the force
signals to help the operator set up the machine. The MAN mode is normally selected after each STOP to
release the stop relays. In this case , the system will learn new envelope limits after it enters AUTO mode.
The time spent in MAN mode can be limited to an adjustable number of strokes after which the unit will
switch into AUTO mode by itself (adjustment is done within the set-up menu). If wanted, the system can
be set so that it re-uses the previous envelopes without relearning. In this case, after a stop condition, the
system should go directly into AUTO mode.
AUTO1 mode (green)
The green mode starts the automatic monitoring mode. The unit is immediately active after the green
mode commenced. The system either starts learning fresh limits or returns to the previous envelopes (depending on the mode change). In the second case, the unit will wait for a few machine strokes before it resumes the previous envelopes to allow the machine to reach consistant speed.The monitoring limits
(force and acoustic envelopes) are dynamically updated and matched with the process variation. Counting of good parts made starts also. Every impermissible deviation of the process curve signal will cause
the unit to react.
AUTO2 mode
Automatic mode offers the same functions as in AUTO1, but is used when running unmanned shifts. In
addition, the AUTO2 parts counter provides a separate count for par ts made during AUTO2 mode. When
stopping the machine during AUTO2, the unit fires the separate EMERGENCY-STOP relay that switches off
the machine entirely (AUTO1 mode will only fire the MOTOR-STOP relay).
STOP (red)
The STOP light comes on every time the unit has switched off the machine. In addition, a machine stop
can be initiated by pushing the STOP key manually. The unit always will prompt a stop
message on the display to identify the reason for switching the machine off.
Selecting operation modes
The different operation modes are selected via the mode buttons when touching the coloured display
beam on the top of any screen. They include functions such as set-up mode or automatic mode for regular or unmanned shifts. The colour of each display beam indicate which mode is currently running.
Touch the coloured display beam
on the top of any screen...
and the mode buttons will appear.
SK 7
V5.2 E 10/04
SK7-06
Page 8
Envelope monitoring
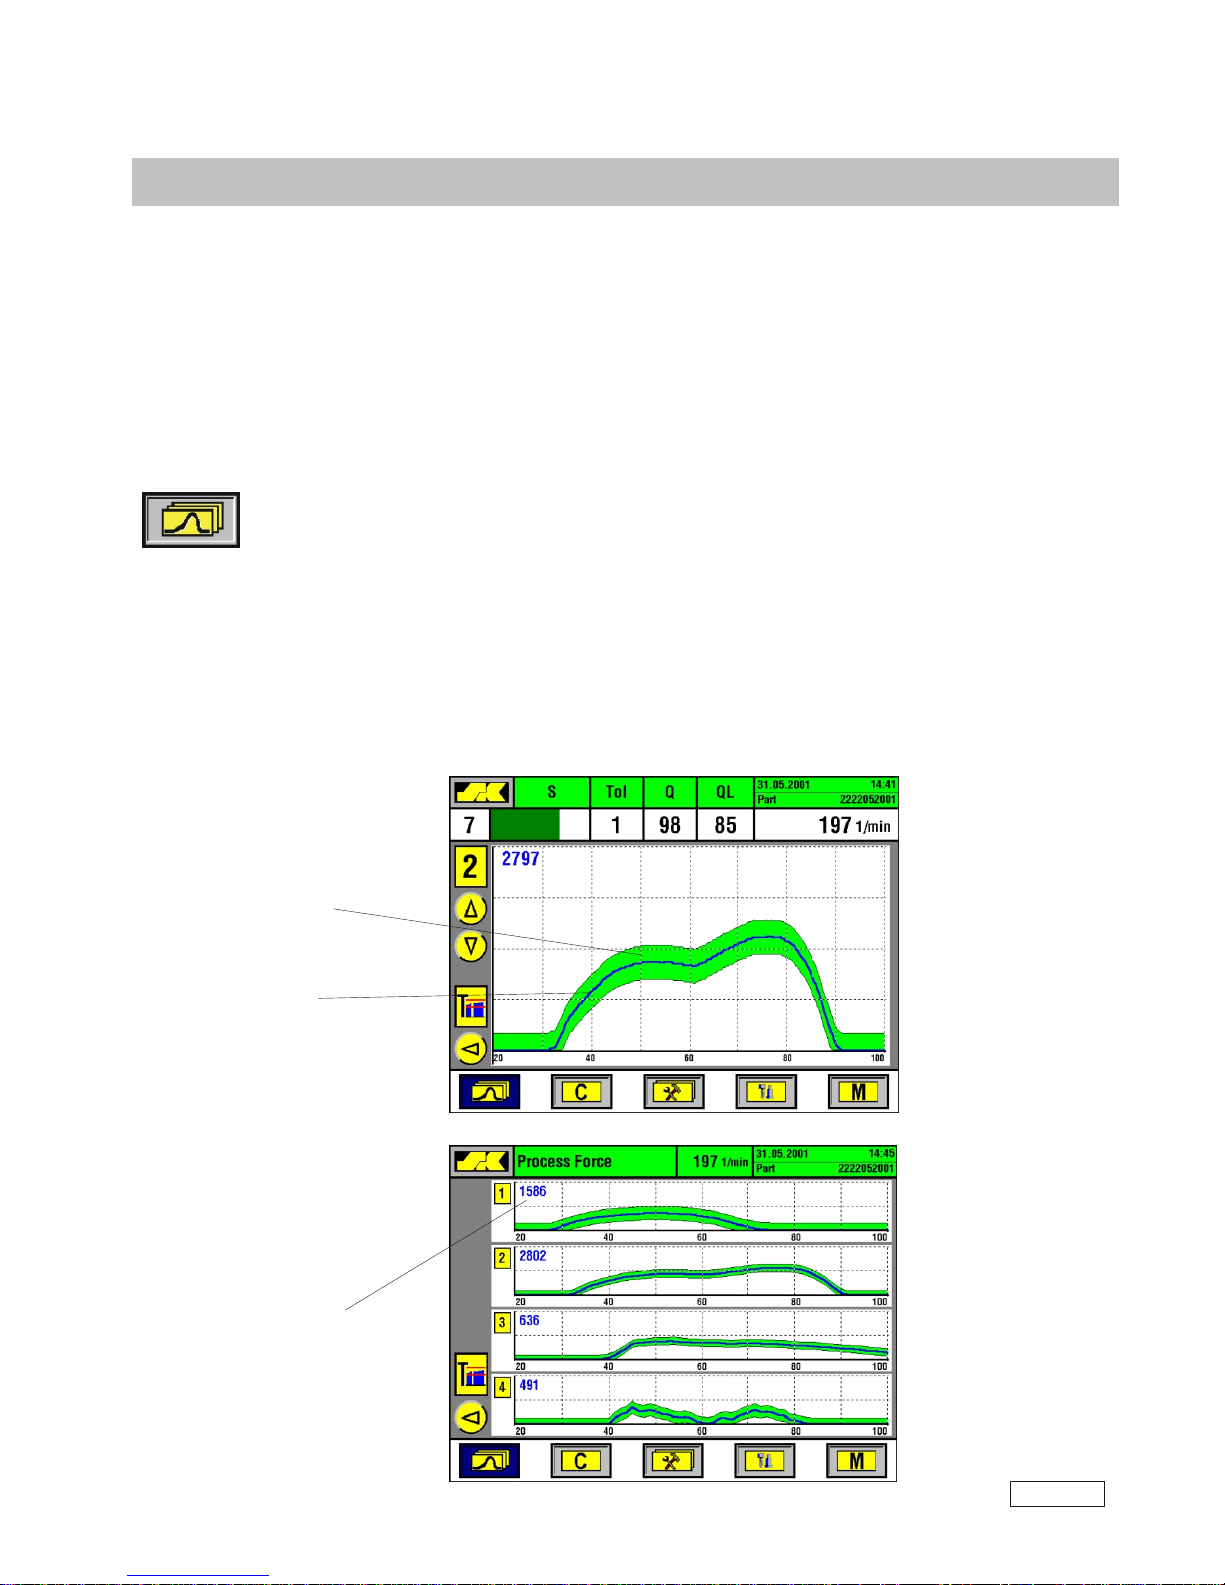
The envelope monitoring technique scans the entire force wave form from start to finish (as
determined by the established timing window). Each point scanned is compared to a previously
memorized "good parts wave form" by using the upper and lower envelope threshold curves. These
are automatically established by the monitoring system each time it is put into AUTO-mode.
Envelope display
Pressing the Curve function key will display the force wave form together with the envelopes. The
display shows either multiple-curves (up to 5 sensors at a time) or single curves representing one
sensor only. Channel selection from one sensor to another is made by simply pressing the number
of the channel you wish to see.
Changing from multiple to single curve presentation and vice versa is initiated by pressing the Curve
function key, or by directly pressing the number key for the desired channel. If the monitor has more
than 5 channels, use the up and down cursor keys to change the channel displayed.
Envelope Monitoring (force)
Multiple curves
Single curve
Envelope
band (green)
Current force
(blue)
This number (in
millivolts) indicates
the peak reading
of the signal
for the last stroke
Shown while single
curve display is active:
S: Sensitivity
Tol.: Tolerance
Q: Q-Factor
QL: Q-Limit
To alter any of the
settings, press the C-key
once, then change the
numbers, and confirm
by pressing the E-key
SK 7
V5.2 E 10/04
SK7-07
Page 9
Envelope Monitoring (force)
Machine stop with envelope error
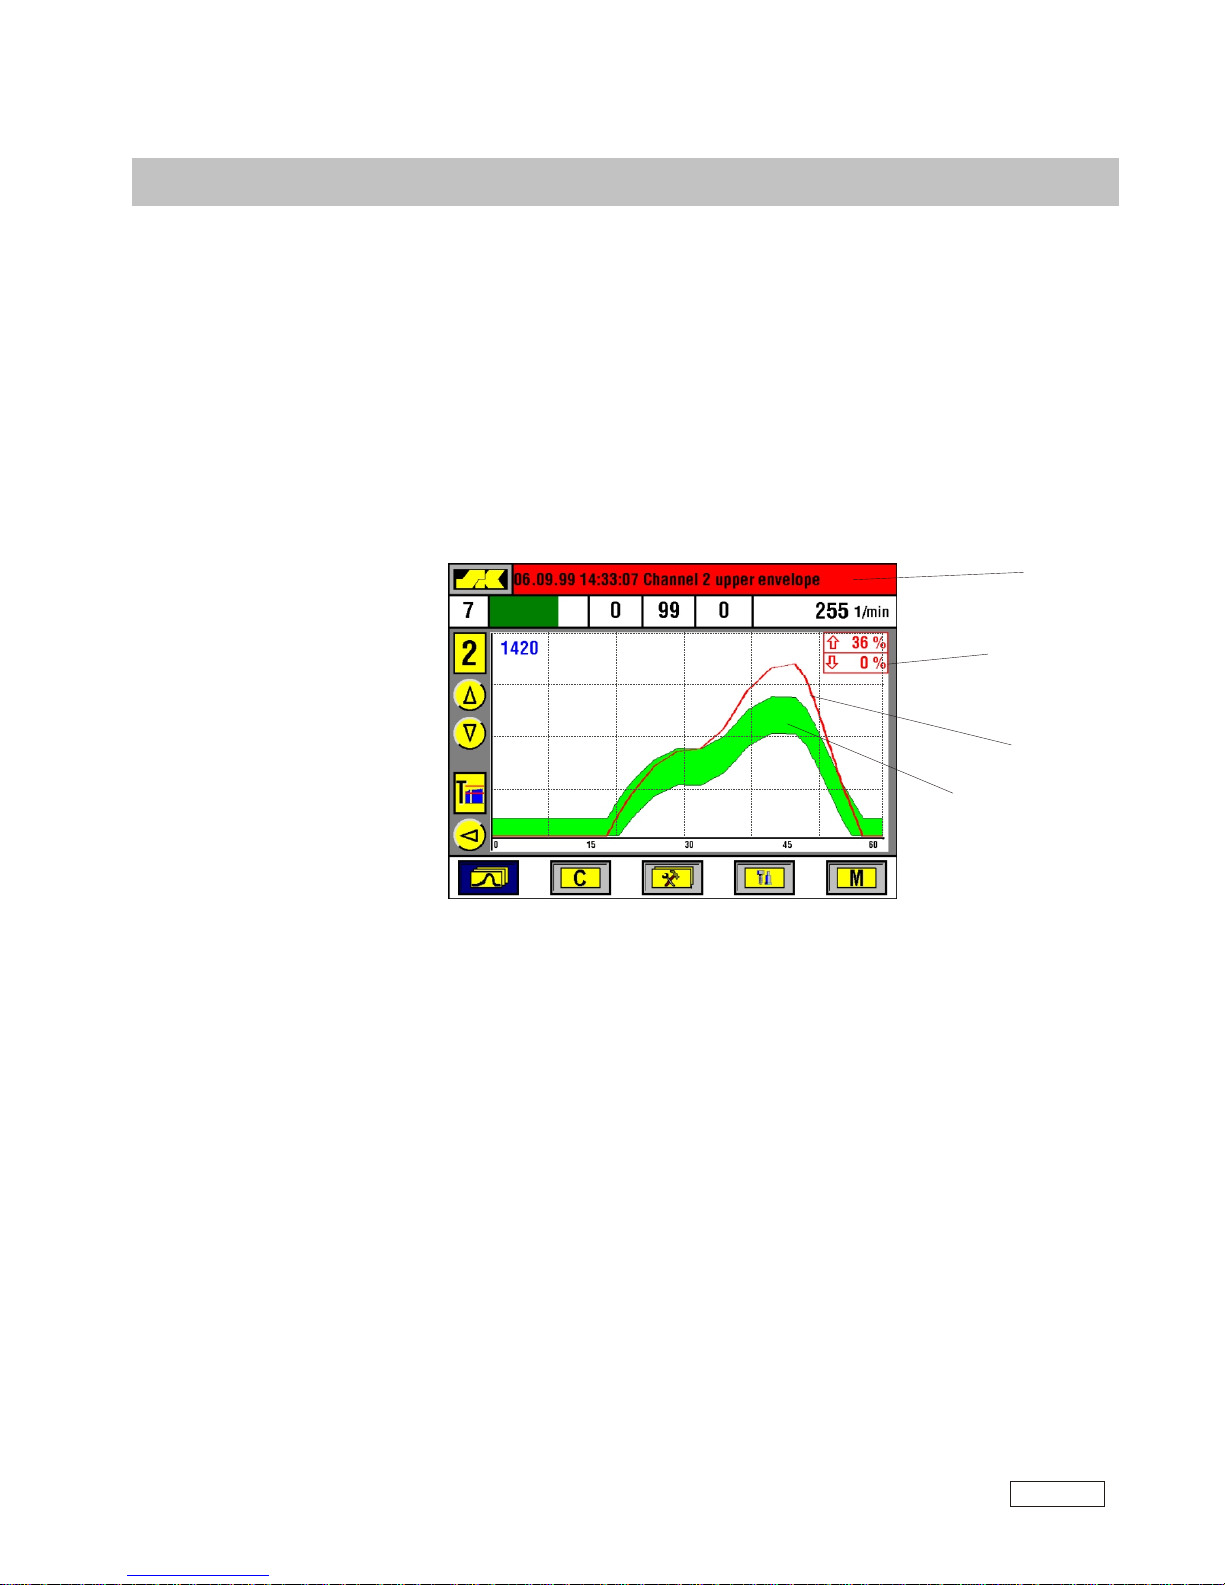
If a channel’s force curve exceeds the upper envelope curve or drops below the lower envelope,
the monitoring system will immediately initiate an appropriate stop action. The LCD screen
automatically switches to the single curve display of the channel in question making it easy to
locate the error. The reason why the machine was stopped along with a date and time stamp for
the error are displayed in the red portion at the top of the screen.
Restart after Stop
After stopping the machine due to a force error, it is necessary to determine and to eliminate the
cause of that error before you restart production. This prevents the system from learning an
improper setup and establishing ineffective control limits. Once this has been done, one of the following procedures should be performed.
The system switches from adjusting mode (yellow beam/MAN-Mode) into AUTO Mode. Alternatively, you can skip into the AUTO-Mode (if your unit is programmed to re-use the
previously established envelopes).
The monitoring mode (AUTO) is reached, when the display beam on the top of the screen appears
in green.
Or restart the machine after confirming that the cause of the error is eliminated. Then press the
AUTO-key to switch the unit back into monitoring mode. The SK bbx now calculates new envelope
limits, or returns to the previous envelopes if you already pressed the AUTO-key (please refer to
page SKbbx-06, selecting the MAN-mode).
Error curve (red
Envelope band (green)
Stop reason
Stop time
on the display beam
Shows error size
(here is 38 % of the force
curve above upper envelope)
SK 7
V5.2 E 10/04
SK7-08
Page 10
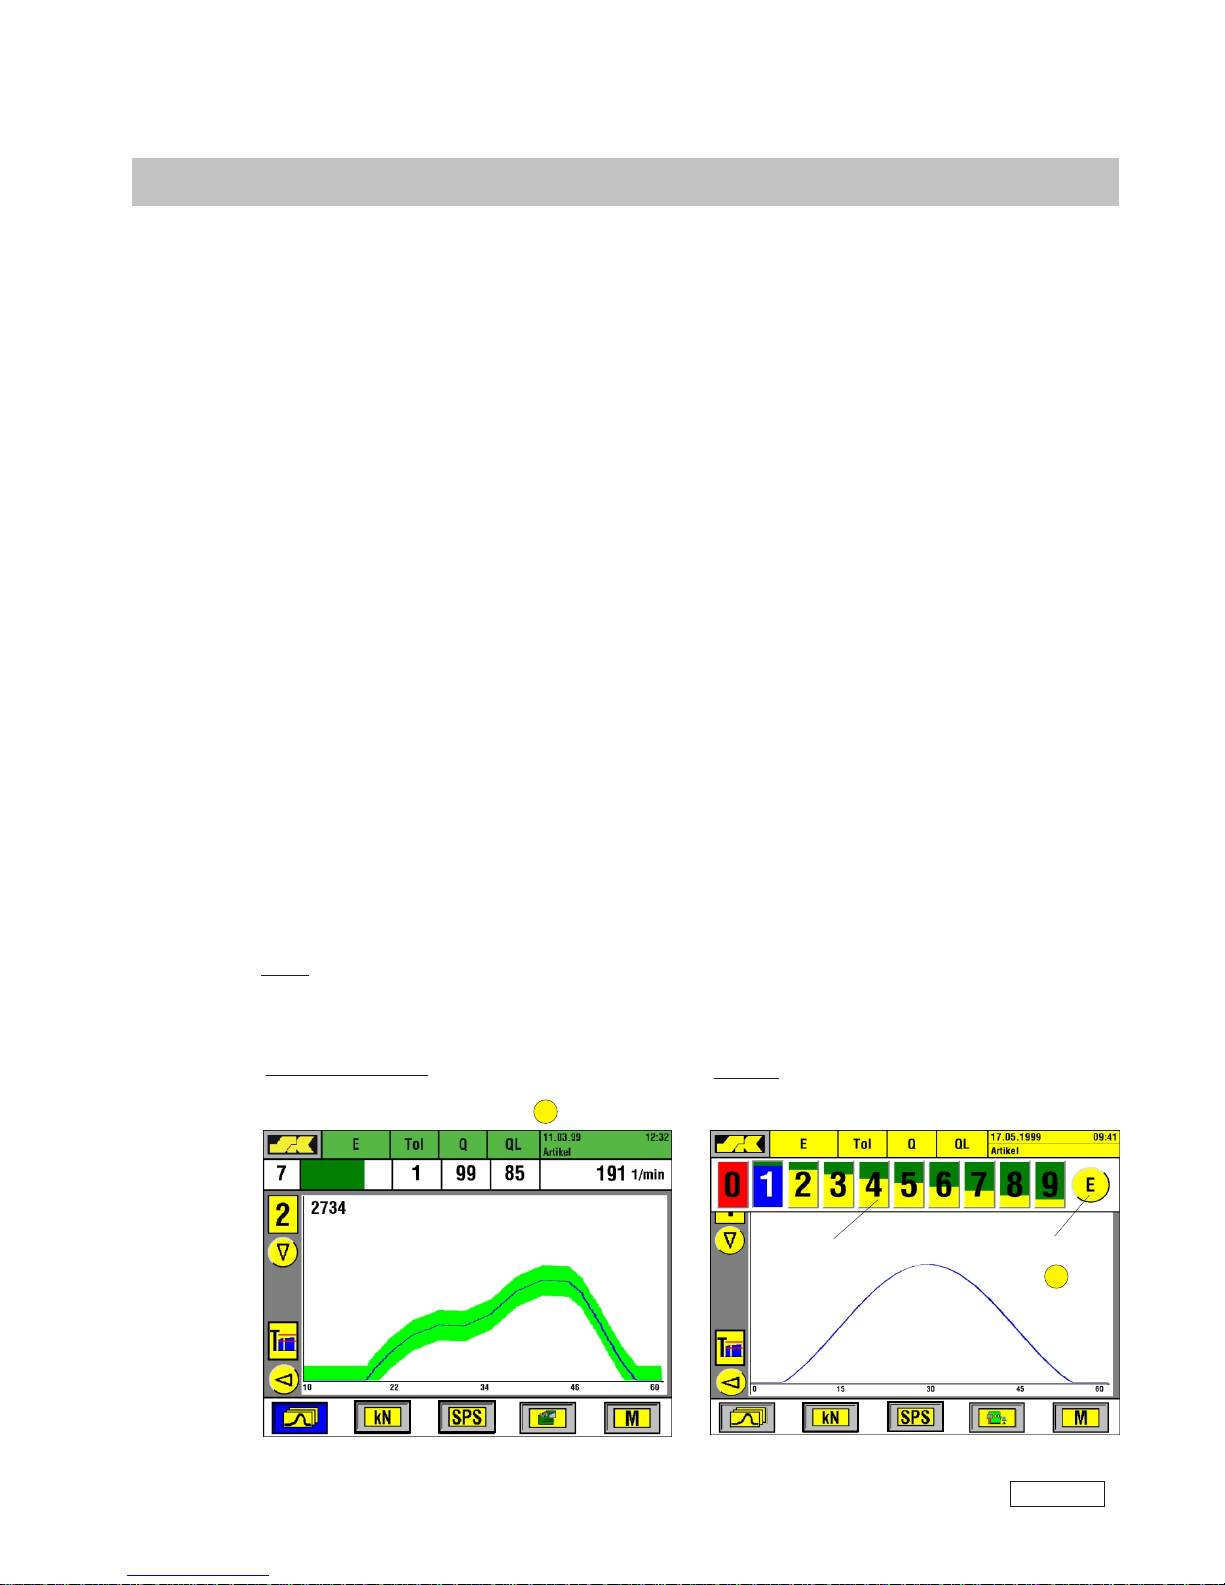
Envelope Monitoring (force)
Adjusting monitoring accuracy
Sensitivity and Tolerance
The accuracy or precision of the enveloping technique typically is set automatically by the SK unit
to match the stability and repeatability of each curve segment. Thus, it is not necessary to fine tune
this any further through manual adjustments, however, the SK does provide the possibility to alter
within a certain range the settings for “Sensitivity” and “Tolerance” individually for each connected
channel.
Sensitivity (S) can be adjusted in steps from 1 - 9 (1=coarse, 9=fine). The sensitivity setting has
an effect on the basic width of the envelope which is the distance between upper and lower
envelope curve. A coarse setting (= low sensitivity numbers) widens the gap between upper and
lower threshold, while a fine setting (= high sensitivity numbers) narrows the gap down which
represents a more precise control. Setting the sensitivity to “0” switches the monitoring off for this
channel (no more envelope curves are being displayed).
The optional SKProfilemaster software (see page 27) provides a segmented envelope profile
around the force curves (tight where needed; loose where necessary).
The Tolerance (Tol) setting determines how many consecutive “bad” parts with force signals
outside the envelope are ignored or “tolerated” before the machine is stopped. Therefore, the
tolerance setting prevents undesired machine stoppages caused by random or erratic force errors.
Tolerance can be set to values from 0 - 9 with the following meanings:
0: No “bad” parts are tolerated. The first “out-of-limit” part will stop the machine.
1: One “bad” part is tolerated. If it is followed by another “bad” one, the machine stops..
9: 8 consecutive “out-of-limit” parts will be tolerated. The 9th “bad” part stops the machine.
NOTE: Use of tolerances should be scrutinized carefully. Remember, an input essentially bypasses
the machine for the number of tolerances entered. Serious damage to tooling could result if this
feature is improperly used.
How to alter S and Tol:
Select sensor chanel and touch the desired field S or Tol;
enter desired value and confirm by E
Example:
Adjusting of S (sensitivity)
Touch desired
sensitivity
Confirm
by E
SK 7
V5.2 E 10/04
SK7-09
Page 11
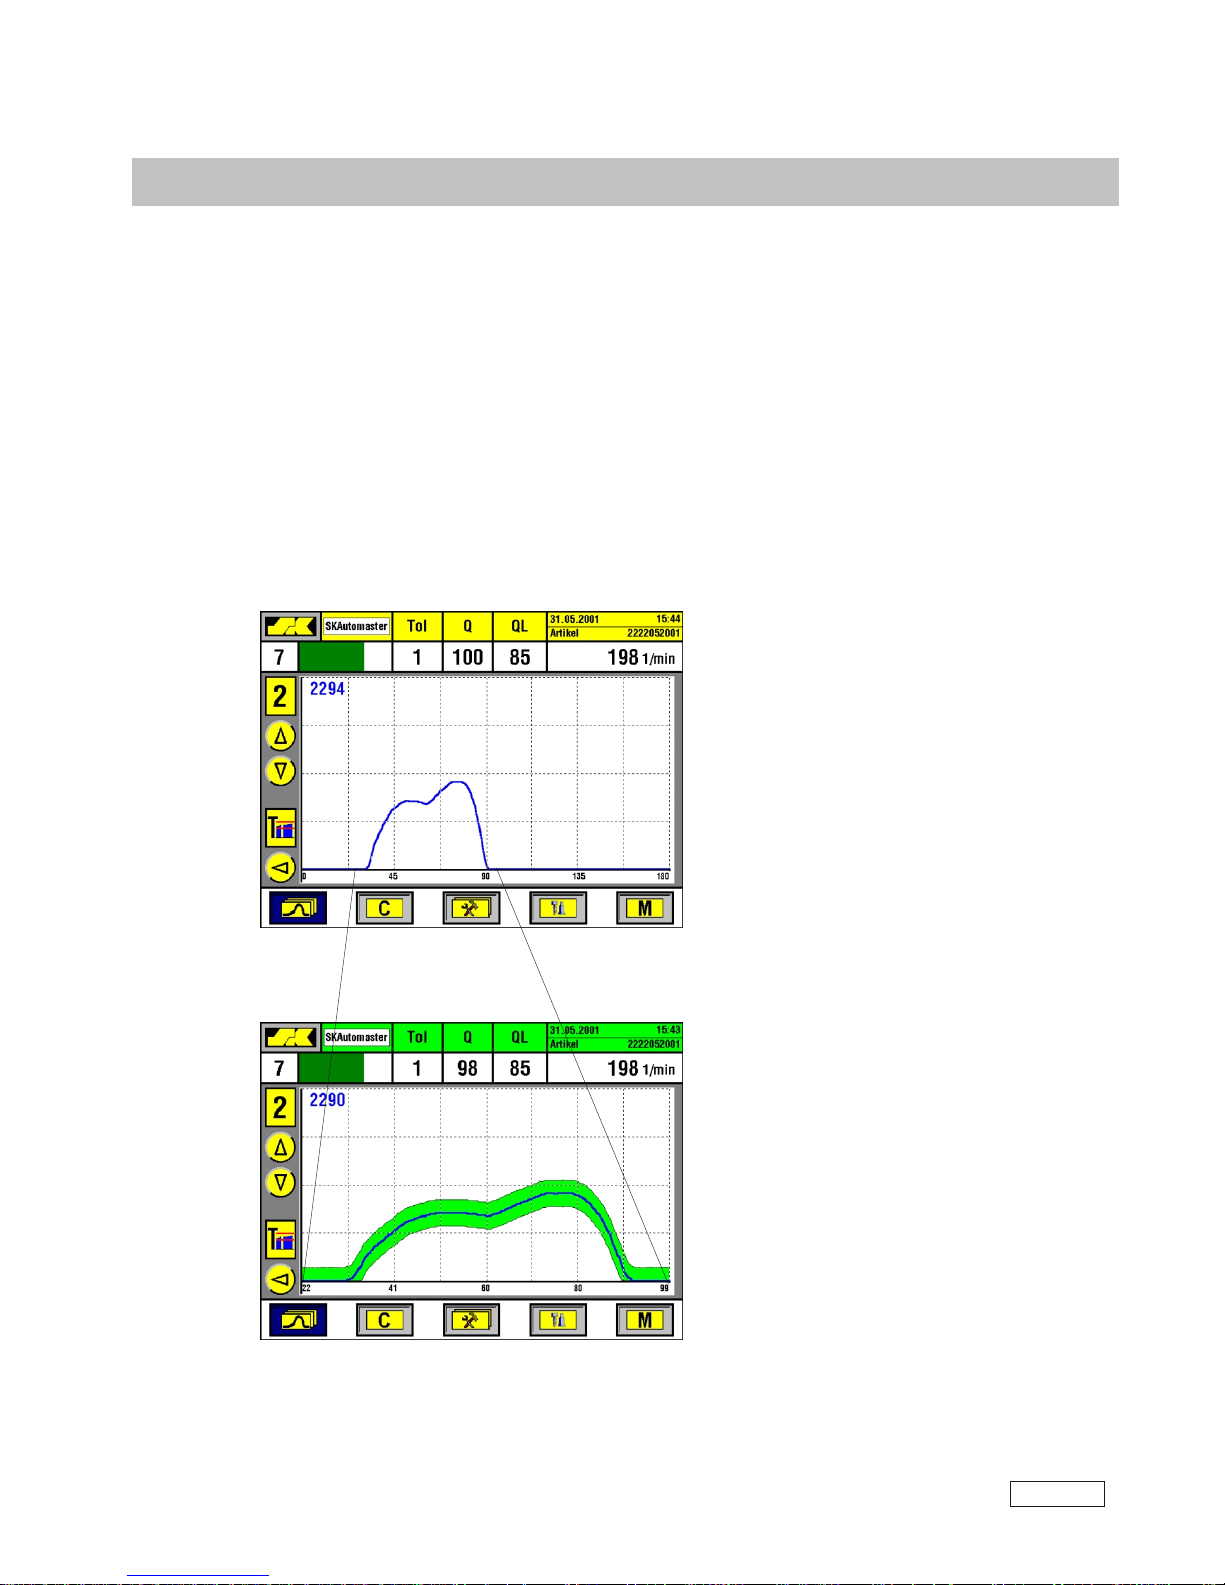
SKAutomaster (Option)
SKAutomaster automatic envelope setting
The SKAutomaster function offers a unique procedure to always obtain perfect envelope settings
and timing windows without any operator assistance. SKAutomaster automatically locates and
zooms in on the appropriate forming signal without the need for any manual interference. As a result, the monitoring accuracy is always set to the optimum efficiency.
In most application, the basic sensitivity setting can be kept on tight numbers keeping the envelope
width as narrow as possible. The special SKAutomaster software routines will in addition assure
that the envelope band is properly adjusted.
While running in MAN-mode, the system will use
a timing which is set overly wide to make sure
that the force signals for all different parts will fall
within this base frame.
This technique guarantees that even unusually wide
force curves which may occur when changing
from one part to another, still will be within
the set timing window.
When advancing into AUTO-mode,the
SKAutomaster automatically locates the
forcve curve and zooms in on it.
The force curve is basically stretched such
that is uses the full width of the screen without
wasting any monitoring capabilty for idle signal
before or after the actual force curve.
ZOOM
SK 7
V5.2 E 10/04
SK7-10
Page 12
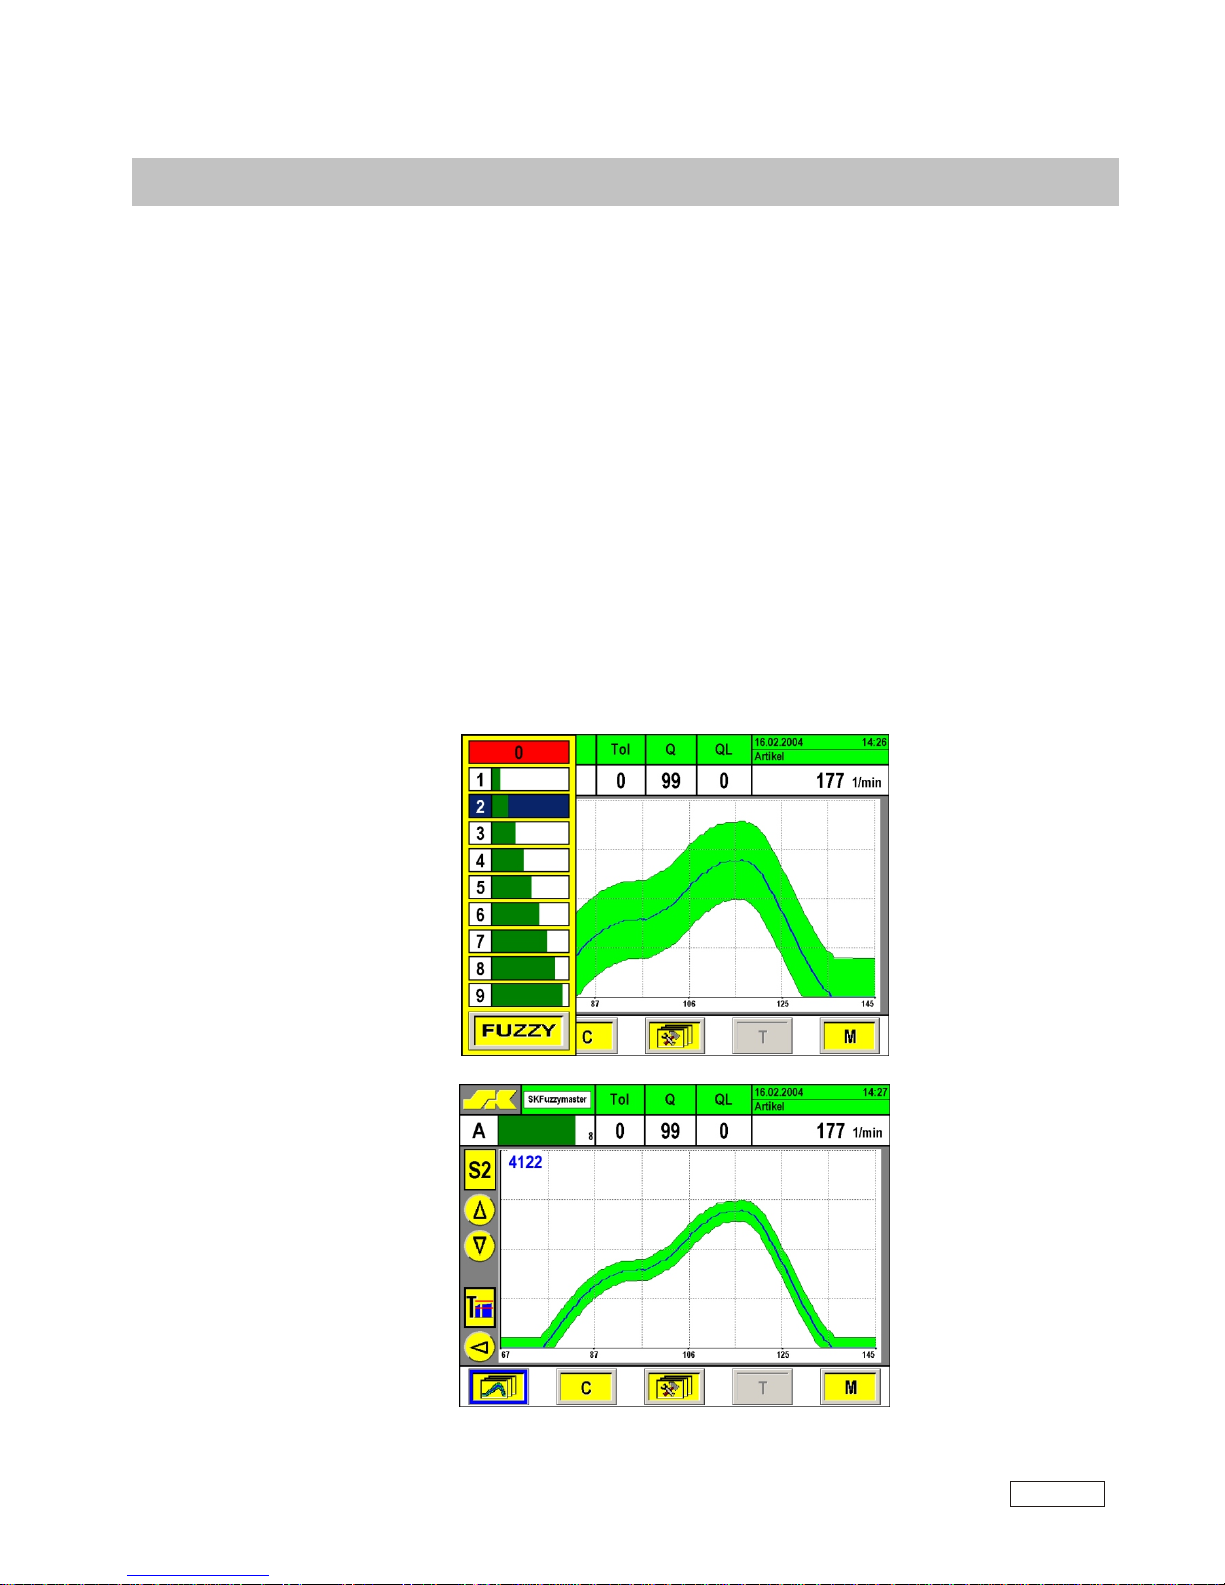
SKFuzzymaster (Option)
SKFuzzymaster fully automatic envelope setting
The SKFuzzymaster technique features for the first time a procedure which will adjust the monitoring envelopes in a fully automatic way to always give a perfect fit around the current variation of the
process.
Starting with a selectable minimum sensitivity, the Fuzzymaster will gradually narrow down the envelope width step-by-step to more sensitive settings, depending upon what the current process will allow it to be. This procedure ensures that the monitoring system always works with the best possible monitoring accuracy for the given situation.
If the process should become a bit more “erratic” during running production, the system will automatically reduce the sensitive, but only by one step. If this is not sufficient, the machine will be
stopped to allow the operator to determine the cause of the increase in process variation.
Fuzzymaster is activated by selecting “FUZZY” within the sensitivity setting bar.
SK 7
V5.2 E 10/04
SK7-11
Page 13
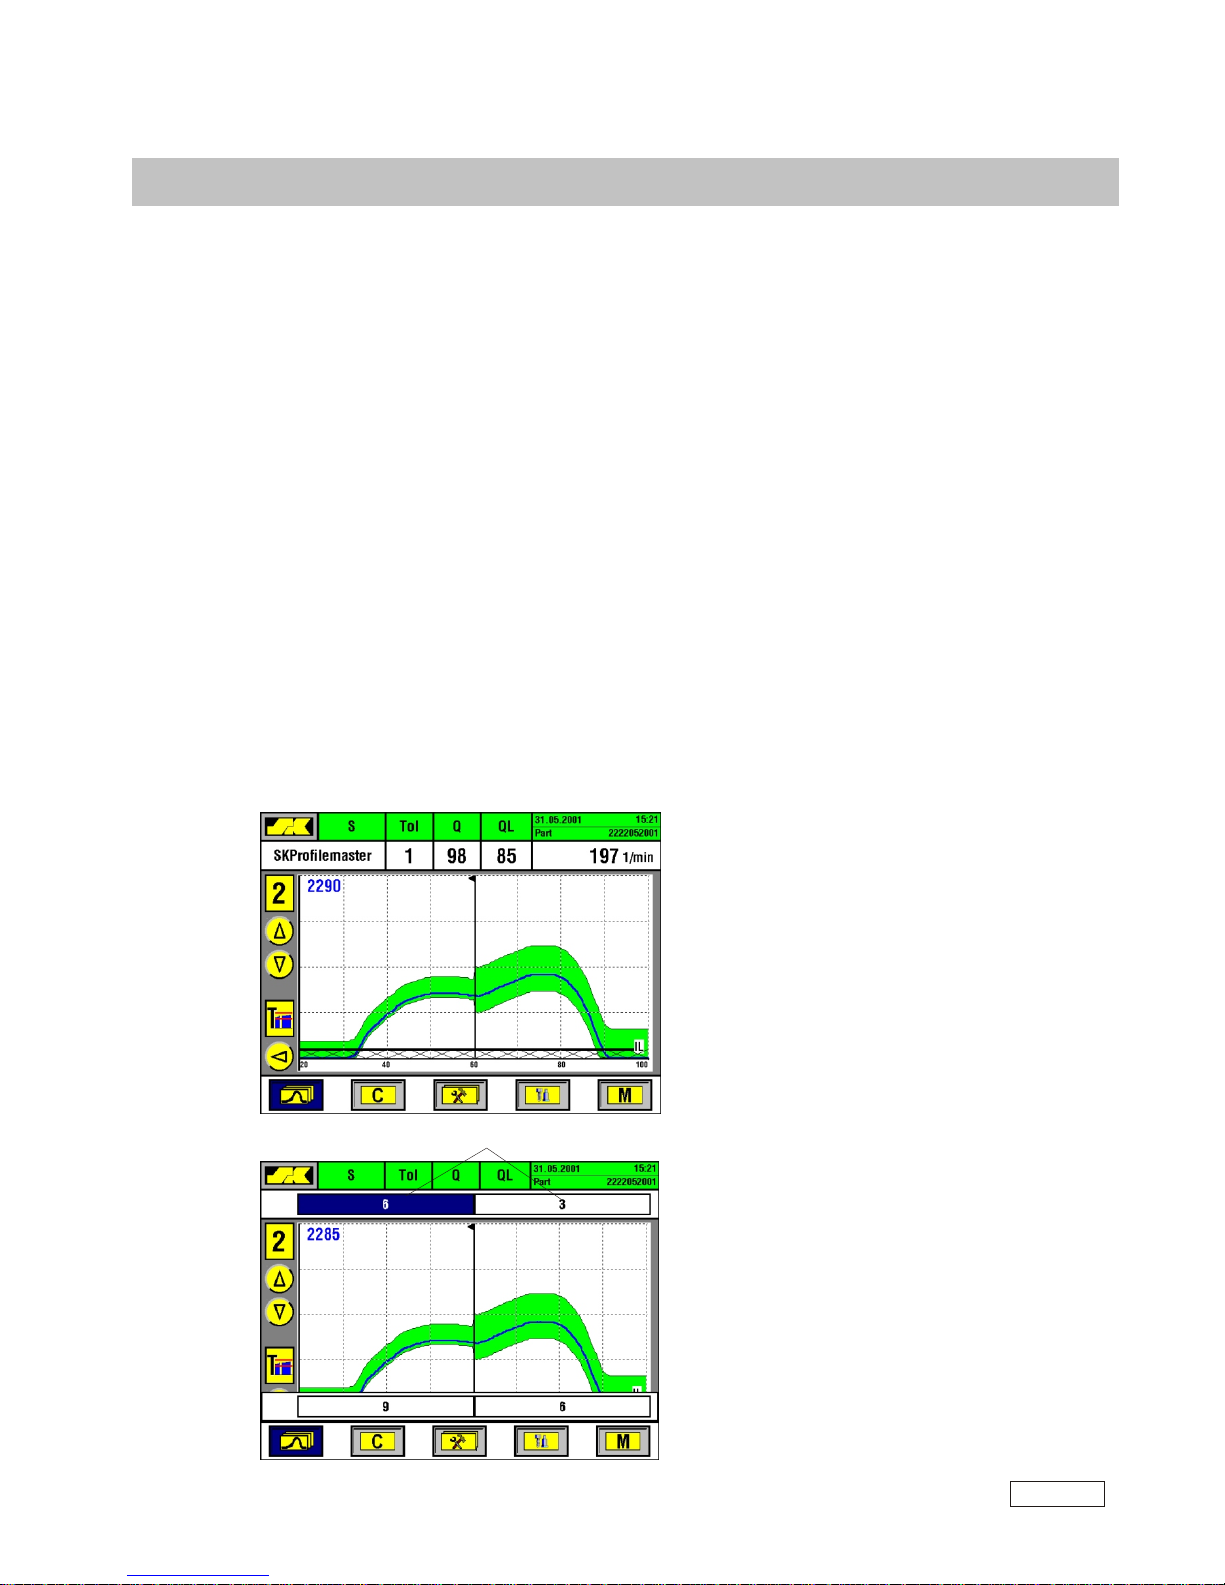
SKProfilemaster
NEW: Envelope Profile Monitoring
The SKProfilemaster monitoring technique represents the next generation of force monitoring
procedures. The conventional enveloping technology had to accommodate the often widely varying
force curve areas with one sensitivity setting only. So you were either not sensitive enough where it
mattered (in those areas where tools actually formed the metal), or you had to live with too many
unjustified machine shut-downs.
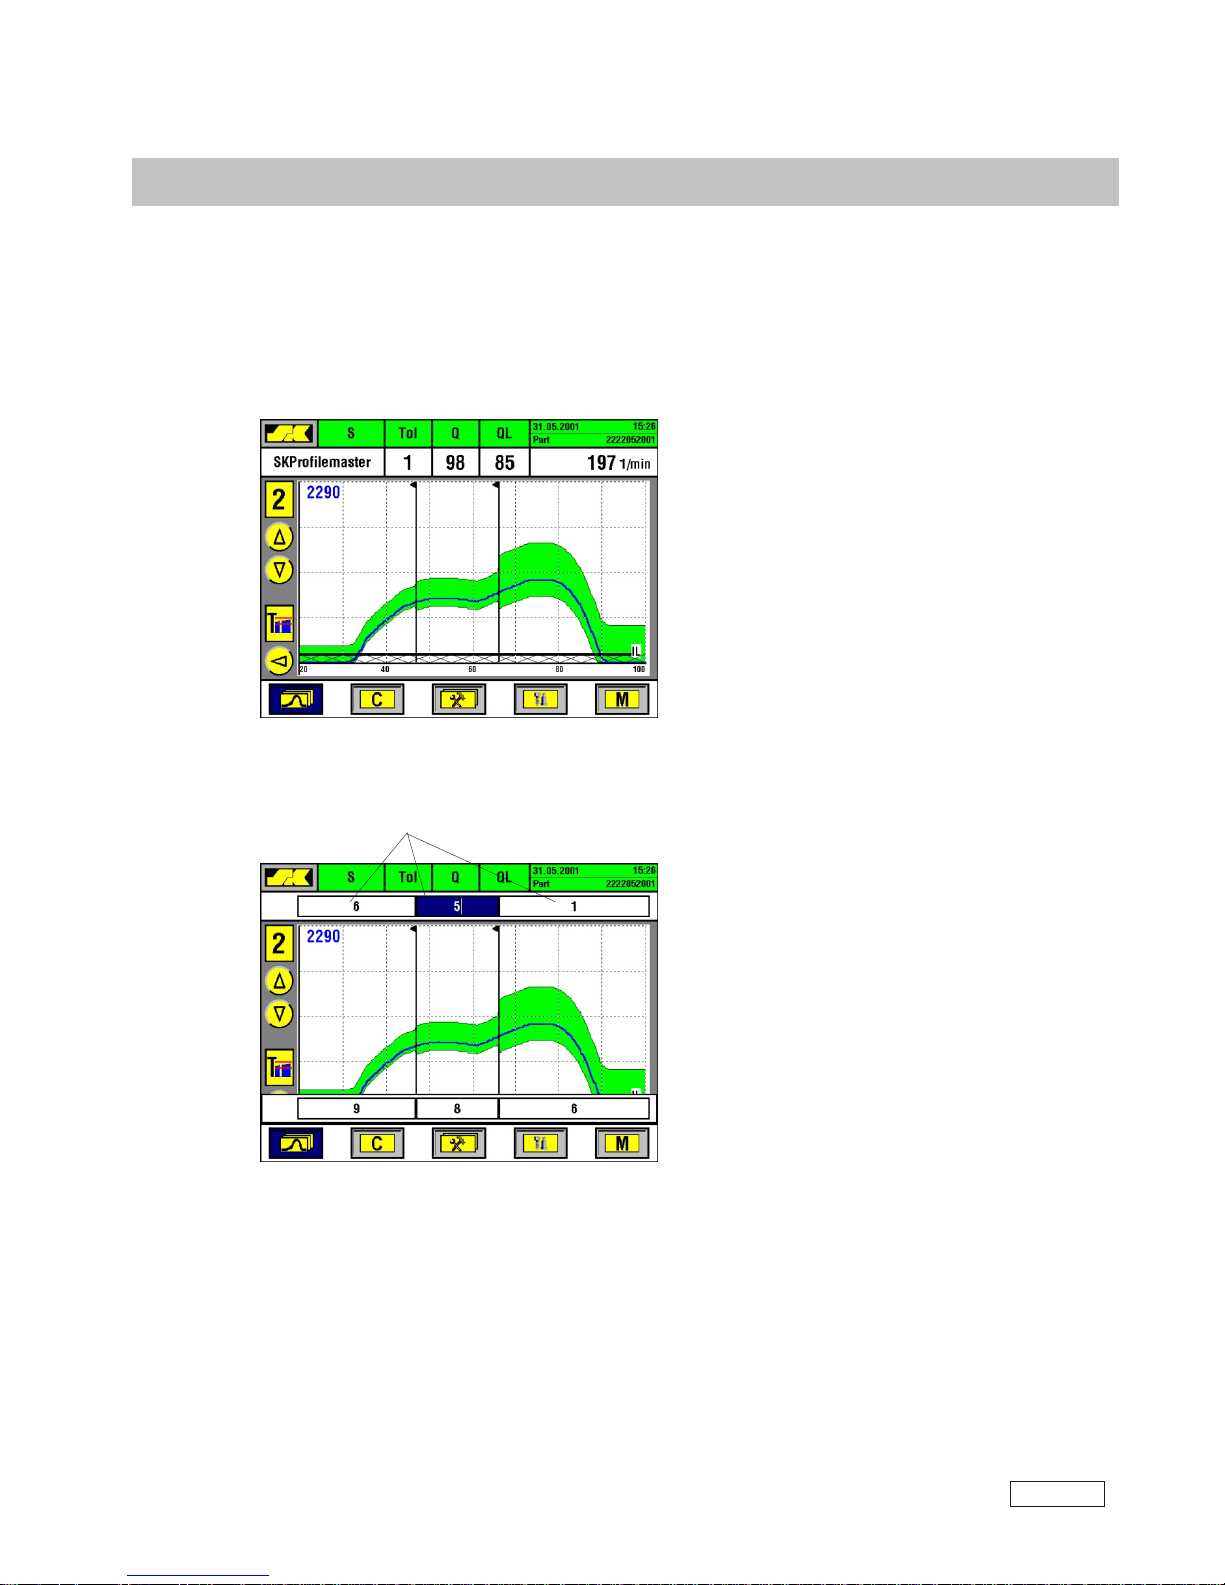
The SKProfilemaster technique now allows you to set different sensitivity profile zones that will perfectly match with the varying stability of your forming processes. Sensitive enough where needed,
and loose enough where necessary.
Each force channel can have the following individual settings:
- different sensitivity settings for upper and lower profile limits
- one, two, or three adjustable profile zones
(see supervisor’s manual for settings, modification and erasing of profile zones).
The example below shows a profiled envelope band (2 zones) with different upper and lower
Sensitivity settings per zone:
The SKProfilemaster envelope profile band.
Each segment has it’s own profile limit setting
allowing you to find a perfect balance between tight
limits where needed (to detect smaller tool failures),
and loose limits in other areas to prevent
unnecessary machine stoppages due to random
variation.
The channel shown on the left side works with
2 profile zones, each having individual high and
low profile limits.
How to set the SKProfilemaster band:
- touch the SK Profilmaster box to access sensitivity
entry mode in the single force curve screen
- separate sensitivity windows pop up for each
individual profile zone
- touch the border line directly to modify
the zone size
- set each zone’s desired sensitivity from
1 to 9 (1=coarse; 9=fine)
- confirm each zone’s selection by pressing the E key
(you are able to view immediately how your setting is
affecting the envelope width in each zone)
Sensitivity windows
SK 7
V5.2 E 10/04
SK7-12
Page 14
SKProfilemaster
The next example below shows a 3-zone profile envelope band with different upper and lower
Sensitivity settings per zone:
Please note:
Changing the timing window will automatically erase the profile zones on the channel in question,
and you will have to go to the MENU section (page 4/4, SKProfilemaster) and re-activate the
number of profile zones you wish to have for the new timing window.
The SKProfilemaster envelope profile band.
The 3-zone setting allows for an even closer
match between curve segment variation and
adopted profiles.
How to set the SKProfilemaster band:
- touch SKProfilmaster box in the single force
curve screen to access sensitivity entry mode
- separate sensitivity windows pop up for each
individual profile zone
- touch the border lines direktly to modify
the zone sizes
- set each zone’s desired sensitivity from
1 to 9 (1=coarse; 9=fine)
- confirm each zone’s selection by pressing the E key
(you are able to view immediately how your setting is
affecting the envelope width in each zone)
Sensitivity windows
SK 7
V5.2 E 10/04
SK7-13
Page 15
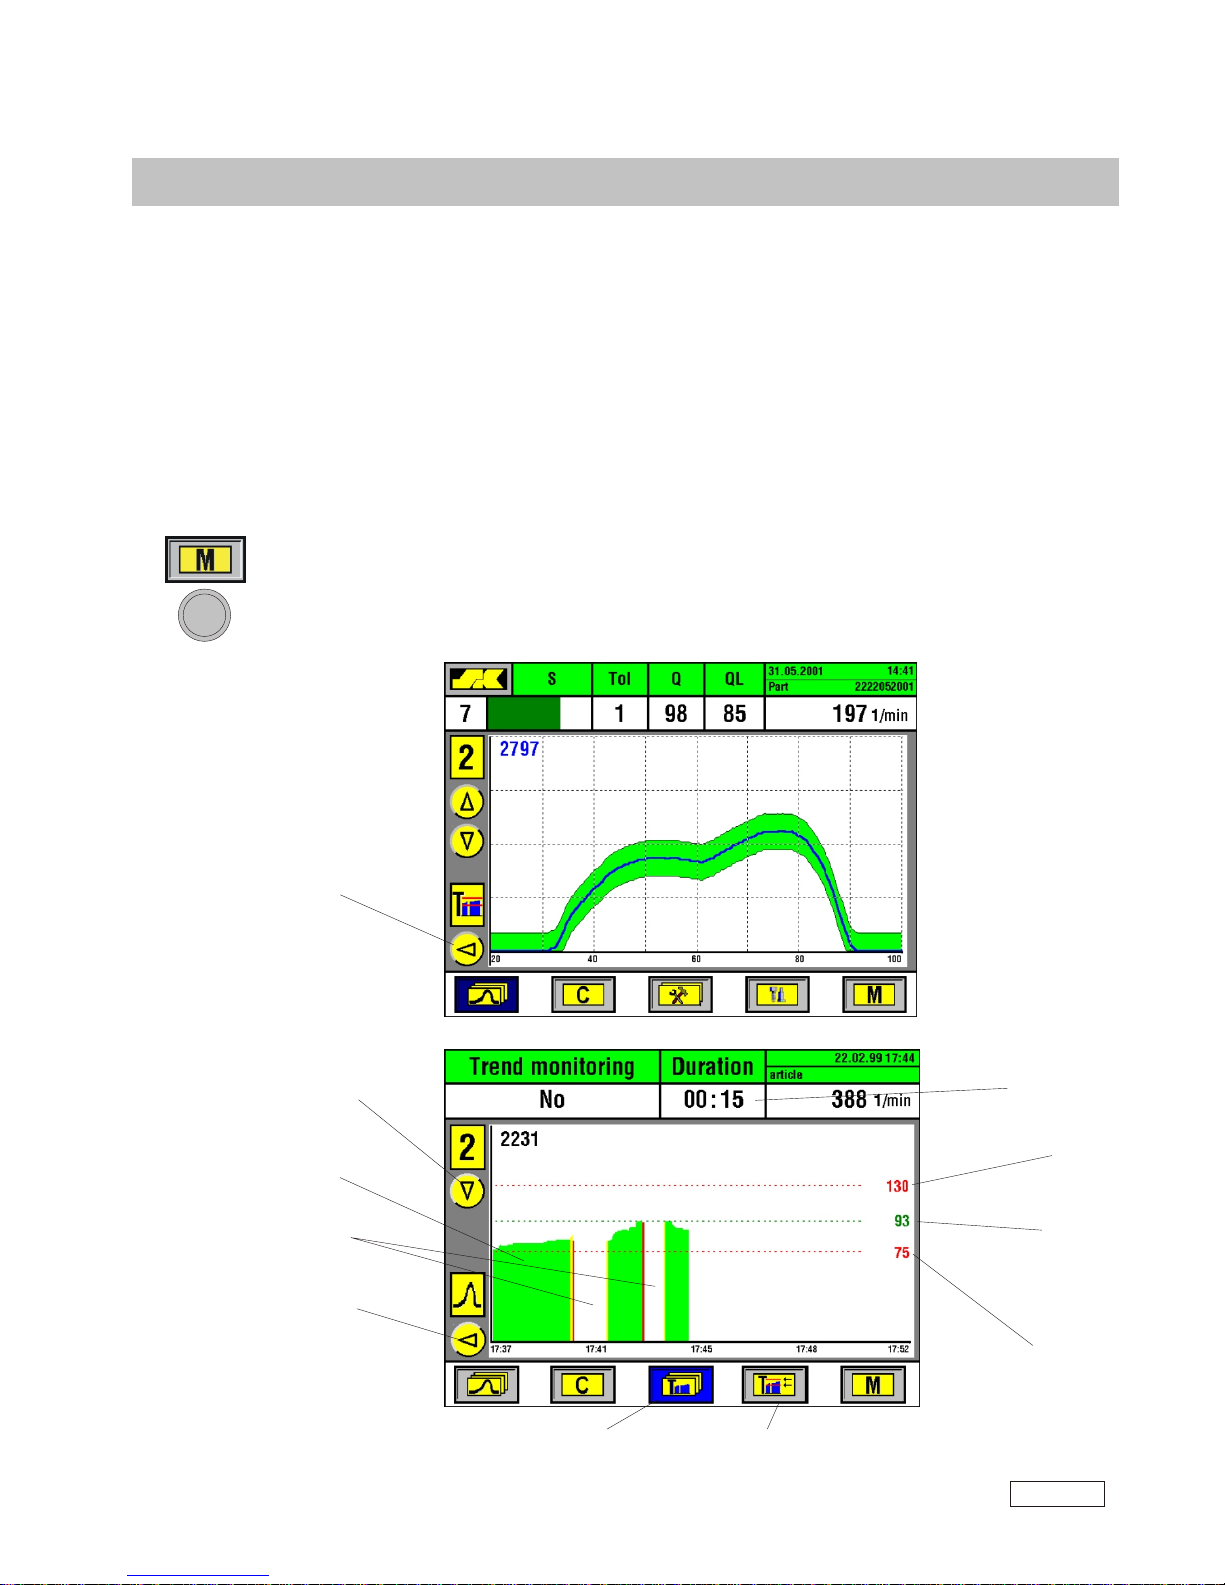
The trending feature allows to visualize and to monitor gradual changes in your forming process
such as a steady but slow rise or fall of the forming load. Trending can be activated individually for
each channel.
Graphic trend display with Stop/Go
The SK bbx offers graphic trending on it's color display. The presentation includes the display of the
average forces over time, the selected trend limits, and any machine stops in between. The trending
screens can be accessed as follows:
1) Press the M function key, then select Trend (press key 1), or
2) From the single force curve screen, press the Cursor-key to go to the trending screen for the
same sensor channel.
Trend Monitoring
1
Move to the
next channel
Upper
trend limit
Duration of the
trending graph
Lower
trend limit
Graphical trend
Machine was
not running
current
trend value
Switch over
to Trend
Go back to
the force curve
Press the corresponding
function key to switch to
multi-trend display
Press the corresponding
function key to adjust trend limits.
SK 7
V5.2 E 10/04
SK7-14
Page 16
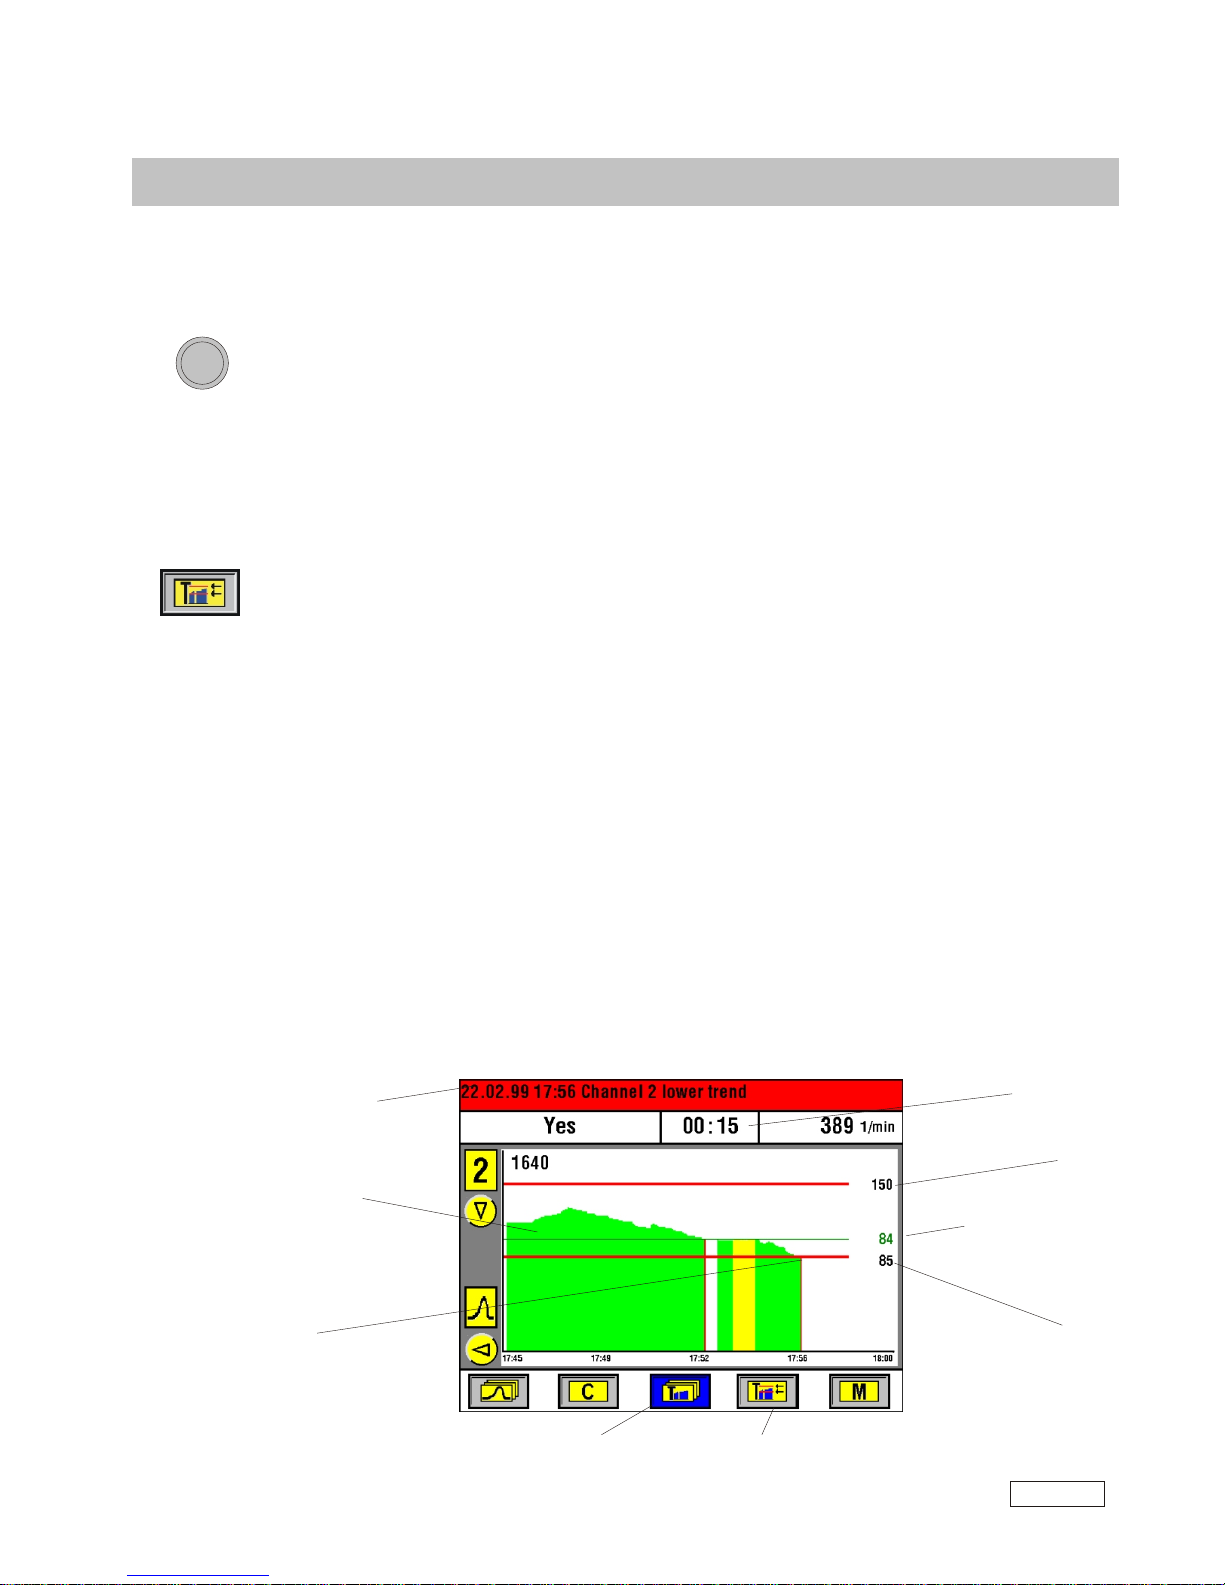
Trend Monitoring
C
Stop reason
including time and
date stamp
Upper trend limit
Duration of trend
graph
Lower
trend limit
Trend Graph
Current trend value
lower than limit:
Stops the machine
The average
force dropped
below the
trend limit:
Stops the machine
Press the corresponding
function key to switch to
multi-trend display.
Press the corresponding
function key to adjust
trend limits.
How to set the trending parameters
The following parameters can be set in connection with trend monitoring (select single trend screen
first to get access to entry mode):
- "Trend monitoring" active "Yes" / "No"
When set to "Yes", the trend limits will be shown as thick solid lines.
When set to "No", the trend limits will be shown as thin dotted lines.
- "Duration" determines the length of the trend graph on the screen from left to right. Time frame
can be set between 15 minutes and 24 hours. Each channel can be set to it's individual time.
Adjusting the trend limits
The trend limits can be adjusted independently for each monitored channel. Press the Trend Limits
function key. A windows will come up on the left side of the screen giving you
access to altering the limits.
How to set the limits:
- use the cursor up or down keys to move the limit to the desired set point, and confirm by
pressing the E-key, or
- enter the new numbers with the numeric keypad, and confirm with the E-key.
The trend graph will be plotted on the screen from left to right according to the selected duration of
the graph. Machine running time in AUTO mode is plotted in green with the height of the graph
showing the trend of the average peak force reading. When the graph has reached the right end of
the screen it will jump back to about the middle of the screen and continue from there. The gaps in
between indicate that the machine is down in STOP mode, while time in MAN mode is shown in
yellow. If the average peak force goes above or below the trend limits, the machine will be stopped
(provided you have "Trend Monitoring" active for that channel).
SK 7
V5.2 E 10/04
SK7-15
Page 17
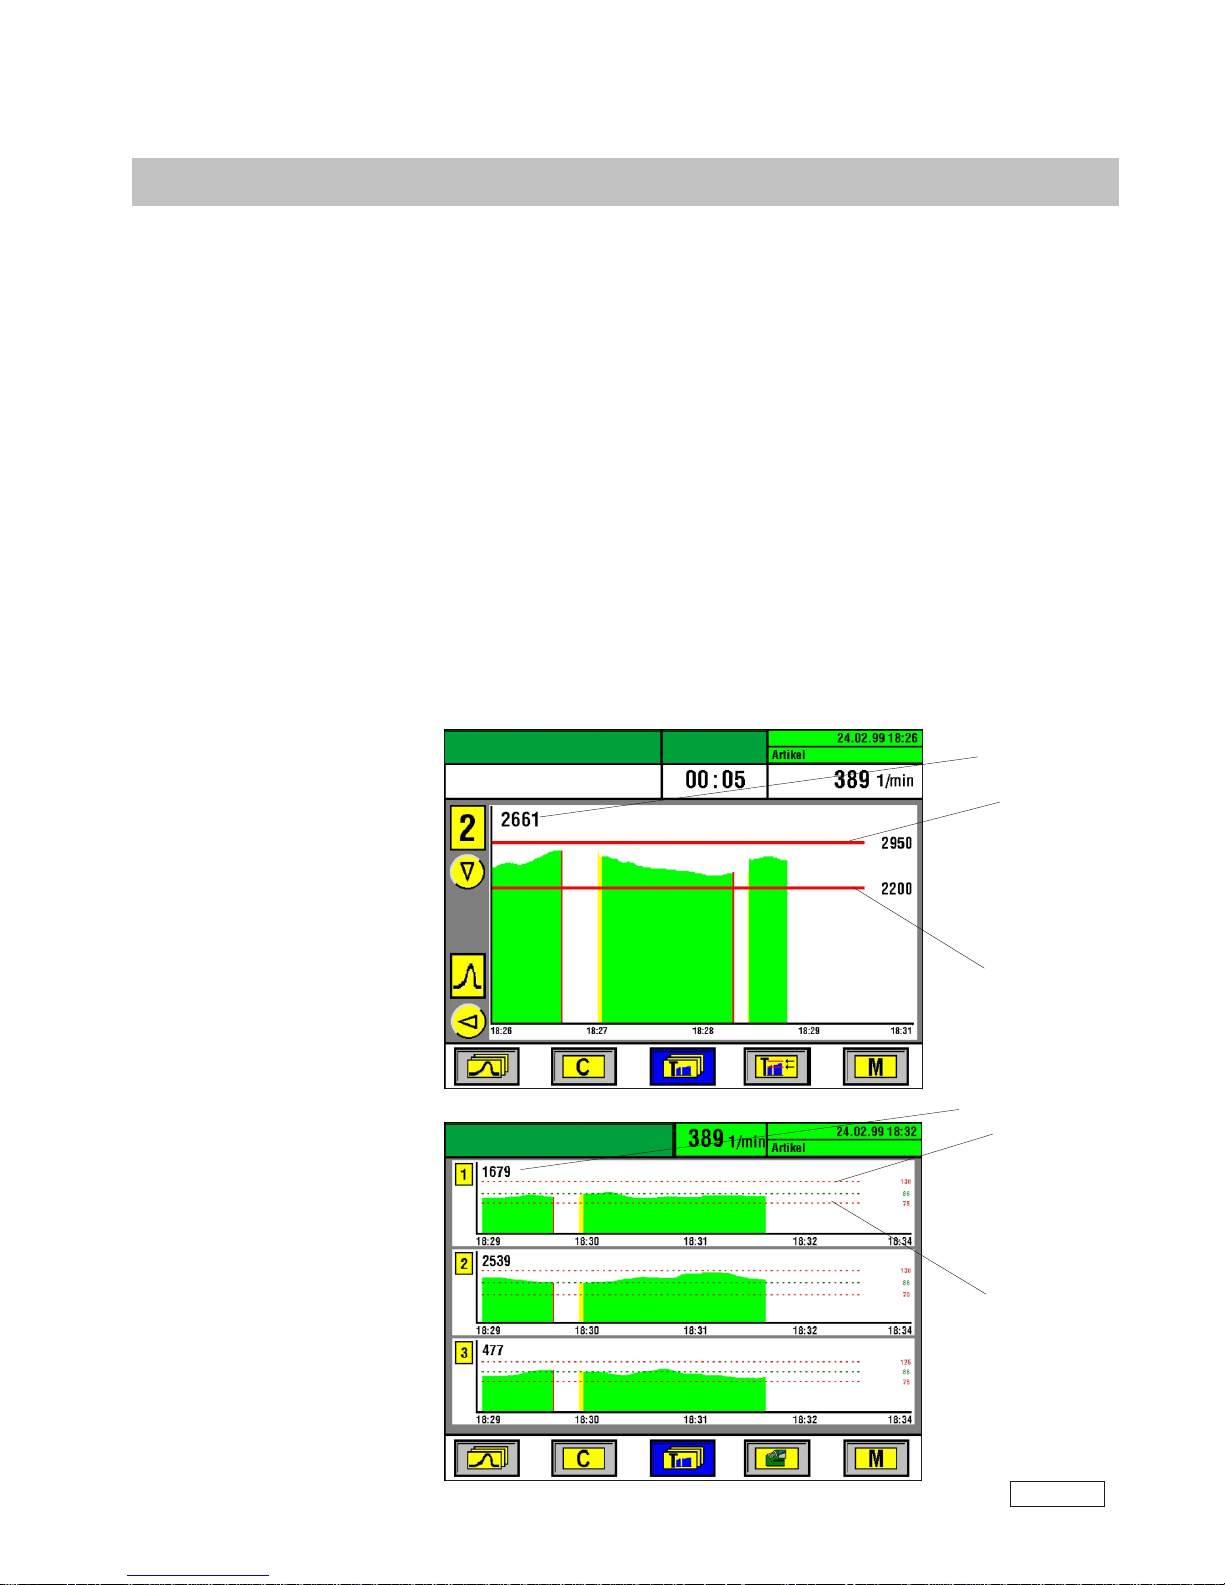
Trend Monitoring
Relative or absolute trend limits
The trend limits can be set either in relative or in absolute numbers (set this within the Menu-section
under "Monitoring Parameters").
When choosing relative limits (as shown in the graphs on the previous pages), the current trend
value representing the average peak force at that time, will be set to 100% each time you start a
new learn. The trend limits also read in relative numbers. If the lower trend limits is set at 85% (as
shown in the graph on the previous page), the average force is allowed to gradually drop by maximum 15 percent. If it continues to drop, the machine will be switched off. Working with relative
trend limits has the advantage that the limits can remain active even when you change the machine
over to another product which typically would mean totally different actual forces.
Absolute trend limits are based on the actual force scale the monitor works with (incoming voltage
or calibrated references). Thus, absolute limits typically need to be adjusted every time you change
the product. Absolute trending is mainly designed to be used in conjunction with calibrated sensors.
Upper absolute
trend limit
Trend monitoring
with absolute limits
Trend monitoring
with relative limits
(shown on the
multi trend display)
Current average peak
Lower absolute
trend limit
Trend Monitoring
Trend Monitoring
Duration
Yes
Current average peak
Lower relative
trend limit
Upper relative
trend limit
SK 7
V5.2 E 10/04
SK7-16
Page 18
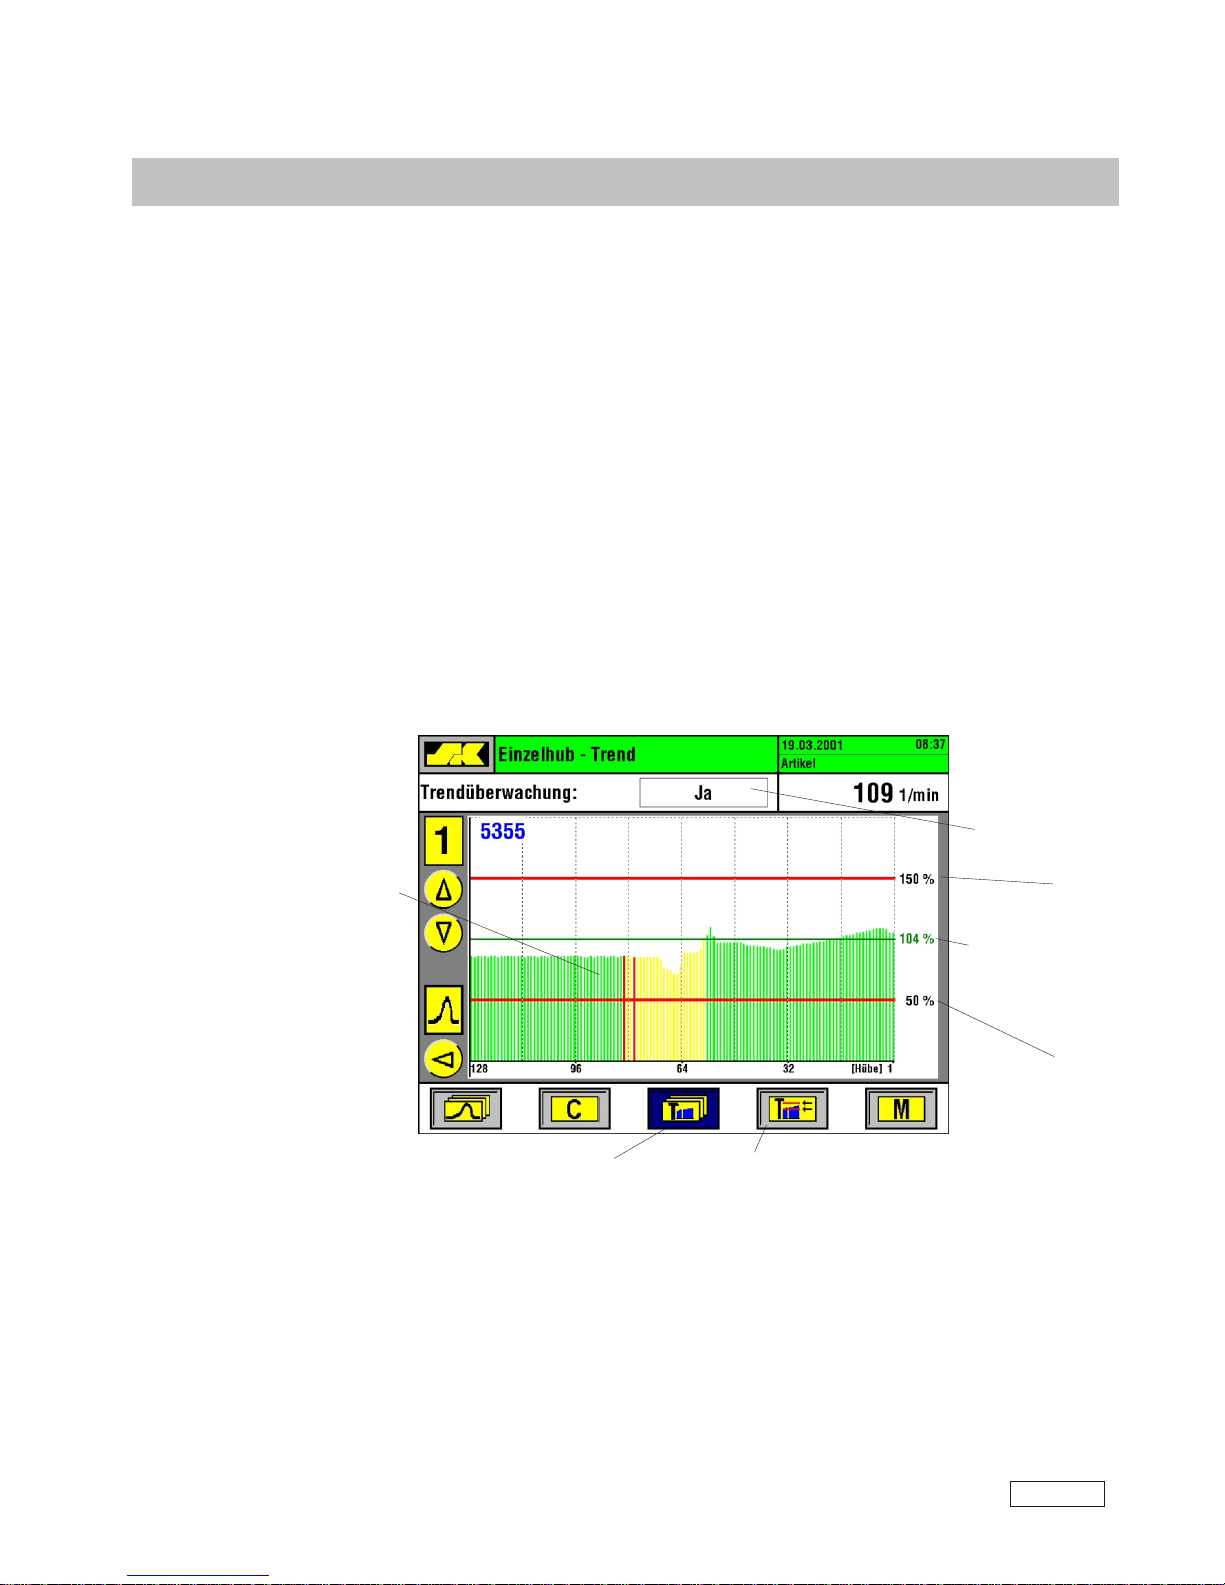
Single Stroke Trending
Trend Monitoring
Yes
Trend Monitoring
Single Stroke Trending
The trend graph can be programmed as an optional feature to show single stroke values rather than
the trending over the average force value (re-programming is done within the menu section).
The single stroke trend graph “plots” the maximum force values as thin vertical lines from left to
right. The full screen will the show the peak values of the last 128 parts. A new part is added to the
right, while the frist part on the left side will drop out.
Setting the trend limits is identical to the procedure explained previously on page 20.
NOTE: Single stroke trending is based on individual parts, and not on the average over many parts.
This means of course that a single part which is above or below the set limits will stop the machine.
Before, the average calculated from the last 100 parts had to exceed the limits.
Upper
Trend Limit
Trend Limits
are activated
(Monitoring = Yes)
Lower
Trend Limit
Trend graph shows
single strokes as
vertical lines.
The color of each
line indicates the
operation mode in
which this line was
plotted
- green: AUTO
- yellow: MAN
- red: STOP
Current
Trend Value
Press to change
screen to multiple
channel trend
Press to adjust
Trend Limits
SK 7
V5.2 E 10/04
SK7-17
Page 19
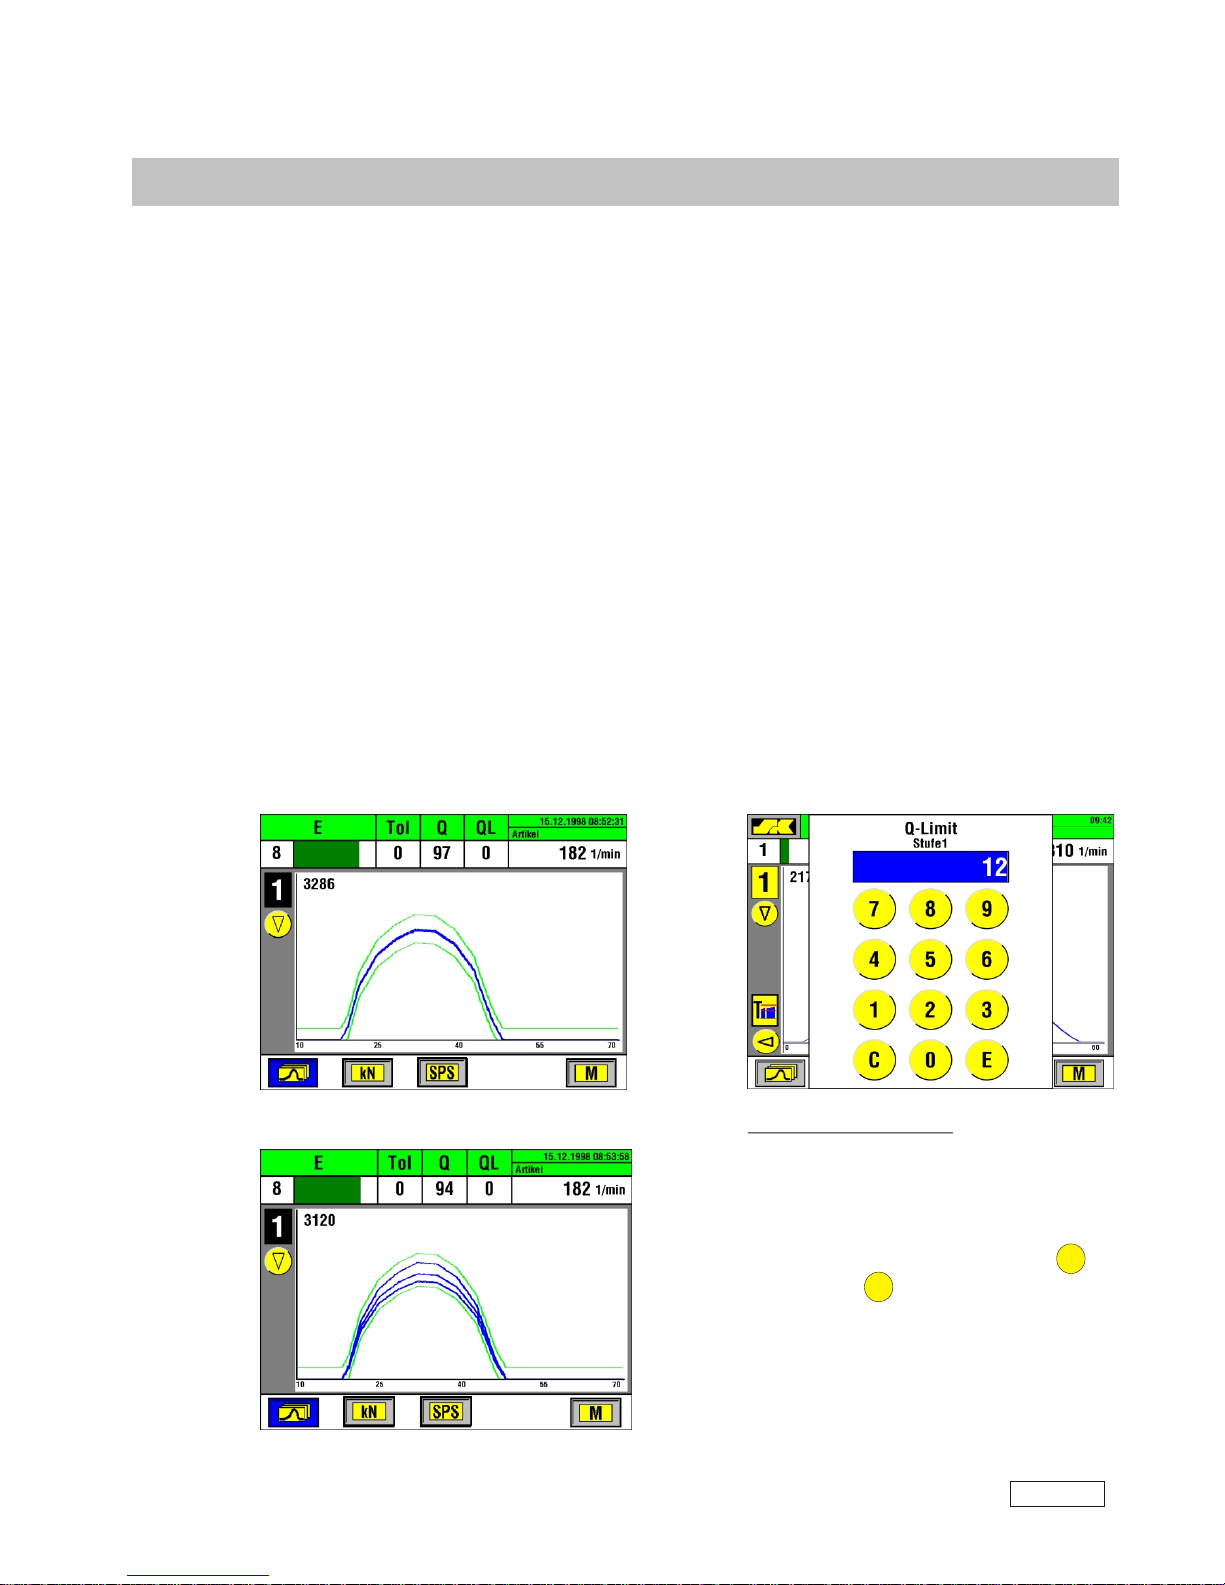
Q-factor monitoring
Q-factor (process stability / process quality)
The Q-factor is an indicator which expresses the stability or repeatability of the forming process
from stroke to stroke as a percentage number. A low Q-factor (e.g. less than 90%) would result
from a very unstable process where the forming force curves are changing significantly from stroke
to stroke. As a consequence, this would lead to fairly wide envelopes with little sensitivity.
Subsequently, this would also have an adverse effect on the consistency of par ts quality.
Alternatively, a calm and stable process will produce high Q-readings of e.g. 95% or better
indicating the high degree of repeatability. Such a process can be monitored very closely with tight
envelope curves.
A separate Q-factor is being calculated for every sensor channel, and is shown as Q on the single
curve screen for this sensor. In addition, you can program a limit value QL which allows to set a
required minimum Q-reading. If the current Q-factor drops below your desired minimum
(e.g. because of an unstable forming process caused by poor material quality or other
inconsistencies), the machine can be stopped.
Calm and stable process with a high Q
Unstable process with a lower factor Q
How to set QL (Q-Limit)
- select the desired sensor chanel
- touch the field QL (field appears blue)
- set the new value vor QL
(compare picture above)
- if necessary correct the value by C
- confirm by E
SK 7
V5.2 E 10/04
SK7-18
Page 20
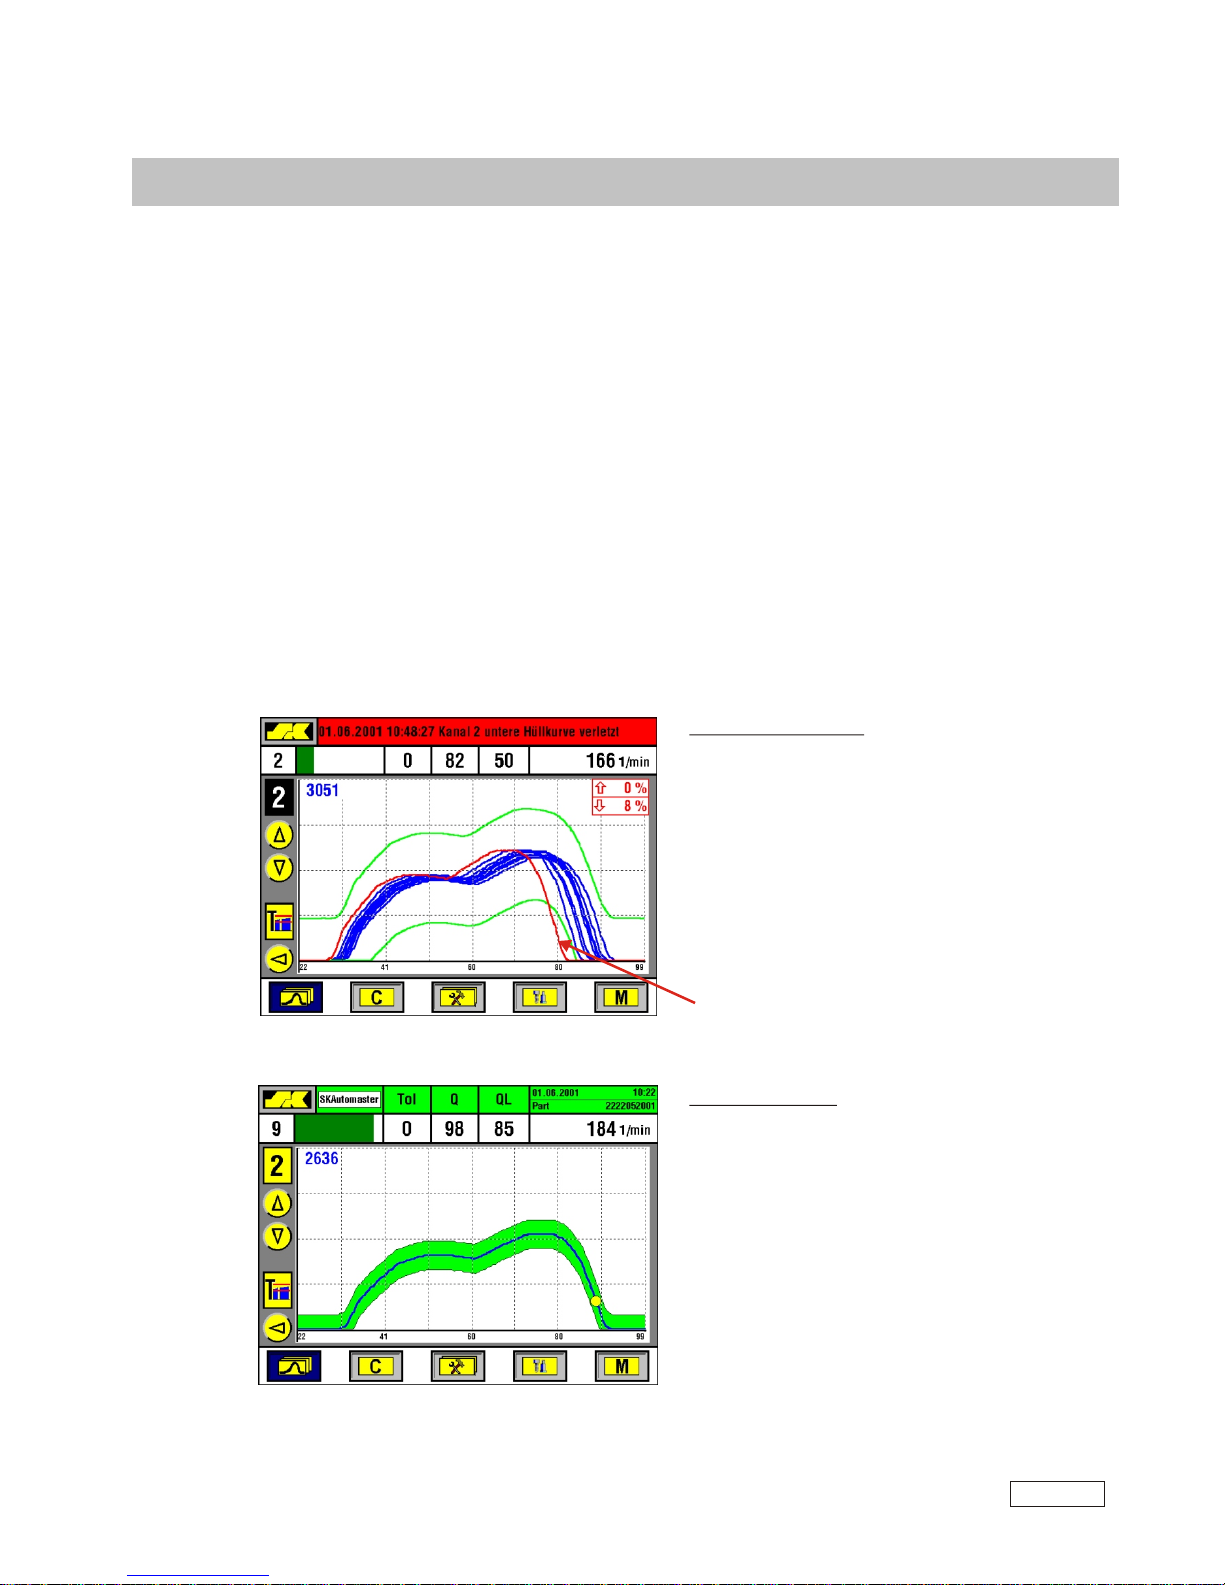
SKQmaster
SKQmaster (machine inconsistency compensator)
Some machines tend to vary slightly in speed during the run, or may have a trigger pulse taken from
an unstable running side shaft (instability often observed on machines with chain-driven side
shafts).
The RPM fluctuation will cause the force waves forms to bounce sidewards left and right. In order
to overcome this, you would typically open the envelope band to accommodate for that. At the
same time, however, you will loose sensitivity but still experience occasional nuisance shut downs.
The SKQmaster function now stabilizes the force signal by automatically compensating left-right
bouncing of the wave form. This allows you to run the usual tight envelopes or envelope profiles,
and it significantly minimizes nuisance shut-downs.
Without SKQmaster:
- machine speed inconsistencies cause the force curves
to bounce left and right
- envelope limits need to be set wide open to allow the
machine to run. You loose sensitivity.
- still erratic force curves occur causing the machine
to stop without apparent reason
This force curve is outside envelope!
With SKQmaster:
- the signal is automatically stabilized. RPM fluctuation
is compensated.
- envelope now can be set close around the actual
process. You regain the necessary sensitivity.
- nuisance shut-downs are avoided.
SK 7
V5.2 E 10/04
SK7-20
Page 21
2
1
Part counters
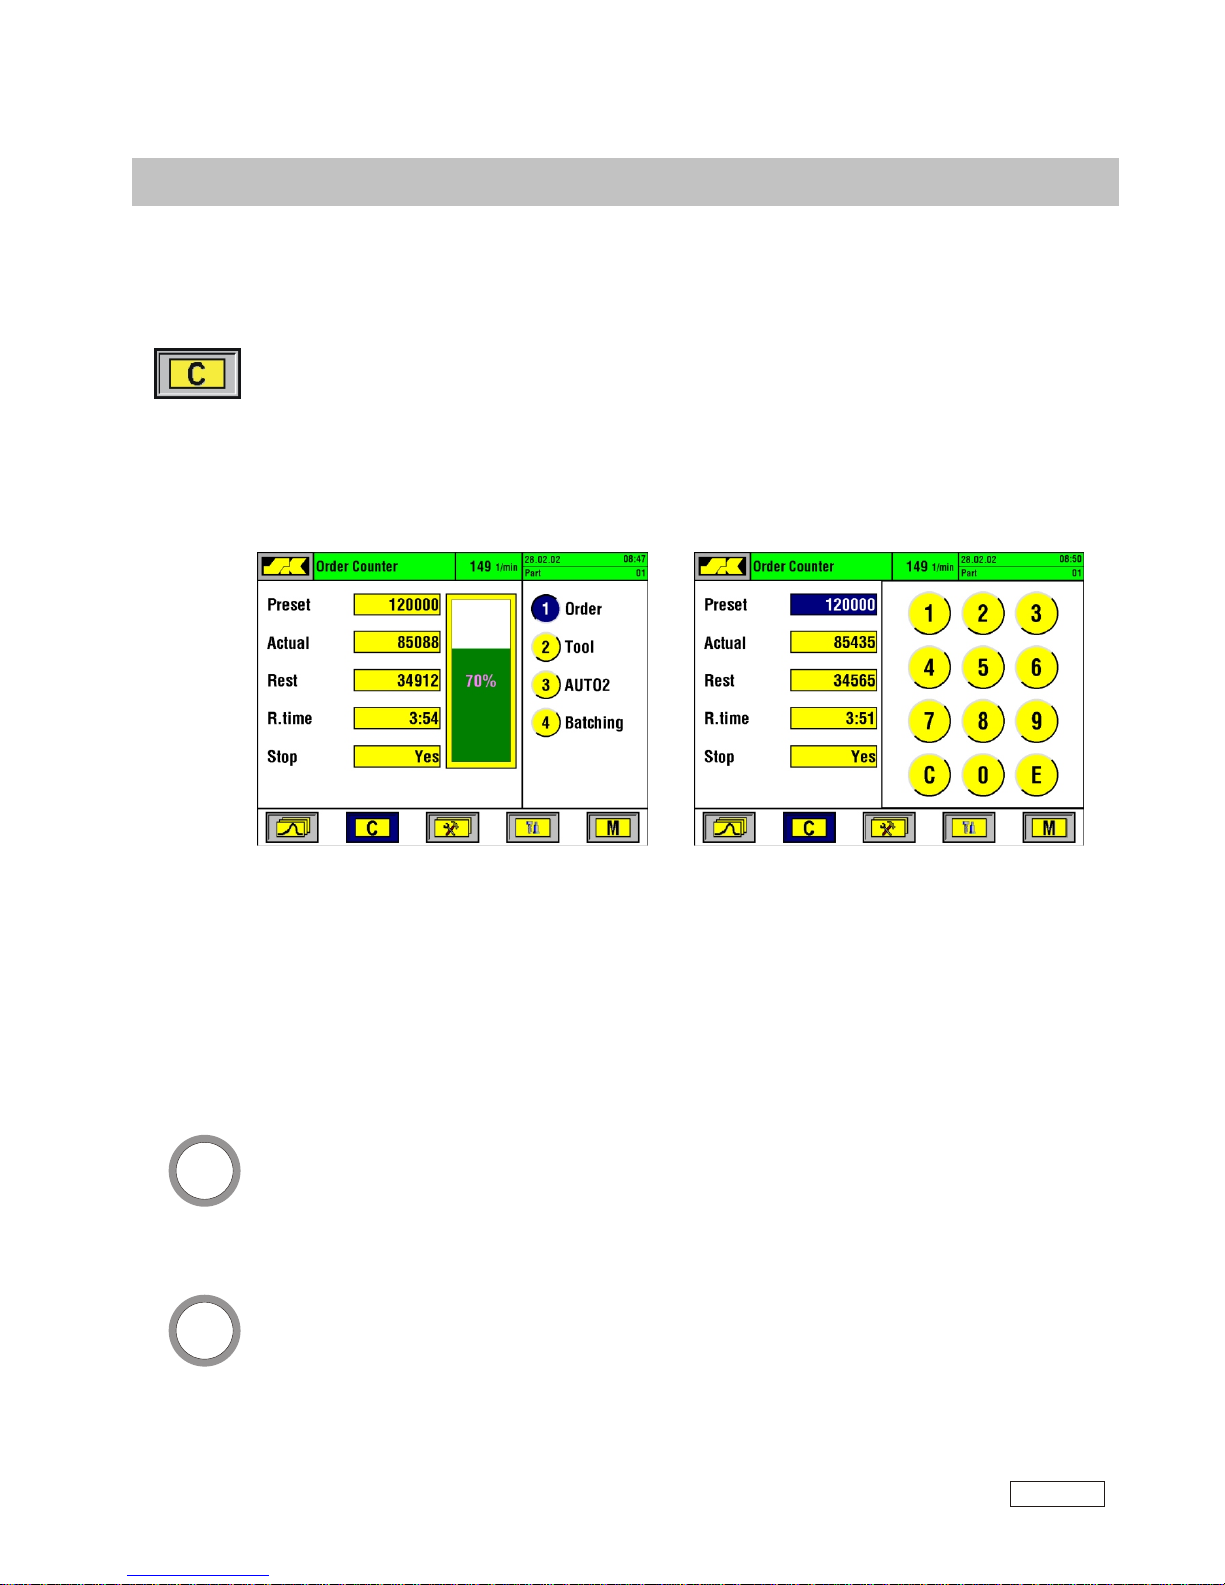
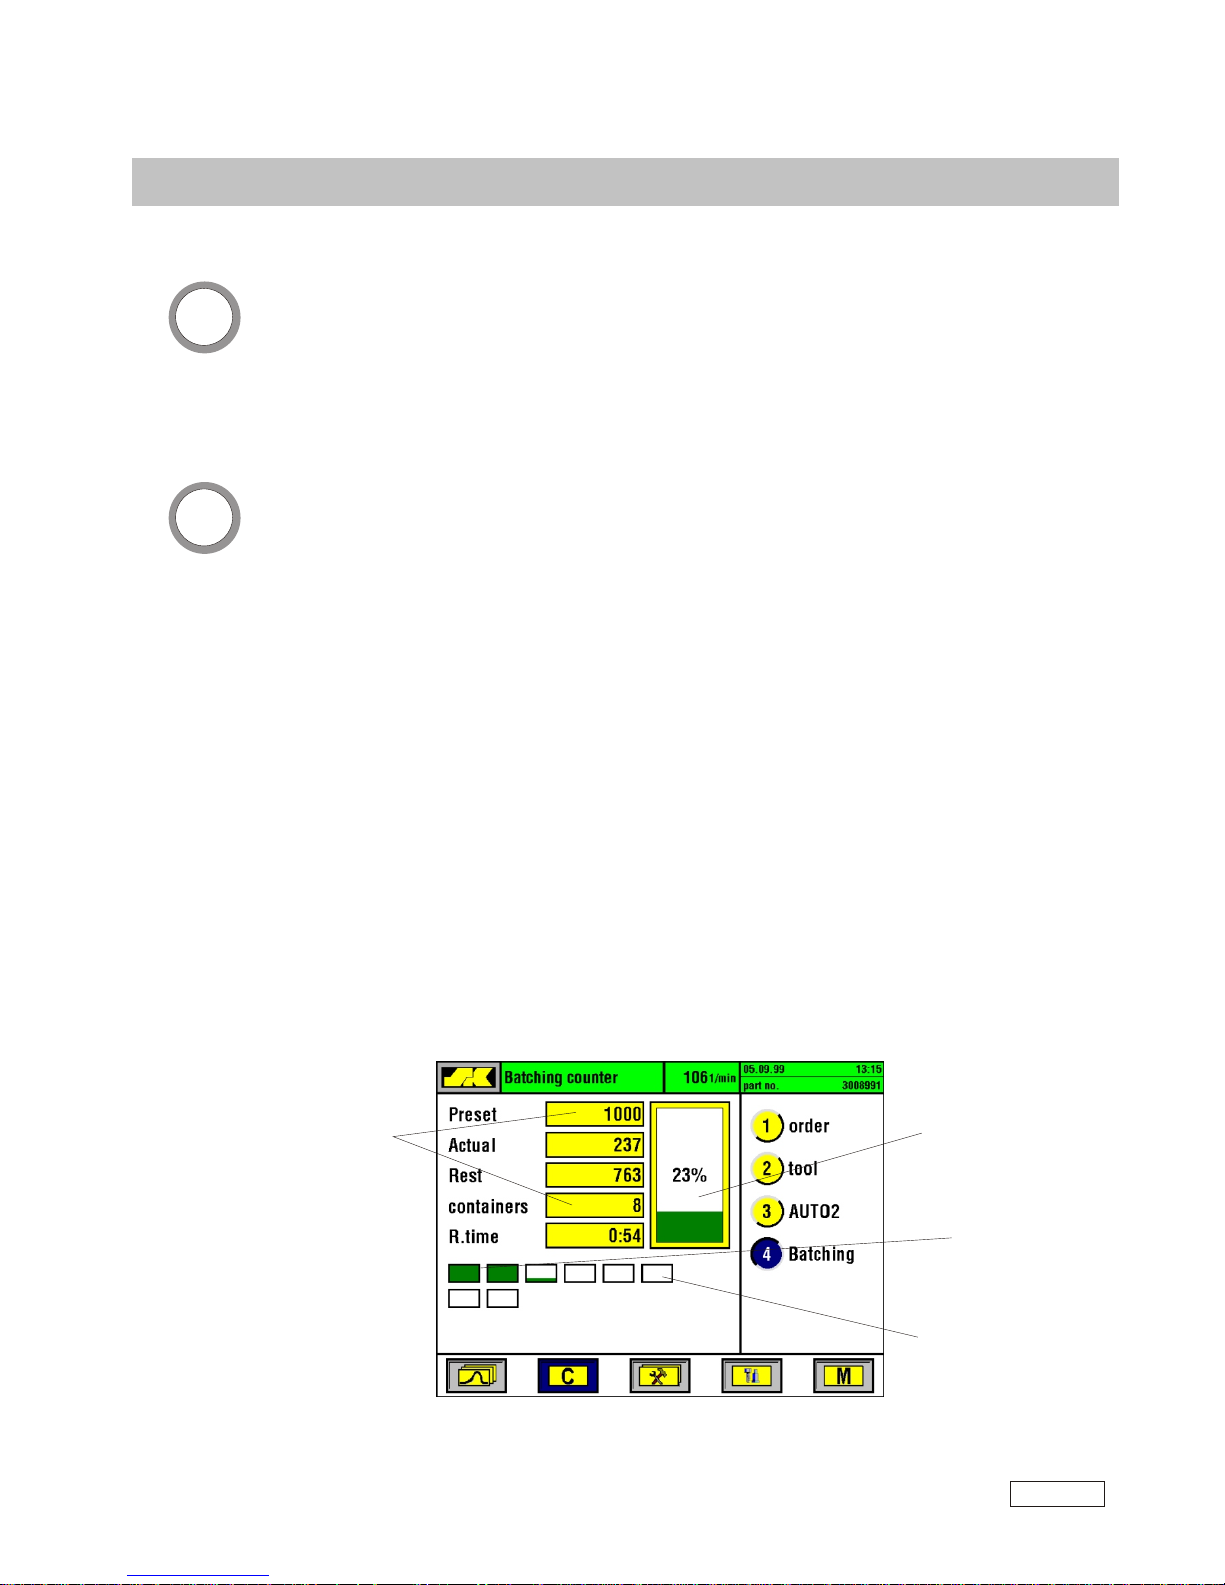
The SK monitoring system provides four (4) different part counters for order size, tool life, unmanned shift (AUTO2-mode) and batching. The counter section is called up on the screen by pressing the C function key below the C function symbol. Changing from one counter to another is done
by pressing the related numerical key 1, 2, 3 or 4. The number and designation of the actively
displayed counter is highlighted in blue (e.g. 1 in the graph below). Each counter’s display shows
the preset quantity, the number of par ts already made, the remaining quantity, and the remaining
running time needed to reach the target count (provided the machine keeps on running at current
speed). The green bar graph on the right side of the display tells you which percentage of the preset
quantity has been completed already.
How to set the counter
Touch the field ‘Preset’ and press the C-key on the numerical keypad (on the right of the display) to
switch into entry mode (color of the preset count box changes to blue). Enter the new quantity,
check the display to be sure you have typed in the correct number, and confirm with the E-key. The
made-count automatically
resets to zero, and the green percentage bar drops down to zero. You can also enter a different
quantity for the made count. This allows you to preset a made count ( e.g. if you have already made
some parts for this order). You can also choose whether you want the machine to stop when it
reaches the preset order size.
Order size counter
The order size counter counts all good parts produced while running in AUTO1 or AUTO2 operation
mode. If desired you can also add all parts made during MAN-mode to the order size count (see
set-up section for programming this). When the current count reaches the preset order size, the
Machine can be stopped in order to prevent over runs.
Tool life counter
The tool life counter counts all parts being made during MAN, AUTO1, and AUTO2 mode (basically
all modes which consume tool life). The tool life counter is typically used to stop the machine at
regular intervals for tool changes or, if you wish, other kinds of regular checks (e.g. periodic
adjustments, inspections, maintenance, etc.).
SK 7
V5.2 E 10/04
SK7-21
Page 22
Part counters
4
3
AUTO2-counter
The AUTO2-counter works just like the previously described order size and tool life counters. It
counts all parts made while the unit runs in AUTO2 mode. This is in addition to the counts taken by
the order and tool counters. The AUTO2 counter is typically used to count production and /or to limit
running time for unattended shifts.
Batching counter
The batching counter is designed to control the function of an external batching unit. Such units are
used to distribute the produced parts into several, consecutive containers. After a preset number of
parts, the SK system will give out a pulse (standard pulse length is 1.5 sec) which is used to switch
the batching unit to the next fresh container. When all available containers are filled, the MOTORSTOP relay is fired to switch the machine off. The display indicates how many containers are filled
already, and to what percentage the current container is filled. The remaining run time shows how
much time is needed to fill all containers.
Touch the ‘Preset’ box directly or the C-key on the numeric pad switches into entry mode ("preset"
box color changes to blue). Enter your desired quantity per container and confirm with the E-key.
Then enter the number of containers available on your batching unit (up to 15 possible). Confirm
again with the E-key.
If you set the number of containers to "0" a batching pulse is given continuously after every filled
container without stopping the machine at any number of filled containers.
The batching function is switched off when both, the preset quantity and the number of containers,
are set to "0".
These 2 green containers
are already full.
The 5 white containers
are still empty.
The currently loading
container (number 3)
is 23 % filled.
This example has
a batching unit
with a capacity
of 8 containers
at 1000 parts each
SK 7
V5.2 E 10/04
SK7-22
Page 23

SKToolmaster
Header set-up assistance by "freezing" force wave forms
Setting up a cold forming machine properly is often a matter of uncer tainty: Are the tools set so that
the resulting forming pressure is sufficient, or are the parts incorrectly formed? Are all
forming stations adjusted such that the loading is uniformly distributed, or are some stations critically overloaded? Would it be possible to form a good or even better part with less
pressure which could even increase tool life? But how would one know if and by how much a setup change improves the setting?
The SKToolmaster system can help you optimize your machine set-up using simple steps. The system indicates if set-up corrections improve the setting, or if they make it worse. At a simple touch
of a button, you can "freeze" the current force wave forms on your screen. After
trying to improve the setting and restarting the machine, you can immediately see if the new force
curves are better than the previous "frozen" ones. Generally speaking, it is advisable to
produce a part with the least amount of pressure possible. Low pressures are generally
considered to be better for the machine and the tooling.
In addition, the shape of the forming force curves will tell you the progression of the metal
deformation as it takes place between your tooling. You can also learn to spot unusual wave forms
indicating improper settings or bad tooling.
Using SKToolmaster to set up your machine
The SK unit can help you improve machine set-up. Try the following procedure:
Put your monitor in MAN-mode (yellow display beam) and let the machine run and produce parts.
Watch the wave forms and compare with your previous experience. If you're not satisfied (e.g. too
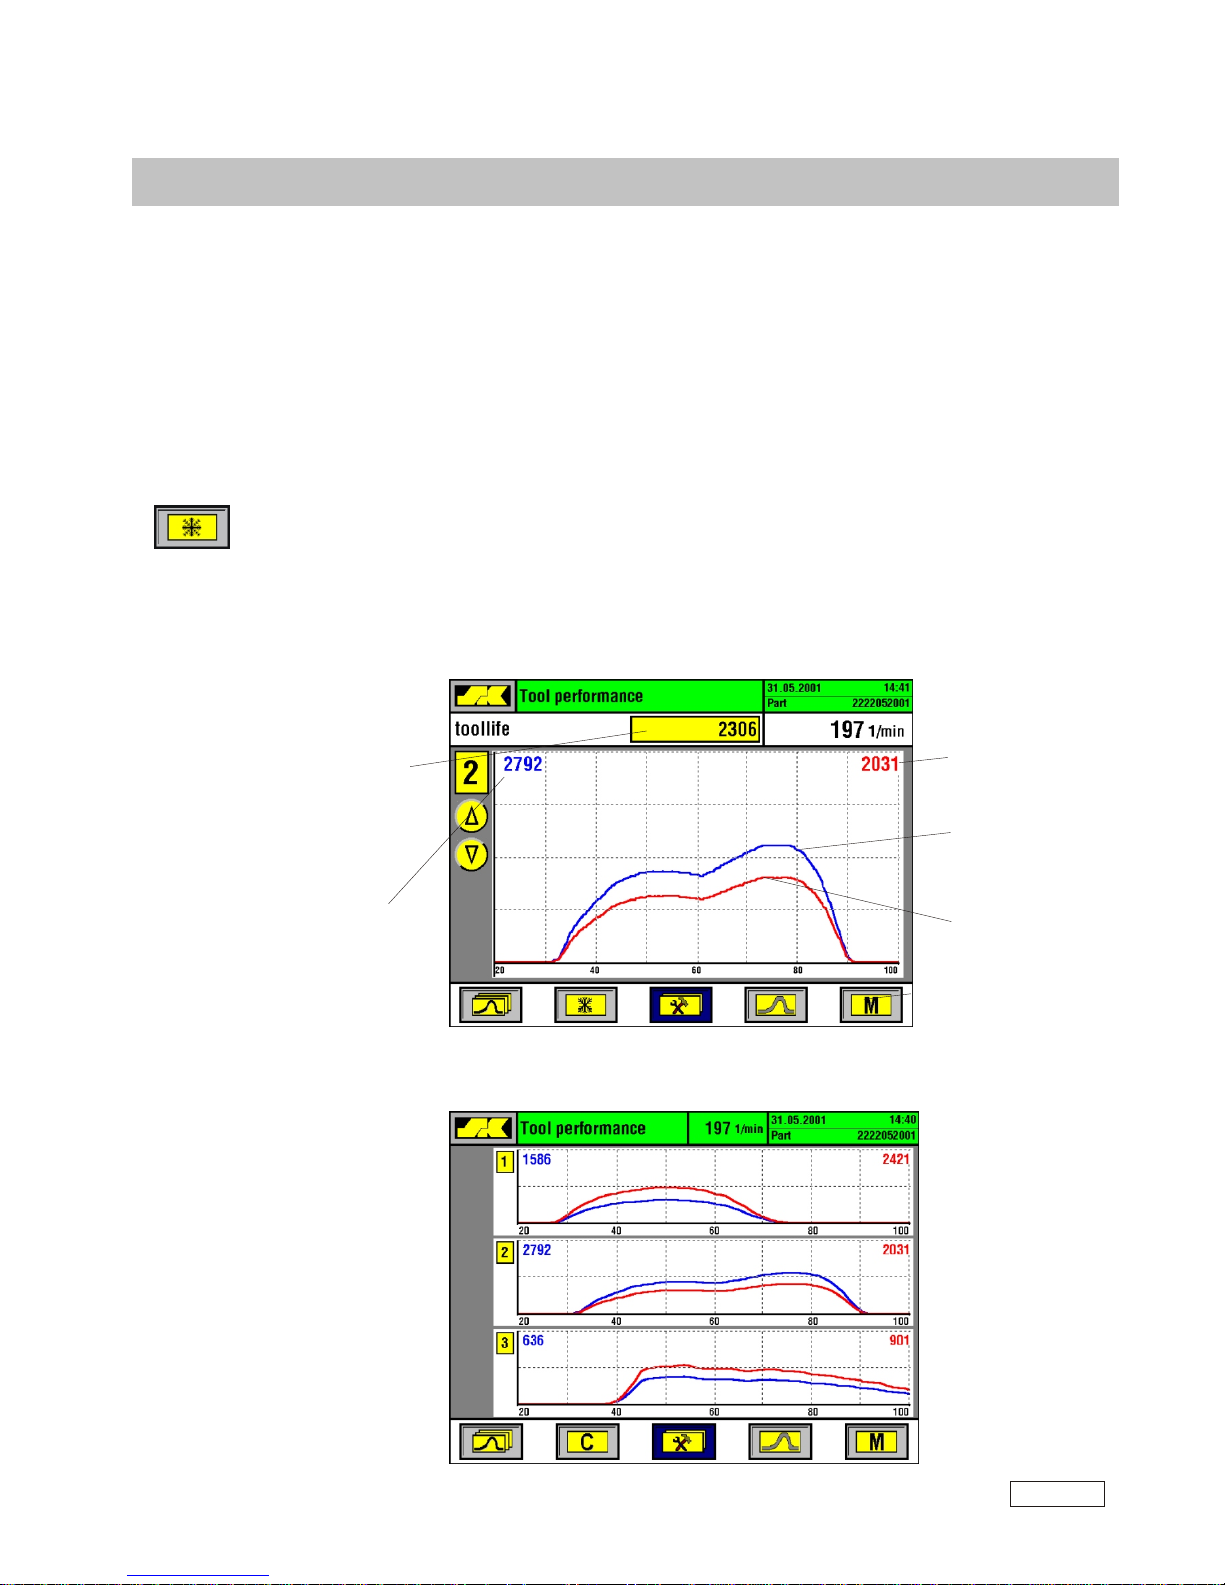
much pressure in some stations, pressure not properly distributed across the stations, erratic patterns, etc. ) press the “snow flake”function key to “freeze” the current wave forms.
These are now shown in red on the screen while the blue lines show the forces of the still running
machine. The blue colored “snow flake”function symbol indicates that frozen curves are in memory.
They will remain "frozen" until you press the “snow flake” function key again (in MAN-mode; the key
will turn back to it’s regular color), or you switch off the monitor.
SK 7
V5.2 E 10/04
SK7-24
Page 24
SKToolmaster
Now stop your machine and make your desired adjustments.
Re-start the machine and watch how the current force curves (blue) differ from the previous (red)
force curves. In addition, you may also want to look at the digital peak force readings and the
arrows pointing the direction of change.
The single curve picture shown below (top) has a situation where the new forces are higher than
the previous ones. This would indicate that the adjustments worked the wrong way (when we
assume that lower forces are better for machine and tooling).
The procedure described here can help to improve the machine set-up step-by-step.
new curve (blue)
showing the situation
after set-up change
old curve (red)
before set-up change
peak force value
after set-up change
Counter keeps track
of how many parts
this tool has run
since “freeze” of the
reference force curve
peak force value
of old curve (red)
Single curve presentation
Multiple curve presentation (example for 3 curves)
Channel 1:
new force is lower
than old one
Channel 2:
new force
is higher
Channel 3:
new force is
lower
SK 7
V5.2 E 10/04
SK7-25
Page 25
Sorting Control
The sorting function
All SK process monitoring systems are designed to operate in conjunction with suitable parts separation devices such as gates or traps in order to separate any detected faulty parts from the previous good parts production. The SK bbx unit will give a sort signal via its sort relay to open and
close such devices. It is recommended that the machine be stopped at the same time so that the
operating personnel can evaluate the type of defect and to initiate possible corrective action. Alternatively, the machine may be allowed to carry on producing while randomly occurring defects are
automatically segregated. The machine will only be stopped by the process monitor if too many consecutive bad parts are made (adjustable via the "Tolerance" setting, see page 09).
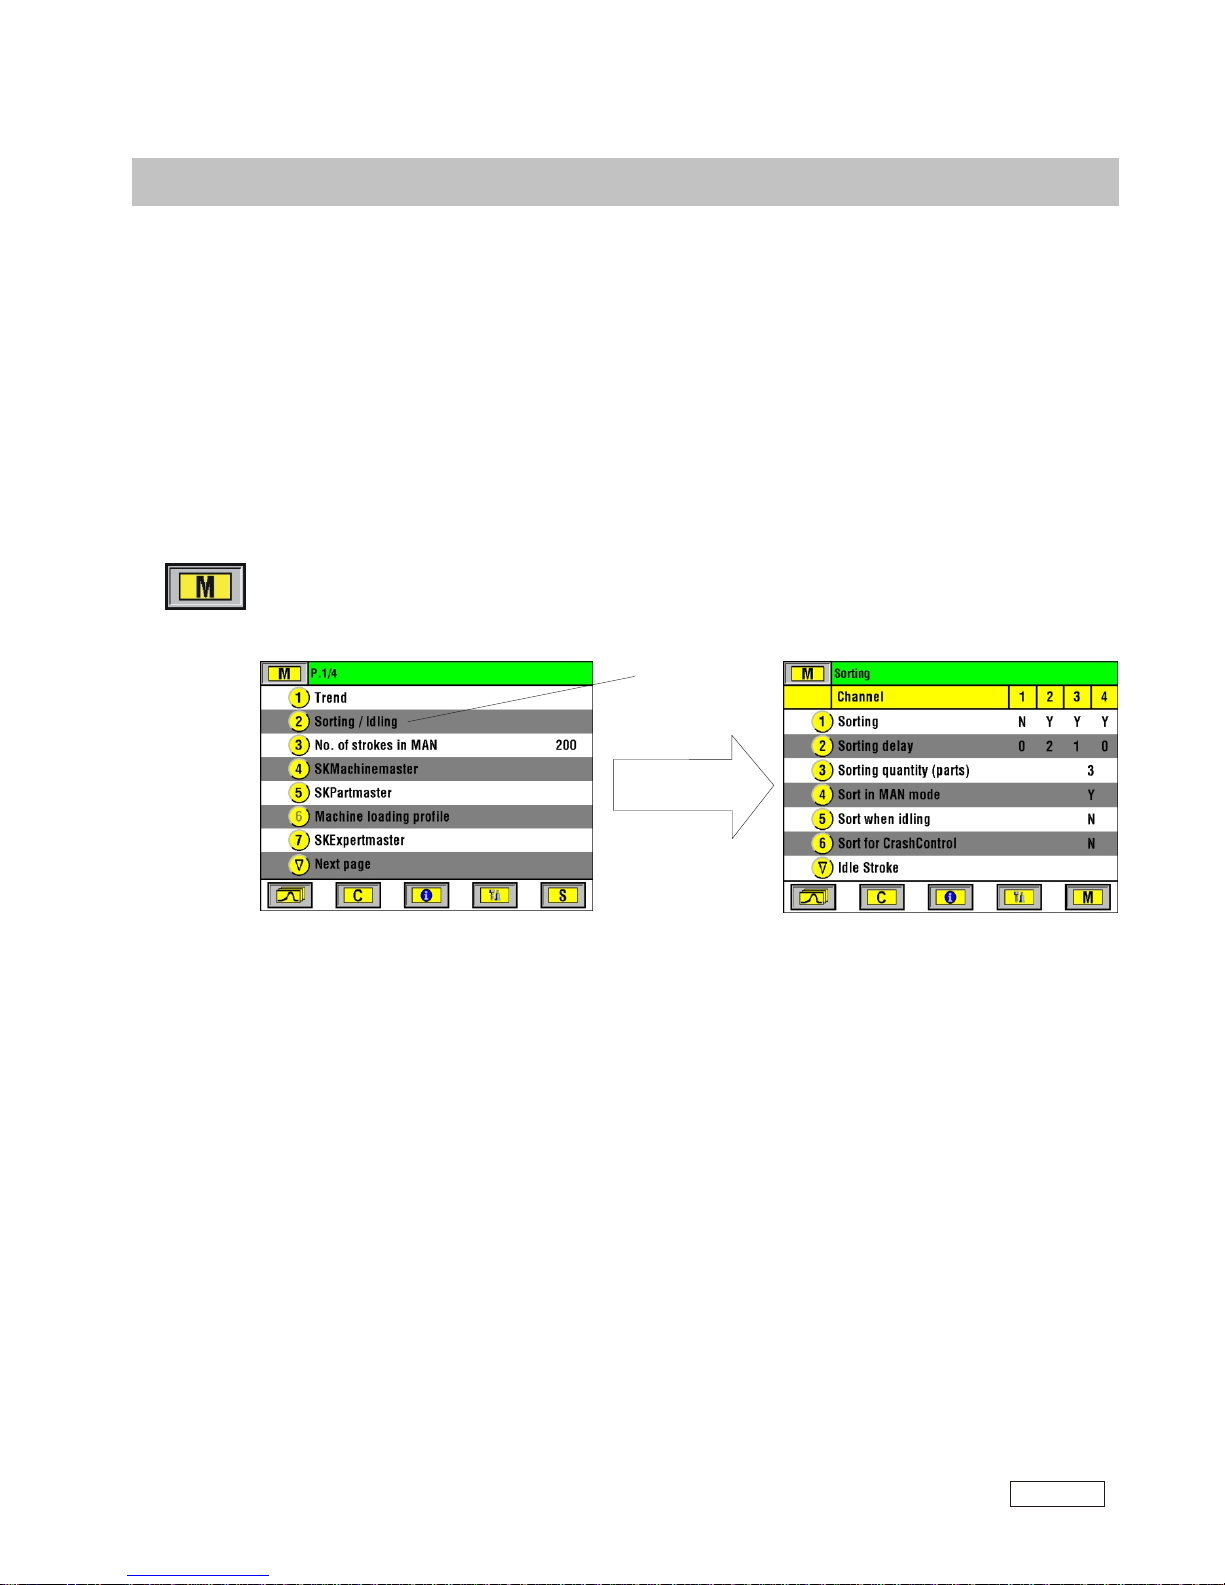
The settings for sorting can be found inside the menu section (accessible via the M function key
and entry of an access code).
Setting the sorting parameters
Touch the numbered key to select the desired function. The related data field on the right side turns
dark. Enter the desired number, or press any number key to switch between Yes and No.
1. Sorting (Yes/No):
Sorting function is active for this channel when set to "Y".
When set to "N" this channel is not used for sorting.
2. Sorting delay:
Allows you to delay the sort signal. This feature is useful in cases where the detected bad part
needs some time to get to the actual sort position. The delayed signal prevents too many of
good parts from being sorted along with the bad one. The delay is entered in number of parts
(or stokes).
3. Sorting quantity (parts):
Determines the number of machine cycles or strokes for which the sort signal will be given.
This ensures that the faulty part has really passed the gate position. Any setting higher than 1
will sort one or more good parts along with the bad one which is generally recommended
for quality control assurance.
Press 2
to acces sorting
SK 7
V5.2 E 10/04
SK7-26
Page 26
Sorting/Idle Stroke Adjustment
4 Sort in MAN mode: When set to "Y" the sort signal will be activated when the SK bbx runs
in MAN mode. All set-up pieces and non-monitored parts are sorted which prevents possible
contamination.
5 Sort when idling: When set to "Y", the sort signal will be activated every time the process
monitor detects an idle stroke. On some machines certain faults have very low force readings
and may look like an Idle stroke. Idle strokes, however, are typically allowed on these machines
and would not prompt a sort signal. In such a case, the sort gate can be activated for safety
reasons every time an idle stroke or a "would-be idle” stroke is detected.
6 Sort for CrashControl: when set to “Y” the sort signal will be activated for every so-called crash control stroke. These are machine strokes where due to feeding problems, or in case of detected
short feeds, the forces are not monitored with their regular envelopes but are only checked for
heavy overloads (crash). These potentially suspicious parts can all be sorted.
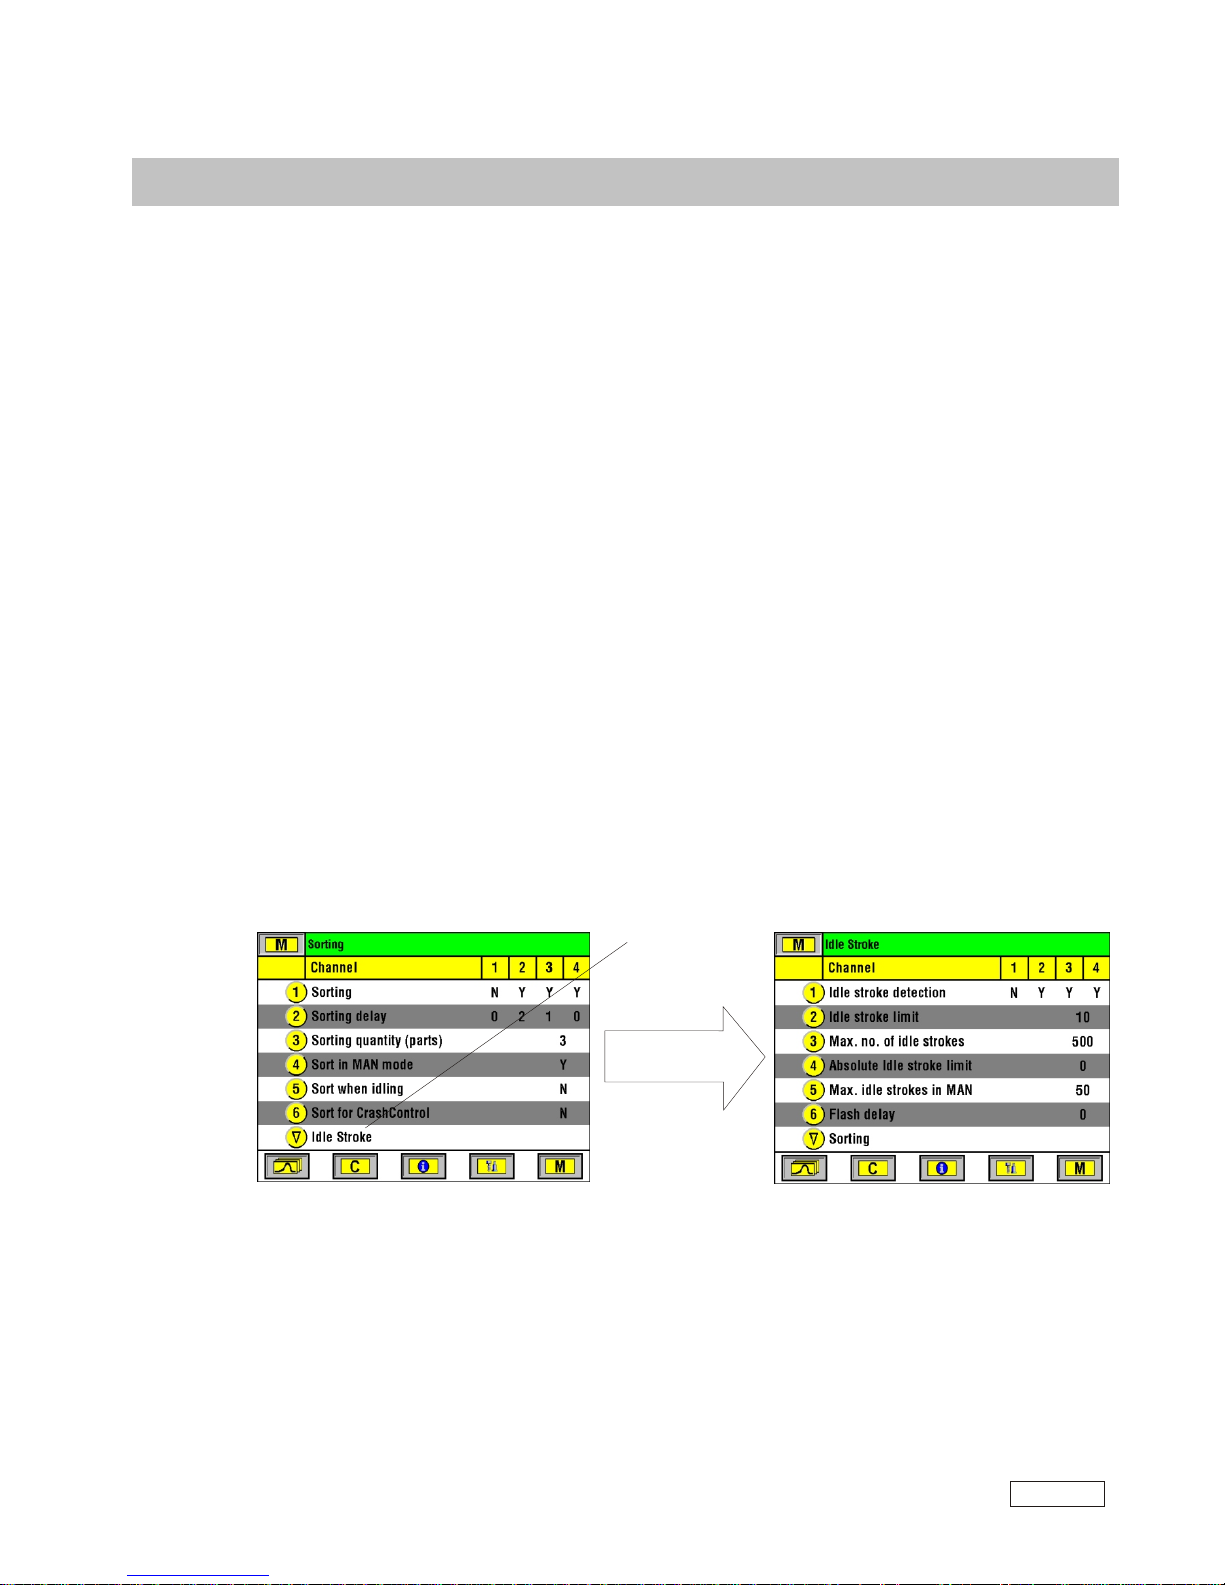
Press cursor key
to get to
idle stroke setting
Idle stroke adjustment
Some machines tend to occasionally run idle stokes due to problems in feeding blanks down the
feed rails. Normally, an idle stroke is considered to be a "fault", and the monitor would stop the
machine. To prevent that, the monitor is capable of seeing the difference between an idle stroke and
other faults, and can tolerate idling for a certain period of time. The machine will be stopped only if
idling continues (e.g. when feeder bowls are empty). The following parameters can be set to tell the
monitor what idle strokes look like:
1 Idle stroke detection
Allows you to select which channels will tolerate idle strokes. Set those channels to "Y".
In those channels where you don't want to allow idle strokes put a "N". Confirm your settings with
the "E" key.
2 Idle stroke limit
Determines the limit for idles strokes as a percentage of the normal peak force reading. If a force
reading is below the threshold, this stroke will be considered an idle stroke. The example above will
see idle strokes if the peak forces are less than 10 % of the normal load.
SK 7
V5.2 E 10/04
SK7-27
Page 27
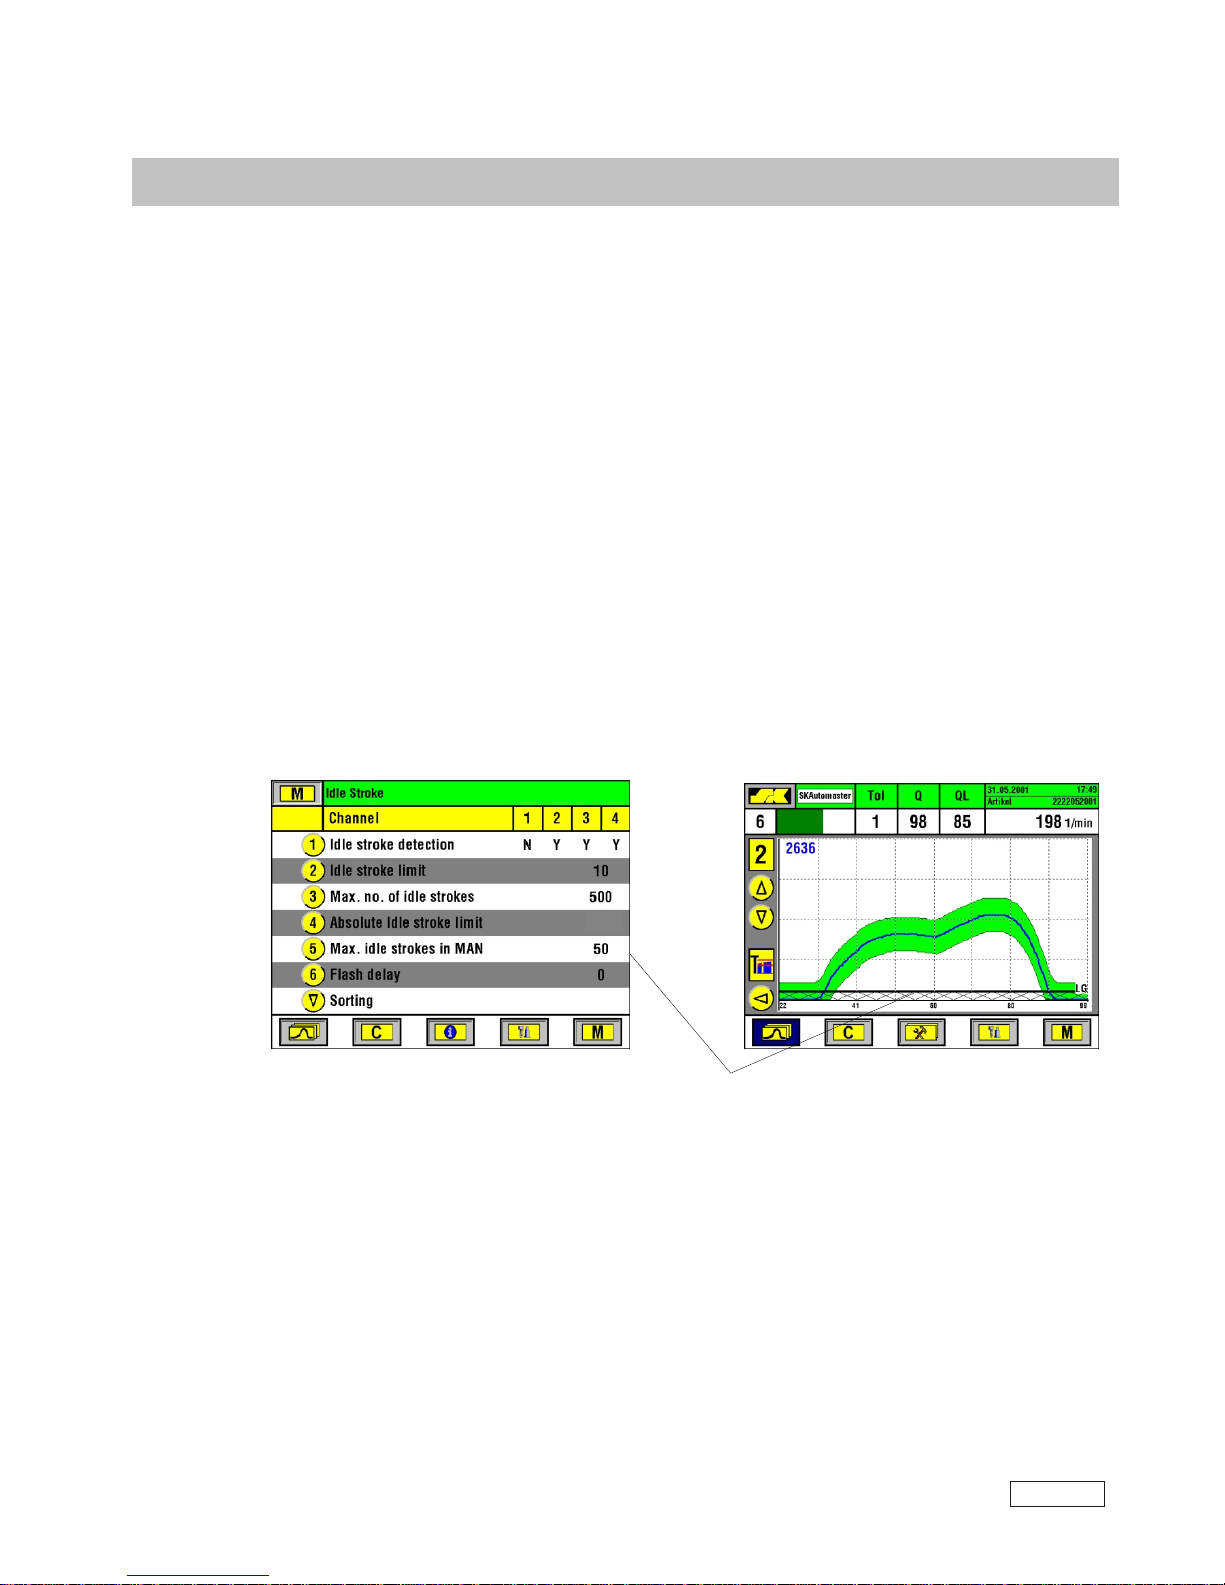
5 Max. idle strokes in MAN (0 .. 9999), Option SKSinglemaster
Determines how many consecutive idle strokes will be accepted in MAN mode (only in
conjunction with the function described at 4 above).
6 Flash delay
Determines when the optional warning lamp starts flashing in case of idle strokes (number of
consecutive strokes after which the lamp starts). This feature prevents that the lamp flashes all
the time in case of irregular no-feeds.
Absolute Idle Stroke Limit
3 Max. number of idle strokes
Determines the maximum number of tolerated consecutive idle strokes before the machine is
switched off (example above: 500 strokes). During this time, the optional warning lamp will flash
to alert the machine operator of an unproductive machine condition.
4 Absolute Idle Stroke Limit (SKSinglemaster option)
This setting will prevent that very small force signals (peak lower than the set limit value) are
considered to be valid force curves but are treated like idle strokes. This feature ensuress that
idle stroke signals (important on thread rollers) are ignored during teach-in.
If your monitor is equipped with this option, the force curve display will visualize the set absolute
idle limit as a shaded area.
25
Sorting/Idle Stroke Adjustment
SK 7
V5.2 E 10/04
SK7-28
Page 28
Machine and process data analysis
Machine
"run time recorder"
including up and
down times
Distribution (%)
of the up and
down time intervals
(efficiency)
The left column
shows how often
each error occurred
in the selected
review time frame
(history)
Press 1 to sort
by frequency/
quantity
(as in example
on the right)
Press 2 to sort
by the down time
caused by
each type of error
The right column shows
the amount of down
time (min) caused by
the listed errors
Review time
Histogram of
the 5 most frequent
events causing
downtime
Statistical machine and process data analysis (optional)
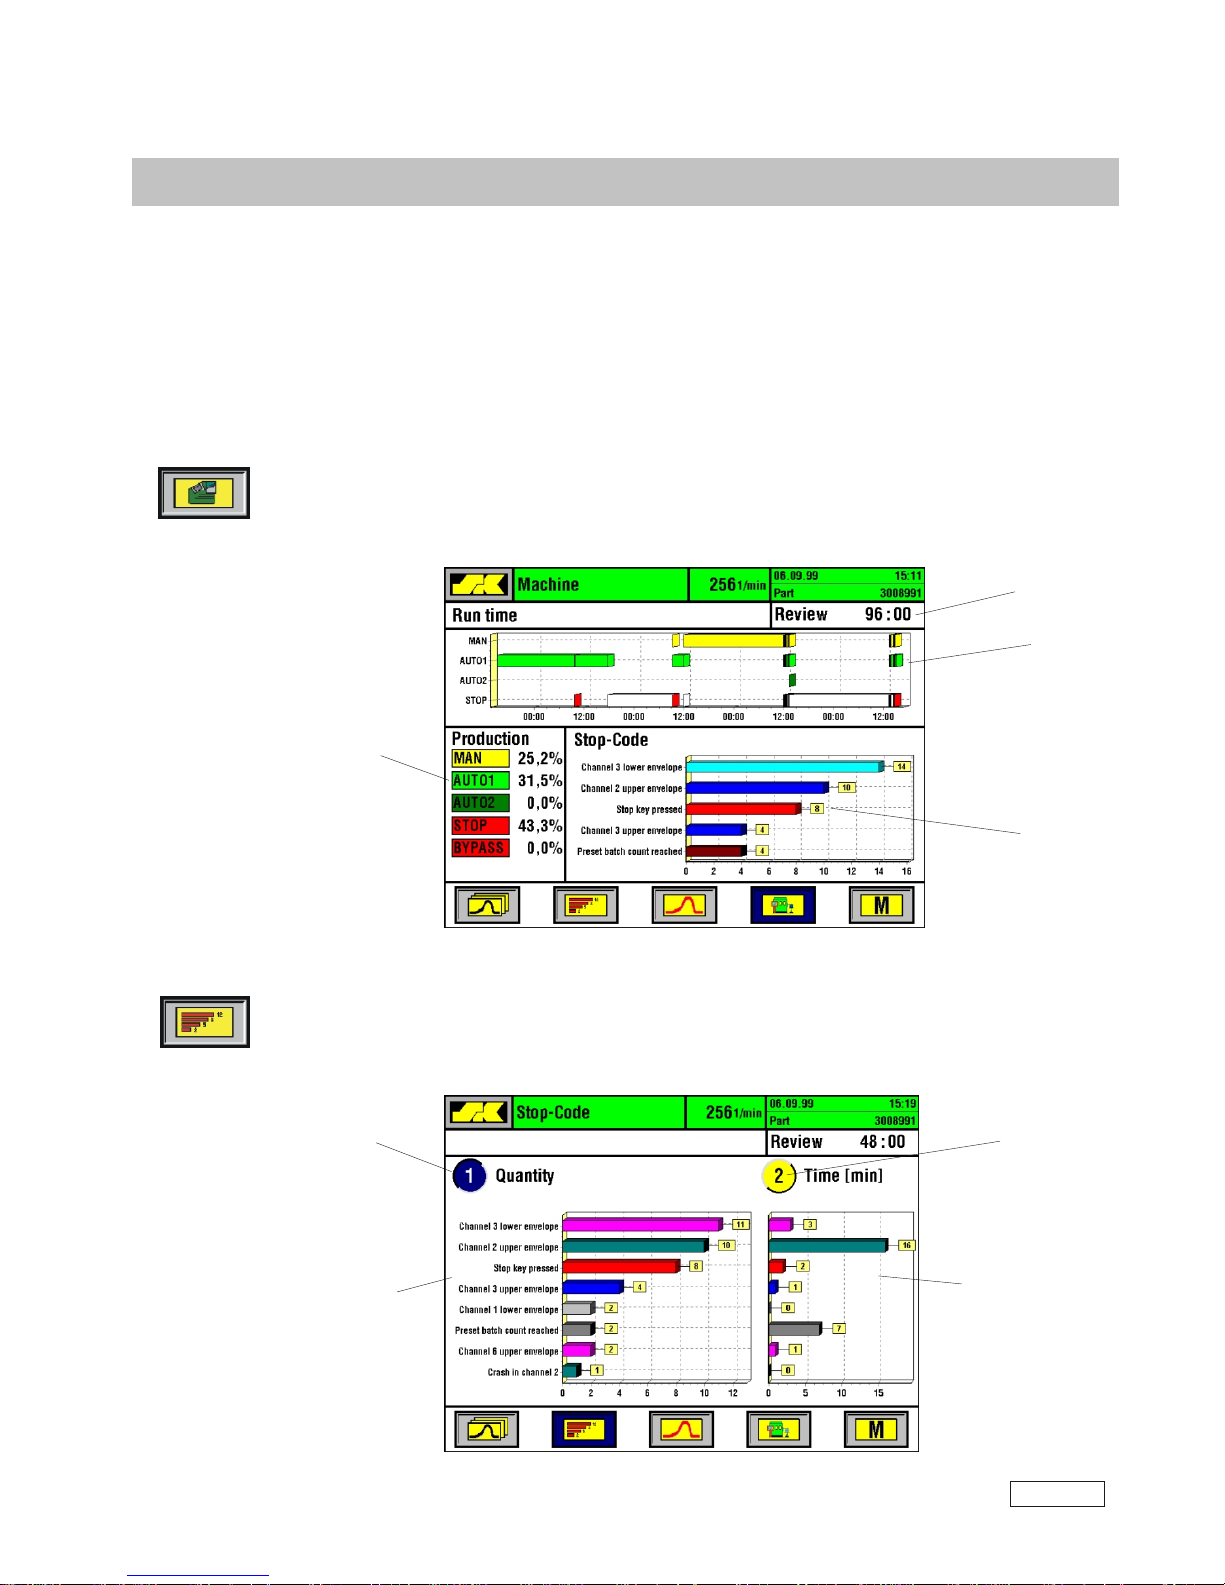
The SK bbx offers as an option the possibility to memorize machine running data over a period of
time, and to provide some statistics from that data. This function is accessible via the first page of
the Menu section, item no. 4, “SKMachinemaster”.
Machine run time diagram
This screen summarizes the machine performance over a certain time frame (history). This
includes up and down times, utilization percentages and down code statistics. The review (history)
can be set between the last 30 minutes up to the last 96 hours (touch the Review box to gain ac-
Stop frequency
Press the function key to see a detailed error and stop code analysis .The error listing can be either
put in sequence of their frequency (press 1) or in order of the down time caused by each type of error (press 2).
SK 7
V5.2 E 10/04
SK7-29
Page 29
Machine and process data analysis
Error analysis (failure curve memory)
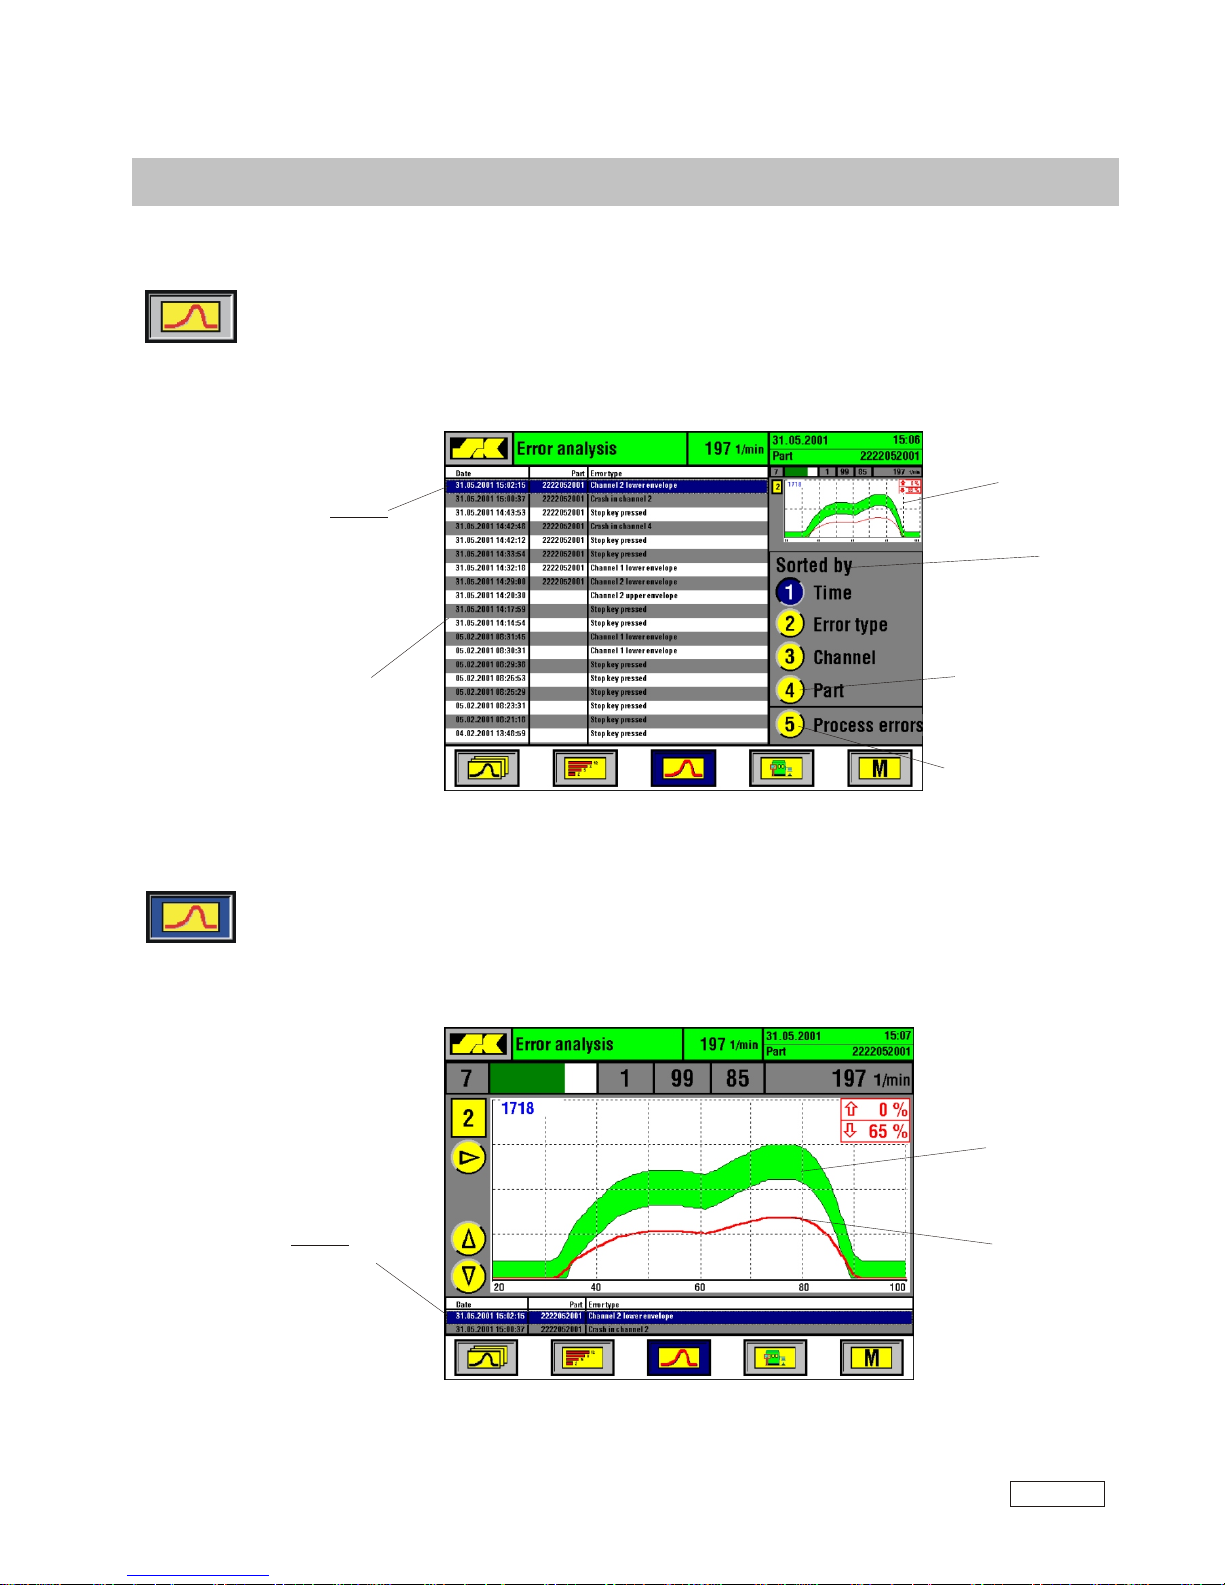
All errors and machine stoppages are kept inside the monitor's memory, and are available for later
analysis over a period of time. Press the Error Curve function key below the function symbol shown
on the left.
Enlarged error curve display
Press the Error Curve function key again to obtain an enlarged image of the error curve you are just
looking at to see more details:
Sort list:
by time of error (press 1),
by type of error (press 2),
or by channel (press 3).
Use the cursor keys to
scroll the blue bar
to the desired
position (the related
error curve will
automatically
insert in the upper
right corner)
Listing of all recorded
errors
The blue bar marks
the currently
displayed error
Example of a
force error:
The actual error
curve is shown
in red
This was the envelope
valid at the time
the error occurred
Appearance of
a process error
(failure curve)
Press 4 to just list
process errors (without
counter stops, etc.).
Press 5 to list all errors
made while the current
part was running.
SK 7
V5.2 E 10/04
SK7-30
Page 30
Load Distribution Profile
Load distribution profile
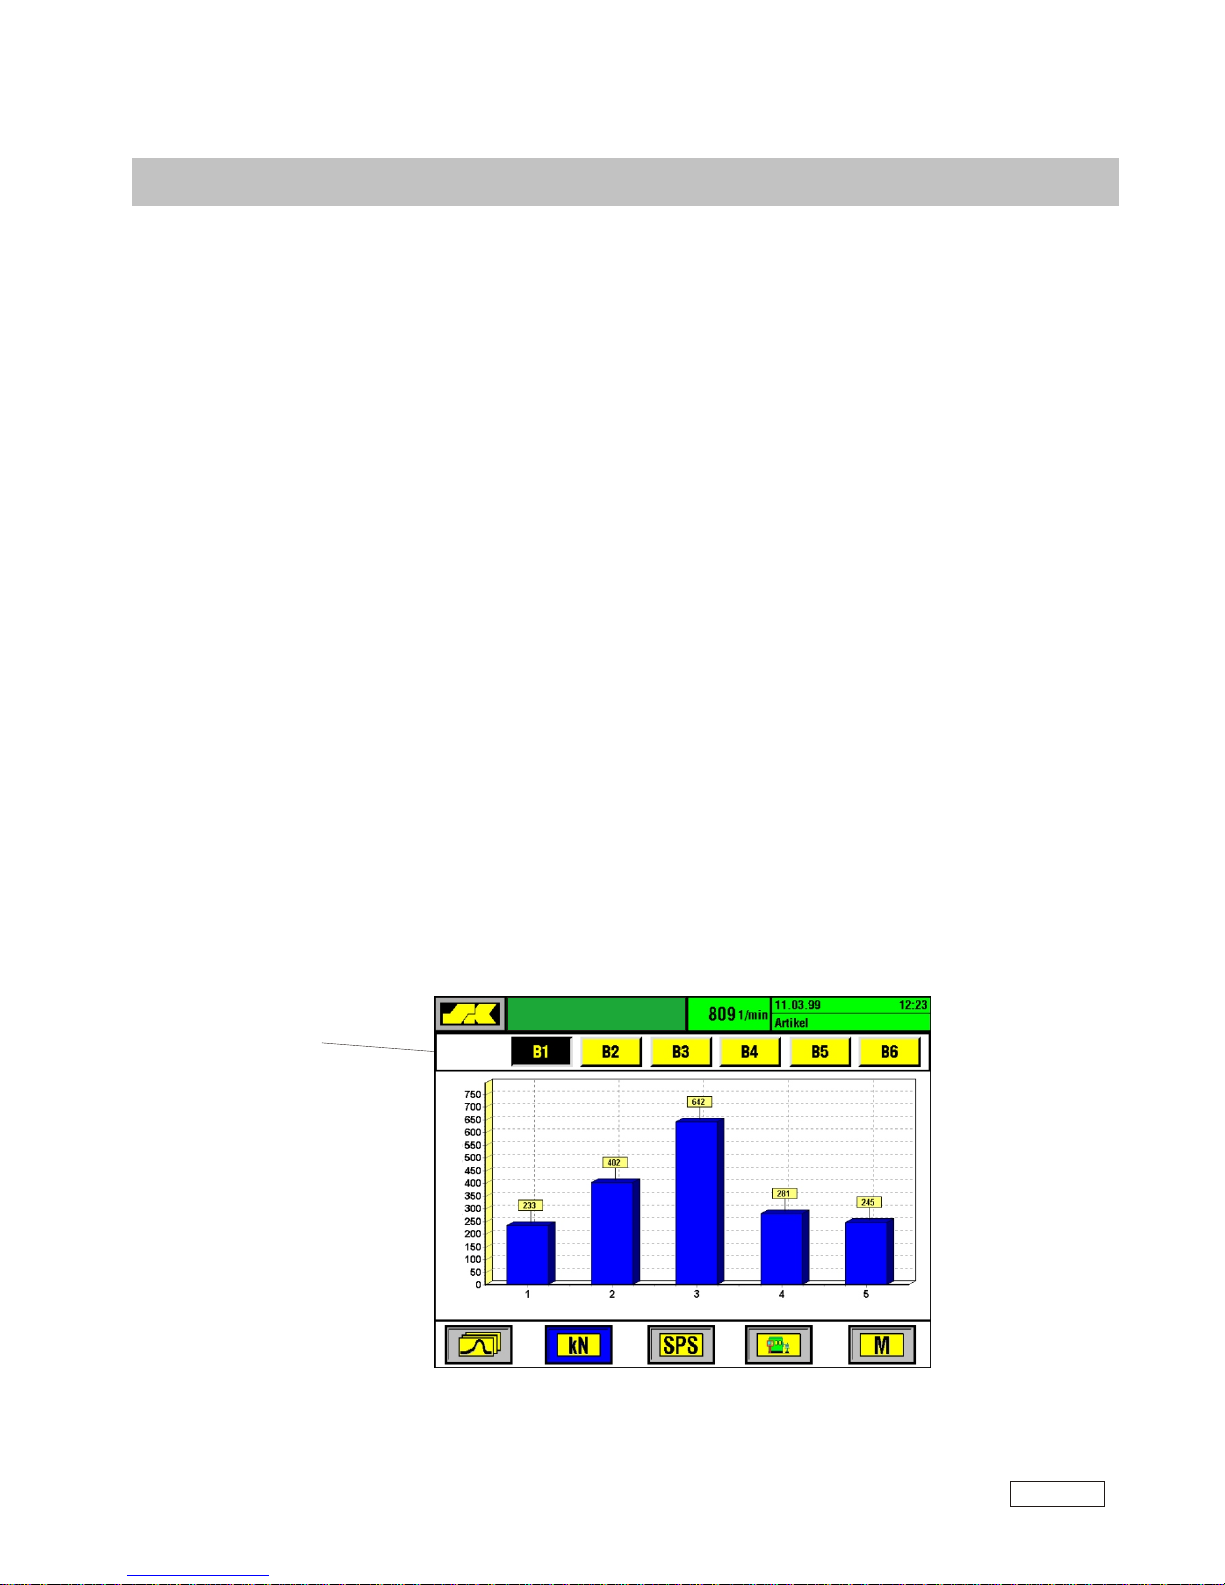
The load distribution profile can be accessed from the first page of the MENU SECTION (press M
and 6). This screen shows the distribution of the current peak force readings (blue bars) for each
channel. This information allows you to view the actual distribution of the forming work among the
channels and to decide whether or not you'll find the distribution acceptable.
On multi-station machines, it is normally desirable to have a fairly uniform distribution of the
forming work in order to obtain good tool life. A distribution heavily out of center, on the other hand,
is typically not acceptable because this would wear out the ram slide bearings.
The numbers shown in the diagram are either based upon the SK bbx's internal scale (directly associated with the strength of the incoming sensor signal), or they can be actual tonnage (kN) readings
in case you use calibrated sensors.
If your machine is equipped with exchangeable tool packs with calibrated sensors installed in each
pack, you can have several sets of calibration parameters stored under BLOCK 1 to BLOCK 6.
Whenever you change a tool pack, you can call up the associated calibration BLOCK and have the
correct absolute load readings off the sensors installed in this tool pack.
If your monitor is also equipped with the optional “Part Data Memory”, the load distribution profile
diagram will show in addition any reference load distribution that may have been stored under the
Respective part number (see next chapter Part Data Memory).
Selected
BLOCK
set
Load Distribution Profile
Peak Load (kN)
Channel
SK 7
V5.2 E 10/04
SK7-31
Page 31
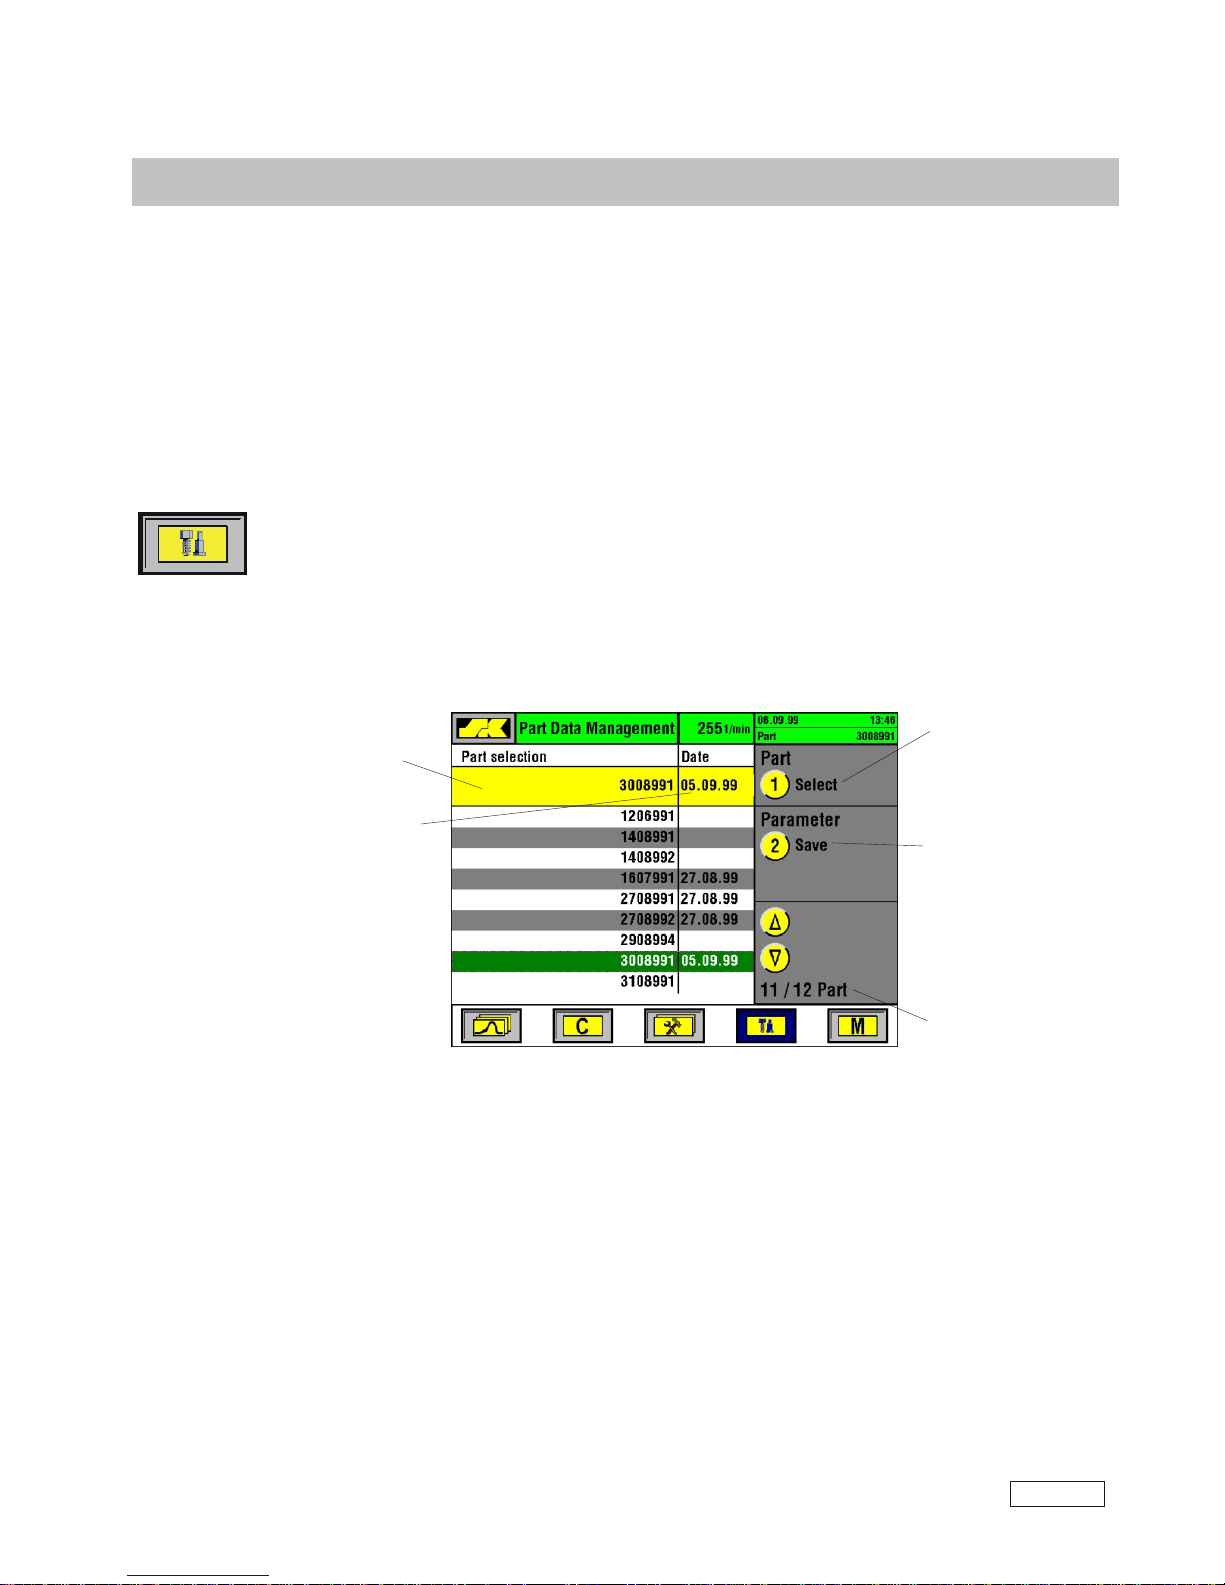
Part Data Memory (optional SKPartmaster)
The memory function of the SK bbx system allows one to store by part number important information relative to the setting parameters such as sensitivities, tolerances, timing windows, profile
zones etc., and to re-use them for repeat jobs. If your monitor is also equipped with the respective
optional features, the unit will also memorize the target force wave forms and the machine loading
profile.
Access to Part Data Memory
Access to enter a new part, to recall part data from memory, or to refresh data for an existing part
number is via the PARTS function key.
Every attempt to enter data (pressing 1 for picking a part number, or 2 for saving part data, followed
by E) is followed by a security question asking whether or not you really wish to make that entry:
- SELECT PART ? YES / NO
When you picked an existing part number (without data in memory), or
when you entered a new part number.
- LOAD PARAMETERS? YES / NO
When you picked a part with data in memory. Answering yes (press E-key) will re-load
and automatically activate that data (only possible while the monitor is in MAN or STOP).
This function is used when re-calling data from a previous run for a repeat job.
The upper yellow line
shows which part
is currently selected
The date marked
shows that and when
data has been
memorized for this
part.
Press 1 (Select Part) to:
- enter a new part number
- select an already existing
part number from the list
Press 2 (Save Parameter) to
store part data into the
memory:
- first set of data for a
new part
- overwrite data for an
existing part
Shows the position of the
cursor bar (example:
cursor is at part 11 out 12)
SK 7
V5.2 E 10/04
Part Data Memory (Partmaster)
SK7-32
Page 32
Part Data Memory (Partmaster)
- STORE PARAMETERS? YES / NO
When you wish to enter data for the selected part number the first time. Please note that
this is only permitted while the unit runs in AUTO mode. Normally, you want to memorize
data only after the part has run and performed well for a certain time (tooling run-in,
machine warmed-up, consistent material, etc.)
- OVERWRITE PARAMETERS? YES / NO
When you wish to refresh an existing set of data for the selected part number. This may
be the case when you have found better settings during a run or repeat run of that part.
Re-activating a previously produced part will do the following:
- reset all relevant parameters back to the settings of the previous run
- show you the former target force curves and your current forces (optional function)
- give you the load distribution diagram (old and new peak loads in comparison; optional function)
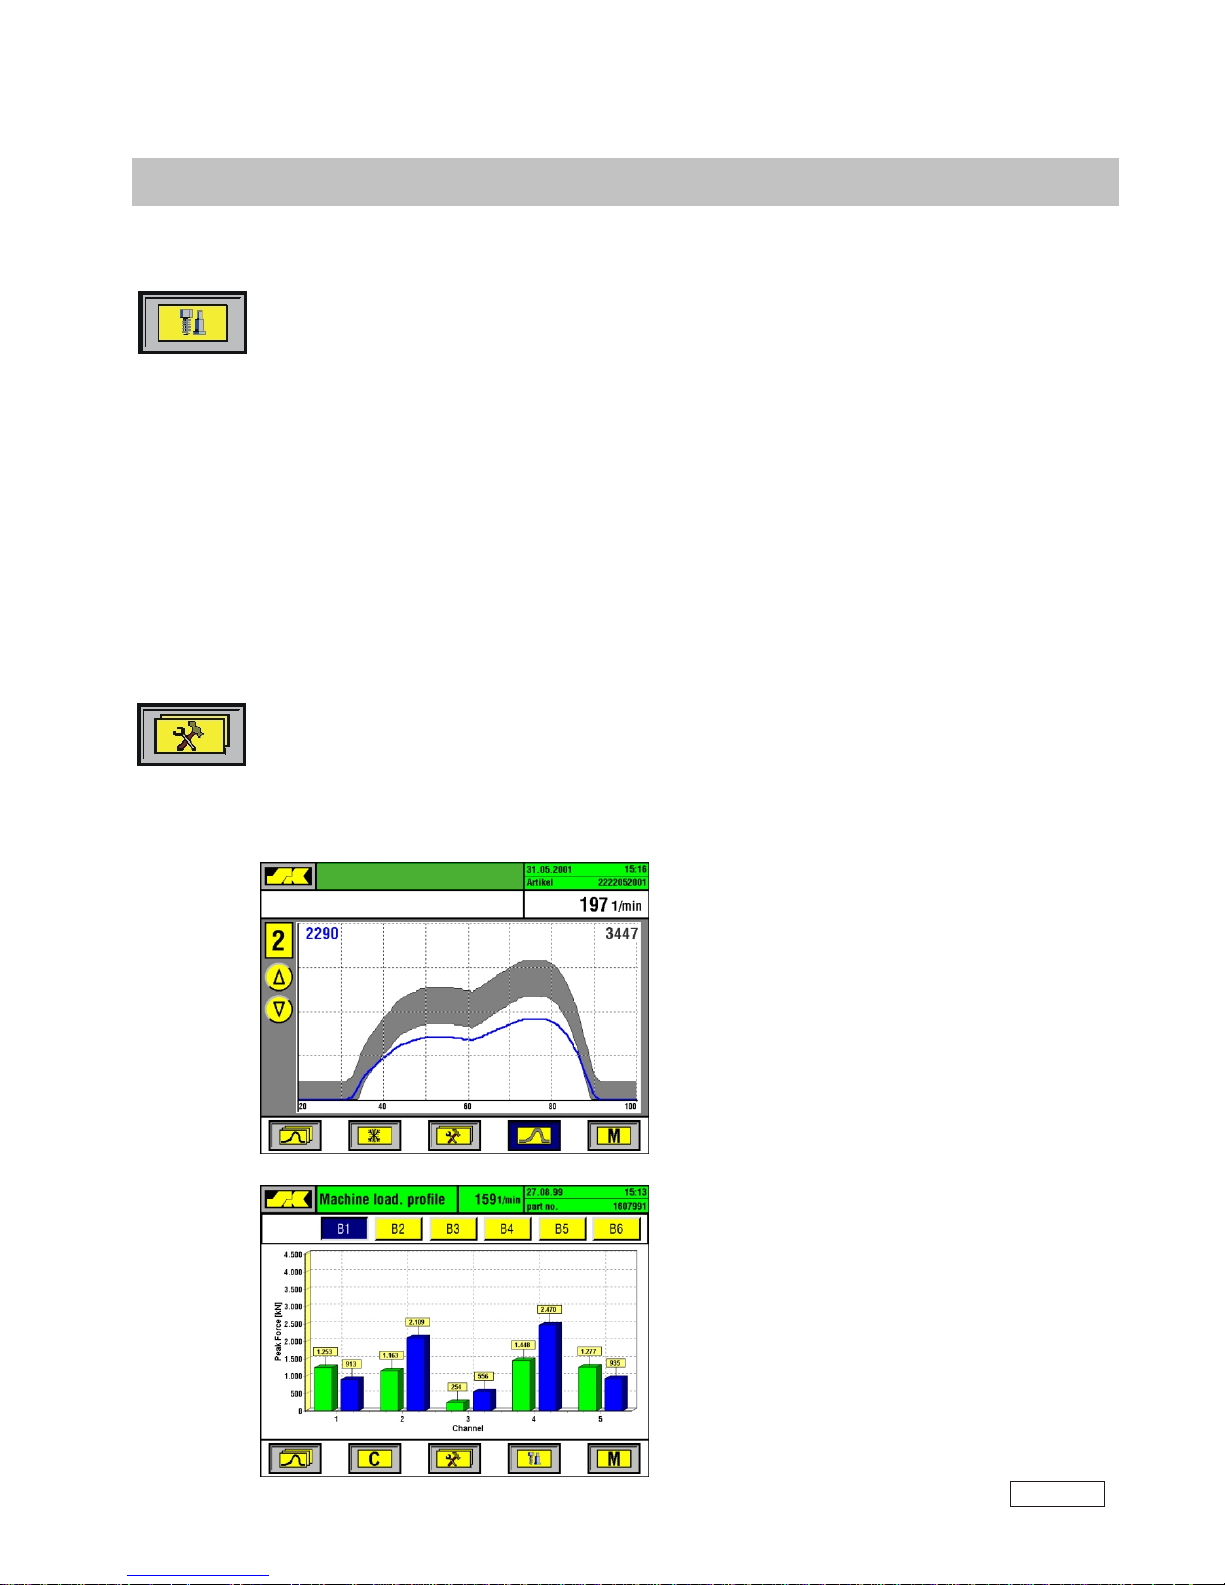
To see the target force curves versus your current forces press the TOOL function key. The graph
shows channel by channel (or in multi-channel presentation) how your current forces (blue lines)
compare against the memorized target area (gray envelope zone).
To see the load distribution diagram press M for Menu and then 6 for “Machine Loading Profile”.
Tool Performance / Target Force Curves
Shows the current force curve (in blue) vs the memorized
target forces from a previous run (stored on 31.05.2001).
The example here shows that channel number 2 is currently
working at much less load than before (peak force reading
now is 2290 vs. 3447 earlier).
Press the Curve function key to see the target curves
for all channels on one screen.
Machine loading profile
Shows for each channel the current peak force readings
(blue bars on the right side) vs the memorized previous
readings (green bars on the left side).
Target curve of 31.05.2001
Target curves
SK 7
V5.2 E 10/04
SK7-33
Page 33

Functions of Machine Interface
INTF1
General description
The machine interface serves as connection between the SK process monitoring systems and the
machine controls. Firstly, the interface contains a set of relays which are used to transfer switching
signals towards the machine (e.g. stop machine, flip sorting gate, etc.). Secondly, the interface has
terminal connectors which are used to input various digital signals from the machine, such as the
timing signal, finger-open signal on multi-die machines, ESA-input on hot formers, etc.). In
addition, the interface also provides through it’s built-in supply unit the 24 VDC power to the
IMPAX-SK unit.
Switching functions
The standard interface contains 6 relays rated at 12A/250VAC. Each relay offers normally-open and
normally-closed contacts. The LED next to the relay shows it's current status. If the LED is lit relay
coil is powered; if the LED is off the relay coil is powerless (low).
Relay #1 (Sorting) / Relay #2 (Batching):
Both relays are normally powered. They will drop to give the sorting or batching signal.
Relay #3 and #6 (Motor-Stop) / Relay #4 (Emergency Stop):
All 3 relays are normally powered. They will drop to switch the motor off or to switch emergency
stop. The “Motor Stop” relays #3 and #6 will switch every time the process monitor goes into
stop. Relay #4 "Emergency Stop" will be switched in addition with a delay of about 1 minute when
a stop signal is given during AUTO2-mode (unmanned shifts). This relay is typically used to switch
off every electrical component on the machine when it stops during unmanned shifts.
By-Pass key switch
The by-pass key switch located on the outside of the interface box will force all relays to stay in
their normal position. The process monitoring system can now be removed from the machine, and
the machine is able to run without the monitor. In case of total power failure inside the interface, all
relays must be bridged in order to run the machine without the monitoring system.
Good-part-made pulse output
The good-parts-made output pulses a short signal for every good part made when the machine is
running. Some data networking systems require such a signal to tell if the machine is running or
not. No output signal is given in case of machine downtime, or when the machine runs idle.
Digital inputs
The following digital inputs are reserved for fixed functions:
INI 1: timing signal input (proximity switch)
INI 2: second timing signal input, only needed for synchronization on rotary die headers!
(normally, prox switches are not connected here but inside the sensor box)
The other inputs are reserved for future functions.
Rev 2.0
V5.2 E 10/04
Page 34
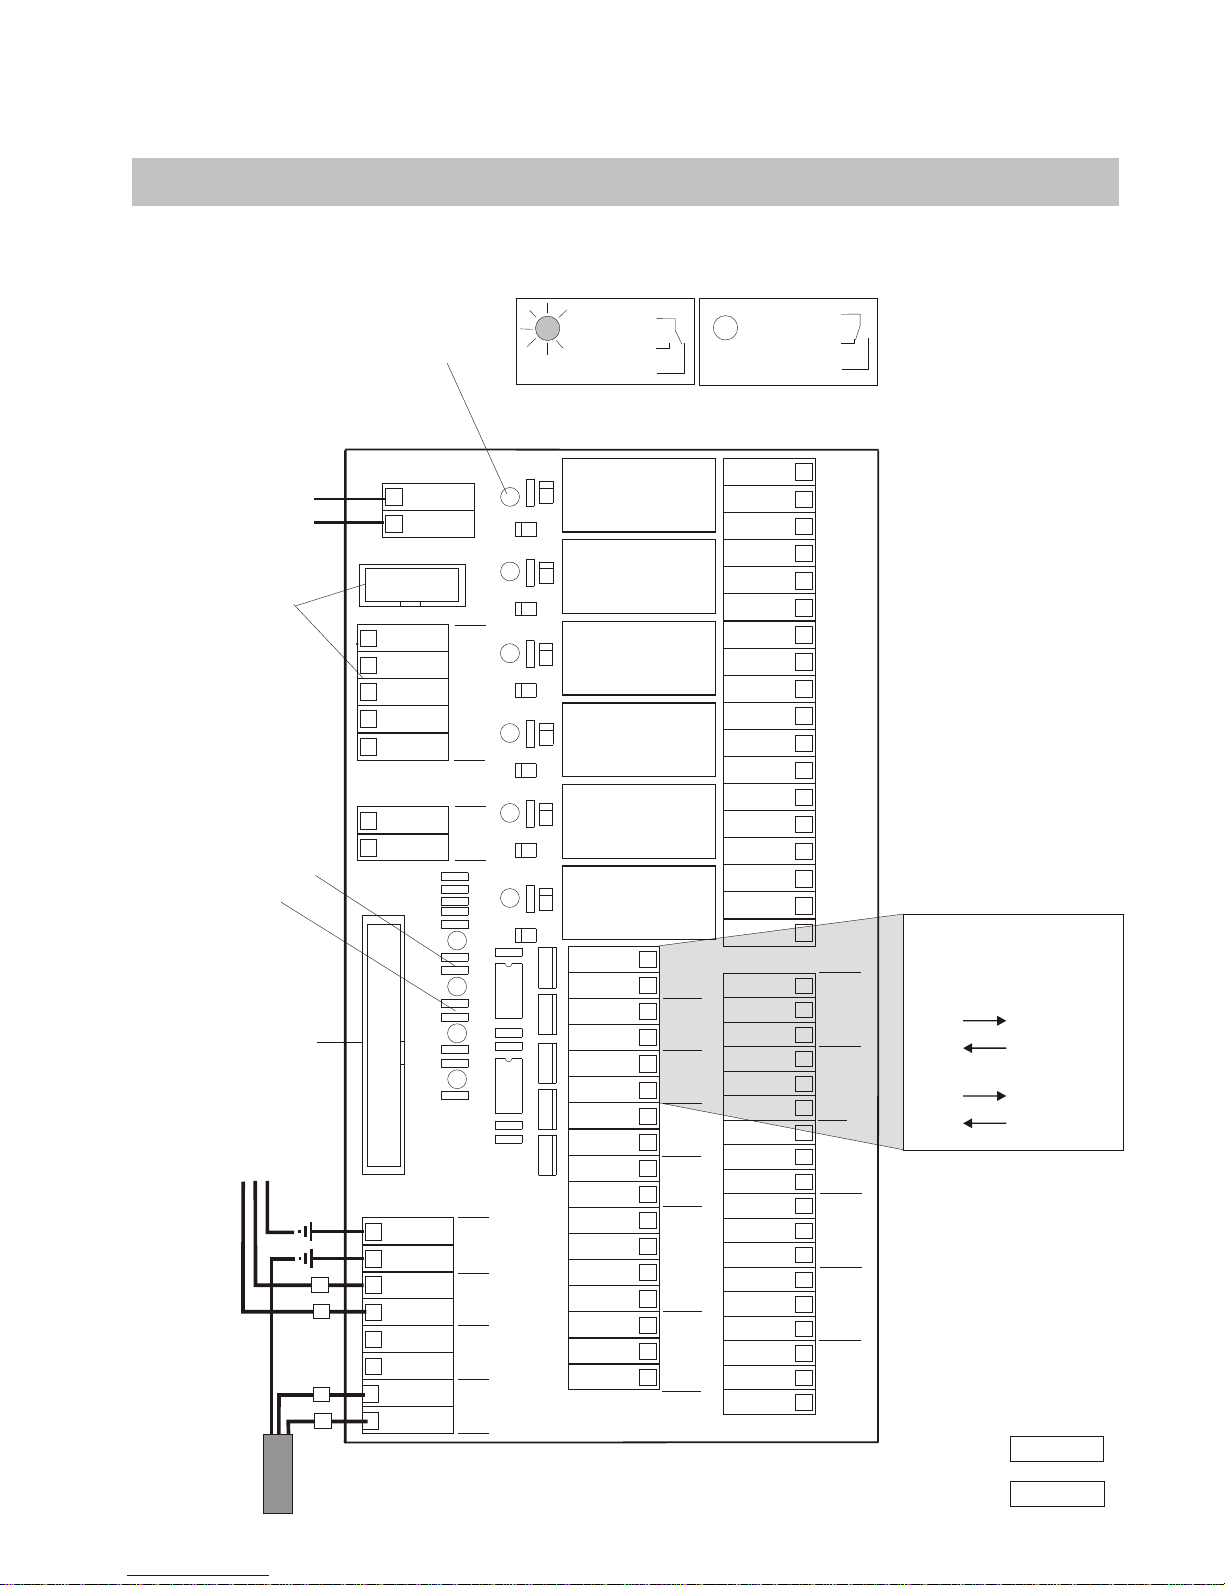
INTF-2
33
22
11
33
22
11
24 V
GND
- BDE 2
- BDE 1
+ BDE 2
+ BDE 1
Bypass
Key
Switch
Part-made pulse
feed external supply,
or use internal 24 VDC
feed external supply,
or use internal 24 VDC
1 pulse (20 ms long)
for each good part made
1 pulse (20 ms long)
for each mach. cycle
Machine interface connection (Rev 2.0)
34 pin
connector
to
SK-monitor
DUPLO
connectors
Control-LED for
stop relays:
Control-LED’s
for cycle
and part made
pulses
LED on
(Running)
LED off
(Stop)
Connection towards
machine controls
Standard configuration:
Relay 1: Sorting
Relay 2: Batching
Relay 3: Motor Stop
Relay 4: Emergency Stop
Relay 6: parallel with #3
(Motor Stop)
Relais 6
Relais 5
Relais 4
Relais 3
Relais 2
Relais 1
RELAY 5
RELAY 6
3
2
1
3
2
1
3
2
1
3
2
1
3
2
1
3
2
1
RELAY 4
RELAY 3
RELAY 2
RELAY 1
24 V
24 V
24 V
24 V
24 V
24 V
24 V
INI 1
GND
INI 2
INI 3
INI 4
INI 5
INI 6
GND
- BDE 1
- BDE 2
- BDE 3
- BDE 5
24 V
INI 8
INI 9
+ BDE 1
+ BDE 2
+ BDE 3
+ BDE 5
INI 7
24 V
GND
GND
Warnlampe
24 V
GND
MAN
GND
+24 V
GND
AUTO2
24 V
24 V
STOP
24 V
AUTO1
PE
PE
GND
GND
GND
GND
GND
Internal 24 V
Connection
Power (24 V) to SK-unit
.....................
.....................
.........
.........
1
1
2
2
Rev 2.0
V5.2 E 10/04
Page 35
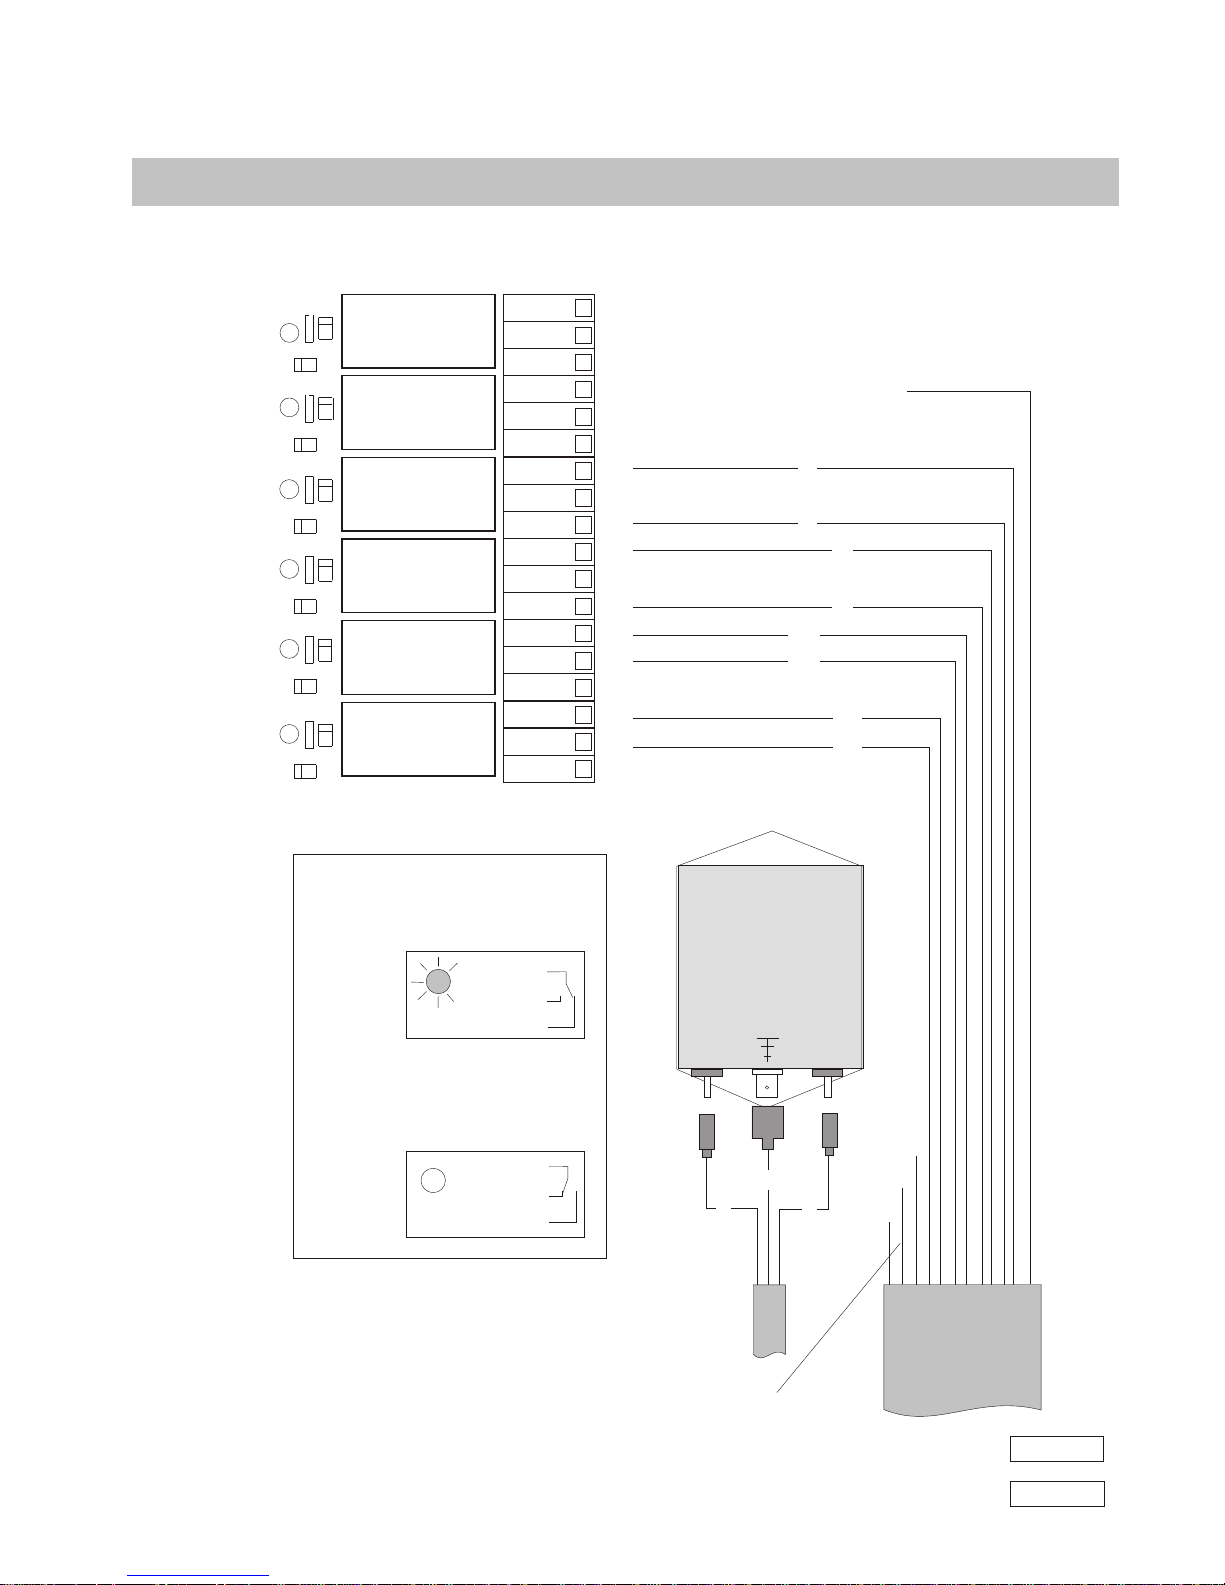
3
2
1
3
2
1
3
2
1
3
2
1
3
2
1
3
2
1
INTF-3
3
4
8
5
11
9
10
7
1
1
2
2
PE
PE
33
22
11
33
22
11
Relay 6
(Motor Stop)
Relay 5
Relay 4
(Emergency Stop)
Relay 3
(Motor Stop)
Relay 2
(Batching)
Relay 1
(Sorting)
Connection Interface - Machine Controls
Power filter
6 (free)
Power supply
85-260VAC
50/60 Hz
The leads 1, 2 and PE can also be used to
supply general AC power from machine controls
(if permitted by electrical safety codes)
12-lead cable
towards
machine
controls
LED on
(running)
LED off
(stop)
Normal relay position
(machine running)
Relay position for STOP and
during sort/batch pulse:
Rev 2.0
V5.2 E 10/04
 Loading...