

Page 1

Swiss Solutions since 1954
Design Patent Pending
®
Operating Instructions
Page 2

© 2016 Proceq SA 2
Contents
1. Safety and Liability ..................................................... 3
1.1 General Information ...........................................................3
1.2 Liability ...............................................................................3
1.3 Safety Instructions ............................................................3
1.4 Correct Usage ...................................................................3
2. Technical Specifications .............................................. 4
3. Operation ...................................................................... 6
3.1 Getting Started ..................................................................6
3.2 Main Menu .........................................................................8
3.3 Pundit PL-200 ...................................................................8
3.4 Pundit PL-200PE .............................................................22
3.5 Pundit 250 Array ..............................................................31
4. Explorer Document Handling ..................................... 42
5. Ordering Information ................................................. 43
5.1 Units .................................................................................43
5.2 Transducers .....................................................................44
5.3 Pundit Array Transducer Parts and Accessories ...........44
5.5 Accessories .....................................................................44
6. Maintenance and Support ......................................... 45
6.1 Maintenance ....................................................................45
6.2 Support Concept .............................................................45
6.3 Warranty Information .......................................................45
6.4 Disposal ...........................................................................45
7. PL-Link Software ....................................................... 45
7.1 Starting PL-Link ...............................................................45
7.2 Viewing the Data ............................................................46
7.3 Adjusting the Settings .....................................................48
7.4 Analysis of B-scans .........................................................48
7.5 Exporting Data .................................................................49
7.6 Further Functions ............................................................49
7.7 Conversion Curves ..........................................................50
7.8 E-modulus Calculator .....................................................50
Page 3

3 © 2016 Proceq SA
1. Safety and Liability
1.1 General Information
This manual contains important information on the safety, use and maintenance of the Pundit Touchscreen. Read through the manual carefully
before the first use of the instrument. Keep the manual in a safe place for
future reference.
1.2 Liability
Our “General Terms and Conditions of Sales and Delivery” apply in all
cases. Warranty and liability claims arising from personal injury and damage to property cannot be upheld if they are due to one or more of the
following causes:
• Failure to use the instrument in accordance with its designated use as
described in this manual.
• Incorrect performance check for operation and maintenance of the instrument and its components.
• Failure to adhere to the sections of the manual dealing with the performance check, operation and maintenance of the instrument and its
components.
• Unauthorised modifications to the instrument and its components.
• Serious damage resulting from the effects of foreign bodies, accidents,
vandalism and force majeure.
All information contained in this documentation is presented in good faith
and believed to be correct. Proceq SA makes no warranties and excludes
all liability as to the completeness and/or accuracy of the information.
1.3 Safety Instructions
The equipment is not allowed to be operated by children or anyone under
the influence of alcohol, drugs or pharmaceutical preparations. Anyone
who is not familiar with this manual must be supervised when using the
equipment.
• Carry out the stipulated maintenance properly and at the correct time.
• Following completion of the maintenance tasks, perform a functional
check.
1.4 Correct Usage
• The instrument is only to be used for its designated purpose as describe herein.
• Replace faulty components only with original replacement parts from
Proceq.
• Accessories should only be installed or connected to the instrument
if they are expressly authorized by Proceq. If other accessories are
installed or connected to the instrument then Proceq will accept no
liability and the product guarantee is forfeit.
The following statement applies to the products covered in this manual,
unless otherwise specified herein. The statement for other products will
appear in the accompanying documentation.
Page 4

© 2016 Proceq SA 4
NOTE! This equipment has been tested and found to comply
with the limits for a Class B digital device, pursuant to Part 15
of the FCC Rules and meets all requirements of the Canadian
Interference-Causing Equipment Standard ICES-003 for digital apparatus. These limits are designed to provide reasonable
protection against harmful interference in a residential installation. This equipment generates, uses, and can radiate radio
frequency energy and, if not installed and used in accordance
with the instructions, may cause harmful interference to radio
communications. However, there is no guarantee that interference will not occur in a particular installation. If this equipment
does cause harmful interference to radio or television reception, which can be determined by turning the equipment off
and on, the user is encouraged to try to correct the interference by one or more of the following measures:
• Reorient or relocate the receiving antenna
• Increase the separation between the equipment and receiver
• Connect the equipment into an outlet on a circuit different
from that to which the receiver is connected
• Consult the dealer or an experienced radio/T.V. technician
for help
This device complies with part 15 of the FCC:
Operation is subject to the following two conditions: (1) This device may not
cause harmful interference, and (2) this device must accept any interference
received, including interference that may cause undesired operation.”
This Class B digital apparatus complies with Canadian ICES-0003.
2. Technical Specifications
Pundit Touchscreen
Display 7” colour display 800x480 pixels
Memory Internal 8 GB flash memory
Regional settings Metric and imperial units and multi-lan-
guage and timezone supported
Power input 12 V +/-25 % / 1.5 A
Battery 3.6 V, 14 Ah
Battery lifetime > 8h (in standard operating mode)
Humidity < 95 % RH, non condensing
Operating temperature -10°C to +50°C
IP classification IP54
Dimensions 250 x 162 x 62 mm
Weight ~ 1.5 kg (incl. battery)
Standards and Directives CE certification
Pollution Degree 2
Installation Category 2
Page 5

5 © 2016 Proceq SA
Power Supply
Model HK-AH-120A500-DH
Input 100-240 V / 1.6 A / 50/60 Hz
Output 12 V DC / 5 A
Max. Altitude 2’500 m above sea level
Humidity < 95%
Operating Temperature 0°C - 40°C
Environment Indoor use only
Pollution Degree 2
Installation Category 2
Pundit PL-200 and PL-200PE
Range 0.1 – 7930 μs
Resolution 0.1 μs (< 793 μs), 1 μs (> 793 μs)
Display 7” colour display 800x480 pixels
Pulse Voltage UPV 100 Vpp – 450 Vpp
Pulse Voltage UPE 100 Vpp - 400 Vpp
Receiver Gain 1x – 10’000x (0 – 80dB) [11 steps]
Receiver Sensitivity 10 μV
Receiver Input Impedance 7 kΩ
Pulse Echo Range 0.1 – 1200 μs
Transducer Frequency 50 kHz
Aperture Size 2x25 cm
2
Bandwidth 20 – 500 kHz
Pundit 250 Array
Receiver
Gain 0 – 80 dB
Analog Bandwidth 15 kHz – 100 kHz
Nominal transducer
frequency
50 kHz shear wave
Range 0 – 1000μs
Resolution 1 μs
Transmitter
Pulse Voltage +/-150 V
Pulse Shape rectangle
Pulse Delay 8 ms – 200 ms
Power Supply
Batteries 6 x NiMH, Size AA, 2300 mAh (can be
replaced by the user)
Battery lifetime > 7 h
Mains 12 V – 15 V
Operating Time min. 7 h
Charging Time approx. 150 min
Page 6
© 2016 Proceq SA 6
Aperture
Number of Channels 8 (with upgrade option to 16)
Transducers per Channel 3
Wave Type shear wave, horizontally polarized
Center Frequency approx. 45 kHz
Transducer Bandwidth 80 % – 100 %
Channel distance 3 cm
Aperture Size 21 cm x 5 cm
Miscellaneous
Weight ~ 3 kg
Operating Temperature -10° – 50°
Humidity < 95 % RH, non condensing
Dimensions 240 x 273 x 153 mm
Laser used for positioning support
Camera 240 x 320 Pixel
3. Operation
The information provided in this manual covers all applications supported
by the Pundit Touchscreen.
3.1 Getting Started
Battery Installation Pundit Touchscreen
To install the Battery into the Pundit Touchscreen Unit, lift the stand as shown. Insert the
battery and fasten in place with the screw.
There are two status LEDs
1
(see page 11) and above them a light
sensor. The upper LED is red while charging and turns to green when it is
fully charged. The other LED is application specific.
NOTE! Only use the power supply provided.
• A complete charge requires approx. 9h (Instrument not operating).
• Charging time is much longer if the instrument is in use.
• An optional quick charger (Part No. 327 01 053) can be used to charge
a spare battery or to charge the battery outside of the instrument. In
this case it takes approx. 4h for a complete charge.
Page 7
7 © 2016 Proceq SA
Energy Saving
Energy saving may be programmed as desired under System/Power settings.
Connecting the Transducers
(G)
Connect the Transducers to the Pundit Touchscreen Unit using the BNC Adapter Cable
and the BNC Cables. Ensure that the screws
are fastened on the BNC adapter cable.
USB Host:
Connect a mouse, keyboard or USB stick.
USB Host
USB Device
Ethernet
Power Supply
USB Device:
Connect to a PC.
Ethernet:
Connection for firmware upgrades.
Power Supply:
Connect the power supply through this connection.
Buttons
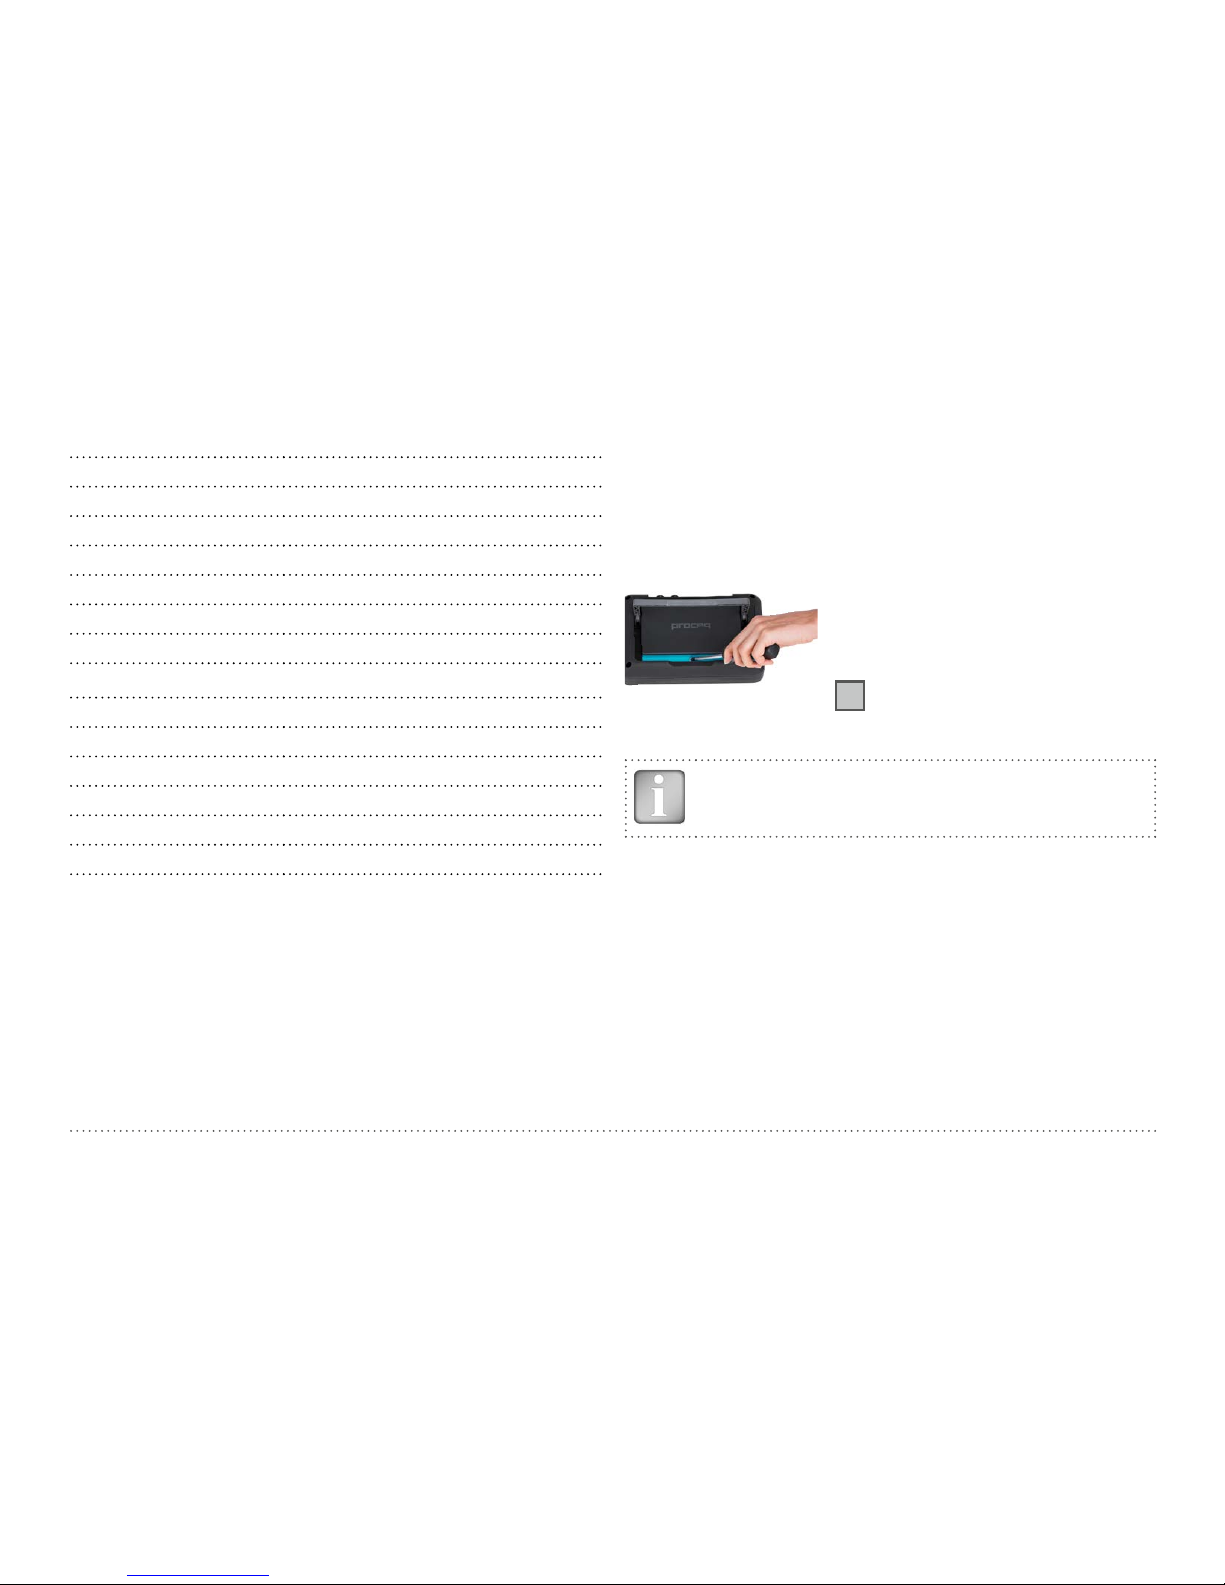
Lift the protective visor.
At the upper right of the screen there are three buttons
2
(see page 11).
Power On/Off – Press to power on. Press and hold to power off.
Soft Key – Open a pdf document (e.g. Operating instructions) or
toggle full screen view.
Back Button – returns to previous screen.
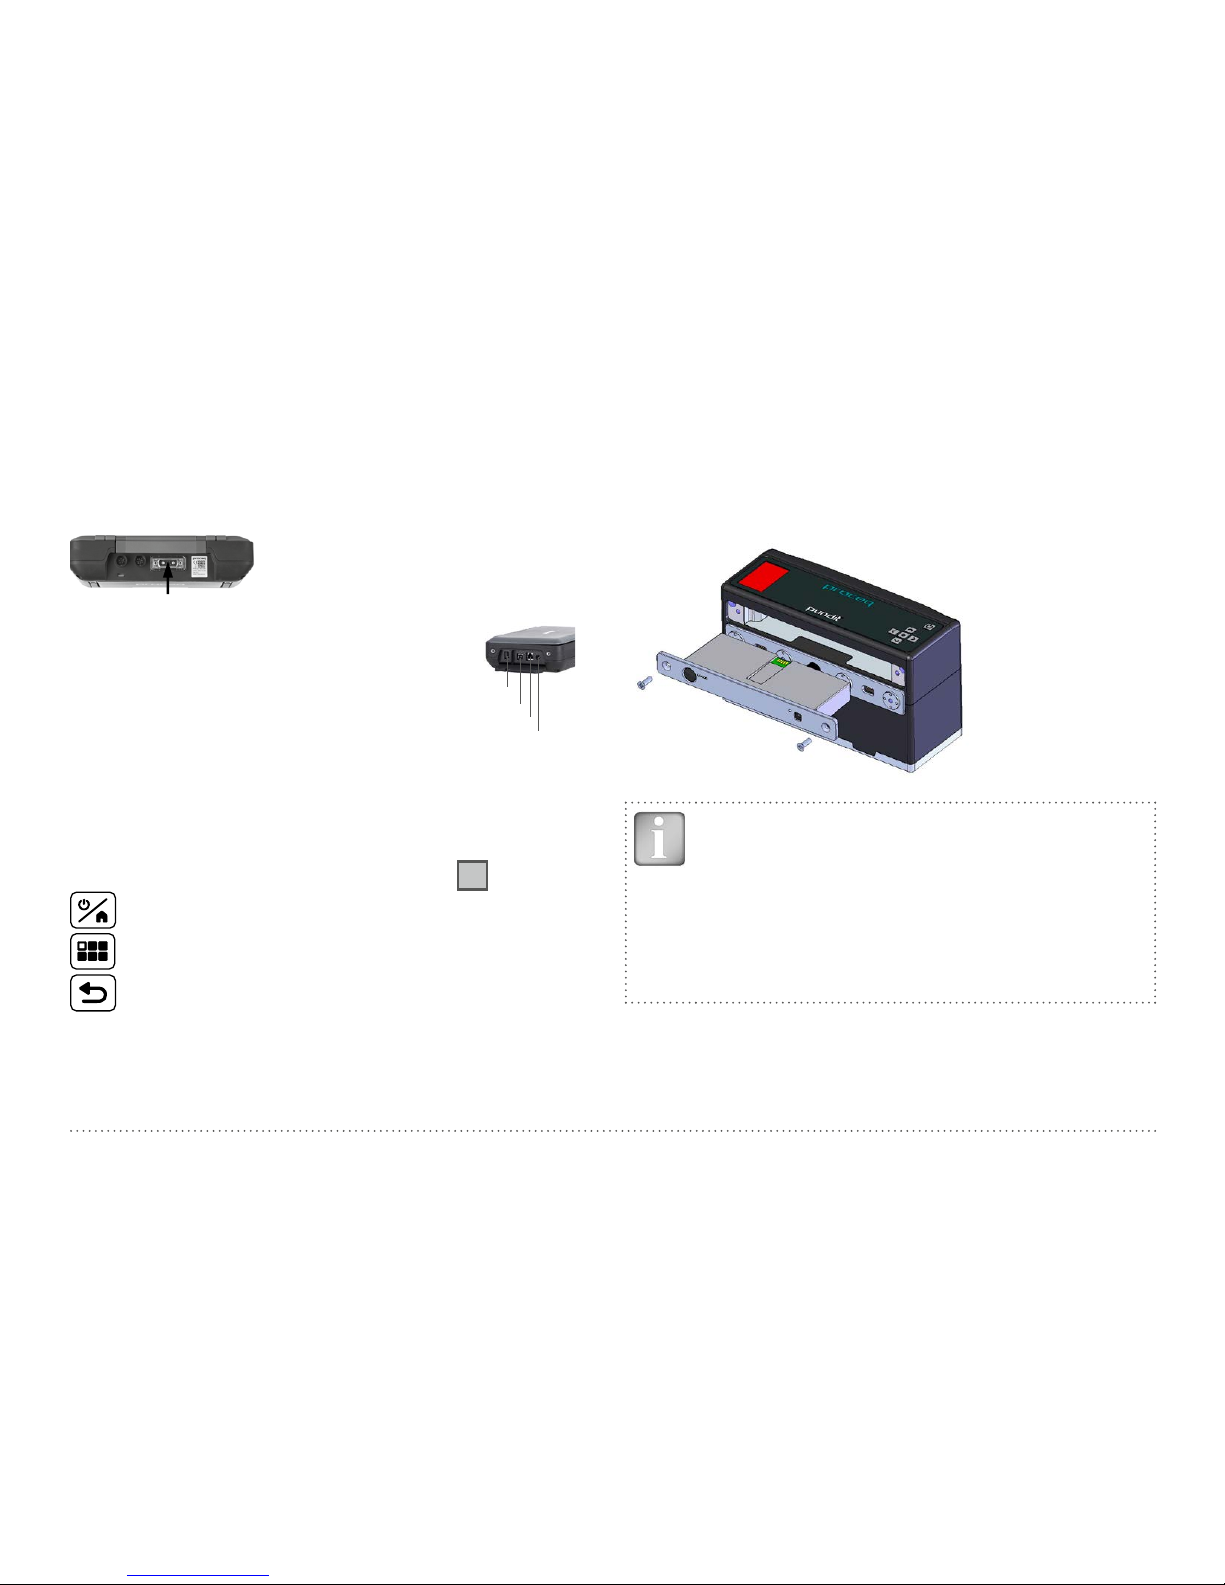
Battery Installation Pundit Array Transducer
Remove the battery pack from the Pundit Array Transducer by loosening
the two screws and pulling out the battery pack. On the underside there
is a plate which has to be removed by unscrewing two screws to access
the battery compartment.
NOTE! Insert the six AA NiMH rechargeable batteries into the
battery pack being sure to observe the correct polarity and
replace into the Pundit Array Transducer. Before first use, fully charge the batteries using the charger provided. While the
battery is charging the status LED is green. It will extinguish
when fully charged. A full charge takes about 2.5 hours.
By pressing and holding the fuel gauge button, the actual
charge statues can be seen. Each LED represents 20%
charge, so all 5 LEDs lit indicates a charge of more than 80%.
Page 8
© 2016 Proceq SA 8
Any AA batteries may be used with the instrument, but the fuel gauge is
only accurate when the recommended NiMH batteries are used.
WARNING!
If standard alkaline batteries (non-rechargeable) are used, it is
very important not to connect the charger as this will result in
damage to the instrument.
3.2 Main Menu
On start up the main menu containing 6 icons is displayed.
Measurement:
Application specific measurement screen.
Settings:
For application specific settings.
Explorer:
File manager functionality for reviewing measurements saved on the instrument.
System:
For system settings, e.g. language, display options, power settings.
Information:
For device information and operating instructions.
Exit:
Power Off.
All functions may be accessed directly via the touch screen. Return to the
previous menu by pressing the back button or the return icon (arrow) at
the top left of the touch screen.
3.3 Pundit PL-200
Scroll up and down the screen by dragging your finger up or down the
screen. The current setting is displayed on the right hand side. Tap on an
item to adjust it.
Transducer
Connected transducer
Select the frequency of the transducer to be used. The custom transducer setting allows non-standard transducers up to 500 kHz to be used.
If this option is selected, the transducer frequency must also be entered.
NOTE! When a transducer frequency is selected, the factory
settings are automatically loaded for that transducer, based
on 1.5m cables being used. Generally, the accuracy this provides is sufficient for most applications, so zeroing is not required with this configuration.
Zeroing Transducer
For increased accuracy or when working with different cable lengths, the
Pundit PL-200 should be zeroed.
Enter the expected calibration value as it is
marked on the Calibration Rod.
Page 9
9 © 2016 Proceq SA
Couple the transducers to the Calibration Rod using the ultrasound Couplant
and press firmly together.
Tap on the start icon to carry out the zeroing.
On completion “Zeroing succeeded” will be displayed.
Tap to return to the settings menu.
Tap to return to the zeroing start screen.
Tap to reload the factory calibration values for the
transducer. This setting provides sufficient accuracy for
most measurements, but for exact zeroing, perform the
procedure described above.
Measurement Settings
Measurement Range
Short range (default). For measurements up to approximately 800 μs.
This corresponds to a path length of approximately 3 m for normal concrete. This provides the maximum measurement resolution of 0.1 μs.
For larger objects select the long range. In this case the measurement
resolution is 1 μs.
The measurement screen indicates (--- μs) if a measurement is out of
range.
Pulse Repetition Frequency
Pulse Repetition Frequencies (PRF) of 5 Hz to 40 Hz (measurements per
second) may be selected. High values should be selected only when the
instrument is used on large objects with high receiver amplification settings. In such cases, it helps to increase the update rate on the display.
For general concrete or ceramic materials testing a PRF of between 1030 Hz is normally used.
The transducers supplied with the instrument are not damped and, therefore, on being excited by the transmitter they have a long ring-down time.
The ring-down time may exceed the pulse interval when the PRF is set
to high values, i. e. the previous pulse may still be ringing as the next
pulse arrives. This effect may cause errors when testing short path length
specimens having low internal damping. If this occurs reduce the PRF.
Line Scan
Line Scan provides the capability to measure along a linear grid at equal
spacing. The distance between the transducers may be varied for each
measurement to accommodate irregular shaped objects (see “3.4.2
Measurement Modes” – Line Scan).
Series Length
Set the number of measurements to be made or leave it open ended.
Distance between Measurements
Set the spacing.
Unit
Choose between pulse velocity or transmission time as the unit for the
graphical display of the results.
Page 10
© 2016 Proceq SA 10
Units
Unit
Choose between metric and imperial units.
Amplitude Unit
Choose to display the receive signal amplitude either as a percentage or
in decibels.
Compressive Strength Unit
Choose the unit for compressive strength correlations.
E-modulus Unit
Choose the unit for E-modulus calculations.
E-modulus Density Unit
Choose the unit for entering density for E-modulus calculations.
Trigger
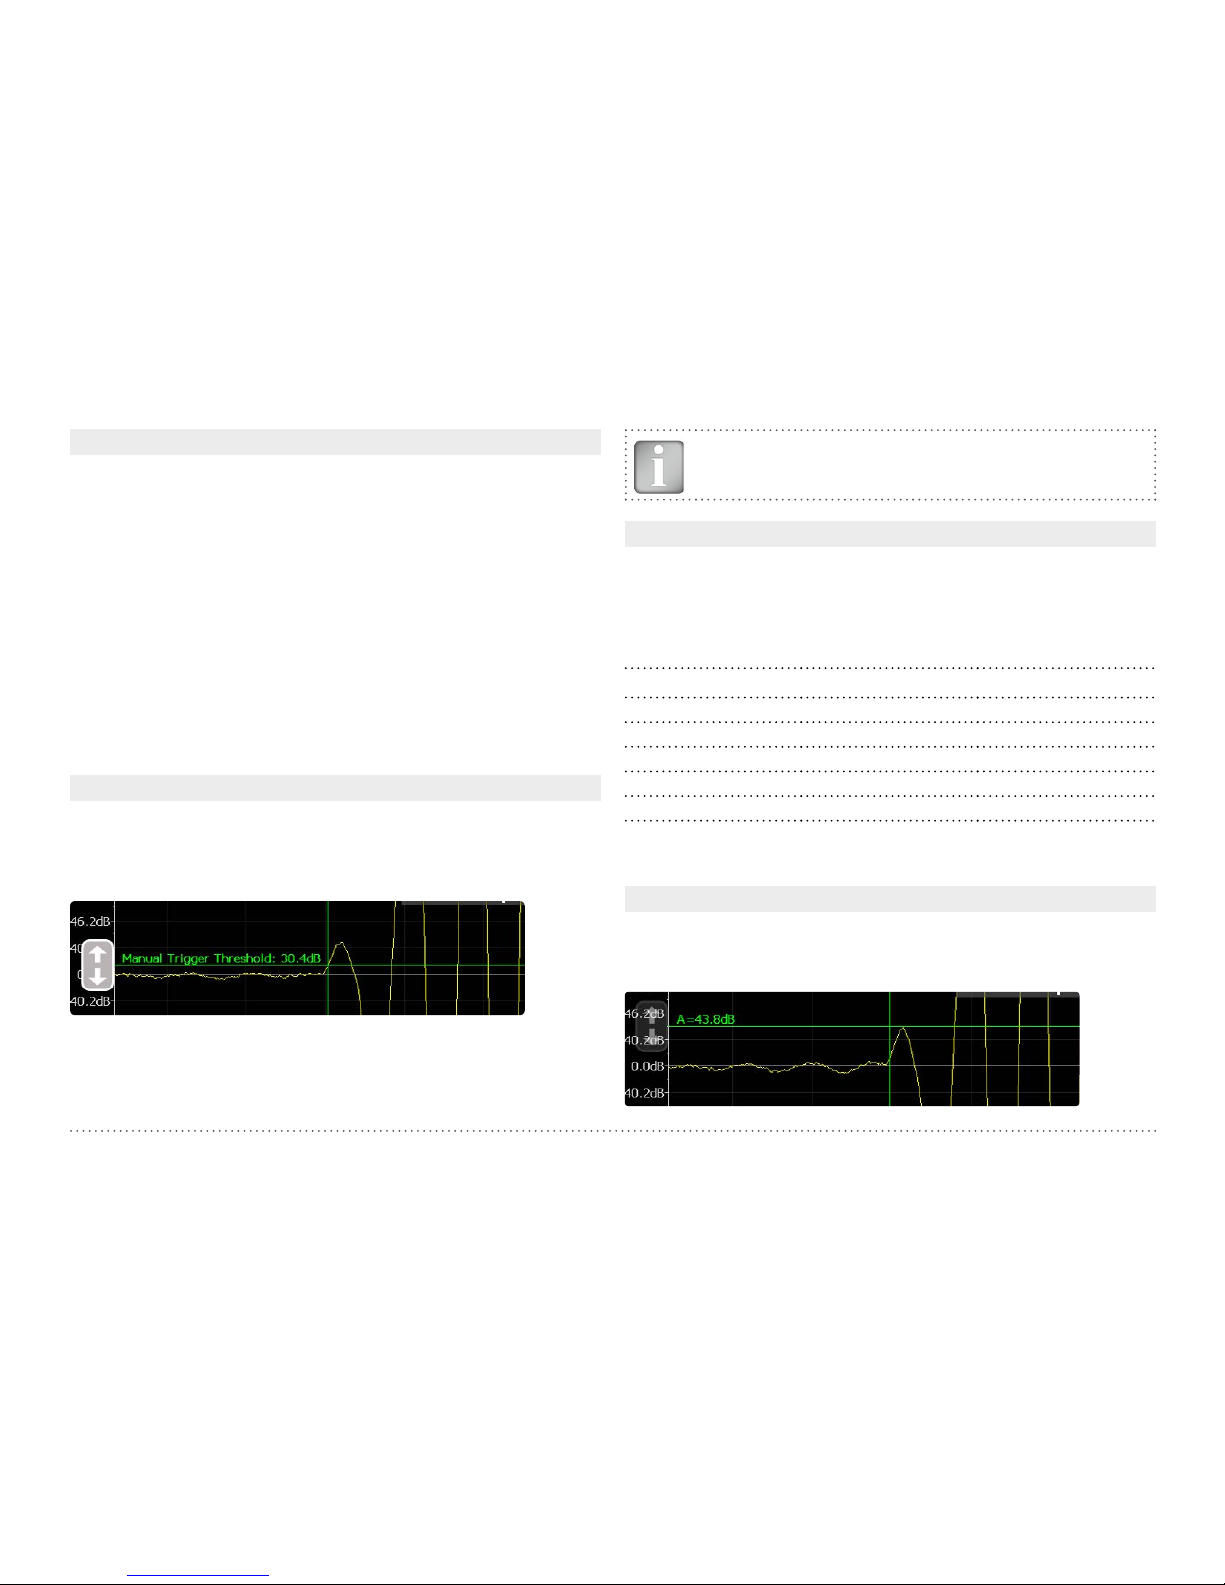
Amplitude Trigger
When selected, allows a user defined amplitude threshold for triggering.
Drag the horizontal cursor to the desired trigger level. The zoom function
is useful to set a specific trigger threshold.
Follow Trigger
When selected, the point at which the trigger occurs is always displayed
in the centre of the screen, irrespective of the measured transmission
time. This does not apply if manual triggering or dual cursor triggering is
being used (see “3.3.1 Measurement Screen”).
NOTE! Both triggering options can be selected at the same
time. If none are selected then the triggering is carried out
automatically as normal.
Corrections
Temperature correction UPV
Pulse velocity measurements are affected by several factors. Two key
factors are the moisture content of the concrete and the temperature.
The table below shows the correction factor that should be entered
based on the recommendations made in BS 1881: Part 203.
Temperature Dry concrete Wet concrete
10 °C – 30 °C 1.0 (No correction) 1.0 (No correction)
60 °C 1.05 1.04
40 °C 1.02 1.02
0 °C 0.99 0.99
-4 °C 0.98 0.92
The correction factor is applied to pulse velocity calculations. The measured transmission time is unaffected.
Amplitude Analysis
Marker
When selected a marker is activated that can be used to record the amplitude of the received signal (see”3.3.5 Measuring with Pundit PL-200”).
Page 11
11 © 2016 Proceq SA
Area Scan
Raster X: set the grid spacing for the X-axis.
Raster Y: set the grid spacing for the Y-axis.
Measurement count X: Set the number of measurements to be made
in the X-direction.
Measurement count Y: Set the number of measurements to be made in
the Y-direction.
Colour Scheme: Select the colour scheme (can be adjusted later in the
explorer).
Result: Select the measurement parameter you wish to display.
Auto Color Range: On or off. If not selected then the user may define
minimum and maximum settings for the colour range and these may also
be adjusted later in the explorer. The color scheme may also be inverted
by setting the maximum value lower than the minimum.
Data Logging Mode
Interval: Select the interval between measurements. (Minimum interval
is 1 minute).
Number of events: Until the test is completed. (Maximum number of
events is 3000).
Averaging: Determines the number of readings to be taken and averaged at each interval measurement.
Result: select transmission time or pulse velocity.
Distance between transducers: This must be set if pulse velocity is
selected as the test result unit.
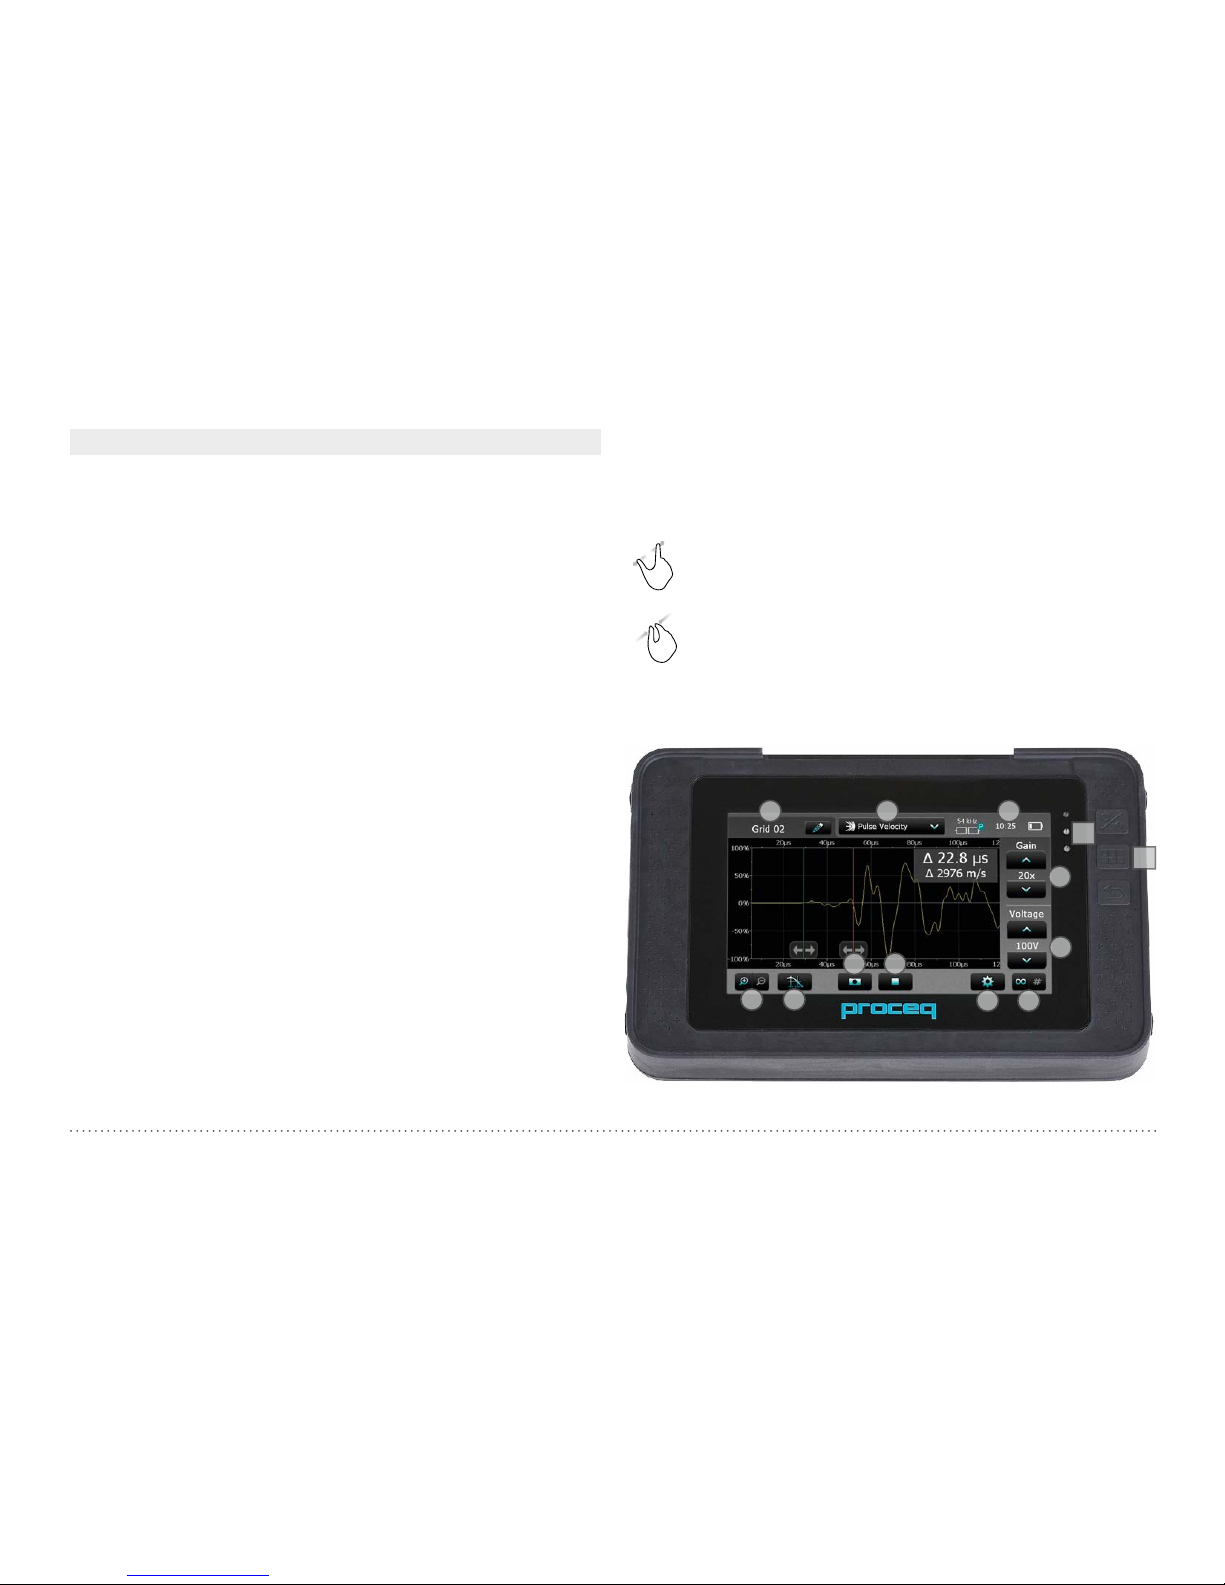
3.3.1 Measurement Screen
The standard measurement screen is shown. All settings are directly accessible from the measurement screen.
Zoom
Zoom in by placing thumb and index finger together on the
screen and spreading them apart. This can be used in both the
horizontal and vertical directions when making a measurement.
Zoom out by placing thumb and index finger apart on the
screen and pinching them together.
Pan
Pan the image from left to right by dragging.
1
1
2
3
4
5
6
7
8
9
10
11
2
Page 12

© 2016 Proceq SA 12
Measuring screen controls
1
Filename: Enter the file name and press return. Saved measure-
ments will be stored with this file name. If several measurements are
made under the same file name, a suffix increments after each measurement.
2
Measurement mode: Select the type of measurement to be carried
out (see section “3.4.2 Measurement Modes”).
3
The top right hand corner of the display shows the current trans-
ducer selected, current time and the battery status.
4
Gain: Adjust the receiver gain, from 1x up to a maximum of 10 000x.
5
Voltage: Adjust the transmitter voltage. For best results, it is best to
begin with low transmitter voltage and a low gain setting. Then increase
until a stable signal level is achieved. Signal clipping should be avoided.
6
Continuous/Burst Transmission:
Continues transmitting until the stop icon is pressed.
Records a measurement as soon as a stable signal is
detected.
7
Settings: Enter the settings menu.
8
Stop/Save:
Stop the current measurement.
Save the current measurement.
Save the current series and continue the measurement.
9
Start/Snapshot:
Begin the measurement.
Save the current measurement as displayed on the
screen and continue measuring.
10
Cursor Selection:
Automatic triggering.
Note: In data logging mode triggering is always
automatic, but may be adjusted manually in PL-Link.
Manual triggering. Set the cursor position manually, by
dragging it to the left or right. The trigger position may also
be adjusted later on the saved waveform in the Explorer.
Dual cursor. Transmission time mode only. Both cursors
have to be set manually. The second cursor is particularly useful when measuring with shear wave transducers.
Dual cursor is selected automatically when measuring in
E-modulus mode.
11
Zoom:
Zoom in and out of the current measurement.
Page 13
13 © 2016 Proceq SA
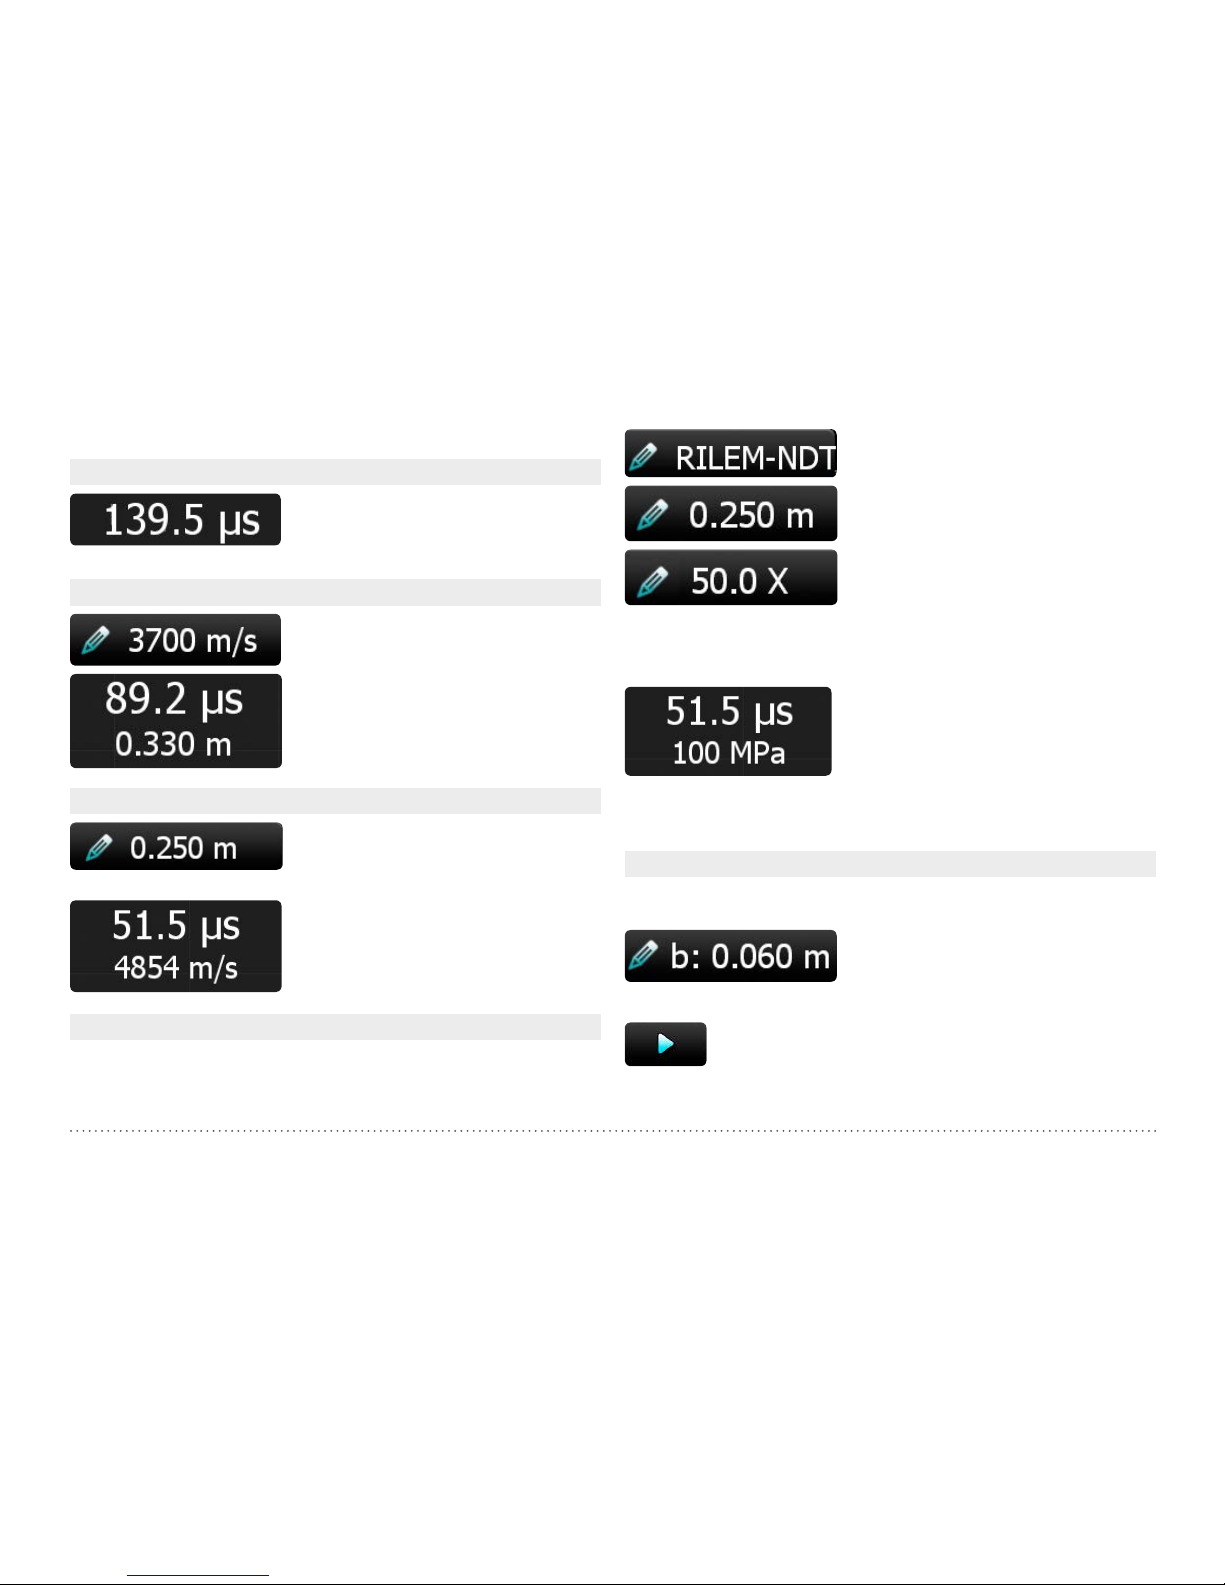
3.3.2 Basic Measurement Modes
Transmission Time
The measured transmission time between the transducers.
Distance
Enter the pulse velocity of the material
under test.
Result is the transmission time and the
distance between the transducers.
Pulse Velocity
Enter the distance between the transducers.
Result is the transmission time and
the pulse velocity of the material under
test.
Compressive Strength
Prior to carrying out this measurement, a conversion curve valid for the
concrete under test must be created in PL-Link and downloaded to the
instrument.
Select the correlation curve.
Enter the distance between the transducers.
If a SONREB curve is selected, enter the
rebound value determined at the same location as the pulse velocity measurement.
SONREB is a method of combining an ultrasonic pulse velocity measurement with a rebound hammer measurement to improve the accuracy of
compressive strength estimation.
Result is the transmission time and the
compressive strength of the material
under test.
3.3.3 Special Measurement Modes
Crack Depth
The crack depth measurement implemented in Pundit PL-200 is in accordance with the method described in BS 1881:Part 203.
Enter the distance ‘b’ as indicated in
the diagram shown on the screen.
Position the transducers as shown in ‘Step 1’ on the screen.
Measure t1.
Page 14

© 2016 Proceq SA 14
Position the transducers as shown in ‘Step 2’ on the screen.
Measure t2.
Result shows the transmission times
t1 and t2 and the crack depth ‘d’.
An incorrect measurement of t1 or t2
may be deleted and repeated before
continuing.
An error message is displayed for an
invalid measurement
(t2 < t1 or t2 > 2 x t1).
NOTE! For this method to give good results, the crack must
be perpendicular to the surface. It must also be free of water
or debris which would allow the wave to propagate through
the crack. The crack must be sufficiently wide to prevent the
wave from simply propagating around it. There must also be no
rebars within the vicinity of the crack. If any of these conditions
occur, the result will be severely affected and it may appear that
the crack depth is much shallower than is actually the case.
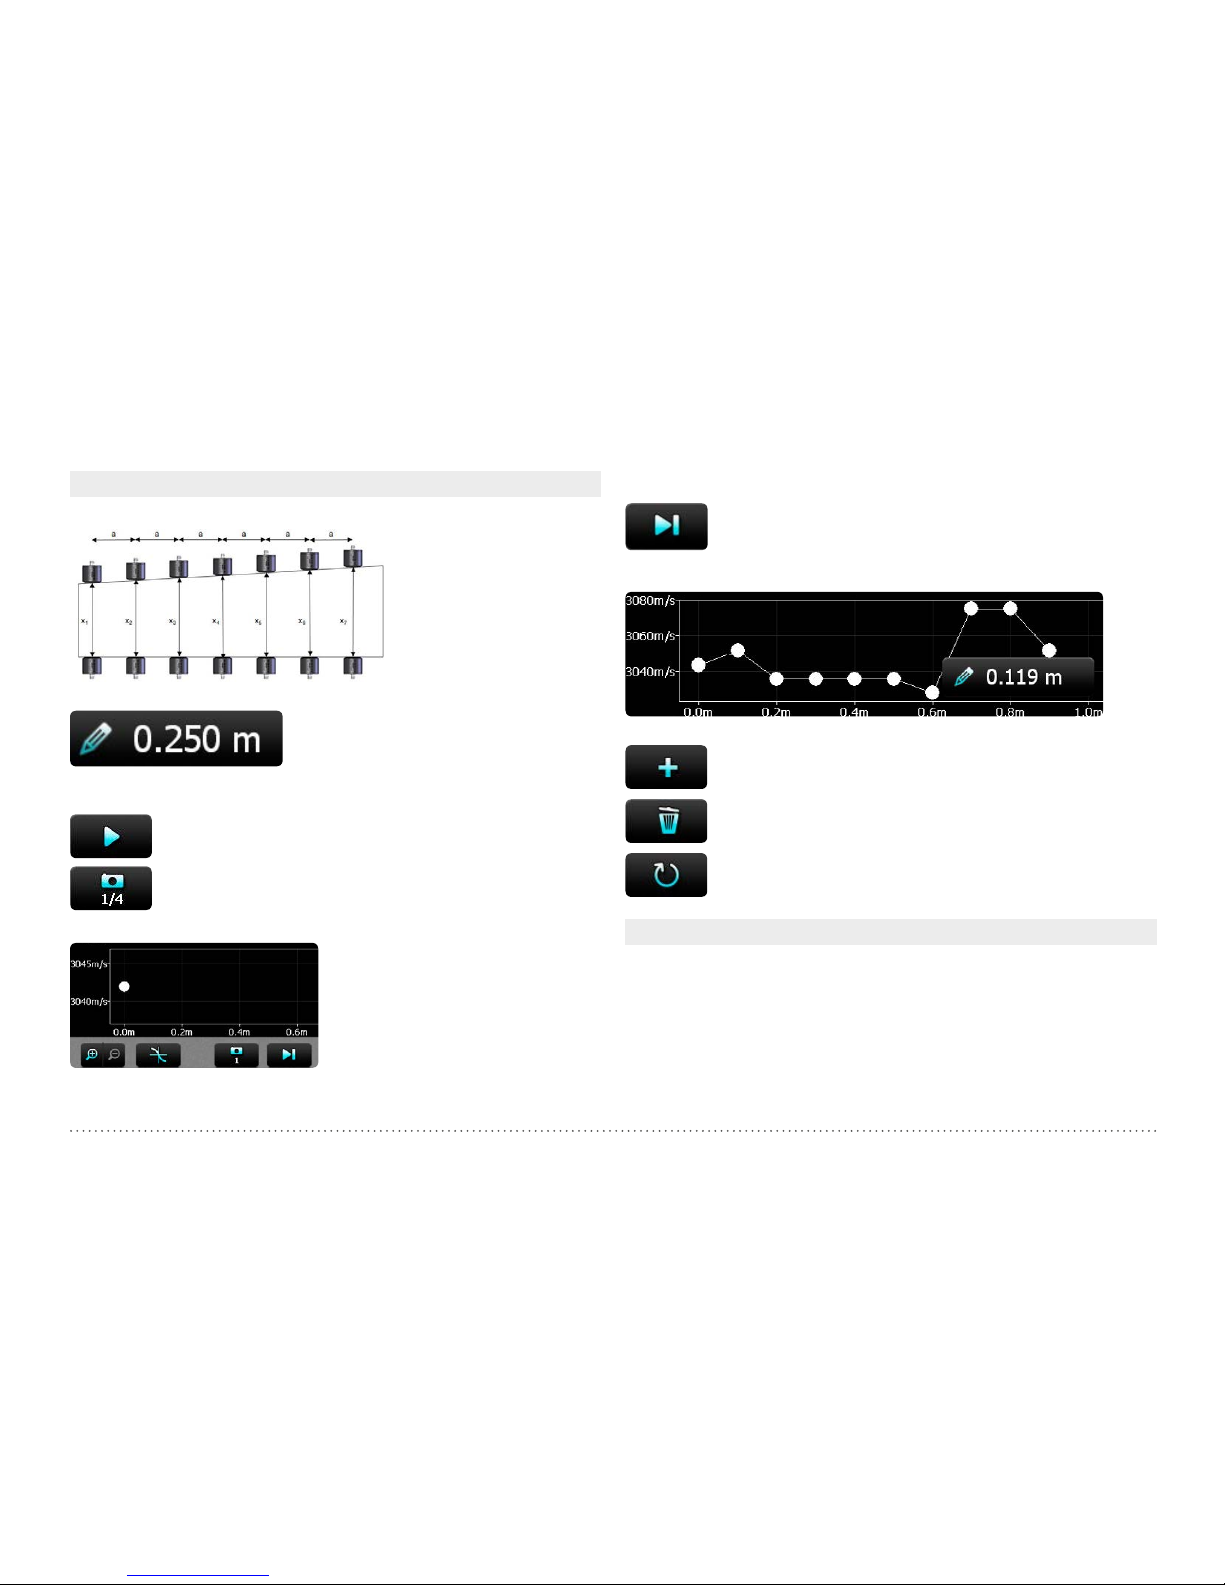
Surface Velocity
The surface velocity measurement implemented in Pundit PL-200 is in
accordance with the method described in BS 1881:Part 203.
The transmitter remains in a fixed position. The receiver is moved at a
fixed interval.
Enter the distance ‘b’ as indicated in the
diagram shown on the screen.
Enter the number of measurements to
be made.
Measure the transmission time at distance ‘b’.
Record the first measurement at distance ‘b’.
Move the receiver a further distance ‘b’ and measure again. Continue
until you have completed the series.
The pulse velocity is calculated from the slope of the curve.
NOTE! If the points recorded show a discontinuity, it is likely
that a surface crack or surface layer of inferior quality is present. In this case the measured velocity is unreliable.
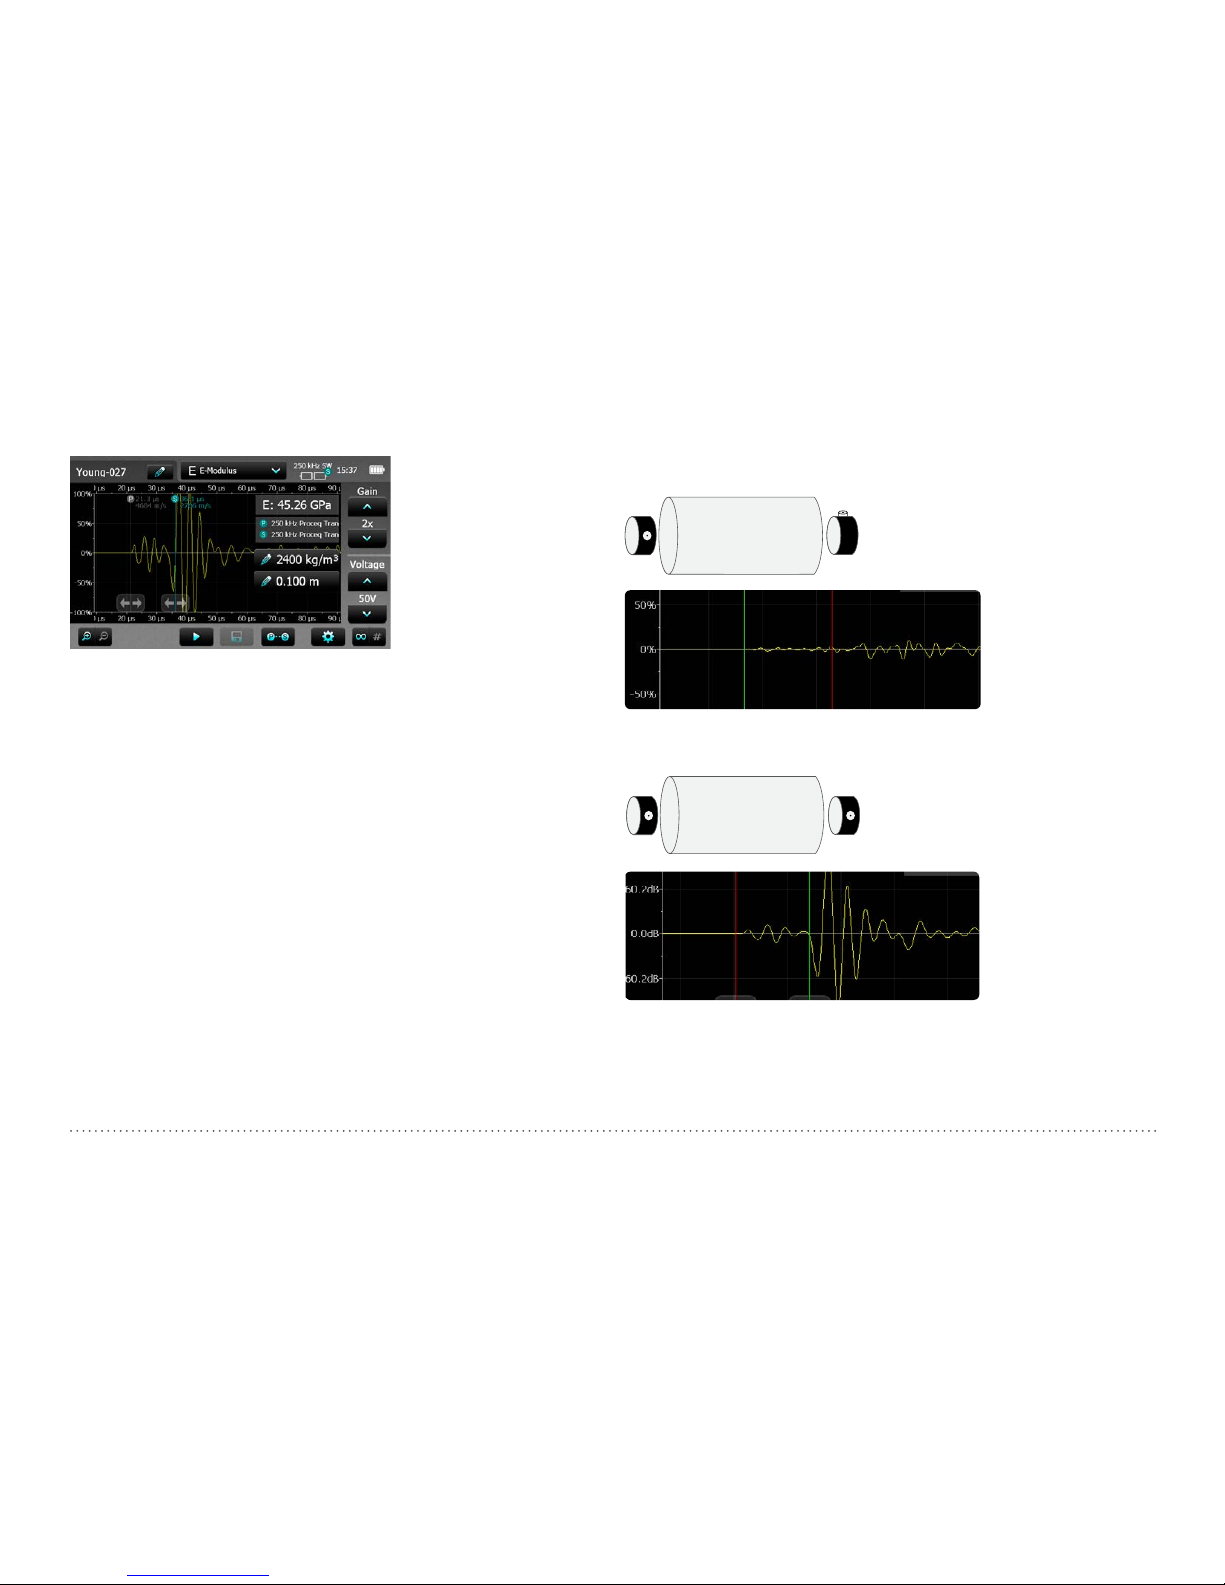
E-Modulus
The dynamic E-modulus and the Poisson’s Ratio of a material (e.g. concrete or rock) may be determined by measuring the P- and S-wave pulse
velocities. The method is described in the following two standards and is
equally applicable to concrete or other solids:
ASTM D 2845 – Standard Test Method for Laboratory Determination of
Pulse Velocities and Ultrasonic Elastic Constants of Rock.
ISRM – Aydin A., Upgraded ISRM Suggested Method for Determining
Sound Velocity by Ultrasonic Pulse Transmission Technique: Rock Mech
Page 15
15 © 2016 Proceq SA
Rock Eng (2014) 47:255-259, DOI: 10.1997/s00603-013-0454-z).
The dual cursor mode is
automatically activated.
Use the first cursor to mark
the onset of the P-wave
component.
Use the second cursor to
mark the onset of the Swave component.
In order to calculate the
E-modulus it is necessary
to enter the density of the
material.
When downloaded to
PL-Link, the Poisson’s
Ratio of the material is also
calculated.
P-waves vs. S-waves
In a P-wave (longitudinal wave) the particle displacement is parallel to
the direction of wave propagation. The particles oscillate back and forth
about their individual equilibrium positions. In an S-wave (shear wave) the
particle displacement is perpendicular to the direction of wave propagation. The particles oscillate up and down about their individual equilibrium positions as the wave passes by.
Measuring with S-wave Transducers
Detection of the shear wave (S-wave) requires the use of the waveform
display in order to manually locate the onset of the shear wave echo as
it is always preceded by a weak P-wave component that is detected by
the automatic triggering.
S-waves travel in a one-dimensional plane. The strongest signal appears
when the transducers are correctly aligned. This property can be used
to correctly detect the S-wave component of the received signal. When
measurements with the 250 kHz shear wave transducers are performed,
it is crucial to use the special shear wave coupling paste, otherwise shear
waves cannot be properly transmitted into the object under test.
Misaligned by 90°
Weak S-wave component
Weak S-wave
component with
the transducers
misaligned.
Rotate one transducer into and out of alignment and watch the S-wave
component increase and decrease.
Correctly aligned
Strong S-wave component
Much stronger
S-wave component
when the
transducers are
correctly aligned.
Page 16
© 2016 Proceq SA 16
3.3.4 Multi-Measurement Modes
Line Scan
The distance ‘a’ is entered in the ‘Settings’ menu.
Position the transducers at the starting position and enter the distance x1.
(Not required if transmission time only is
being measured.)
Press the start icon to begin.
Press the snapshot icon and record the first measurement. If burst mode is selected this will be recorded
automatically.
Move the transducers the distance ‘a’ to the next point on the grid.
If the distance ‘x’ does not change press the snapshot icon again to
make the second measurement and so on.
Press this icon to save the current series. If the distance ‘x’ is different at the new position a new value
may be entered before proceeding with the scan.
Enter the new distance ‘x’.
Press to continue the scan.
Use this icon to delete the last measurement made.
Press the to save the current series and reset the instrument for a new series.
Area Scan
Area scan allows a 2D visualization of an element based on pulse velocity, transmission time or distance measurements. The measurement
grid is defined in ‘Settings.’ If the expected variation of the measured
parameter is not known then select ‘Auto color range.’ This may be subsequently adjusted in the explorer. If the expected range is known, the
color range may be defined by setting a maximum value and a minimum
value. E.g. The Indian standard IS 13311 defines pulse velocity bands for
concrete quality classification.
Page 17

17 © 2016 Proceq SA
> 4’500 m/s: Excellent
3’500 – 4’500 m/s: Good
3’000 – 3’500 m/s: Medium
< 3’000 m/s: Doubtful
Setting the maximum speed to 4’500 m/s and the minimum speed to
3’000 m/s provides a simple visualization of areas of the structure that
require attention.
The cursor position indicates the position of the next measurement. Ensure that this aligns with a grid drawn out on the test structure.
You may drag the cursor to the position
on the grid where you wish to start measuring. Arrows indicated the direction of
proceeding with the measurement.
It is possible to drag the cursor to another location on the grid in order to
avoid obstacles etc. It is also possible to
drag the cursor back to previous measurement and either delete it, or measure
it again. In the example below measurement #71 is indicated and may be deleted or repeated. If the measurement
is repeated by pressing the snapshot
button, the previous value is overwritten.
The black areas were excluded by dragging the cursor to the next position to be
measured.
Data Logging
The data logging mode allows the user to program a test sequence. A
typical application for this would be to track the pulse velocity change
as concrete sets. The parameters must be set in Settings. Initially the
information box shows the current settings. During the test a countdown
timer indicates the remaining time to the next measurement, the number
of measurements already made and the time at which the test will be
concluded.
The test may be stopped at any time by pressing on the icon.
The information screen may be switched in and out by pressing on the
‘i’ button. The waveforms are saved with each measurement and may
be viewed by tapping on the marker. The trigger points may be adjusted
manually if necessary once the data has been exported to PL-Link.
Page 18

© 2016 Proceq SA 18
3.3.5 Measuring with Pundit PL-200
Three transducer arrangements are commonly used.
Direct Transmission: The optimum
configuration with maximum signal
amplitude. The most accurate method of pulse velocity determination.
Path length is measured from centre
to centre of the transducers.
Indirect Transmission: Signal amplitude is approximately 3 % of signal amplitude when compared to
direct transmission. Path length may
be uncertain. Use the surface velocity mode to eliminate this uncertainity.
The pulse velocity will be influenced
by the concrete surface zone. Where
possible, carry out a comparison
with a direct transmission measurement to eliminite any uncertainly.
Semi-direct Transmission: Sensitivity is somewhere between the
other two methods. Path length is
measured from centre to centre of
the transducers.
Preparation
Basic preparations are common to each application. The distance (path
length) between the transducers should be measured as accurately as
possible (unless you are measuring in transmission time mode).
It is essential in all ultrasonic pulse tests to use some form of couplant
between the faces of the transducers and the material under test. Failure
to do so will result in a loss of signal due to inadequate acoustic coupling.
The ultrasound couplant provided provides good coupling when used
on concrete or other materials having smooth surfaces. Silicone grease,
medium bearing grease or liquid soap may also be used to good effect.
For rougher surfaces, a thick grease or petroleum jelly is recommended.
In some cases it may be necessary to prepare the surface by smoothing
it. If this is not possible the exponential transducers (Part No. 325 40 170)
should be considered.
For line scans a test grid should be drawn out on the surface.
Amplitude Analysis
Amplitude analysis is a method developed at Tonji University in Shanghai
and is widely used throughout China for comparison testing of concrete
in structures.
In order to record the amplitude the Amplitude Analysis Marker must be
set in the settings menu . When this is set, the amplitude is recorded
along with the transmission time as part of the test result.
Page 19

19 © 2016 Proceq SA
A reference measurement is made on a section of concrete of known quality.
t
0
: Reference transmission time
A
0
: Reference receive level
Subsequent measurements on the structure are compared with these
two values and an inference is made about the concrete quality based
on this.
Six different cases are identified which allow the user to make a statement about the concrete quality.
Good quality – High strength.
High fine aggregate content. Low coarse aggregate content.
High coarse aggregate content. Low fine aggregate content.
Defect on surface. Poor coupling.
Measuring through rebar.
Defects, honeycombing, voids.
3.3.6 Transducer Selection Guideline
Physical Influences on Transducer Selection
The selection of the correct transducer for the application is largely dependent on the aggregate (grain) size and the dimensions of the test
object.
Page 20

© 2016 Proceq SA 20
Effect of particle size
Inhomogeneities (e. g. aggregate particles, voids) in concrete influence
the propagation of an ultrasound pulse. They will scatter the signal. The
effect is very large if the size of the aggregate is equal to or larger than
the wavelength of the ultrasonic signal. This influence can be significantly
reduced by choosing the pulse frequency, such that the wavelength is at
least twice as large as the aggregate size.
It also follows that it is very difficult to detect an anomaly if it is smaller
than half the wavelength.
For rocks and other fine grained materials such as ceramics and wood,
the grain size is less significant. For such materials, the size of the object
to be tested is the most significant factor.
Best results have been obtained on wood with 54 kHz.
For ceramics, the small sample size and fine grain means that 250 kHz or
500 kHz is most widely used.
Effect of sample size
The pulse velocity is reduced significantly if the lateral dimensions (perpendicular to the direction of transmission)
is less than the wavelength.
Higher frequency signals, have a better defined edge and therefore make
it easier to identify the onset of the received pulse. However they are
more influenced by scattering. A 500 kHz signal has a wavelength of
around 7 mm (assuming the speed of sound to be 3500 m/s) and is heavily scattered by the coarse aggregate in concrete, limiting the transmission to a few decimeters at most. A 24 kHz signal has a wavelength of
around 150 mm and is largely unaffected by scattering. The maximum
transmission range may be several meters.
Transducer Wavelength
The wavelength may be easily calculated:
Wavelength = ultrasonic pulse velocity / frequency
For concrete, the ultrasonic pulse velocity ranges from 3000 m/s (poor
quality) to 5000 m/s (high quality). An average value for ordinary concrete
of 3700 m/s (longitudinal wave) and 2500 m/s (shear wave) have been
used for the computation of the wavelengths, the maximum aggregate
size and the minimum lateral dimension of the test object.
NOTE! For ultrasonic measurements made on rock,
ASTM D2845 recommends a minimum lateral dimension of 5x the wavelength. It also recommends using a wavelength at least 3x the average grain size.
e. g. An NX core specimen has a diameter of 54.7 mm
A transducer frequency of 250 kHz or 500 kHz would be recommended for this size of specimen based on this recommendation, (depending on pulse velocity of the rock types to
be tested). Maximum grain size would be 5 mm or 2.33 mm
respectively.
Page 21

21 © 2016 Proceq SA
P-wave Transducers
Test Object Limitations Application
Wavelength Maximum
grain size
Minimum lateral
dimension
24 kHz
Part No. 325 40 026
154 mm ≈ 77 mm 154mm Concrete:
Very coarse, aggregate, Large objects (several meters)
54 kHz
Part No. 325 40 131
68.5 mm ≈ 34 mm 69 mm Concrete, Wood, Rock
150 kHz
Part No. 325 40 141
24.7 mm ≈ 12 mm 25 mm Fine grained material, Refractory bricks
Rock (NX cores)
250 kHz
Part No. 325 40 177
14.8 mm ≈ 7 mm 15 mm Fine grained material, Refractory bricks,
Rock, Small samples
500 kHz
Part No. 325 40 175
7.4 mm ≈ 3 mm 7 mm Fine grained material, Refractory bricks
Rock, Use on small samples limited by size of transducer
Exponential Transducer
54 kHz
Part No. 325 40 170
68.5 mm ≈ 34 mm 69 mm Concrete: rough surfaces, rounded surfaces. (No couplant required.)
Wood, Rock (heritage sites)
The signal strength is not as strong as the standard transducer and
therefore it is recommended to use this transducer with a high receiver
gain and also to verify the trigger point using the waveform display.
S-wave Transducer
250 kHz
Part No. 325 40 049
≈ 5 mm Greater than the thickness of
the object.
Used for determination of elastic modulus, Concrete, wood, rock (small
samples only), Requires special shear wave couplant
Page 22

© 2016 Proceq SA 22
3.4 Pundit PL-200PE
Connected Transducer
If a Pulse Echo Transducer is connected this will be recognized automatically.
Test Transducer
Each individual dry contact transducer can be tested for correct functionality.
The graphic on the right hand side of the screen indicates which transducer pair is to be tested (blue highlight). Press the Pulse Echo Contact
Tester onto the transducer pair as shown.
A successful test is indicated by the
transducer pair being highlighted green.
The next pair to be tested is then highlighted blue.
Continue until each transducer pair has
been tested.
If one contact pair fails the test, it may
be repeated before continuing.
A-scan Analysis
Echo Tracking
This is particularly useful if a quick read-out of slab thickness is desired.
For complex objects containing internal defects, pipes and rebars it is
recommended to perform a complete B-scan for analysis of the object.
Enable Gate
The gate function is used to search for the correct echo in a specific section of the A-scan. It is used in the measurement modes Distance, Pulse
Velocity and Area Scan. See chapter “3.4.2 Measurement Modes”.
Filter
Filters are used to filter out unwanted noise, to make it easier to identify
the correct echo.
• OFF – No filter is applied. The raw signal is displayed.
• Normal – Applies a medium band filter to the received signal.
The received signal is saved post-filtering, so it is not possible to alter the
filter afterwards. Switching the filter off allows the raw data to be viewed.
Time Gain Compensation
When switched on amplifies signals that are further away from the transducer.
Area Scan
Raster X: set the grid spacing for the X-axis.
Raster Y: set the grid spacing for the Y-axis.
Measurement count X: Set the number of measurements to be made
in the X-direction.
Measurement count Y: Set the number of measurements to be made
in the Y-direction.
Colour Scheme: Select the colour scheme (can be adjusted later in the
explorer).
Result: Select the measurement parameter you wish to display.
Auto Color Range: On or off. If not selected then the user may define
minimum and maximum settings for the colour range and these may also
be adjusted later in the explorer. The color scheme may also be inverted
by setting the maximum value lower than the minimum.
Page 23

23 © 2016 Proceq SA
B-scan
Distance between measurements
Set the spacing between measurements. For good resolution images,
a spacing of 1 cm is recommended. For a quicker initial scan a coarser
spacing may be used, e. g. 2.5 cm corresponding to the spacing markers
on the Pulse Echo Transducer. When searching for larger objects such as
delaminations or thickness variations, much coarser grid spacings may
be used, e. g. 10 cm and upwards.
2.5 cm
SAFT
When activated, applies a Synthetic Aperture Focusing Technique to the
raw data to produce a sharper image.
SAFT uses path length and positioning information to correct the image. The quality of the final image is dependent on the spacing of the
measurements.
Envelope
When this setting is activated it uses an envelope of the A-scan to generate the B-scan image. This can also help to generate a clearer B-scan
image.
Color Range and Color Scheme
Color range may be automatic or manual. When set to manual, the color
gain icon
9
appears on the measurement screen.
Four different color schemes may be chosen according to preference.
Original – Original signal is used to generate the B-scan.
Envelope – Envelope signals is used to generate the B-scan.
Units
Choose between metric and imperial units
3.4.1 Measurement Screen
The standard measurement screen is shown on page 24. All settings
are directly accessible from the measurement screen.
Page 24

© 2016 Proceq SA 24
Zoom
Zoom in by placing thumb and index finger together on the
screen and spreading them apart. This can be used in both the
horizontal and vertical directions when making a measurement.
Zoom out by placing thumb and index finger apart on the
screen and pinching them together.
Pan
Pan the image from left to right by dragging.
25
25
25
25
25
25
25
25
25
1
1
2
3
4
5
6
7
8
9
10
2
Measuring screen controls
1
Filename: Enter the file name and press return. Saved measure-
ments will be stored with this file name. If several measurements are made
under the same file name, a suffix increments after each measurement.
2
Measurement mode: Select the type of measurement to be carried
out (see section “3.4.2 Measurement Modes”).
3
The top right hand corner of the display shows the current trans-
ducer selected, current time and the battery status.
4
Gain: Adjust the receiver gain, from 1x up to a maximum of 10 000x.
5
Voltage: Adjust the transmitter voltage. For best results, it is best to
begin with low transmitter voltage and a low gain setting. Then increase
until a stable signal level is achieved. Signal clipping should be avoided.
6
Settings: Enter the settings menu.
7
Stop/Save (Right Button on Transducer):
Stop the current measurement.
Save the current measurement.
Save the current series and continue the measurement.
8
Start/Snapshot (Left Button on Transducer):
Begin the measurement.
Save the current measurement as displayed on the
screen and continue measuring.
Page 25

25 © 2016 Proceq SA
L
R
9
Cursor Selection
Automatic triggering.
Manual triggering. Set the cursor position manually, by
dragging it to the left or right. The trigger position may
also be adjusted later on the saved waveform in the
Explorer or in PL-Link.
Available in transmission time mode only. Allows a
marker to be set on a second echo and the difference
between thet two echos is displayed.
Manually adjust the colour intensity.
10
Automatic Estimation of Pulse Velocity
This setting is available in the Distance and B-scan
modes. The pulse velocity may be entered manually after having made a control measurement on an
object of known thickness. Alternatively, it is possible
to estimate the pulse velocity directly on surface of the
test object. Tap on this button and press the transducer
against the surface to make a measurement. A number
of measurements can be made and an average value
is calculated. Tap to apply the pulse velocity setting. Pulse velocity may be subsequently adjusted on
saved files in the Explorer or in PL-Link.
NOTE! Typical shear wave pulse velocities for concrete are in
the region 2000 - 2500 m/s
3.4.2 Measurement Modes
Transmission time
The measured transmission time between the transmitter and receiver.
Distance
Enter the pulse velocity of the material under test or perform an “Automatic Estimation of Pulse Velocity” as described in the previous chapter.
The result is the thickness of the slab or distance to the internal object
(e. g. void, delamination) that is the source of the echo.
Pulse Velocity
Enter the thickness of the object under test.
The result is the transmission time and pulse velocity of the material under test.
Page 26
© 2016 Proceq SA 26
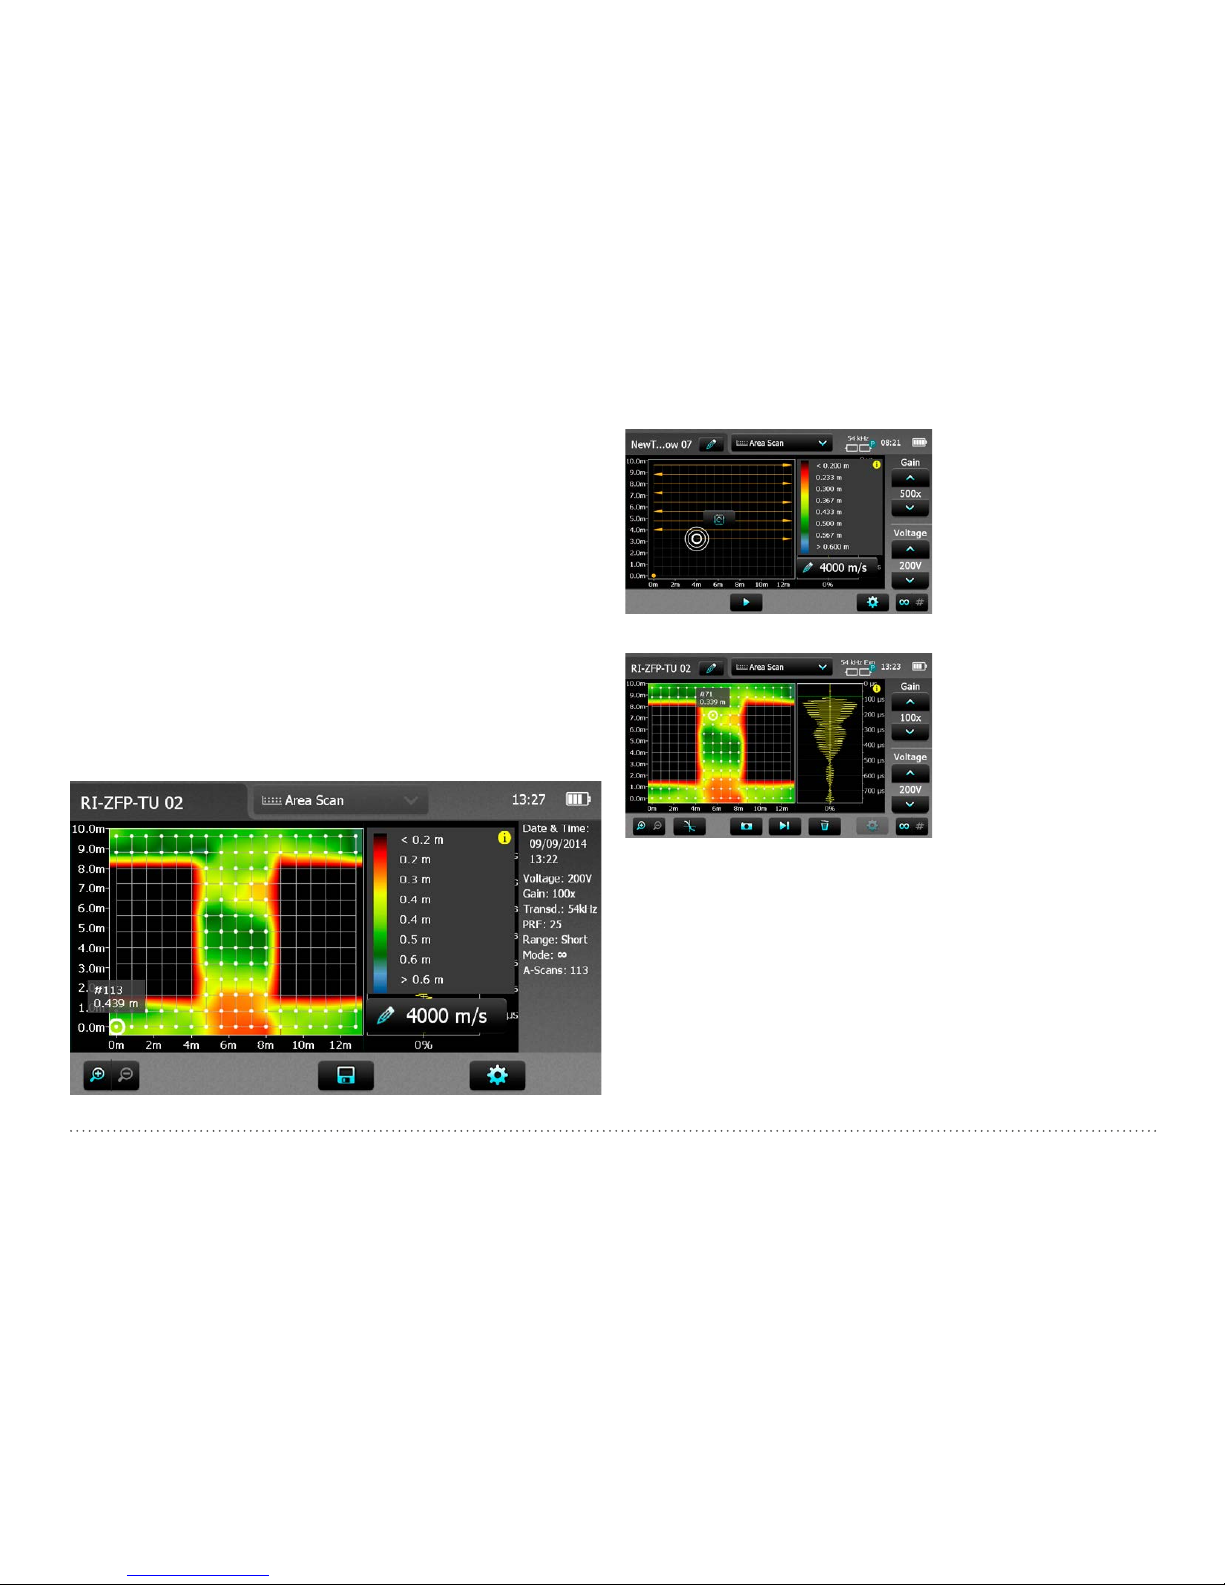
Area Scan
Area scan allows a 2D visualization of an element based on pulse velocity, transmission time or distance measurements.
The measurement grid is defined in ‘Settings.’ If the expected variation of
the measured parameter is not known then select ‘Auto color range.’ This
may be subsequently adjusted in the explorer.
If the expected range is known, the color range may be defined by setting
a maximum value and a minimum value.
e.g. The German guideline RI-ZFP-TU for Non-Destructive Assessment
of Tunnel Inner Shell Thickness specifies a measurement grid of 80 cm.
The purpose of the test is to determine areas of reduced thickness in
tunnel shells and also to locate possible voids between the tunnel shell
and the rock surface.
Setting the result to distance allows areas of reduced thickness to be
easily identified.
The cursor position indicates the position of the next
measurement. Ensure that
this aligns with a grid drawn
out on the test structure. You
may drag the cursor to the
position on the grid where
you wish to start measuring.
Arrows indicated the direction of proceeding with the
measurement.
It is possible to drag the cursor to another location on the
grid in order to avoid obstacles etc. It is also possible to
drag the cursor back to previous measurement and either
delete it, or measure it again.
In the example below measurement #71 is indicated and
may be deleted or repeated.
If the measurement is repeated by pressing the snapshot
button, the previous value is
overwritten. The black areas
were excluded by dragging
the cursor to the next position to be measured.
Page 27

27 © 2016 Proceq SA
B-scan
Provides a cross sectional image of the test object perpendicular to the
scanning surface in the plane through which the individual A-scans have
been collected.
The spacing between A-scans is entered in the “Settings” menu.
Position the transducer at the starting position.
Press the start icon to begin or the left button on the
transducer.
Record the first measurement. The measurement may
also be recorded by pressing the left button on the
transducer.
• The LED’s on the transducer provide a visual feedback when a measurement has taken place successfully. This is accompanied by an
acoustic tone on the display device. The volume of the tone may be
adjusted in system settings.
• Move the transducers to the next point of the scan. Make the second
measurement and continue.
• The current A-scan is shown on the right hand side of the screen.
• The current status of the B-scan is shown on the main part of the
screen.
Press this icon or the right button on the transducer to
save the current B-scan.
Press this icon or the right button on the transducer to
continue the current B-scan.
Use this icon to delete the last measurement made.
Press the to save the current series and reset the instrument for a new series.
The green cursor (cross-hairs) may be moved to any point on the B-scan
simply by dragging. The actually cursor position is displayed on the axes.
The current A-scan selected changes with the cursor position. This is
indicated by the A-scan number at the top of the chart and also on the
A-scan display at the right side of the measurement screen. This feature
is also available on saved B-scans in the Explorer or in PL-Link.
Gate Function
The gate function is used to search for the correct echo in a specific section of the A-scan. It is used in the measurement modes Distance, Pulse
Velocity and Area Scan. Without the gate function, it can occur that the
echo detected by the echo tracking function is not the one received from
the back wall of the test object. When the gate function is enabled, the
“gate” will be visible as a green band in measurement screen and the echo
tracking function will only look in the region defined for the correct echo.
Page 28

© 2016 Proceq SA 28
In the Distance and Pulse Velocity modes it is at the top of the measurement screen. In the Area Scan mode it is located in the A-scan window at
the right side of the screen.
Press and drag on either end of the gate to adjust the range.
Page 29

29 © 2016 Proceq SA
In order to find a suitable range, it is advisable to first carry out an automatic pulse velocity estimation and then to do a quick B-scan to determine the range of the back wall.
In this example the back wall is at 0.3m with a transmission time of 255
μs. If the aim were to look for variation in thickness it would be reasonable to set the gate between 200 μs and 300 μs.
In the distance mode, the gate can also be set using the distance scale
at the top of the screen as an aid.
Page 30

© 2016 Proceq SA 30
3.4.3 Measuring with Pundit PL-200PE
NOTE! Testing with Pulse Echo Technology requires in-depth
knowledge of the test object and application characteristics.
Proceq offers comprehensive ultrasonic training seminars
imparting this knowledge as well as all functionalities and
features of the Pundit instruments. Pundit PL-200PE users
are recommended by Proceq to register for the Advanced
Ultrasonic Tomography Applications training. Details can be
found on the Proceq website.
Preparation
• Very few preparations are necessary when measuring with the Pulse
Echo Transducer.
• The dry-contact transducer means that acoustic coupling is ensured
without the use of any couplant.
• The contacts are sprung and can accommodate surface irregularities
to a depth of 7 mm, so smoothing of the surface is also unnecessary.
• For Area Scans and B-scans a test grid should be drawn out on the
surface. Alternatively Proceq provide a calibrated tape (Part No. 327
010 71) that can be stuck on the surface for the test and then removed
afterwards.
• For best results with Distance, Pulse Velocity and Area Scan measurements make sure that Echo Tracking and Enable Gate are activated
in Settings.
Calibration
The most accurate results can be obtained if the instrument is calibrated
for the material under test.
• This is done by performing a pulse velocity measurement on a section
of the structure of known thickness.
• Alternatively, perform the automatic estimation of pulse velocity as described in chapter 3.4.1.
Physical influences on the Measurement
Inhomogeneities (e. g. aggregate particles, voids) in concrete influence
the propagation of an ultrasound pulse. They will scatter the signal. The
effect is very large if the size of the aggregate is equal to or larger than the
wavelength of the ultrasonic signal. This influence is significantly reduced
when the wavelength is at least twice as large as the aggregate size. It
also follows that it is very difficult to detect an anomaly if it is smaller than
half the wavelength.
The Pulse Echo Transducer is a shear wave transducer with a frequency
of 50 kHz.
Assuming a typical pulse velocity of 2500 m/s, the wavelength is 50 mm.
This means that anomalies smaller than 25 mm will be invisible.
Effect of sample size
The geometry of the object is very important for obtaining good results.
• The maximum penetration depth depends on the quality of the concrete and also on the amount of rebars present. Typically the maximum
transmission depth lies between 50 cm (19.7”) and 1m (39.4”).
• Generally, the minimum lateral dimension should be two times the
thickness of the object, or the depth of the anomaly you are trying to
detect. The reason for this is that if the object is too narrow, reflections
from the side walls will interfere with the echo from the rear wall.
Page 31

31 © 2016 Proceq SA
3.4.4 Analysis of B-scans
Please refer to the
separate booklet Pundit PL-200PE B-scan
Measurement Examples.
Explorer provides a number of tools that assist in the analysis of B-scans.
• Drag the cross hairs to a point of interest. (e. g. back wall of sample
as shown here)
• The object thickness (e. g. 0.3m) is displayed on the y-axis.
• The object position from the beginning of the scan is displayed on the
x-axis.
• The current A-scan (e. g. #22) is indicated above the B-scan and also
in the the A-scan window.
• The current transmission time is displayed at the right hand side of the
of the screen.
• The cursor position may also be adjusted by dragging on the position
display boxes.
• SAFT and Envelope may be switched ON/OFF in Settings.
• Pulse velocity may be corrected.
• Spacing between measurements may be corrected.
• The color scheme may be adjusted.
• Any modifications made to the scan may be saved.
• All of these items may be adjusted later in PL-Link once the files have
been downloaded to a PC.
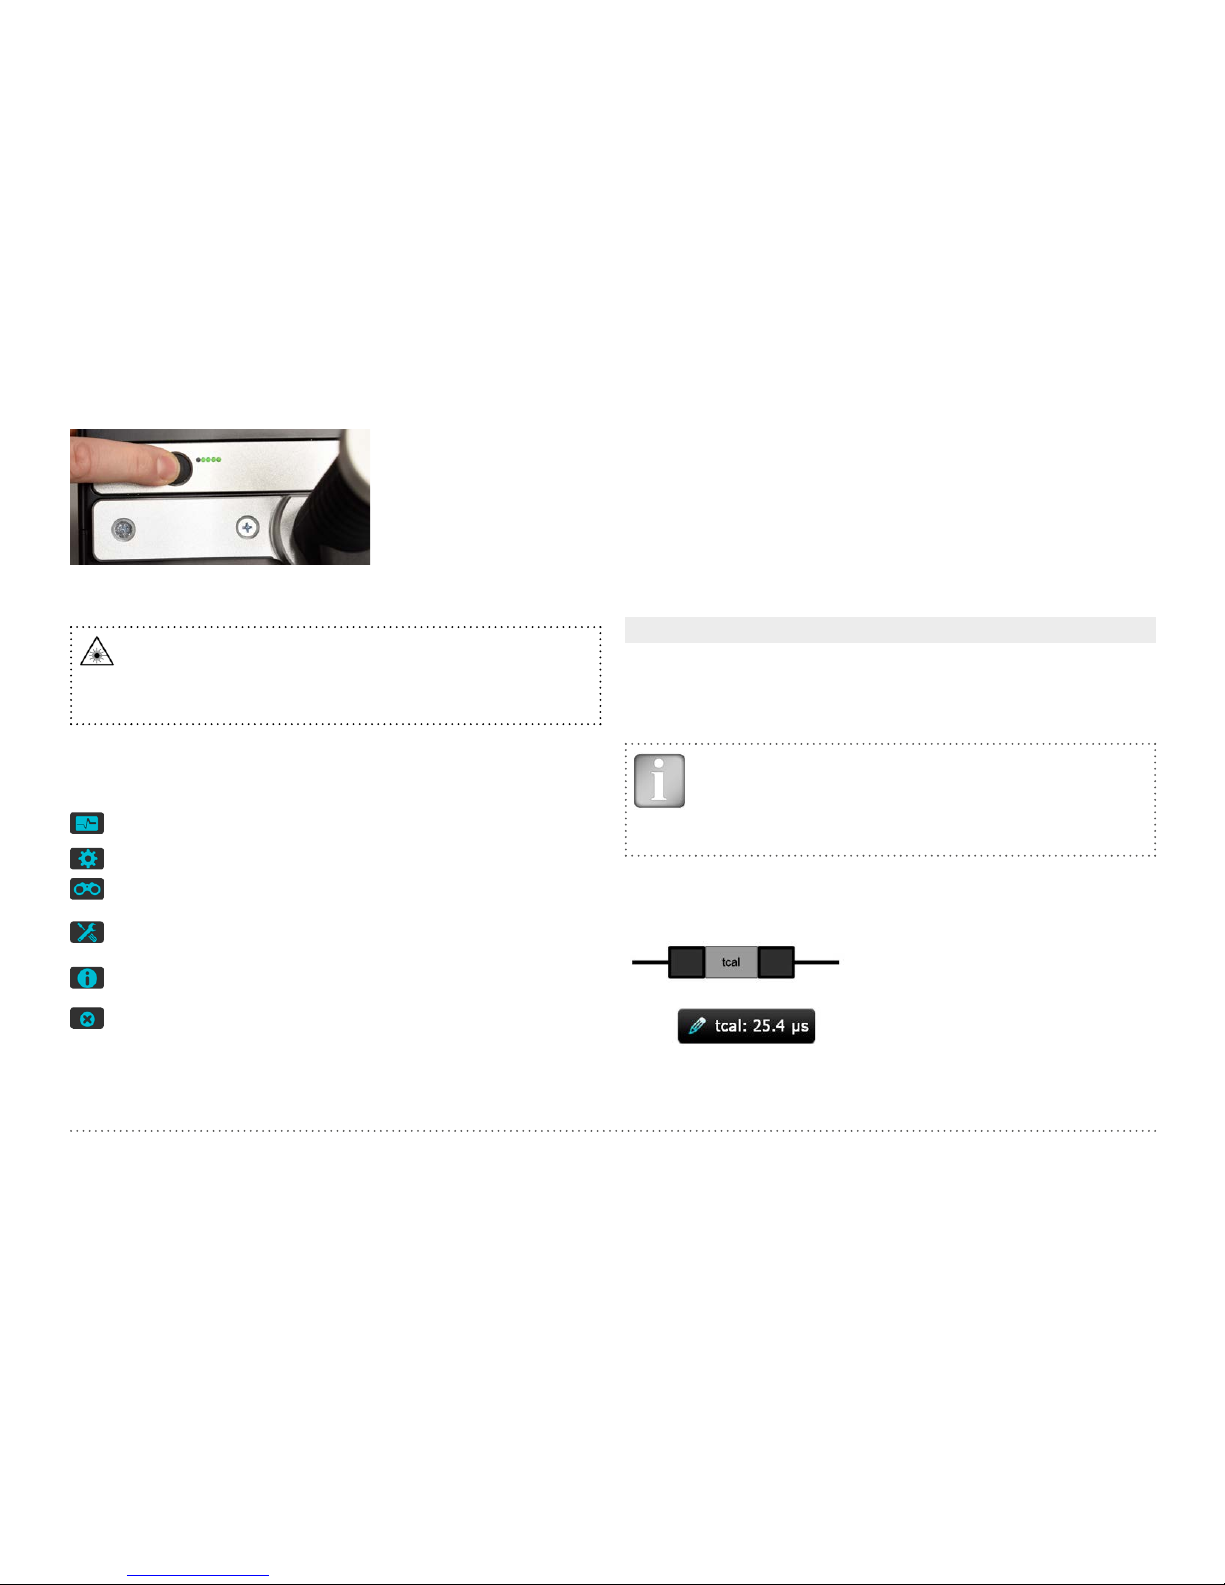
3.5 Pundit 250 Array
Press the power button for ca. 1 second to turn the transducer on.
It takes about 20 – 25s to boot up.
When it is ready the start up screen will be displayed
which also displays information about the transducer
serial number and the hardware and firmware versions.
By entering the Settings menu, a screen showing various settings/actions appears:
Connecting Transducer
Connect the Pundit Array Transducer to the 12 pin connector of the
Pundit Touchscreen Unit using the cable provided. The Pundit Array
Transducer will be recognized automatically.
NOTE! If you have purchased the upgrade kit Part No. 327
30 130) you will need to enter the activation key provided,
before the Pundit Touchscreen recognizes the Array Transducer. To do this enter the menu System/Features/Enter Activation Key.
Page 32

© 2016 Proceq SA 32
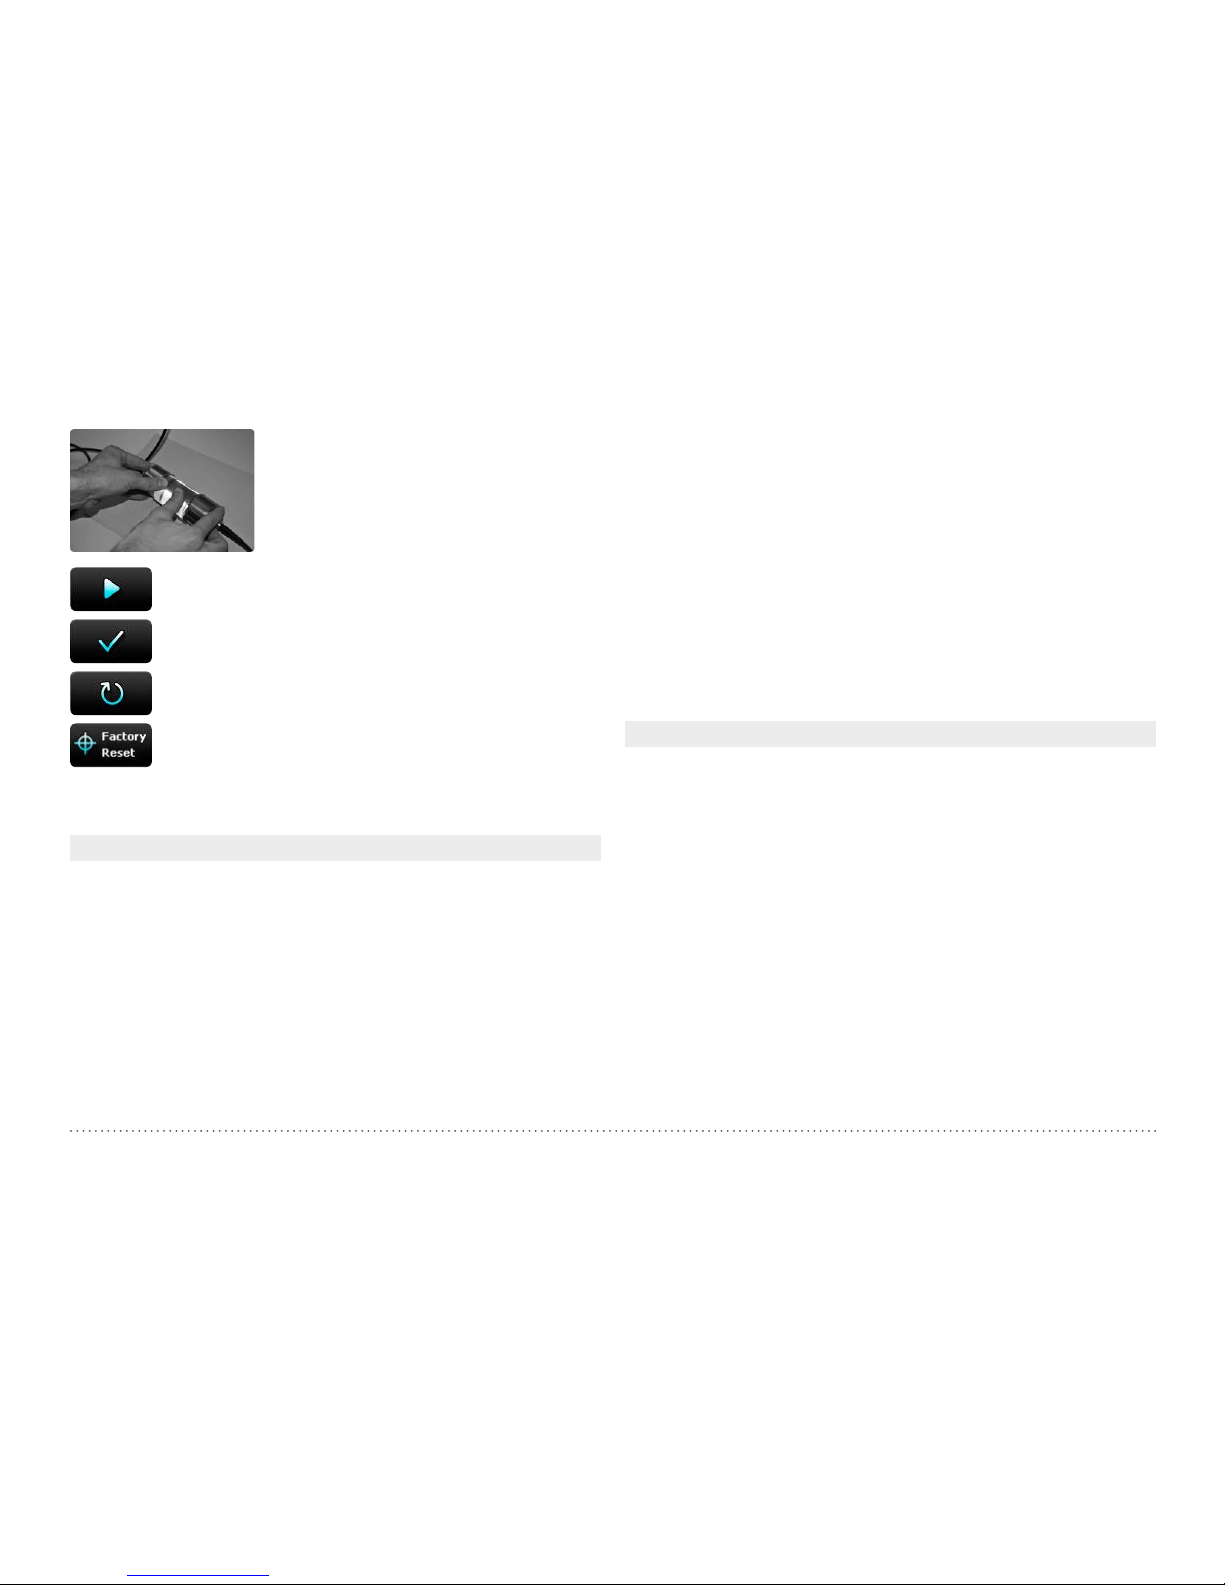
Test Transducer
Each individual dry contact transducer can be tested for correct functionality. After having started the test procedure the graphic on the Pundit
Touchscreen Unit indicates which transducer row is to be tested (blue
highlight).
Press the Pundit Array Contact Tester onto the transducer row as shown.
A successful test is indicated by the transducer row being highlighted
green. The next row to be tested is then highlighted blue. Continue until
each transducer row has been tested.
If one row fails the test, it may be repeated before continuing. If it continues to fail the test, contact a Proceq service centre.
A-scan Analysis
A-scan Presentation
Determines how the A-scan is displayed. Choose between: Signal, Envelope or Signal and Envelope. The A-scan is shown on the right hand
side of the measurement screen as seen below. The signal is shown in
yellow and the envelope (if selected) is shown in red.
B-scan
All of these settings can be applied or removed from saved scans.
Surface Wave Cancellation
Removes the surface wave component from the displayed B-scan.
B-scan Stabilizer
Normalizes the signal strength to compensate for variations in the pressure applied to individual transducer elements. This allows a B-scan image to be obtained without having to press hard against the test object.
Color Scheme
Four different colour schemes are available.
Panorama B-scan
Two settings are used to create the image and to align it to the structural
element being tested.
Overlap of B-scans
Set the amount by which individual scans overlap when creating a panorama B-scan. The overlap range is from 0.21m corresponding to an overlap of one complete transducer (only relevant for the 16-channel con-
Page 33

33 © 2016 Proceq SA
figuration) to a negative overlap of -5m. The overlap is explained in the
chapter “Measurement Modes”.
Horizontal Panorama Offset
This setting enables the user to align a panorama B-scan to the structural drawings.
In this example the scan can be aligned to:
• point A, in which case the horizontal panorama offset would be set
to 1.5 m
• point B, in which case the horizontal panorama offset would be set
to -8.5 m
Corrections
Signal Zero Offset
This feature allows the user to work with the envelope peak for depth
measurements. This is much easier than trying to locate the beginning
of a pulse. The default value is zero. In order to use this feature, enter
the offset in microseconds determined when estimating the pulse velocity using an echo. (See “3.5.2 Measurement Modes” Estimate by Echo).
Time Gain Compensation
This feature amplifies echoes that are further away from the transducer to
provide a more balanced B-scan. The amount of amplification can be adjusted by the user either here in the settings or directly on the transducer
while carrying out a B-scan. (See Transducer Controls.)
Data Acquisition
Pulse Delay
The default value is 8ms. This will give the fastest screen refresh when
carrying out a real time B-scan.
For narrow objects and objects with very little attenuation the delay between pulse cycles can be increased. This reduces the noise effect of
reflections from side walls etc.
Units
Choose between metric and imperial units.
Transducer Energy Settings
Transducer Backlight
Turn the backlight of the auxiliary display on and off.
3.5.1 Measurement Screen
1
2
3
4
5
6
7
8
9
10
11
12
Page 34

© 2016 Proceq SA 34
Measuring screen controls
1
Filename: Enter the file name and press return. Saved measure-
ments will be stored with this file name. If several measurements are
made under the same file name, a suffix increments after each measurement.
2
Measurement mode: Select the type of measurement to be carried
out (see section “3.5.2 Measurement Modes”).
3
The top right hand corner of the display shows the current trans-
ducer selected, current time and the battery status.
4
Gain: Adjust the receiver gain from 0 – 62 dB
5
Settings: Enter the settings menu.
6
Delete last measurement
7
Stop/Save (Right Button on Transducer):
Stop the current measurement.
Save the current measurement.
Save the current series and continue the measurement.
8
Start/Snapshot:
Begin the measurement.
Save the current measurement as displayed on the
screen and continue measuring.
9
Cursor Selection
Manually adjust the colour intensity.
10
Automatic Estimation of Pulse Velocity
See section “3.5.2 Measurement Modes”
11
B-scan (real time) Cursor shows depth and horizontal position
12
A-scan (with envelope)
Keypad Controls
The gain can be adjusted directly on the transducer. Also the alignment
laser can be turned on and off at any time.
Handle Controls
There are three buttons on the handle. The centre button corresponds to
the control buttons 7 and 8 on the Pundit Touchscreen.
The outer buttons are used to adjust the gain. The functionality is summarized in the following table.
Page 35

35 © 2016 Proceq SA
Function Keypad Single
Handle
Dual
Handle
Left
Dual
Handle
Right
8
Start /
Snapshot
Press once
Press once
7
Stop / Save
Press and
hold
Press once
Adjust gain
Adjust end
gain (TGC)
Toggle
Alignment
Laser
NOTE! Gain adjustment is blocked once a panorama B-scan
has been started.
3.5.2 Measurement Modes
Pulse Velocity Estimation
Pundit 250 Array has two different methods available for estimating pulse
velocity.
Pressing the
key brings up the pulse velocity estimation screen.
Estimate by surface wave
This option should be used when the thickness of the test object is not
known. The pulse velocity of signals travelling near the surface of the
concrete is determined. Press the transducer against the surface to make
a measurement. A number of measurements can be made using the
snapshot key at different locations and an average value is calculated.
Tap
to apply the pulse velocity setting.
Page 36

© 2016 Proceq SA 36
Estimate by echo
The second and more accurate option should be used if the thickness of
the test object is known.
The thickness of the object must be entered manually.
Then press the transducer against the surface and begin a measurement.
The ideal situation is when multiple back wall echoes are visible.
Use the cursors to mark the position of the first and second back wall
echo, using the A-scan envelope to identify the peaks.
The transit time is calculated from peak to peak as seen in the screen
shot below. The offset is shown in the very top right of the measurement
screen (23us in this example). This value can be entered in Signal Zero
Offset setting, allowing the user to work with the envelope peak for depth
measurements.
For thicker objects a second back wall echo is not always visible. In this
case it is still possible to estimate the pulse velocity by echo but the procedure is slightly different.
The first cursor remains at the ‘0’ position and the second cursor is
moved to the position of the back wall echo. In this case however it is
necessary to identify the beginning of the pulse using the A-scan rather
than work with the peaks. The diagram below shows the form of the
transmission pulse which is a square wave. The received format is shown
on the left hand side. This is important to understand when trying to locate the depth of objects in the scan.
Page 37

37 © 2016 Proceq SA
The scan below shows the correct identification of the back wall echo using the beginning of a pulse. If the Signal Zero Offset has been correctly
determined, the peak of the envelope may be used instead.
During the pulse velocity estimation procedure “Estimate by surface
wave” the auxiliary display on the transducer shows the number of
measurements made, the last three measurements made and the average pulse velocity.
When using the procedure “Estimate by echo”, it simply shows the pulse
velocity calculated from the echo and the object thickness input by the
user.
Page 38

© 2016 Proceq SA 38
Estimate by surface wave Estimate by echo
B-scan
Provides a cross sectional image of the test object perpendicular to the
scanning surface in the plane through which the individual A-scans have
been collected. The width of the B-scan corresponds to the width of the
aperture, i.e., width = (number of channels-1) x 3 cm.
The Pundit Array Transducer is an 8 channel transducer. One channel
transmits and the echoes are received by the other seven channels. Each
channel transmits in turn.
A complete cycle consists of 56 individual A-scans. These are used to
Page 39

39 © 2016 Proceq SA
create a B-scan which is displayed in real time on the measurement
screen. This is extremely useful for carrying out quick spot checks at any
point of the structure without the need to save any data. Once areas of
interest have been located, more extensive scans can be made as described in the next chapter.
The cursor can be dragged to any point on the B-scan and the corresponding A-scan will be displayed in the right hand window.
As the cursor is moved around the B-scan, the left hand scale shows the
depth at which the cursor is located. The bottom scale shows the cursor
position relative to the left hand side of the transducer and the right hand
scale shows the transmission time.
Correct depth indication depends on the accuracy of the pulse velocity
setting. The pulse velocity (e.g. 2357 m/s in this example) can be entered
manually if known, or it can be estimated automatically as described in
the previous chapter.
Correct identification of the back wall echo is assisted by the A-scan
analysis as described previously.
The B-scan can be optimized in real time also by adjusting the gain and
the end gain (for time gain compensation) using the controls on the transducer as described under “Settings”.
B-scan Auxiliary Display
When carrying out a B-scan the auxiliary display provides useful information about the current settings.
Panorama B-scan
A panorama B-scan is created by stitching individual B-scans together
to make a larger image. A scan is always carried out from left to right.
Zero Overlap means that the transducer is moved by a complete transducer length to create the next B-scan. When carrying out a panorama
B-scan the auxiliary display shows the overlap, the number of scans
made and the distance from the origin.
Page 40

© 2016 Proceq SA 40
Due to the edge effects caused by the SAFT algorithm an image created
with zero overlap can be disjointed at the borders. For this reason it is
often better to use an overlap. For best results and ease of alignment
when carrying out the scan it is best to set the overlap as a whole number
of channels.
In this example the overlap is set to 3 cm which corresponds to a single
channel overlap.
When carrying out a typical application like trying to determine the extent
of a delamination on a large structure, it may be preferable to leave a gap
between B-scans in order to reduce the effort. This can be achieved by
setting a negative overlap as seen in the diagram below.
Page 41

41 © 2016 Proceq SA
Here the overlap is set to -10 cm, so when carrying out the scan a gap
of 10 cm is left from the end of one B-scan to the beginning of the next.
The image is constructed sequentially on the measurement screen as the
scans are saved.
This image is created from 8 individual B-scans with an overlap of 6 cm
(corresponding to two channels.)
The A-scan is blended out of the screen in order to provide more space
for the image. In order to see the A-scan, tap on the double arrow symbol
“<<” in the upper right hand corner of the screen.
Page 42

© 2016 Proceq SA 42
3.5.3 Pundit 250 Array Modularity
Pundit 250 Array Transducer with single handle.
Supplied as standard (Part No. 327 30 110).
Pundit 250 Array Transducer with
dual handle. Requires dual handle
kit accessory (Part No. 327 30 370).
Pundit 250 Array Transducer – 16 channels. Requires the following accessories:
• Pundit Array Transducer (Part No. 327 30 100)
• Pundit Array Transducer Extension Kit (Part No. 376 30 377)
• Dual Handle Kit (Part No. 327 30 370)
Changing from one model to another can be carried out simply on site.
The instructions on how to do this are provided with the extension kits.
4. Explorer Document Handling
From the main menu select Explorer to review saved files.
If folders have been created they are shown in the first lines from the top
(see following figure).
• Tap on a saved file to open it.
• Return to the Explorer list by
pressing the back button.
• To delete a file tap in the
check box to the left of the
file and delete it.
• Tap on
to access the files stored in it.
• To create a new folder tap on
, write the name and tap on
• To cut/copy a file/files tap on
to the left of the file(s) to become
and tap on /
• To insert/copy a file tap on
to open the folder and tap on
The cut and insert functions are useful in case a file is/files are stored in
the wrong folder or a specific folder was only created after the files have
been stored in the main level.
Below the subfolder “Inclined Rebar” is open
Name of folder (in the main level only \ is shown)
Page 43

43 © 2016 Proceq SA
• Tap on the first with the name “..” to go back to the upper folder
Download measuring files to an USB stick:
• Connect the USB-stick to the USB Device plug on the left side of
the Profometer Touchscreen
• Click on the checkbox of each file to be downloaded and click on
• The name of the downloaded file is “PM-Product version_Year_
Month_Day_Time”
Upload pdf-files from an USB-stick:
• Create the folder “PQ-Import” in the main directory of the USB-stick
(not as a subfolder in another folder) and fill it with all the pdf-files to
be uploaded to the Profometer Touchscreen
• Go to Information/Documents
• Connect the USB-stick to the USB Device plug on the left side of the
Profometer Touchscreen
• Click on
and confirm with click on
The uploaded pdf-files appear on the bottom of the document list.
5. Ordering Information
5.1 Units
PART NO. DESCRIPTION
327 10 002 Pundit Touchscreen without transducers consisting
of Pundit Touchscreen, BNC adapter cable, power
supply, USB cable, DVD with software, documentation,
carrying strap and carrying case
327 10 001
Pundit PL-200
consisting of Pundit Touchscreen, 2
Transducers 54 kHz, 2 BNC cables 1.5 m, couplant,
calibration rod, BNC adapter cable, power supply,
USB cable, DVD with software, documentation, carrying strap and carrying case
327 20 001 Pundit PL-200PE consisting of Pundit Touchscreen,
Pundit Pulse Echo Transducer incl. cable, contact
tester, power supply, USB cable, calibrated tape, DVD
with software, documentation, carrying straps and
carrying case
327 30 110 Pundit 250 Array consisting of Pundit Touchscreen,
Pundit array transducer, Pundit 250 Array software,
Pundit Array Cable 12-pin 1.5m, Pundit Array contact
tester, 6x Rechargeable AA NiMH batteries, battery
charger, USB cable, calibrated tape, DVD with
software, documentation, carrying strap and carrying
case Pundit Array
327 30 130
Upgrade Kit to Pundit 250 Array consisting of
Pundit Array Transducer, Pundit 250 Array software,
Pundit Array Cable 12-pin 1.5m, Pundit Array contact
tester, 6x Rechargeable AA NiMH batteries, DVD with
software, documentation, carrying case Pundit Array
Page 44

© 2016 Proceq SA 44
5.2 Transducers
PART NO. DESCRIPTION
325 40 026S 2 Transducers 24 kHz
325 40 131S 2 Transducers 54 kHz
325 40 141S 2 Transducers 150 kHz
325 40 177S 2 Transducers 250 kHz
325 40 175S 2 Transducers 500 kHz
325 40 176 2 Exponential Transducers 54 kHz, incl. calibration rod
325 40 049 2 S-Wave Transducers 250 kHz, incl. couplant
327 40 130 Pulse Echo Transducer, incl. cable, contact tester and
documentation
5.3 Pundit Array Transducer Parts and Accessories
PART NO. DESCRIPTION
327 30 370 Dual Handle Kit
327 30 100 Pundit Array Transducer
376 30 377 Pundit Array Transducer Extension Kit
327 30 337 Pundit Array Transducer Battery Pack Complete
327 01 085
Pundit Array Cable 12-pin 1.5m
327 30 381
Pundit Array contact tester
5.5 Accessories
PART NO. DESCRIPTION
327 01 043 Carrying strap complete
325 40 150 Transducer holder complete
327 01 049 BNC adapter cable for Pundit PL-200
325 40 021 Cable with BNC-plug, 1.5 m (5 ft)
325 40 022 Cable with BNC-plug, 10 m (33 ft)
710 10 031 Ultrasound couplant, 250 ml
325 40 048 Shear wave couplant, 100 g
327 01 033 Battery complete
327 01 053 Quick charger
710 10 028 Calibration rod 25 μs for Pundit PL-200
710 10 029 Calibration rod 100 μs for Pundit PL-200
327 01 070 Snap Ferrite for BNC Adapter cable*
327 01 051
Pundit Pulse Echo Cable
327 00 027
Pundit Pulse Echo Contact Tester complete
327 20 002
Pundit PL-200PE UPV Kit including BNC adapter cable, 2x cable with BNC-plug, L=1.5m (5ft), Ultrasound
couplant, 250ml bottle, 2 transducers 54 kHz, calibration rod
327 01 071S Calibrated Tape (Set of 5)
* In the case that receiving equipment within a radius of 10m suffers from interference, it is possible to order a ferrite to fit onto the BNC adapter cable. This serve
to further reduce the electromagnetic radiation produced by the instrument.
Page 45

45 © 2016 Proceq SA
6. Maintenance and Support
6.1 Maintenance
To guarantee consistent, reliable and accurate measurements, the instrument should be calibrated on a yearly basis. The customer may however,
determine the service interval based on his or her own experience and
usage.
Do not immerse the instrument in water or other fluids. Keep the housing
clean at all times. Wipe off contamination using a moist and soft cloth. Do
not use any cleaning agents or solvents. Do not open the housing ofthe
instrument yourself.
6.2 Support Concept
Proceq is committed to providing a complete support service for
this instrument by means of our global service and support facilities. It is recommended that the user register the product on
www.proceq.com to obtain the latest on available updates.
6.3 Warranty Information
Each instrument is backed by the standard Proceq warranty and extended warranty options.
• Electronic portion of the instrument: 24 months
• Mechanical portion of the instrument: 6 months
6.4 Disposal
Disposal of electric appliances together with household waste is not
permissible. In observance of European Directives 2002/96/EC,
2006/66/EC and 2012/19/EC on waste, electrical and electronic equipment and its implementation, in accordance with national law, electric
tools and batteries that have reached the end of their life must be collected separately and returned to an environmentally compatible recycling facility.
7. PL-Link Software
7.1 Starting PL-Link
Locate the file “PL-Link Setup.exe” on your computer or on
the CD and click on it. Follow the instructions on the screen.
Make sure that the “Launch USB Driver install”
tick is selected.
The USB driver installs a virtual com port which is
needed to communicate with the Pundit Touchscreen Unit.
Double click on the PL-Link Icon on your desktop or start the PL-Link
via the start menu.
The PL-Link starts with a blank list.
Application settings
The menu item “File – Application settings” allows the user to select the
language and the date and time format to be used.
Connecting to a Pundit Touchscreen Unit
Connect the Pundit Touchscreen Unit to a USB port, then select the following icon to download data from the Pundit Touchscreen Unit.
The following window will be displayed: Select “USB” as the communi-
Page 46

© 2016 Proceq SA 46
cation type.
Click on “Next >”. When a Pundit Touchscreen Unit has been found its details
will be displayed on screen. Click on the
“Finish” button to establish the connection.
Select one or more measurements and click “Download”.
7.2 Viewing the Data
Measurement files stored on the device will be displayed in the following
window:
Select one or more measurements and click “Download”.
The selected measurements on your Pundit Touchscreen Unit will be displayed on the screen:
Click on the double arrow icon in the first column to see more details:
NOTE! Click on “Add” to attach a comment to the object.
The folder structure may be seen on the left hand side. Click on a folder
to see the measurements stored in it.
Page 47

47 © 2016 Proceq SA
Right click in the folder section to
create a new folder.
Measurements may be moved
around between folders by using cut
and paste functionality.
Right click on a measurement or a
folder to see the options available.
8.2.1 Data Logging
Move the cursor over a particular measurement to see the waveform.
Scroll in the table either using the scroll bar or the mouse wheel. Click
on a measurement to select it and highlight it on the measurement plot.
8.2.2 Area Scan
When the 1:1 check box is ticked it is possible to zoom in and out of the
scan using the mouse wheel.
Click with the right mouse button to move the cursor to a new position.
Drag with the
left mouse button pressed to
move within the
zoomed graphic.
Click on the
Symbol to obtain a larger graphical display of the scan
in a separate window.
Page 48

© 2016 Proceq SA 48
7.3 Adjusting the Settings
Each of the settings that were used in the Pundit Touchscreen Unit at
the time of the measurement series can be adjusted subsequently in PLLink. This can be done either by right clicking directly on the item in the
appropriate column, or by clicking on the blue setting item in the detailed
view of a measurement object.
In each case a drop down selection box will appear with the choice of
setting.
Manual Trigger
The trigger point of A-scans can be adjusted manually simply by dragging the cursor. If it has been adjusted it will be indicated with an asterisk.
The original transmission time can be reset by clicking on [Reset Time1]
7.4 Analysis of B-scans
PL-Link provides a number of tools that assist in the analysis of B-scans.
• Zoom into the B-scan using the zoom boxes. A separate zoom box is
available for the currently selected A-scan
• Move the B-scan in both x- and y-directions by dragging with the left
mouse button.
• Move the A-scan in the y-direction by dragging with the left mouse
button.
• Drag the cross hairs to a point of interest using the right mouse button.
The position is shown in the details on the right hand side.
• The current A-scan (e. g. #22) is indicated in the table.
• All settings in blue text can be adjusted as necessary
• All check box settings may be activated or deactivated as desired to
obtain the best image.
Adjusting the date and time
Right click in the “Date & Time” column.
The time will be adjusted for the selected series only.
In “Data Logging” mode it is the date and time at which the measurement
was made.
Page 49

49 © 2016 Proceq SA
7.5 Exporting Data
PL-Link allows you to export selected objects or the entire project for
use in third party programs. Click on the measurement object you wish
to export. It will be highlighted as shown.
Click on the “Export as CSV file(s)” icon. The data for this
measurement object is exported as a Microsoft Office Excel
comma separated file or files. The export options may be
chosen in the following window:
Select the option “Export waveform data (if available)” to export all saved
waveform data for analysis in third party software.
Click on the “Export as graphic” icon to open the following
window which allows the various export options to be chosen.
In both cases, the preview window shows the effects of the current output selection.
Finish by clicking on export to select the file location, name the file and
in the case of a graphical output to set the output graphic format: .png,
.bmp or .jpg.
7.6 Further Functions
The following menu items are available via the icons at the top of the
screen:
“PQUpgrade” icon - Allows you to upgrade your firmware via
the internet or from local files.
“Open project” icon – Allows you to open a previously saved
.pql project.
“Save project” icon – Allows you to save the current project.
“Print” icon – Allows you to print out the project. You may
select in the printer dialog, if you want to print out all of the
data or selected readings only.
Clicking “Auto Scale” adjusts the zoom parameters of the
waveform display to an optimum setting.
Page 50

© 2016 Proceq SA 50
7.7 Conversion Curves
Pundit Touchscreen Unit allows compressive strength estimates to be
made using pulse velocity measurements or a combination of pulse velocity and rebound hammer measurements.
To do this it is necessary to create a conversion curve and upload this
onto the instrument.
Conversion curves are very much specific to the concrete under test and
there are many examples in the literature.
Pundit Touchscreen Unit allows either polynomial curves or exponential
curves to be programmed and in the case of a combined ultrasonic/rebound value measurement a curve based on the SONREB (SONic REBound) method may be entered.
Select the menu item “Conversion Curves”
Here you can view existing curves
stored on your computer, copy an existing curve for modification or:
Create new curve.
Enter the curve parameters and click
on “Create”.
The new curve will now appear in the
drop down list and may be loaded
onto the Pundit Touchscreen Unit.
7.8 E-modulus Calculator
Enter the P- and S-wave pulse velocities to calculate the Poisson’s ratio.
Additionally enter the density of the material to calculate the E-modulus.
Page 51

Made in Switzerland
Subject to change. Copyright © 2016 by Proceq SA, Schwerzenbach. All rights reserved.
82032701E ver 12 2016
Proceq Europe
Ringstrasse 2
CH-8603 Schwerzenbach
Phone +41-43-355 38 00
Fax +41-43-355 38 12
info-europe@proceq.com
Proceq UK Ltd.
Bedford i-lab, Priory Business Park
Stannard Way
Bedford MK44 3RZ
United Kingdom
Phone +44-12-3483-4515
info-uk@proceq.com
Proceq USA, Inc.
117 Corporation Drive
Aliquippa, PA 15001
Phone +1-724-512-0330
Fax +1-724-512-0331
info-usa@proceq.com
Proceq Asia Pte Ltd
12 New Industrial Road
#02-02A Morningstar Centre
Singapore 536202
Phone +65-6382-3966
Fax +65-6382-3307
info-asia@proceq.com
Proceq Rus LLC
Ul. Optikov 4
korp. 2, lit. A, Office 410
197374 St. Petersburg
Russia
Phone/Fax + 7 812 448 35 00
info-russia@proceq.com
Proceq Middle East
P. O. Box 8365, SAIF Zone,
Sharjah, United Arab Emirates
Phone +971-6-557-8505
Fax +971-6-557-8606
info-middleeast@proceq.com
Proceq SAO Ltd.
Rua Paes Leme, 136, cj 610
Pinheiros, São Paulo
Brasil Cep. 05424-010
Phone +55 11 3083 38 89
info-southamerica@proceq.com
Proceq China
Unit B, 19th Floor
Five Continent International Mansion, No. 807
Zhao Jia Bang Road
Shanghai 200032
Phone +86 21-63177479
Fax +86 21 63175015
info-china@proceq.com
 Loading...